1. Introduction
Signatories are committed to keeping the rise in global average temperature to far below 2 °C and strive to limit the increase to 1.5 °C in the Paris Climate Agreement 2015. Carbon neutrality is one of the crucial segments for attaining the targets of agreement and defines the equilibrium between the sources and sinks of greenhouse gas (GHG) emissions [
1]. The International Energy Agency (IEA) recently published a report on net zero emission (NZE) scenarios, which outlines various potential trajectories for attaining global net zero CO
2 emissions by 2050, along with numerous uncertainties that may influence these pathways; focusing on an NZE scenario is one of several possible routes to net zero emissions, rather than a single definitive path [
2]. Similarly, a report released by the International Renewable Energy Agency (IRENA) on the energy transition perspective last year elucidated how technologies such as electrification and energy efficiency, alongside renewables, as seen in
Figure 1, may significantly aid in fulfilling the Paris Agreement objectives [
3].
Figure 2 indicates that renewables will account for 25% of global emission reductions by 2050, hence underscoring their significance in achieving NZE goals. To comply with the NZE objectives and the Paris Agreement, the UK has formulated its renewable energy strategy [
4] and hydrogen net zero strategy [
5]. The UK currently produces electricity from offshore wind farms by using the wind energy available in its maritime regions, similar to other countries such as China [
6].
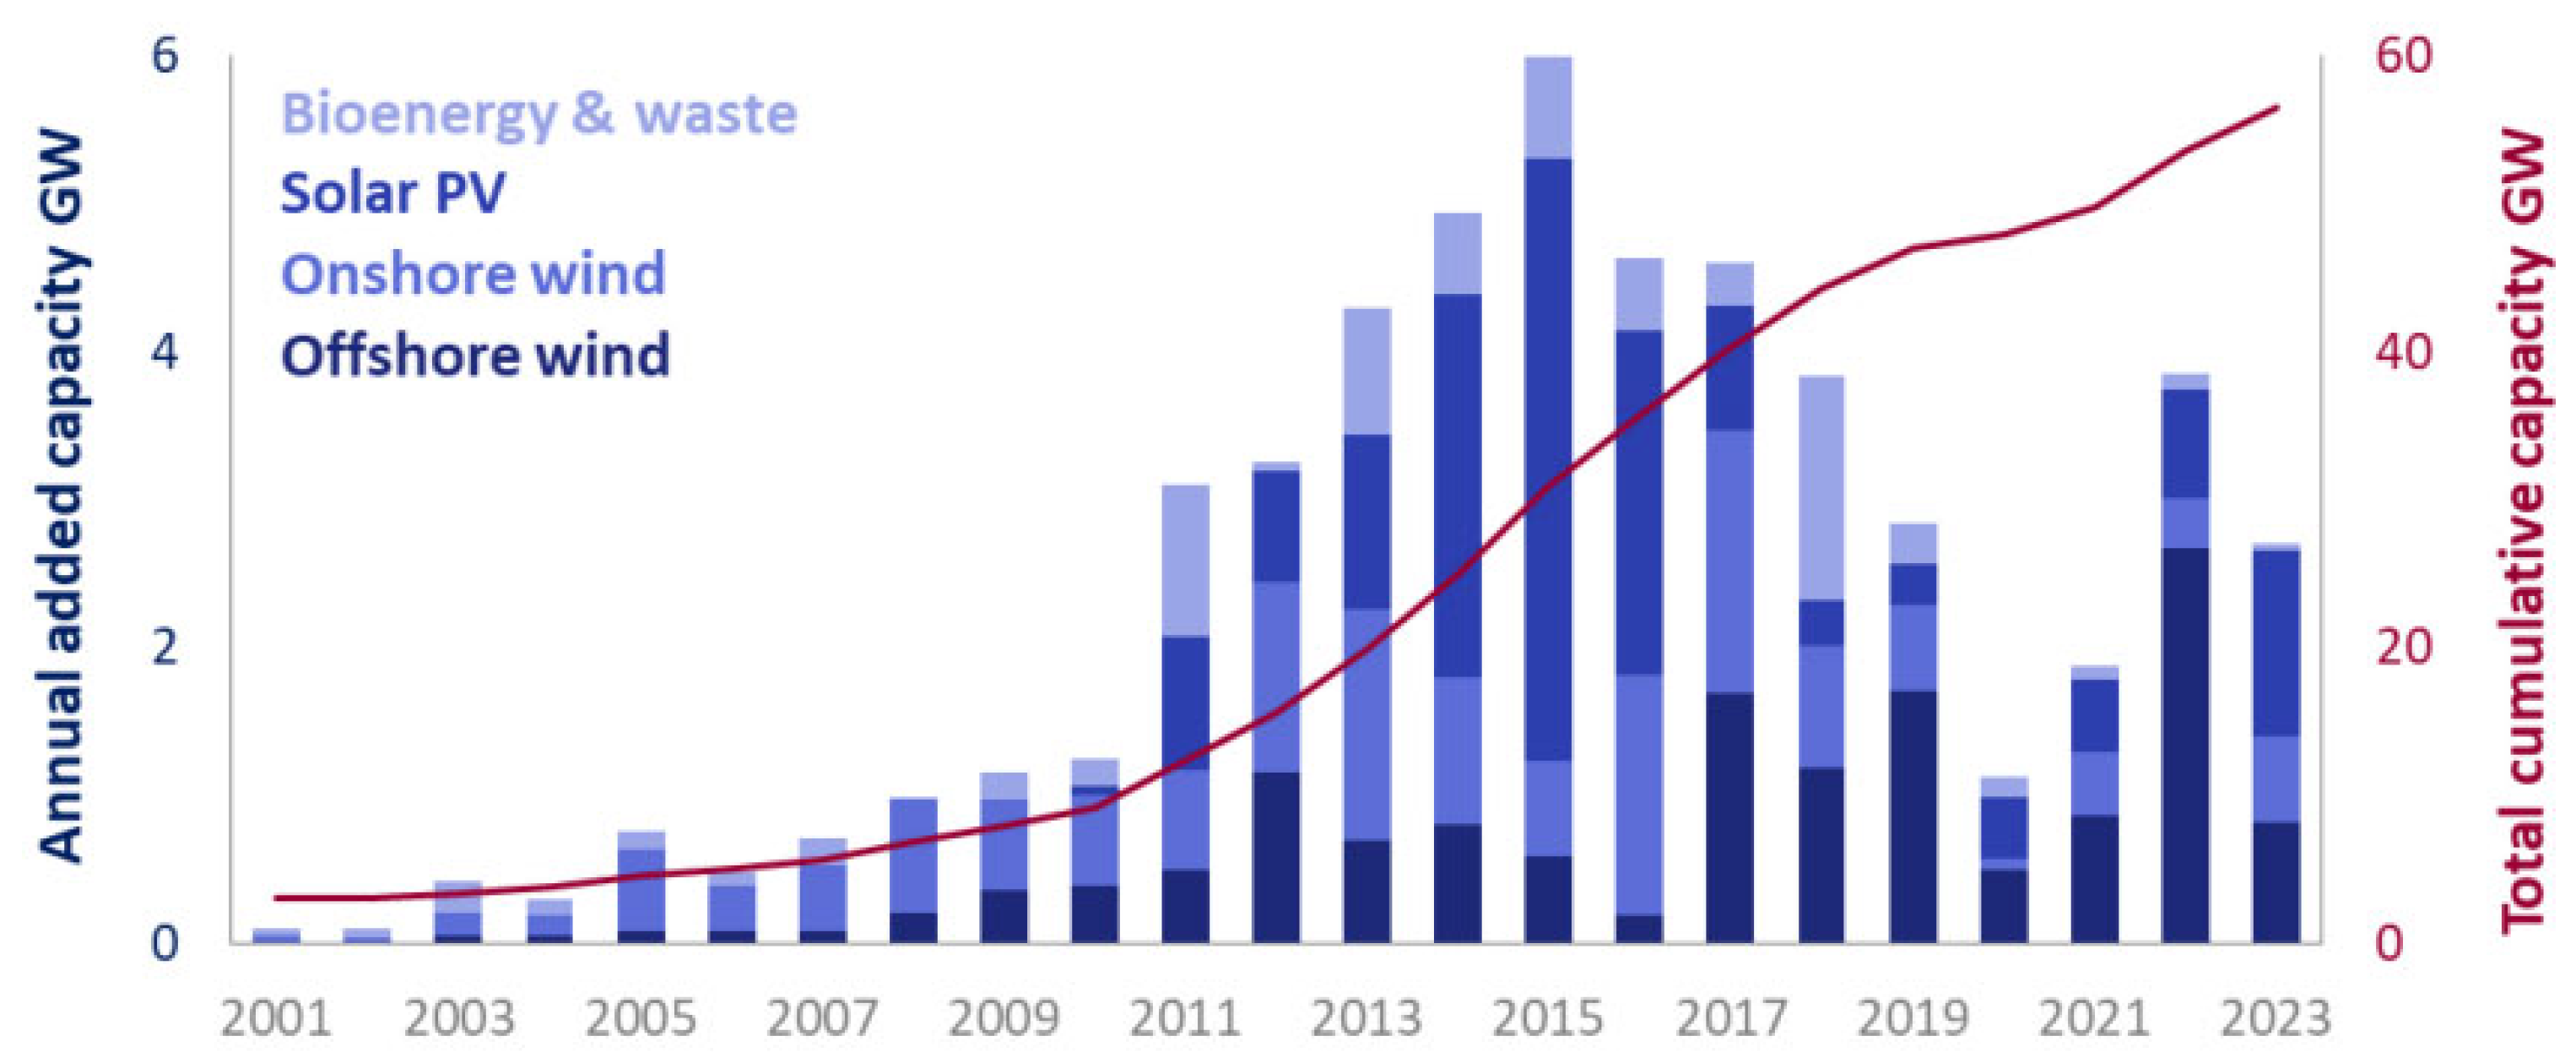
Figure 3 illustrates the annual increase in renewable energy generation capacity in the UK over the past couple of decades [
6]. The UK currently possesses an offshore wind capacity of 14.8 GW. It aims to escalate up to 50 GW of power generation capacity from offshore wind by 2030, which includes 5 GW of novel floating offshore wind energy (FOWE) in the windiest areas of its seas [
7].
Figure 3 illustrates the percentage comparison of electricity generation from renewable sources in the UK in the first quarter of 2023 and 2024 [
8].
In terms of electricity generation, renewable energy technologies are constrained by their ability solely where and when corresponding resources are accessible. This inherent limitation in supply flexibility challenges existing RES, thereby increasing the significance of energy storage systems. Consequently, load-shifting operations or storage must be considered before depending on renewable energy sources. Furthermore, in the long term, reliance on highly unpredictable weather conditions could lead to supply security issues, requiring additional investments in backup systems [
9]. In 2023, Britain’s wind farms had a 5% electricity output loss due to curtailment, amounting to approximately 4.3 TWh, an amount sufficient to power 1.5 million homes. In 2023, constraint payments for shutting the operations of farms totalled GBP 300 million, resulting in an additional cost of roughly 4 GBP/MWh for wind electricity generation [
10]. Offshore wind farms at Hornsea have the largest capacity to produce electricity in the UK. Hornsea Two is the most significant operational wind farm with an electricity generation capacity of 1386 MW, followed by Hornsea One with an electricity generation capacity of 1218 MW and an offshore wind farm operational at Triton Knoll with an electricity generation capacity of 857 MW.
Table 1 illustrates the operating wind farms surrounding England, whereas
Figure 4 depicts the annual curtailment of wind energy in the UK during the past decade [
10,
11].
Energy storage systems are much-needed technologies for addressing curtailment issues associated with renewable energy sources and ensuring the energy demand and supply cycle. Energy storage systems augment energy security and the diminish reliance on fossil fuels, offering resilience against electricity supply disturbances. Developing and implementing advanced energy storage technologies are essential to national and international initiatives to attain net zero emissions and fulfil the environmental objectives established by the Paris Agreement [
12].
So, currently, the UK’s clean energy goals revolve around the rapid expansion of renewable energy generation capacity, particularly offshore wind, to address the increasing challenges of grid integration and energy curtailment. However, there is an economic burden of curtailment due to the lack of energy storage systems and inefficiencies in the grid’s stability. The solution of these issues includes enhanced infrastructure, demand-side management, and investment in energy storage such as green hydrogen and ammonia to fully utilise renewable resources.
1.1. Scope of This Study
Recent studies about green energy production and supply chains elucidate the significance of energy storage in the form of green hydrogen and green ammonia, which possess the potential to store energy for more extended periods of time. There are few studies such as [
13] that show the lowest possible import prices for green ammonia and a comparison with scenarios for the UK’s green energy production and storage costs. Likewise, in [
14], various prospects of green hydrogen and ammonia-based energy storage have been discussed. Furthermore, in [
15], the researchers established a model that optimises a worldwide green ammonia network in terms of green energy trade.
Based on the knowledge published in the recent literature, there is no such study presented which would cover the technical aspects of offshore green energy storage such as the green energy storage capacity based on the optimal energy distribution. Conclusively, a study that thoroughly examines the feasibility of green hydrogen and green ammonia storage options depending on the total power available is missing. So, the primary aim of this paper is to analyse the possibilities of offshore green hydrogen and green ammonia storage by optimising energy requirements. This study presents three different production and storage scenarios harnessed by offshore wind energy. The technical assessment drawing on existing research and our own mathematical calculations illustrates the feasibility and storage capacity along with the economics of the presented scenarios for offshore green energy storage. Based on the annual hydrogen and ammonia production from offshore wind energy and the optimal energy distribution to every unit operation involved in the process, the green energy storage capacity will be decided. Both the technological and economical aspects of the presented scenarios offer more realistic results. The results of this study can offer suggestive information on whether this kind of large-scale green hydrogen storage is feasible and as a first concept of how it could be approached.
1.2. Objectives
To identify possible scenarios for storing green hydrogen and ammonia, depending on the synthesis configuration, and to figure out which of the presented scenarios is potentially viable in terms of production and storage flexibility.
To find out the mass of green hydrogen and green ammonia that will be produced depending upon the total energy available in all three scenarios.
To calculate the storage capacity (mass and volume) for green hydrogen and green ammonia separately, depending upon the synthesis configuration.
1.3. Limitations of the Study
The results of this study are highly contingent upon the selection of either optimistic or pessimistic values in terms of the selected efficiency of processes like electrolysis, water purification techniques, and air separation plants for nitrogen generation. It is essential to acknowledge that alternative clean hydrogen and ammonia production methods, such as steam methane reforming (SMR + CCS) or blue hydrogen/ammonia, and non-renewable energy sources, including nuclear energy, are not in the purview of this study. The technical aspects of wind energy transmission, such as the effect of energy curtailment or wind intermittency, is not considered in this study. The mathematical model is majorly aimed to find out the maximum possible storage capacity of offshore green ammonia and green hydrogen based on the total power available, which will help in the process of plant design and to find the possible offshore risks of storing offshore green hydrogen and green ammonia. There is no potential error with the model basis identified during the analysis and calculations.
2. The UK’s Energy Storage Roadmap and Hydrogen Strategy
Energy storage technologies can be categorised depending on the time of their storage cycle, as shown in
Table 2 [
16].
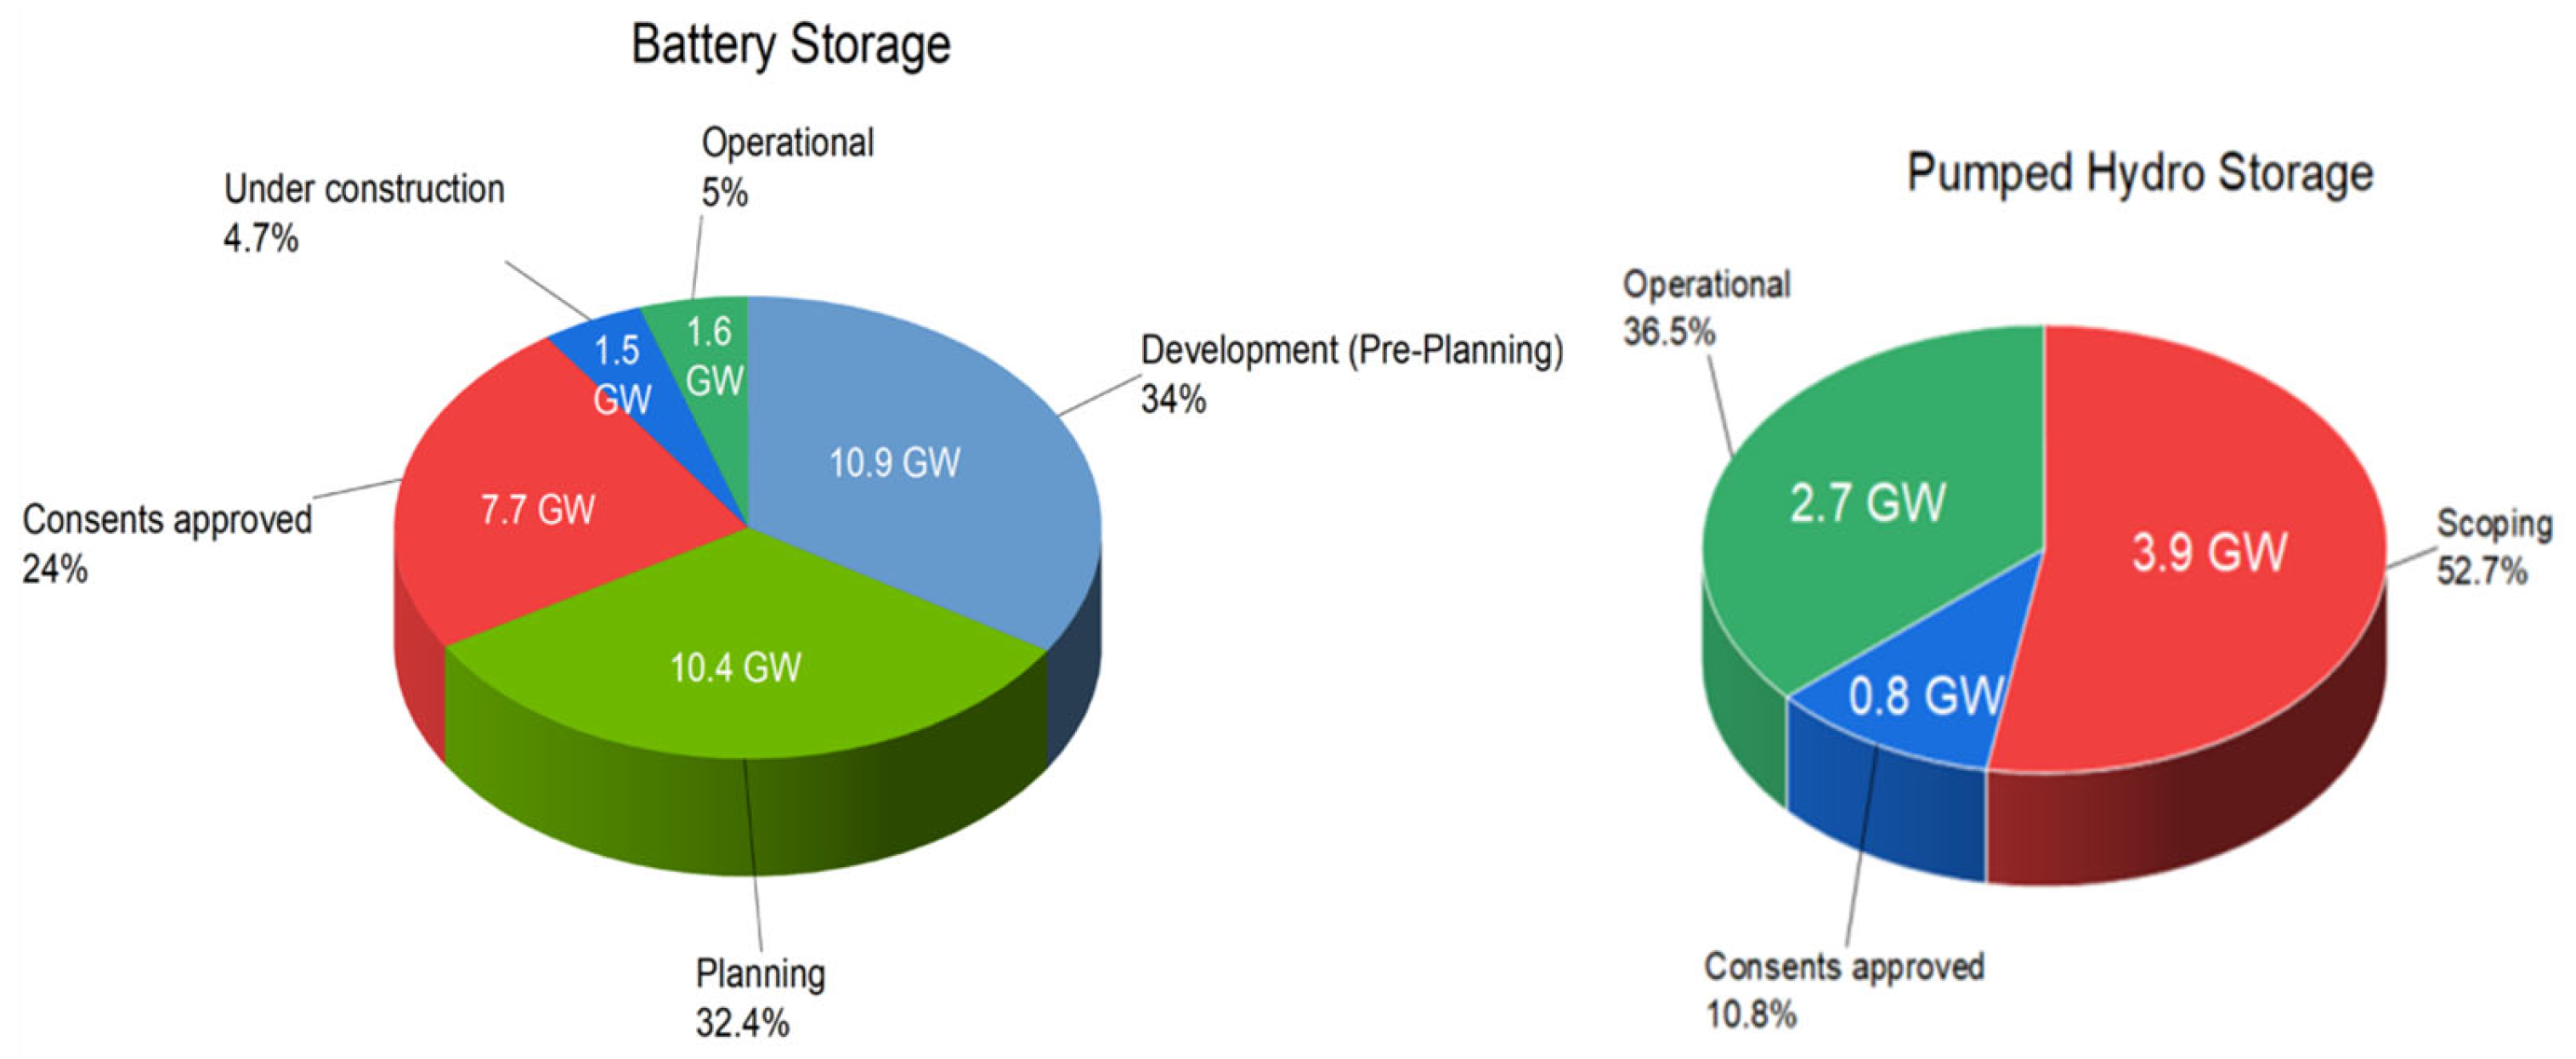
Presently, the United Kingdom has 1.6 GW of usable battery storage capacity, with most of that capacity having a discharge duration of 1 h, meaning that the energy-to-power ratio is 1:1 (GWh to GW). Similarly, the most significant operational volume of pumped hydro storage (PHS) is 25.8 GWh, with a capacity of 2.74 GW in the UK, indicating a significantly greater discharge ratio. The specific capacities of battery storage in the UK across several developmental phases in 2022 and the pipeline of pumped hydro storage are illustrated by
Figure 5 [
17].
Meeting the need for long-term energy storage necessitates a significantly reduced cost per unit of stored energy, so hydrogen in compressed or liquefied form is a leading candidate for a more extended energy storage duration. The complementary option, which may incur substantially higher costs, is ammonia, a good candidate for a hydrogen carrier [
17]. The recent research conducted by the UK Royal Society on large-scale electricity storage indicates that 60–100 TWh of hydrogen storage may be necessary to ensure the required backup for renewable energy sources in the UK by 2050.
To achieve the total energy storage demand in hydrogen, specialised hydrogen storage tanks or vessels capable of storing several MWh of energy will be necessary in conjunction with salt caverns. The recent report from the ‘Department of Energy Security and Net Zero HM Government’ indicates that the UK has increased its production target to 20 GW of green hydrogen by 2030, with a minimum of 50% derived from electrolytic production facilities [
18].
The United Kingdom has implemented several ambitious initiatives to encourage and assist businesses to invest in low-carbon hydrogen. The UK is assisting producers via the “Net Zero Hydrogen Fund”, which allocates up to GBP 240 million for the development and building of new low-carbon hydrogen production facilities. The UK has released version 3 of the “Low Carbon Hydrogen Standard” to guarantee that low-carbon hydrogen production aids in decarbonisation initiatives [
19]. In order to establish a new hydrogen-to-power business model [
20], the UK has already made great strides in delivering the UK hydrogen economy. These include announcing up to GBP 21.7 billion in available funding to launch the country’s new carbon capture, utilisation, and storage industry and confirming support for the 11 successful “Hydrogen Allocation Round 1” projects [
21]. UK also launched three new bodies, the “National Energy System Operator”, “Great British Energy”, and the “National Wealth Fund”, which will help to deliver a world-class energy system, including for low-carbon hydrogen.
In 2024, the United Kingdom’s domestic hydrogen consumption is approximately 27 terawatt-hours (TWh) per year. At present, most of the hydrogen produced in the UK is obtained from natural gas via steam methane reforming, a method that releases carbon dioxide. This process produces what is referred to as ‘grey’ hydrogen.
The UK government anticipates that hydrogen demand may represent 20–35% of the country’s ultimate energy consumption by 2050. This expected increase is propelled by initiatives to decarbonize multiple sectors, including transportation, heating, and electricity generation. To sustainably address future demands, there is a strategic focus on enhancing low-carbon hydrogen production techniques, particularly green hydrogen generated through electrolysis utilising renewable energy sources [
22]. The UK’s Department of Energy Security and Net Zero conducted research indicating that the UK possesses significant potential for hydrogen exports to continental Europe. The UK’s geographical proximity to the principal hydrogen demand centres in northwest Europe will result in considerably lower transport costs compared to other regions with substantial renewable resources.
In the context of market projection, the UK’s hydrogen market generated approximately USD 548.8 million in revenue in 2022 and is projected to reach USD 969.7 million by 2030, growing at a compound annual growth rate (CAGR) of 7.4% from 2023 to 2030. The ammonia segment was the largest revenue-generating application in 2022, with oil refining anticipated to be the fastest-growing application during the forecast period [
23].
According to the IEA, in a “Net Zero” emissions scenario, low-emission hydrogen is projected to make up about 10% of the overall energy utilisation by 2050, constituting over 500 Mt of H
2. Around 186 million metric tonnes of green ammonia might be used as fuel for ships and power plants, with an extra 104 million metric tonnes as a hydrogen carrier. Ammonia, according to IRENA’s research, can serve as a sustainable source of hydrogen for large-scale (>200 kt H
2/year) maritime transport over oceans with a total length exceeding 8000 km [
24]. The most important thing is that the transportation cost is almost nothing compared to the costs of converting, storing, and re-converting ammonia. Therefore, long distances have little effect on the overall cost, making it more attractive as the distance increases. Hence, large-scale green hydrogen and green ammonia storage and their integration to the existing infrastructure are necessary for enhancing grid stability, energy security, and long-term sustainable renewable energy infrastructure.
4. Methodology and State-of-the-Art Concept
The concept of producing green hydrogen and ammonia from electricity, summarised under the terms “power-to-gas” and “power-to-ammonia”, includes various ideas for manufacturing green fuels from offshore wind electricity. In this study, a novel state-of-the-art concept of selecting the storage capacity of green fuels on the floating surface of the sea, depending upon the availability of offshore wind energy, was developed. The UK’s largest operational offshore wind farms, located in Hornsea, have an electricity generation capacity of 1236 MW and 1375 MW, constituting this study’s power baseline.
4.1. Technical Description of Green Hydrogen and Ammonia Production and Storage Scenarios
The total energy supply of 2.5 GW from the UK’s largest offshore wind farms will supply power to all unit operations involved in the production of green hydrogen and green ammonia. Three different process scenarios to produce green fuels are presented to find the best energy utilisation scenario, ultimately selecting the green fuels’ storage capacity.
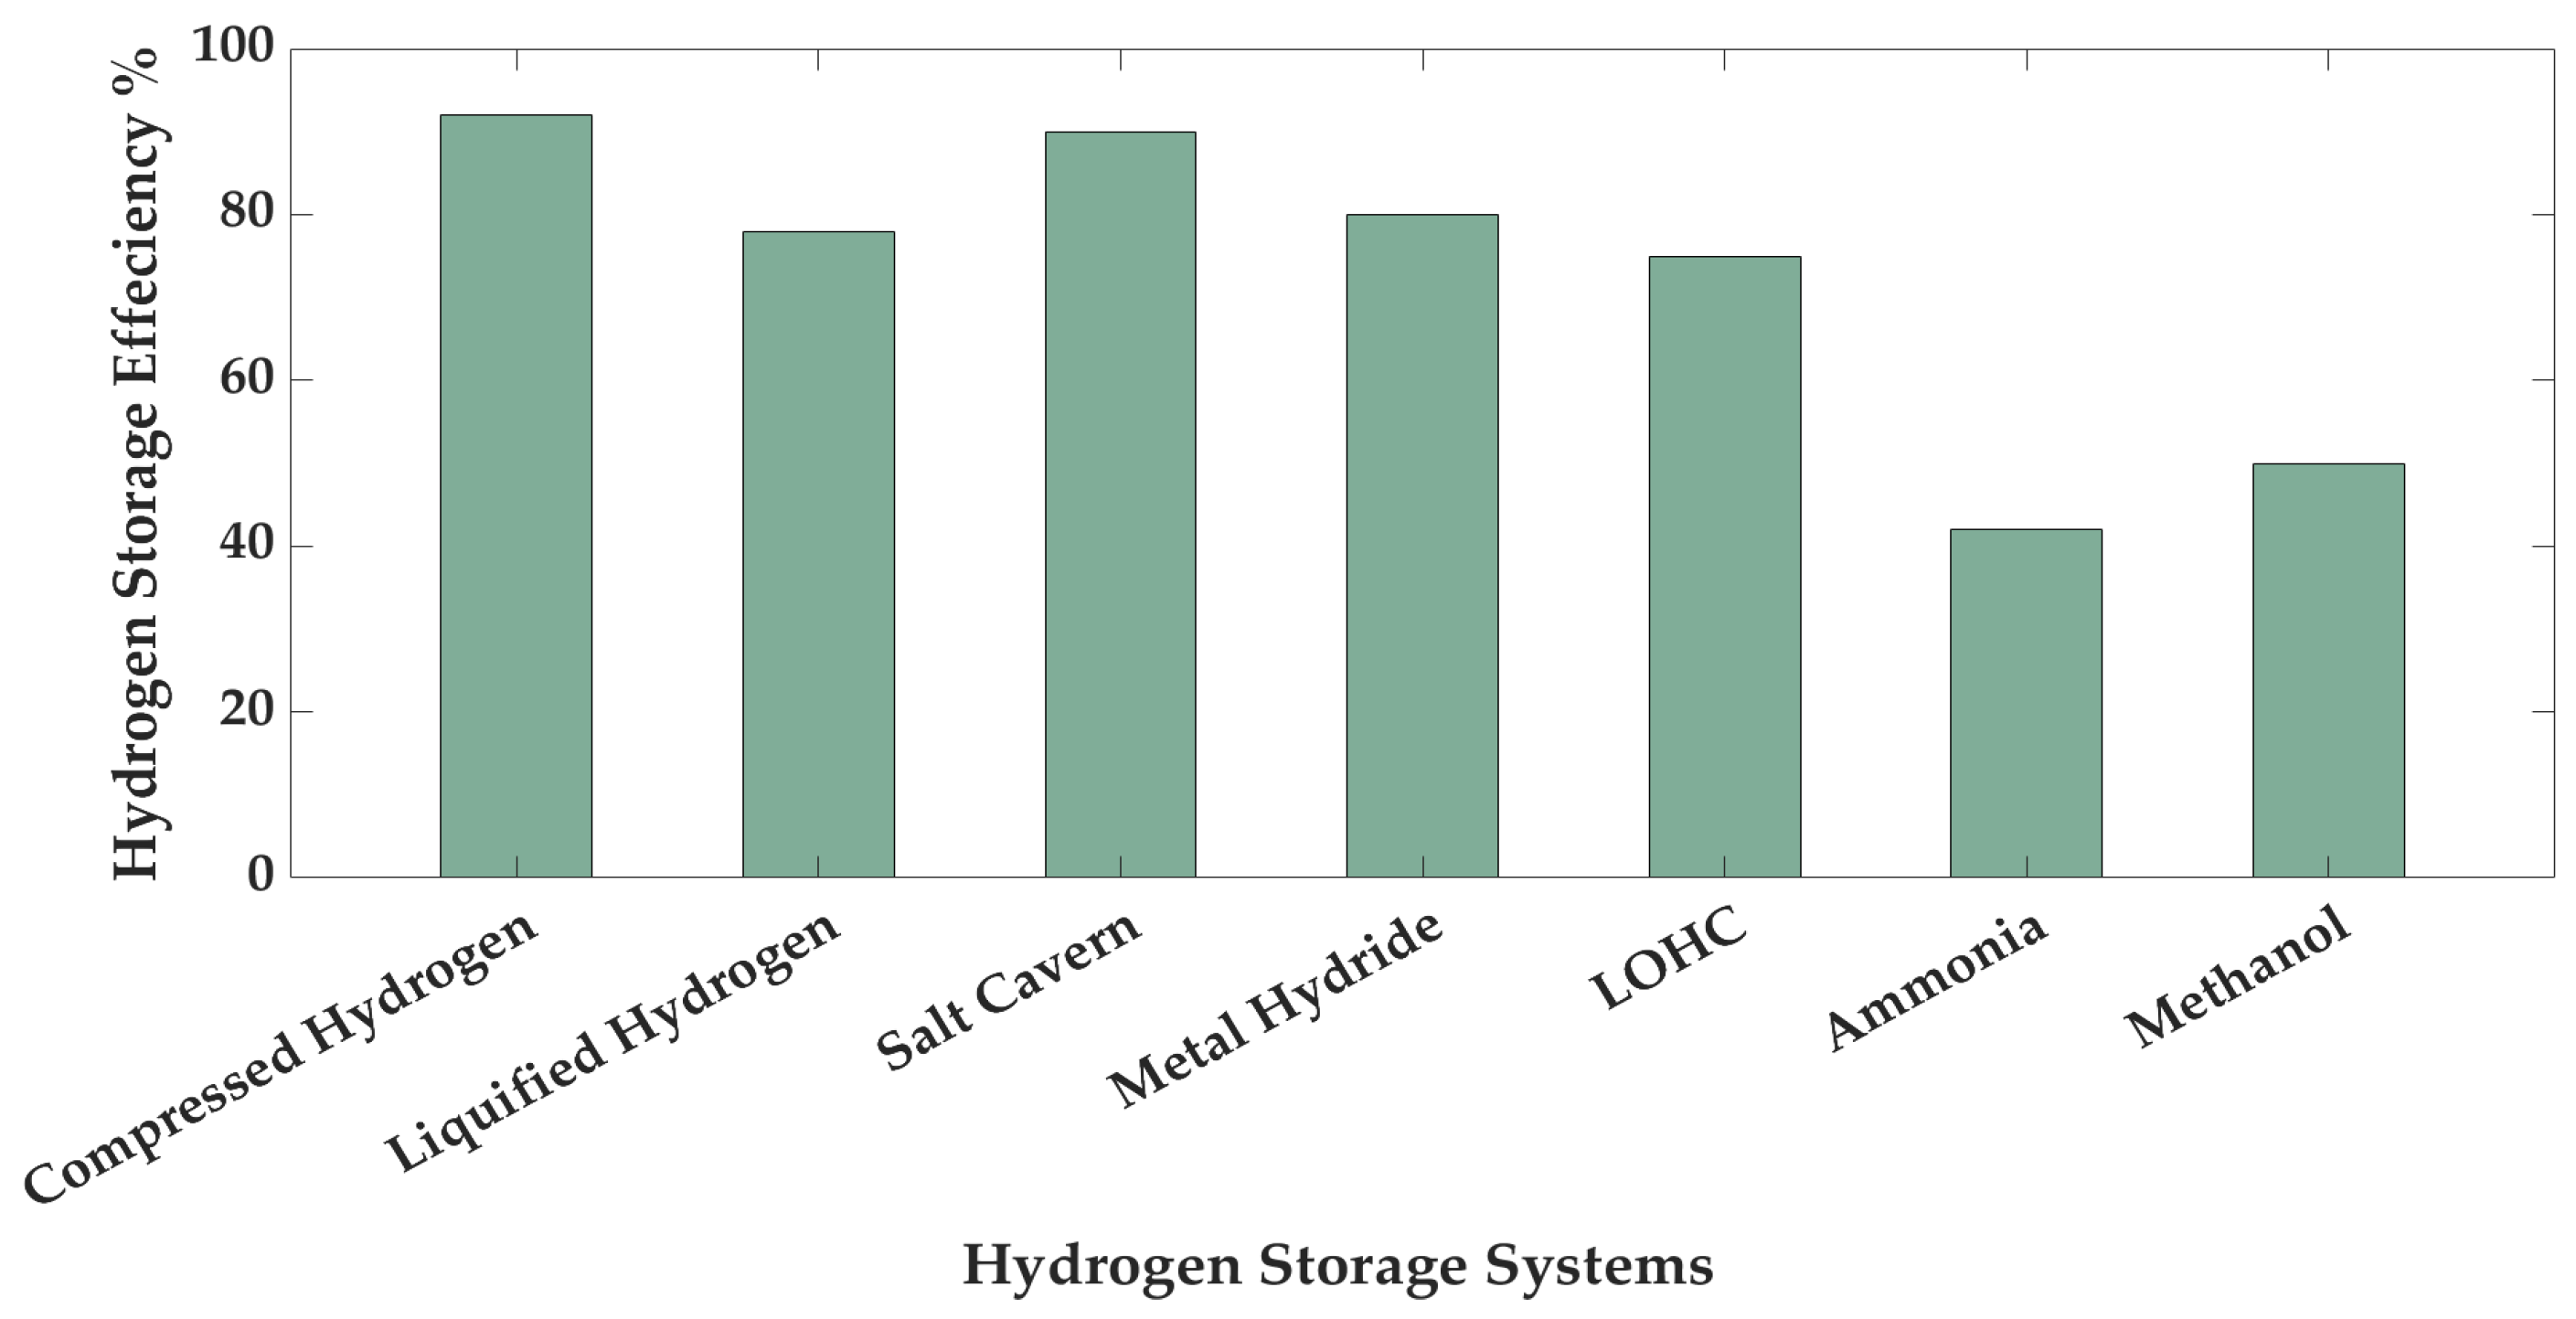
These three distinct configurations for the production and storage of green hydrogen and green ammonia are presented to demonstrate the variations in process design and flow, as well as storage integration, illustrating different ways to maximise scalability and efficiency in the use of renewable energy. These configurations differ in their approach to hydrogen storage, as well as the sequence of the process, which affects the system’s overall adaptability and feasibility in various operational scenarios. In all three configuration scenarios, green hydrogen storage is considered as compressed hydrogen at 700 bars. The comparison of different hydrogen storage strategies based on storage efficiency is given in
Figure 6.
Scenario 1, as shown in
Figure 7, illustrates that offshore wind energy is utilised to drive all the unit operations in the process. This configuration guarantees flexible hydrogen storage management by incorporating a dedicated hydrogen storage unit prior to ammonia synthesis. This configuration is particularly advantageous for accommodating the intermittent nature of renewable energy sources, such as offshore wind. This method can be helpful for improving energy security and enables ammonia production to operate independently of fluctuating hydrogen generation rates by decoupling hydrogen production and ammonia synthesis.
In Scenario 2, as depicted in
Figure 8, the process configuration eliminates the necessity for distinct hydrogen storage by directly integrating hydrogen production with ammonia synthesis. This simplified design is appropriate for scenarios in which a consistent and uninterrupted supply of hydrogen can be guaranteed, as it minimises infrastructure costs and complexity. Nevertheless, it is dependent upon consistent renewable energy input to prevent interruptions in ammonia production.
In scenario 3, shown in
Figure 9, a hybrid approach is demonstrated in which incorporates hydrogen storage while maintaining a direct connection to ammonia synthesis. This design strikes a balance between efficiency and flexibility, guaranteeing hydrogen availability during periods of low renewable energy generation while still enabling a direct production pathway when energy supply is stable. This configuration improves operational stability and reduces the risks associated with energy fluctuations. Stored green hydrogen might be used for many applications according to the market’s demand, such as as an e-fuel in hydrogen fuel cell vehicles (HFCVs). In the same way, green ammonia production does not depend on stored hydrogen.
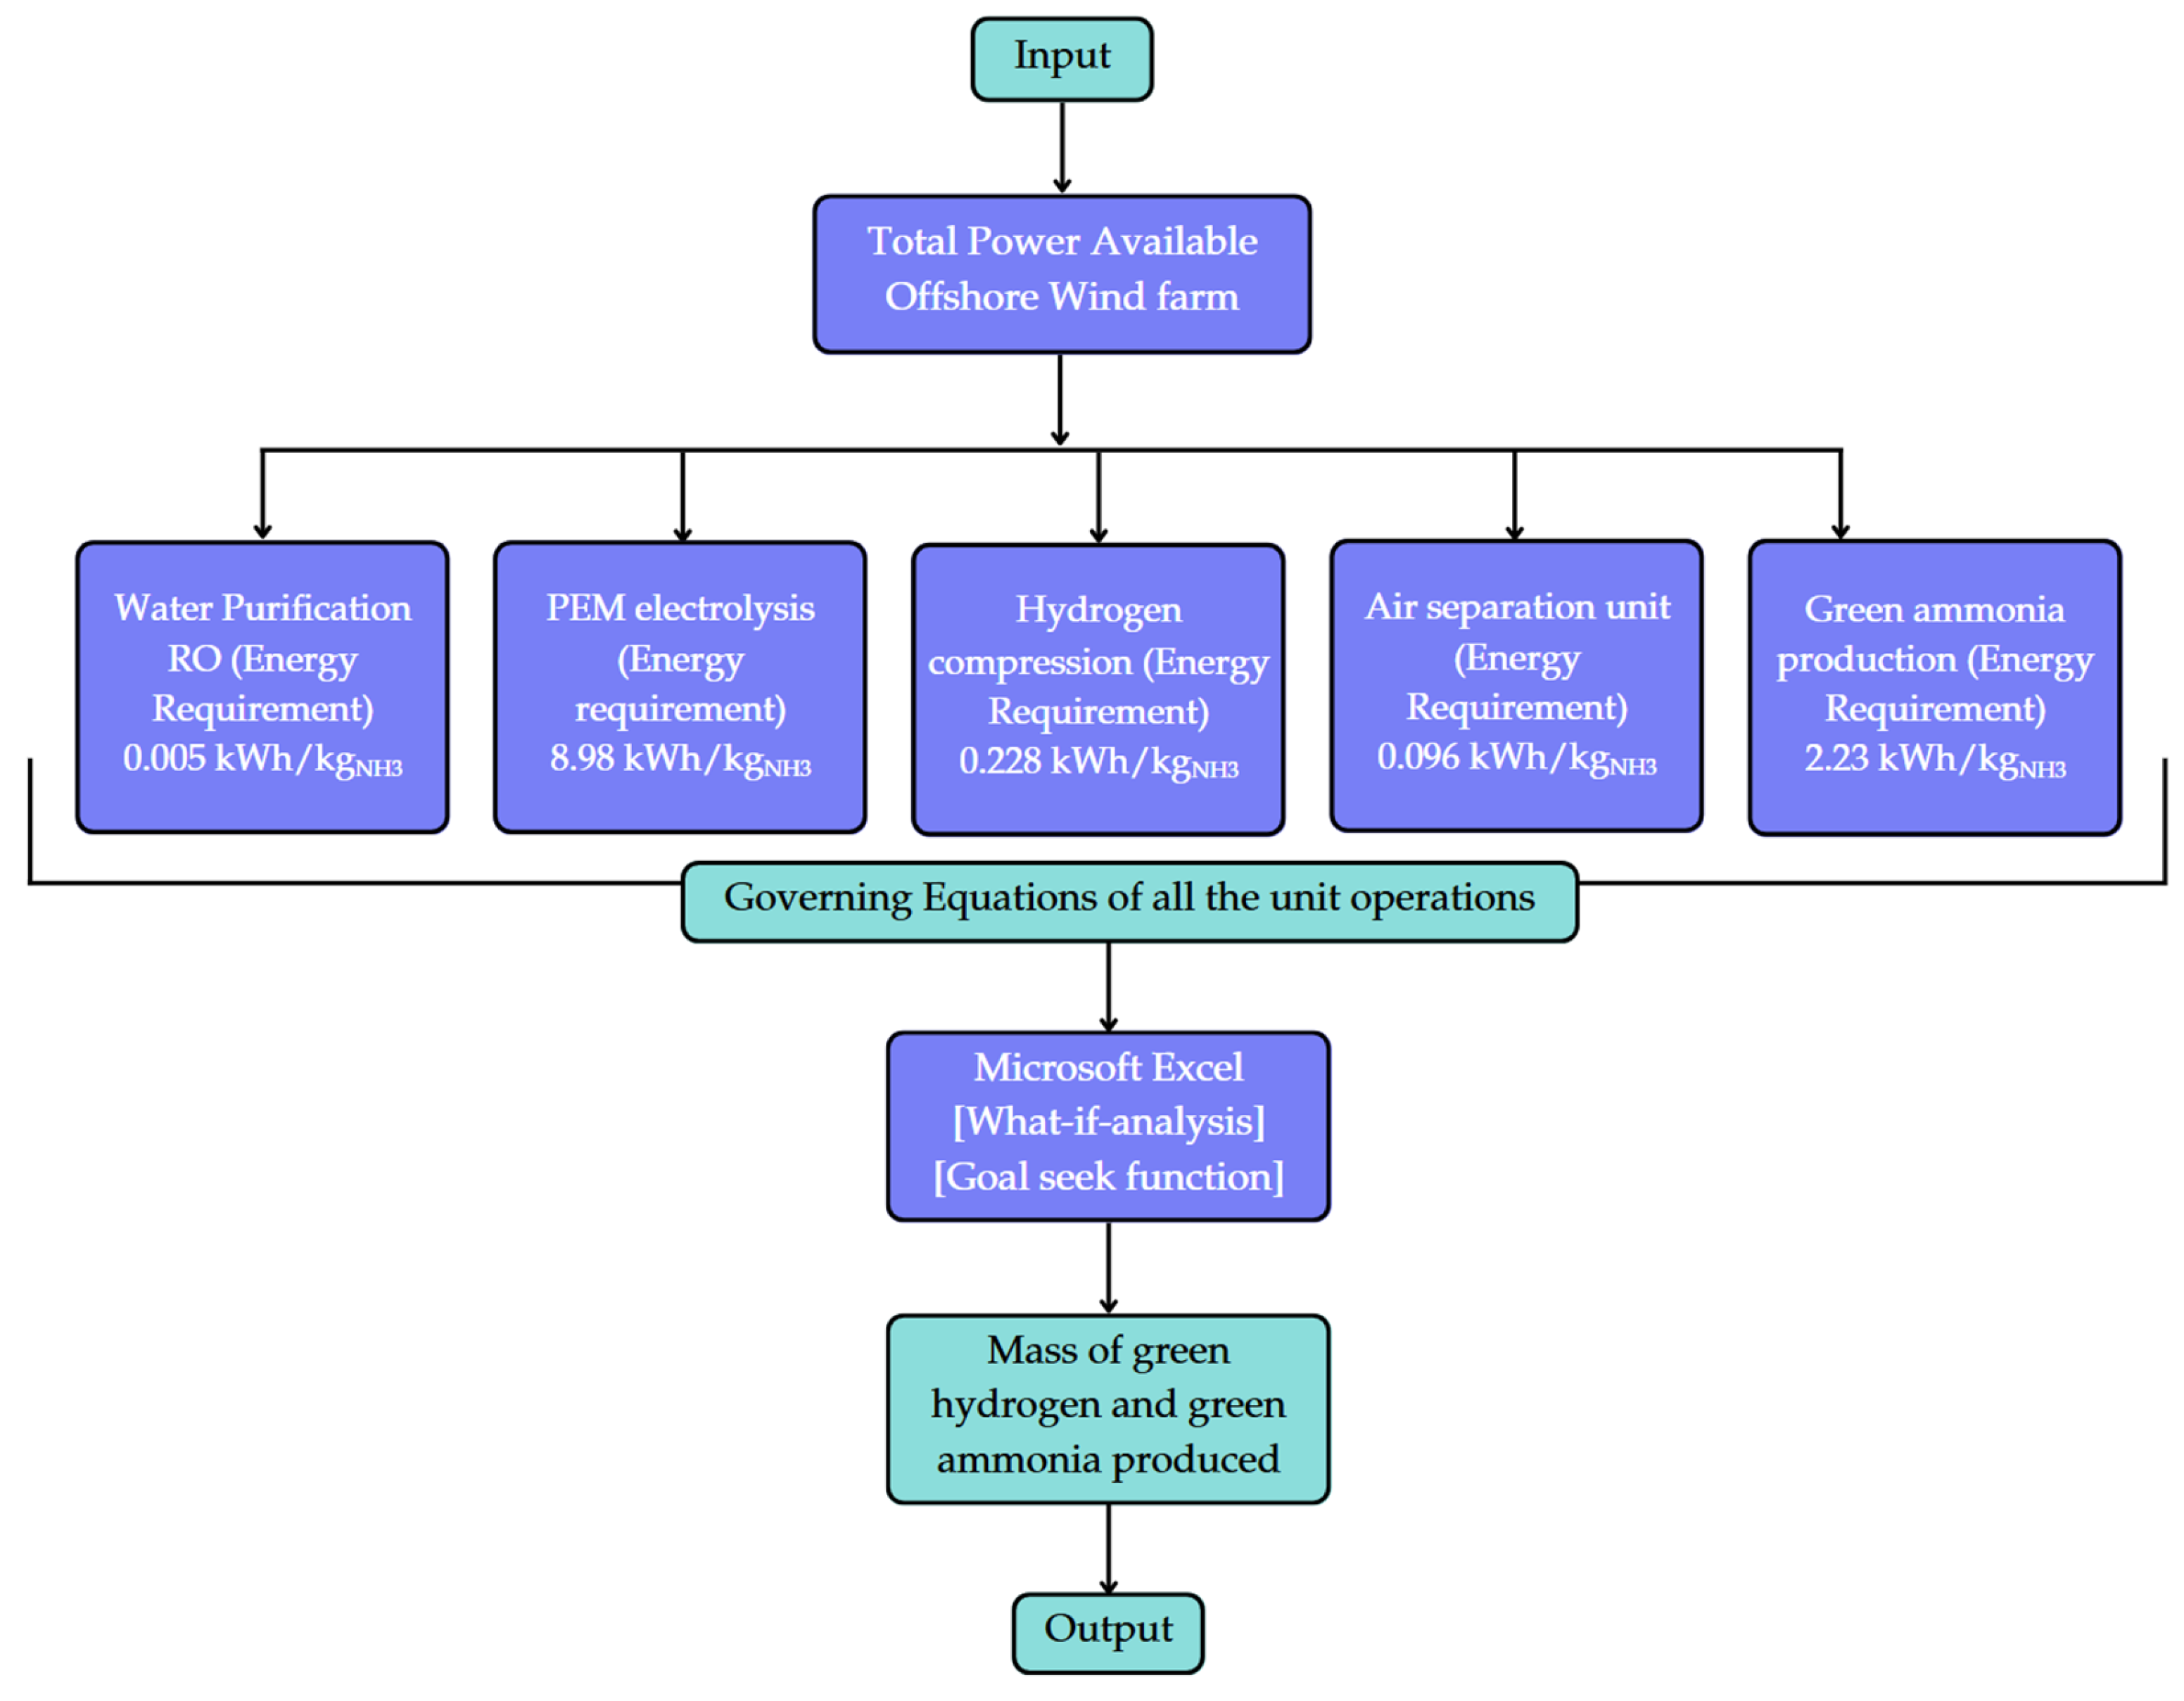
To find out the total mass of green hydrogen and green ammonia produced, Microsoft Excel’s what-if analysis and goal seek function are used with the following constraint: total available power must be equal to the power consumed in the process, so power will be supplied to every unit operation depending upon its requirement. The total mass of green hydrogen and green ammonia produced, as well as the total mass of water and nitrogen required, will be popped out of the function depending on how much power is distributed.
The flowchart in
Figure 10 delineates a systematic methodology for estimating the storage capacity of green hydrogen and green ammonia utilising energy generated from offshore wind farms. The foundation of this model is the input, representing the total available power derived from offshore wind. The total power available is allocated among several essential unit operations, each with a defined energy need measured per kilogram of green ammonia produced. The governing equations presented below are executed in Microsoft Excel by utilising advanced capabilities such as the “What-if Analysis” and “Goal Seek” functions. This computational method facilitates sensitivity analysis, scenario comparison, and optimisation depending on diverse inputs or desired outputs. The model ultimately yields the mass of green hydrogen and green ammonia produced as the final output, offering essential insights into the system’s efficiency and scalability. This visual and analytical depiction is essential for decision-making in the planning and development of offshore renewable fuel infrastructure.
Among the presented scenarios, each setup has trade-offs regarding energy efficiency, storage demands, operational adaptability, and overall system robustness. The selection of a particular design is contingent upon factors including energy availability, project location, economic considerations, and the intended degree of integration between hydrogen and ammonia production. These designs collectively demonstrate the various methods for deploying green hydrogen and ammonia storage systems in a renewable energy-based economy.
4.2. Power Output from Offshore Wind Farms
A list of installed and operational wind farms in England is given in
Table 1. A wind turbine’s ability to generate power is proportional to the wind speed. Equation (1) describes the typical behaviour of the power output of a wind turbine, P(U
wind), as a function of wind speed, U
wind:
The wind speed at which the wind turbine begins to generate power is represented by Ucut-in, and at a wind speed of Urated, the wind turbine can generate its rated power output. At a certain wind speed, specifically 25 m/s in case of Vestas V164 7000, the wind turbine must be shut down to protect its components and avoid damage, known as Ucut-off, which is the cut-off speed.
The power curves of wind turbines are not typically provided continuously by the manufacturers. However, a linear relationship between the data supplied by the manufacturer of the wind turbines from different web sources can be assumed to calculate the total power P (U
wind) for the different values of the wind speed, as shown in the equation below:
where P
i+1 and P
i show the power output at wind speeds U
i+1 and U
i between the two points from the available power and wind speed data, and the total power output from the wind farm having specific numbers of wind turbines can be calculated from the equation below:
where N
WT shows the total number of wind turbines and ‘
i’ shows the specific number of turbines.
4.3. Hydrogen Production Process (Electrolysis)
This analysis considers a sophisticated offshore water electrolysis platform, which is the major element in green hydrogen production. Two prevalent water electrolyser methods utilised in low-temperature applications are the alkaline electrolyser (AEL) and the proton exchange membrane electrolyser (PEMEL). Both systems are well established and are capable of large-scale hydrogen production; however, the latter is more appropriate for integration with intermittent renewable sources due to its rapid reaction capability.
In the AEL, an aqueous solution of KOH (25–30%) is used as an electrolyte. An electrolyte is a solution in which both electrodes of a cell are submerged. In alkaline electrolysers, there is diaphragm (membrane) separation between both cells.
Equations (4) and (5) show the chemical reactions taking place at the anode and cathode inside the cell of an alkaline electrolyser.
Hydrogen gas (H2) is generated at the cathode with high purity, generally between 99.5% and 99.9%, following the drying process. The energy efficiency of the alkaline electrolyser ranges from 51% to 60%, depending upon the reaction conditions, voltages, and electrodes.
In proton exchange membrane electrolysers, electrodes are affixed directly on a solid membrane stack that can conduct protons. The chemical reactions occurring on the anode and cathode are illustrated below. Unlike alkaline electrolysis, both processes occur in an acidic environment. The equations below describe the chemical reactions taking place in a cell of the PEMEL.
About 99.99% hydrogen purity could be achieved using PEMELs. At elevated current densities, the electrolysers could perform at higher pressures, facilitating the HB ammonia synthesis process. PEM electrolysers can operate at more than 1500 mA/cm
2 of current densities as compared to the alkaline electrolyser (200–600 mA/cm
2).
Table 4 shows the working conditions and potential characteristics of different electrolysers.
This analysis assumes a 65% efficiency of the PEM electrolyser based on a lower heating value of H2. This means that 65% of the electric energy input would be stored as chemical energy (lower heating value) during H2 production. The electricity needed for electrolysis is anticipated to come from offshore wind energy, which is a sustainable resource.
The basic electrolysis reaction, apart from the type of electrolyser, is as follows:
The above reaction is endothermic and requires energy from the process given by the following equation:
where
ΔH (J/mol) = the change in enthalpy;
ΔG (J/mol) = Gibbs free energy;
T (K) = the process temperature;
ΔS (J/mol) = the entropy change.
Based on ΔH, the required cell voltage in the electrolyser can be calculated with
where 2 is the number of electrons and F is the Faraday constant, F = 96,485.3365 C/mol. Now, ∆H is mostly the higher heating value of hydrogen, which is
But in some cases, such as in AEL and PEM, ∆H can be the lower heating value (LHV) of hydrogen, which is:
where the molar mass of hydrogen is M = 2.015 g/mol; this demonstrates how the rising temperature affects the energy required for the synthesis of hydrogen.
Eventually, the mathematical formula to calculate the amount of hydrogen is produced in Kg, providing the energy available:
where
P (MWh) = the available energy;
Vc = the cell voltage;
M = the molar mass of hydrogen;
= the efficiency of the electrolyser;
F = Faraday’s constant;
To determine the energy efficiency of the electrolyser, the following equation will be integrated:
According to the balanced chemical equation, Equation (8), and reaction stoichiometry, the production of 1 kg of H2 requires 8.965 kg of water, resulting in the generation of 7.9 kg of O2 as a by-product. In this analysis, no credits were assigned to the by-product O2. Now, for the water requirement, PEM electrolysers cannot be operated directly on seawater but need processed water, which can be obtained either through the desalination plant, reverse osmosis (RO), or multi-stage flash distillation (MSFD). The primary factor for comparison is the energy consumption of each procedure. To date, reverse osmosis has the minimum energy requirement of 3–3.5 kWh/m3 of seawater processing.
4.4. Storage of Produced Green Hydrogen
Efficiency is a crucial element in the cost of storage. An efficient storage system necessitates reduced energy input for hydrogen storage. Among the storage systems depicted in
Figure 6, compressed gas exhibits the highest storage efficiency at approximately 92% (salt caverns also store hydrogen in this form), as this storage method necessitates less energy input compared to others; it is a well-established hydrogen storage technology and is extensively utilised globally. Similarly,
Table 5 illustrates that metal hydrides have the lowest gravimetric density after LOHCs. Ammonia storage has a higher gravimetric density, but there are toxicity issues and conversion losses. Salt caverns have limitations in terms of location, and liquified hydrogen has high boil-off losses. For mobile and decentralised energy applications, 700 bars of compressed hydrogen storage is considered as the best option since it has balanced trade-offs such as energy density, response time, and infrastructure readiness level.
As illustrated in
Table 4, PEM electrolysers work with a pressure of 30–50 bars, and the pressure of the green hydrogen produced in the outlet stream is considered as 30 bars. According to the scenarios described above, green hydrogen needs to be compressed before entering the pressurised storage vessel. So, the energy requirement for the compression of gas can be calculated as
In the above equation, Pinlet and Poutlet represent the inlet and outlet pressures (bar/psi) of the gas and “n” is the number of compression stages, and the compression ratio is selected as 2. Ecomp (kWh/kg) shows the total energy consumed in the compression of a gas. ηEM represents the efficiency of an electric motor (assumed 95%), and ηc (efficiency isentropic) is assumed to be 80%. “Z” represents the compressibility factor (assumed to be 1).
4.5. Carbon-Free Green Ammonia Synthesis
Ammonia (NH3) exhibits higher volumetric density than hydrogen, good energy efficiency, and flexibility, since it can be utilised directly as fuel, fertiliser, or transformed into hydrogen. The ammonia synthesis method necessitates a Haber–Bosch (HB) reactor for the reaction of nitrogen and hydrogen, based on a weight composition of 82.4% nitrogen and 17.6% hydrogen, under particular reaction conditions. The ammonia synthesis reaction, as detailed in Equation (16), for the pressure range of 250–350 bars and temperatures of 400–550 °C in the presence of a metal-based catalyst such as Fe3O4, is an exothermic process that releases 2.7 MJ of heat per kilogram of ammonia produced, which constitutes approximately 7.5% of the total energy necessary for the conversion of reactants to green ammonia.
Air Separation for Nitrogen Production
Over 90 percent of the world’s nitrogen is produced through cryogenic distillation. With impurity concentrations as low as parts per billion, it is appropriate for large-scale system manufacturing. Compared to alternative air separation techniques, cryogenic distillation yields the purest N2 while using the least amount of power input, and cryogenic distillation is the only technology available for large-scale ASUs. By utilising differences in the boiling points of the main air constituents, cryogenic distillation separates the air into its constituent parts using a distillation column after cooling the air to its dew point and eliminating impurities. Due to two changes to the double-column arrangement, the energy needed to separate one standard cubic metre of pure N2 at 8 bars ranges from 0.15 to 0.25 kWh. Using a nitrogen density of 1.23 kg/m3, a standard temperature, and 1 bar (STP) of pressure, we employ a mid-value of 0.2 kWh/m3 in this investigation.
Figure 9 shows the process description for green ammonia production from the offshore wind farm.
According to the balanced chemical equation, 3 moles of hydrogen is required to produce 2 moles of ammonia:
According to the above chemical and molar equations, we calculated that 0.178 kg of hydrogen and 0.822 kg of nitrogen are required to produce 1 kg of ammonia.
A conventional Haber–Bosch ammonia synthesis plant has five common operations, including (1) compressors (regulate the pressure according to need in the synthesis loop), (2) chemical reactor/s to carry out the reactions for ammonia synthesis, (3) heat exchanger/s to regulate the temperatures of the synthesis loop, (4) a chemical separation unit (condensation of absorption) to obtain the liquid ammonia, (5) purge stream/s to recycle the unreacted chemicals in the synthesis loop.
Alkaline electrolysers produce hydrogen, and cryogenic distillation, powered by offshore wind farms, produces nitrogen, making this process green ammonia production.
Table 6 shows the renewable ammonia synthesis technologies with their readiness levels [
35].
According to the best available technology, green ammonia production powered by the offshore wind farm, electric HB with alkaline electrolysis, is the best option. A study conducted by Guillermo et al. showed that a two-reactor series combination with a working pressure between 205–250 bars and 400–500 °C with an iron-based catalyst is the best. Researchers also show that hydrogen production from water electrolysis is only responsible for 80.6% of the total energy consumption in the production of green ammonia, followed by HB synthesis at 18.6% and nitrogen production at 0.818%.
Table 7 compares the performance indicators of green, grey, and blue ammonia production [
29].
4.6. Cost Evaluation of Green Hydorgen and Green Ammonia
The objective of the cost evaluation is to find out the price per kg of green ammonia and green hydrogen for the proposed scenarios. The levelized cost of ammonia (LCOA) and the levelized cost of hydrogen (LCOH) are the parameters through which the economic viability of green ammonia production is assessed. LCOA involves the capital investment or capital expenditure (CAPEX) and operating cost or operating expenditure (OPEX) for ammonia production. Similarly, LOHC is the key parameter to determine that the hydrogen production technology is viable or not. Both LOCA and LOCH are determined based on the net present values (NPVs) as follows:
Equation (17) is the showing price at which the ammonia produced would have to be sold to achieve a net present value of zero for the defined discount rate and plant lifetime. The LCOA is calculated using CAPEX
t, OPEX
t, and mNH
3, which are the capital costs, operating costs, and mass of ammonia produced in year t; r is the discount rate, and n is the total number of years. The discount rate was set to 7.5%. The costs of all the components are proposed in the range of specific costs, e.g., (USD/kW) or (USD/tonne) and (USD/m
3). The total CAPEX is calculated based on the maximum performance capacity of the components. The costing data for the components and equipment are collected from the literature for cost estimation using the comparative cost method. The selected cost ranges for the different equipment and components are presented in
Table 8.
To calculate the LCOH, the parameters CAPEX
t, OPEX
t, and mH
2 are the capital costs, operating costs, and mass of hydrogen produced in year t. Equation (18) is used for all three scenarios, and costing data are used, as shown in
Table 8.
To carry out cost estimation, all the costing values are taken from the range of different literature sources based upon the scenarios presented in this study.
5. Results and Discussion
The Hornsea offshore wind farms operational in the North Sea, which is east of the Yorkshire coast, are considered the energy source to power every operation of green hydrogen and ammonia process in this study. Only Hornsea One and Hornsea Two are operational among the four wind farms at Hornsea, with a power production capacity of 1.265 GW and 1.320 GW, respectively. Meanwhile, Hornsea Three and Four are in the development stages. The Hornsea One wind farm is incorporated with the wind turbine model Siemens Gamesa SG 7.0-154, with a total of 174 wind turbines, and Hornsea Two is incorporated with the wind turbine model Siemens Gamesa 8.0-167 DD, with a total of 165 wind turbines. In this study, wind turbine models from the Vestas are considered at the exact location, with the same windmills at Hornsea One and Hornsea Two. The potential characteristics for both wind turbines are given in
Table 9 and
Table 10.
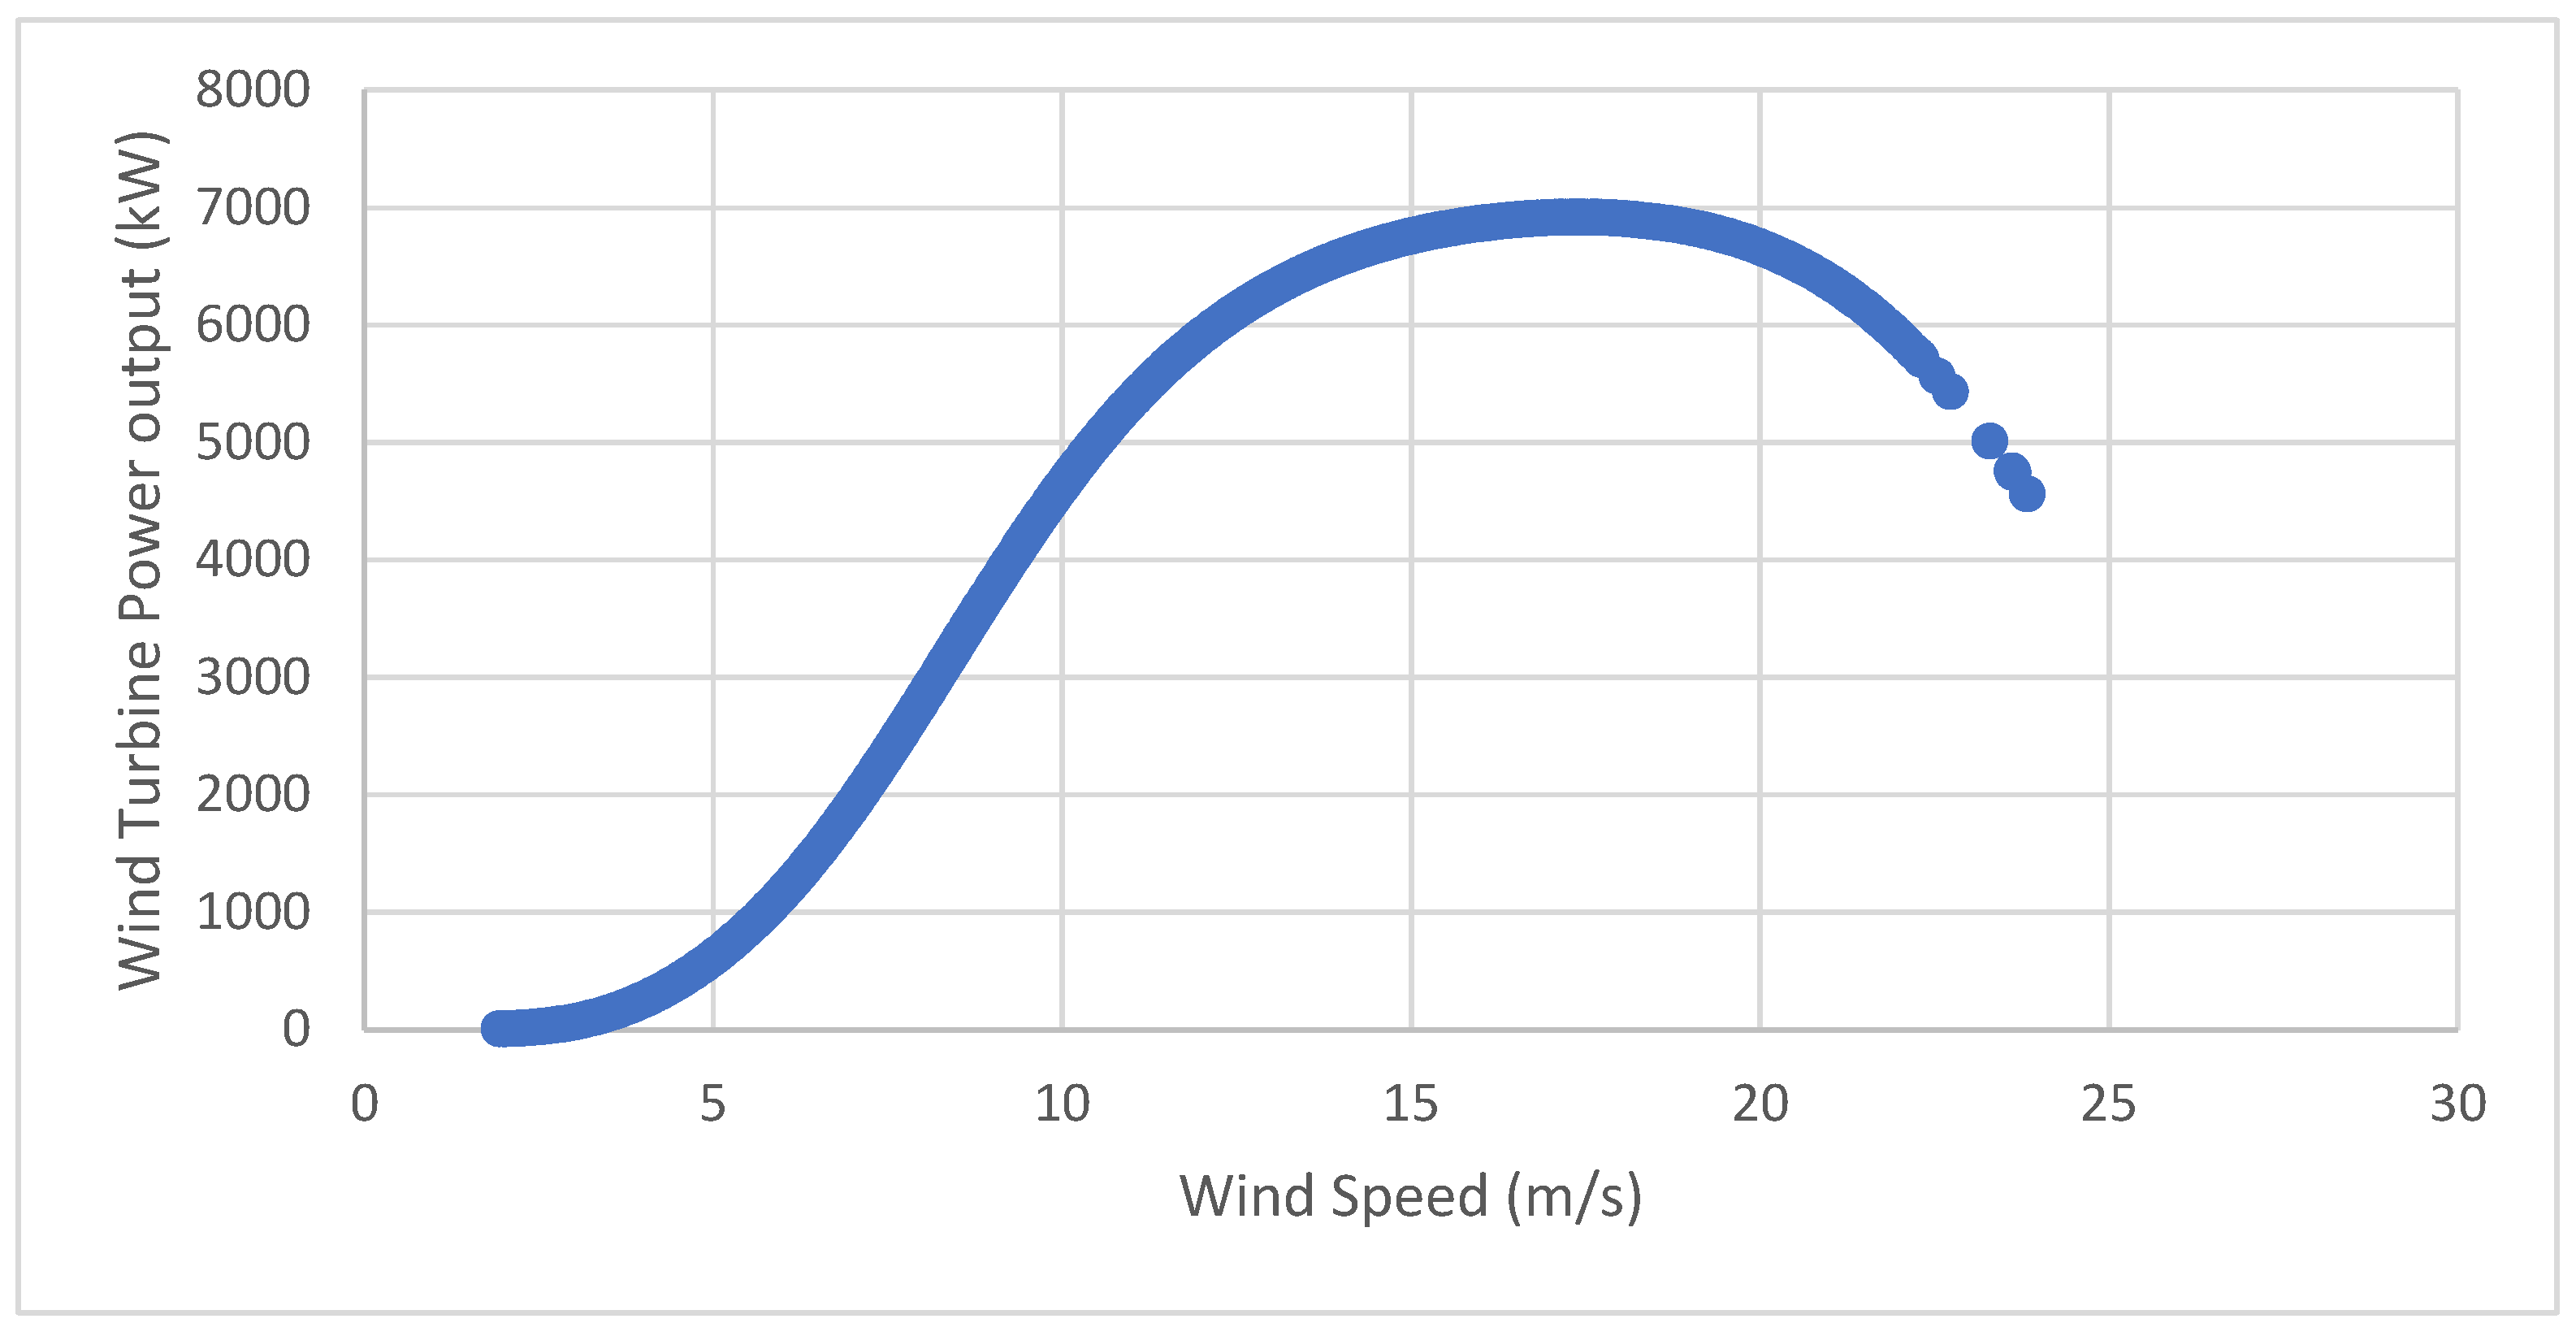
The ideal power curve of Vestas V164-7000 and Vestas V164-8000, which was obtained from the given source [
36,
37], is given in
Figure 11.
Wind data for the exact location of the Hornsea One wind farm were taken from [
38] for the whole year of 2023.
Figure 12 shows the hourly wind speed data at the Hornsea One wind farm.
Figure 13 shows the hourly power output of a single turbine depending upon the wind speed. The total power produced by the wind farm on an hourly basis can then be calculated using the equation P
farm(t), according to the total number of turbines working in the wind farm.
Figure 14 shows the power output curve of Vestas V164 7000 based on the wind speed data presented in
Figure 14.
Table 10 shows the technical characteristics of the Hornsea Two wind farm with the turbine model of Vestas V164-8000.
Figure 15 shows the hourly wind speed data obtained from [
38]. Similarly,
Figure 16 shows the hourly power output of a single turbine depending on the wind speed and the power curve.
Figure 17 shows the power output curve based on available real-time wind speed data. The total power produced by the wind farm on an hourly basis can then be calculated by using the equation P
farm(t), according to the total number of turbines working in the wind farm.
Both wind farms collectively produced a total power output of 12.2832 TWh in 2023, which is considered the total energy available to power the green hydrogen and green ammonia production facilities in this study.
5.1. Scenario 1
In Scenario 1, as described in the methodology, the total amount of green hydrogen produced will be stored in the pressurised storage. Then, the storage vessel will supply hydrogen to the ammonia production plant.
Table 11 shows the energy requirement for unit operations in green hydrogen and green ammonia production. The type of electrolyser is selected a proton exchange membrane electrolyser because of its high response rate in the intermittent nature of renewable energy sources. The efficiency of the electrolyser is assumed as 66%. To produce green ammonia, the process of electric Haber–Bosch with the high-pressure PEM electrolysis is considered in all three presented scenarios.
Table 12 shows the total mass of green hydrogen produced, the mass of nitrogen required to react with the produced green hydrogen, and the total mass of green ammonia produced with the equal distribution of power available.
The total available power for various operations in the process is 12,283.22 GWh. This power is distributed across multiple operations, each contributing to different production outcomes. Water purification utilises a minimal 0.062% of the total power (5.9634 GWh), resulting in the requirement of 1,703,576.34 tonnes of purified water, with no specified storage requirements. The huge amount of power, 77.78% (9554.86 GWh), is allocated to green hydrogen production, yielding 189,286.26 tonnes of green hydrogen and requiring a storage volume of 4,506,815.73 m3. Additionally, green hydrogen compression at 700 bars consumes 2.546% (242.67 GWh) of the total power, although the storage volume for compression is not specified separately.
Nitrogen production uses 1.076% (102.57 GWh) of the power to produce 876,700.84 tonnes of nitrogen, with no specific storage volume mentioned. Lastly, green ammonia production takes up 19.35% (2377.15 GWh) of the total power, producing 1,065,987.11 tonnes of ammonia and requiring a storage volume of 1,563,030.95 m3.
5.2. Scenario 2
In Scenario 2, as explained in the methodology, no specific huge green hydrogen is considered. The hydrogen produced from the electrolysers will be supplied straight away to the green ammonia production facility. All other technical assumptions are the same as in scenario 1.
Table 13 shows the mass of green hydrogen produced, the amount of nitrogen required to combine with the produced green hydrogen, and the mass of green ammonia produced with the equal distribution of power available.
The total available power for various operations in the process is 12,283.22 GWh, which is the power generated by the wind farms in 2023. The breakdown of power utilisation across various operations shows that most of the power, 79.35% (9747.43 GWh), is dedicated to green hydrogen production, resulting in 193,101.21 tonnes of green hydrogen and requiring a storage volume of 4,597,648.08 m3. Green ammonia production utilises 19.74% (2425.06 GWh) of the total power, yielding 1,087,471.48 tonnes and necessitating a storage volume of 1,594,532.96 m3. Although it consumes only 0.049% (6.083 GWh) of the total power, water purification results in a significant requirement of 1,737,910.97 tonnes of purified water. Nitrogen production uses 0.851% (104.64 GWh) of the power to produce 894,370.26 tonnes of nitrogen.
The provided data show that the largest portion of energy is allocated to green hydrogen production, reflecting its high energy demands and significant output. The substantial storage requirements for hydrogen indicate the need for large-scale infrastructure to support its production and storage. The efficient allocation of power across these operations demonstrates a balanced approach to achieving diverse production goals, emphasising green hydrogen and ammonia, highlighting their importance in the overall energy and production strategy. The relatively low power utilisation for water purification and nitrogen production suggests that these processes are less energy-intensive but still crucial for supporting the main production processes.
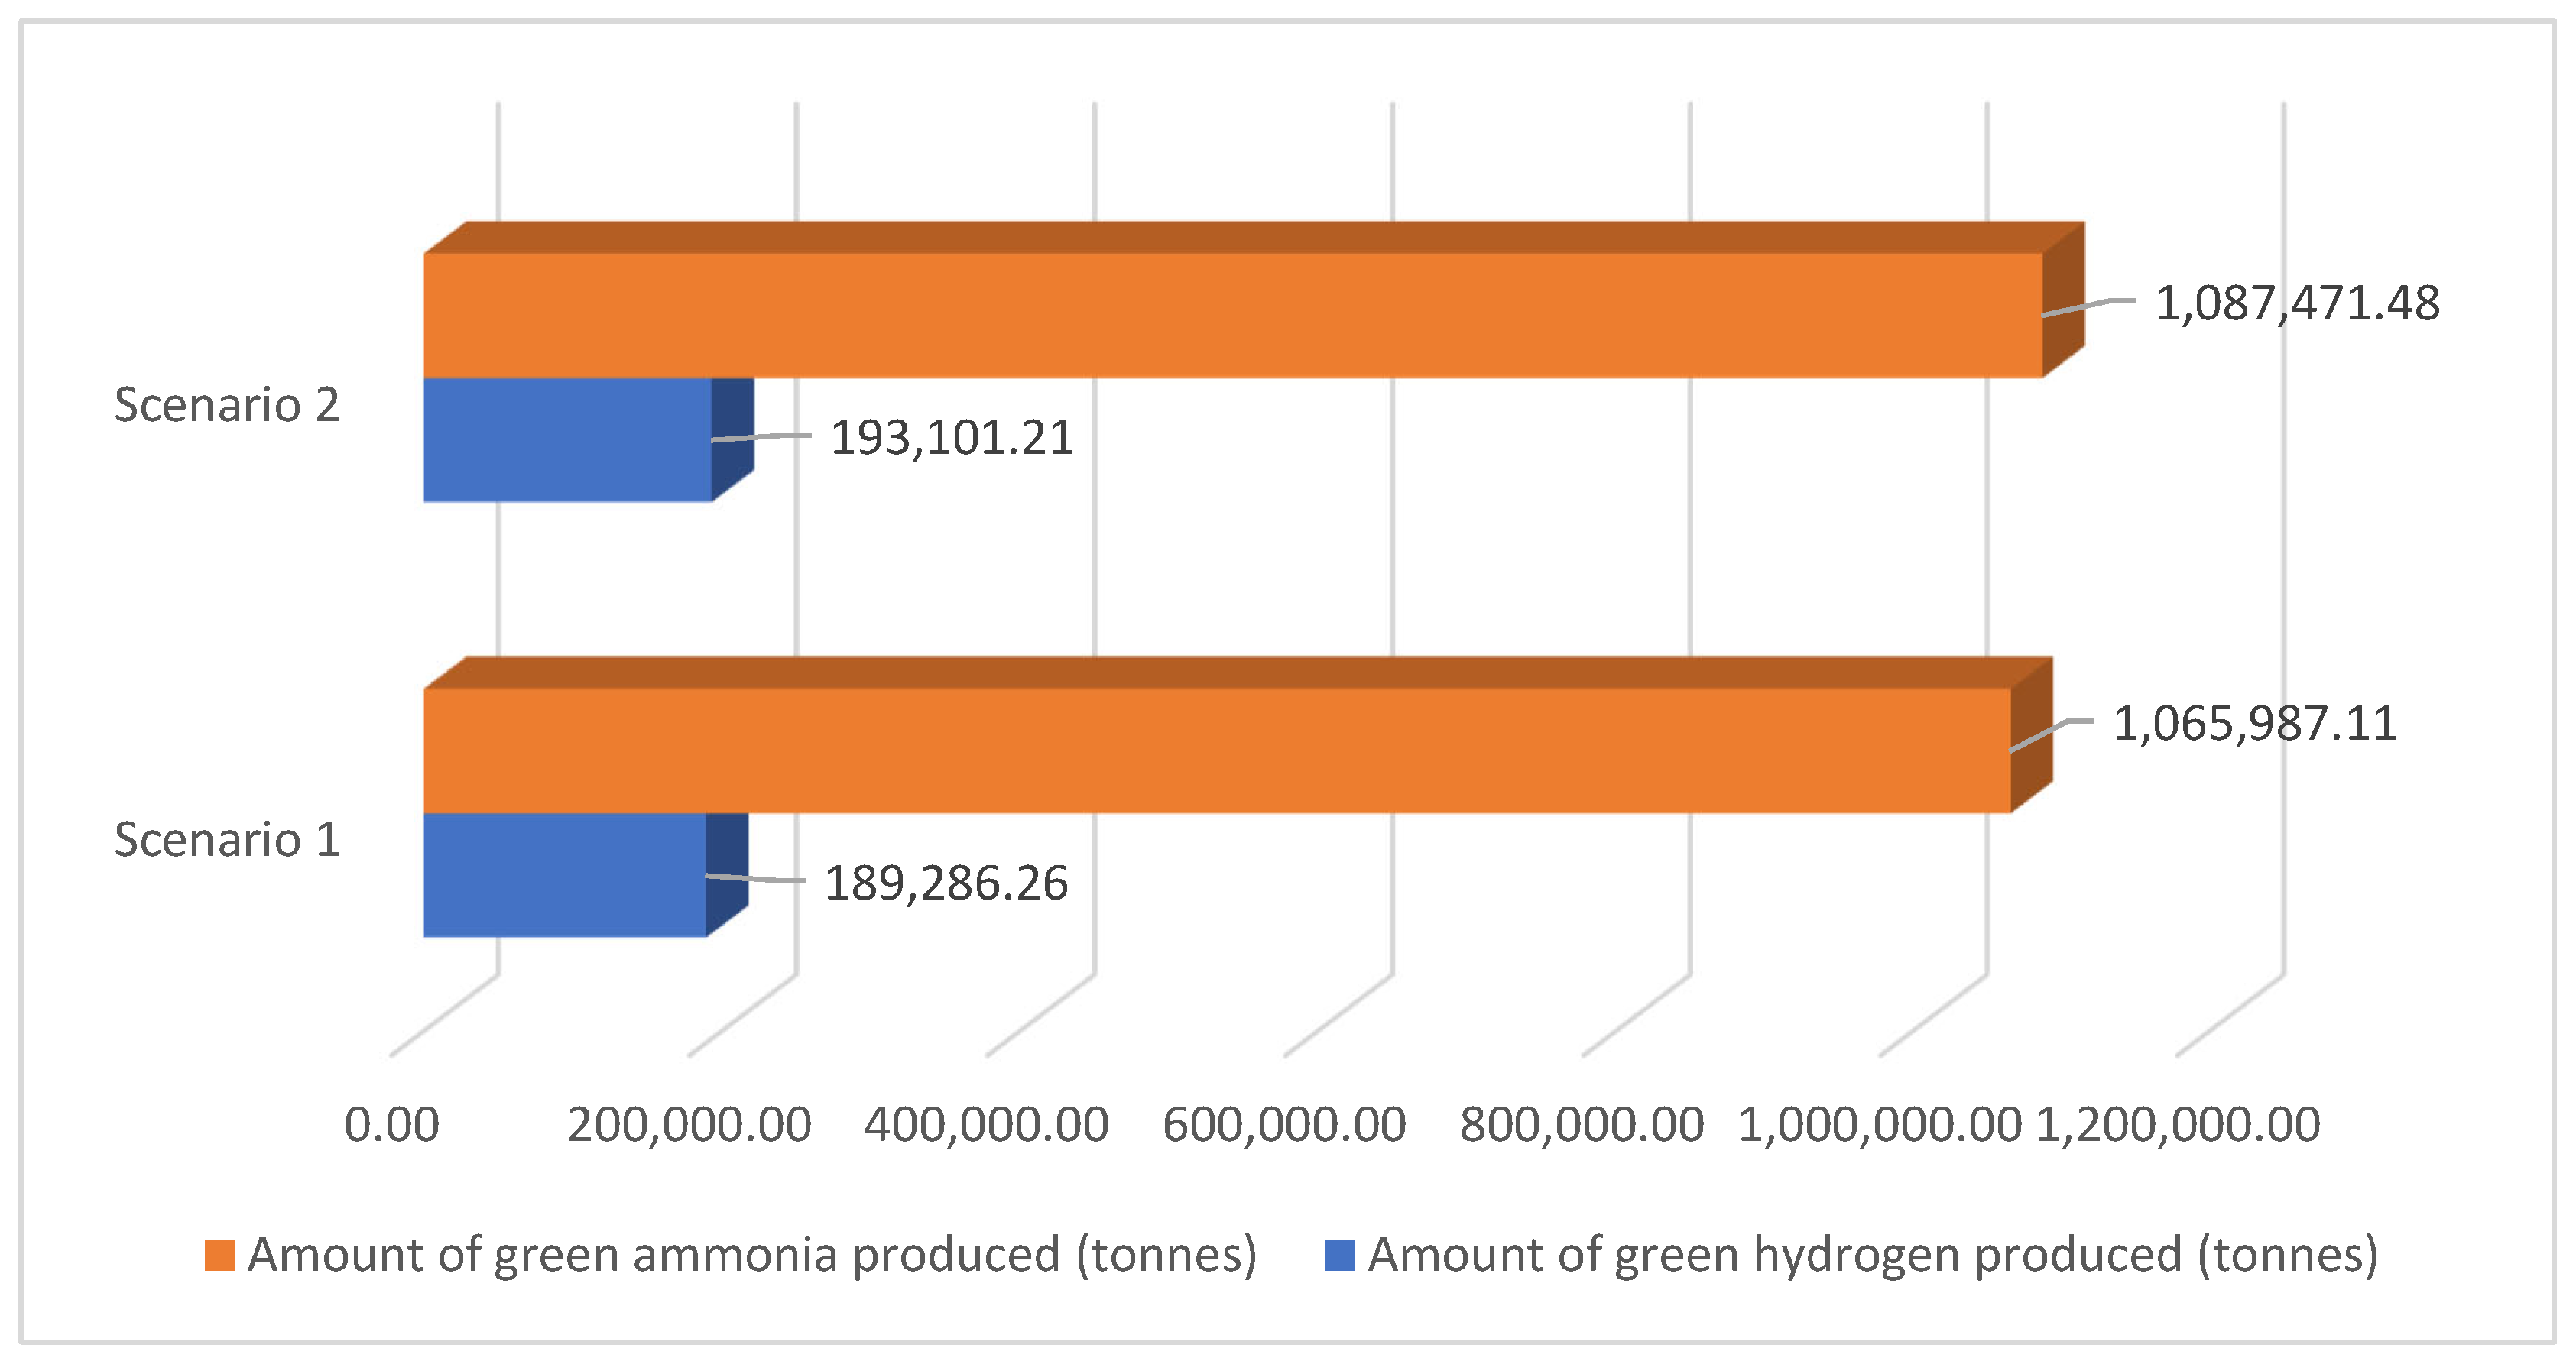
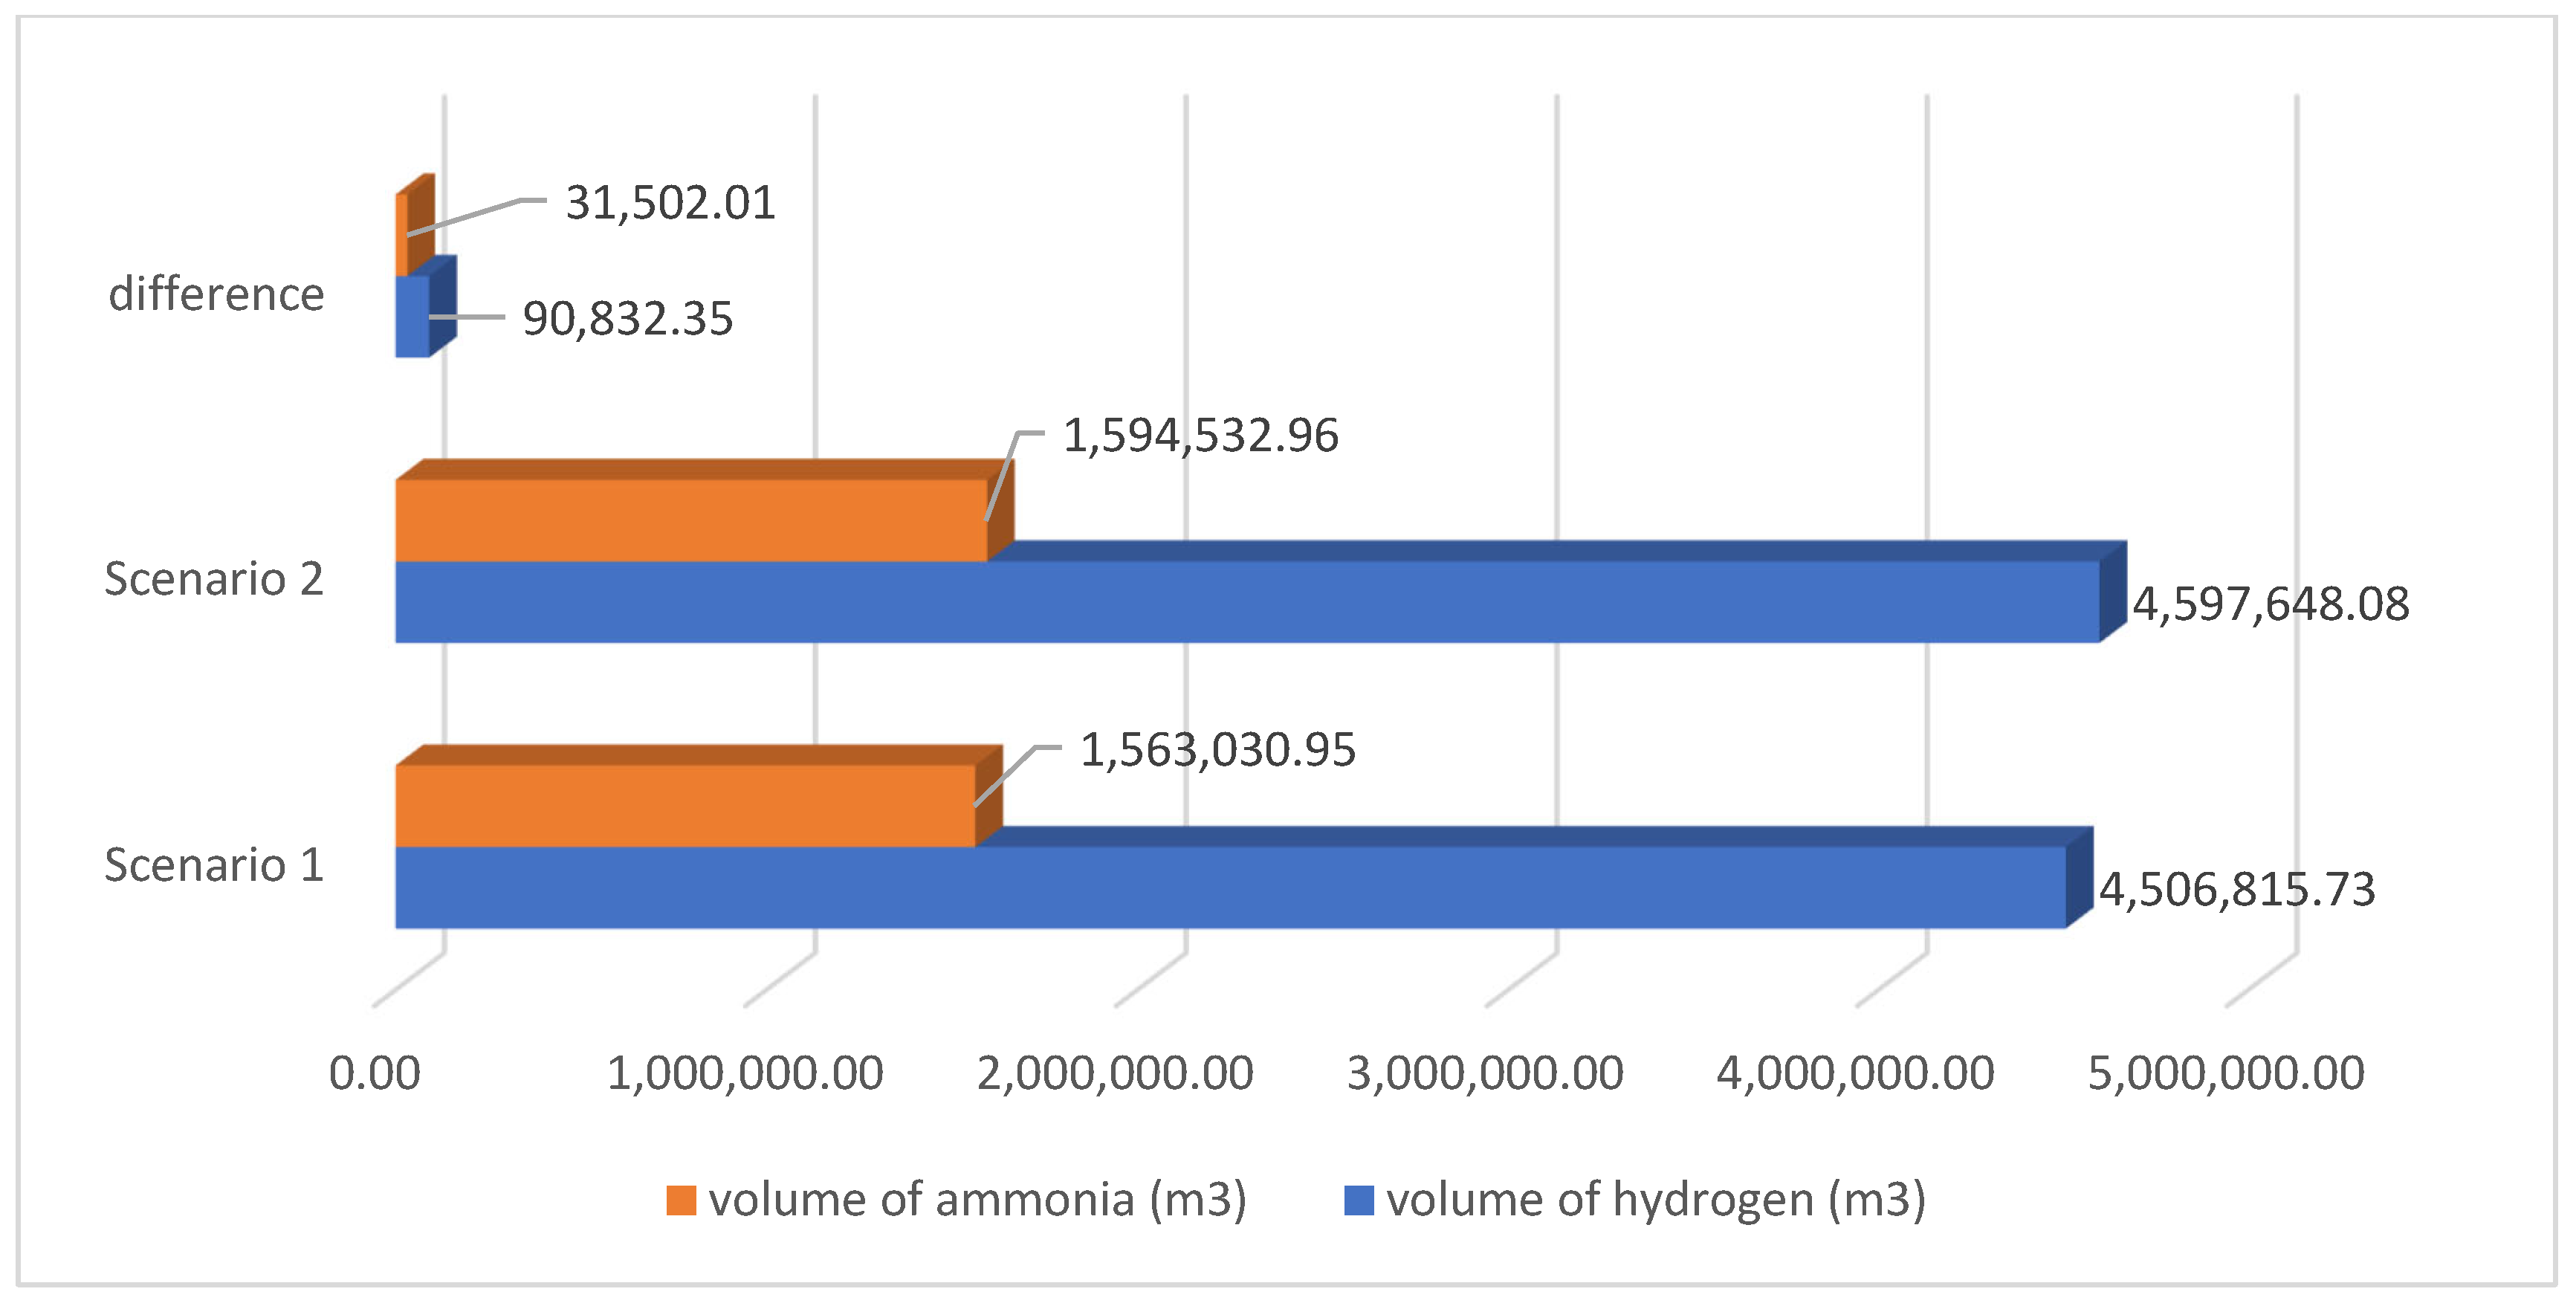
Figure 18 and
Figure 19 show a comparison between scenario 1 and scenario 2 with respect to the amount of green hydrogen and ammonia produced and the volume required for storage.
The comparison of the two scenarios indicates that scenario 2 results in a larger production of both green ammonia and green hydrogen relative to scenario 1, measured in both mass and volume. It is majorly due to saving the storage cost from scenario 1 and utilizing this amount of saved energy in the production of green ammonia and hydrogen in larger quantities. Scenario 2 yields an additional 21,484.37 tonnes of ammonia and 3814.95 tonnes of hydrogen, resulting in a volume increase of 31,502.01 m3 for green ammonia and 90,832.35 m3 for green hydrogen. The disparities suggest that modifications in scenario 2, whether stemming from process optimisation, resource allocation, or other operational enhancements, have marginally increased the production of both green ammonia and hydrogen. The increase in green hydrogen volume is significantly more than that of ammonia, indicating that scenario 2 may be more successful in maximising hydrogen generation. Scenario 2 has a marginal superiority over scenario 1 in generating greater quantities of green ammonia and green hydrogen, both in weight and volume, indicating a possibly more efficient manufacturing methodology. But without the potential storage of hydrogen in the production process of green ammonia, it would have challenges like reliance on real-time renewable energy sources for ammonia production, and there would be an imbalance between production, supply, and demand. So, an optimised scenario must be considered to overcome these kinds of challenges.
5.3. Scenario 3
In scenario 3, as described in the methodology, the specific percentage of green hydrogen produced from the electrolysers goes into the storage vessel, and the rest is supplied to the green ammonia production facility. This study performed a sensitivity analysis to select the optimised percentage of the green hydrogen produced for green ammonia production.
Figure 20 depicts the almost/quasi linear, ascending trend, which signifies a direct and proportional correlation between the quantity of hydrogen allocated for storage and the overall quantity of hydrogen generated. This indicates that when additional hydrogen is designated for storage, overall hydrogen production rises consistently. This is due to the less amount of energy being used to produce ammonia because only a small amount of hydrogen is used to supply the production of ammonia. So, the energy saved from ammonia production will be used to produce extra hydrogen.
From
Figure 21, it can be inferred that the amount of total green ammonia produced directly depends upon the amount of hydrogen supplied according to need and demand. The diversion of more hydrogen to storage results in a diminished availability of hydrogen for ammonia synthesis, thereby reducing the mass of green ammonia produced. This graph may be pertinent in contexts where green hydrogen serves dual purposes in energy storage and industrial production, such as ammonia synthesis, necessitating a balancing according to demand or operational strategy.
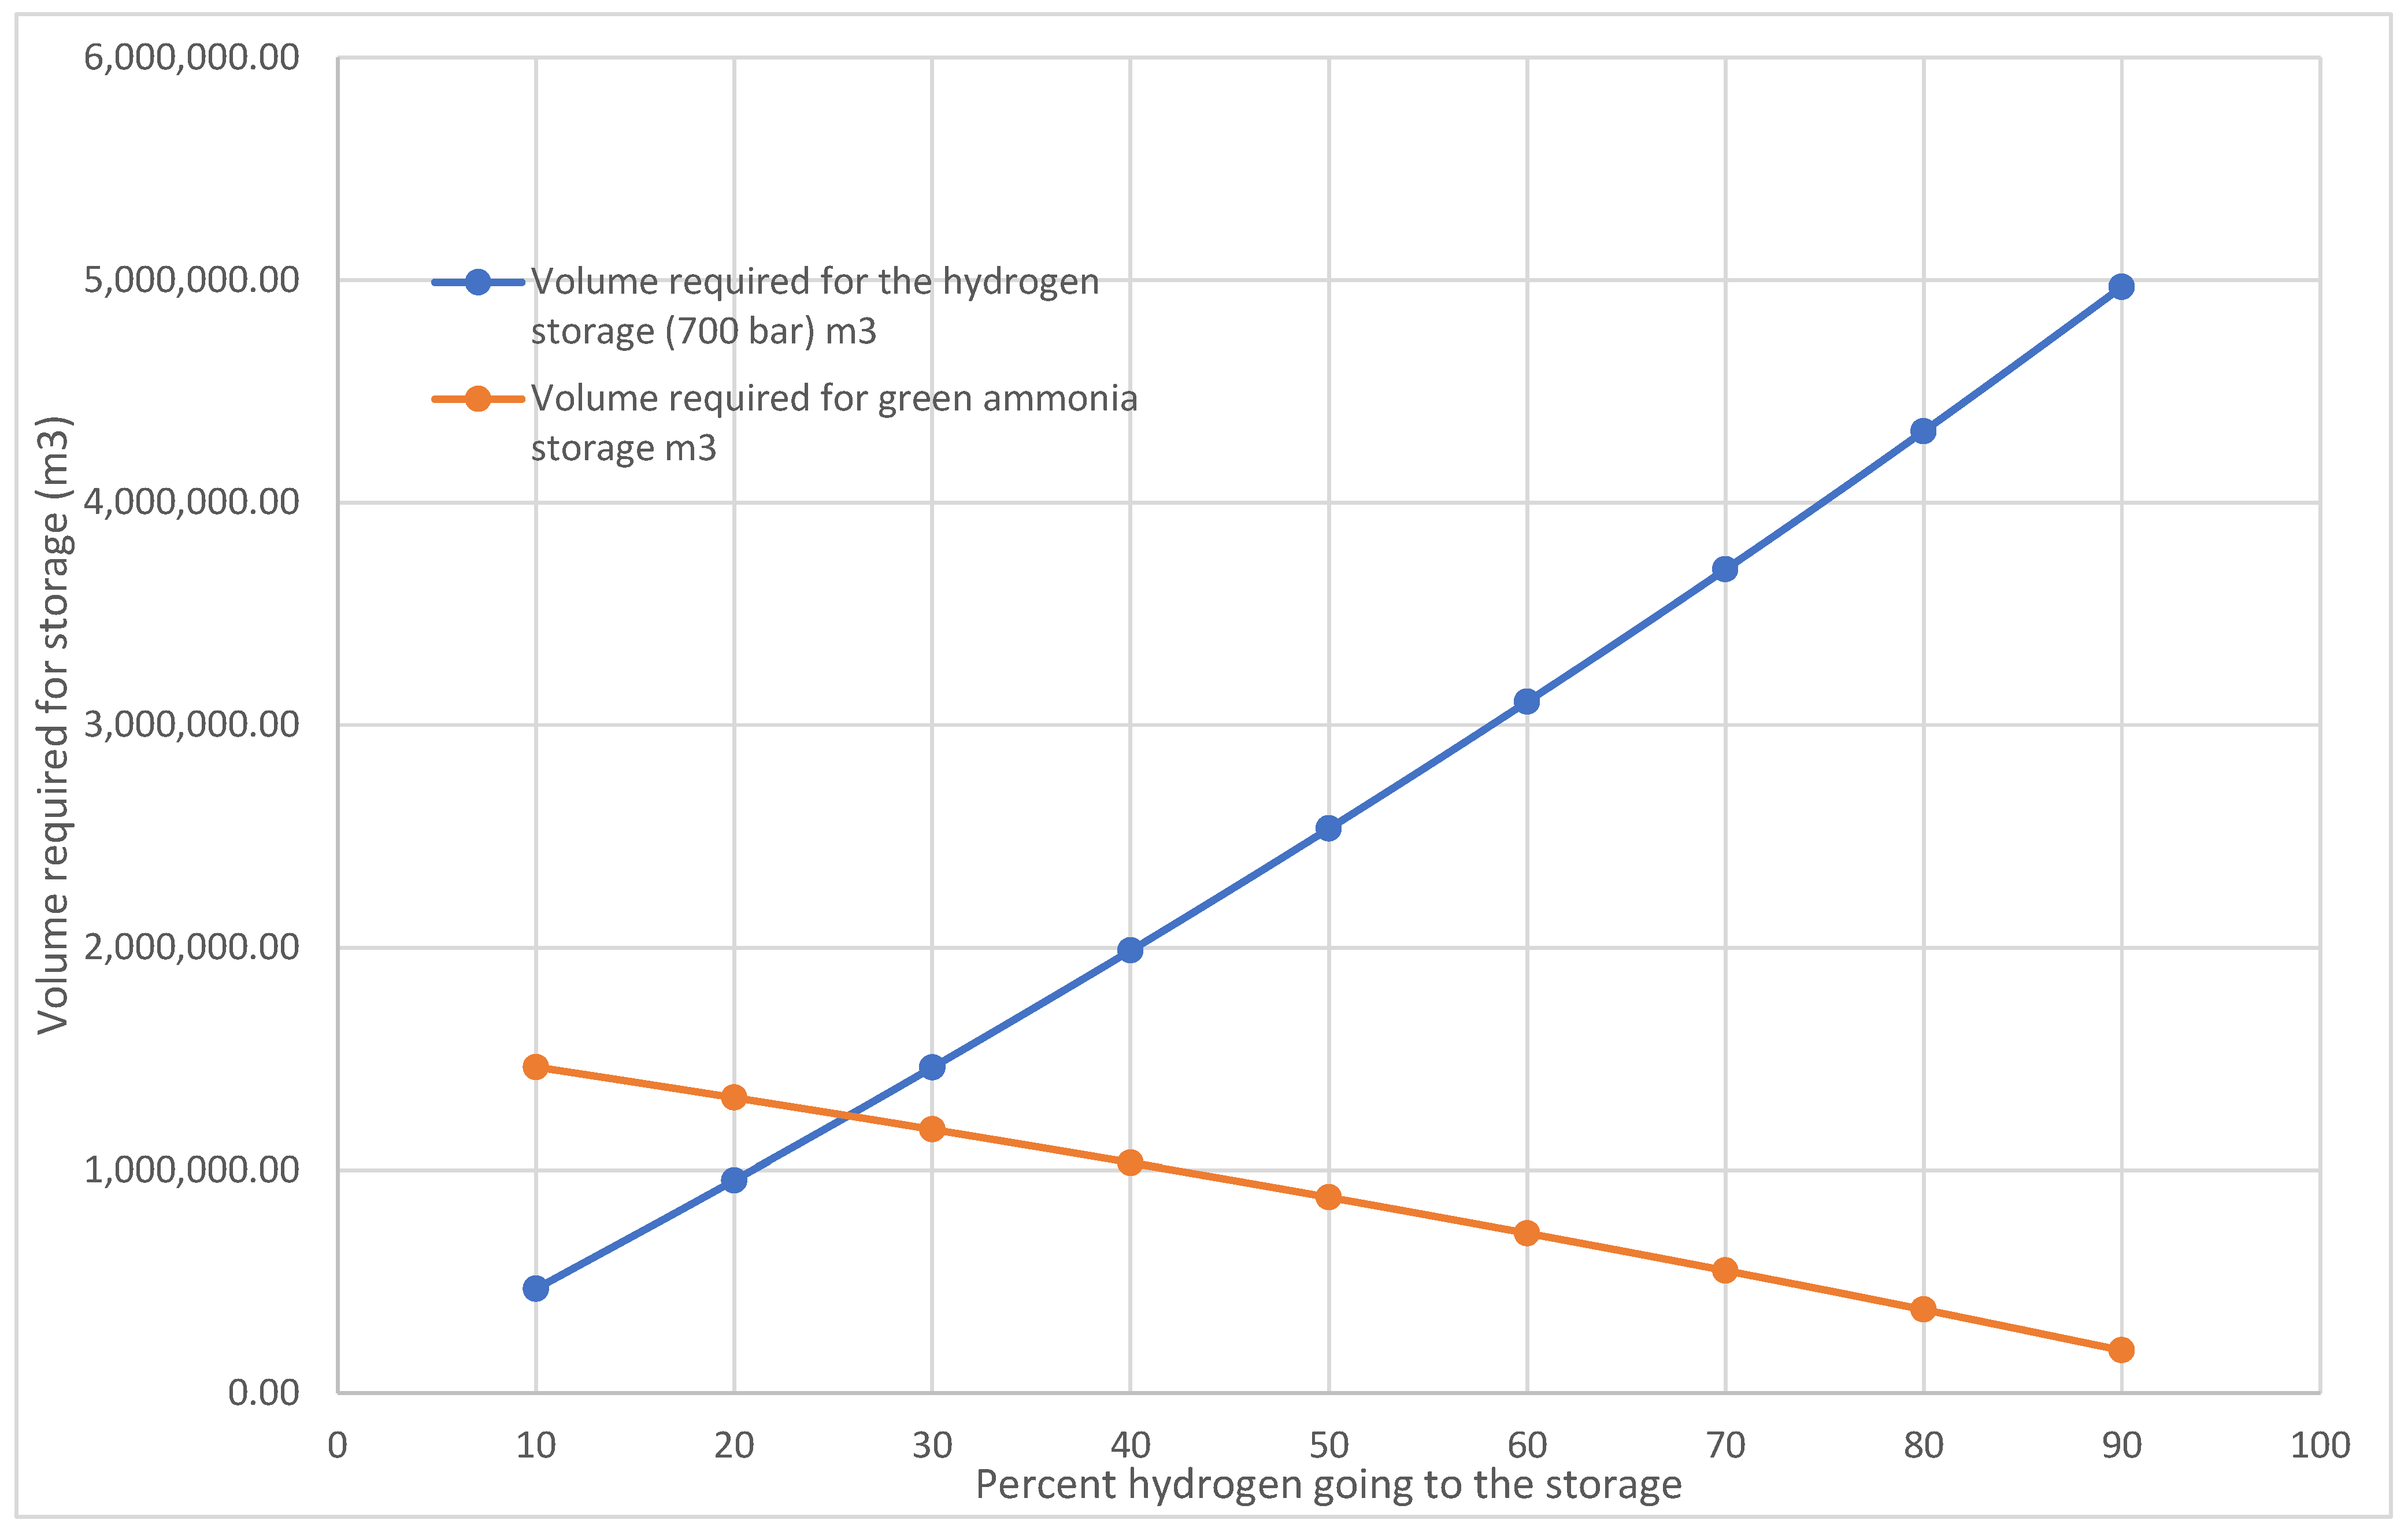
Figure 22 illustrates the volume necessary for green hydrogen storage at 700 bars according to the proportion of total hydrogen generated. As the proportion of green hydrogen storage rises, the volume necessary for storage escalates linearly. The pattern indicates that storing green hydrogen at elevated pressures necessitates a significant and proportionate augmentation in storage volume as production intensifies. When 90% of the total green hydrogen produced is going to storage, the volume required for a pressure vessel nears 5,000,000 m
3. Similarly, the volume required for liquid green ammonia storage will escalate as the mass of green hydrogen going into storage declines.
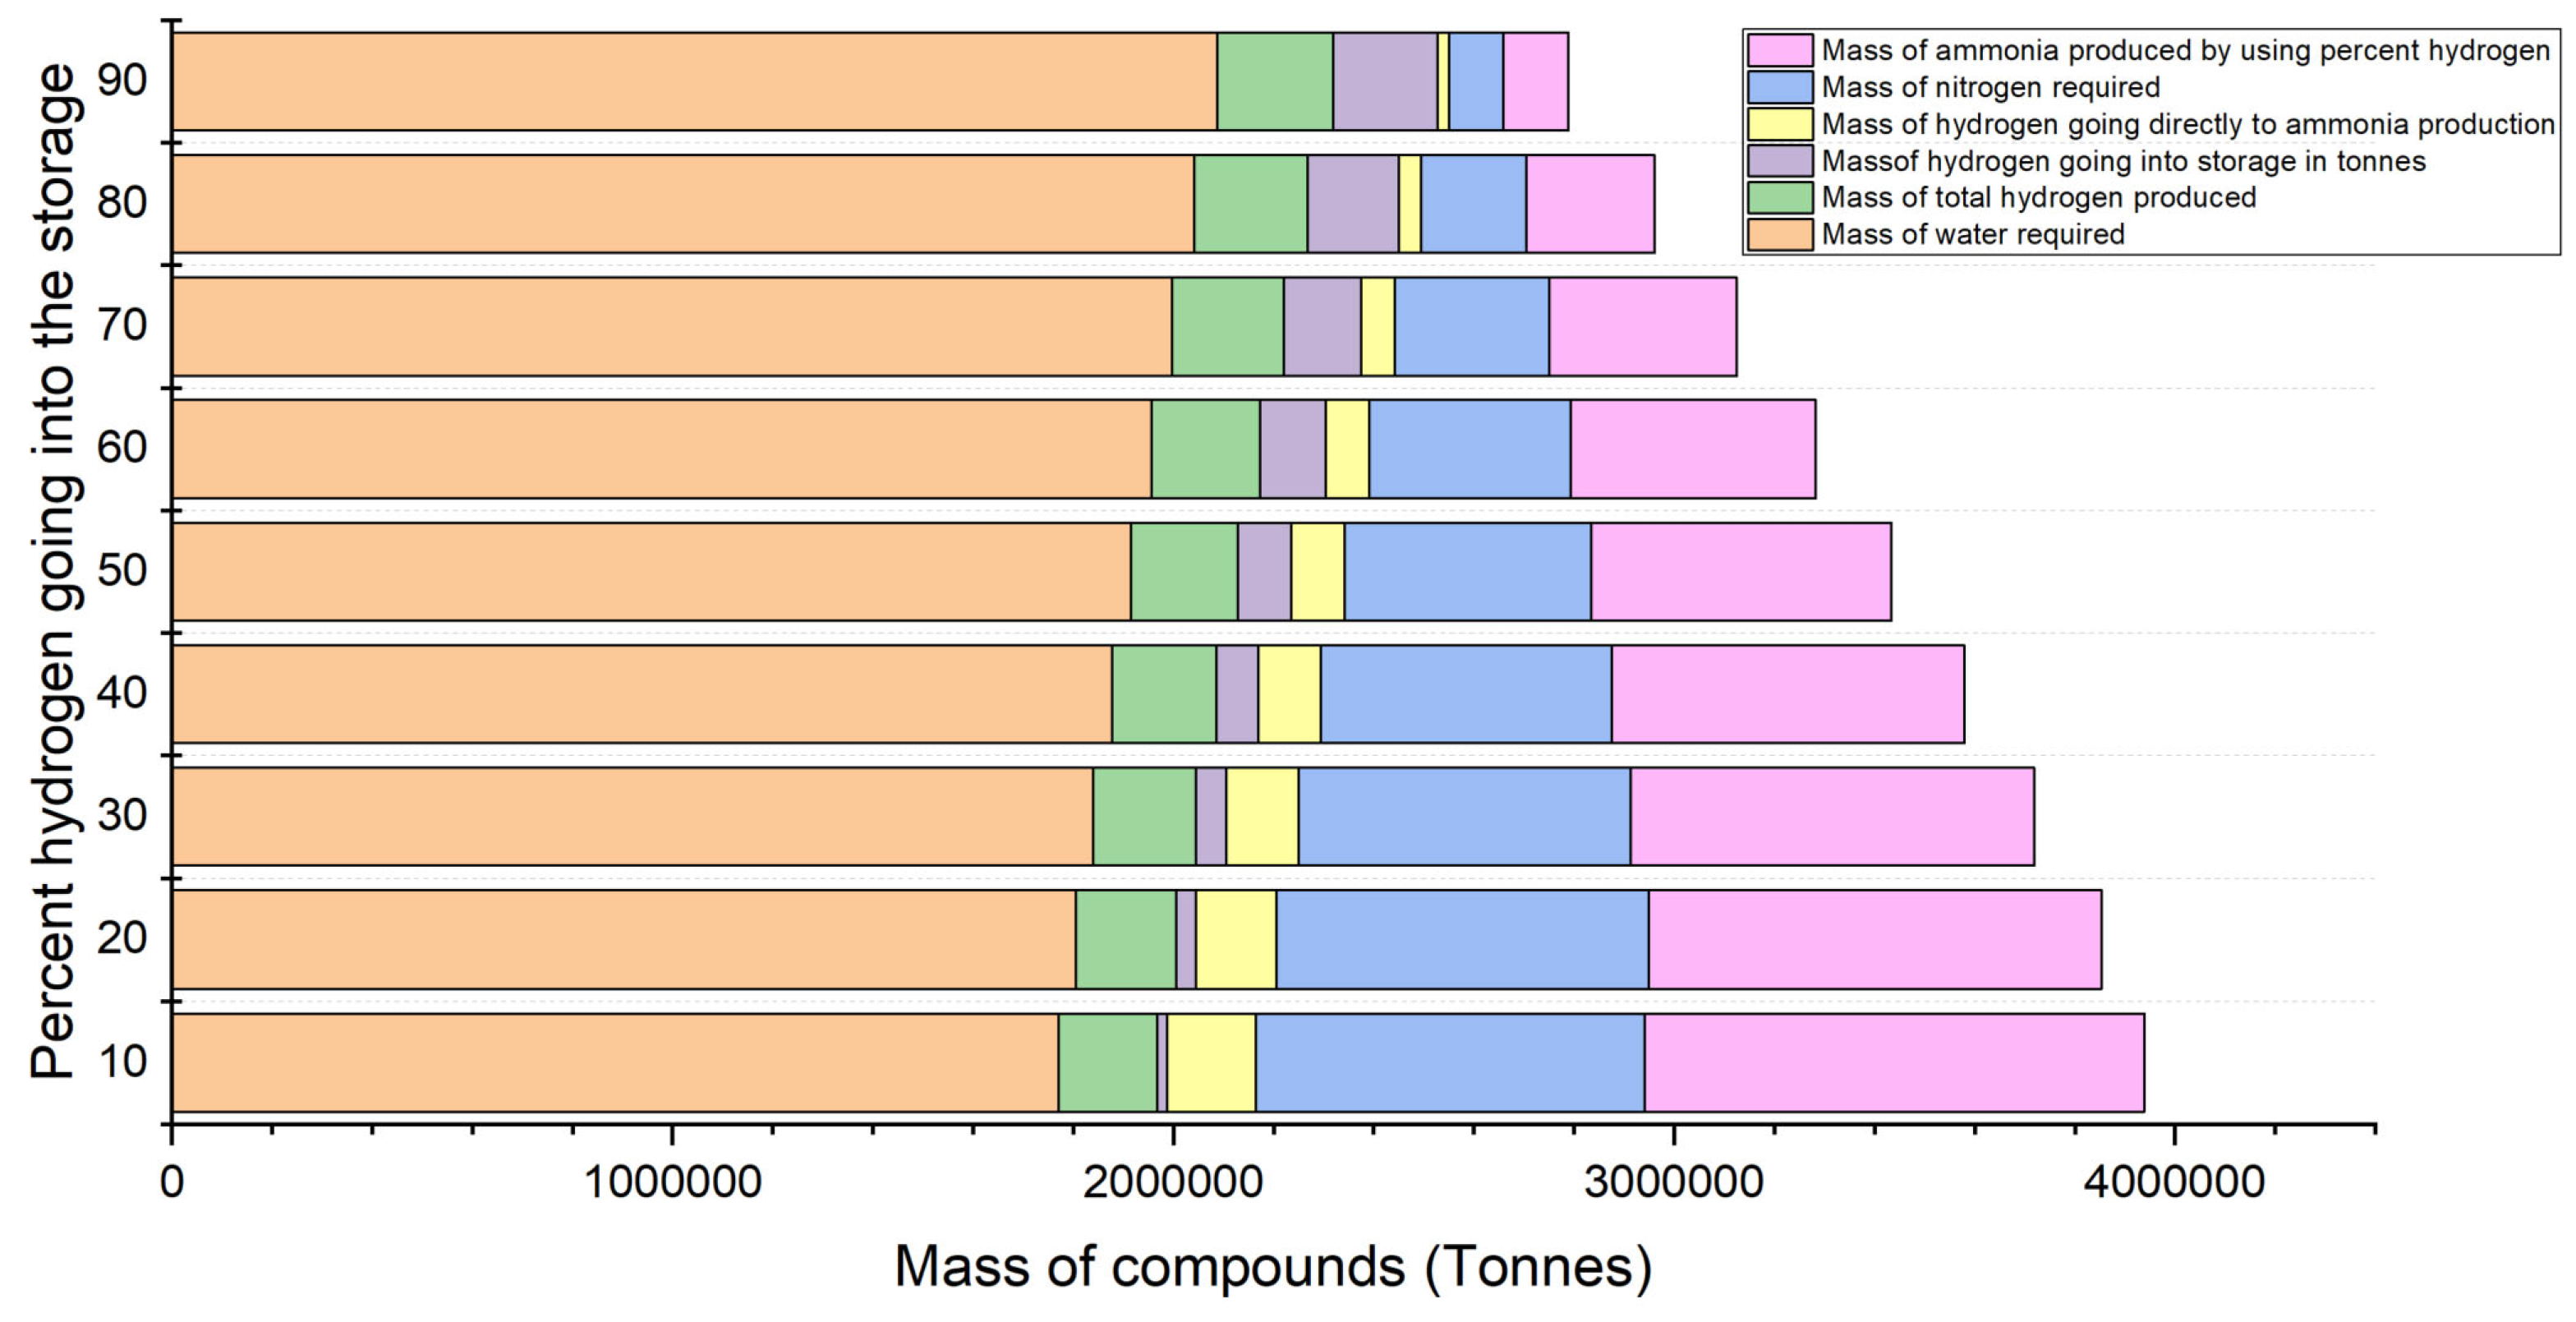
In
Figure 23, bar chart comprehensively analyses the resource use and production indicators related to the proportion of green hydrogen allocated to storage. The graph illustrates the mass of different compounds in tonnes as the percentage of green hydrogen redirected to storage ranges from 10% to 90%. The dark blue bars represent the entire volume of water necessary for the operation, likely for hydrogen generation via electrolysis. The bars are notably elevated across all percentages, indicating a substantial water demand, irrespective of the quantity of hydrogen stored. This graph elucidates the impact of reallocating hydrogen between storage and ammonia production on the overall production system concerning water, hydrogen, nitrogen consumption, and ammonia output.
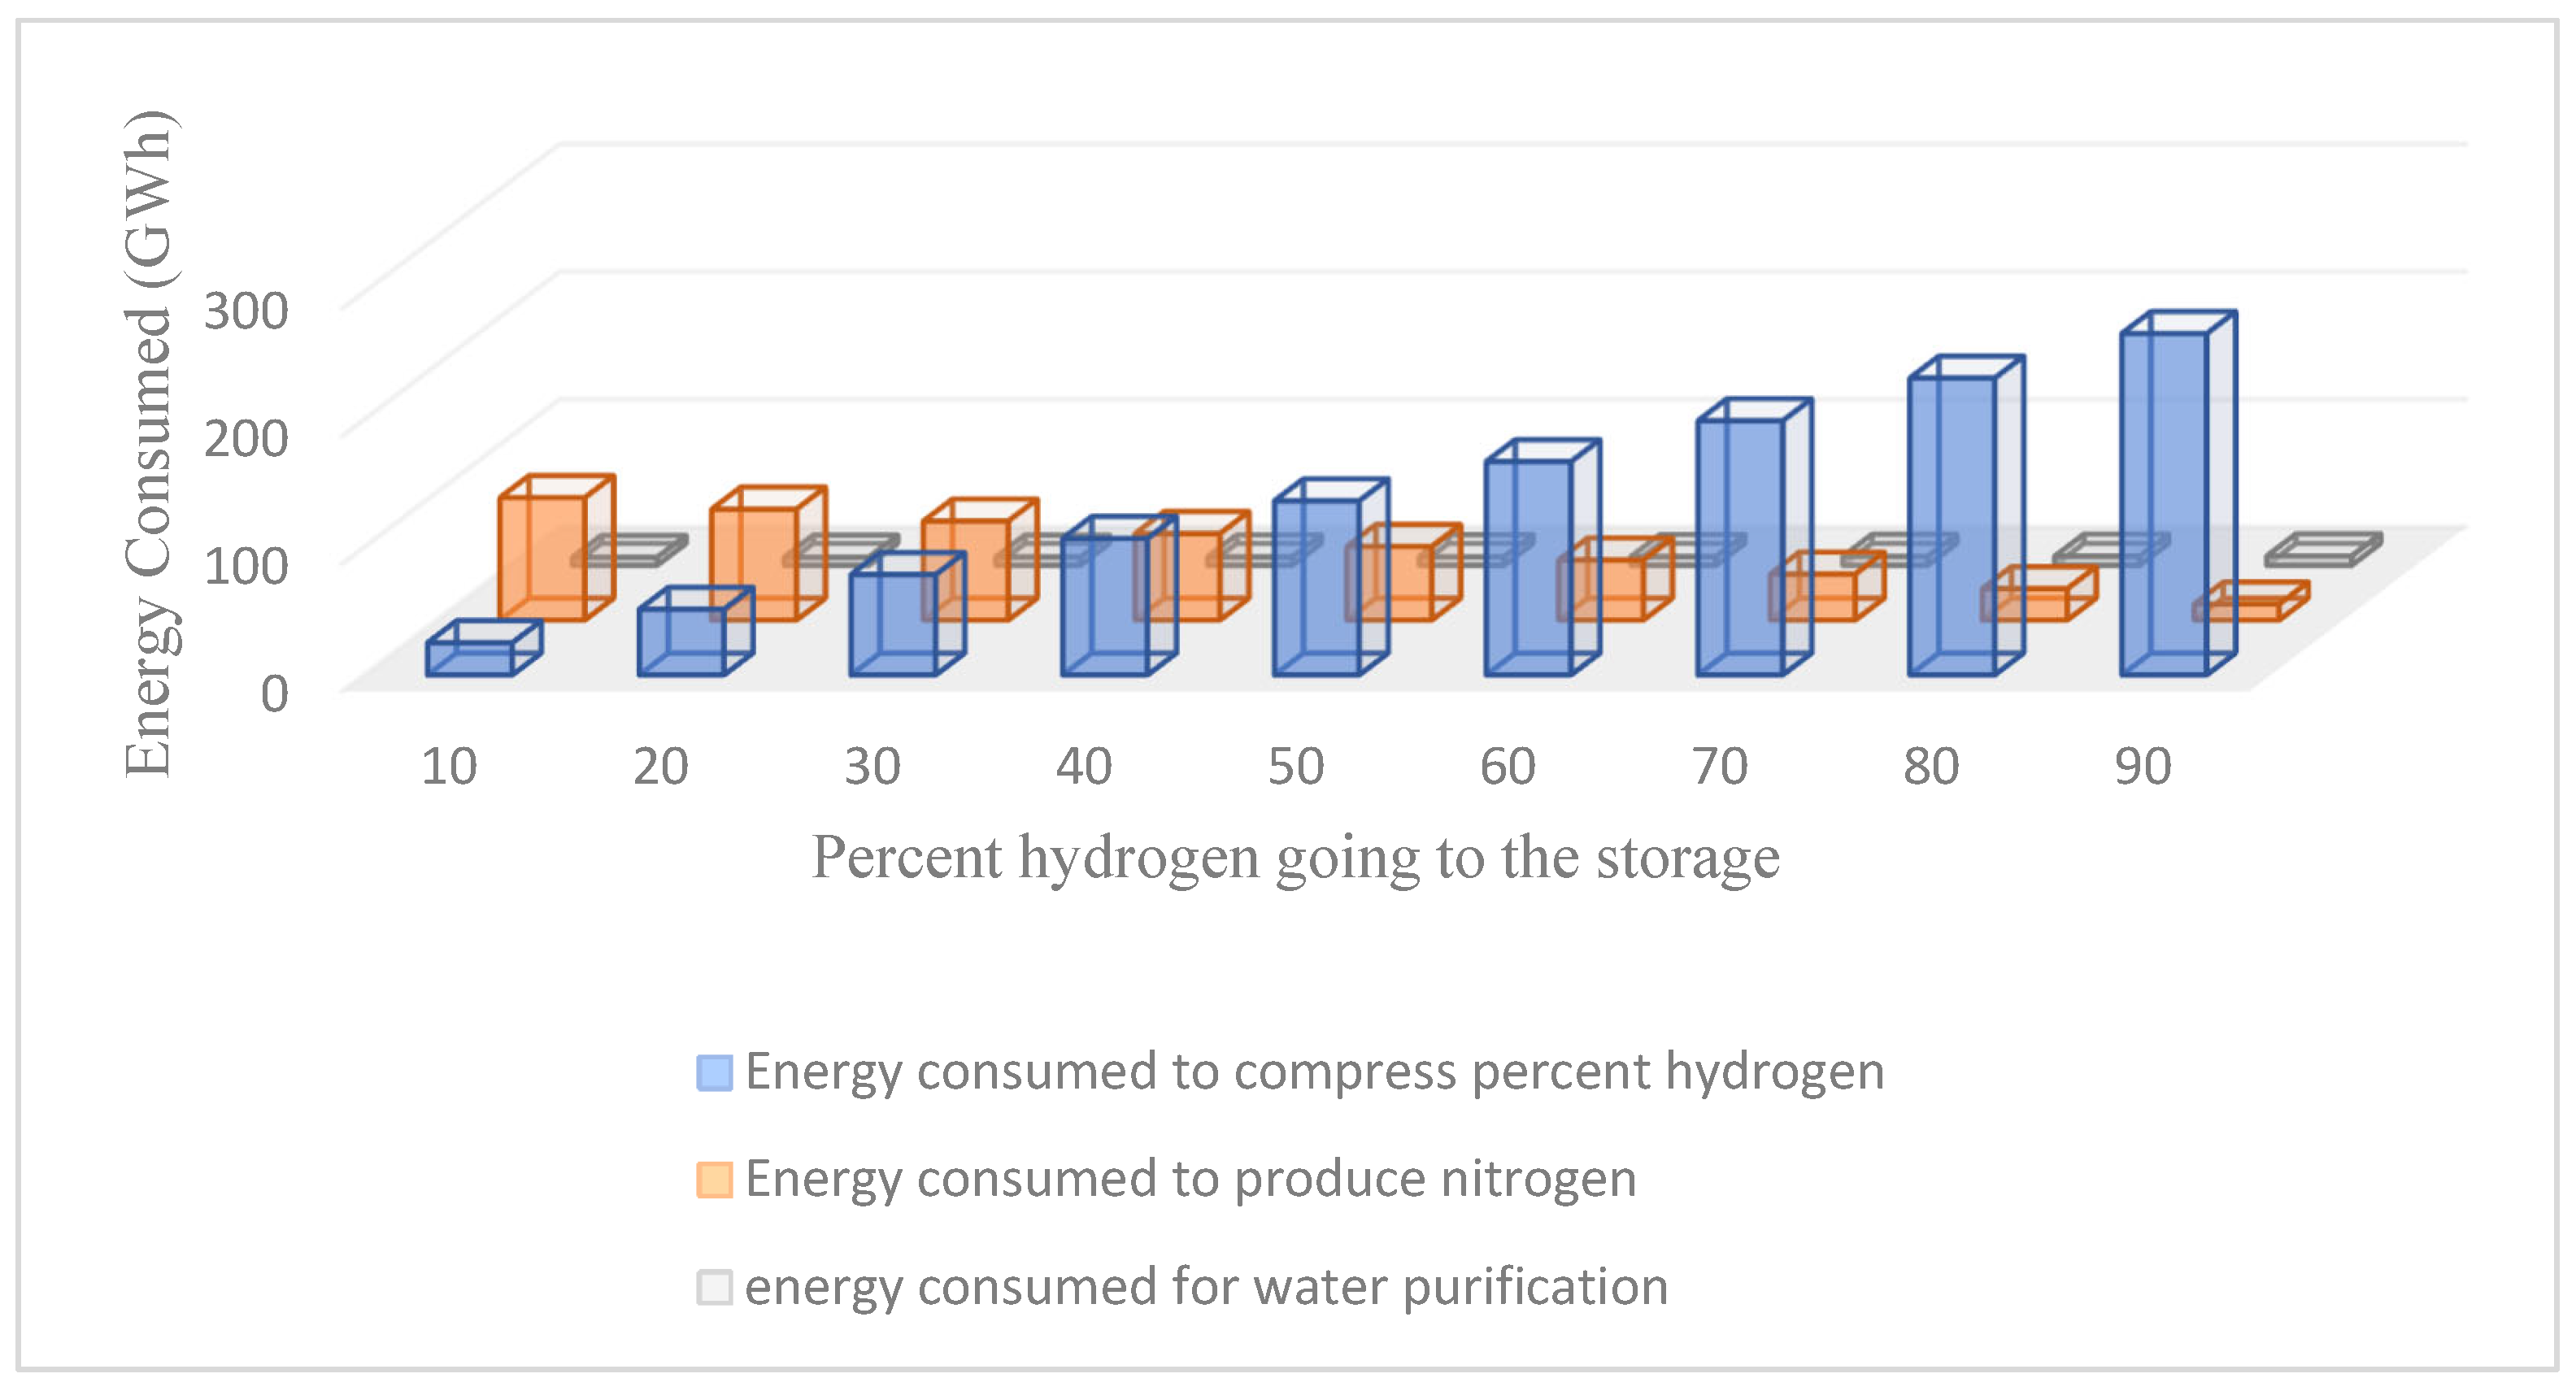
Figure 24 illustrates the distribution of energy consumption across three principal processes in the hydrogen and ammonia manufacturing cycle. It emphasises the energy trade-offs associated with determining the quantity of hydrogen to store compared to the amount utilised for ammonia synthesis. Storing additional hydrogen elevates the energy needed for compression while reducing the energy requisite for nitrogen synthesis. Simultaneously, water purification requires a constant energy expenditure, irrespective of hydrogen storage choices.
5.4. Cost Comparison of the Presented Scenarios
To assess the economic viability of green hydrogen and green ammonia production from the three different presented scenarios, their CAPEX and OPEX are calculated to determine the LCOA and LCOH. The results from the cost estimations shows the cost-effectiveness and practical implications of each configured scenario over a 30-year project lifespan.
Table 14 shows the cost estimations for all three scenarios.
The total CAPEX for scenario 2 is the least because there is no hydrogen storage facility available and is thus counted as a disadvantage in terms of energy storage. In the same run, the LCOA and LCOH are the least among all three scenarios justified because of the limitations of scenario 2. On the other hand, scenario 3 has the optimal LCOH because scenario 3 has the flexibility and availability of dual energy storage which will be the best fit for the market demand and supply fluctuations.
LCOA and LCOH compared to the current UK market pricing highlight significant economic trade-offs that affect each product’s competitiveness in the market. In early 2025, the UK government facilitated green hydrogen production via the hydrogen allocation round (HAR), granting contracts with a weighted average strike price of roughly 241 GBP/MWh, which corresponds to about GBP 9.50 per kilogramme of hydrogen. The market pricing for green ammonia in the UK is not expressly disclosed; nonetheless, the cost of green ammonia is inherently connected to that of green hydrogen, as hydrogen serves as a crucial feedstock in its production. Some of the research studies that calculate the LCOA from offshore wind sources reported the range of 1000–1200 USD/tonne [
15]. The LCOH and LCOA calculated from the presented scenarios are lesser than the current market prices of green ammonia and hydrogen in the UK. Economic trade-offs between green ammonia and hydrogen are significantly influenced by the flexibility of end-use and the readiness of infrastructure. Although hydrogen provides adaptability in various industries like heavy manufacturing, transportation, and energy, its storage and distribution necessitate substantial investment in new infrastructure. Conversely, green ammonia, despite its energy-intensive production, has advantages from established global storage and transportation infrastructures and demonstrates significant potential as both a fertiliser and a low-carbon maritime fuel. This establishes green ammonia as a viable export product and energy transporter. Moreover, current UK policy reforms seek to substantially lower the cost of green hydrogen, potentially beneath 100 GBP/MWh, by tackling power expenses and regulatory obstacles. Ultimately, market demand, governmental incentives, and infrastructure compatibility will dictate which vector—hydrogen or ammonia—provides the most economically viable pathway for expanding low-carbon energy solutions in the UK and worldwide.
5.5. Environemental and Safety Consideration
The industrial-scale production of green hydrogen and ammonia necessitates a significant quantity of high-purity water, usually obtained through desalination methods like reverse osmosis (RO), particularly in offshore areas. Reverse osmosis desalination often extracts 35–50% of the incoming saltwater as freshwater, resulting in a concentrated brine stream that is roughly twice as saline as the original seawater. If this brine is released back into the ocean without adequate dilution or dispersion methods, it may result in the following environmental risks:
Elevated salinity and temperature diminish dissolved oxygen levels, potentially leading to hypoxic conditions that are harmful to aquatic ecosystems.
Brine typically exhibits a higher temperature than the surrounding saltwater and may include leftover antiscalants, coagulants, heavy metals (e.g., from corrosion), and cleaning agents, which further compromise water quality and present toxicity hazards to marine organisms.
Increased the salinity can impair osmoregulation in marine species, resulting in a decline in biodiversity.
The implementation of offshore green hydrogen and ammonia storage systems has distinct leakage hazards attributable to the inherent characteristics of these substances and the demanding marine environment. Hydrogen leaks easily, explodes in many different combinations with air, and does not need much energy to start a fire. Its elevated burning velocity increases the likelihood of ignition from leaks, potentially resulting in catastrophic explosions. Ammonia is poisonous and presents considerable health hazards upon leaking, including breathing problems and chemical burns. The implementation of this technology in offshore settings requires rigorous safety protocols. Despite ammonia’s flammability, it is difficult to ignite. The risk of ignition indoors is elevated, particularly in the presence of oil and other flammable substances. Leakages of liquefied ammonia may compromise offshore ammonia storage structures owing to low-temperature embrittlement.
The meticulous assessment and mitigation of leakage risks are essential for the successful implementation of offshore green hydrogen and ammonia storage solutions.
Mitigation solutions for hydrogen leakage encompass the implementation of rigorous design practices throughout the Front-End Engineering Design (FEED) phase to reduce potential leak spots, including the optimisation of specifications for electrolysers, compressors, and storage tanks.
Implementing high-sensitivity hydrogen sensors that can detect leaks at parts per billion levels, especially in high-risk zones such as electrolysers and compressor units, is essential.
Implementing automated leak control systems that can swiftly isolate impacted areas, initiate emergency ventilation, and notify staff in the occurrence of a leak is essential.
Similarly key mitigation strategies to address the ammonia leakage risks include the following:
The implementation of infrared, electrochemical, and catalytic sensors facilitates early leak identification and enables real-time monitoring throughout the storage system.
Routine ultrasonic thickness assessments, valve integrity evaluations, and stress–strain analyses of storage components can proactively detect vulnerabilities.
Utilising materials like composite linings and epoxy coatings reduces the likelihood of corrosion caused by ammonia.
Compliance with requirements set by the International Maritime Organization and the UK’s Health and Safety Executive guarantees effective emergency preparedness and incident response.
5.6. Discussions and Future Recommendations
This study investigates multiple scenarios for producing green hydrogen and ammonia powered by offshore wind farms in Hornsea, UK. The operational wind farms with the Vestas wind turbine models of the same capacity and number of turbines are considered to provide the power for the production process of green fuels. By utilising the total power available from the Hornsea One and Two wind farms, it has evaluated how much mass of green hydrogen and green ammonia could be produced depending upon different production scenarios and how much storage volume will be required to store these green fuels.
Results shows that scenario 1 has some extra energy demands due to the compression of green hydrogen, which reduces the total mass of green hydrogen and ammonia produced. In scenario 2, no potential storage of hydrogen is considered, which may cause some issues and challenges, as discussed above. In contrast, scenario 3 has significant advantages regarding the favourable production of green fuels depending on the supply and demand. Since offshore wind energy is intermittent, separating green hydrogen into storage enables the system to run continuously, even during periods of high generation of electricity, preventing energy curtailment. As a buffer, green hydrogen offers a reliable backup supply for different energy applications and for manufacturing ammonia. The stored green hydrogen can continue ammonia synthesis uninterrupted if there are technical difficulties with hydrogen production (electrolysis). Flexibility in meeting the demands of the hydrogen and ammonia markets is made possible by storing green hydrogen. Instead of being utilised for ammonia synthesis, green hydrogen in the buffer can be sold directly as a green energy product when hydrogen prices are high or in demand in hydrogen markets. This flexibility can increase profitability by enabling the facility to adapt to the most profitable market conditions based on fluctuations in the price of hydrogen and ammonia. Stated differently, operators can choose to supply hydrogen or convert it to ammonia depending on market conditions thanks to hydrogen storage, which creates “dual” revenue streams. This modularity also makes the potential for hybrid energy projects possible, as the stored hydrogen may eventually be used for other purposes, such as delivering hydrogen to fuel cell applications, supplying grid services, or fuelling ships.
Moreover, the configuration presented in scenario 3 is beneficial in enhancing grid stability by providing the availability of stored energy in terms of green hydrogen and green ammonia. These stored green fuels can be utilised to produce electricity which will help in stable power supply and balanced load shifting from the grid. Additionally, the flexibility to switch between green hydrogen and green ammonia ensures better demand-side management and helps stabilise the grid. Similarly, in terms of scalability, scenario 3 has the potential of enabling seamless energy export and global trade.
The development of these kinds of storage scenarios same as scenario 3 needs to be addressed to make these technologies commercially viable and integrate them into existing energy policies. Unlike fossil-based energy storage solutions, both hydrogen and ammonia are carbon-free, reducing greenhouse gas emissions and aligning with global climate objectives, making them sustainable alternatives. The following are some gaps in the infrastructure which can be performed in future.
The design and structural specifications for offshore green hydrogen and ammonia storage scenarios remain insufficiently examined. Research regarding these energy storage systems’ materials and structural stability in severe marine environments, including waves, corrosion, and extreme weather, is notably limited. Several studies have investigated the endurance of floating platforms and pressure vessels for offshore use; nevertheless, there are insufficient data about hydrogen and ammonia storage, particularly with long-term fatigue and failure analysis. The assessment of integration models for optimising offshore renewable energy with green hydrogen and ammonia production and storage systems is essential. There is limited research on integrating floating offshore hydrogen and ammonia storage with current and prospective supply chain infrastructure. This includes difficulties in offloading, transportation logistics, and compatibility with pipelines, shipping, and distribution systems. There is limited research regarding the environmental consequences of offshore green hydrogen and ammonia production and storage, especially in uncertain scenarios like leakage. Comprehending the effects of hydrogen and ammonia on marine ecosystems and formulating mitigation methods are essential.


