Abstract
With the intensifying global energy crisis, ensuring robust and reliable energy reserves has become crucial, and underground energy storage offers a safe, large-scale, and cost-effective solution. Among various options, salt cavern gas storage is recognized for its excellent sealing capacity and geological stability; however, many natural salt domes contain inherent fissures and interlayers (e.g., gypsum) that can jeopardize operational safety. Hence, this study aims to clarify how different fissure angles and bedding plane dip angles affect the mechanical behavior of salt–gypsum composites, providing insights for enhancing safety measures in underground gas storage facilities. Based on practical engineering demands, we employ finite element software (RFPA2.0) under a confining pressure of 25 MPa to investigate the compressive strength, fractur patterns, and acoustic emission responses of salt–gypsum composites with varying bedding plane and fissure angles. The results indicate that (1) the composite’s compressive strength gradually increases with the fissure angle, being lowest at 0° and highest at 90°; (2) as the bedding plane angle increases, the compressive strength first rises, then decreases, and finally rises again, with its minimum at 60° and maximum at 90°; and (3) when the bedding plane angle exceeds 60°, cracks preferentially develop along the bedding plane, dominating the overall fracture process. These findings provide theoretical guidance for optimizing the design and ensuring the long-term safety and stability of underground salt cavern gas storage systems.
1. Introduction
With the increasing severity of the global energy crisis, competition for resources has intensified, prompting many countries to prioritize energy reserves as a strategic asset [1,2,3]. Among various storage approaches, underground energy storage has attracted considerable attention due to its high safety, large capacity, low operational cost, and minimal land use [4,5,6,7]. Specifically, salt cavern storage—typically constructed within thick salt domes—offers unique advantages in terms of geological stability, extremely low permeability, and exceptional plasticity of salt rock [8,9,10]. These attributes make salt caverns particularly reliable for large-scale, long-duration storage of oil, natural gas, and hydrogen [11,12,13,14]. Pilot projects and commercial-scale facilities in regions such as the United States and Europe have demonstrated the technical feasibility of hydrogen storage in salt caverns, leveraging the same advantages observed with natural gas [2,3,4,5,6]. However, not all salt deposits are uniformly thick or homogeneous. In countries like China, salt beds are relatively thin and contain numerous interlayers, predominantly composed of gypsum-based sulfates [15,16,17]. The presence of these interlayers introduces additional discontinuities and anisotropic properties that can compromise the overall stability of cavern construction and increase risks such as leakage or catastrophic failure. Understanding and mitigating these risks have therefore become pressing issues in the field of underground gas storage.
Natural rock masses frequently contain micro-defects and fissures, which are known to markedly affect their mechanical properties and fracture behavior [18,19]. Prior investigations have illuminated various aspects of rock fracturing. For instance, Zhao et al. [20] showed that granite specimens with inclined pre-existing fissures exhibit lower compressive strength than intact samples, highlighting how fissure orientation can dictate crack propagation. Similarly, Bi et al. [21] explored salt rock under triaxial conditions with different fissure angles, revealing pronounced decreases in strength and elastic moduli due to the presence of fractures. While these studies underscore the importance of fissure inclination on rock strength and failure modes, they have not sufficiently addressed the more complex scenario of salt–gypsum composites with layered interfaces, where both the fissure geometry and the bedding plane orientation may interact synergistically to affect overall stability.
Indeed, many scholars have studied the mechanical behavior of layered salt rocks, focusing on creep characteristics, impurity content, and loading/unloading cycles [22,23,24,25]. Lyu et al. [22] discussed the evolution of porosity and sealing capacity in gypsum–salt covers under cyclic stress, whereas Zhao et al. [23] examined creep deformation in layered salt rocks, emphasizing viscoelastic and viscoplastic responses at different stress levels. Wang et al. [24] and Meng et al. [25] further elucidated the effects of impurities and interlayers on stiffness and strength of rock. While these efforts have enriched our understanding of salt-related lithologies, they primarily concentrate on either (i) a single type of interlayer material (e.g., mudstone or a generic “impurity”) or (ii) the impact of cyclic loading on an otherwise relatively simple salt formation. In contrast, the combined effects of pre-existing fissures—varying in inclination—and multiple dip angles of a gypsum interlayer remain insufficiently explored. Specifically, there is a lack of systematic research integrating both fissure and bedding plane orientations in a unified framework and evaluating their influence on fracture patterns under realistic confining pressures.
This gap is particularly consequential for salt cavern gas storage facilities in thin-bedded formations, where fissures and gypsum interlayers exist almost inevitably. Notably, compared to natural gas, hydrogen has a smaller molecular size and higher diffusivity. If the microstructure or interlayers (e.g., gypsum) in salt rock are not adequately sealed, hydrogen may migrate and escape along microcracks. Consequently, in thin-bedded salt formations containing gypsum or other impurities, the mechanical and sealing properties of the rock become especially critical. In such salt–gypsum composites, pre-existing fissures or inclined bedding planes frequently serve as preferential leakage pathways [25]. Misjudging the interactive influence of fissure geometry and bedding plane inclination can lead to underestimating the risk of fracture propagation, potentially resulting in economic losses or severe safety incidents. Therefore, it is crucial to investigate systematically how different fissure angles (e.g., 0°, 30°, 60°, 90°) and interlayer dip angles (ranging from 0° to 90°) affect the mechanical stability, crack-initiation processes, and post-peak fracture evolution of salt–gypsum composites. Such a focused approach not only clarifies the fundamental rock mechanics but also provides critical guidelines for the design and long-term operation of underground gas storage in geologically challenging settings.
To address these needs, the present study employs the Realistic Failure Process Analysis (RFPA) software program under a confining pressure of 25 MPa to simulate salt–gypsum composites containing a medium-strength gypsum interlayer and predefined fissures in the salt section. The main objectives are to elucidate the influence of varying fissure angles and bedding plane orientations on the compressive strength of salt–gypsum composites; characterize the fracture trajectories and failure patterns that evolve under different geometric configurations; reveal the acoustic emission (AE) signatures associated with microcrack initiation, propagation, and coalescence, thereby linking AE data to the evolving damage mechanisms in the composite.
Through a combination of numerical analysis, theoretical interpretation, and data visualization, this work represents one of the first comprehensive attempts to disentangle how fissure geometry and interlayer anisotropy jointly shape the load-bearing capacity and overall failure processes of salt–gypsum composites. Our findings advance the existing literature by offering new perspectives on rock heterogeneity, fracture progression, and energy-release phenomena in layered systems. From an engineering standpoint, these insights yield practical recommendations for site selection, cavern layout, and operational safety measures in underground gas storage applications, especially where thin-bedded salt formations with gypsum interlayers are common. Ultimately, this study aims to bridge crucial knowledge gaps and thereby enhance the reliability of salt cavern-based energy reserves, contributing to national energy security and infrastructure resilience.
2. Establishment and Simulation of Discrete Element Model
The entire simulation process in this study was carried out using RFPA software. It is a numerical simulation software capable of simulating material failure. The process involves discretizing the material using structured grids, constructing a material of a specific size (before constructing the material, a model diagram must be drawn with Computer-Aided Design (CAD), and the coordinates recorded; these coordinates are then input into RFPA to construct the material), followed by editing the material and inputting the corresponding mechanical property parameters. The material is then filled into the previously constructed model, and finally, load pressure is applied to simulate the material’s failure.
2.1. Numerical Modeling
This study focuses on a salt–gypsum composite, analyzing and discussing the fracture characteristics of the composite with different inclined prefabricated fissures and bedding interfaces. Four fissure angles (α = 0°, α = 30°, α = 60°, and α = 90°) and seven bedding angles (β = 0°, β = 15°, β = 30°, β = 45°, β = 60°, β = 75°, and β = 90°) were set in the experiment. The specimen size for this simulation was a rectangular composite with a height of 100 mm and a length of 50 mm, and a grid size of 200 × 300 = 60,000 was established. The composite model for this simulation consists of two different types of rocks with distinct material parameters, in contact with each other. A boundary interface of different strength is placed at the contact surface, which is referred to as the bedding plane. The thickness of this boundary interface is adjusted to 6 mm. A prefabricated fissure was set in the salt–gypsum composite, with a length of 10 mm. The model used in the experiment is shown in Figure 1, where blue represents salt rock and green represents gypsum.
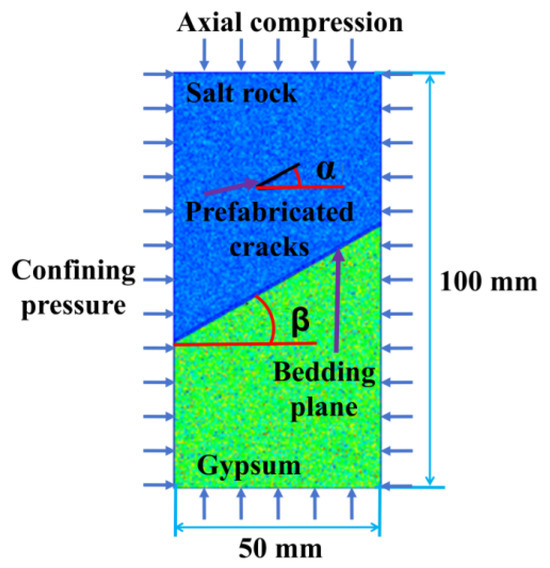
Figure 1.
Schematic diagram of salt paste combination in simulation test.
During the model construction process, AutoCAD2024 drawing software is first used to create graphics representing different bedding angles and prefabricated fissure inclinations, with the coordinates of each endpoint recorded for future use in the simulation software when establishing the bedding and fissures. Table 1 and Table 2 show the coordinate parameters of the different bedding planes and prefabricated fissures in this experiment. In our current study, the constitutive models for salt rock, gypsum, and the bedding plane are implemented using elastic–plastic formulations based on the Mohr–Coulomb failure criterion. Specifically, each material is characterized by parameters such as elastic modulus, Poisson’s ratio, internal friction angle, and a tension-to-compression strength ratio, which are calibrated against available experimental data (as detailed in Table 3). These models capture the immediate, short-term response of the materials under load. Table 3 lists the detailed modeling parameters for this simulation model.

Table 1.
Coordinate parameters of layered plane grid modeling for salt rock–gypsum composite body.
Table 2.
Coordinate parameters for prefabricated fracture grid modeling of salt rock–gypsum composite.
Table 3.
Grid modeling parameters of salt rock–gypsum composite body.
2.2. Numerical Simulation Process
This experiment primarily uses numerical simulation to investigate the fracture mechanism of the salt–gypsum composite, focusing on the effects of bedding angle and prefabricated fissure angle. The main process is as follows: (1) Model construction: Different angles of prefabricated fissures and bedding planes are created in CAD drawing software, with the coordinates of each endpoint recorded. A model with dimensions of 100 × 50 mm is then established in RFPA, setting up a grid of 200 × 300. The corresponding polygon coordinates are input, and materials for salt rock, gypsum, and medium-strength layers are created. Their respective mechanical parameters, as listed in Table 3, are input and then filled into the corresponding sections. As shown in Figure 1, the upper part is salt rock, the middle layer is a medium-strength layer (with a thickness of 6 mm), and the lower part is gypsum. α represents the angle between the prefabricated fissure and the horizontal plane, and β represents the angle between the bedding plane and the horizontal plane. Figure 2 shows the model with different bedding angles and prefabricated fissure inclinations established for this experiment. (2) In real-world applications, salt caverns often lie at depths of several hundred to over a thousand meters, where in situ stresses can indeed reach tens of megapascals. A confining pressure of around 25 MPa is typical for mid- to deep-level salt cavern storage operations. Hence, force is applied to the composite, with 25 MPa lateral compressive pressure. Both the initial start and endpoint values are set to 0, followed by inputting a step increment of 0.001 mm/step, and finally, the number of loading steps is entered. Once the inputs are complete, the load application calculation for the composite begins. During the computation process, the composite gradually exhibits macroscopic fractures until the loading steps are completed, signaling the end of the simulation experiment. (3) Experimental result analysis: The experimental results obtained from the simulation were saved and analyzed to obtain the stress–strain curves, peak stresses, and acoustic emission data of specimens with different inclination angles of laminar surfaces and prefabricated fissure angles in order to investigate the effects of laminar angle and prefabricated fissure inclination on the fracture properties of salt–gypsum composites.
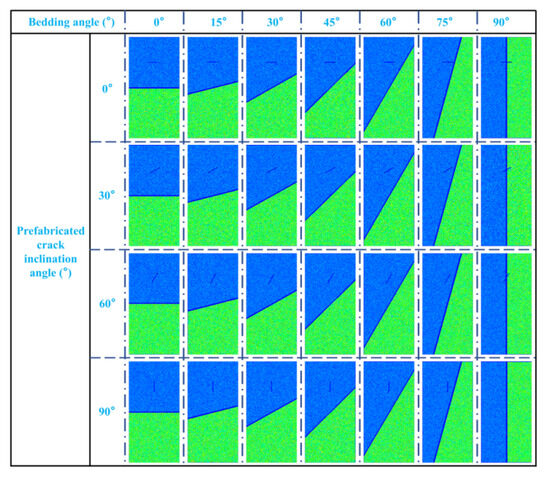
Figure 2.
Model diagram of different bedding angles and prefabricated crack inclination angles established in this experiment.
3. Macroscopic Mechanical Characteristics of Salt Paste Composite
3.1. Stress–Strain Curve
The stress–strain curve is a fundamental parameter that describes the mechanical characteristics of rocks. By analyzing the evolution trend of the curve, the damage process of the rock can be understood. Analysis of the stress–strain curve for the salt rock–gypsum composite specimen shown in Figure 3 reveals a similar evolutionary trend, going through the stages of compaction, elastic deformation, stable damage, and catastrophic failure. Compaction stage: The rock contains original microcracks, and as the load is applied, these microcracks gradually close, corresponding to the initially concave part of the curve. Elastic stage: As the load continues, the specimen undergoes elastic deformation, represented by the linear portion of the stress–strain curve. In this stage, if the load is removed, the elastic deformation of the specimen can recover. Stable damage stage: This stage is also referred to as the nonlinear stage. When the specimen reaches its elastic limit, with continued loading, the original microcracks within the specimen begin to expand, and new microcracks start to form. At this point, the expansion of the microcracks remains steady, so it is termed the stable damage stage. Catastrophic failure stage: As the load reaches the peak strength of the specimen, the specimen has reached its strength limit. With further loading, the microcracks within the specimen develop rapidly, and cracks in close proximity begin to connect, eventually evolving into macroscopic cracks that can be observed with the naked eye. In this stage, the specimen has essentially lost its load-bearing capacity and is severely damaged.
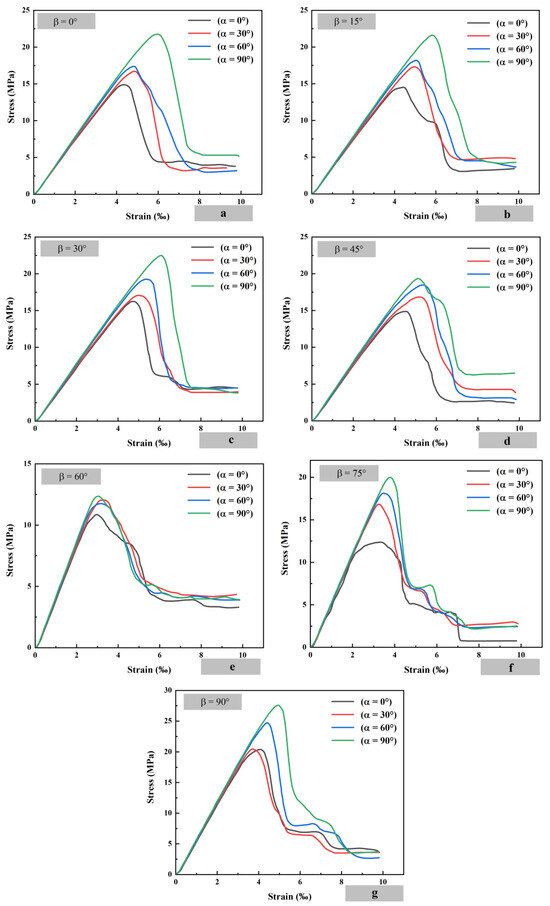
Figure 3.
Stress–strain curves of salt paste assemblies.
3.2. Compressive Strength
As shown in Figure 4, when the angle of the prefabricated fissures changes from 0° to 90°, the peak stress of the medium-strength layer increases at different angles. When β = 90°, the peak stress is at its maximum, and when β = 0°, the peak stress is at its minimum. From the peak stress variation graph of the seven groups above, it can be concluded that when α = 90°, i.e., when the fissure angle is 90°, the stress required for the composite to reach the failure state is the greatest. In this case, the composite is the most compressive. When α = 0°, the stress required for the composite to reach the failure state is the smallest, and the composite is most prone to failure. As shown in Figure 5, when the composite reaches peak stress, at α = 0°, the prefabricated fissure extends into a large crack and a large number of cracks appear in the gypsum layer, indicating severe damage. At α = 30°, only the two ends of the prefabricated fissure extend into larger cracks, and the damage is relatively serious. At α = 60°, smaller cracks appear at both ends of the prefabricated fissure, and the damage is less severe. At α = 90°, there are almost no other cracks around the fissure, and only a crack appears at the lower end of the gypsum layer, indicating minimal damage. Through color comparison (where color represents the magnitude of shear stress), it is observed that the gypsum layer experiences greater shear stress than the salt rock layer. In conclusion, as the prefabricated fissure angle α increases, the damage degree of the salt–gypsum composite decreases. At α = 0°, the damage is greatest, with more and larger cracks around the prefabricated fissure, while at α = 90°, the damage is least, with no noticeable cracks around the prefabricated fissure.
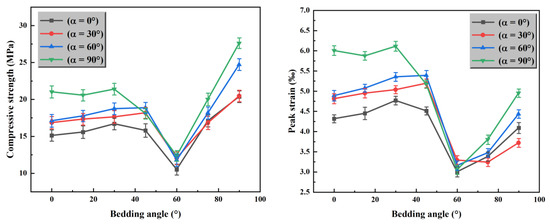
Figure 4.
The evolution trend of compressive strength and peak strain of specimens with the dip angle of bedding planes.
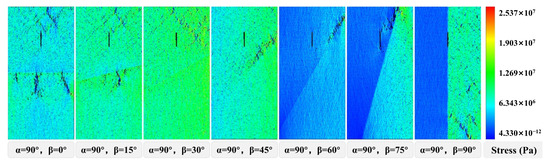
Figure 5.
Stress cloud map at the peak load moment of specimens with different bedding angles under the same crack inclination angle (α = 90°).
As shown in Figure 6, increasing the dip angle of the bedding plane, the peak stress of different prefabricated fissure angles first increases slowly, then sharply decreases after β = 45°, and rises sharply again at β = 60°, showing an upward trend afterward. From the peak stress variation graph of the four groups above, it can be concluded that when β = 90°, i.e., when the bedding plane angle is 90°, the peak stress required for the composite to reach the failure state is the largest. In this case, the composite is the most compressive. When β = 60°, the stress required for the composite to reach the failure state is the smallest, and the composite is most prone to failure. As shown in Figure 7, when β ≤ 45°, the composite requires a larger number of loading steps to reach peak stress. However, when β = 60° and 75°, the peak stress decreases, and fewer loading steps are needed to reach peak stress, with some cracks appearing on the bedding plane. When β = 90°, the peak stress reaches its maximum, and a few cracks appear in the gypsum layer, with an increase in the number of loading steps required to reach peak stress. When the composite reaches peak stress, the color comparison reveals that when β ≤ 45°, there is little difference in the shear stress experienced by the salt rock and gypsum. However, when β > 45°, there is a noticeable difference in the shear stress, with the gypsum layer experiencing greater shear stress than the salt rock.
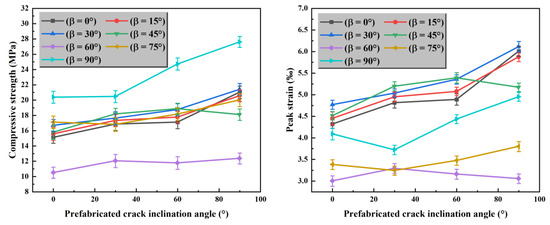
Figure 6.
The variation trend of compressive strength and peak strain of specimens with crack inclination angle.
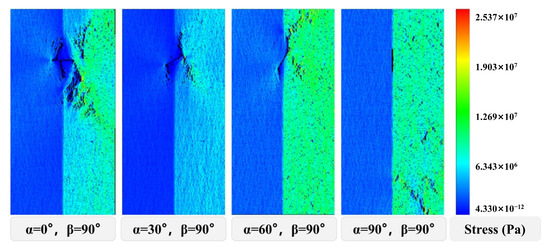
Figure 7.
Stress clouds at the moment of peak loading for specimens with different fissure inclinations at the same lamination angle (β = 90°).
4. Damage and Fracture Characteristics of Salt Rock–Gypsum Composite
4.1. Acoustic Emission Characteristics of Salt Paste Composite
As shown in Figure 8, when β = 30°, 45°, and 90°, as the angle of the prefabricated fissures increases, the maximum number of acoustic emissions first increases and then decreases. When β = 0° and 15°, the maximum number of acoustic emissions shows a trend of first increasing, then decreasing, and then increasing again. When β = 60° and 75°, the maximum number of acoustic emissions shows a slow and steady increase. According to Figure 9, when β = 90°, for different prefabricated fissure combinations, before the acoustic emission number peaks, the number of acoustic emissions increases as the loading steps increase, until it reaches the maximum value. After reaching the maximum, the number of acoustic emissions decreases with the increase in loading steps, eventually dropping to zero. Comparing this with Figure 7, it can be observed that the loading steps at which the acoustic emission number peaks occur after the peak stress, indicating that after the composite fractures, there are still significant energy fluctuations within the composite, leading to further fragmentation.
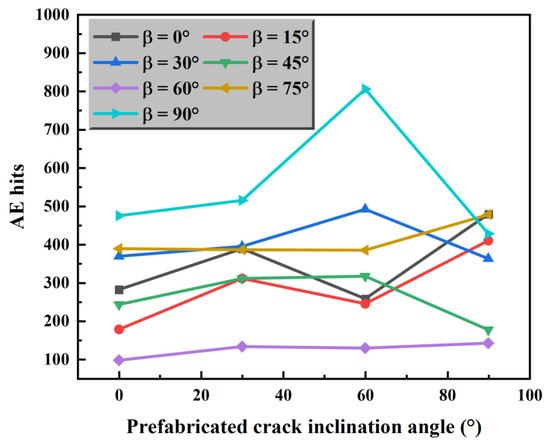
Figure 8.
Evolution trend of maximum emission with fracture angle during compression process of salt paste composite.
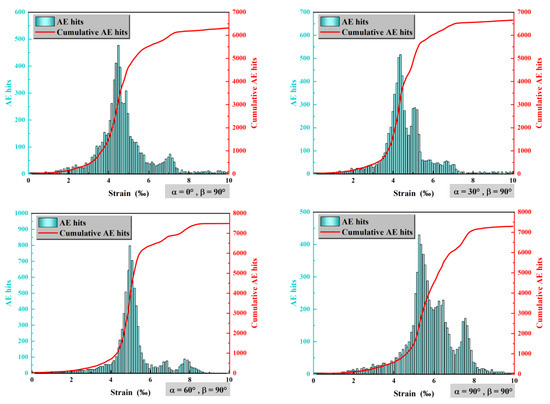
Figure 9.
Acoustic emission characteristics of salt paste composites with different fracture angles at the same bedding angle (β = 90°).
According to Figure 10, it can be seen that keeping the prefabricated crack angle constant, the maximum number of acoustic emissions decreases at β = 15°, increases at β = 30°, decreases at β = 45° and 60°, and increases again at β = 75° and 90°. In general, when the bedding plane angle changes, the maximum number of acoustic emissions exhibits a wave-like variation. According to Figure 11, when α = 90°, at β = 0°, 30°, 60°, and 75°, the maximum number of acoustic emissions first increases, then decreases, and finally drops to zero. At β = 15°, 45°, and 90°, there is a slight rebound in the number of acoustic emissions when it starts to decrease. Observation of Figure 5 and Figure 11 shows that after reaching the peak stress, the assemblage starts to rupture, and the number of acoustic emissions inside the assemblage increases and the energy increases, which eventually leads to the rupture of the assemblage as a whole.
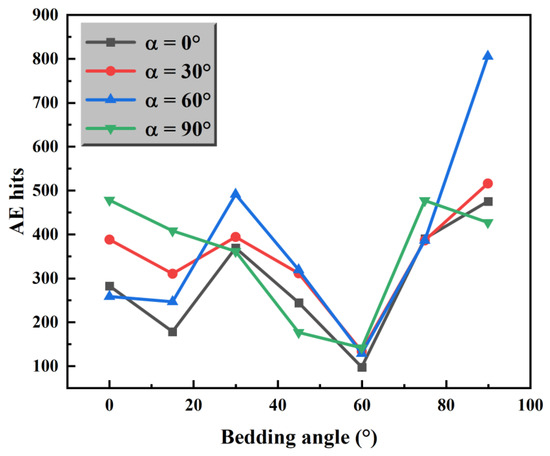
Figure 10.
Evolution trend of maximum emission with bedding angle during compression process of salt paste composite.
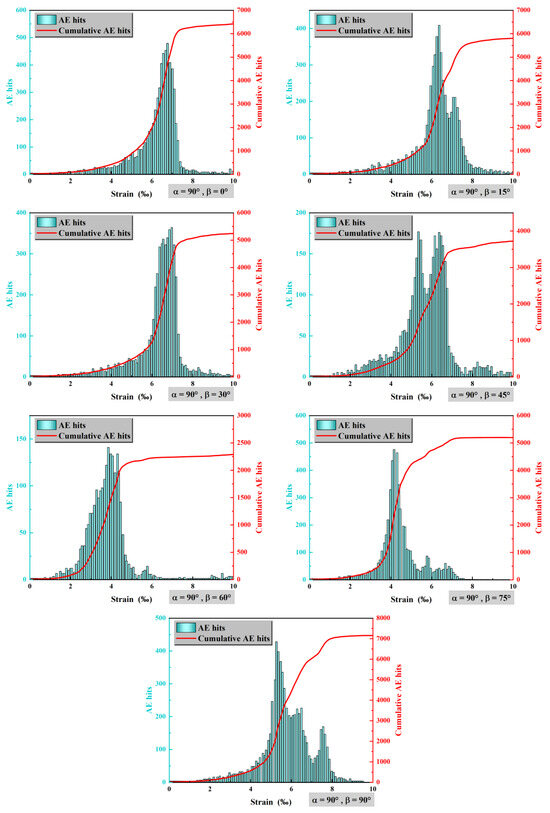
Figure 11.
Acoustic emission characteristics of salt paste composites with different bedding angles at the same fracture inclination angle (α = 90°).
4.2. Fracture Characteristics of Salt Paste Composite
When β = 0° and α = 60°, the peak stress shows a significant decrease, while when α = 90°, the peak stress shows a significant increase. Therefore, the rupture modes of the composite at β = 0°, for α = 60° and α = 90°, will be analyzed. As shown in Figure 12a, the fracture characteristic evolution of the salt–gypsum composite at α = 60° and β = 0° is presented. At point A, small cracks appear around the fracture, and the ends of the cracks begin to expand. Small cracks also appear around the intermediate-strength layer, and at this point, the model maintains stable deformation. Observing the acoustic emission diagram, both white and red circles are present, where white circles represent shear-type microcracks and red circles represent tensile-type cracks. At point B, the crack propagates along the 60° upper-right direction. Observing the acoustic emission diagram, a large number of shear-type cracks appear along this direction, and larger cracks appear in the intermediate-strength layer, along with shear-type cracks. At point C, the salt rock layer presents an M-shaped fracture, and as the cracks in the intermediate-strength layer expand, the gypsum layer also begins to fracture. Observing the acoustic emission diagram, a large number of shear-type cracks appear from the ends of the cracks to the top, and a few shear-type cracks appear in the gypsum layer. Observing the color change, from yellow to blue, indicates that after reaching failure, the shear stress decreases. In summary, the model fractures outward from the edges of the cracks, ultimately leading to the overall failure of the composite. Acoustic emission occurs due to the rapid release of energy locally in the composite, which produces elastic waves [26,27]. Upon examining the cumulative acoustic emission graph, it is found that before point B, the cumulative number of acoustic emissions increases slowly due to the generation of a small number of microcracks inside the composite. After point B, the cumulative number of acoustic emissions increases rapidly, reaching a maximum of 6032. This is due to the concentration and connection of the microcracks distributed within the composite, leading to the macro-fracture of the composite. After reaching the shear stress peak, the composite begins to experience instability and failure. Therefore, the point where the cumulative acoustic emission number starts to increase rapidly can be considered as a precursor to the composite’s fracture.
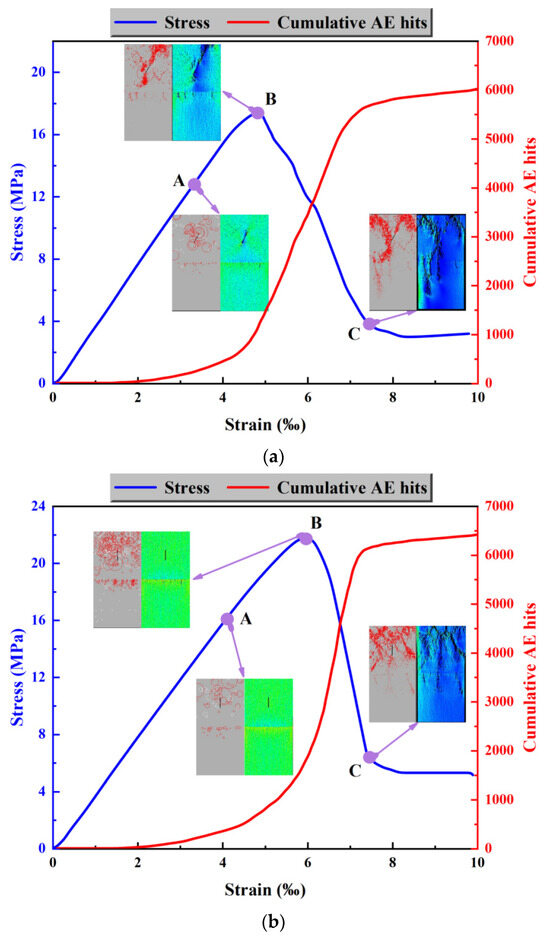
Figure 12.
Evolution of fracture characteristics of salt gypsum composite under the same bedding plane dip angle (β = 0°). (a) Stress–strain curve and fracture characteristic evolution trend of salt paste composite with α = 60° and β = 0°. (b) Stress–strain curve and fracture characteristic evolution trend of the salt–gypsum composite when α = 90° and β = 0°.
When the fracture angle of the salt–gypsum composite and the bedding dip angle are α = 90° and β = 0°, respectively, the stress contour map (Figure 12b) reveals that at point A, no significant cracks appear, and the composite maintains stable deformation. The acoustic emission diagram indicates the presence of both shear and tensile microcracks around the fractures, with the intermediate-strength layer entirely exhibiting shear cracks. At point B, the salt rock layer displays a greater number of shear cracks, and the intermediate-strength and gypsum layers begin to show a few tensile cracks. The maximum stress contour map shows that cracks start to appear at the top of the salt rock layer and within the intermediate-strength layer. As the applied load increases, at point C, the composite has already fractured, and the acoustic emission diagram shows a large number of shear cracks in the salt rock layer. The color changes observed throughout these steps indicate that initially, the color is yellow, suggesting high stress, and after reaching the failure state, the color turns blue, signifying lower stress but more occurrences. In summary, the composite fractures starting from the top of the crack, ultimately leading to the rupture of the entire salt rock layer, with a few cracks appearing in the gypsum layer. The cumulative acoustic emission graph shows that before point B, the cumulative number of emissions increases slowly, which is due to the formation of a small number of microcracks within the composite. After point B, the cumulative number increases sharply, reaching a maximum of 6428, marking point B as the precursor to the composite’s fracture. Following this, the composite begins to experience instability and failure.
When β = 60°, the peak stress of different prefabricated cracks decreases significantly. Therefore, the following will analyze the failure mechanism of the composite at α = 0° and 60° when β = 60°. When α = 0° and β = 60°, the stress diagram of the salt–gypsum composite (Figure 13a) reveals that at point A, small cracks initially appear around the fracture, with significant shear stress along the bedding plane. The acoustic emission diagram shows a large number of red circles around the cracks, indicating shear stress in the vicinity of the fractures, and the bedding plane also exhibits many red circles. As the loading steps increase, the stress in the Y direction continuously rises. At point B, a larger crack extends from the right end of the fracture, and the upper-right corner of the bedding plane begins to crack. The acoustic emission diagram shows a large amount of shear stress at the upper-right corner of the bedding plane. At point C, the bedding plane has completely fractured. The color observation reveals that the color difference between the salt rock layer and the gypsum layer is minimal, indicating that the shear stress experienced by both layers is nearly identical. In conclusion, as the load increases, the shear stress on the bedding plane continues to rise, eventually exceeding the bedding plane’s limit, leading to the fracture of the composite along the bedding plane, which ultimately causes the entire composite to fracture. Observing the cumulative acoustic emission graph, it is evident that before point B, the cumulative number of emissions increases slowly, and after point B, the cumulative number increases sharply. At point B, the stress Is also at Its maximum, marking It as the precursor to fracture. The maximum cumulative number of acoustic emissions at this point is 2326.
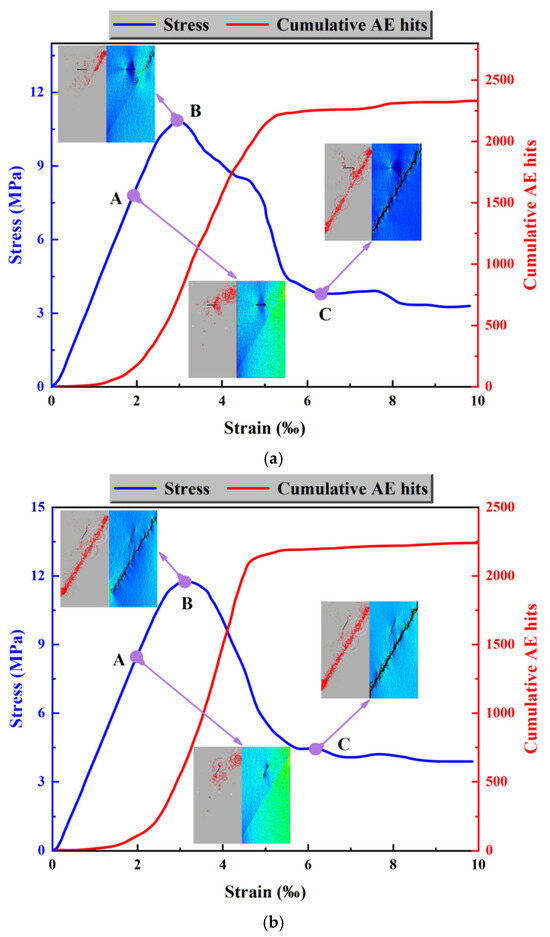
Figure 13.
Evolution of fracture characteristics of salt paste composite under the same prefabricated crack inclination angle (β = 60°). (a) Stress–strain curve and fracture characteristic evolution trend of the gypsum–salt composite at α = 0° and β = 60°. (b) Stress–strain curve and fracture characteristic evolution trend of the gypsum–salt composite at α = 60° and β = 60°.
Figure 13b illustrates the fracture evolution characteristics of the composite when α = 60° and β = 60°. At point A, the two ends of the crack begin to slightly expand, with a few red circles appearing at both ends of the crack. A large number of white and red circles appear at the upper-right corner of the bedding plane. As the applied load increases, the upper-right corner of the bedding plane gradually fractures. At point B, four-fifths of the bedding plane has fractured, and a large number of white and red circles have accumulated on the bedding plane, indicating instability and failure. A small number of shear cracks appear around the prefabricated crack. As the load increases further, the bedding plane completely fractures. At point C, the bedding plane is fully fractured, with white and red circles concentrated on the bedding plane. Only a few red circles appear around the prefabricated cracks, and the prefabricated cracks have not extended toward either end. The color observation shows that at step 20, the color of the gypsum layer is more yellow than that of the salt rock layer, indicating that the gypsum layer experiences higher shear stress than the salt rock layer. As the composite fractures, the colors of the gypsum and salt rock layers become more similar, and the shear stress on both layers decreases, with minimal difference between them. In conclusion, as the applied load increases, the upper-right corner of the bedding plane fractures, eventually leading to the entire bedding plane’s fracture, while the prefabricated crack only shows slight expansion towards both ends in the earlier stages. Observing the cumulative acoustic emission graph, it is evident that before point B, the cumulative number of emissions increases slowly. After point B, the cumulative number increases rapidly. The stress at point B is also at its maximum, marking it as the precursor to fracture. At this point, the maximum cumulative number of acoustic emissions is 2235.
5. Discussion
5.1. Effect of Pre-Existing Fracture Angles on Compressive Strength and Failure Modes
Table 4 indicate that the salt–gypsum composite exhibits its lowest compressive strength at a pre-existing fissure angle of 0°, whereas strength increases significantly toward 90°. This trend aligns with classic rock mechanics theories, including the Mohr–Coulomb criterion and Griffith crack theory, both of which suggesting that fracture orientation strongly affects stress concentration and crack propagation thresholds [20,21]. At lower angles (near 0°), horizontal fissures more readily align with principal tensile stresses under compression, leading to extensive wing cracks and shear sliding at relatively lower load levels. In contrast, at high angles (particularly 90°), a near-vertical crack orientation tends to distribute normal stresses more uniformly, requiring a higher load to trigger instability or coalescence of microcracks. Notably, this is consistent with prior work on fractured granite and sedimentary rocks in which steeply inclined fissures often exhibit delayed failure because crack-opening mechanisms require more energy under vertical compression [18,20].
Table 4.
Comprehensive summary of salt–gypsum composite behavior under various fissure (α) and bedding (β) angles.
Microscale observations of how crack tips nucleate and extend offer an additional layer of understanding. In lower-angle fissures, microcracks can easily connect along or near the bedding interface in the gypsum–salt composite, expediting the formation of an interconnected crack network. Conversely, at higher angles, microcracks must overcome larger shear or tensile thresholds to propagate across layer boundaries, thus explaining the higher peak loads observed. This pattern resonates with experimental results on other anisotropic rocks under confining pressure, highlighting that fissure orientation can be a decisive factor in controlling the composite’s load-bearing capacity [21].
5.2. Influence of Bedding Plane Dip Angles on Strength and Cracking Behavior
Equally significant is the role of the bedding plane dip angle in shaping the composite’s failure modes. Our findings reveal a non-monotonic relationship between bedding-plane angles (0–90°) and compressive strength, with the lowest strength around 60°. Such a dip angle appears to facilitate interlayer slip, local stress concentration, and the formation of macroscopic fractures that propagate through the gypsum–salt interface. By contrast, near-horizontal (0–30°) layers exhibit comparatively higher strength, as the interfaces are less favorably oriented for shear or tensile fracture under vertical compression. Once the bedding plane surpasses roughly 60°, the rock transitions into a geometry where bedding planes are nearly vertical, shifting the failure pattern back to a more columnar load-bearing mode reminiscent of single-layer salt or gypsum cores [24].
From the perspective of anisotropic failure envelopes—including the Jaeger plane-of-weakness model—the presence of inclined discontinuities significantly reduces shear resistance when those discontinuities intersect principal stresses at near-optimal angles for slip [23]. Our simulations confirm that at around 60°, bedding planes become “optimally oriented” for fracture propagation. Moreover, the transition in failure patterns—where cracks initiate from pre-existing fissures at low angles versus forming along bedding planes at higher angles—underscores the interplay between interlayer bonding strength, salt and gypsum mechanical properties, and the orientation of principal stresses. These results are in good agreement with layered rock studies showing complex crack deflection and delamination phenomena once the layer interface aligns more favorably with the stress field [25].
5.3. Acoustic Emission, Comparisons with Previous Studies, Engineering Implications, and Limitations
A unifying perspective on these observations can be gleaned from acoustic emission (AE) monitoring. The cumulative AE counts, which spike near or just after peak stress, confirm that the composite undergoes an abrupt transition from stable crack growth to unstable macro-fracture. During loading, the gradual accumulation of microcracks generates smaller AE events, but once critical crack coalescence begins—often tied to fissure angles or bedding orientations that maximize stress concentration—the AE rate surges sharply. This behavior aligns with previously reported AE patterns in both salt rocks and other stratified rocks, where a sudden burst in AE activity frequently denotes imminent failure [22]. Notably, in configurations with vertical fissures (α = 90°) or steep bedding planes (β > 60°), the composite exhibits a more dramatic post-peak stress drop, implying a brittle-like collapse mechanism dominated by coalescing tensile cracks and frictional sliding along the interface.
When evaluated against earlier studies, our work advances the understanding of salt–gypsum composites by exploring the combined effects of fissure orientation and bedding plane inclination under confining pressures—a factor that has often been investigated in isolation. While Zhao et al. [20] and Bi et al. [21] examined fissure angles or fissure lengths in salt or granite, their analyses did not capture the additional complexity of layered composites. Meanwhile, other research, such as Lyu et al. [22] and Zhao et al. [23], emphasized cyclic or creep behaviors in layered salt without systematically addressing how fissure angles might intersect layer interfaces. Our multi-parameter approach more comprehensively reveals how these geometric features collectively govern stress redistribution, crack path divergence, and ultimate load capacity. This synergy of parameters can be crucial in salt-dominated formations (e.g., in China) where thin-bedded salt deposits and gypsum interlayers are widespread.
From an engineering standpoint, these insights carry several practical implications for the design and safety assessment of underground salt cavern gas storage, such as the following: Cavern orientation and layout: Geomechanical models of cavern stability should incorporate field measurements of bedding-plane dips and pre-existing cracks. When a site exhibits bedding planes at or near 60°, operators should recognize the increased likelihood of slip or fracture coalescence, calling for conservative injection and withdrawal pressures or additional reinforcement measures. Micro-seismic monitoring: Installing a micro-seismic monitoring system can provide real-time alerts of microcrack coalescence, offering an early-warning mechanism for incipient failure. Given the spike in AE events near peak stress, field engineers can adjust operational parameters—such as controlling injection flow rates—if AE patterns signal a high risk of fracture propagation. Mitigation of fluid pathways: High-angle fissures and critically oriented bedding planes may evolve into fluid migration pathways during cavern operation. Identifying and sealing such pathways, or avoiding them via strategic cavern placement, could help maintain the integrity of the storage system and reduce the risk of gas leakage.
Despite these contributions, our study has several limitations. First, we employed a two-dimensional numerical model, and real geological formations exhibit three-dimensional complexities—such as variations in layer thickness, local undulations, and inhomogeneities in salt or gypsum composition. Second, while we captured fundamental fracturing modes, we did not incorporate time-dependent phenomena like creep, which can be especially relevant for long-term operations in salt caverns. It is important to note that our current study assumes isothermal conditions and does not incorporate thermomechanical coupling. As a result, the observed strength evolution and failure modes are representative of a constant temperature environment, and the potential impacts of temperature-induced stresses, creep, or fatigue remain unaddressed. In scenarios where significant thermal gradients exist, the absence of temperature effects in our model could lead to discrepancies between simulated outcomes and actual field performance. Future research should integrate temperature effects by coupling thermal, hydraulic, and mechanical processes in the numerical framework. This would enable a more comprehensive assessment of how thermal stresses interact with pre-existing fissures and bedding plane geometries, ultimately enhancing the predictive capabilities regarding the long-term safety and performance of salt cavern gas storage facilities.
In summary, the integration of AE insights, comprehensive angle variations, and confining pressure simulations offers a more nuanced picture of how fissure orientations and interlayer angles collectively shape salt–gypsum composite failure. Our findings not only fill gaps in the existing literature regarding multi-parameter anisotropic behavior under stress but also provide targeted guidance for the construction and safe operation of underground salt cavern facilities—particularly in thin-bedded salt formations where gypsum interlayers are pervasive.
6. Conclusions
This study employs RFPA2.0 simulation software to investigate the fracture behavior of a salt–gypsum composite, which includes a medium-strength layer, under a constant confining pressure of 25 MPa. By systematically varying the pre-existing fissure angle in the salt rock (0°, 30°, 60°, and 90°) and the dip angle of the medium-strength bedding plane (ranging from 0° to 90°), the experimental data obtained provide a comprehensive picture of how these geometric factors affect both the load-bearing capacity and the failure mechanisms of the composite. The following five detailed conclusions, along with suggestions for future research, are drawn from this study:
- (1)
- The orientation of the pre-existing fissure has a profound impact on the mechanical behavior of the composite. Specifically, when the fissure is oriented near 0°, the crack tends to coalesce at a lower stress level, leading to an early onset of extensive damage characterized by wide-spread microcrack connectivity. In contrast, when the fissure is oriented near 90°, the simulation results indicate a significant delay in the propagation of cracks, thereby increasing the composite’s capacity to sustain higher loads before failure occurs. The alignment of fissures relative to the loading direction plays a critical role in determining the overall structural integrity, as it influences the stress distribution and the subsequent energy release during fracture.
- (2)
- The bedding plane dip angle exerts a complex, non-monotonic effect on the compressive strength of the composite. As the bedding plane angle increases from 0° toward 60°, the peak compressive strength first rises, then reaches a pronounced minimum at around 60°. At this critical angle, the salt–gypsum interface is particularly susceptible to shear activation and delamination, which results in a rapid decrease in load-bearing capacity. Beyond 60°, as the bedding plane approaches a near-vertical orientation (90°), the strength increases again. This behavior underscores the importance of the bedding plane orientation in governing failure; the minimum strength at approximately 60° highlights a vulnerability that can be attributed to optimal conditions for interlayer sliding and stress concentration along the interface.
- (3)
- The AE activity is closely linked to the transition from gradual microcrack development to the rapid coalescence that characterizes macro-fracture. Sudden surges in AE events were observed to coincide with critical load levels, signaling a rapid release of strain energy and imminent structural failure. These AE patterns serve as a sensitive indicator of the evolving damage process and validate the notion that the interplay between fissure orientation and bedding plane dip not only governs the static strength but also the dynamic fracture propagation behavior.
- (4)
- This paper has direct implications for the design and operation of underground salt cavern gas storage facilities. In regions where geological surveys reveal a high prevalence of bedding planes with dip angles near 60°, extra caution must be exercised during site selection, or measures should be implemented to reinforce the interlayer stability. Moreover, in scenarios where low-angle or horizontal fissures are dominant, it becomes critical to adopt a phased approach to controlling injection and withdrawal pressures. Coupled with high-frequency micro-seismic monitoring, these measures can facilitate the early detection of rapid crack propagation or shear failure, thereby mitigating risks such as cavern collapse or gas leakage. The study thus provides a framework for tailoring design strategies and operational protocols based on the geometric characteristics of the rock mass.
- (5)
- This study provides valuable insights into the fracture behavior of salt–gypsum composites under static, isothermal conditions; several aspects remain for future exploration. It is essential to incorporate cyclic loading and temperature variations into the simulation framework, as these factors are inherent in real underground gas storage environments and significantly influence fatigue, creep, and thermal stress responses. Furthermore, given that salt rock exhibits pronounced time-dependent behavior, integrating viscoplastic or creep constitutive models would enhance the accuracy of long-term stability predictions. Extending the analysis to three-dimensional models would also provide a more realistic representation of complex geological conditions, including irregular interface geometries. Lastly, experimental validation using laboratory tests on specimens with controlled fissure and bedding configurations is critical for verifying and refining the numerical predictions. Coupling thermo-hydro-mechanical processes in future studies would further bridge the gap between simulation and field performance, ultimately contributing to safer and more reliable underground gas storage designs.
Author Contributions
F.W.: Conceptualization, Writing—review and editing, Data curation. T.M.: Conceptualization, Writing—review editing. K.C.: Visualization, Investigation. P.Z.: Visualization, Investigation. Z.Z.: Visualization, Investigation. C.Z.: Visualization, Investigation. G.Z.: Visualization, Investigation. Z.W.: Visualization, Investigation. P.L.: Visualization, Investigation. X.W.: Visualization, Investigation. All authors have read and agreed to the published version of the manuscript.
Funding
This research is funded by the Scientific and Technological Innovation Programs of Higher Educations Institutions in Shanxi (2022L607) and the National Natural Science Foundation of China (52474080).
Data Availability Statement
Data will be made available on request.
Acknowledgments
We gratefully acknowledge the developers of the RFPA software for providing an essential tool that significantly enhanced the numerical simulations in this study.
Conflicts of Interest
The authors declare that they have no known competing financial interests or personal relationships that could have appeared to influence the work reported in this paper.
References
- Farghali, M.; Osman, A.I.; Mohamed, I.M.; Chen, Z.; Chen, L.; Ihara, I.; Yap, P.-S.; Rooney, D.W. Strategies to save energy in the context of the energy crisis: A review. Environ. Chem. Lett. 2023, 21, 2003–2039. [Google Scholar] [CrossRef] [PubMed]
- Tarkowski, R. Underground hydrogen storage: Characteristics and prospects. Renew. Sustain. Energy Rev. 2019, 105, 86–94. [Google Scholar] [CrossRef]
- Lord, A.S.; Kobos, P.H.; Borns, D.J. Geologic storage of hydrogen: Scaling up to meet city transportation demands. Int. J. Hydrogen Energy 2014, 39, 15570–15582. [Google Scholar] [CrossRef]
- Matos, C.R.; Carneiro, J.F.; Silva, P.P. Overview of large-scale underground energy storage technologies for integration of renewable energies and criteria for reservoir identification. J. Energy Storage 2019, 21, 241–258. [Google Scholar] [CrossRef]
- Panfilov, M. Underground and pipeline hydrogen storage. In Compendium of Hydrogen Energy; Elsevier: Amsterdam, The Netherlands, 2016; Volume 2, pp. 91–115. [Google Scholar]
- Caglayan, D.G.; Weber, N.; Heinrichs, H.U.; Linßen, J.; Robinius, M.; Kukla, P.A.; Stolten, D. Technical potential of salt caverns for hydrogen storage in Europe. Int. J. Hydrogen Energy 2020, 45, 6793–6805. [Google Scholar] [CrossRef]
- Liu, W.; Li, Q.; Yang, C.; Shi, X.; Wan, J.; Jurado, M.J.; Li, Y.; Jiang, D.; Chen, J.; Qiao, W.; et al. The role of underground salt caverns for large-scale energy storage: A review and prospects. Energy Storage Mater. 2023, 63, 103045. [Google Scholar] [CrossRef]
- Gao, R.; Wu, F.; Chen, J.; Zhu, C.; He, Q. Accurate characterization of triaxial deformation and strength properties of salt rock based on logarithmic strain. J. Energy Storage 2022, 51, 104484. [Google Scholar] [CrossRef]
- Wang, J.; Zhang, Q.; Liu, X.; Song, Z.; Feng, S. Creep properties and constitutive model for salt rock subjected to uniaxial trapezoidal cyclic loading. J. Energy Storage 2022, 52, 105023. [Google Scholar] [CrossRef]
- Gao, R.; Wu, F.; Chen, J.; Zhu, C.; Ji, C. Study on creep characteristics and constitutive model of typical argillaceous salt rock in energy storage caverns in China. J. Energy Storage 2022, 50, 104248. [Google Scholar] [CrossRef]
- Lin, H.; Liu, J.; Yang, J.; Ran, L.; Ding, G.; Wu, Z.; Lyu, C.; Bian, Y. Analysis of damage characteristics and energy evolution of salt rock under triaxial cyclic loading and unloading. J. Energy Storage 2022, 56, 106145. [Google Scholar] [CrossRef]
- Zhang, Q.; Song, Z.; Wang, J.; Zhang, Y.; Wang, T. Creep properties and constitutive model of salt rock. Adv. Civ. Eng. 2021, 2021, 8867673. [Google Scholar] [CrossRef]
- Wang, J.; Zhang, Q.; Song, Z.; Zhang, Y. Creep properties and damage constitutive model of salt rock under uniaxial compression. Int. J. Damage Mech. 2020, 29, 902–922. [Google Scholar] [CrossRef]
- Liang, X.; Meng, T.; Feng, G.; Zhao, G.; Wang, Z.; Liu, P. Evolution of permeability and pore structure of salt rock and its self-healing mechanism under coupled thermo-hydro-mechanical environment. J. Energy Storage 2023, 66, 107476. [Google Scholar] [CrossRef]
- Tong, K.; He, J.; Chen, P.; Li, C.; Dai, W.; Sun, F.; Tong, Y.; Rao, S.; Wang, J. Key Technologies for the Efficient Development of Thick and Complex Carbonate Reservoirs in the Middle East. Energies 2024, 17, 4566. [Google Scholar] [CrossRef]
- Zhao, S.; Liu, H.; Zhu, Y.; Wang, S.; Yang, X. Quantitative Evaluation of Gypsum-Salt Caprock Sealing Capacity Based on Analytic Hierarchy Process—A Case Study from the Cambrian in the Tarim Basin, Western China. Energies 2022, 15, 7139. [Google Scholar] [CrossRef]
- Li, J.; Wan, J.; Liu, H.; Jurado, M.J.; He, Y.; Yuan, G.; Xia, Y. Stability analysis of a typical salt cavern gas storage in the Jintan area of China. Energies 2022, 15, 4167. [Google Scholar] [CrossRef]
- Shi, H.; Chen, W.; Zhang, H.; Song, L.; Li, M.; Wang, M.; Lu, P. Dynamic strength characteristics of fractured rock mass. Eng. Fract. Mech. 2023, 292, 109678. [Google Scholar] [CrossRef]
- Shi, H.; Zhang, H.; Song, L.; Yang, Z.; Yuan, G.; Xue, X.; Wang, Y. Failure characteristics of sandstone specimens with randomly distributed pre-cracks under uniaxial compression. Environ. Earth Sci. 2020, 79, 1–21. [Google Scholar] [CrossRef]
- Zhao, E.; Li, J.; Zhang, X.; Zhang, C.; Ren, Q.; Tan, T.; Wang, Y. Failure characteristics and the law of the energy evolution of granite with different pre-crack inclination angles under uniaxial compression loading. Front. Earth Sci. 2023, 11, 1218178. [Google Scholar] [CrossRef]
- Bi, X.; Wang, W.; Zhu, G.; Liu, X. Study of mechanical behavior of salt rock with prefabricated fissures under different confining pressures. Arab. J. Geosci. 2021, 14, 785. [Google Scholar] [CrossRef]
- Lyu, X.; Yun, L.; Xu, J.; Liu, H.; Yu, X.; Peng, P.; Ouyang, M.; Luo, Y. Sealing capacity evolution of gypsum salt caprocks under multi-cycle alternating stress during operations of underground gas storage. J. Pet. Sci. Eng. 2023, 220, 111244. [Google Scholar] [CrossRef]
- Zhao, Y.; Wang, X.; Tang, W.; Li, Y.; Lin, H.; Wang, Y.; Zhang, L. Creep behavior of layered salt rock under triaxial loading and unloading cycles. Appl. Rheol. 2023, 33, 20230103. [Google Scholar] [CrossRef]
- Wang, G.; Meng, T.; Feng, G.; Ma, L.; Yang, W.; He, Y.; Zhang, Z.; Liang, X. Influence of bedding strength and angle on fracture characteristics of sandstone under three-point bending conditions. Appl. Sci. 2023, 13, 8216. [Google Scholar] [CrossRef]
- Meng, T.; Hu, Y.; Fang, R.; Fu, Q.; Yu, W. Weakening mechanisms of gypsum interlayers from Yunying salt cavern subjected to a coupled thermo-hydro-chemical environment. J. Nat. Gas Sci. Eng. 2016, 30, 77–89. [Google Scholar] [CrossRef]
- Liu, X.; Zhang, S.; Xie, Y.; Wang, T. Three-Dimensional Heterogeneity of the Pore and Fracture Development and Acoustic Emission Response Characteristics of Coal Rocks in the Yunnan Laochang Block. Energies 2024, 17, 1207. [Google Scholar] [CrossRef]
- Liu, X.; Liu, Z.; Li, X.; Gong, F.; Du, K. Experimental study on the effect of strain rate on rock acoustic emission characteristics. Int. J. Rock Mech. Min. Sci. 2020, 133, 104420. [Google Scholar] [CrossRef]
Disclaimer/Publisher’s Note: The statements, opinions and data contained in all publications are solely those of the individual author(s) and contributor(s) and not of MDPI and/or the editor(s). MDPI and/or the editor(s) disclaim responsibility for any injury to people or property resulting from any ideas, methods, instructions or products referred to in the content. |
© 2025 by the authors. Licensee MDPI, Basel, Switzerland. This article is an open access article distributed under the terms and conditions of the Creative Commons Attribution (CC BY) license (https://creativecommons.org/licenses/by/4.0/).