Article

Efficiency and Energy Consumption of Partial Carbonation Process for CO2 Capture from Natural Gas Combustion

by
Rubens Coutinho Toledo
1,*,
Caio Leandro de Moraes
1,
Vinoth Thangarasu
2,
João Andrade de Carvalho, Jr.
1 and
Ivonete Avila
1
1
LC3—Laboratory of Combustion and Carbon Capture, Department of Chemistry and Energy, School of Engineering and Science, UNESP—São Paulo State University, Guaratingueta 12516-410, SP, Brazil
2
Indian Rubber Materials Research Institute, DPIIT, Ministry of Commerce and Industry, Thane 400604, Maharashtra, India
*
Author to whom correspondence should be addressed.
Energies 2025, 18(9), 2285; https://doi.org/10.3390/en18092285 (registering DOI)
Submission received: 24 February 2025 / Revised: 12 April 2025 / Accepted: 24 April 2025 / Published: 29 April 2025
(This article belongs to the Section B3: Carbon Emission and Utilization)

Abstract

:
Brazil has set a goal to reduce greenhouse gas (GHG) emissions, which is a significant opportunity to leverage calcium looping (CaL) technology for energy generation in natural gas power plants. CaL is a promising technology, due to sorbent low cost and availability, but its industrial implementation performance decay is a major challenge to face. While evaluating carbon-capture technologies, net emissions perspective is essential, and optimizing CaL capture through a partial carbonation cycle is a promising approach, both to reduce net emissions and improve the number of cycles before deactivation. In this context, a Brazilian dolomite was characterized and evaluated, to be used as sorbent in a CaL process employed in natural gas power plants. For such a purpose, a novel methodology has been proposed to evaluate the mass ratio of CO2 captured, to assess the energy consumed in the process. A rotatable central composite design (RCCD) model was used to identify the optimal temperature and residence time conditions in the carbonation stage of the CaL process, focusing on achieving energy efficiency. The five most promising conditions were then tested across 10 calcination–carbonation cycles, to examine the impact of partial carbonation in capture efficiency over extended cycles. The results indicate that temperature plays a critical role in the process, particularly in terms of capture efficiency, while residence time significantly affects energy consumption. The conditions that demonstrated optimal performance for both the single and the multi-cycle tests were 580 °C for 7.5 min and 550 °C for 10 min, given that index of capture efficiency ( IEC 10 , c ) values of 1.34 and 1.20 were found, respectively—up to 40% higher than at 475 °C. There was lower energy expenditure at 580 °C ( E s p ) (33.48 kJ), 550 °C ( E s p = 37.97 kJ), CO 2 mass captured ( CO 2 c a p = 9.80 mg), and the samples exhibited a more preserved surface, thus making it the most suitable option for scale-up applications.

1. Introduction

Global temperatures rose by 0.9 °C, on average, in the initial two decades of the 21st century compared to the last two decades of the 20th century, as a result of anthropogenic factors [1]. Greenhouse gas (GHG) emissions is a key concern in modern society, given that climate change starts affecting everyday lives through land-use and lifestyle change, and in patterns of consumption and production across regions among individuals [1,2,3].
Climate change has far-reaching consequences, in addition to temperature rise and greenhouse gas emissions. It exacerbates extreme weather events, such as droughts, floods, and wildfires, which, in turn, influence contaminant dispersion in terrestrial and aquatic systems [4]. These environmental stressors threaten not only water resources but agricultural productivity, leading to economic instability, particularly in regions which are heavily reliant on farming [5]. In addition, climate variability impacts livestock supply chains, altering food availability and increasing risks to animal health and labor productivity, due to extreme heat waves and shifting ecological conditions [6]. These interconnected effects highlight the necessity for comprehensive mitigation strategies integrating sustainable land-use policies, technological advancements, and cross-sector collaborations to enhance resilience in critical industries [4,5,6,7].
Rising energy consumption and the resulting increase in CO2 emissions have compelled the scientific community to seek new technological solutions aimed at mitigating the impact of CO2 on climate change. In this context, investments were made in projects aimed at energy efficiency, renewable energy generation, and low-carbon technologies [8,9,10,11,12,13]; however, a reduction in anthropogenic CO2 emissions would de-escalate such consequences even further [1].
Currently, as society strives for carbon neutrality, it faces numerous challenges. In addition to changing the energy matrix to renewable sources, carbon capture, utilization, and storage (CCUS) technologies are presented as good alternatives to reach carbon neutrality [14], while cleaner forms of energy, such as hydrogen, are still maturing [15]. Even though a great effort has been made to research and develop CCUS technologies, many still require robust infrastructure, including CO2 capture devices, transportation pipelines, storage facilities, and accurate prediction models to support long-term implementation [16]. Such developments, which were once limited to large and industrial facilities, seem to have started being incorporated into society as a form of green transportation, green supply chains, green tourism, and green economy [17]. Nonetheless, these are dependent on a comprehensive system of financial incentives, tax policies, regulatory frameworks, and public education to raise awareness about CCUS’s importance [14].
Given the global urgency to reduce emissions, there should be greater collaboration in the advancement of relevant technologies. As noted by Chu et al. [14], CCUS technologies do not represent a universal solution; rather, their applicability and effectiveness vary across regions. In this regard, it is justifiable for specific regions, such as Brazil, to prioritize the development of technologies aligned with their unique resource availability and national context.
Brazil has a longstanding commitment to reduce CO 2 emissions and has set ambitious GHG targets for the coming years. By 2025, Brazil aims to reduce its GHG emissions by 37% in relation to the 2005 levels, with a further reduction target of 43% below the 2005 levels by 2030 [18]. National emissions in 2022 amounted to 1.69 GtCO 2 , of which 18.0% came from the energy sector [19].
Natural gas has strong potential for energy production, and it is often used as a bolster through thermal plants, to assist their power generation systems in preventing blackouts due to water shortages in reservoirs during years of low rainfall. Its use represents 7.5% of all Brazilian energy matrix generation [20].
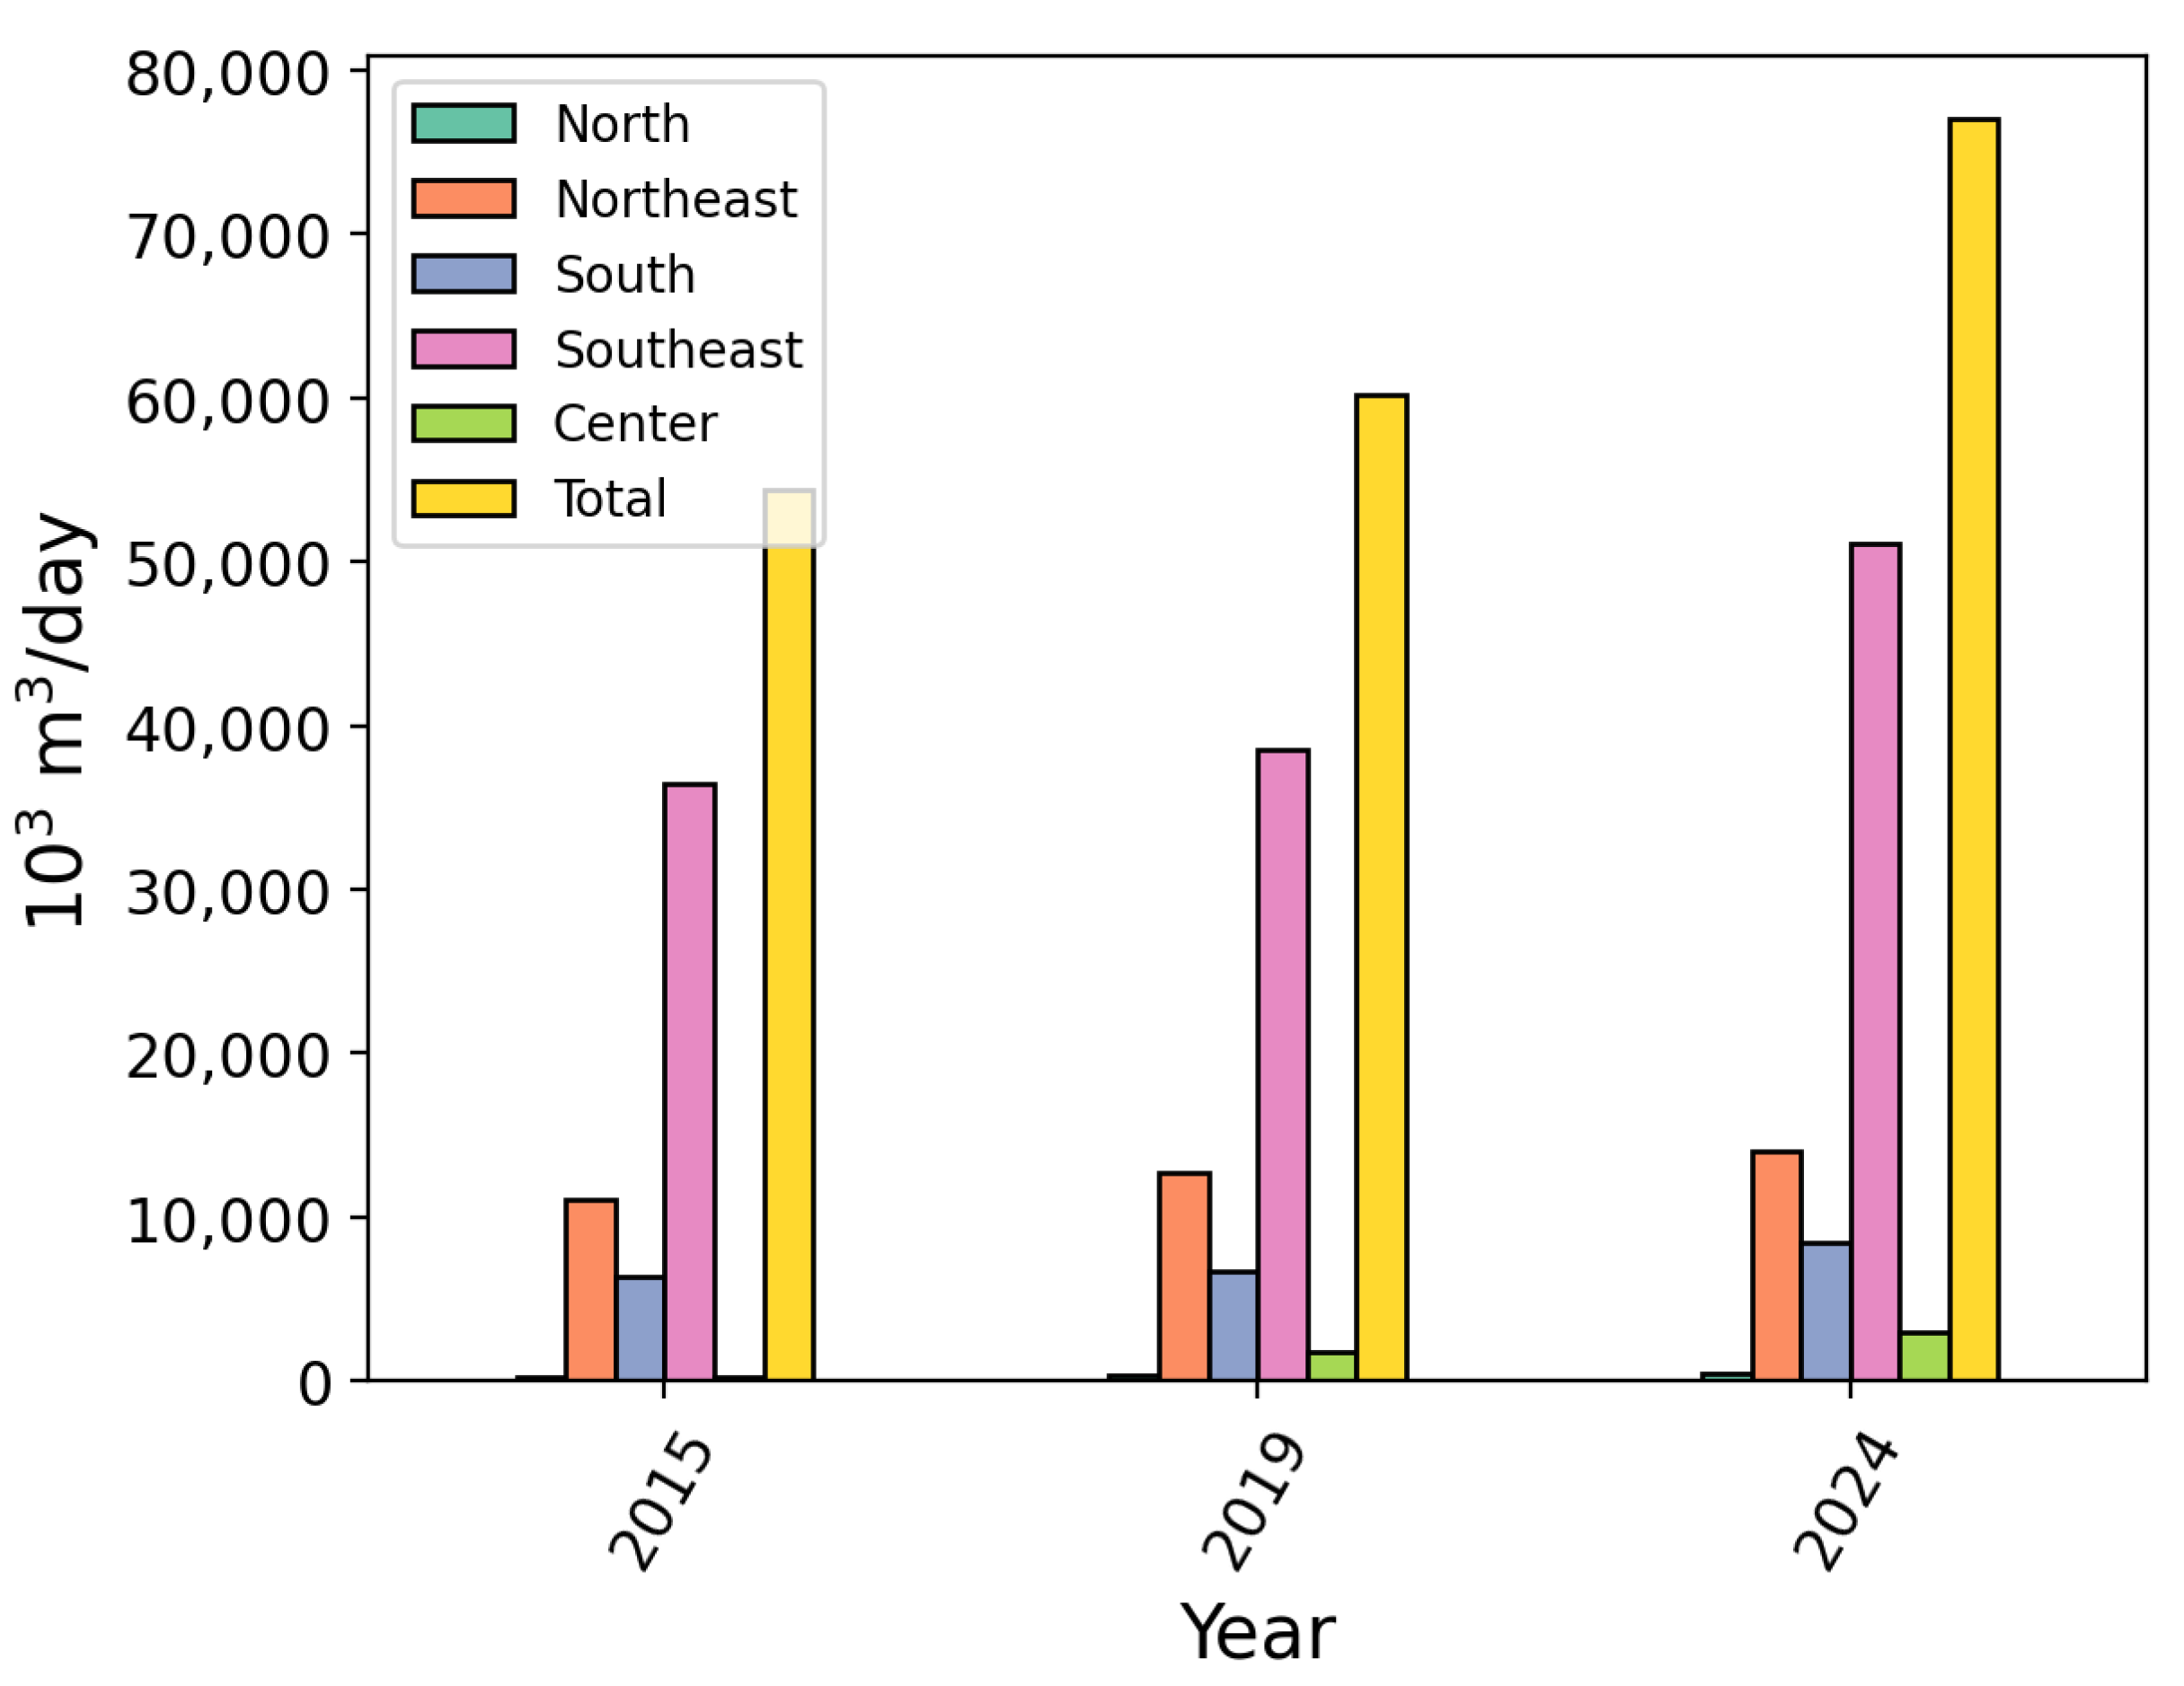
Figure 1 shows natural gas utilization countrywide in 2015, 2019, and 2024 classified by region. It can be seen that the Southeast, Northeast, and South regions were accountable for the large majority of all gas utilization, with 66.4%, 18.1%, and 11.0%, respectively. Industries in the state of São Paulo were responsible for up to 80% of its total consumption of natural gas [21]. The current industrial gas consumption scenario in Rio de Janeiro requires a demand of over 2.38 million m 3 / day [22]. The state of Bahia focuses most of its natural gas use on industrial facilities, where 53.3% is utilized by fuel industries, followed by 30.2% in co-generation [23].
The expanding nationwide reliance of Brazil’s energy matrix on natural gas power plants presents a key opportunity to reduce emissions from this source.
Calcium looping (CaL) is a CCUS technology performed through a reversible cyclic reaction consisting of several steps of calcination, as in Equation (1), and carbonation, as in Equation (2) [24,25]. CaL uses calcium-based sorbents, such as limestone CaCO3, which have different components and physical–chemical characteristics depending on their site of extraction [26].
C a C O 3 ( s ) C a O ( s ) + C O 2 ( g ) Δ H r = 178 kJ / mol
C a O ( s ) + C O 2 ( g ) C a C O 3 ( s ) Δ H r = + 178 kJ / mol
Limestone is an abundant low-cost material suitable for an economically viable process, due to being natural; thus, it is largely utilized for such purposes [27,28,29].
Despite having been developed, CaL technology still poses technical challenges to be faced before being widely implemented. A limited number of cycles in which limestone can be used during CaL reactions is a limiting factor for industrial applications, due to particle elutriation (entrainment and removal of fine particles) [26,30] and deactivation of limestone surfaces after several calcination–carbonation stages [31,32,33]. Some solutions were proposed to make the CaL process application viable in real-world scenarios, such as pelletization and doping with other elements, leading to an increase in CO2 capture efficiency and abrasion resistance [33]. However, these processes raise the cost of base raw materials and make the process economically unfeasible [34,35,36,37].
Partial carbonation was another solution proposed to address issues regarding the number of carbonation–calcination cycles required. In partial carbonation, the carbonation is stopped before the sorbent is able to reach its maximum CO2 capture capacity. Grasa et al. [38] demonstrated that partial carbonation cycles significantly reduce decay in sorbent capture capacity. Their experiments showed that sorbents undergoing partial carbonation maintained higher reactivity over multiple cycles, behaving as “younger” particles compared to fully carbonated sorbents. This effect became particularly pronounced after more than 20 cycles. The authors reached no definitive conclusion on the mechanism, but proposed two possibilities: during carbonation, some of the sorbent remains preserved in the form of CaO, with no decay of its CO 2 capture capacity, or the movement of Ca atoms during CaCO 3 formation facilitates sorbent sintering. Other authors have also found that partial carbonation leads to better performance over the cycle, although their focus was on discussing how the increased solid circulation affects the overall reactor efficiency instead of the mechanism of partial carbonation [39].
Liu et al. [40] have proposed the opposite, stating that sorbent has a memory effect in carbonation, and they found that longer and deep carbonation leads to longer and fast carbonation phases in the next cycles. The authors also cited crack formation during carbonation, increasing mesoporosity and leading to longer fast-phase carbonation. Although this contradicts the previous authors’ arguments, this work used synthetic material, which may behave differently compared to natural sorbents [35,41].
An alternative to mitigating the decay of natural sorbents, partial carbonation presents an option that has not been fully explored, presenting an accessible implementation to all current developments in CaL technologies. Nevertheless, as was pointed out by Rodríguez et al. [39], a fluidized bed design adjustment might be necessary to accommodate faster particle transfer due to smaller residence time. Such a solution requires no additional equipment, as in the case of hydration, but only a natural sorbent, which is the lowest cost of all the proposed solutions.
In this context, partial carbonation can be coupled with CaL technology as a means to optimize CO 2 capture, aiming to reduce total emissions initially by measuring then optimizing the amount of energy spent per mass of CO 2 captured. Although other authors have used the approach of optimizing general configurations of CaL coupled to power plants [42,43,44], to the best of the authors’ knowledge no other work has attempted to optimize CO 2 capture on the carbonator by relating carbonation temperature and residence time to the energy spent in the process.
Therefore, this research aimed to evaluate the performance of a Brazilian dolomite in a synthetic environment of natural gas emissions ( 4%CO 2 -balance air) to maximize CO 2 capture in the carbonator while minimizing energy consumption. As such, the Brazilian dolomite was characterized in terms of particle size, through sieving and chemical composition using X-ray fluorescence (XRF). A rotatable central composite design (RCCD) was then employed to investigate the effects of carbonation temperature and residence time on the optimization of partial carbonation. Tests were conducted using a TGA in a synthetic environment of natural gas emission. The most promising conditions were subjected to 10 calcination–carbonation cycles, to evaluate the impact of the number of cycles on the capture efficiency of CO2 and the dolomite surface. The results contributed to determining how previous tested conditions perform in a multi-cycle scenario.

2. Material and Method

2.1. Material

The dolomite used in this study was from Piracicaba, São Paulo, Brazil, extracted from ground sedimentary dolomite rocks. It was selected due to Piracicaba’s strategic location, with convenient access to major routes in São Paulo, which could support future applications. The sample was prepared using quartering, to prevent variations in granulometric distribution between samples. The dolomite, comprising 356.49 g, was separated into seven samples having 50 g in mass [45] each, which were weighted on a SHIMADZU BL3200H semi-analytical scale, Kyoto, Japan. Seven samples of different particle sizes were separated, using 18 consecutive sieves of varying mesh sizes, ordered from the largest (>1 mm—top) to the smallest (<18 µm—bottom). Replicates were used to assess the deviation of results. Figure 2 shows the particle size distribution of the dolomite:
Particle sizes ranging from 780 μ m to 231 μ m were selected for optimization tests, to provide a better and actual representation of the CaL technology on larger scales.
XRF analysis was performed, to determine the chemical composition of the dolomite. Samples were sent to Central de Análises Químicas Instrumentais—CAQI at Chemistry Institute (EESC/USP) in São Carlos—SP for XRF analyses. The CAQI lab personnel conducted tests using their own protocol, and their XRF equipment was a PANalytical—Model: MiniPaI4, Malvern Panalytical B.V., Almelo, Netherlands. Table 1 shows the initial composition of the samples used in this work:
Morphological observations were made using a ZEISS EVO LS-15 scanning electron microscope manufactured by Carl Zeiss Microscopy GmbH in Oberkochen, Germany. (SEM). Samples were sent to the Laboratório de Imagens de Materiais (LAIMAT) at the Materials department (FEG/UNESP) in Guaratinguetá—SP for SEM analyses. Morphological analyses were conducted, to assess the impact of the process on the surface integrity of the samples.

2.2. TGA Setup and Experimental Conditions for CaL Testing

CaL tests were conducted on a TA Instruments (SDT Q600) simultaneous thermal analysis system, New Castle, Delaware, USA (TGA-DTG-DSC). TGA systems offer excellent control over temperature, heating rate, and atmosphere, typically working with small samples and having high mass precision, making them ideal for small-scale experiments. The carrier gas was introduced through its main inlet and the reagent gas was injected by means of an Aalborg flow controller (GFC-17), Orangeburg, NY, USA through its side inlet. Figure 3 illustrates the experimental setup used.
These tests were performed in a synthetic-environment natural gas-emission atmosphere, due to Brazil’s large consumption of natural gas for energy production [20]. A search was made in the literature on experimental data, to determine the concentration of CO2 required for the exhaustion of natural gas combustion [46,47,48,49,50,51,52,53,54], which resulted in an average of 4.2%vol. wet CO2 for exhaust gases from natural gas combustion. Due to mass flow controller limitations, an approximate value of 4% vol. was adopted. Prior to the tests, the TGA system was calibrated, as described in the manufacturer’s manual. Details on the accuracy and resolution of measurements are provided in Table 2.

2.3. Partial Cycle Optimization CaL Experiments

CO 2 capture by dolomite rises with increased residence time and temperature up to a certain limit. Above a given temperature, the reaction begins to occur predominantly in the form of calcination [55] while residence time reaches saturation; thus, it cannot be optimized, because the maximum CO 2 capture is achieved at the highest-possible residence time and temperature. In this case, an additional variable is needed to evaluate the carbon capture rate in terms of the newly created variable.
Figure 4 shows an example of the behavior of a carbonation reaction for an evaluated sample. It is possible to observe that carbonation has three well-defined regions. The methodology proposes that the mass capture-to-energy ratio used in regions I and II should be greater than that in region III.
In this context, this methodology proposes to interrupt the cycle around region II, to investigate an optimization region when investigating the CO 2 mass captured and energy spent in the process.
Dolomite samples weighing (10 ± 0.5) mg—the maximum amount allowing a single-layer distribution at the bottom of the crucible—ensured that all the particles remained in contact with the reactant gas, calcined up to 800 °C at a heating rate of 10 °C/min in a synthetic air atmosphere flowing at 100 mL/min. The calcination temperature was selected as the minimum temperature necessary to guarantee a 100% conversion of CaCO 3 while minimizing sintering and the high-temperature calcination effect on the carbon capture [56,57]. After the calcination step, the samples were cooled at a controlled rate of 10 °C/min to their respective carbonation temperatures. Then, the reaction atmosphere was changed to a composition of 4% CO 2 balanced with synthetic air. Tests were conducted for the residence time specified in the experimental planning matrix (Table 3).
The calcined mass ( m c a l c ) and carbonated mass ( m c a r b ) were recorded from the TGA weight signal, as illustrated in Figure 5, and the CO 2 mass ( C O 2 c a p ) could be calculated by Equation (3):
CO 2 c a p = m c a r b m c a l c m g
The total energy spent ( E s p ) in the process of each experiment was calculated by integrating the signal of instantaneous energy spent by the reactor along the process, i.e., from the beginning of calcination to the end of carbonation. In order to avoid the magnification effect produced by different magnitudes of E s p (kJ) and CO 2 c a p (mg), both equations were normalized by their maximum value as presented in Equations (4) and (5), respectively.
E s p , n = E s p E s p , m a x
CO 2 c a p , n = CO 2 c a p CO 2 c a p , m a x
A response variable IEC was determined as in Equation (6), which calculated the ratio between E s p , n and CO 2 c a p , n . The index of capture efficiency (IEC) was then used as a response, which related the CO 2 mass captured by the system and the furnace energy spent during the test:
IEC = CO 2 c a p , n E s p , n
In practice, the IEC indicates the energy efficiency of CO 2 capture. This index reveals how much CO 2 is being removed per unit of energy spent and is, therefore, a direct metric of the relationship between the performance and the energy cost of the process. Higher values indicate greater efficiency, i.e., more excellent CO 2 capture with lower relative energy consumption. In comparison, lower values suggest a loss of efficiency, possibly due to sorbent degradation, reduced reactivity over the cycles, or suboptimal operating conditions.

The Rotatable Central Composite Design Model

A rotatable central composite design (RCCD) model was used, due to having a reduced number of tests for two parameters, with residence time (t/min, as presented in Figure 5) and process temperature (T/°C) as independent variables coded as x 1 and x 2 , respectively, as in Equation (7). Temperature and time were selected based on their relationship with the efficiency of the CaL reaction and energy consumption, as the furnace was the primary energy consumer.
In RCCD 2k (k = number of factors), two factors were adopted (RCCD 22) and used on five levels, to optimize the response variables of interest. Regarding the method used, the coded levels were defined as follows: central level (0)—minimum of 3 to estimate experimental variability; low and high levels—factorial points (−1; +1), related to the rotation of factors; and low and high axial levels—axial points (− 2 ; + 2 ), used to determine the response curvature. To facilitate experimental analysis, the axial point values were rounded to −1.4 and +1.4, resulting in integer temperature values rather than fractional ones. Table 3 depicts this coding.
The RCCD planning matrix was set for the region related to the carbonation reaction, based on preliminary tests to observe how the dolomite sample behaved in calcination and carbonation. This region was defined by a change in the main reaction mechanism, in which the whole surface reacted with CO2 and generated CaCO3, and the reaction still took place in the form of CO2 diffusion towards the sample core, which was still composed of CaO [58].
After performing the tests, a generic quadratic model was adjusted according to the data, as in Equation (7):
y = b 0 + b 1 x 1 + b 2 x 2 + b 3 x 2 2 + b 4 x 2 2 + b 5 x 1 x 2
To find the model adjustment constants, the level matrix was written as in Equation (8), where b 0 , b 1 , b 2 , b 11 , b 22 , and b 12 were the constants adjusted experimentally according to the RCCD levels and response variables:
X = x 11 x 21 x 11 2 x 21 2 x 11 × x 21 x 12 x 22 x 12 2 x 22 2 x 12 × x 22 x 1 n x 2 n x 1 n 2 x 2 n 2 x 1 n × x 2 n
where X was the planning matrix comprising time and temperature variables, i.e., the main planning matrix of the curve region defined by the rotational design. The response vector z was also found in Equation (9):
z = y 1 y 2 y n
Thus, it was possible to calculate the adjustment coefficients of Equation (7) using Equation (10), where y 1 , y 2 , and y n were the response variables:
b = ( X T X ) 1 X T z
where b represented the coefficients of Equation (7).
A response surface was generated the moment the optimization methodology was determined. The response surface aimed to show the energy mapping of the whole process, highlighting the difference in the effect of the two process variables.
Analysis of variance (ANOVA) was used to verify the statistical significance of the process parameters for the calcium looping process.

2.4. Multicycle Path Analysis

Samples showing distinct behavior and/or great performance in the RCCD model were selected to investigate the effect of residence time and carbonation temperature on multicycles of CaL. The ratio between the total mass CO 2 captured, ( m c a r b m c a l c ) , as illustrated in Figure 6, and the energy spent in the process was calculated according to Equation (11), not taking into account the first cycle of each test, due to their high variability.
Thus, it was possible to evaluate the optimization process effect in the performance decay and how energy consumption affected this analysis for a higher number of cycles:
IEC 10 , c = ( m c a r b m c a l c ) E s p m g k J = CO 2 c a p , n E s p , n
Repeating the methodology of the RCCD tests, the results of CO 2 c a p and E s p were normalized by their maximum value before analyzing their ratio.
Multicycle tests were conducted, using the previous experimental setup. After the first cycle, the atmosphere was switched to synthetic air, and the temperature was again raised to 800 °C at a rate of 20 °C/min, to reduce the total time spent during the tests, followed by going through the carbonation stage once more. A total of ten complete calcination/carbonation cycles were performed.

3. Results

3.1. RCCD Response Variables

The response variables were energy spent ( E s p ) and mass of CO2 captured ( CO 2 c a p ), and those obtained from the RCCD model are shown in Table 4. It can be observed that shorter residence times (t) and lower temperatures (T) indicated less energy consumption, as expected. CO 2 c a p was greater for tests 4, 5, 10, and 12, reaching 1.72, 1.44, 1.43, and 1.51 mg, respectively. The ratio between CO 2 c a p , n and E s p , n was consistent with the results presented above, and higher values were also found for tests 4, 5, 10, and 12, and their IEC was 1.01, 0.88, 0.83, and 0.89, respectively. On the other hand, tests 1, 2, and 11 had low CO 2 c a p and IEC values.
From Table 4, it was possible to generate a response surface model as presented in the methodology. Equation (12) describes its results, in which t is a variable representing residence time (t/min) and carbonation temperature (T/°C):
IEC = 6.49 + 2.67 E 2 t + 2.61 E 2 T 1.39 E 2 t 2 2.77 E 5 T 2 + 4.80 E 4 t T
Figure 7 and Figure 8 present the response surface plots and contour lines related to Equation (12), respectively:
It is possible to observe a curved response surface, indicating a region of maximum response for IEC. The contour lines allow identifying the peak region with greater precision, which was located between 7.3 and 11 min and between temperatures of 490 and 580 °C.
Table 5 shows the ANOVA results for the model presented in Equation (12):
Table 6 presents measurement ranges for each response variable:

3.2. Multi-Cycle

Table 7 shows the results achieved from those presented in Table 4 for the multi-cycle path condition. It is possible to observe that the best responses were found at higher temperatures:
Figure 9a,b present the cycles for tests 5 and 10, respectively. It is possible to observe in both images that there was great capture performance in the first cycle and loss of efficiency in the following cycles with a slight difference on the degradation pattern during each cycle. Figure 10a shows test 2 for the cycle condition presenting a slight initial capture of around 0.4 mg and similar degradation behavior of other conditions.
Figure 10b,c shows tests 4 and 12, respectively. A similar performance with mass capture above 1.2 mg can be observed for both tests. A similar pattern of degradation can be seen with a slight difference on test 12 after the fifth cycle.
The degradation curves corresponding to the tests in Table 7 are shown in Figure 11. All the tests exhibited a decay in efficiency, regardless of time and temperature differences.
The morphological structures of the dolomite were investigated, using samples 2, 4, 5, 10, and 12, as shown in Table 3, respectively. Figure 12 depicts SEM images of multi-cycle tests at 5000× magnification.

4. Discussion

Concerning response variables, IEC had excellent performance on tests 4, 5, 10, and 12, as can be seen in Table 4. However, as shown in 
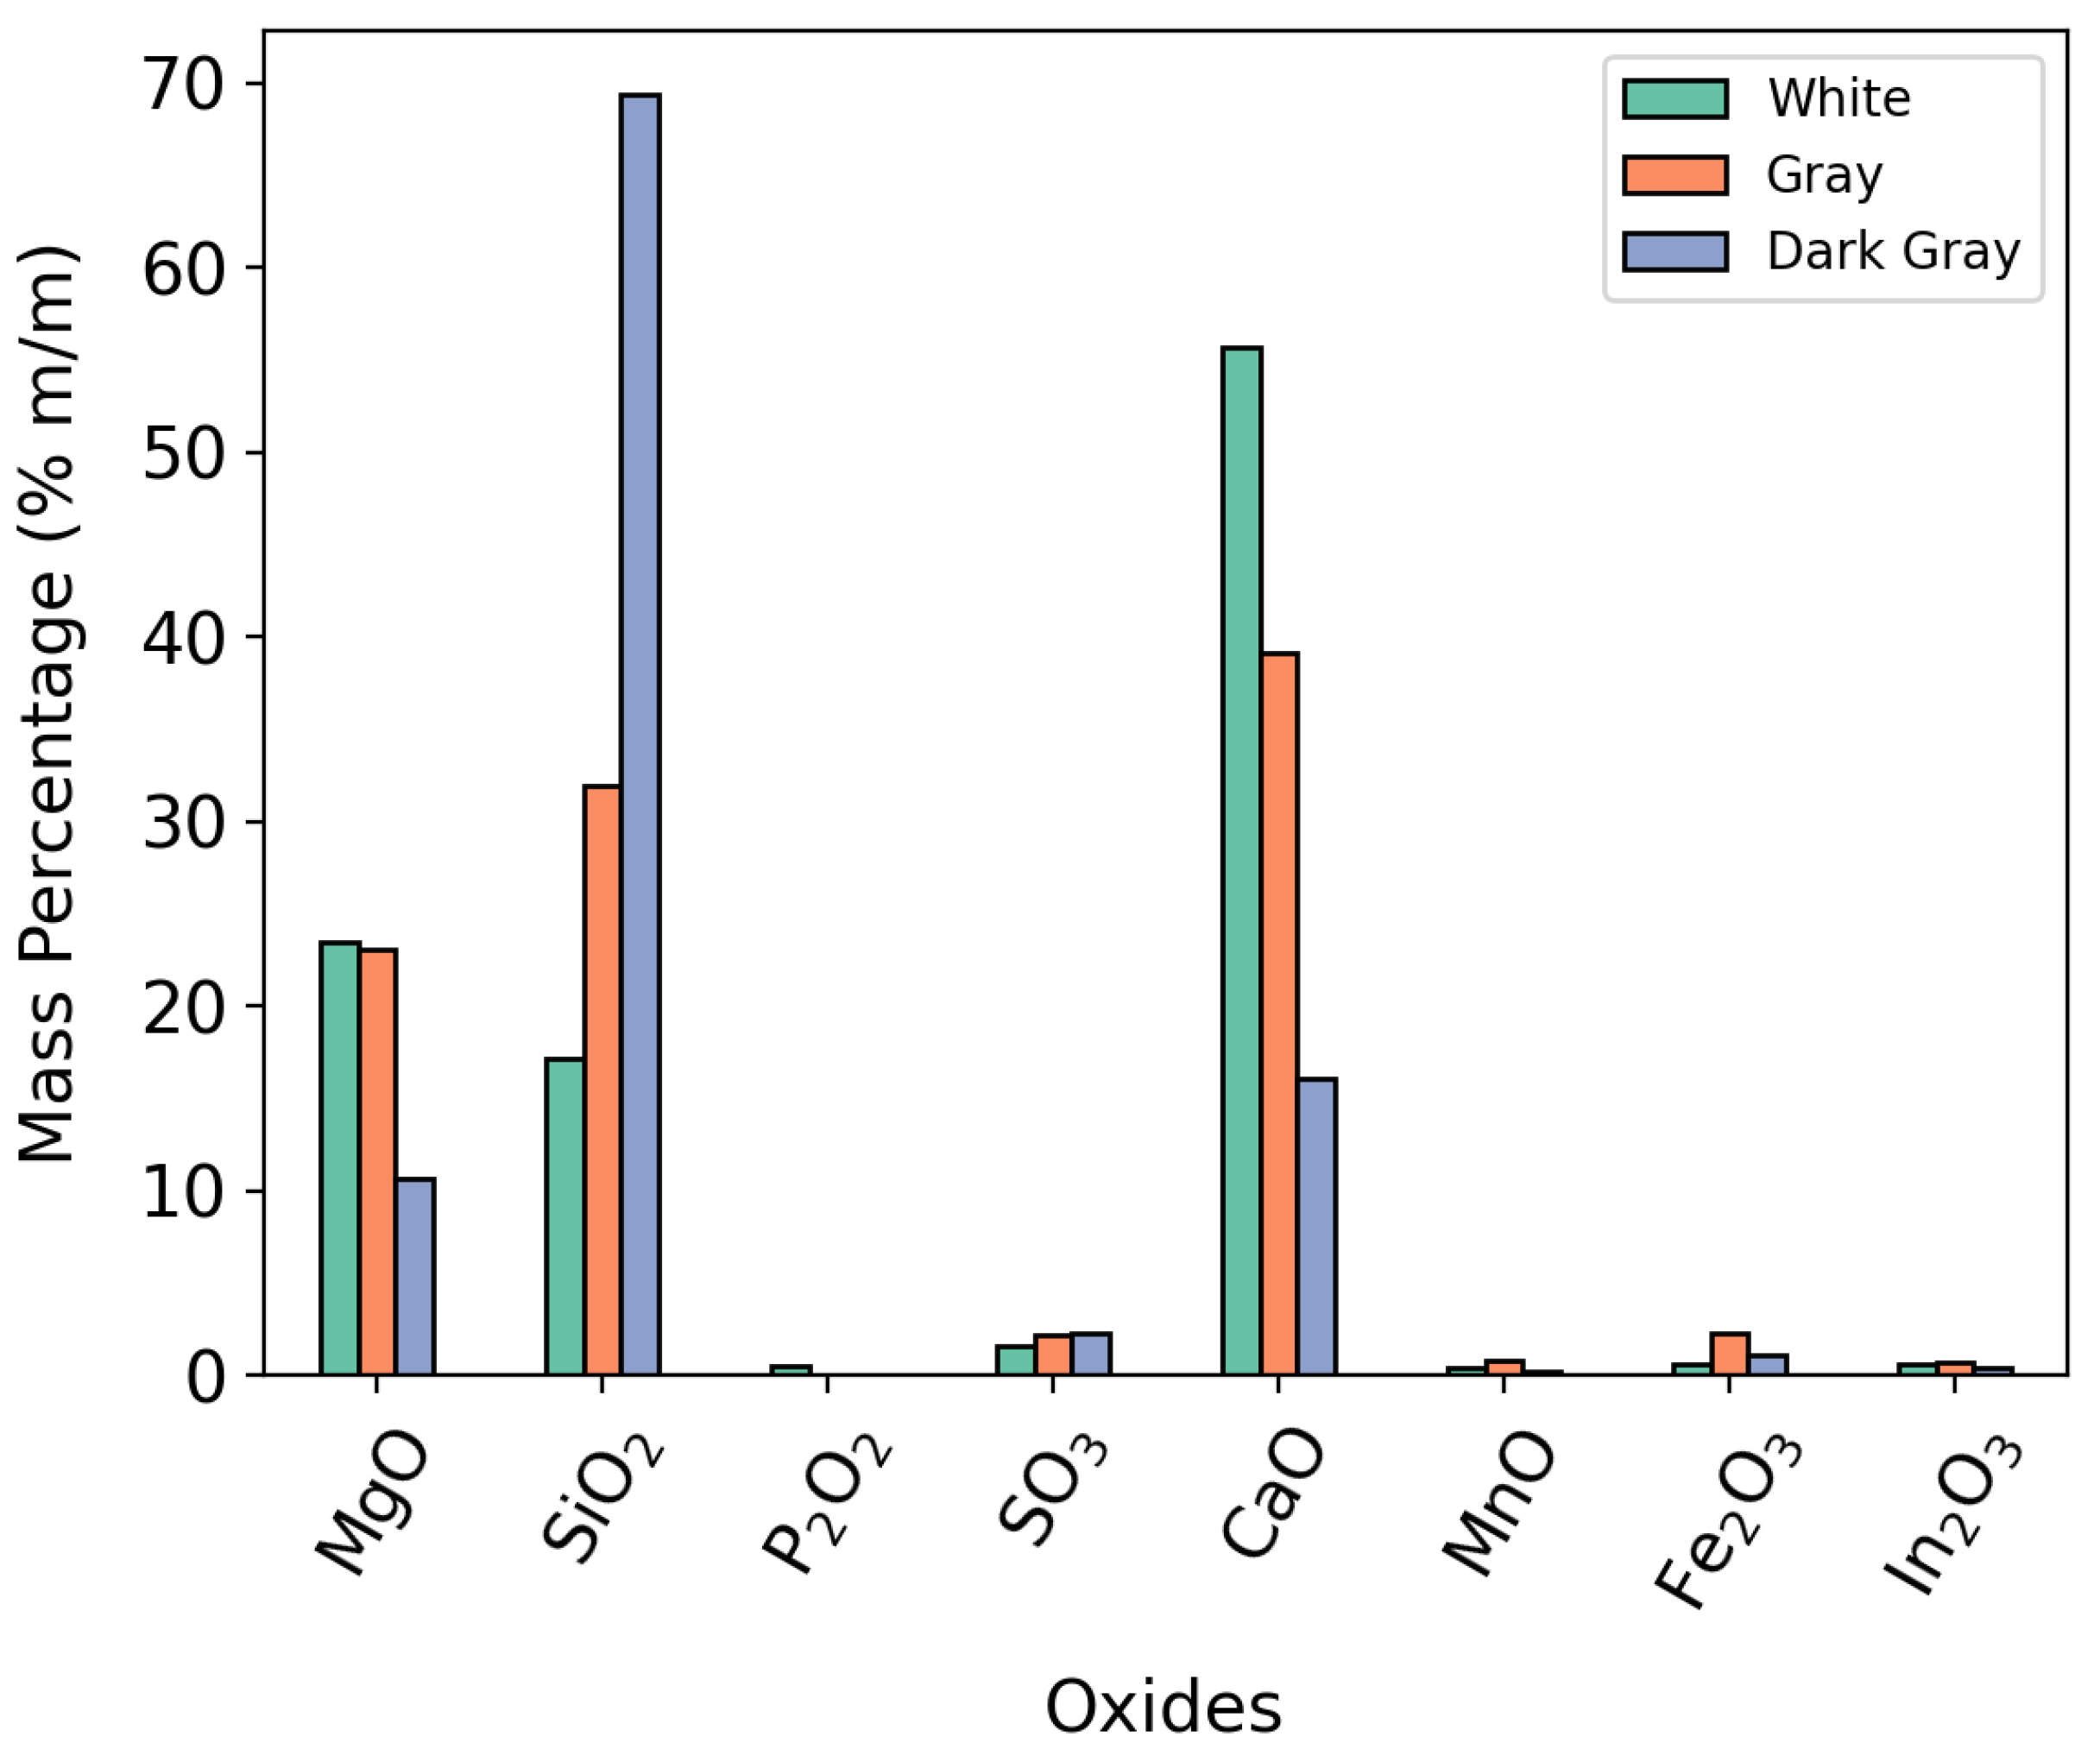
Table 6, the tests had equivalent efficiency by adding estimated accuracy intervals. Such deviation was expected, since the sample had open particle size in a wide particle size range. This hindered the replication of the same distribution using a small 10 mg alumina crucible. This phenomenon was observed at central points of the experimental design where IEC, for example, varied from 0.73 to 0.88. Furthermore, the sample consisted of three original rock types with distinct compositions, as shown in Figure 13, which presented XRF analysis results for white, gray, and dark gray particles. These particles visually corresponded to three different rock colors observed at larger particle sizes.
Thus, although care was taken to ensure that particle size distribution was represented within the crucible, it is unlikely that the chemical composition of each test could be replicated according to Figure 13. Despite the variability presented, the sample in question simulated a real use of dolomite in application.
Table 5 presents the ANOVA results, which revealed that the quadratic model was statistically significant (p = 0.001), with T showing the strongest effect (F = 41.91, p < 0.001). Both the linear and quadratic terms for temperature (T, T 2 ) were highly significant (F = 41.91 and 32.93, respectively, p ≤ 0.001); t and its quadratic term were demonstrated to be significant as well, but had weaker effects (F = 14.98, p = 0.008 and F = 10.23, p = 0.019). The time–temperature interaction (t × T) was marginally significant (F = 7.08, p = 0.038). The lack-of-fit test (p = 0.423) confirmed that the model adequately fitted the experimental data.
Despite the extrapolation experiments (±1.4) used in RCCD, it was impossible to cross the upper limit of carbonation so that calcination reaction became predominant, and a reduction in capture efficiency was expected for carbonation temperature, since different particle sizes should have different calcination temperatures [59]. The use of the proposed model was limited to temperatures outside the evaluated ranges, especially higher ones.
Variability in composition and particle size distribution might not have been fully captured by the replicates at central points. Open particle size samples are a challenge to representing small quantities accurately, as required by instruments such as thermogravimetric balances. To address this issue, a new investigation is proposed, using a system capable of handling larger sample masses, combined with the quartering method and an increased number of replicates.
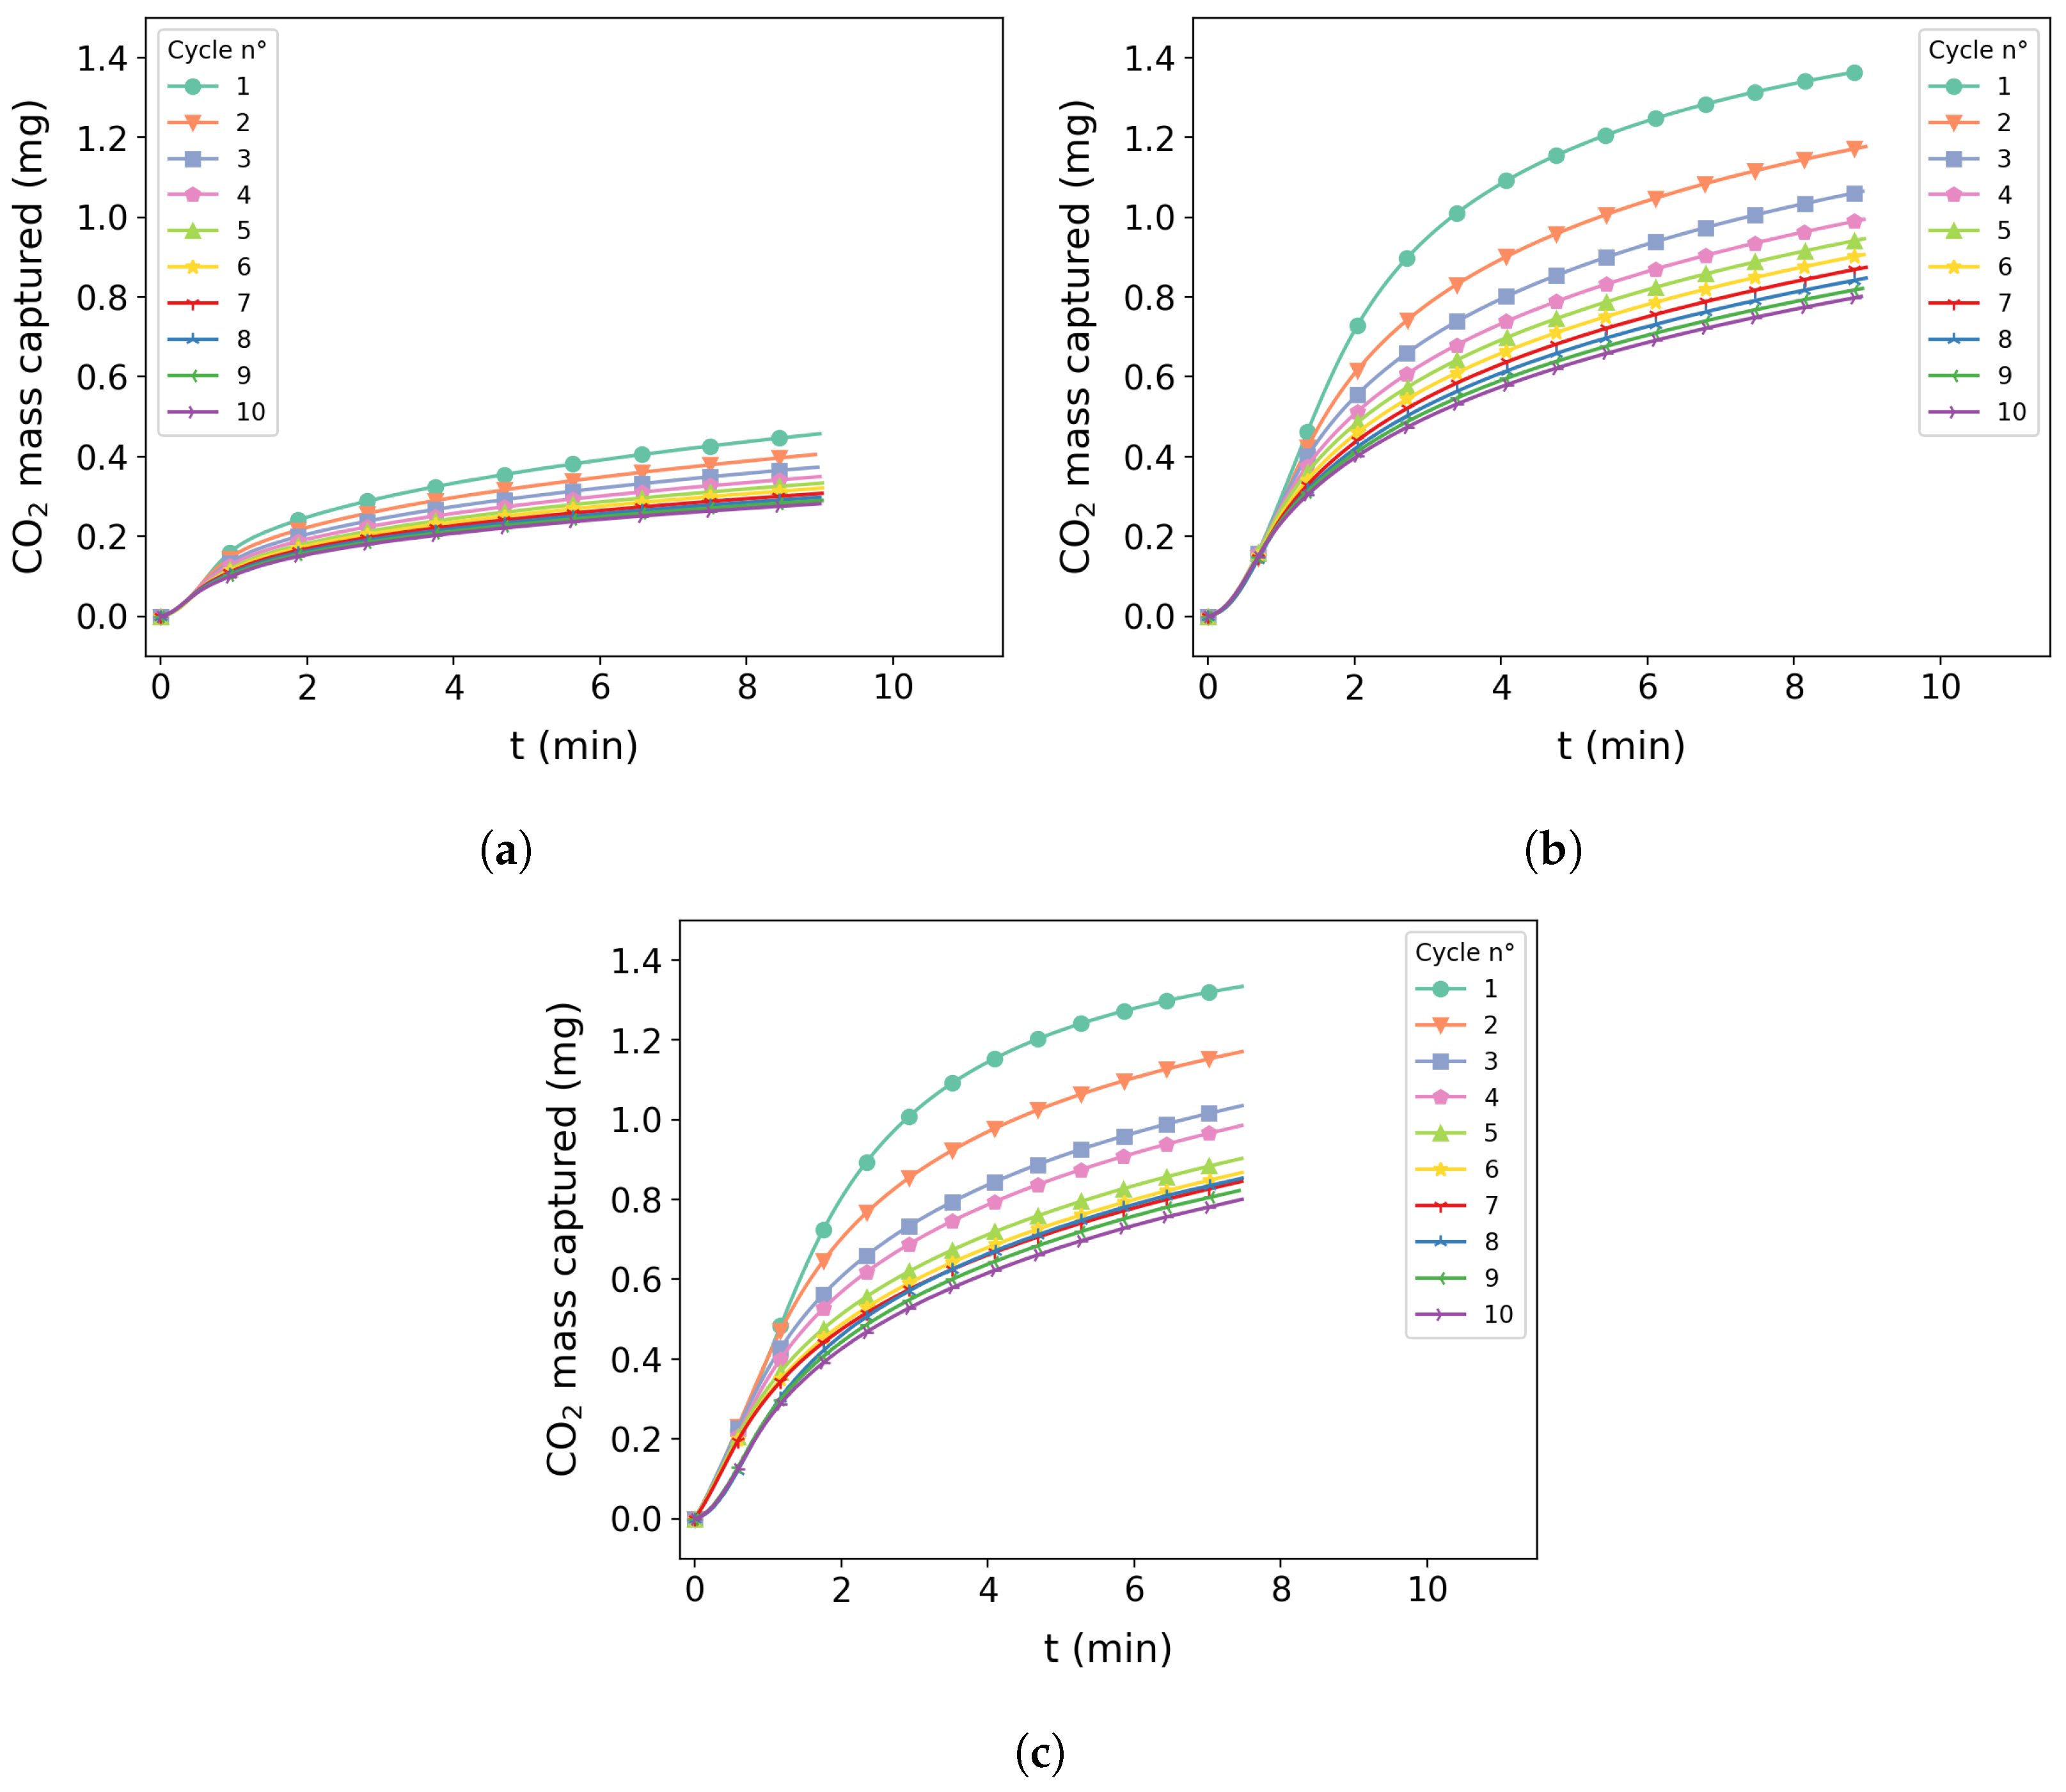
The tests at 370 and 400 °C are unsuitable for real-world applications, due to their extremely low mass capture. Figure 10a supports this observation, showing that despite having achieved low capture capacity, the deactivation effect remained significant, even at reduced temperatures. This effect alone rules out the possibility of improving the number of cycles through reduced temperatures, which might have been beneficial, considering the emissions associated with transporting make-up dolomite. Instead, the findings suggest that operating conditions with higher capture capacities and shorter residence times could be more emission-efficient, even if they increase the material make-up ratio. However, confirming this hypothesis would require further investigation on a large-scale fluidized bed, considering factors such as particle fragmentation and the net emissions of the process. Figure 12c shows an intact surface with few temperature cycling marks resembling natural dolomite [60,61,62], which might indicate that a larger particle was unable to react, due to low temperature. This mechanism is attributed to the amount of defects associated with smaller particle size, which reduces the temperature necessary for the reaction [59], i.e., carbonation. When dealing with open particle size samples in calcium looping, it seems pertinent to maintain a carbonation temperature high enough to allow most particles to react.
The 475 °C samples showed similar capture performance and energy efficiency, as in Figure 9. The presented cycles were in agreement, both regarding the amount of CO2 capture and the deterioration between cycles. Figure 12a,b do not show apparent differences that might have been caused by longer carbonation times. However, from the perspective of elutriation, it is possible that shorter residence time favored the test in a fluidized bed application. When analyzed from the perspective of an interrupted cycle, no evidence of improved capture capacity was observed, as both samples exhibited a similar degradation pattern and C O 2 c a p .
The samples at 580 °C and 550 °C showed the best C O 2 c a p results, which, given the uncertainties, presented the same C O 2 c a p value and energy efficiency for the RCCD experiments, respectively. The surface shown by Figure 12e has an uneven appearance without sharp corners, unlike the other images. If compared to Figure 12d, the surface of Figure 10c shows fewer irregularities, appearing to be more deteriorated. The sample at 580 ºC with 10 cycles was the only one showing signs of sintering by a visual analysis.
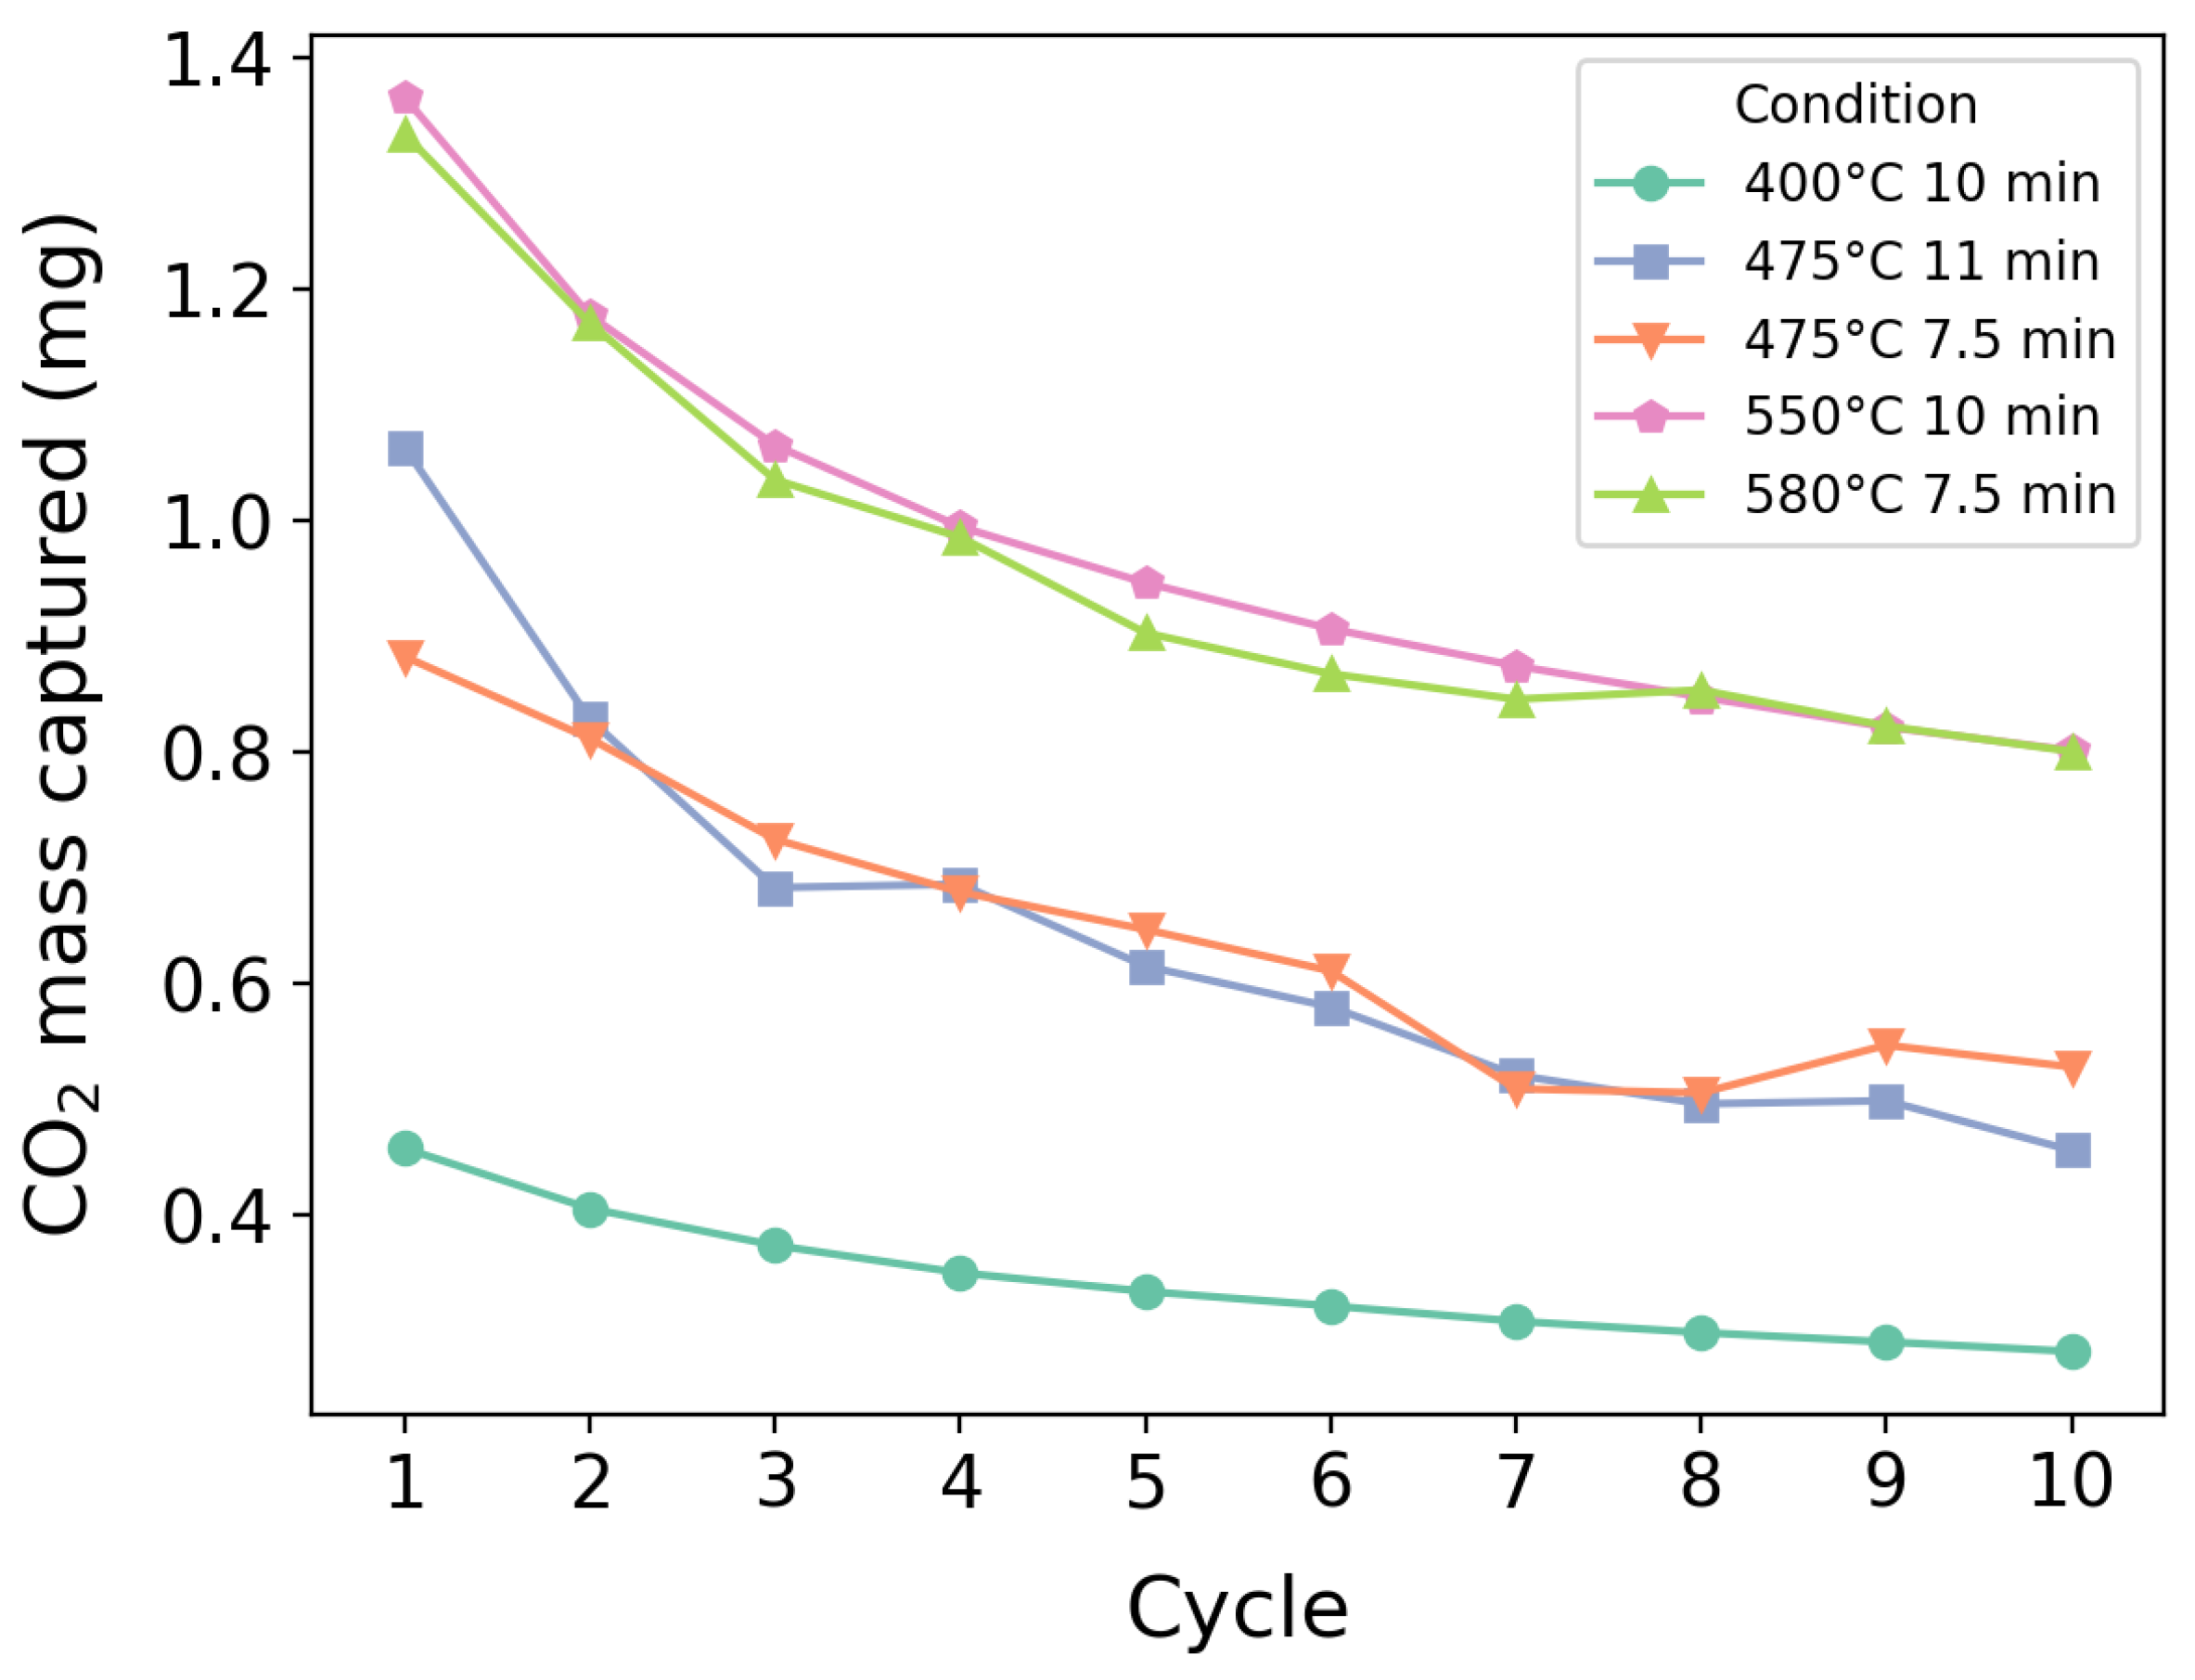
When analyzed solely by C O 2 c a p , Figure 11 exhibits a characteristic decay curve of deactivating limestone/dolomite, which is consistent with the findings in the literature [63,64,65], including studies conducted on setups of different scales [26]. Temperature appeared to influence degradation, as lower-temperature curves exhibited a smoother transition from the initial high-capacity cycle to a steady deactivated state. However, this effect was negligible compared to the overall loss of capture capacity due to temperature differences. Notably, even at the tenth cycle, higher-temperature conditions still achieved greater capture efficiency than the first cycle under lower-temperature conditions.
These results, along with Table 7, suggest that while an optimal zone may have been identified in the initial analysis, a multi-cycle perspective indicates that the most effective strategy for CO 2 capture is to operate at the highest-possible temperature without inducing calcination. However, such a conclusion requires validation in larger-scale setups, as the shape of the deactivation curve may be influenced by increased carbon capture as well as elutriation and fragmentation effects due to fluidization [66,67].
Regarding residence time, longer residence makes a relevant impact on the total energy spent when compared to temperature, and this impact is related to the carbonation reaction. This result emphasizes that residence time must be found using others means [68]. Although increasing residence time enhances the efficiency of carbon capture following the fast reaction phase, the most efficient conditions appear to result from an optimal combination of carbonation temperature and residence time. Both parameters influence surface degradation and elutriation [56,57,69], which, in turn, impacts the requirement for the make-up material in the reactor, contributing to additional emissions from its transport and preparation.
One factor contributing to a high value of IEC for elevated temperatures in this experimental configuration was the fact that the majority of the process energy was spent in the calcination stage. Thus, the energy required to heat up to 800 °C from 580 °C was lower than in other conditions; therefore, it had the lowest energy consumption among all the conditions. This suggests the need to repeat this analysis on dual fluidized beds, which are commonly used configurations in calcium looping plants.

5. Conclusions

The optimization of the CaL process using Brazilian dolomite in low-CO2-concentration flue gas, such as that from a natural gas thermoelectric plant, has promising potential for efficient CO2 capture within Brazil’s energy production matrix. The investigated dolomite showed good performance in CO 2 capture in a TGA setup. However, further studies using fluidized bed reactors should be conducted to evaluate its behavior on a larger, more industrially relevant scale. Such studies would provide a better representation of energy consumption, sorbent elutriation and sintering effects that could influence performance over a longer number of cycles. Within the scope of this work, the following results were found:
  • Even though the energy consumed during the process was accounted for, temperature remained the most critical factor affecting carbon capture, given that higher temperatures demonstrated greater energy efficiency in this particular setup. As for the RCCD design, the optimal conditions were 580 °C for 7.5 min (IEC = 0.89), 550 °C for 10 min (IEC = 1.01), and 475 °C for both 11 min (IEC = 0.83) and 7.5 min (IEC = 0.88). Among these, there was less surface damage at 475 °C compared to 580 °C and 550 °C. However, in multi-cycle tests, there was greater performance at 580 °C for 7.5 min and 550 °C for 10 min, since IEC 10 , c values of 1.34 and 1.20 were found, respectively—a 40% improvement over the conditions at 475 °C. In this case, the best result of this analysis was at 580 °C for 7.5 min, presenting lower E s p (33.48 kJ) and almost the same CO 2 c a p as test 550 °C. However, for a scale-up application, 550 °C for 10 min appeared to be a more suitable condition, as it demonstrated good performance ( E s p of 37.97 kJ) and CO 2 c a p of 9.80 mg) and no signs of sintering were observed on the surface, which might enhance its feasibility in a fluidized bed system.
  • Residence time had a substantial impact on the overall energy consumption, where 3.5 min per cycle had an increase of 8% of total energy spent during the 475 °C multi-cycle tests, underscoring the importance of identifying an optimal balance to maximize net carbon capture efficiency.
  • The variability of composition and particle size associated with the selected Brazilian dolomite was of critical importance, due to replicability difficulties. Tests using this type of dolomite should be carried out, preferably in narrow particle size ranges and larger quantities of mass.
  • Higher temperatures (>475 °C) had a significant impact on the surface degradation of the dolomite, whereas residence time appeared to have a minimal effect.
  • The deactivation curves presented in this work showed no signs of interaction between partial carbonation and variations in deactivation performance when compared to the literature data, as all conditions exhibited the expected decay curve shape. However, a further study comparing complete and partial carbonation should be carried out, to confirm this hypothesis.

Author Contributions

R.C.T.: conceptualization, methodology, software, investigation, data curation, writing—original draft, writing—review and editing; C.L.d.M.: writing—original draft, visualization, investigation, data curation, software; V.T.: methodology, visualization, investigation; J.A.d.C.J.: supervision, funding acquisition, project administration; I.A.: supervision, funding acquisition, project administration, writing—review and editing, conceptualization. All authors have read and agreed to the published version of the manuscript.

Funding

This study was financed by the Coordination for Higher Education Staff Development (CAPES)—process 1681464 and 88881.361902/2019-01; the National Petroleum, Natural Gas and Biofuels Agency (ANP)—process 48610.200793/2019-21 PRH-ANP 34.1.; the São Paulo Research Foundation (FAPESP)—process 2024/11098-6; and the National Council for Scientific and Technological Development (CNPq)—processes 315630/2021-3 and 406351/2023-6.

Data Availability Statement

The original data presented in the study are openly available in Zenodo at https://doi.org/10.5281/zenodo.13918153.

Acknowledgments

The authors are thankful to Laboratory of Surface Characterization (LCS-LAIMat) and Rogério Hein for their support on SEM analysis and discussion. We also thank the Calcário Diamante Company for their donation of dolomite supplies and Central de Análises Químicas Instrumentais (CAQI) from the Chemistry Institute (EESC/USP) for the XRF analysis.

Conflicts of Interest

The authors declare no conflicts of interest.

Abbreviations

The following abbreviations are used in this manuscript:
ANOVAanalysis of variance
CaLcalcium looping
CCUScarbon capture, utilization, and storage
GHGgreenhouse gases
NGCCnatural gas combined cycle
RCCDrotatable central composite design
SAMscanning electrons microscopy
TGAthermogravimetric analysis
XRFX-Ray fluorescence

Symbol Index

The following symbols are used in this manuscript:
CO 2 c a p CO 2 mass captured (mg)
CO 2 c a p , n CO 2 mass captured normalized by the maximum value (—)
E s p Energy spent (kJ)
E s p , n Energy spent normalized by the maximum value (—)
kNumber of factors (—)
tResidence time (min)
TCarbonation temperature (°C)
IECIndex of capture efficiency (—)
IEC 10 , c Ten-cycles index of capture efficiency (—)
Subscripts
cNumber of cycles
maxHighest value

References

  1. Summary for Policymakers. Climate Change 2023: Synthesis Report.Contribution of Working Groups I, II and III to the Sixth Assessment Report of the Intergovernmental Panel on Climate Change; IPCC: Geneva, Switzerland, 2023; pp. 1–34. [Google Scholar] [CrossRef]
  2. Shah, I.H.; Manzoor, M.A.; Jinhui, W.; Li, X.; Hameed, M.K.; Rehaman, A.; Li, P.; Zhang, Y.; Niu, Q.; Chang, L. Comprehensive review: Effects of climate change and greenhouse gases emission relevance to environmental stress on horticultural crops and management. J. Environ. Manag. 2024, 351, 119978. [Google Scholar] [CrossRef]
  3. Filonchyk, M.; Peterson, M.P.; Zhang, L.; Hurynovich, V.; He, Y. Greenhouse gases emissions and global climate change: Examining the influence of CO2, CH4, and N2O. Sci. Total Environ. 2024, 935, 173359. [Google Scholar] [CrossRef]
  4. Bolan, S.; Padhye, L.P.; Jasemizad, T.; Govarthanan, M.; Karmegam, N.; Wijesekara, H.; Amarasiri, D.; Hou, D.; Zhou, P.; Biswal, B.K.; et al. Impacts of climate change on the fate of contaminants through extreme weather events. Sci. Total Environ. 2024, 909, 168388. [Google Scholar] [CrossRef]
  5. Kabir, M.; Habiba, U.E.; Khan, W.; Shah, A.; Rahim, S.; De los Rios-Escalante, P.R.; Farooqi, Z.U.R.; Ali, L.; Shafiq, M. Climate change due to increasing concentration of carbon dioxide and its impacts on environment in 21st century; a mini review. J. King Saud-Univ.-Sci. 2023, 35, 102693. [Google Scholar] [CrossRef]
  6. Godde, C.M.; Mason-D’Croz, D.; Mayberry, D.E.; Thornton, P.K.; Herrero, M. Impacts of climate change on the livestock food supply chain; a review of the evidence. Glob. Food Secur. 2021, 28, 100488. [Google Scholar] [CrossRef]
  7. Davamani, V.; John, J.E.; Poornachandhra, C.; Gopalakrishnan, B.; Arulmani, S.; Parameswari, E.; Santhosh, A.; Srinivasulu, A.; Lal, A.; Naidu, R. A critical review of climate change impacts on groundwater resources: A focus on the current status, future possibilities, and role of simulation models. Atmosphere 2024, 15, 122. [Google Scholar] [CrossRef]
  8. CLEVER. Creating Legitimate Emission Factors for Verified GHG Emission Reductions in Transport. 2024. Available online: https://cordis.europa.eu/project/id/101146908 (accessed on 11 June 2024).
  9. CoSense4Climate. Compressed Sensing for Climate: A Novel Approach to Localize, Quantify and Characterize Urban Greenhouse Gas Emitters. 2024. Available online: https://cordis.europa.eu/project/id/101089203 (accessed on 23 April 2025).
  10. SOCRATCES. SOlar Calcium-Looping Integration for Thermo-Chemical Energy Storage. 2022. Available online: https://cordis.europa.eu/project/id/727348 (accessed on 26 July 2022).
  11. CLEANKER. CLEAN clinKER Production by Calcium Looping Process. 2022. Available online: https://cordis.europa.eu/project/id/764816 (accessed on 26 July 2022).
  12. Natural Resources Canada. Carbon Capture, Utilization, and Storage (CCUS). 2022. Available online: https://natural-resources.canada.ca/energy-sources/carbon-management (accessed on 23 April 2025).
  13. Arce, G.L.; Neto, T.G.; Ávila, I.; Luna, C.M.; dos Santos, J.C.; Carvalho, J.A., Jr. Influence of physicochemical properties of Brazilian serpentinites on the leaching process for indirect CO2 mineral carbonation. Hydrometallurgy 2017, 169, 142–151. [Google Scholar] [CrossRef]
  14. Chu, H.; Huang, Z.; Zhang, Z.; Yan, X.; Qiu, B.; Xu, N. Integration of carbon emission reduction policies and technologies: Research progress on carbon capture, utilization and storage technologies. Sep. Purif. Technol. 2024, 343, 127153. [Google Scholar] [CrossRef]
  15. Dziejarski, B.; Krzyżyńska, R.; Andersson, K. Current status of carbon capture, utilization, and storage technologies in the global economy: A survey of technical assessment. Fuel 2023, 342, 127776. [Google Scholar] [CrossRef]
  16. Del Duca, V.; Ponsiglione, C.; Primario, S.; Strazzullo, S. Towards Economic, Environmental, and Societal Sustainable World: Reviewing the Interplay of Methodologies, Variables, and Impacts in Energy Transition Models. J. Clean. Prod.n 2024, 479, 144074. [Google Scholar] [CrossRef]
  17. Shah, K.J.; Pan, S.Y.; Lee, I.; Kim, H.; You, Z.; Zheng, J.M.; Chiang, P.C. Green transportation for sustainability: Review of current barriers, strategies, and innovative technologies. J. Clean. Prod. 2021, 326, 129392. [Google Scholar] [CrossRef]
  18. AgenciaGov. Redução da Emissão de Gases de Efeito Estufa: Compromisso com o Planeta. 2024. Available online: https://agenciagov.ebc.com.br/noticias/202404/reducao-da-emissao-de-gases-de-efeito-estufa-compromisso-com-o-planeta (accessed on 11 July 2024).
  19. Observatório do Clima. Análise das Emissões Gases de Efeito Estufa e Suas Implicações Para as Metas Climáticas do Brasil 1970–2022. 2023. Available online: https://seeg.eco.br/wp-content/uploads/2024/02/SEEG11-RELATORIO-ANALITICO.pdf (accessed on 11 July 2024).
  20. EPE. Empresa de Pesquisa Energética—Relatório Síntese. 2024. Available online: https://www.gov.br/mme/pt-br/assuntos/secretarias/sntep/publicacoes/plano-decenal-de-expansao-de-energia/pde-2029-a-2021/pde-2024/plano-decenal-de-expansao-de-energia-pde-2024.pdf/view (accessed on 11 April 2024).
  21. ARSPESP. Agência Reguladora de Serviços Públicos do Estado de São Paulo. 2024. Available online: https://www.arsesp.sp.gov.br/Paginas/gas/gas-canalizado.aspx (accessed on 23 April 2024).
  22. FIRJAN. Federação das Indústrias do Estado do Rio de Janeiro. 2024. Available online: https://www.firjan.com.br/lumis/portal/file/fileDownload.jsp?fileId=2C908A8A7D159ABE017D6D4AE7CF2987 (accessed on 23 April 2024).
  23. FIEB. Federação das Indústrias do Estado da Bahia. 2024. Available online: https://www.fieb.org.br/wp-content/uploads/2021/01/Estudo-de-Petroleo-e-Gas_id_411__x1a669897e2e141888c87d9fa0b7a3dd9_08052019101642_.pdf (accessed on 23 April 2024).
  24. Yi Yuan, Y.L.; Zhao, J. Development on Thermochemical Energy Storage Based on CaO-Based Materials: A Review. Biosci. J. 2018, 10, 2660. [Google Scholar] [CrossRef]
  25. Diego, M.; Arias, B. Impact of load changes on the carbonator reactor of a 1.7 MWth calcium looping pilot plant. Fuel Process. Technol. 2020, 200, 106307. [Google Scholar] [CrossRef]
  26. Coppola, A.; Scala, F.; Salatino, P.; Montagnaro, F. Fluidized bed calcium looping cycles for CO2 capture under oxy-firing calcination conditions: Part 1. Assessment of six limestones. Chem. Eng. J. 2013, 231, 537–543. [Google Scholar] [CrossRef]
  27. Blamey, J.; Al-Jeboori, M.J.; Manovic, V.; Fennell, P.S.; Anthony, E.J. CO2 capture by calcium aluminate pellets in a small fluidized bed. Fuel Process. Technol. 2016, 142, 100–106. [Google Scholar] [CrossRef]
  28. Zhang, W.; Li, Y.; Duan, L.; Ma, X.; Wang, Z.; Lu, C. Attrition behavior of calcium-based waste during CO2 capture cycles using calcium looping in a fluidized bed reactor. Chem. Eng. Res. Des. 2016, 109, 806–815. [Google Scholar] [CrossRef]
  29. Antzara, A.N.; Arregi, A.; Heracleous, E.; Lemonidou, A.A. In-depth evaluation of a ZrO2 promoted CaO-based CO2 sorbent in fluidized bed reactor tests. Chem. Eng. J. 2018, 333, 697–711. [Google Scholar] [CrossRef]
  30. Coppola, A.; Esposito, A.; Montagnaro, F.; Iuliano, M.; Scala, F.; Salatino, P. The combined effect of H2O and SO2 on CO2 uptake and sorbent attrition during fluidised bed calcium looping. Proc. Combust. Inst. 2019, 37, 4379–4387. [Google Scholar] [CrossRef]
  31. Hilz, J.; Helbig, M.; Haaf, M.; Daikeler, A.; Ströhle, J.; Epple, B. Long-term pilot testing of the carbonate looping process in 1 MWth scale. Fuel 2017, 210, 892–899. [Google Scholar] [CrossRef]
  32. Papalas, T.; Antzaras, A.N.; Lemonidou, A.A. Evaluation of calcium-based sorbents derived from natural ores and industrial wastes for high-temperature CO2 capture. Ind. Eng. Chem. Res. 2020, 59, 9926–9938. [Google Scholar] [CrossRef]
  33. Zang, P.; Tang, J.; Zhang, X.; Cui, L.; Chen, J.; Zhao, P.; Dong, Y. Strategies to improve CaO absorption cycle stability and progress of catalysts in Ca-based DFMs for integrated CO2 capture-conversion: A critical review. J. Environ. Chem. Eng. 2023, 11, 111047. [Google Scholar] [CrossRef]
  34. Erans, M.; Manovic, V.; Anthony, E.J. Calcium looping sorbents for CO2 capture. Appl. Energy 2016, 180, 722–742. [Google Scholar] [CrossRef]
  35. Chen, J.; Duan, L.; Sun, Z. Review on the development of sorbents for calcium looping. Energy Fuels 2020, 34, 7806–7836. [Google Scholar] [CrossRef]
  36. Lisbona, P.; Martinez, A.; Lara, Y.; Romeo, L.M. Integration of carbonate CO2 capture cycle and coal-fired power plants. A comparative study for different sorbents. Energy Fuels 2010, 24, 728–736. [Google Scholar] [CrossRef]
  37. Symonds, R.T.; Champagne, S.; Ridha, F.N.; Lu, D.Y. CO2 capture performance of CaO–based pellets in a 0.1 MWth pilot-scale calcium looping system. Powder Technol. 2016, 290, 124–131. [Google Scholar] [CrossRef]
  38. Grasa, G.; Abanades, J.C.; Anthony, E.J. Effect of partial carbonation on the cyclic CaO carbonation reaction. Ind. Eng. Chem. Res. 2009, 48, 9090–9096. [Google Scholar] [CrossRef]
  39. Rodríguez, N.; Alonso, M.; Abanades, J. Average activity of CaO particles in a calcium looping system. Chem. Eng. J. 2010, 156, 388–394. [Google Scholar] [CrossRef]
  40. Liu, W.; González, B.; Dunstan, M.T.; Sultan, D.S.; Pavan, A.; Ling, C.D.; Grey, C.P.; Dennis, J. Structural evolution in synthetic, Ca-based sorbents for carbon capture. Chem. Eng. Sci. 2016, 139, 15–26. [Google Scholar] [CrossRef]
  41. Afandi, N.; Satgunam, M.; Mahalingam, S.; Manap, A.; Nagi, F.; Liu, W.; Johan, R.B.; Turan, A.; Tan, A.W.Y.; Yunus, S. Review on the modifications of natural and industrial waste CaO based sorbent of calcium looping with enhanced CO2 capture capacity. Heliyon 2024, 10, e27119. [Google Scholar] [CrossRef]
  42. Rodrigues, D.; Pinheiro, C.; Filipe, R.; Mendes, L.; Matos, H. Optimization of an improved calcium-looping process for thermochemical energy storage in concentrating solar power plants. J. Energy Storage 2023, 72, 108199. [Google Scholar] [CrossRef]
  43. Alovisio, A.; Chacartegui, R.; Ortiz, C.; Valverde, J.; Verda, V. Optimizing the CSP-calcium looping integration for thermochemical energy storage. Energy Convers. Manag. 2017, 136, 85–98. [Google Scholar] [CrossRef]
  44. Wu, W.; Chen, S.C.; Kuo, P.C.; Chen, S.A. Design and optimization of stand-alone triple combined cycle systems using calcium looping technology. J. Clean. Prod. 2017, 140, 1049–1059. [Google Scholar] [CrossRef]
  45. Allen, T. Particle Size Measurement; Chapman & Hall: London, UK, 1997. [Google Scholar]
  46. Lott, P.; Casapu, M.; Grunwaldt, J.D.; Deutschmann, O. Exhaust gas after-treatment of lean-burn natural gas engines–from fundamentals to application. Appl. Catal. Environ. 2023, 340, 123241. [Google Scholar] [CrossRef]
  47. Qureshi, Y.; Ali, U.; Sher, F. Part load operation of natural gas fired power plant with CO2 capture system for selective exhaust gas recirculation. Appl. Therm. Eng. 2021, 190, 116808. [Google Scholar] [CrossRef]
  48. Díaz-Herrera, P.R.; Alcaraz-Calderón, A.M.; González-Díaz, M.O.; González-Díaz, A. Capture level design for a natural gas combined cycle with post-combustion CO2 capture using novel configurations. Energy 2020, 193, 116769. [Google Scholar] [CrossRef]
  49. Dutta, R.; Nord, L.O.; Bolland, O. Selection and design of post-combustion CO2 capture process for 600 MW natural gas fueled thermal power plant based on operability. Energy 2017, 121, 643–656. [Google Scholar] [CrossRef]
  50. Campanari, S.; Manzolini, G.; Chiesa, P. Using MCFC for high efficiency CO2 capture from natural gas combined cycles: Comparison of internal and external reforming. Appl. Energy 2013, 112, 772–783. [Google Scholar] [CrossRef]
  51. Sipöcz, N.; Tobiesen, F.A. Natural gas combined cycle power plants with CO2 capture–Opportunities to reduce cost. Int. J. Greenh. Gas Control 2012, 7, 98–106. [Google Scholar] [CrossRef]
  52. Amrollahi, Z.; Ertesvåg, I.S.; Bolland, O. Thermodynamic analysis on post-combustion CO2 capture of natural-gas-fired power plant. Int. J. Greenh. Gas Control 2011, 5, 422–426. [Google Scholar] [CrossRef]
  53. Colorado, A.; Herrera, B.; Amell, A. Performance of a flameless combustion furnace using biogas and natural gas. Bioresour. Technol. 2010, 101, 2443–2449. [Google Scholar] [CrossRef]
  54. Friedman, J.; Li, H. Natural gas combustion in a fluidized bed heat-treating furnace. Combust. Sci. Technol. 2005, 177, 2211–2241. [Google Scholar] [CrossRef]
  55. Blamey, J.; Anthony, E.; Wang, J.; Fennell, P. The calcium looping cycle for large-scale CO2 capture. Prog. Energy Combust. Sci. 2010, 36, 260–279. [Google Scholar] [CrossRef]
  56. Charitos, A.; Hawthorne, C.; Bidwe, A.; Sivalingam, S.; Schuster, A.; Spliethoff, H.; Scheffknecht, G. Parametric investigation of the calcium looping process for CO2 capture in a 10 kWth dual fluidized bed. Int. J. Greenh. Gas Control 2010, 4, 776–784. [Google Scholar] [CrossRef]
  57. Duelli, G.; Charitos, A.; Diego, M.E.; Stavroulakis, E.; Dieter, H.; Scheffknecht, G. Investigations at a 10 kWth calcium looping dual fluidized bed facility: Limestone calcination and CO2 capture under high CO2 and water vapor atmosphere. Int. J. Greenh. Gas Control 2015, 33, 103–112. [Google Scholar] [CrossRef]
  58. Rouchon, L.; Favergeon, L.; Pijolat, M. Analysis of the kinetic slowing down during carbonation of CaO by CO2. J. Therm. Anal. Calorim. 2013, 113, 1145–1155. [Google Scholar] [CrossRef]
  59. Valverde, J.; Sanchez-Jimenez, P.; Perez-Maqueda, L.A. Relevant influence of limestone crystallinity on CO2 capture in the Ca-looping technology at realistic calcination conditions. Environ. Sci. Technol. 2014, 48, 9882–9889. [Google Scholar] [CrossRef]
  60. Medina-Carrasco, S.; Valverde, J.M. The Calcium Looping process for energy storage: Insights from in situ XRD analysis. Chem. Eng. J. 2022, 429, 132244. [Google Scholar] [CrossRef]
  61. Su, Y.; Han, R.; Gao, J.; Wei, S.; Sun, F.; Zhao, G. Novel method for regeneration/reactivation of spent dolomite-based sorbents from calcium looping cycles. Chem. Eng. J. 2019, 360, 148–156. [Google Scholar] [CrossRef]
  62. Sánchez-Jiménez, P.E.; Valverde, J.M.; Perejón, A.; de la Calle, A.; Medina, S.; Pérez-Maqueda, L.A. Influence of ball milling on CaO crystal growth during limestone and dolomite calcination: Effect on CO2 capture at calcium looping conditions. Cryst. Growth Des. 2016, 16, 7025–7036. [Google Scholar] [CrossRef]
  63. Lo Conte, S.; Murmura, M.A.; Fratini, F.; Cerbelli, S.; Lanchi, M.; Spadoni, A.; Turchetti, L.; Annesini, M.C. Calcium looping for thermochemical storage: Assessment of intrinsic reaction rate and estimate of kinetic/transport parameters for synthetic CaO/mayenite particles from TGA data. Ind. Eng. Chem. Res. 2023, 62, 16647–16659. [Google Scholar] [CrossRef]
  64. Valverde, J.; Sanchez-Jimenez, P.E.; Perez-Maqueda, L.A. Calcium-looping for post-combustion CO2 capture. On the adverse effect of sorbent regeneration under CO2. Appl. Energy 2014, 126, 161–171. [Google Scholar] [CrossRef]
  65. Valverde, J.; Sanchez-Jimenez, P.; Pérez-Maqueda, L.A. Ca-looping for postcombustion CO2 capture: A comparative analysis on the performances of dolomite and limestone. Appl. Energy 2015, 138, 202–215. [Google Scholar] [CrossRef]
  66. Coppola, A.; Montagnaro, F.; Scala, F.; Salatino, P. Impact fragmentation of limestone-based sorbents for calcium looping: The effect of steam and sulphur dioxide. Fuel Process. Technol. 2020, 208, 106499. [Google Scholar] [CrossRef]
  67. Coppola, A.; Scala, F.; Itskos, G.; Grammelis, P.; Pawlak-Kruczek, H.; Antiohos, S.K.; Salatino, P.; Montagnaro, F. Performance of natural sorbents during calcium looping cycles: A comparison between fluidized bed and thermo-gravimetric tests. Energy Fuels 2013, 27, 6048–6054. [Google Scholar] [CrossRef]
  68. Perejón, A.; Miranda-Pizarro, J.; Pérez-Maqueda, L.A.; Valverde, J.M. On the relevant role of solids residence time on their CO2 capture performance in the Calcium Looping technology. Energy 2016, 113, 160–171. [Google Scholar] [CrossRef]
  69. Tregambi, C.; Salatino, P.; Solimene, R.; Montagnaro, F. An experimental characterization of Calcium Looping integrated with concentrated solar power. Chem. Eng. J. 2018, 331, 794–802. [Google Scholar] [CrossRef]
Figure 1. Total Brazilian natural gas consumption in 2015, 2019, and 2024 classified by region. Adapted from [20].
Energies 18 02285 g001
Figure 2. Dolomite particle size distribution.
Energies 18 02285 g002
Figure 3. Schematic representation of the experimental configuration.
Energies 18 02285 g003
Figure 4. Brazilian dolomite representation of the three stages of carbon capture. Region I represents the fast chemical reaction. Region II is saturation and transition to Region III, where diffusion takes over the process.
Energies 18 02285 g004
Figure 5. CaL cycle of the Brazilian dolomite used to show m c a l c , m c a r b , and residence time (t). Calcination temperature: 800 °C. Carbonation temperature: 550 °C. Heating rate of 10 °C/min. Residence time of 10 min. Atmosphere: 100 mL/min—4% CO 2 balance synthetic air for carbonation.
Energies 18 02285 g005
Figure 6. CaL multi-cycle of the Brazilian dolomite used to show m c a l c , m c a r b , and the first cycle magnitude difference. Calcination temperature: 800 °C. Carbonation temperature: 580 °C. Heating rate of 20 °C/min. Residence time of 7.5 min. Atmosphere: 100 mL/min—4% CO 2 balance synthetic air for carbonation.
Energies 18 02285 g006
Figure 7. Response surface plot for the proposed RCCD model, Equation (12).
Energies 18 02285 g007
Figure 8. Surface plot contour lines for the proposed RCCD model, Equation (12).
Energies 18 02285 g008
Figure 9. Ten-cycle reaction of 475 °C samples: (a) test 5 for carbonation at 475 °C and residence time of 7.5 min; (b) test 10 for carbonation at 475 °C and residence time of 11 min.
Energies 18 02285 g009
Figure 10. Ten-cycle reaction at 400 °C, 550 °C, and 580 °C at a given carbonation time: (a) test 1 was carbonated at 400 °C for 10 min; (b) test 4 was carbonated at 550 °C for 10 min; (c) test 12 was carbonated at 580 °C and residence time of 7.5 min.
Energies 18 02285 g010
Figure 11. Deactivation curves corresponding to the tests presented in Table 7.
Energies 18 02285 g011
Figure 12. SEM images of all multi-cycle samples: (a) Test 5—475 °C and 7.5 min; (b) test 10—475 °C and 11 min; (c) test 2—400 °C and 10 min; (d) test 4—550 °C and 10 min; (e) test 12—580 °C and 7.5 min.
Energies 18 02285 g012
Figure 13. Oxide composition of white, gray, and dark gray particles present on dolomite.
Energies 18 02285 g013
Table 1. Elementary chemical composition of dolomite.
Chemical Composition (% Mass/Mass)
CaSiMgFeInSMnSr
57.5918.1517.223.601.400.910.840.28
Table 2. Instrument properties information.
InstrumentMeasurementRangeAccuracyResolution
SDT Q600Mass (mg)0–200±1.0% 0.1   μ g
Gas flow (mL/min)20–1000±2.0%1.0
GFC-17Gas flow (mL/min)0–50±1.0%f.s0.1
Table 3. RCCD matrix.
Test x 1 x 2 t (min)T (°C)
1−1−15400
2+1−110400
3−1+15550
4+1+110550
5007.5475
6007.5475
7007.5475
8007.5475
9−1.404475
10+1.4011475
110−1.47.5370
120+1.47.5580
Table 4. RCCD experimental results.
TesttT m calc m carb CO 2 cap E sp CO 2 cap , n E sp , n IEC
Unit[min][°C][mg][mg][mg][kJ][—][—][—]
154006.106.450.358.040.200.930.22
2104006.046.530.498.260.280.960.29
355506.046.990.958.160.550.950.58
4105505.907.621.728.521.000.991.01
57.54755.877.311.448.260.840.960.88
67.54755.877.181.318.290.760.960.79
77.54756.117.331.228.350.710.970.73
87.54755.827.191.378.290.800.960.83
944756.827.660.848.030.490.930.53
10114756.267.691.438.600.831.000.83
117.53706.336.660.338.140.190.950.20
127.55806.057.561.518.500.880.990.89
Table 5. ANOVA analysis of Equation (12).
SourceDFAdj. SSF-Valuep-Value
Model50.490521.470.001
Linear20.260528.450.001
   t10.068614.980.008
   T10.191941.910.001
Square20.197621.580.002
    t 2 10.046910.230.019
    T 2 10.150832.930.001
2-Way Int.10.03247.080.038
    t × T 10.03247.080.038
Error60.0275--
   Lack-of-Fit30.01541.280.423
   Pure Error30.0121--
Total110.5190--
Table 6. Uncertainty interval for each measured response variable.
ParameterAccuracy
E s p [kJ]±0.05
CO 2 c a p [mg]±0.13
E s p , n [—]±0.01
CO 2 c a p , n [—]±0.08
IEC [—]±0.09
Table 7. RCCD tests 2, 4, 5, 10, and 12 from Table 4 on 10 cycles of carbonation.
t [min]T [°C] CO 2 cap [mg] E sp [kJ] CO 2 cap , n [—] E sp , n [—] IEC 10 , c [—]
104003.4245.930.351.000.35
7.54756.4439.910.660.870.76
114756.4243.150.660.940.70
105509.8037.971.000.831.20
7.55809.6133.480.980.731.34
Disclaimer/Publisher’s Note: The statements, opinions and data contained in all publications are solely those of the individual author(s) and contributor(s) and not of MDPI and/or the editor(s). MDPI and/or the editor(s) disclaim responsibility for any injury to people or property resulting from any ideas, methods, instructions or products referred to in the content.

