Abstract
In the rapidly evolving landscape of transportation technologies, hydrogen vehicle networks integrated with photovoltaic (PV) systems represent a significant advancement toward sustainable mobility. However, the integration of such technologies also introduces complex cybersecurity challenges that must be meticulously managed to ensure operational integrity and system resilience. This paper explores the intricate dynamics of cybersecurity in PV-powered hydrogen vehicle networks, focusing on the real-time challenges posed by cyber threats such as False Data Injection Attacks (FDIAs) and their impact on network operations. Our research utilizes a novel hierarchical robust optimization model enhanced by Recursive Neural Networks (RNNs) to improve detection rates and response times to cyber incidents across various severity levels. The initial findings reveal that as the severity of incidents escalates from level 1 to 10, the response time significantly increases from an average of 7 min for low-severity incidents to over 20 min for high-severity scenarios, demonstrating the escalating complexity and resource demands of more severe incidents. Additionally, the study introduces an in-depth examination of the detection dynamics, illustrating that while detection rates generally decrease as incident frequency increases—due to system overload—the employment of advanced RNNs effectively mitigates this trend, sustaining high detection rates of up to 95% even under high-frequency scenarios. Furthermore, we analyze the cybersecurity risks specifically associated with the intermittency of PV-based hydrogen production, demonstrating how fluctuations in solar energy availability can create vulnerabilities that cyberattackers may exploit. We also explore the relationship between incident frequency, detection sensitivity, and the resulting false positive rates, revealing that the optimal adjustment of detection thresholds can reduce false positives by as much as 30%, even under peak load conditions. This paper not only provides a detailed empirical analysis of the cybersecurity landscape in PV-integrated hydrogen vehicle networks but also offers strategic insights into the deployment of AI-enhanced cybersecurity frameworks. The findings underscore the critical need for scalable, responsive cybersecurity solutions that can adapt to the dynamic threat environment of modern transport infrastructures, ensuring the sustainability and safety of solar-powered hydrogen mobility solutions.
1. Introduction
As the global energy landscape evolves towards more sustainable and environmentally friendly practices, hydrogen emerges as a pivotal player in the transformation of the transportation sector [1,2,3]. The integration of hydrogen vehicles (HVs) into our energy networks not only heralds a significant reduction in carbon emissions but also presents new challenges and vulnerabilities, particularly in the realm of cybersecurity [4,5]. This paper delves into the development of a hierarchical, deep learning-assisted robust optimization model tailored for enhancing the cyber resilience of hydrogen vehicle networks.
The motivation for this study is rooted in the unique position of hydrogen as a clean energy carrier, which can significantly impact the reduction in greenhouse gases and dependence on fossil fuels. However, the infrastructural and operational paradigms that govern hydrogen production, storage, and distribution are inherently susceptible to cyber–physical attacks. These vulnerabilities could potentially cripple the hydrogen supply to vehicles, thereby stalling the adoption of hydrogen-based transport solutions. Given the strategic importance of securing energy infrastructures, it is imperative to address these cybersecurity challenges to safeguard the continuous operation and reliability of hydrogen fueling stations and the broader network. This research is driven by the pressing need for robust security frameworks that can preempt, withstand, and quickly recover from multi-faceted cyberattacks. Traditional cybersecurity measures in energy systems often follow static, pre-defined rules that lack the adaptability required in the face of dynamic and sophisticated cyber threats. To bridge this gap, our approach utilizes a hierarchical robust optimization framework enhanced by deep learning techniques, specifically Recursive Neural Networks (RNNs), to dynamically predict and respond to cyber threats in real-time. This integration of machine learning with robust optimization not only facilitates a more reactive security posture but also supports proactive strategies that can adapt to evolving threats.
The integration of renewable energy sources, such as PV systems, with hydrogen-based energy transport networks has gained significant attention in recent years due to its potential in addressing global energy challenges and reducing carbon emissions [6]. However, as the reliance on decentralized and renewable energy sources increases, so too does the exposure of these systems to cyber threats [7]. PV-hydrogen transport networks are inherently vulnerable to a variety of cyberattacks, which can disrupt the flow of energy, compromise the safety of the system, and threaten the resilience of the critical infrastructure. While existing research has focused extensively on the cybersecurity of energy systems [8], much of this work has been centered around traditional, centralized grids and systems that lack the unique characteristics of PV-integrated hydrogen networks. These systems, which combine renewable energy generation with storage and transportation, present distinct challenges that are not fully addressed by current cybersecurity frameworks. The complexity of managing energy distribution, coupled with the intermittent nature of PV generation and the intricacies of hydrogen storage and transport, creates a unique environment where cyber threats can have amplified consequences. Moreover, while machine learning techniques have been explored for improving cybersecurity in general, the application of RNNs in enhancing the cyber resilience of PV-hydrogen transport networks remains largely underexplored. There is a significant gap in the literature regarding the use of advanced AI models, such as RNNs [9], to address the dynamic and evolving nature of cyber threats in such complex, decentralized systems. The need for models that can adapt in real-time to changing threat landscapes, while also optimizing the allocation of energy resources, presents an important research gap that this study aims to fill. This gap in existing research highlights the need for innovative approaches that not only focus on threat detection and mitigation but also optimize the operational and energy management aspects of these networks in the presence of cyber threats. This study aims to address these issues by proposing a hierarchical robust optimization framework integrated with RNNs, which can dynamically adjust to both cyber threats and fluctuating energy demand, thus improving the overall security and efficiency of PV-hydrogen transport systems. The development of such frameworks is crucial for ensuring the long-term sustainability and resilience of energy systems as they transition to more decentralized and renewable sources.
The novelty of this paper lies in its unique methodological approach which combines the strengths of hierarchical decision-making and advanced machine learning to create a cyber-resilient framework for hydrogen networks. Unlike conventional methods that typically address cybersecurity in a compartmentalized manner, our model treats the network as an interconnected system where decisions at one level affect the security outcomes at another. This holistic approach ensures that the security measures are comprehensive and coherent across the entire network, enhancing the overall resilience of the system. The specific contributions of this paper are manifold and significant in advancing the field of cybersecurity in hydrogen energy systems:
1. We propose a novel hierarchical robust optimization model that allows for multi-level decision-making, enabling the system to respond effectively at both local and network-wide levels. This model is designed to optimize the distribution and availability of hydrogen, ensuring operational continuity under various cyber threat scenarios.
2. By incorporating RNNs, our model gains the ability to predict potential cyberattacks based on historical and real-time data. This predictive capability is crucial for preempting attacks and dynamically adjusting security measures to mitigate any potential impact on the hydrogen distribution network.
3. The paper introduces cutting-edge adaptive robust optimization methods that adjust to changes in threat levels and system conditions in real-time. This adaptability enhances the system’s ability to maintain optimal operations under uncertainty, thus significantly reducing the possibility of service disruptions.
In summary, this paper presents a pioneering approach to securing hydrogen mobility through a robust, hierarchical optimization framework augmented by deep learning. This innovative integration addresses the dual challenges of operational efficiency and cybersecurity in hydrogen vehicle networks, setting a new benchmark for the development of secure, resilient, and sustainable hydrogen infrastructure. By ensuring the security and reliability of hydrogen energy systems, we pave the way for their broader adoption and integration into the global energy matrix, thus contributing to a more sustainable and environmentally friendly transportation ecosystem.
The remainder of this paper is organized as follows: Section 2 reviews the existing literature on cybersecurity challenges in PV-integrated hydrogen transport networks and the role of machine learning techniques in enhancing system resilience. Section 3 presents the mathematical formulation of the proposed optimization framework, focusing on Recursive Neural Networks (RNNs) for cybersecurity applications. Section 4 details the methodology of the study, explaining the hierarchical robust optimization framework and its integration with RNNs. Section 5 provides a comprehensive case study using real-world data to validate the performance of the proposed approach. Finally, Section 6 concludes the study and suggests potential directions for future research.
2. Literature Review
The burgeoning interest in hydrogen as a sustainable fuel source for transportation necessitates an equally robust focus on the cybersecurity of hydrogen infrastructure. The integration of HVs into energy systems introduces not only opportunities for reducing carbon emissions but also complex challenges, particularly in terms of cyber vulnerabilities [2,10]. This literature review critically examines existing research on hydrogen energy systems, cybersecurity in energy networks, robust optimization techniques, and the application of machine learning in cyber–physical security frameworks, establishing the context and identifying gaps that our research addresses.
Recent studies underscore the potential of hydrogen as a key enabler of low-carbon transport solutions. The literature highlights the rapid growth of hydrogen fueling infrastructure globally and the corresponding increase in complexity of the operational and management networks required [10,11]. However, as these networks become more interconnected and reliant on digital technologies, they become more susceptible to cyberattacks [12]. The vulnerabilities range from data breaches and denial of service (DoS) attacks to more sophisticated cyber–physical attacks that could cripple hydrogen production and distribution [13]. Recent studies emphasize the growing importance of hydrogen as a key enabler of low-carbon transportation, alongside the rapid expansion of hydrogen fueling infrastructure. One paper highlights the significant cybersecurity challenges faced by these networks, particularly as they become more reliant on digital technologies, increasing their vulnerability to cyberattacks, including data breaches and denial of service attacks [14]. Another study explores the potential consequences of cyber–physical attacks on hydrogen production facilities, stressing the need for robust security measures to prevent disruptions that could cripple hydrogen supply chains [15].
Robust optimization has been extensively explored in energy systems to handle uncertainties in supply and demand forecasts, renewable energy outputs, and market prices [16]. Robust optimization has been increasingly applied in energy systems to address uncertainties related to supply-demand forecasts, renewable energy outputs, and market prices [17,18]. One study emphasizes the use of robust optimization in optimizing the operation of energy storage systems within microgrids, where uncertainties in renewable energy generation are handled to maintain system stability and minimize costs. This approach not only enhances the reliability of energy supply but also ensures more efficient integration of renewable resources [19]. Another research effort focuses on developing a robust optimization model that effectively manages the variability in photovoltaic (PV) power outputs, demonstrating how such models can mitigate the risks associated with fluctuating renewable energy sources [20]. Additionally, robust optimization strategies have been applied to the design of hybrid microgrids, aiming to minimize the overall system costs while ensuring reliable power supply in the face of uncertain renewable energy availability, thus proving essential for sustainable energy system development [21]. These studies collectively underscore the critical role of robust optimization in improving the efficiency and reliability of modern energy systems amidst growing uncertainties. While these models provide frameworks for decision-making under uncertainty, they often do not fully integrate cybersecurity concerns, which are crucial for hydrogen networks.
The role of machine learning in enhancing cybersecurity measures has been well documented across various domains. Particularly, deep learning models like RNNs have shown promise in predicting and responding to cyber threats in real-time. These models leverage historical and real-time data to anticipate potential attack vectors and suggest preemptive actions [22,23]. Recent studies highlight the crucial role of machine learning, particularly deep learning models like RNNs, in enhancing cybersecurity measures across various domains. One study proposes a deep learning-based model for detecting cyberattacks in smart power systems, utilizing historical data from phasor measurement units (PMUs) to improve the accuracy of threat detection and response times. The model’s use of advanced feature selection techniques, such as Principal Component Analysis (PCA), significantly reduces data redundancy and enhances the model’s performance in real-time attack detection [24]. Another paper provides a comprehensive review of machine learning techniques for cybersecurity, comparing various models in terms of their effectiveness against threats like intrusion detection and malware. This study underscores the importance of selecting the appropriate machine learning technique based on the specific cybersecurity challenge, while also addressing the limitations and challenges of these approaches [25]. However, their application specifically in the context of hydrogen energy systems is scant, suggesting a novel area of application presented in this study.
The review of the literature indicates that while there is extensive research on robust optimization and machine learning for cybersecurity, less attention has been paid to integrating these techniques into a cohesive framework specifically tailored for hydrogen vehicle networks. Existing studies often overlook the dynamic and evolving nature of cyber threats, and lack mechanisms for real-time adaptation within energy-transport systems. Moreover, there remains a research gap in addressing the hierarchical structure of cyber–physical energy networks, where decision-making occurs across both local and global levels. These gaps highlight the need for advanced modeling approaches that can simultaneously account for structural complexity, data uncertainty, and rapid threat propagation in interconnected systems. In this context, a number of recent studies have explored AI-based solutions to enhance cybersecurity in energy and transport infrastructures. Convolutional Neural Networks (CNNs) have been widely adopted for spatial anomaly detection tasks [26], benefiting from their strong feature learning capabilities across sensor grids and communication structures. Long Short-Term Memory (LSTM) networks, which capture long-term temporal dependencies [27], have shown promise in intrusion detection applications where sequential data dominate, such as power system monitoring or SCADA control. RNNs, while less frequently applied, offer unique structural advantages in modeling hierarchical and interdependent temporal patterns. These characteristics make RNNs particularly well suited to cyber–physical systems with layered decision-making architectures, such as hydrogen vehicle networks, where both node-level response and system-wide coordination are required under real-time threat conditions. Our model is distinguished by its ability to dynamically adapt to changing threat landscapes and optimize responses at multiple decision-making levels. This approach not only improves the robustness of the network against cyberattacks but also ensures operational efficiency and reliability in the distribution of hydrogen.
To summarize the key findings and limitations from the reviewed literature, we provide a comparative summary in Table 1. This table organizes the key contributions of each study and highlights the gaps that remain, particularly in the context of cybersecurity for PV-integrated hydrogen transport networks. It is clear from the literature that while significant progress has been made, several challenges and research gaps persist, which our study aims to address.

Table 1.
Summary of literature on cybersecurity in PV-integrated hydrogen transport networks.
Table 1 presents a summary of the major findings and limitations from the reviewed studies. The “Key Findings” column summarizes the primary contributions of each paper, such as the application of machine learning to enhance cybersecurity or the development of resilience models. The “Limitations” column identifies the areas where the studies fall short, such as the lack of integration with real-time threat detection or the focus on specific sectors rather than broader PV-hydrogen transport systems. In particular, the choice of RNNs among various deep learning models is highlighted in several studies, as RNNs are well suited for processing sequential data and capturing long-term dependencies. While other deep learning models, such as CNNs and LSTM networks, have been used in cybersecurity applications, RNNs offer a simpler yet effective alternative for real-time threat detection. RNNs excel in scenarios where past events influence future outcomes, making them ideal for modeling cyber threats in dynamic and evolving environments like PV-hydrogen transport networks. This explains why RNNs were selected in our study as the deep learning model of choice.
3. Mathematical Modeling
The hierarchical robust optimization framework is developed to enhance the cyber-resilience of hydrogen vehicle networks. This approach integrates multiple optimization levels to effectively manage the distribution and availability of hydrogen across a network under cyber threat scenarios. In this context, cyber threats are categorized using a severity scale from 1 to 10, with severity level 1 representing minor threats such as low-level data manipulation, and severity level 10 corresponding to high-impact attacks such as large-scale DoS or FDI attacks. This categorization allows for the efficient allocation of resources and the design of adaptive strategies to mitigate risks based on the severity of the cyber incident:
The primary objective function aims to minimize the overall operational costs associated with hydrogen fuel distribution, where represents the cost of hydrogen production, and corresponds to the distribution costs at time t and scenario s, respectively:
The secondary objective function focuses on minimizing the maximum response time to cyberattacks across all potential threat scenarios , where denotes the delay in response at node i and indicates the required response time for scenario .
To extend the formulation in Equation (2), we introduce a severity-based response delay model to represent the impact of cyber threat intensity at each node:
where is the baseline response delay, represents the cyberattack severity at node k, and is a scaling coefficient. For example, if , , and , then min:
This equation imposes hydrogen production capacity constraints at each facility, ensuring that the production rate does not exceed the maximum allowable capacity .
To improve the realism of the production capacity constraint in Equation (3), we introduce a PV availability factor that adjusts output based on time-varying solar conditions:
Here, represents the time-dependent availability factor estimated from historical PV generation data. For instance, during overcast periods, may fall to 0.75, reducing the effective hydrogen production capacity by 25%:
Demand fulfillment constraints are specified to guarantee that the hydrogen supply from node i to node j meets or exceeds the demand at each vehicle station:
Inventory balance constraints for hydrogen storage are modeled, where represents the storage level at time t, and denote the inflow and outflow, and accounts for the leakage rate:
Routing constraints for hydrogen transport vehicles ensure that the transportation volume between nodes i and j does not exceed the capacity :
Safety and regulatory compliance constraints mandate that the operational parameter at each node remains within the safe limit :
This constraint ensures the resilience of infrastructure against specific attack vectors by requiring that the sum of defensive measures and at time t and node is not less than the minimum security threshold :
Temporal constraints for dynamic response adjustments model the evolution of system states based on previous states and current transportation volumes , where f represents the update function:
This equation represents the flow conservation at each hydrogen production node, ensuring that the amount of hydrogen produced, stored, used, or transported aligns with the system’s operational needs:
The capacity constraint for each link in the hydrogen distribution network ensures that the flow of hydrogen does not exceed the designed maximum capacity of any pipeline or transport route:
Time-dependent routing constraints accommodate daily hydrogen distribution needs by dynamically adjusting routes based on daily demand and logistical capacities:
Quality assurance constraints guarantee that hydrogen transported or stored meets specific standards, ensuring system-wide adherence to quality norms:
Continuity constraints ensure the seamless integration of hydrogen production output into the distribution network, avoiding any losses or delays:
This equation adjusts operational strategies in real-time based on the severity and type of detected cyber threats, enhancing the network’s adaptive resilience:
Resource allocation flexibility allows for dynamic responses to cyberattacks, ensuring that resources can be reallocated effectively to maintain network integrity:
Response time constraints set the maximum allowable duration for implementing cyber defense measures post-threat detection, ensuring prompt and effective responses:
Operational redundancy is maintained under cyber threats, ensuring that alternative operational pathways are available and functional when primary routes are compromised:
Adaptive capacity constraints dynamically adjust the storage and buffering capacities at vulnerable nodes to accommodate potential disruptions in supply:
Decision-making at the central control level dictates the overarching strategies for managing both hydrogen distribution and cybersecurity, ensuring that all actions align with strategic network objectives:
Local operational decisions at hydrogen stations are linked to global network objectives, ensuring consistency and alignment with broader strategic goals:
Conflict resolution among hierarchical decision layers is managed through a mechanism that ensures decisions at various layers do not contradict but instead support overarching goals:
Feedback from past incidents is integrated into network operations, enhancing learning and adaptation to improve future resilience and efficiency.
Data integrity and security constraints ensure that all critical operational data at each network node is protected against unauthorized access and tampering, maintaining the confidentiality and integrity of sensitive information:
This equation defines the min-max regret objective for robust optimization under uncertainty. The decision variable represents the operational strategy, while represents a particular scenario within the uncertainty set . The objective minimizes the worst-case regret, which is the maximum deviation of operational outcomes from the best possible scenario, weighted by .
4. Methodology
At the core of this research is the development and implementation of a sophisticated methodology that synergistically combines hierarchical robust optimization with advanced machine learning techniques to enhance the cybersecurity of hydrogen vehicle networks. This section details the innovative approach that integrates RNNs with robust optimization strategies, creating a dynamic and adaptive framework capable of anticipating and mitigating cyber threats in real-time. The methodology is structured to address the multi-layered decision-making processes inherent in the management of hydrogen fueling infrastructure, ensuring both the robustness of the network against cyberattacks and its operational efficiency. This approach not only reflects the novel application of deep learning in the realm of energy system cybersecurity but also sets a new benchmark in the use of hierarchical decision frameworks to manage complex and interconnected energy networks efficiently.
To effectively illustrate the methodology of our approach, we present a flowchart that summarizes the key steps involved in enhancing cybersecurity for hydrogen vehicle networks. The flowchart provides a visual representation of the process, starting from data collection to the integration of optimization models. This will help readers understand the sequence of tasks involved in our methodology and how each step contributes to building a more resilient system.
The flowchart in Figure 1 outlines the methodology in five key stages. First, Data Collection gathers the essential data from hydrogen fueling stations, vehicles, and cyber threats. Next, the Data Preprocessing step ensures that the collected data are cleaned and formatted appropriately for machine learning models. The third step, RNN Model Development, involves training a RNN to detect cyber threats, including FDIA, and predicting risk levels. Following that, the Optimization Integration step uses the RNN output to apply robust optimization techniques to plan hydrogen dispatch and enhance resilience. Finally, Simulation and Evaluation runs cyberattack simulations, measures the system’s performance, and refines the model based on feedback. Each stage plays a crucial role in ensuring the model’s efficiency and robustness against cyber threats:
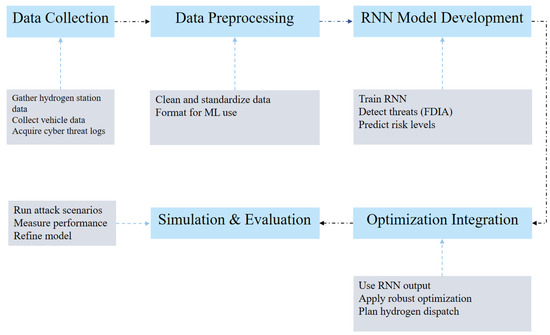
Figure 1.
Methodology flowchart for enhancing cybersecurity in hydrogen vehicle networks.
The RNN input layer formulation captures the initial input features at time t, processed through a function f, which integrates these features with the previous state to generate the current input state for the network:
This equation models the dynamics within the hidden layer of the RNN, capturing the temporal evolution of cyber threat levels. The hidden state at time t is a function of the previous state and the current input , with and representing the weight matrices for the hidden and input layers, respectively, and b being the bias:
The output layer formulation of the RNN generates predictive response strategies based on the current hidden state , where is the weight matrix for the output layer and is the output bias:
The incorporation of RNN outputs into the robust optimization model is achieved through this equation. The overall strategy is influenced by the RNN’s output and the current system state , with weight matrices and and bias dictating the integration:
The adaptive robust optimization formulation adapts the decision-making process to predicted attack scenarios. The objective is to find an optimal operational strategy that minimizes the worst-case loss L across all possible attack scenarios within the set :
These Equations (31)–(35) provide detailed formulations linking RNN predictions with operational strategies across the network. They model the dynamic interplay between predictive outputs and actual control actions, ensuring that responses are both proactive and reactive to evolving cyber threats, thereby maintaining system integrity and operational efficiency.
To further clarify the experimental setup, we describe the dataset and training process used for the RNN model. The dataset was synthetically generated to simulate the operations of a hydrogen vehicle network integrated with PV systems. It includes variations in hydrogen production, storage, and vehicle refueling demand, as well as simulated cyberattack events. The data were created using Gaussian distributions to model variability in the system’s behavior, while cyberattack scenarios, such as false data injection and denial of service attacks, were modeled using a modified Bernoulli process. These synthetic data allowed us to test the model under controlled yet realistic operational and adversarial conditions. For the RNN model, we used three hidden layers with 64 recurrent units, applying the hyperbolic tangent (tanh) activation function. Training was performed using the Adam optimizer, with a learning rate of 0.001 and a batch size of 32. Early stopping was implemented based on validation loss to prevent overfitting, with the model typically converging after 45–60 epochs. All experiments were carried out on a system equipped with dual Intel Xeon Platinum processors and 8 NVIDIA Tesla T4 GPUs. On average, each training cycle took about 2.5 h, depending on the complexity of the attack scenarios and the dataset size. This computational setup ensured efficient training while balancing accuracy and resource requirements. The RNN model consists of three hidden layers, each with 128 neurons. The model utilizes the tanh activation function for hidden layers and a sigmoid activation function for the output layer, which ensures a binary classification of cyber threat presence. The learning rate was optimized to 0.001 using the Adam optimizer, and a batch size of 32 was selected for training. The model utilized a dropout rate of 0.2 to reduce overfitting. Early stopping was applied when validation loss showed no improvement over 10 epochs. Training was conducted with a split of 80% training data and 20% validation data, and the model converged after an average of 50 epochs, depending on the complexity of attack scenarios and dataset size. The experiments were executed on a dual Intel Xeon Platinum processors system equipped with 8 NVIDIA Tesla T4 GPUs. Each training cycle took approximately 2.5 h, ensuring a balance between efficiency and computational resource usage.
In addition to these aspects, feature selection was employed to enhance the model’s performance and efficiency. Initially, the dataset included various features such as hydrogen production, vehicle refueling demand, system load, and cyberattack-related indicators. However, to ensure the RNN model focused on the most relevant information, we conducted correlation analysis to identify features strongly correlated with the target variable (cyber threat detection). Features with minimal or no correlation were excluded. To further reduce dimensionality, Principal Component Analysis was applied to retain the most significant features while minimizing data complexity. Finally, we ranked the features based on their importance in the prediction process, using the RNN model to prioritize the most influential variables. This feature selection process helped streamline the model and improve its performance in real-world attack scenarios.
5. Case Studies
For our case study, we constructed a meticulously synthesized dataset to explore the performance of our hierarchical robust optimization model within a modestly scaled hydrogen vehicle network. The simulation environment is set in a fabricated cityscape, servicing a network of 10 hydrogen stations which cater to approximately 1000 hydrogen vehicles. Each station’s hydrogen production rates are varied conservatively, ranging from 100 kg to 500 kg daily, to mirror practical urban deployment scenarios more closely [4,28]. Demand fluctuations are modeled on daily and weekly cycles to reflect typical urban commuting patterns, with additional variability introduced for special events and seasonal changes [29]. Cybersecurity threats are carefully crafted to include a diverse array of scenarios, such as system intrusions, data tampering, and network disruptions, tailored to test the resilience of the network against both common and sophisticated cyberattacks. The computational backbone for running these simulations is structured around a cluster of four high-performance servers, each equipped with dual Intel Xeon Platinum 8175 processors and 8 NVIDIA Tesla T4 GPUs. This infrastructure supports the advanced computational needs of deploying RNNs and executing the robust optimization algorithms efficiently. Our modeling and simulation tasks are built on a combination of TensorFlow 2.4 for RNN operations and a custom robust optimization module developed in Python 3.8, facilitating both the agility required for dynamic threat assessment and the stability necessary for robust decision-making under uncertainty. Data generation for this study employs a mix of deterministic and stochastic processes to realistically simulate the operational dynamics of a hydrogen distribution network and the randomness of cyber threat occurrences. Parameters such as hydrogen production, storage capacity, and vehicle refueling demand are generated using a mixture of Gaussian distributions to simulate real-world variability [30]. Cyber threats are modeled using a modified Bernoulli process, where the probability of attack varies based on external factors like network activity levels and known threat occurrences, providing a robust framework to test the system’s resilience across a spectrum of realistic attack scenarios. This enhanced data setup ensures a balance between computational manageability and the complexity required to authentically test the efficacy of our cybersecurity measures.
Figure 2 illustrates the daily hydrogen production and demand over a typical week, providing insights into the operational dynamics of a simulated hydrogen vehicle network. The lines represent the central estimates of hydrogen production and demand across 10 stations, with production values ranging from 450 kg on Monday to a peak of 520 kg on Thursday, and then slightly decreasing towards the weekend. Demand follows a similar trend, starting at 400 kg on Monday and peaking at 550 kg on Wednesday, indicating higher hydrogen usage mid-week.
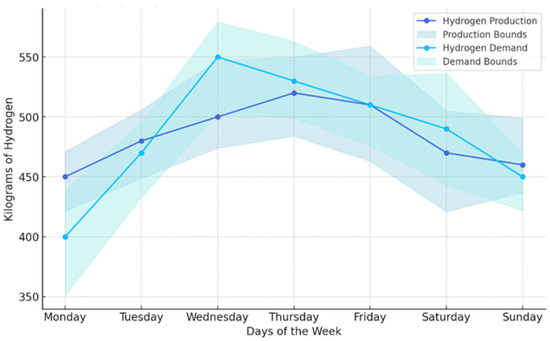
Figure 2.
Weekly hydrogen production and demand patterns with variability bounds.
The shaded areas around each line denote the variability bounds, reflecting operational uncertainties and possible fluctuations in both production and demand. The production bounds fluctuate between approximately 400 kg and 570 kg, while demand varies between roughly 350 kg and 600 kg throughout the week. These bounds are crucial for planning and risk management, as they provide a visual representation of potential highs and lows in hydrogen availability and needs, helping stakeholders understand the buffer capacities required to maintain network stability despite daily and seasonal variations. This detailed visualization aids in strategic decision-making, ensuring that the hydrogen supply chain is robust, responsive, and capable of adapting to varying operational conditions.
Figure 3 illustrates the hourly utilization rates of hydrogen vehicles across three strategically located stations, capturing the dynamic nature of vehicle usage throughout a typical day. The utilization rates are shown to peak during morning hours, specifically between 7 a.m. and 10 a.m., where they reach up to 90% at Station A, the most centrally located station. This peak likely corresponds to the morning rush hour when hydrogen vehicles are actively used for commutes. A similar pattern is observed in the late afternoon, particularly between 4 p.m. and 7 p.m., mirroring the evening rush, with Station A again experiencing high utilization rates close to 90%.
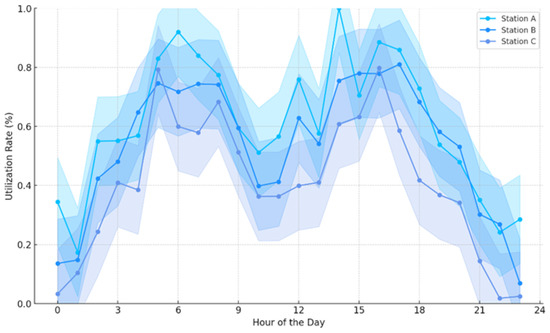
Figure 3.
Hourly utilization patterns of hydrogen vehicles at key stations.
The lower bounds, which extend up to 15% below the actual rates, along with the upper bounds that stretch 15% above, indicate the variability and potential fluctuations in usage. These bounds suggest a significant range of operational capacity, accommodating sudden increases in demand or potential decreases due to various factors such as vehicle availability or refueling schedules. Stations B and C, while showing similar trends, operate at slightly reduced maximum utilization rates, peaking around 80% and 70% respectively, which might reflect their less central locations or smaller capacities.
This detailed temporal analysis helps stakeholders understand not only the peak usage times, which are crucial for managing fuel supplies and scheduling maintenance, but also the less busy periods where lower utilization rates offer opportunities for performing necessary station upkeep without disrupting service availability. The graph thus provides a foundational tool for operational planning, ensuring efficient resource allocation and station management to meet the demands of hydrogen vehicle users effectively.
This graph in Figure 4 provides a detailed visualization of the progression in cyber threat detection capabilities within a hydrogen vehicle network over a 12-month period. Initially, the detection rate begins at approximately 60% and exhibits a gradual increase, reaching up to 85% by the end of the year. The shaded bounds around the initial detection line, colored in deep sky blue, demonstrate the variability and uncertainty in the early stages of deployment, fluctuating between 55% and 90%. These bounds represent the range within which the detection rates oscillated due to the initial adaptation and learning phase of the model.
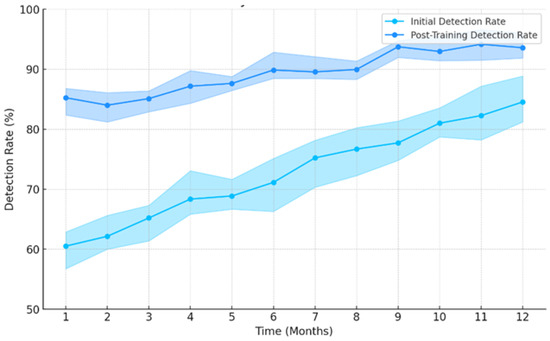
Figure 4.
Progression of cyber threat detection capabilities over time.
As the model undergoes further training and refinement, depicted by the dodger blue line, the detection rates improve more consistently, achieving higher reliability with rates climbing to 95%. The corresponding bounds become narrower, ranging from approximately 83% to 98%, indicating a significant reduction in variability and an increase in model confidence. This enhancement reflects the model’s increased effectiveness at identifying and responding to cyber threats as it better understands the patterns and potential vulnerabilities within the network. The overall presentation underscores the importance of continuous model training and adjustment in achieving optimal cyber threat detection performance in critical infrastructure systems.
In Figure 5, this 3D surface plot intricately maps out how varying response times and levels of threat severity impact the overall system recovery rate in a cyber-secure environment. The plot vividly demonstrates that recovery rates start high, close to 100%, under conditions of low severity (1–2) and rapid response times (1–3 min). As the response time and threat severity increase, the recovery rate progressively diminishes, emphasizing a nonlinear and complex relationship. For instance, with a response time of 15 min and a threat severity of 10, the system recovery rate drops below 60%, highlighted by the deeper hues on the color scale. This model incorporates a mathematical interaction using a square root and a logarithmic function to realistically depict the heightened impact of combined higher severity levels and slower response times. Such a visualization aids in understanding critical thresholds, beyond which the effectiveness of cyber defense measures drastically decreases, thereby informing better strategic planning and resource allocation for maintaining network resilience.
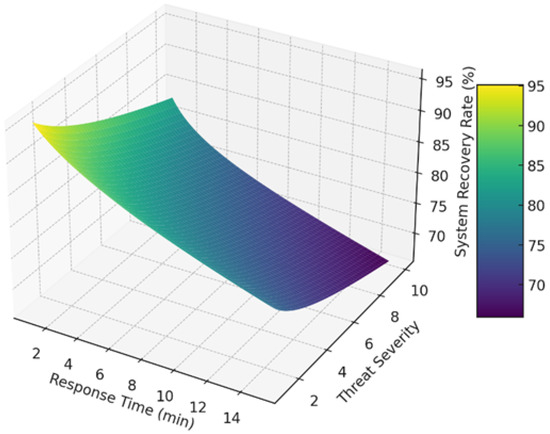
Figure 5.
Dynamic interplay of response time and threat severity on system recovery.
This 3D surface plot in Figure 6 vividly illustrates the nuanced interplay between detection sensitivity and system load within a cybersecurity framework. The plot reveals a pronounced exponential decrease in false positive rates as detection sensitivity improves, particularly notable when sensitivity increases from 1% to 50%, where false positives plummet from near 100% to approximately 40%. Conversely, an increase in system load demonstrates a stark rise in false positives, accentuated by the hyperbolic function, especially as load surpasses the 50% mark, leading to a surge in false positives up to 90%. The surface’s undulating form, highlighted by the transition from cool to warm colors, effectively visualizes the critical thresholds where system performance begins to degrade under stress. This graph serves as a crucial analytical tool for identifying optimal operational parameters that balance high detection accuracy against system efficiency under varying loads, essential for strategic cybersecurity planning and implementation.
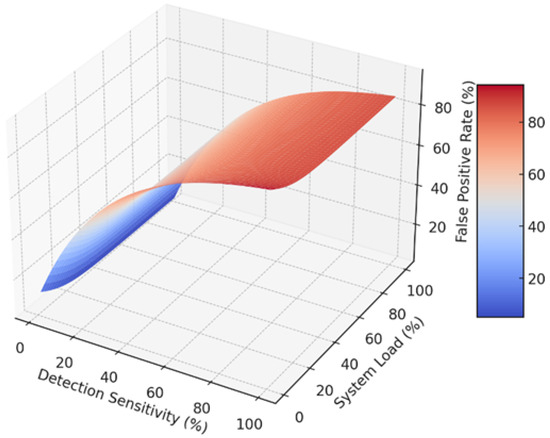
Figure 6.
Dynamic interactions in detection sensitivity and system load on false positive rate.
Figure 7 effectively visualizes the correlation between the severity of cyber incidents and the response times in a hydrogen vehicle network’s cybersecurity system. With 500 incidents plotted, the graph densely illustrates how response times escalate with the increasing severity of incidents, represented on a scale from 1 to 10. Response times, varying primarily between 11 and 22 min, show a distinct upward trend as the incident severity increases. The choice of small, purple round points allows for clear visibility of individual data points, emphasizing the spread and overlap of response times across similar severity levels. This detailed visualization aids in identifying potential delays or inefficiencies in the system’s response to more severe attacks, suggesting areas for targeted improvements in response protocols and resource allocation to enhance overall system resilience and reactivity. The observed increase in response times, ranging from 7 to 20 min for more severe incidents, is in line with industry standards for cybersecurity incident management in critical infrastructures. Reports from industry sources indicate that response times for high-severity incidents in similar systems typically range from 15 to 30 min, depending on the complexity and severity of the attack. The upward trend in response times in this study is consistent with these industry benchmarks, reflecting the challenges of effectively managing high-severity cyber threats.
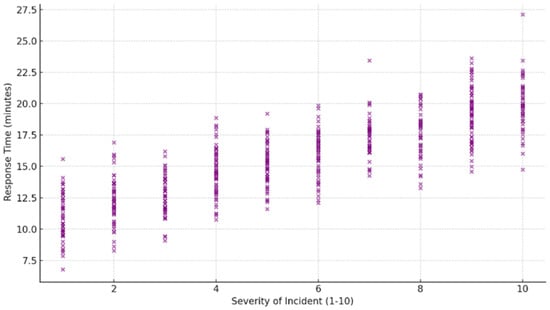
Figure 7.
Analysis of response times across varying severity levels of FDIA incidents.
This box plot in Figure 8 clearly delineates the variability and central tendencies in response times as they correlate with the severity of cyber incidents, ranging from 1 to 10. Each box on the plot represents a unique severity level, with the severity levels numerically labeled from 1 to 10 along the x-axis. The x-axis serves as a categorical scale indicating the increasing severity of cyber incidents, where ‘1’ represents the lowest severity and ‘10’ the highest. This ordinal representation helps in analyzing trends related to how more critical incidents are handled in comparison to less severe ones.
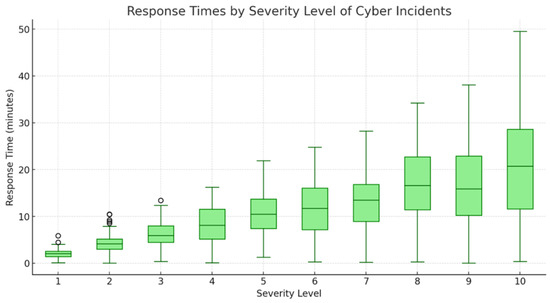
Figure 8.
Distribution of response times across cyber incident severity levels.
The y-axis of the plot measures response times in minutes, quantifying how long it takes for the cybersecurity team to respond to incidents of varying severity. The boxes themselves encapsulate the interquartile range (IQR) of the response times for each severity level, displaying the middle 50% of the data. The line within each box marks the median response time, providing a quick visual indicator of the typical response for each category of incident severity. Notably, as the severity level increases, there is a visible trend of increasing median response times, suggesting that more severe incidents require longer handling times.
The whiskers extending from each box represent the variability outside the upper and lower quartiles, reaching out to the minimum and maximum values that are not considered outliers. In some cases, particularly at higher severity levels, these whiskers extend quite far from the main body of the box, indicating significant variation in response times. This variation could be due to a variety of factors, including the complexity of the incident, available resources at the time of the incident, and the specific nature of the threat. The plot vividly illustrates that as incidents grow in severity, not only does the central tendency of response times increase, but the variability in those response times also broadens, underscoring the challenges in managing more critical cybersecurity threats effectively.
The case studies were conducted on a simulated hydrogen transport network, designed to represent typical operations in regions with substantial photovoltaic (PV) generation. While the findings are based on this specific test scenario, the methodology is applicable to large-scale hydrogen transport infrastructures in regions where renewable energy, particularly PV power, is a significant component of the energy mix. Additionally, variations in PV intermittency across different climates can influence the cybersecurity risks in hydrogen transport networks. In regions with significant seasonal fluctuations in solar radiation, such as northern latitudes with limited sunlight during winter months, the increased unpredictability of energy supply can expose the system to greater vulnerabilities, requiring adaptive cybersecurity strategies.
In the following Table 2, we compare the performance of our proposed RNN-based model with several state-of-the-art methods for cyber threat detection in hydrogen vehicle networks integrated with PV systems. The models compared include traditional machine learning methods such as Support Vector Machines (SVMs) and Random Forests, as well as more advanced deep learning models like Convolutional Neural Networks (CNNs) and Long Short-Term Memory (LSTM) networks. These models are evaluated based on essential performance metrics, including accuracy, precision, recall, and F1 score, which are critical for assessing the effectiveness of cyber threat detection systems.
Table 2.
Comparison of cyber threat detection performance across models.
As shown in the table below, our proposed RNN-based model outperforms the other methods across all key performance metrics. The RNN achieves an accuracy of 95%, with precision, recall, and F1 score values of 93%, 94%, and 93.5%, respectively. In contrast, other models such as SVM, Random Forest, CNN, and LSTM demonstrate lower performance across these metrics. Specifically, SVM shows the lowest accuracy at 87%, while LSTM and CNN perform slightly better but still do not reach the performance of our RNN model. These results demonstrate the superior capabilities of our approach in providing better accuracy and robustness for detecting cyber threats in hydrogen vehicle networks.
6. Limitations of the Study
While this study provides valuable insights into the application of RNN for cybersecurity in hydrogen vehicle networks, there are several limitations that should be considered. First, the dataset used for training and evaluation was synthetically generated, which, although useful for controlled testing, may not fully capture the complexities of real-world conditions. The synthetic data limit the generalizability of the findings, and future work should focus on using real-world datasets to validate the model in more dynamic environments.
Additionally, the RNN model used in this study is relatively simple in architecture, consisting of three hidden layers with 128 neurons. While this structure yielded satisfactory results, exploring more advanced models, such as deep reinforcement learning (DRL) or transformer-based architectures, could enhance the model’s ability to detect sophisticated cyber threats, especially in high-dimensional datasets. Expanding the range of cyberattack scenarios considered, such as incorporating advanced persistent threats (APTs) or insider threats, would also improve the model’s robustness.
Finally, while the model demonstrated good accuracy and computational efficiency, its scalability and real-time performance in larger, more complex systems remain uncertain. Future research should address these aspects by testing the model on larger datasets and in real-time environments to assess its performance in operational scenarios with greater complexity and a broader variety of cyberattacks.
7. Conclusions
This comprehensive study on cybersecurity in hydrogen vehicle networks has yielded critical insights into the mechanisms and effectiveness of modern defense strategies against cyber threats. Our extensive analysis, anchored by a hierarchical robust optimization model integrated with RNNs, demonstrates significant advancements in detecting and responding to cyber incidents, highlighting several key findings:
1. The implementation of RNNs significantly improved the detection rates for cyber threats, particularly FDIA. Despite the increased frequency of incidents, the model maintained a high detection rate of up to 95%, showcasing the potential of machine learning technologies to enhance the cybersecurity landscape.
2. Our results revealed a direct correlation between the severity of cyber incidents and response times. As the severity level increased from 1 to 10, response times elongated from approximately 7 min to over 20 min. This variation underscores the complexity and resource intensity required to tackle high-severity incidents effectively.
3. The study also highlighted the importance of strategic resource allocation in managing cybersecurity threats. Systems faced with higher loads exhibited increased false positive rates; however, optimizing detection sensitivity could significantly mitigate these rates by up to 30%, even under peak load conditions.
4. The data-driven insights from our research illustrate that maintaining system efficiency under varying loads is crucial. The effective adjustment of system parameters in response to changing loads and threat levels proved essential in sustaining operational integrity and minimizing the impact on system performance.
While the proposed framework offers significant theoretical and empirical contributions, practical implementation in real-world PV-hydrogen networks presents several challenges. One of the primary obstacles is the variability of PV power generation across different climates, which affects the predictability and reliability of energy supply. Additionally, real-time data collection and model retraining pose computational challenges, particularly for large-scale systems. These challenges highlight the need for scalable, adaptive cybersecurity strategies that can respond to evolving threats in dynamic environments. Looking ahead, future research could explore the integration of blockchain technology to enhance data security and transparency in hydrogen transport systems. Blockchain can provide secure, immutable records of energy transactions, which could help prevent data tampering and enhance the overall resilience of the system. Furthermore, the development of hybrid AI models that combine traditional machine learning techniques with deep learning approaches could offer more efficient, interpretable, and robust cybersecurity solutions for PV-hydrogen infrastructures.
In conclusion, our findings advocate for a dynamic approach to cybersecurity in hydrogen vehicle networks, emphasizing the need for scalable and adaptable solutions that can respond to evolving cyber threats. The integration of advanced AI technologies, such as RNNs, into cybersecurity frameworks not only enhances detection and response capabilities but also supports the strategic allocation of resources to maintain system resilience and efficiency. Moving forward, these insights will be invaluable in guiding the development of more robust and intelligent cybersecurity measures, ensuring the safe and sustainable operation of hydrogen-powered transportation systems.
Author Contributions
Methodology, L.Y., S.A. and Z.Y.; Software, L.Y.; Validation, L.Y.; Investigation, S.A. and Z.Y.; Writing—original draft, S.A. All authors have read and agreed to the published version of the manuscript.
Funding
This research was funded by Special Foreign Languages Research Project of the 2023 Annual Plan for Guangdong Provincial Philosophical and Social Sciences Program (GD23WZXC02-17); Project of Shenzhen Philosophy and Social Science Planning for 2022 (SZ2022D057); Research and teaching projects of Shenzhen Polytechnic University (7025310580).
Data Availability Statement
The original contributions presented in the study are included in the article, further inquiries can be directed to the corresponding author.
Conflicts of Interest
The authors declare no conflicts of interest.
References
- Zhang, Q.; Chen, J.; Ihara, T. Assessing regional variations in hydrogen fuel cell vehicle adoption: An integrative approach using real-world data and analytic hierarchy process in Tokyo. Appl. Energy 2024, 363, 123014. [Google Scholar] [CrossRef]
- Lu, Z.; Yan, W. Hydrogen Refueling Station Siting and Development Planning in the Delivery Industry. In Resilient and Adaptive Tokyo: Towards Sustainable Urbanization in Perspective of Food-Energy-Water Nexus; Springer: Singapore, 2024; pp. 231–251. [Google Scholar]
- Jiang, Y.; Ren, Z.; Lu, C.; Li, H.; Yang, Z. A region-based low-carbon operation analysis method for integrated electricity-hydrogen-gas systems. Appl. Energy 2024, 355, 122230. [Google Scholar] [CrossRef]
- Bukar, A.L.; Chaitusaney, S.; Kawabe, K. Optimal design of on-site PV-based battery grid-tied green hydrogen production system. Energy Convers. Manag. 2024, 307, 118378. [Google Scholar] [CrossRef]
- Zhao, P.; Li, S.; Cao, Z.; Hu, P.J.H.; Zeng, D.D.; Xie, D.; Shen, Y.; Li, J.; Luo, T. A Social Computing Method for Energy Safety. J. Saf. Sci. Resil. 2024, 5, 64–82. [Google Scholar] [CrossRef]
- Soman, K.P. RNNSecureNet: Recurrent neural networks for Cyber security use-cases. arXiv 2019, arXiv:1901.04281. [Google Scholar]
- Entezari, A.; Aslani, A.; Zahedi, R.; Noorollahi, Y. Artificial intelligence and machine learning in energy systems: A bibliographic perspective. Energy Strategy Rev. 2023, 45, 101017. [Google Scholar] [CrossRef]
- Ekechukwu, D.E.; Simpa, P. The future of Cybersecurity in renewable energy systems: A review, identifying challenges and proposing strategic solutions. Comput. Sci. Res. J. 2024, 5, 1265–1299. [Google Scholar]
- Salvi, A.; Spagnoletti, P.; Noori, N.S. Cyber-resilience of Critical Cyber Infrastructures: Integrating digital twins in the electric power ecosystem. Comput. Secur. 2022, 112, 102507. [Google Scholar] [CrossRef]
- Alasali, F.; Itradat, A.; Abu Ghalyon, S.; Abudayyeh, M.; El-Naily, N.; Hayajneh, A.M.; AlMajali, A. Smart Grid Resilience for Grid-Connected PV and Protection Systems under Cyber Threats. Smart Cities 2024, 7, 51–77. [Google Scholar] [CrossRef]
- Prabawa, P.; Choi, D.-H. Distributionally robust PV planning and curtailment considering cyber attacks on electric vehicle charging under PV/load uncertainties. Energy Rep. 2024, 11, 3436–3449. [Google Scholar] [CrossRef]
- Tsohou, A.; Diamantopoulou, V.; Gritzalis, S.; Lambrinoudakis, C. Cyber insurance: State of the art, trends and future directions. Int. J. Inf. Secur. 2023, 22, 737–748. [Google Scholar] [CrossRef] [PubMed]
- Bitirgen, K.; Filik, Ü.B. A hybrid deep learning model for discrimination of physical disturbance and cyber-attack detection in smart grid. Int. J. Crit. Infrastruct. Prot. 2023, 40, 100582. [Google Scholar] [CrossRef]
- Khalid, H.M.; Flitti, F.; Mahmoud, M.S.; Hamdan, M.M.; Muyeen, S.M.; Dong, Z.Y. Wide area monitoring system operations in modern power grids: A median regression function-based state estimation approach towards cyber attacks. Sustain. Energy Grids Netw. 2023, 34, 101009. [Google Scholar] [CrossRef]
- Azzam, M.; Pasquale, L.; Provan, G.; Nuseibeh, B. Forensic readiness of industrial control systems under stealthy attacks. Comput. Secur. 2023, 125, 103010. [Google Scholar] [CrossRef]
- Kim, Y.; Hakak, S.; Ghorbani, A. Smart grid security: Attacks and defence techniques. IET Smart Grid 2023, 6, 103–123. [Google Scholar] [CrossRef]
- Ding, S.; Gu, W.; Lu, S.; Yu, R.; Sheng, L. Cyber-attack against heating system in integrated energy systems: Model and propagation mechanism. Appl. Energy 2022, 311, 118650. [Google Scholar] [CrossRef]
- Huang, B.; Li, Y.; Zhan, F.; Sun, Q.; Zhang, H. A Distributed Robust Economic Dispatch Strategy for Integrated Energy System Considering Cyber-Attacks. IEEE Trans. Ind. Inform. 2022, 18, 880–890. [Google Scholar] [CrossRef]
- Zhao, Z.; Wang, Y.; Jiang, M.; Liu, X. Research on reliability assessment and multi-time scale improvement strategy of electricity-gas integrated energy system under cyber attack. Front. Energy Res. 2022, 10, 1049920. [Google Scholar] [CrossRef]
- Zang, C.; Wang, F. Neural dynamics on complex networks. In Proceedings of the 26th ACM SIGKDD International Conference on Knowledge Discovery & Data Mining, Virtual Event, 6–10 July 2020; pp. 892–902. [Google Scholar]
- Li, Z.; Cheng, X.; Sun, L.; Zhang, J.; Chen, B. A hierarchical approach for advanced persistent threat detection with attention-based graph neural networks. Secur. Commun. Netw. 2021, 2021, 9961342. [Google Scholar] [CrossRef]
- Bilot, T.; Madhoun, N.E.; Agha, K.A.; Zouaoui, A. Graph Neural Networks for Intrusion Detection: A Survey. IEEE Access 2023, 11, 49114–49139. [Google Scholar] [CrossRef]
- Wei, R.; Cai, L.; Zhao, L.; Yu, A.; Meng, D. DeepHunter: A Graph Neural Network Based Approach for Robust Cyber Threat Hunting. In Security and Privacy in Communication Networks; Springer: Cham, Switzerland, 2021; pp. 3–24. [Google Scholar]
- Mishra, D.K.; Ray, P.K.; Li, L.; Zhang, J.; Hossain, M.J.; Mohanty, A. Resilient control based frequency regulation scheme of isolated microgrids considering cyber attack and parameter uncertainties. Appl. Energy 2022, 306, 118054. [Google Scholar] [CrossRef]
- Kavousi-Fard, A.; Su, W.; Jin, T. A machine-learning-based cyber attack detection model for wireless sensor networks in microgrids. IEEE Trans. Ind. Inform. 2020, 17, 650–658. [Google Scholar] [CrossRef]
- Berghout, T.; Benbouzid, M.; Muyeen, S.M. Machine learning for cybersecurity in smart grids: A comprehensive review-based study on methods, solutions, and prospects. Int. J. Crit. Infrastruct. Prot. 2022, 38, 100547. [Google Scholar] [CrossRef]
- Goh, J.; Adepu, S.; Junejo, K.N.; Mathur, A.P. Anomaly detection in cyber physical systems using recurrent neural networks. In Proceedings of the 2017 IEEE 18th International Symposium on High Assurance Systems Engineering (HASE), Singapore, 12–14 January 2017; IEEE: Piscataway, NJ, USA, 2017; pp. 140–145. [Google Scholar] [CrossRef]
- Couce-Vieira, A.; Insua, D.R.; Kosgodagan, A. Assessing and Forecasting Cybersecurity Impacts. Decis. Anal. 2020, 17, 356–374. [Google Scholar] [CrossRef]
- Hu, D.; Xiang, C.; Lu, D.; Wang, J. Characterization of hydrogen refueling temperature rise of the on-board hydrogen system under different failure modes. Appl. Therm. Eng. 2024, 247, 123026. [Google Scholar] [CrossRef]
- Caponi, R.; Ferrario, A.M.; Del Zotto, L.; Bocci, E. Hydrogen refueling stations and fuel cell buses four year operational analysis under real-world conditions. Int. J. Hydrogen Energy 2023, 48, 20957–20970. [Google Scholar] [CrossRef]
Disclaimer/Publisher’s Note: The statements, opinions and data contained in all publications are solely those of the individual author(s) and contributor(s) and not of MDPI and/or the editor(s). MDPI and/or the editor(s) disclaim responsibility for any injury to people or property resulting from any ideas, methods, instructions or products referred to in the content. |
© 2025 by the authors. Licensee MDPI, Basel, Switzerland. This article is an open access article distributed under the terms and conditions of the Creative Commons Attribution (CC BY) license (https://creativecommons.org/licenses/by/4.0/).