Author Contributions
Conceptualization, H.P.L.; methodology, H.M.L.; software, H.M.L.; validation, H.M.L.; formal analysis, H.M.L.; investigation, H.M.L.; resources, H.P.L.; data curation, H.M.L.; writing—original draft preparation, H.M.L.; writing—review and editing, H.M.L.; visualization, H.M.L.; supervision, H.P.L.; project administration, H.P.L. All authors have read and agreed to the published version of the manuscript.
Figure 1.
(a) Original, (b) lattice, and (c) auxetic battery pack casings.
Figure 1.
(a) Original, (b) lattice, and (c) auxetic battery pack casings.
Figure 2.
25 reference points for capturing data on the surface of the battery pack casing.
Figure 2.
25 reference points for capturing data on the surface of the battery pack casing.
Figure 3.
Mode shape 1 of the three different aluminum battery pack casings. (a) Original, (b) lattice, and (c) auxetic.
Figure 3.
Mode shape 1 of the three different aluminum battery pack casings. (a) Original, (b) lattice, and (c) auxetic.
Figure 4.
Longitudinal displacement (m2/Hz) of the three different aluminum battery pack casings at 15 Hz. (a) Original, (b) lattice, and (c) auxetic.
Figure 4.
Longitudinal displacement (m2/Hz) of the three different aluminum battery pack casings at 15 Hz. (a) Original, (b) lattice, and (c) auxetic.
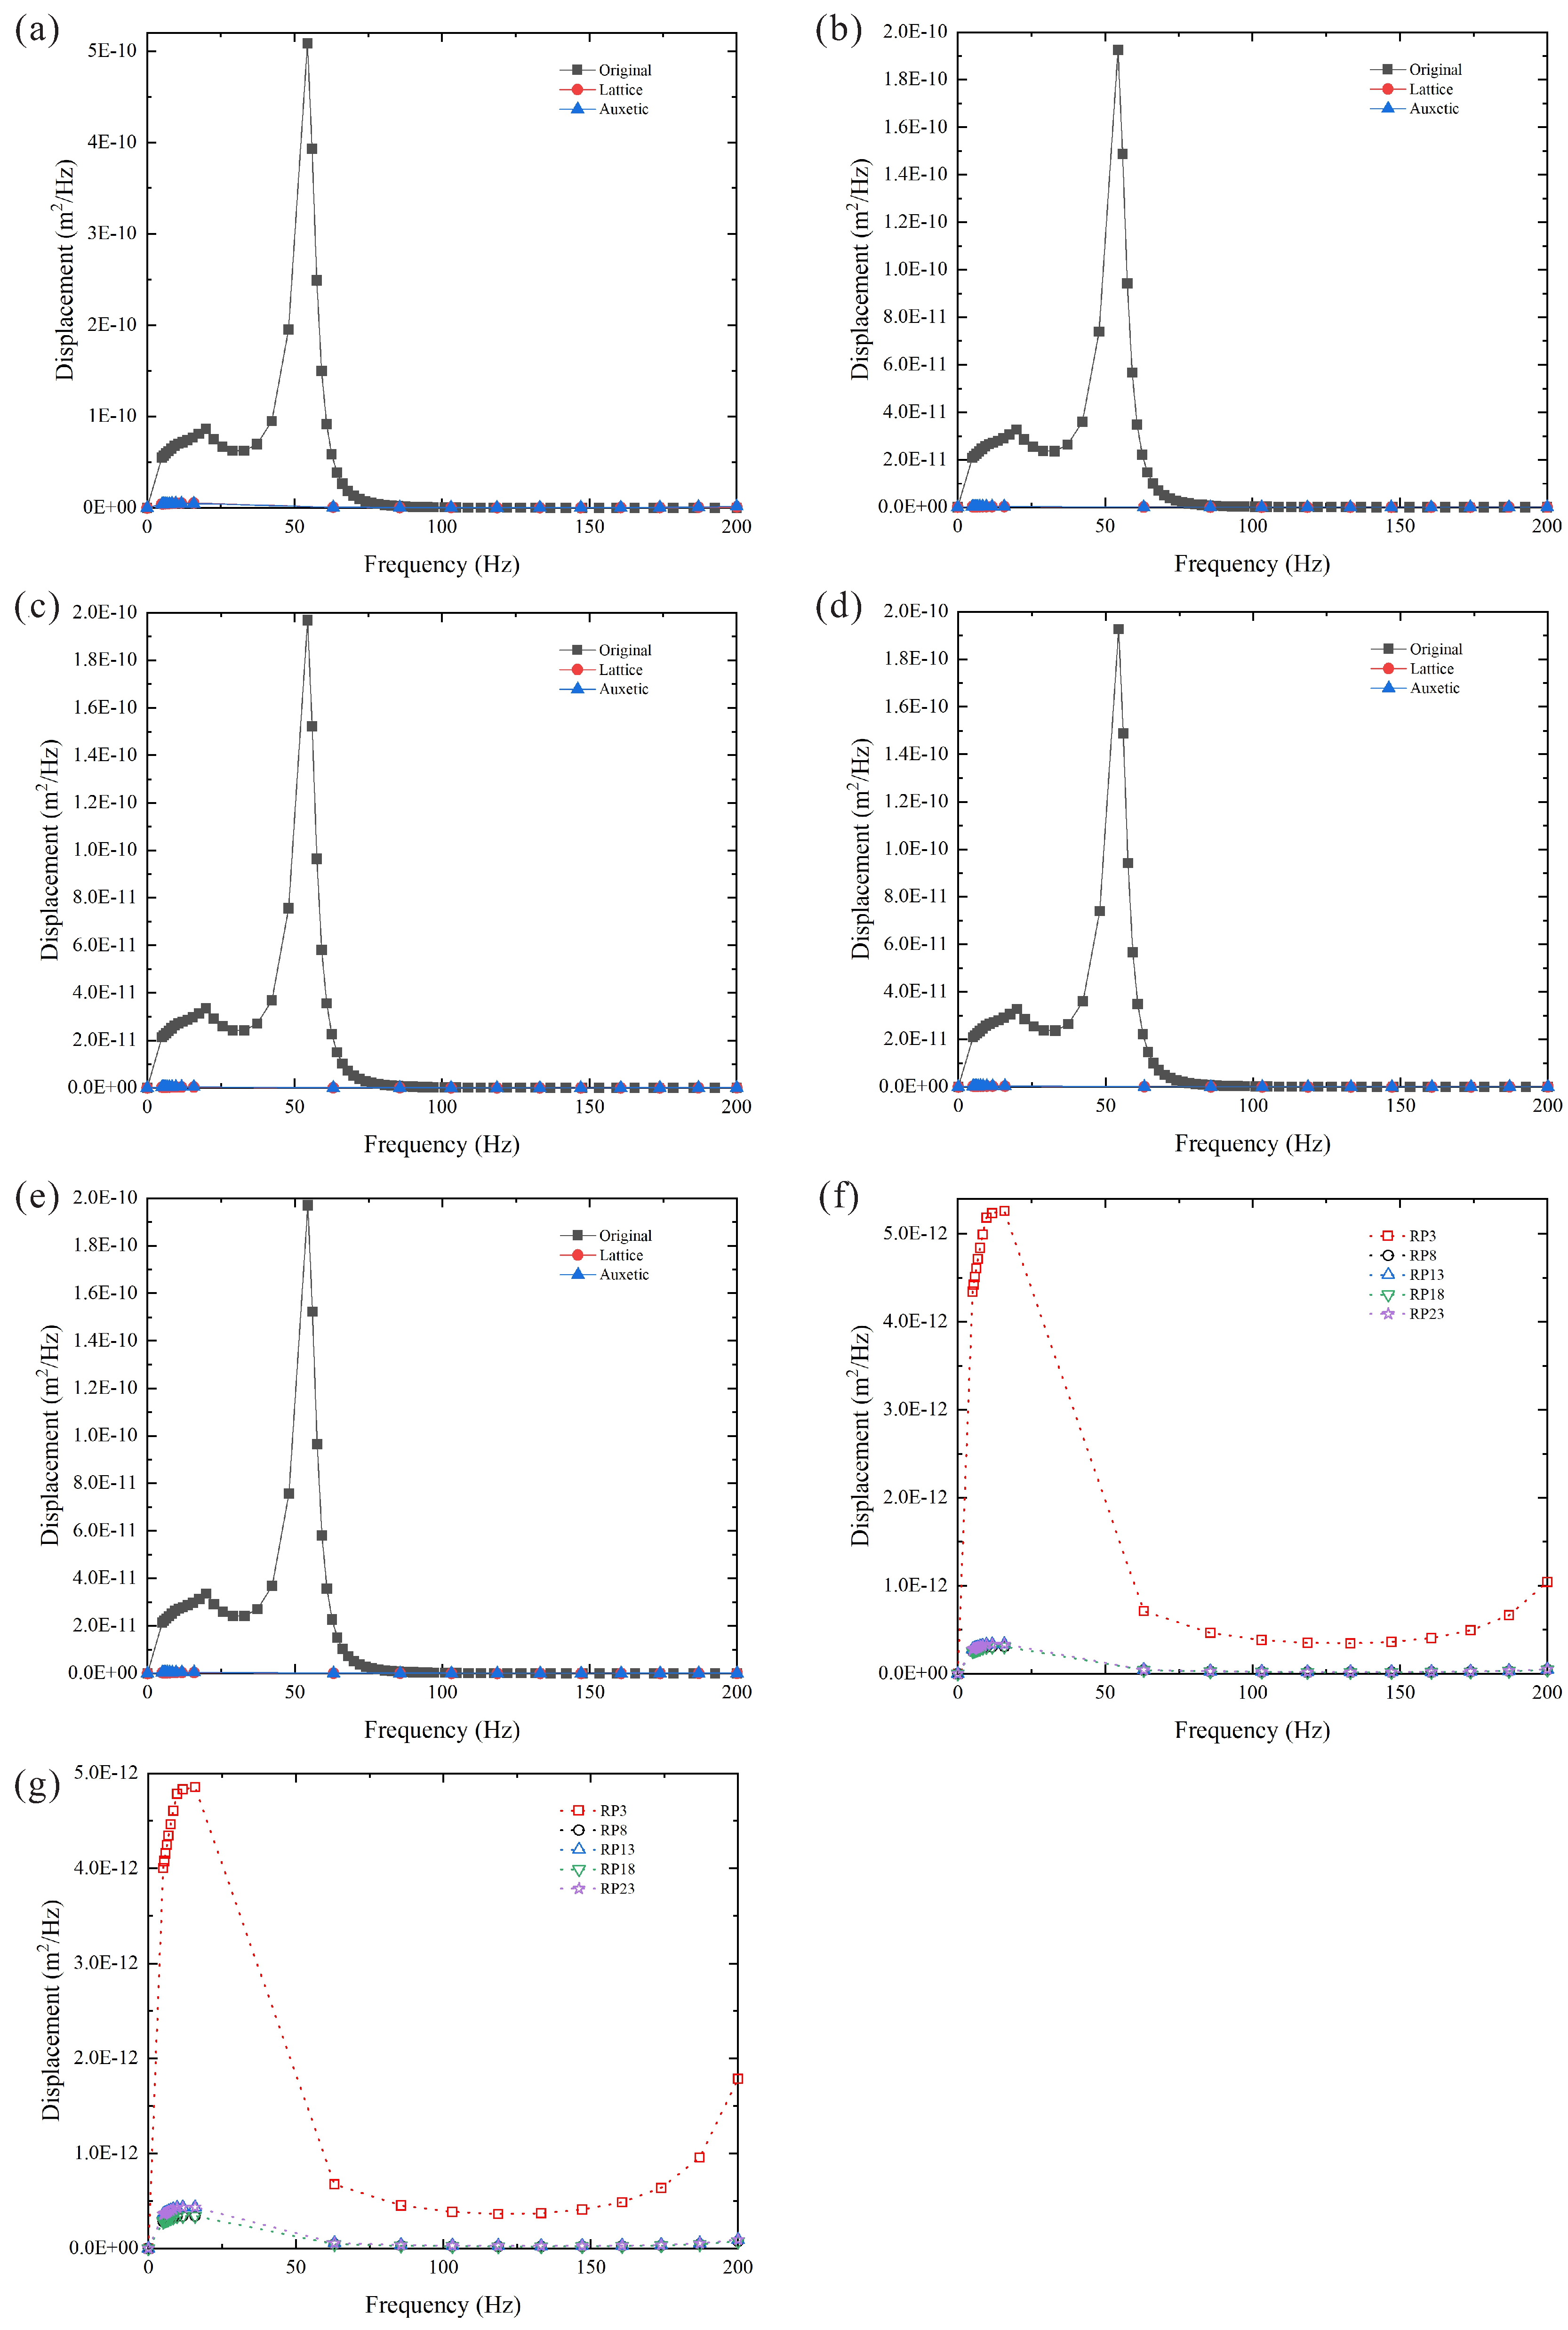
Figure 5.
Longitudinal displacement of the three different aluminum battery pack casings at (a) RP3, (b) RP8, (c) RP13, (d) RP18, and (e) RP23. Longitudinal displacement of the (f) lattice and (g) auxetic aluminum casings at different reference points.
Figure 5.
Longitudinal displacement of the three different aluminum battery pack casings at (a) RP3, (b) RP8, (c) RP13, (d) RP18, and (e) RP23. Longitudinal displacement of the (f) lattice and (g) auxetic aluminum casings at different reference points.
Figure 6.
Vertical displacement (m2/Hz) of the three different aluminum casings at 15 Hz. (a) Original, (b) lattice, and (c) auxetic.
Figure 6.
Vertical displacement (m2/Hz) of the three different aluminum casings at 15 Hz. (a) Original, (b) lattice, and (c) auxetic.
Figure 7.
Vertical displacement of the three different aluminum casings at (a) RP 3, (b) RP 8, (c) RP 13, (d) RP 18, and (e) RP23. Vertical displacement of the (f) lattice and (g) auxetic casings at different reference points.
Figure 7.
Vertical displacement of the three different aluminum casings at (a) RP 3, (b) RP 8, (c) RP 13, (d) RP 18, and (e) RP23. Vertical displacement of the (f) lattice and (g) auxetic casings at different reference points.
Figure 8.
Transverse displacement (m2/Hz) of the three different aluminum casings at 85 Hz. (a) Original, (b) lattice, and (c) auxetic.
Figure 8.
Transverse displacement (m2/Hz) of the three different aluminum casings at 85 Hz. (a) Original, (b) lattice, and (c) auxetic.
Figure 9.
Transverse displacement of the three different PPA-CF casings at (a) RP 3, (b) RP 8, (c) RP 13, (d) RP 18, and (e) RP 23. Transverse displacement of (f) lattice and (g) auxetic casings at different reference points.
Figure 9.
Transverse displacement of the three different PPA-CF casings at (a) RP 3, (b) RP 8, (c) RP 13, (d) RP 18, and (e) RP 23. Transverse displacement of (f) lattice and (g) auxetic casings at different reference points.
Figure 10.
Transverse displacement of the three different PPA-CF casings at (a) RP 7, (b) RP 9, (c) RP 17, and (d) RP 19.
Figure 10.
Transverse displacement of the three different PPA-CF casings at (a) RP 7, (b) RP 9, (c) RP 17, and (d) RP 19.
Figure 11.
Longitudinal displacement (m2/Hz) of the three different PPA-CF casings at 5.5 Hz. (a) Original, (b) lattice, and (c) auxetic.
Figure 11.
Longitudinal displacement (m2/Hz) of the three different PPA-CF casings at 5.5 Hz. (a) Original, (b) lattice, and (c) auxetic.
Figure 12.
Longitudinal displacement of the three different PPA-CF casings at (a) RP 3, (b) RP 8, (c) RP 13, (d) RP 18, and (e) RP23. Longitudinal displacement of the (f) lattice and (g) auxetic casings at different reference points. X-axis in discrete scale for clearer presentation of the data in low-frequency region.
Figure 13.
Vertical displacement (m2/Hz) of the three different PPA-CF casings at 5.8 Hz. (a) Original, (b) lattice, (c) auxetic.
Figure 13.
Vertical displacement (m2/Hz) of the three different PPA-CF casings at 5.8 Hz. (a) Original, (b) lattice, (c) auxetic.
Figure 14.
Vertical displacement of the three different PPA-CF casings at (a) RP 3, (b) RP 8, (c) RP 13, (d) RP 18, and (e) RP 23. Longitudinal displacement of the (f) lattice and (g) auxetic casings at different reference points. X-axis in discrete scale for clearer presentation of the data in low-frequency region.
Figure 15.
Transverse displacement (m2/Hz) of the three different PPA-CF casings at 5.1 Hz. (a) Original, (b) lattice, and (c) auxetic.
Figure 15.
Transverse displacement (m2/Hz) of the three different PPA-CF casings at 5.1 Hz. (a) Original, (b) lattice, and (c) auxetic.
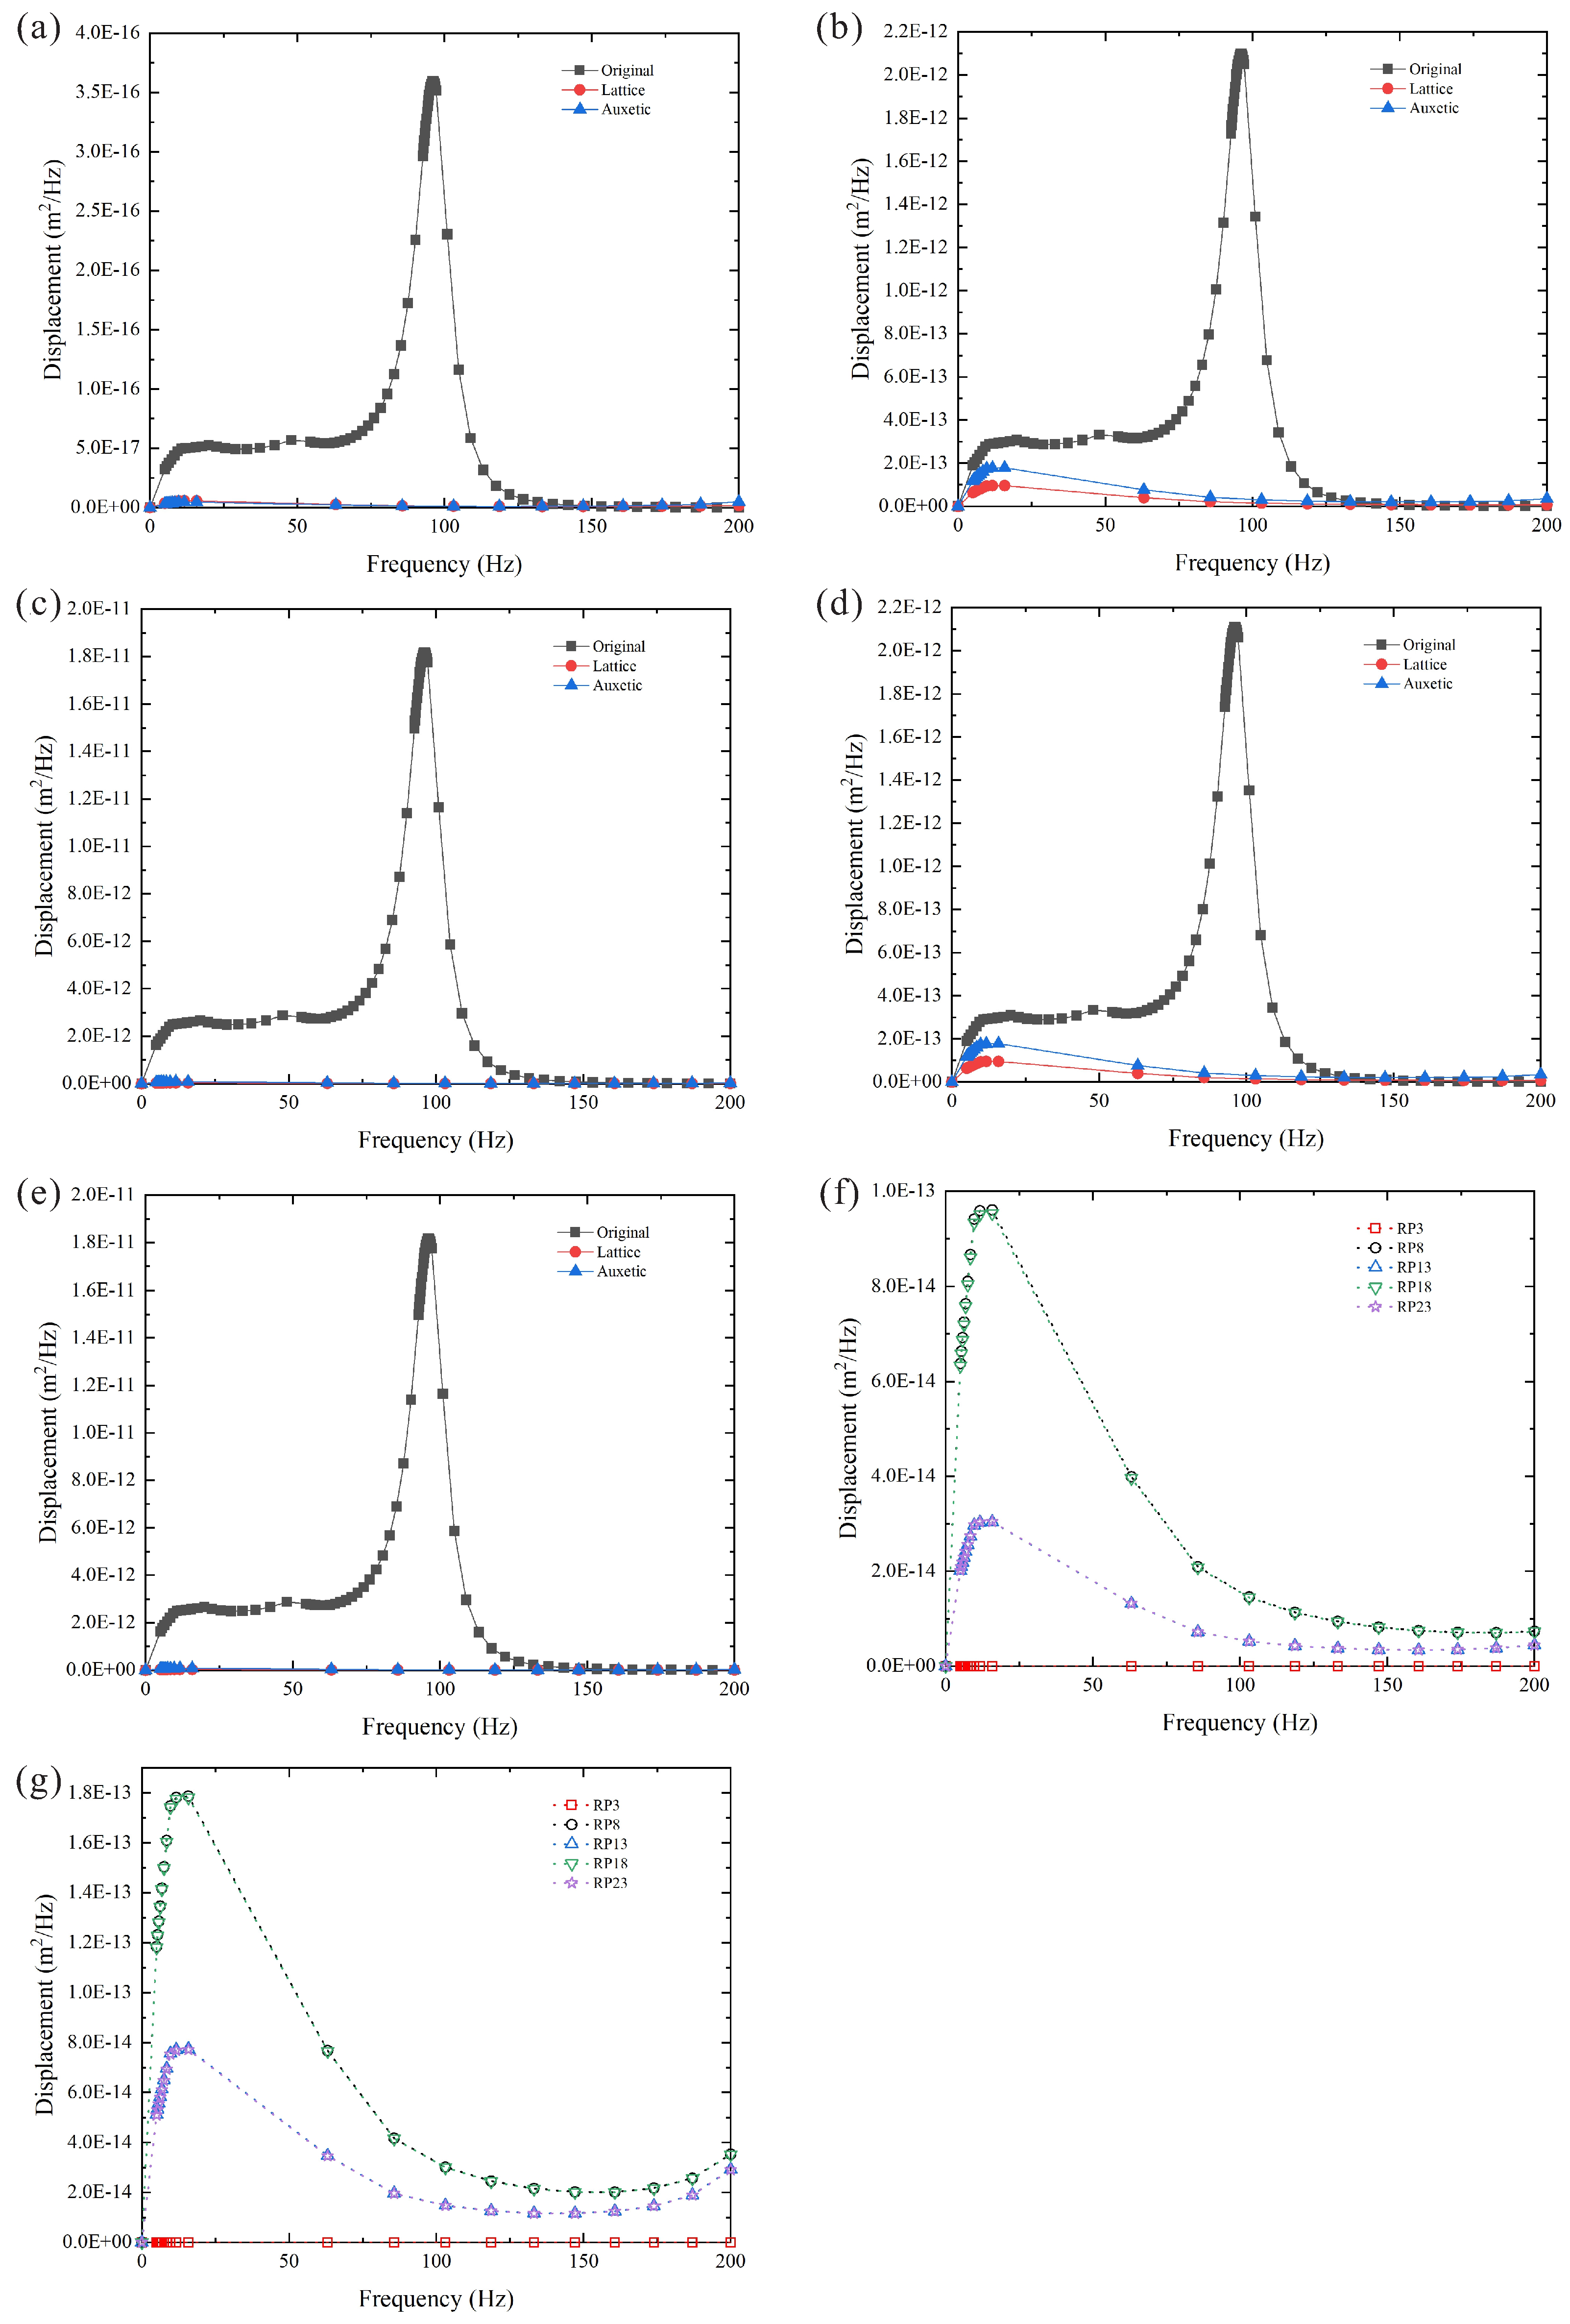
Figure 16.
Transverse displacement of the three different PPA-CF casings at (a) RP 3, (b) RP 8, (c) RP 13, (d) RP 18, and (e) RP 23. Longitudinal displacement of the (f) lattice and (g) auxetic casings at different reference points. X-axis in discrete scale for clearer presentation of the data in low-frequency region.
Table 1.
Properties of PPA-CF [
18]. G is the shear modulus.
Table 1.
Properties of PPA-CF [
18]. G is the shear modulus.
| Properties | Value |
|---|
| (kg/m3) | 1200 |
| El (MPa) | 6945 |
| Et (MPa) | 2977 |
| Ev (MPa) | 2977 |
| 0.33 |
| 0.33 |
| 0.4 |
| Glt (MPa) | 3000 |
| Glv (MPa) | 3000 |
| Gtv (MPa) | 1063 |
Table 2.
Natural frequencies of the three different aluminum battery pack casings.
Table 2.
Natural frequencies of the three different aluminum battery pack casings.
| Battery Pack Casing | Mode 1 (Hz) | Mode 2 (Hz) | Mode 3 (Hz) |
|---|
| Original | 54 | 92 | 97 |
| Lattice | 216 | 233 | 264 |
| Auxetic | 205 | 226 | 232 |
Table 3.
Vibration mitigation capabilities of the lattice and auxetic aluminum casings in 3 directions.
Table 3.
Vibration mitigation capabilities of the lattice and auxetic aluminum casings in 3 directions.
| Battery Pack Casing | Longitudinal (%) | Vertical (%) | Transverse (%) |
|---|
| Lattice | 97.7 | 98.9 | 99.0 |
| Auxetic | 97.1 | 98.7 | 97.9 |
Table 4.
Natural frequencies of the three different PPA-CF casings.
Table 4.
Natural frequencies of the three different PPA-CF casings.
| Battery Pack Casing | Mode 1 (Hz) | Mode 2 (Hz) | Mode 3 (Hz) |
|---|
| Original | 5.0 | 5.3 | 5.6 |
| Lattice | 2.3 | 2.5 | 2.8 |
| Auxetic | 2.2 | 2.4 | 2.5 |


