
Optimal Configuration of Mobile–Stationary Hybrid Energy Storage Considering Seismic Hazards


Abstract
1. Introduction
- There are optimal access points for hybrid energy storage under different operating scenarios, and the operational scenarios of DNs are divided into normal and disaster scenarios to maximize their value. The model adopts the minimization of annual operating costs as the objective for normal operation and the minimization of load reduction as the optimization goal for extreme scenarios, thereby enhancing the overall benefits of energy storage applications. Compared to existing energy storage planning models, this model considers the comprehensive performance of energy storage under different scenarios, balancing the economics and resilience of the DNs.
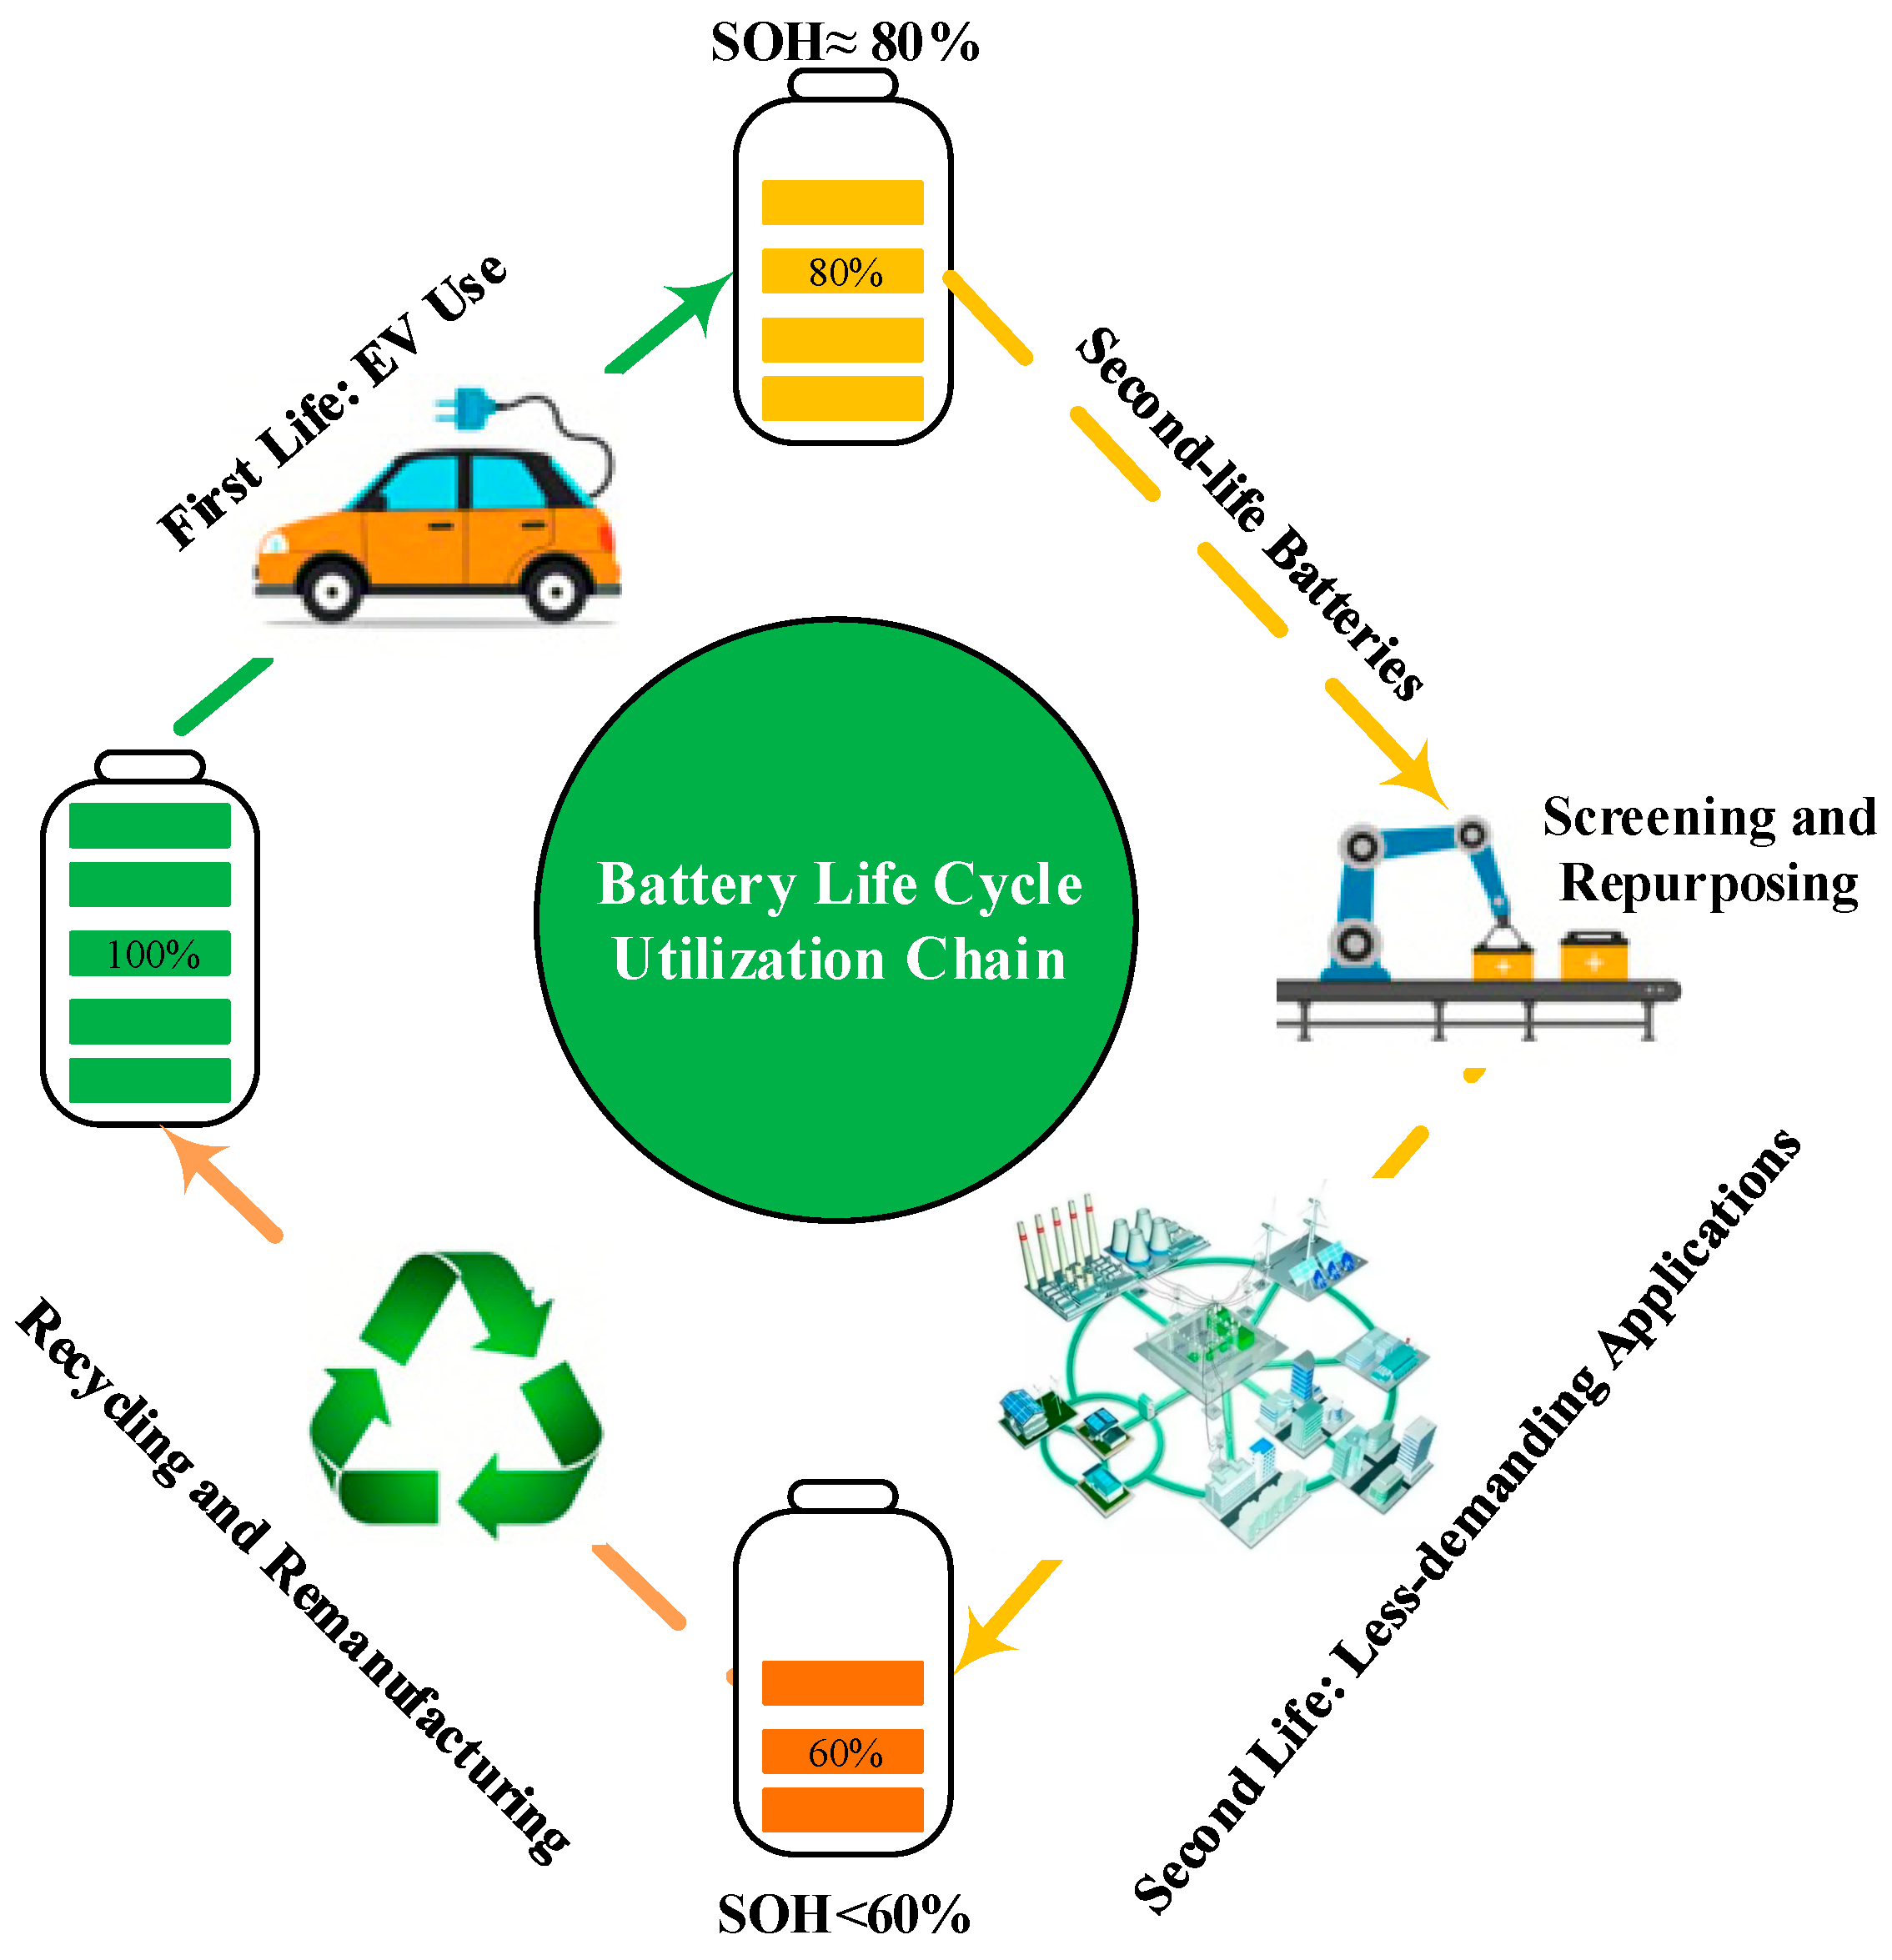
- We propose an energy storage planning model that leverages the low costs associated with SESSs derived from SLBs as well as the mobility of fresh batteries as MESSs. It alleviates the initial economic burden on energy storage investors while significantly enhancing grid resilience, providing a new idea for realizing the economics and sustainability of energy storage systems.
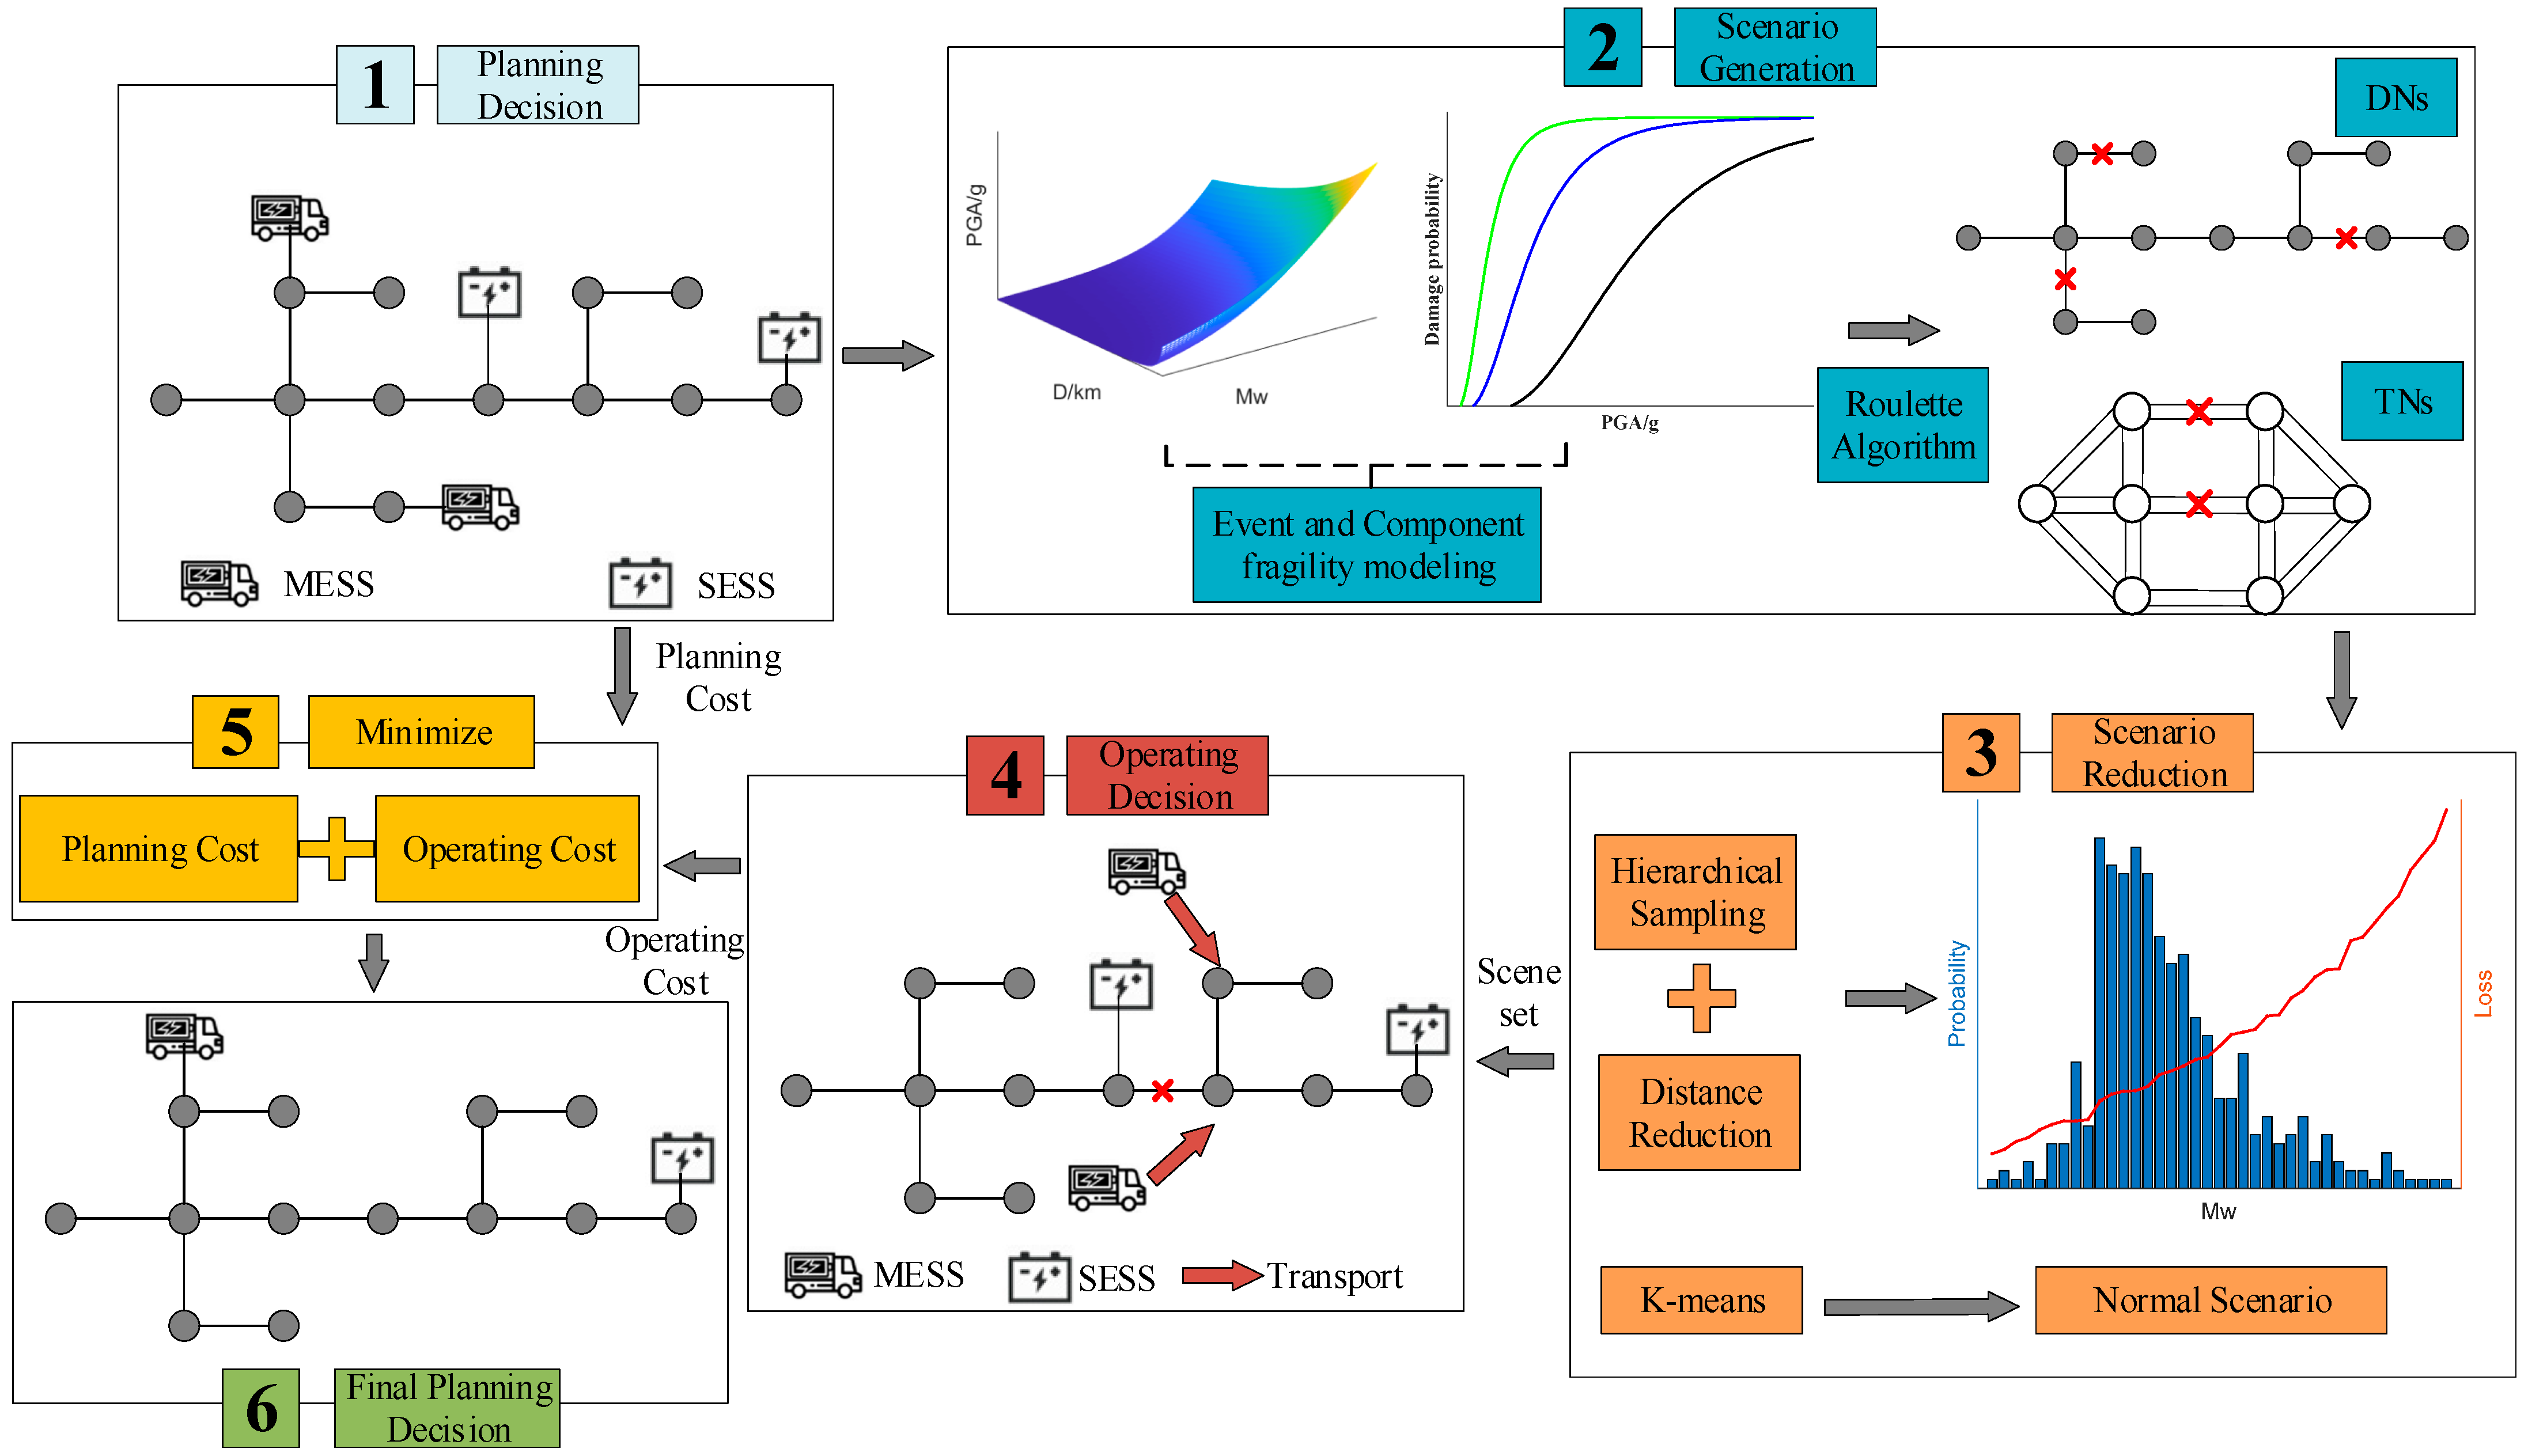
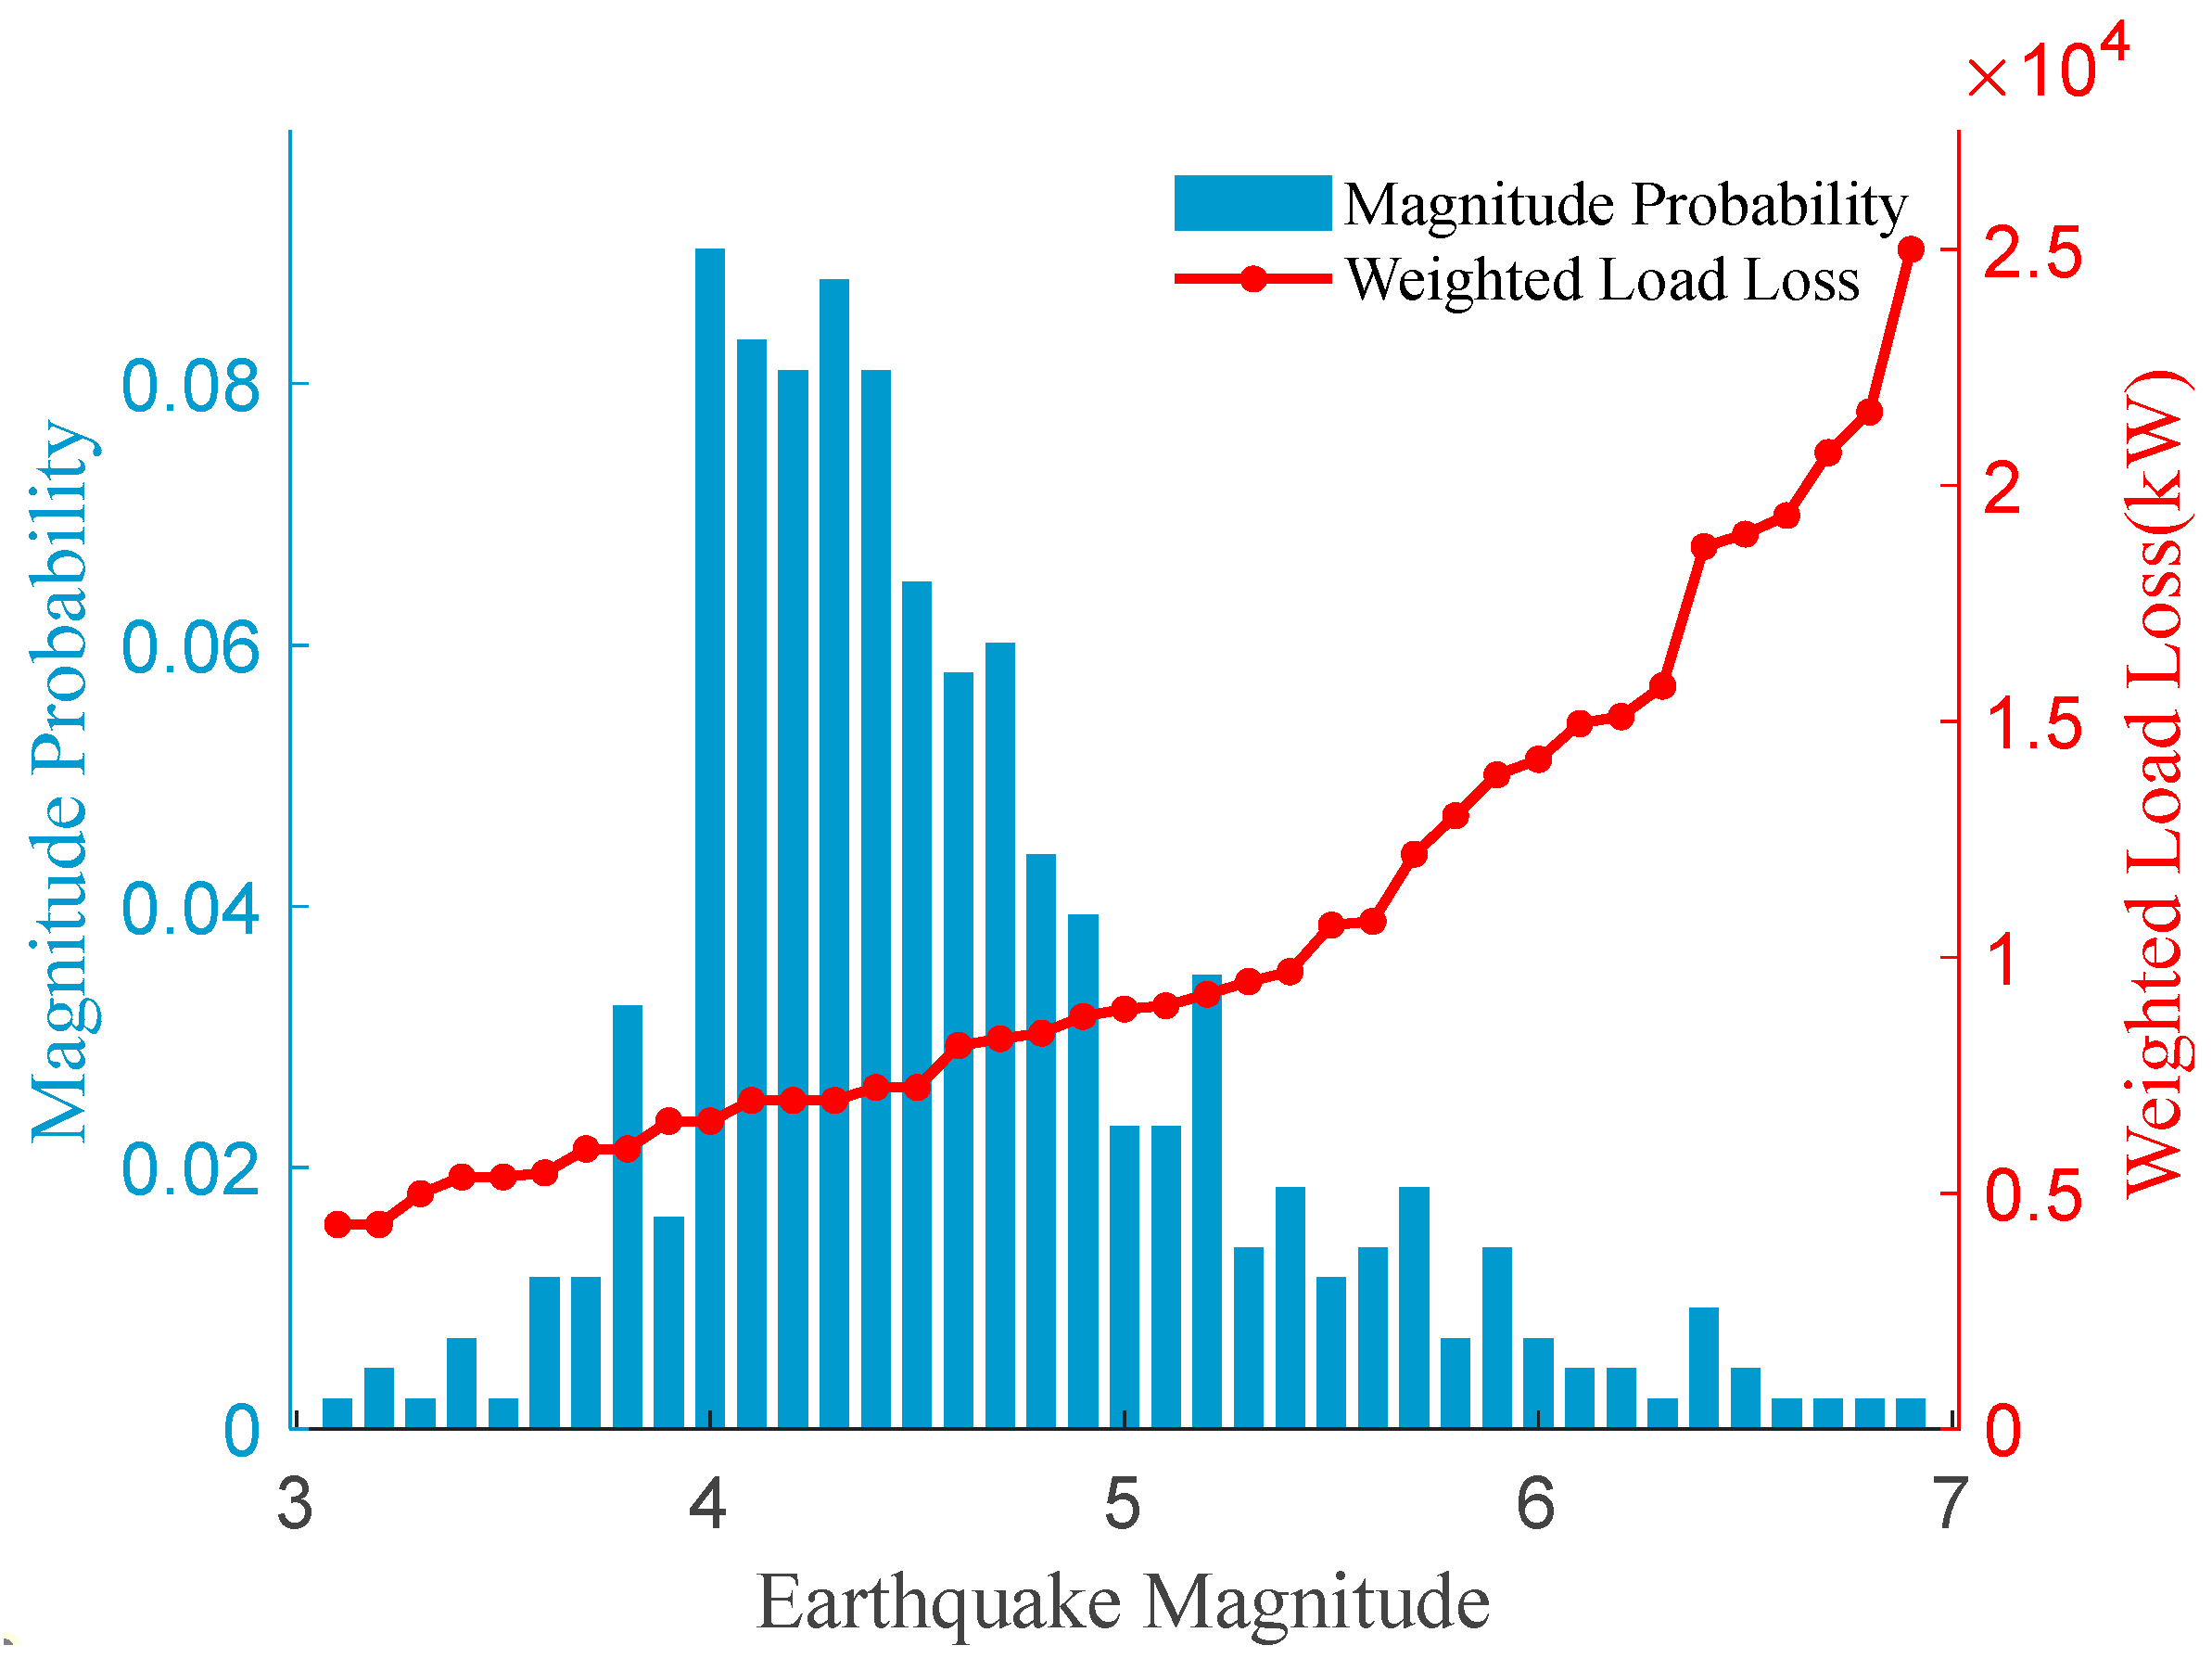
- The roulette algorithm is utilized to generate a vast array of power distribution equipment and road traffic fault scenarios, and then stratified sampling and a distance reduction method are employed, grounded in load loss considerations, to generate representative scenarios for each magnitude. The proposed method effectively captures the relationship between earthquake magnitude and system load loss, thereby reflecting actual disaster scenarios, incorporating HILP events.
2. Modeling Framework for BESS Planning
2.1. Modeling of Mobile–Stationary Hybrid Energy Storage
2.2. Operation Scenarios of DNs
2.2.1. Normal Operation
2.2.2. Disaster Operation
3. Scenario Sampling and Reduction Under Seismic Hazards
3.1. Vulnerability of Power Distribution Equipment
3.2. TNs’ Impedance Under Seismic Hazards
3.3. Seismic Hazards Scenario Generation and Reduction
| Algorithm 1: Fault Scenario Generation and Reduction |
| 1. Available information and initialization: 2. Power grid and transportation network model, equipment fragility curve, seismic data 3. Scenario Generation: 4. For m = 1, 2, …, M 5. For n = 1, 2, …, N for each line (i, j) by Equation (9) 7. Calculate the cumulative probability of PV and road by Equation (10) : damage stage 12. Else damage stage 14. Go to step 10 calculate the road damage stage 17. Scenario Reduction: 18. For m = 1, 2, …, M 19. For n = 1, 2, …, N 21. Selecting scenario as typical for DNs 23. Selecting scenario as typical for TNs |
4. Energy Storage Planning Considering Seismic Hazards
4.1. Two-Stage SIMP Model
4.2. Constraints
4.2.1. Operational Constraints of BESS
4.2.2. Distribution System Operating Constraints
4.2.3. MESS Routing Constraints
4.3. Solution Technology
| Algorithm 2: PH Algorithm |
, terminate the algorithm, otherwise go to Step 4 |
5. Case Studies
5.1. Scenario Generation and Reduction
5.2. Planning Result
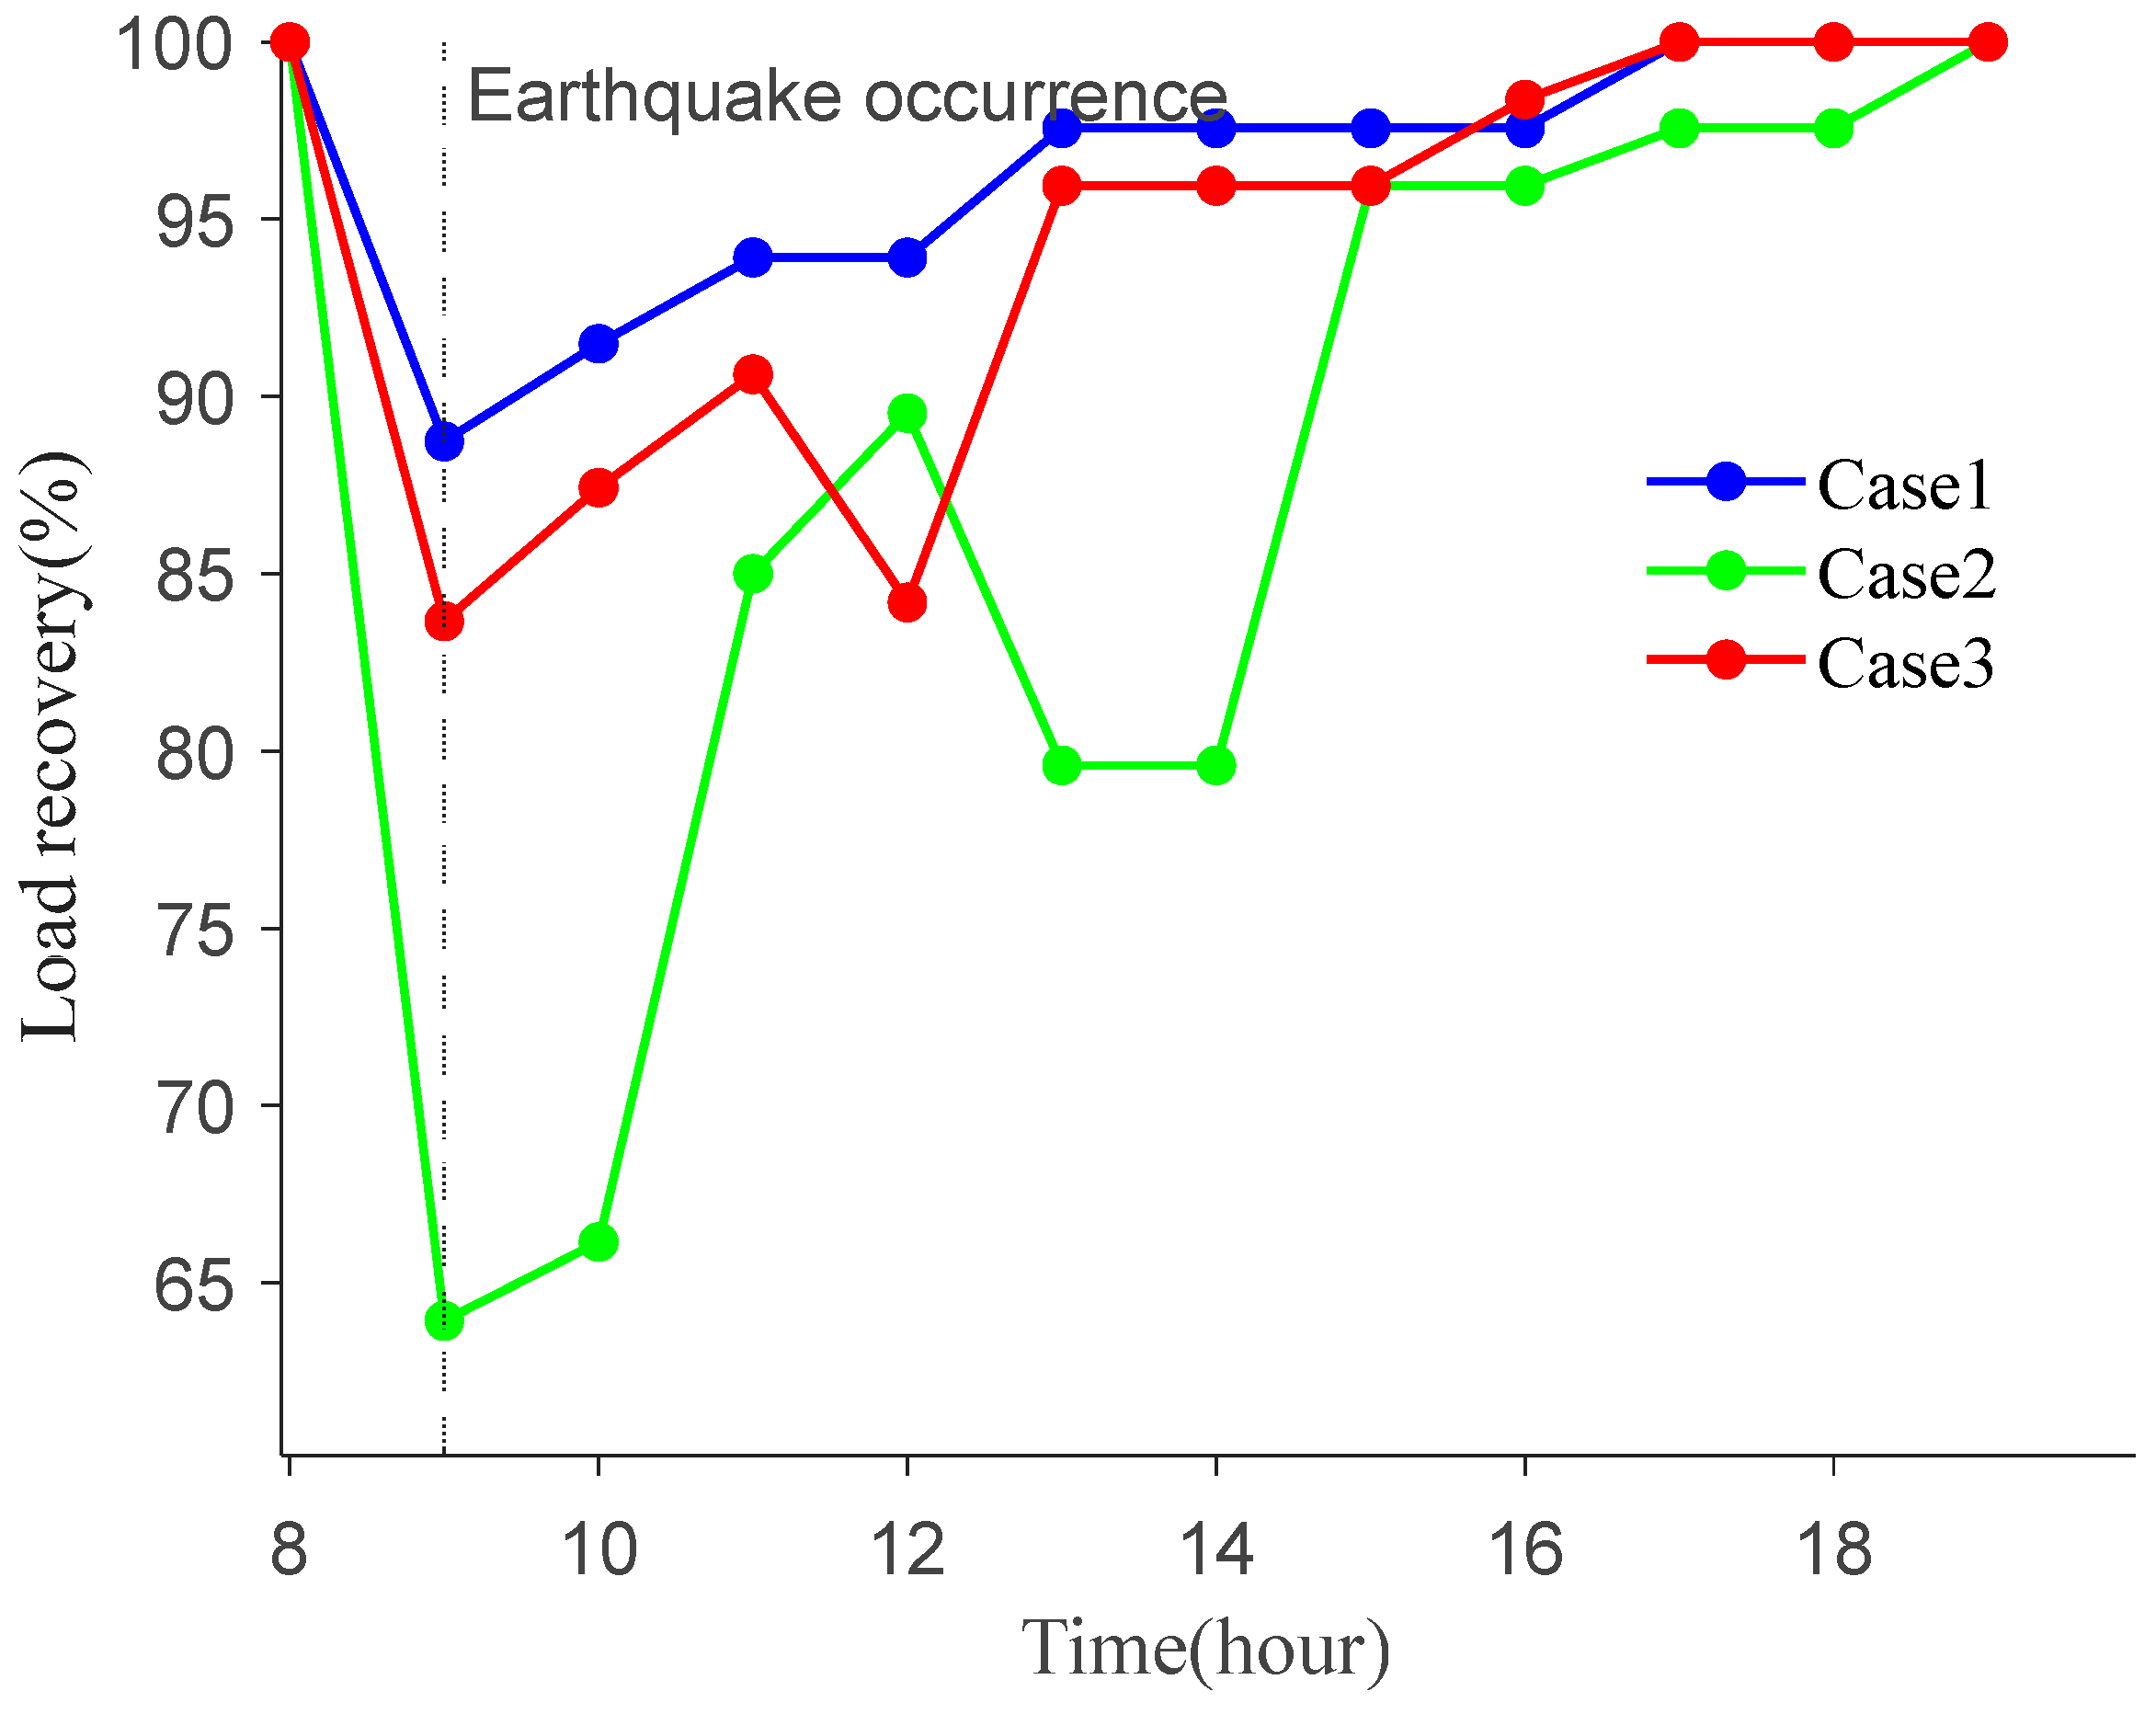
5.3. Comparison of Different Cases
6. Conclusions
- The impact of seismic hazards on distribution equipment and road traffic is quantified using the PGA, and failure probability models for both are established. Typical scenarios are created for each magnitude by employing the roulette algorithm and considering distance reduction based on load loss. The proposed method captures the relationship between earthquake magnitude and system load loss, ensuring that disaster scenarios realistically represent actual conditions and include HILP events.
- A two-stage stochastic optimization model is established, with the second stage dividing operational scenarios into normal and disaster conditions. During normal operations, BESSs generate profit through peak shaving and valley filling, while in disaster operations, BESSs ensure a continuous power supply to loads. Compared to models that consider only a single operational scenario, the efficient utilization of energy storage resources is achieved based on meeting the dual goals of good economy and resilience of DNs.
- This paper proposes a novel hybrid energy storage planning model that utilizes low-cost SLBs to construct SESSs and fresh batteries as MESSs. The proposed planning scheme can effectively reduce the initial economic pressure of the energy storage investor while improving the grid resilience, providing a new idea for realizing the economy and sustainability of the energy storage system.
Author Contributions
Funding
Data Availability Statement
Conflicts of Interest
Abbreviations
| HILP | high impact low probability |
| DNs | distribution networks |
| TNs | transportation networks |
| BESS | battery energy storage systems |
| MESS | mobile energy storage systems |
| SESS | stationary energy storage systems |
| SLBs | second-life batteries |
References
- Shi, Q.; Liu, W.; Zeng, B.; Hui, H.; Li, F. Enhancing Distribution System Resilience against Extreme Weather Events: Concept Review, Algorithm Summary, and Future Vision. Int. J. Electr. Power Energy Syst. 2022, 138, 107860. [Google Scholar] [CrossRef]
- Ozen, C.; Kaya, K. Earthquake Effects on Electricity Network: A Case Study in Turkish Grid. In Proceedings of the 2023 5th Global Power, Energy and Communication Conference (GPECOM), Nevsehir, Turkey, 14–16 June 2023; pp. 333–338. [Google Scholar]
- China News. China Experienced 726 Earthquakes of Magnitude 3 or Above, with the Highest Magnitude Reaching 6.9. Available online: https://m.chinanews.com/wap/detail/chs/zw/9927702.shtml (accessed on 4 January 2024).
- Mate, A.; Hagan, T.; Cotilla-Sanchez, E.; Brekken, T.K.A.; Von Jouanne, A. Impacts of Earthquakes on Electrical Grid Resilience. In Proceedings of the 2021 IEEE/IAS 57th Industrial and Commercial Power Systems Technical Conference (I&CPS), Las Vegas, NV, USA, 27–30 April 2021; pp. 1–5. [Google Scholar]
- Umunnakwe, A.; Huang, H.; Oikonomou, K.; Davis, K.R. Quantitative Analysis of Power Systems Resilience: Standardization, Categorizations, and Challenges. Renew. Sustain. Energy Rev. 2021, 149, 111252. [Google Scholar] [CrossRef]
- Zhang, H.; Ma, S.; Ding, T.; Lin, Y.; Shahidehpour, M. Multi-Stage Multi-Zone Defender-Attacker-Defender Model for Optimal Resilience Strategy with Distribution Line Hardening and Energy Storage System Deployment. IEEE Trans. Smart Grid 2021, 12, 1194–1205. [Google Scholar] [CrossRef]
- Wang, Y.; Rousis, A.O.; Strbac, G. Resilience-driven optimal sizing and pre-positioning of mobile energy storage systems in decentralized networked microgrids. Appl. Energy 2022, 305, 117921. [Google Scholar] [CrossRef]
- Ma, S.; Li, S.; Wang, Z.; Qiu, F. Resilience-Oriented Design of Distribution Systems. IEEE Trans. Power Syst. 2019, 34, 2880–2891. [Google Scholar] [CrossRef]
- Li, T.; Han, X.; Wu, W.; Sun, H. Robust Expansion Planning and Hardening Strategy of Meshed Multi-Energy Distribution Networks for Resilience Enhancement. Appl. Energy 2023, 341, 121066. [Google Scholar] [CrossRef]
- Ma, S.; Su, L.; Wang, Z.; Qiu, F.; Guo, G. Resilience Enhancement of Distribution Grids Against Extreme Weather Events. IEEE Trans. Power Syst. 2018, 33, 4842–4853. [Google Scholar] [CrossRef]
- Shi, W.; Liang, H.; Bittner, M. Stochastic Planning for Power Distribution System Resilience Enhancement Against Earthquakes Considering Mobile Energy Resources. IEEE Trans. Sustain. Energy 2024, 15, 414–428. [Google Scholar] [CrossRef]
- Lei, S.; Chen, C.; Zhou, H.; Hou, Y. Routing and Scheduling of Mobile Power Sources for Distribution System Resilience Enhancement. IEEE Trans. Smart Grid 2019, 10, 5650–5662. [Google Scholar] [CrossRef]
- Arif, A.; Wang, Z.; Wang, J.; Chen, C. Power Distribution System Outage Management with Co-Optimization of Repairs, Reconfiguration, and DG Dispatch. IEEE Trans. Smart Grid 2018, 9, 4109–4118. [Google Scholar] [CrossRef]
- Zhang, G.; Zhang, F.; Zhang, X.; Meng, K.; Dong, Z.Y. Sequential Disaster Recovery Model for Distribution Systems with Co-Optimization of Maintenance and Restoration Crew Dispatch. IEEE Trans. Smart Grid 2020, 11, 4700–4713. [Google Scholar] [CrossRef]
- Giannitrapani, A.; Paoletti, S.; Vicino, A.; Zarrilli, D. Optimal Allocation of Energy Storage Systems for Voltage Control in LV Distribution Networks. IEEE Trans. Smart Grid 2017, 8, 2859–2870. [Google Scholar] [CrossRef]
- Ahmed, H.M.A.; Sindi, H.F.; Azzouz, M.A.; Awad, A.S.A. Optimal Sizing and Scheduling of Mobile Energy Storage Toward High Penetration Levels of Renewable Energy and Fast Charging Stations. IEEE Trans. Energy Convers. 2022, 37, 1075–1086. [Google Scholar] [CrossRef]
- Wang, Z.; Lin, W.; Yang, Z.; Yu, J. A Reliability-constrained Distribution Network Expansion Planning Method Considering Flexibility Space of Power Demand. Proc. CSEE 2022, 42, 6655–6668. [Google Scholar] [CrossRef]
- Yang, Z.; Dehghanian, P.; Nazemi, M. Seismic-Resilient Electric Power Distribution Systems: Harnessing the Mobility of Power Sources. IEEE Trans. Ind. Appl. 2020, 56, 2304–2313. [Google Scholar] [CrossRef]
- Jiang, X.; Chen, J.; Zhang, W.; Wu, Q.; Zhang, Y.; Liu, J. Two-Step Optimal Allocation of Stationary and Mobile Energy Storage Systems in Resilient Distribution Networks. J. Mod. Power Syst. Clean Energy 2021, 9, 788–799. [Google Scholar] [CrossRef]
- Rajabzadeh, M.; Kalantar, M. Improving the Resilience of Distribution Network in Coming across Seismic Damage Using Mobile Battery Energy Storage System. J. Energy Storage 2022, 52, 104891. [Google Scholar] [CrossRef]
- Meng, H.; Jia, H.; Xu, T.; Wei, W.; Wu, Y.; Liang, L.; Cai, S.; Liu, Z.; Wang, R.; Li, M. Optimal Configuration of Cooperative Stationary and Mobile Energy Storage Considering Ambient Temperature: A Case for Winter Olympic Game. Appl. Energy 2022, 325, 119889. [Google Scholar] [CrossRef]
- Kebede, A.A.; Hosen, M.S.; Kalogiannis, T.; Behabtu, H.A.; Assefa, M.Z.; Jemal, T.; Ramayya, V.; Van Mierlo, J.; Coosemans, T.; Berecibar, M. Optimal Sizing and Lifetime Investigation of Second Life Lithium-Ion Battery for Grid-Scale Stationary Application. J. Energy Storage 2023, 72, 108541. [Google Scholar] [CrossRef]
- Hu, X.; Deng, X.; Wang, F.; Deng, Z.; Lin, X.; Teodorescu, R.; Pecht, M.G. A Review of Second-Life Lithium-Ion Batteries for Stationary Energy Storage Applications. Proc. IEEE 2022, 110, 735–753. [Google Scholar] [CrossRef]
- Yang, Y.; Qiu, J.; Zhang, C.; Zhao, J.; Wang, G. Flexible Integrated Network Planning Considering Echelon Utilization of Second Life of Used Electric Vehicle Batteries. IEEE Trans. Transp. Electrif. 2022, 8, 263–276. [Google Scholar] [CrossRef]
- Jinlei, S.; Lei, P.; Ruihang, L.; Qian, M.; Chuanyu, T.; Tianru, W. Economic Operation Optimization for 2nd Use Batteries in Battery Energy Storage Systems. IEEE Access 2019, 7, 41852–41859. [Google Scholar] [CrossRef]
- Nazemi, M.; Moeini-Aghtaie, M.; Fotuhi-Firuzabad, M.; Dehghanian, P. Energy Storage Planning for Enhanced Resilience of Power Distribution Networks Against Earthquakes. IEEE Trans. Sustain. Energy 2020, 11, 795–806. [Google Scholar] [CrossRef]
- El-Maissi, A.M.; Argyroudis, S.A.; Nazri, F.M. Seismic Vulnerability Assessment Methodologies for Roadway Assets and Networks: A State-of-the-Art Review. Sustainability 2020, 13, 61. [Google Scholar] [CrossRef]
- FEMA. Multi-Hazard Loss Estimation Methodology Earthquake Model. Available online: https://www.fema.gov/sites/default/files/2020-09/fema_hazus_earthquake-model_technical-manual_2.1.pdf (accessed on 9 September 2024).
- Yang, H.; Bell, M.G.H.; Meng, Q. Modeling the Capacity and Level of Service of Urban Transportation Networks. Transp. Res. Part B Methodol. 2000, 34, 255–275. [Google Scholar] [CrossRef]
- Xuan, G.; Lin, J.; Liu, J. A method for assessing the overall function failure of transportation networks after an earthquake. J. Seismol. Res. 2022, 45, 362–369. [Google Scholar] [CrossRef]
- Argyroudis, S.; Kaynia, A.M. Analytical Seismic Fragility Functions for Highway and Railway Embankments and Cuts. Earthq. Eng. Struct. Dyn. 2015, 44, 1863–1879. [Google Scholar] [CrossRef]
- Zhou, G.; Dong, Q.; Zhao, Y.; Wang, H.; Jian, L.; Jia, Y. Bilevel Optimization Approach to Fast Charging Station Planning in Electrified Transportation Networks. Appl. Energy 2023, 350, 121718. [Google Scholar] [CrossRef]


| Damage State | PV Output | Road Attenuation |
|---|---|---|
| none | 1.0 | 1.0 |
| slight | 1.0 | 0.8 |
| moderate | 0.5 | 0.5 |
| extensive | 0 | 0 |
| complete | 0 | 0 |
| Traffic Node | Distribution Node | Traffic Node | Distribution Node |
|---|---|---|---|
| 1 | 21 | 7 | 14 |
| 2 | 2 | 8 | 15 |
| 3 | 12 | 9 | 27 |
| 4 | 8 | 10 | 29 |
| 5 | 3 | 11 | 18 |
| 6 | 1 | 12 | 32 |
| Hybrid Energy Storage | Fresh | SLBs |
|---|---|---|
| 3 | 3 | |
| 2150 CNY/kWh | 1000 CNY/kWh | |
| 1100 CNY/kW | 400 CNY/kW | |
| 10 | 5 | |
| 0.95 | 0.85 | |
| 0.2 | 0.2 | |
| 0.1–0.9 | 0.1–0.9 |
| Time Period | Time | Tariff (CNY/kWh) |
|---|---|---|
| Trough | 23:00–7:00 | 0.35 |
| Flat | 13:00–18:00 | 0.7 |
| Peak | 8:00–12:00; 19:00–22:00 | 1.4 |
| Normal Scenario | Probability | Normal Scenario | Probability |
|---|---|---|---|
| 1 | 0.135 | 4 | 0.176 |
| 2 | 0.218 | 5 | 0.262 |
| 3 | 0.209 |
| Magnitude 5 Earthquake | Time Period | ||||||||
| 9 | 10 | 11 | 12 | 13 | 14 | 15 | 16–19 | ||
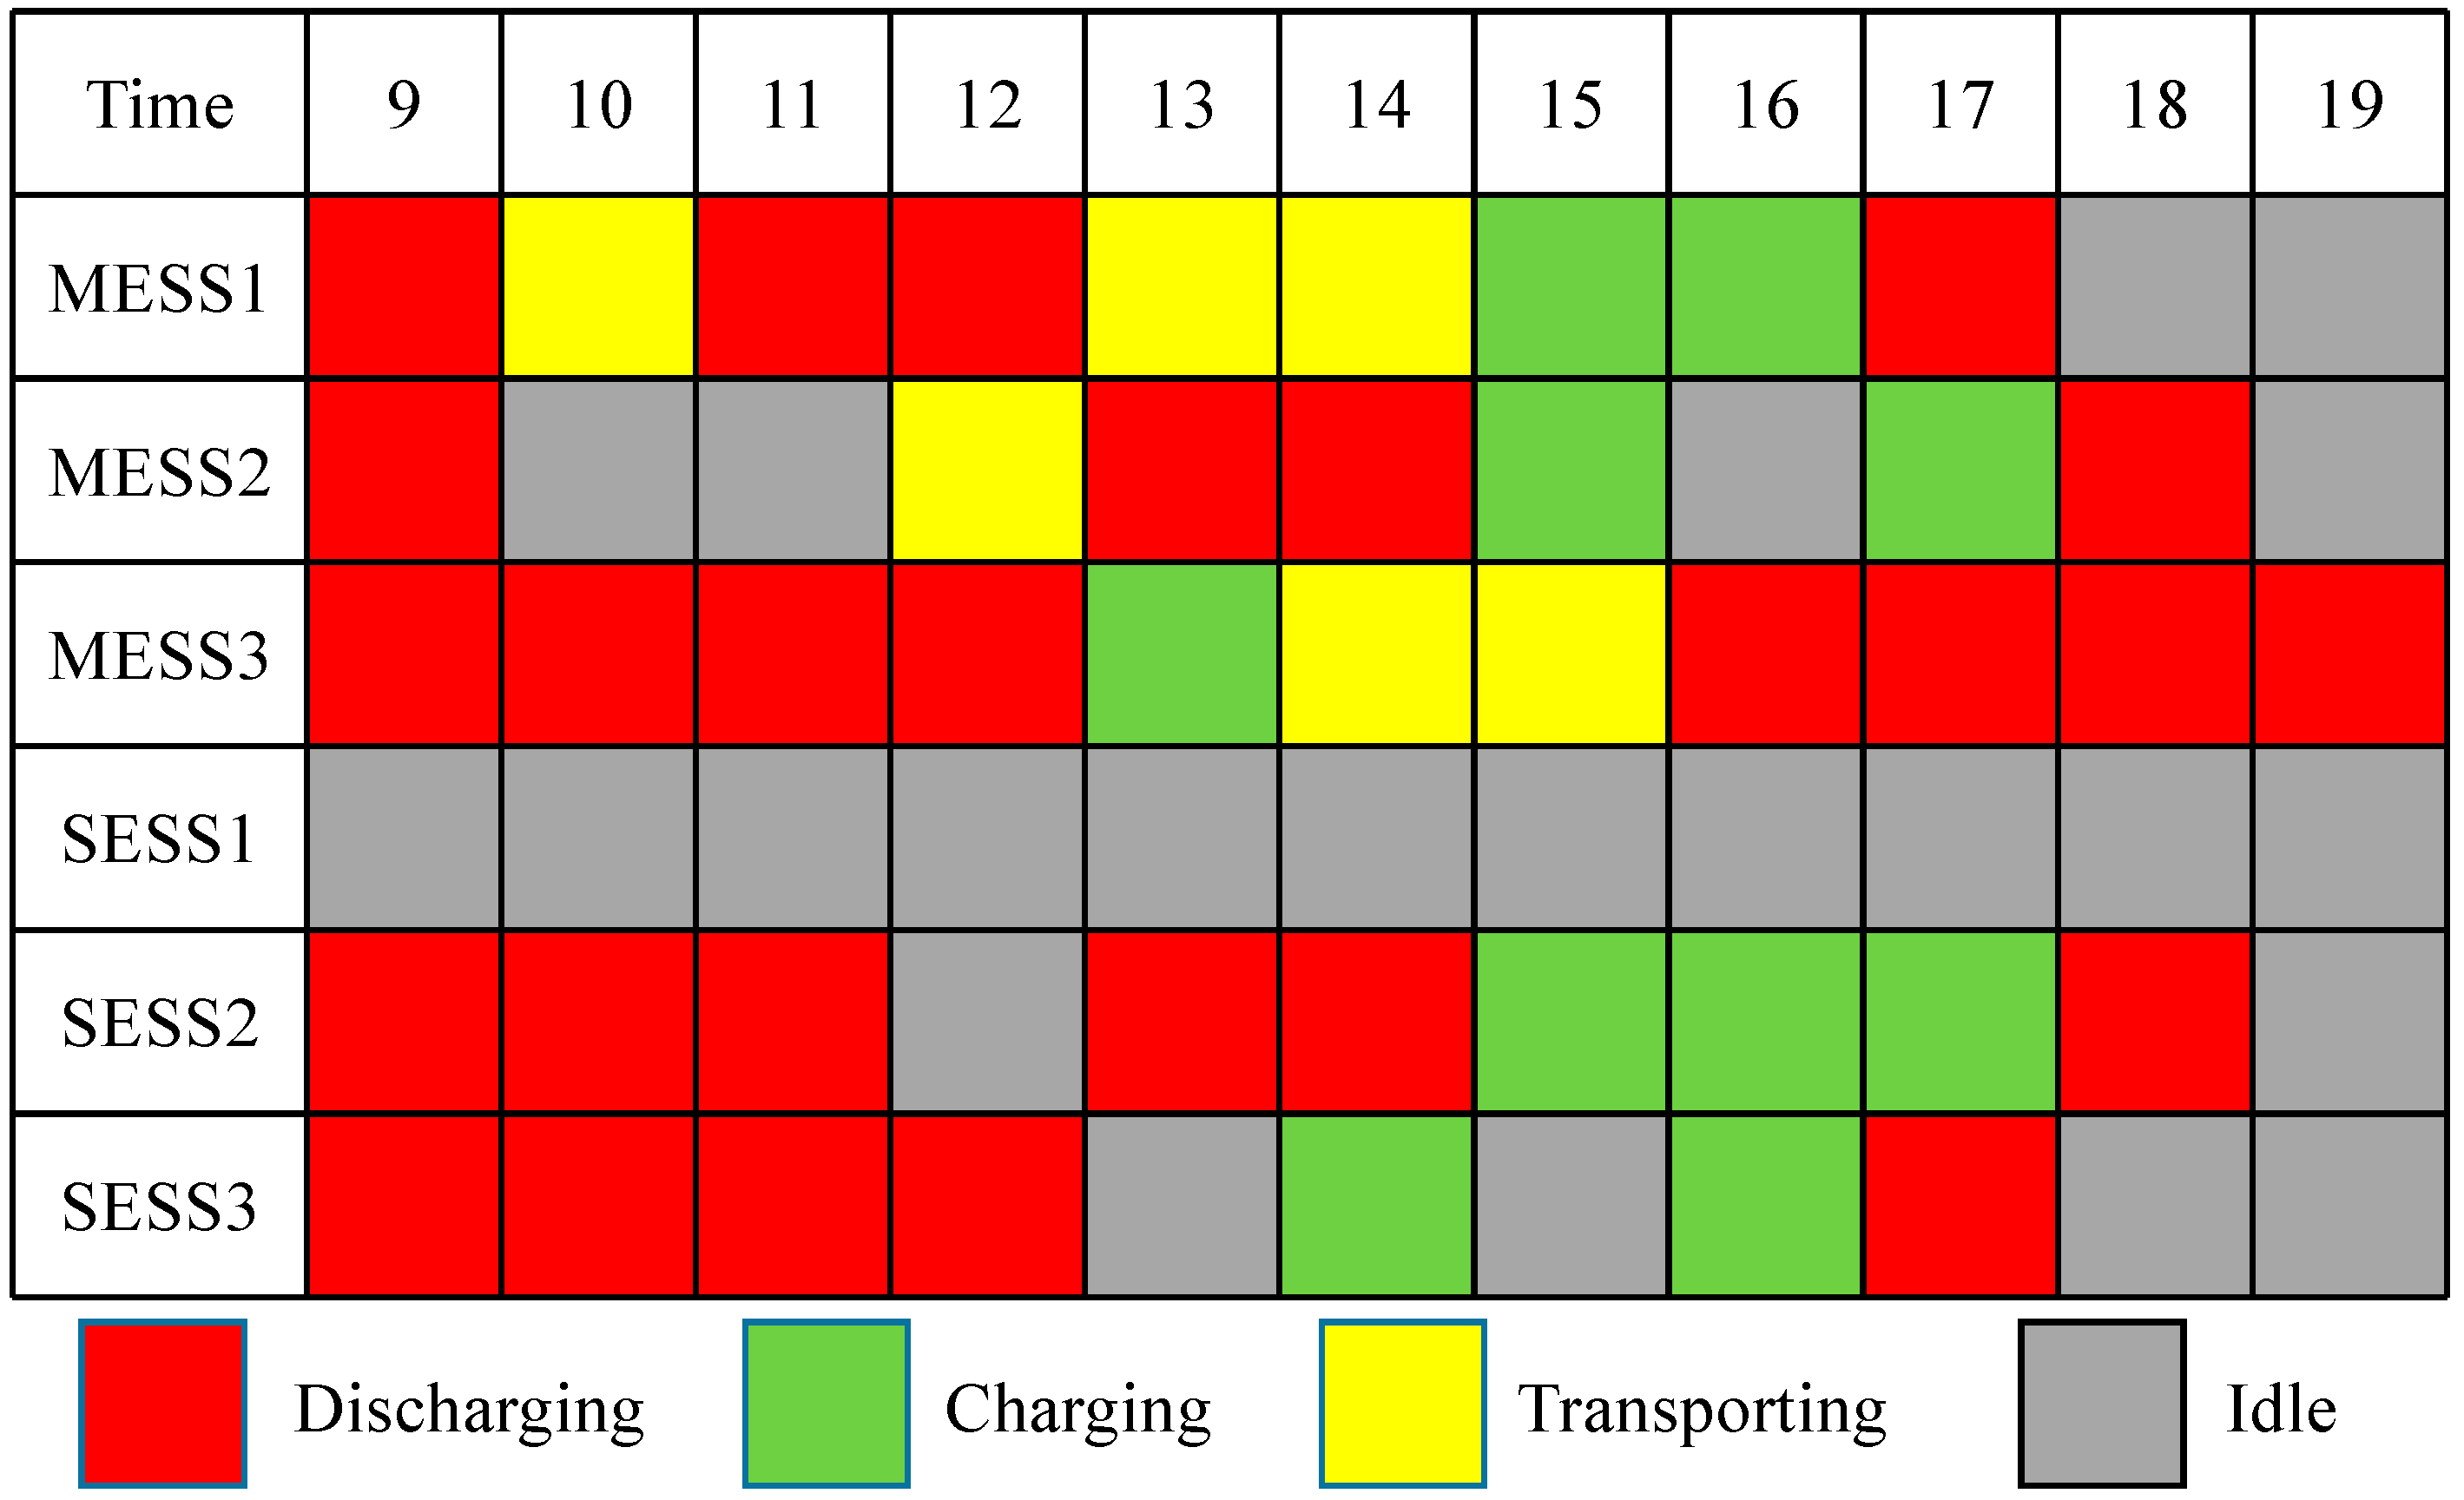
| Dispatch | MESS1 | 21 | → | 8 | → | 2 | |||
| MESS2 | 3 | → | 8 | ||||||
| MESS3 | 29 | → | 18 | ||||||
| Case | Type | Capacity (kWh) | Investment Cost (CNY 103) | Benefit of BESS (CNY 103) | Load Shedding Cost (CNY 103) |
|---|---|---|---|---|---|
| 1 | SESS | 1200, 2000, 2000 | 1955 | 2328 | 456 |
| MESS | 1900, 2000, 2000 | 2125 | 2914 | ||
| 2 | SLBs | 2000, 2000, 2000 | 1642 | 2061 | 1400 |
| Fresh | 1700, 2000, 1800 | 1981 | 2780 | ||
| 3 | SESS | 2000, 2000, 1700 | 1557 | 1962 | 825 |
| MESS | 2000, 1800, 2000 | 2089 | 2910 |
Disclaimer/Publisher’s Note: The statements, opinions and data contained in all publications are solely those of the individual author(s) and contributor(s) and not of MDPI and/or the editor(s). MDPI and/or the editor(s) disclaim responsibility for any injury to people or property resulting from any ideas, methods, instructions or products referred to in the content. |
© 2025 by the authors. Licensee MDPI, Basel, Switzerland. This article is an open access article distributed under the terms and conditions of the Creative Commons Attribution (CC BY) license (https://creativecommons.org/licenses/by/4.0/).
Share and Cite
Deng, C.; Shen, X.; Tang, X. Optimal Configuration of Mobile–Stationary Hybrid Energy Storage Considering Seismic Hazards. Energies 2025, 18, 2052. https://doi.org/10.3390/en18082052
Deng C, Shen X, Tang X. Optimal Configuration of Mobile–Stationary Hybrid Energy Storage Considering Seismic Hazards. Energies. 2025; 18(8):2052. https://doi.org/10.3390/en18082052
Chicago/Turabian StyleDeng, Chengcheng, Xiaodong Shen, and Xisheng Tang. 2025. "Optimal Configuration of Mobile–Stationary Hybrid Energy Storage Considering Seismic Hazards" Energies 18, no. 8: 2052. https://doi.org/10.3390/en18082052
APA StyleDeng, C., Shen, X., & Tang, X. (2025). Optimal Configuration of Mobile–Stationary Hybrid Energy Storage Considering Seismic Hazards. Energies, 18(8), 2052. https://doi.org/10.3390/en18082052