Article

Asymmetric Four-Terminal Solar Concentrator Improving Power Collection in Bifacial Solar Cells

by
Floriana Morabito
1,
Daniela Fontani
2,*,
Paola Sansoni
2,
Salvatore Lombardo
3,
Andrea Farina
1 and
Silvia Maria Pietralunga
1
1
CNR-Institute for Photonics and Nanotechnologies Milano, Piazza L. da Vinci 32, 20133 Milan, Italy
2
CNR-National Institute of Optics, Largo E. Fermi 6, 50125 Firenze, Italy
3
CNR-Institute for Microelectronics and Microsystems, Zona Industriale, Ottava Strada 5, 95121 Catania, Italy
*
Author to whom correspondence should be addressed.
Energies 2025, 18(8), 2044; https://doi.org/10.3390/en18082044
Submission received: 21 March 2025 / Revised: 9 April 2025 / Accepted: 10 April 2025 / Published: 16 April 2025
(This article belongs to the Section A2: Solar Energy and Photovoltaic Systems)

Abstract

:
The exploitation of bifacial solar cells in photovoltaics aims to provide cost-effective solutions to maximize solar power collection on specific surfaces. A prerequisite for this is the effective collection of backscattered diffuse light from albedo, to which self-shading is an obstacle. We discuss the benefits of bifaciality for an asymmetric low-concentrating and spectral-splitting photovoltaic optics system that features a wedged right-prism geometry to address self-shading. The performance of the conceptual design is analyzed, using commercial ray-tracing software, for four different latitudes of installation, by assuming a standard solar AM1.5G spectrum as input. The daily Relative Optical Power Increase (ROPI) is evaluated with respect to standard flat bifacial configurations, reaching ROPI = 293% at a latitude of 25° north at winter solstice. The photocurrent and total Power Conversion Efficiency (PCE) in a four-terminal (4T) configuration are estimated, assuming the operation of a commercial Si HJT bifacial cell and a commercial single-junction GaAs cell. A global increase in PCE of up to 23% is obtained with respect to the best-performing trackless standard bifacial configuration. From this perspective, the use of high-performance, high-bandgap solar cells in 4T configurations might further leverage the advantages of the optics proposed here.

1. Introduction

At the system level, one of the key ingredients for the cost-effectiveness of photovoltaic (PV) energy conversion resides in the optimized usage of the space available for the installation of solar modules. Limitations in the extent of exploitable soil represent a typical constraint in large, utility-scale plants, as well as in domestic systems. When addressing energy demand in a dense urban context, one approach to tackling land occupation issues involves designing and fabricating building-integrated PV (BIPV) systems [1]. The need to cope with restrictions in terms of the surface available is even stronger in the case of “portable PV” solutions for self-powered devices, vehicles, and vessels, which face intrinsic limitations in dimensions. All of these are possible market sectors for integrated PV (IPV) solutions, which are often customized and specifically tailored to a particular application [2,3,4,5,6,7,8,9,10,11,12,13]. For these purposes, IPV solutions may be quite diverse in terms of the shape, size, optical design, and type of solar cell employed. Also, the stringent constraints in terms of cost that heavily affect the utility-scale market can be somewhat relaxed in this context, to the extent that the PV module itself becomes a design element of the final product, and the customer is willing to pay for this. It is worth noting that, when dealing with IPV solutions, in contrast to utility-scale applications, functionality and esthetics typically coexist thanks to innovative designs, e.g., as discussed by Borja Block A. and co-authors in [2]. Especially when dealing with trackless and stationary outer IPV systems, the installation site, its latitude, and the corresponding sun elevation at noon play crucial roles in defining the proper cell orientation, and ultimately in determining the actual efficiency of the PV system.
At the level of PV module technology, one approach to maximizing solar energy conversion per unit of area is to use bifacial solar cells that collect backscattered radiation from the ground at their rear side [14]. Bifacial silicon-based solar cells are presently the most convenient available technology to maximize the Power Conversion Efficiency (PCE) in a given area [15], defined as PCE = Pout,el/Pin,opt, where Pout,el is the electrical power output of the PV system and Pin,opt is the optical power input. These cells generally increase the PCE by 20% in modules [16]. Non-silicon-based solar cell technologies are also increasingly being confronted with the bifacial paradigm [17]. In a recent review by Mahim M.T. and co-authors, a comparative study between mono- and bifacial approaches was reported, concluding that bifaciality is generally the winning choice, providing higher energy collection at lower costs [18,19].
Bifaciality may also be an added feature in multijunction PV systems that aim to overcome the Shockley–Queisser limit in PCE [20], e.g., as is the case of the four-terminal (4T) dual-junction approach. Classically, the 4T configuration is a tandem architecture made of two stacked cells. The top cell, with a higher bandgap, works in the visible (VIS) spectrum, and the bottom cell works in the near-infrared (NIR) one. Stacked cells have a common shape and are optically, but not electrically, “in series”, with no need for monolithic integration [21,22,23].
An alternative solution to cell stacking is spectral splitting, based on the separation of optical paths for light belonging to different spectral ranges [24]. In this case, the need for a common shape is obsolete, and each solar cell technology can be independently optimized [25,26,27,28]. A recent review of spectral splitting for PV modules, mainly devoted to thermal energy recovery, is provided by Hong W. and coworkers [29]. Hence, in principle, the combination of bifaciality, 4T electrical connection, and spectral splitting can be a winning strategy to improve PCE in PV systems, as some authors also suggest in Refs. [25,28]. In particular, Ref. [25] describes the working principle and potentialities of an asymmetric low-gain optical concentrator, designed as a wedged right-angled prism light guide coupled to dichroic mirrors for spectral splitting. The configuration exploits a Si (silicon) bifacial solar cell and a GaAs (gallium arsenide) cell for the NIR and VIS spectra, respectively. By using a right-angled prism, the spectral splitting function is implemented with minimized land occupation, and the result is a PV tile, which can be employed as the primary element of larger PV modules and is also suitable for integration in both indoor and outdoor systems, like BIPV solar venetian blinds and active sunshades [30,31]. Other IPV applications are also possible if one considers similar optical elements in the shape of micro-facets, as proposed by Cook J. M. and co-authors in [32]. In addition, the peculiar geometry of the optical design in [25] entails counter-intuitive angular orientation conditions of PV cells. In particular, the orientation of the bifacial cell with respect to the ground is different from the typical orientation of standard bifacial solutions [33,34]. This specific orientation is claimed to be advantageous for bifacial operation, in that it is expected to lower the self-shading effect of the module, thus improving the collection of diffused radiation from the ground. When a bifacial PV cell is directly exposed to sunlight, the back of the cell receives light from ground that is in the shade of the cell; meanwhile, with the proposed prism configuration, the back of the Si cell receives light from unshaded ground. In this work, we deepen the numerical study of the bifacial performance of a conceptual design of a photovoltaic system, as introduced in Ref. [25], providing an analytical description of the radiation collection on the back face of the bifacial solar cell, in different possible installation conditions. More specifically, a bifacial solar cell inserted in the 4T spectral splitting geometry is compared in terms of performances with equivalent cells in typical standard orientations for flat modules and a daily Relative Optical Power Increase (ROPI) is defined; the goal is to quantify the increase in diffuse optical power collected on the back face of the cell. The ROPI has been numerically evaluated considering the shading effect, the safety height of the PV elements, the diffusive nature of the terrain, and the installation latitudes of the systems. Numerical modelling is based on a commercial ray tracing software environment (ZEMAX OpticStudio, 22.2 Professional) and the standard solar spectrum ASTM G-173-03 AM1.5G [35] is taken as a general reference. We demonstrate that a certain positive degree of ROPI is always present for bifacial cells mounted in 4T prismatic configuration and that the value is higher for installations at lower latitudes and in winter. The total amount of optical power collected is also studied. In particular, the photocurrent and total PCE were estimated as functions of the installation site and the operating parameters of the solar cells. In the following sections, we show and discuss the possible advantages of the 4T bifacial configuration over the standard flat ones.

2. Methods and Analysis

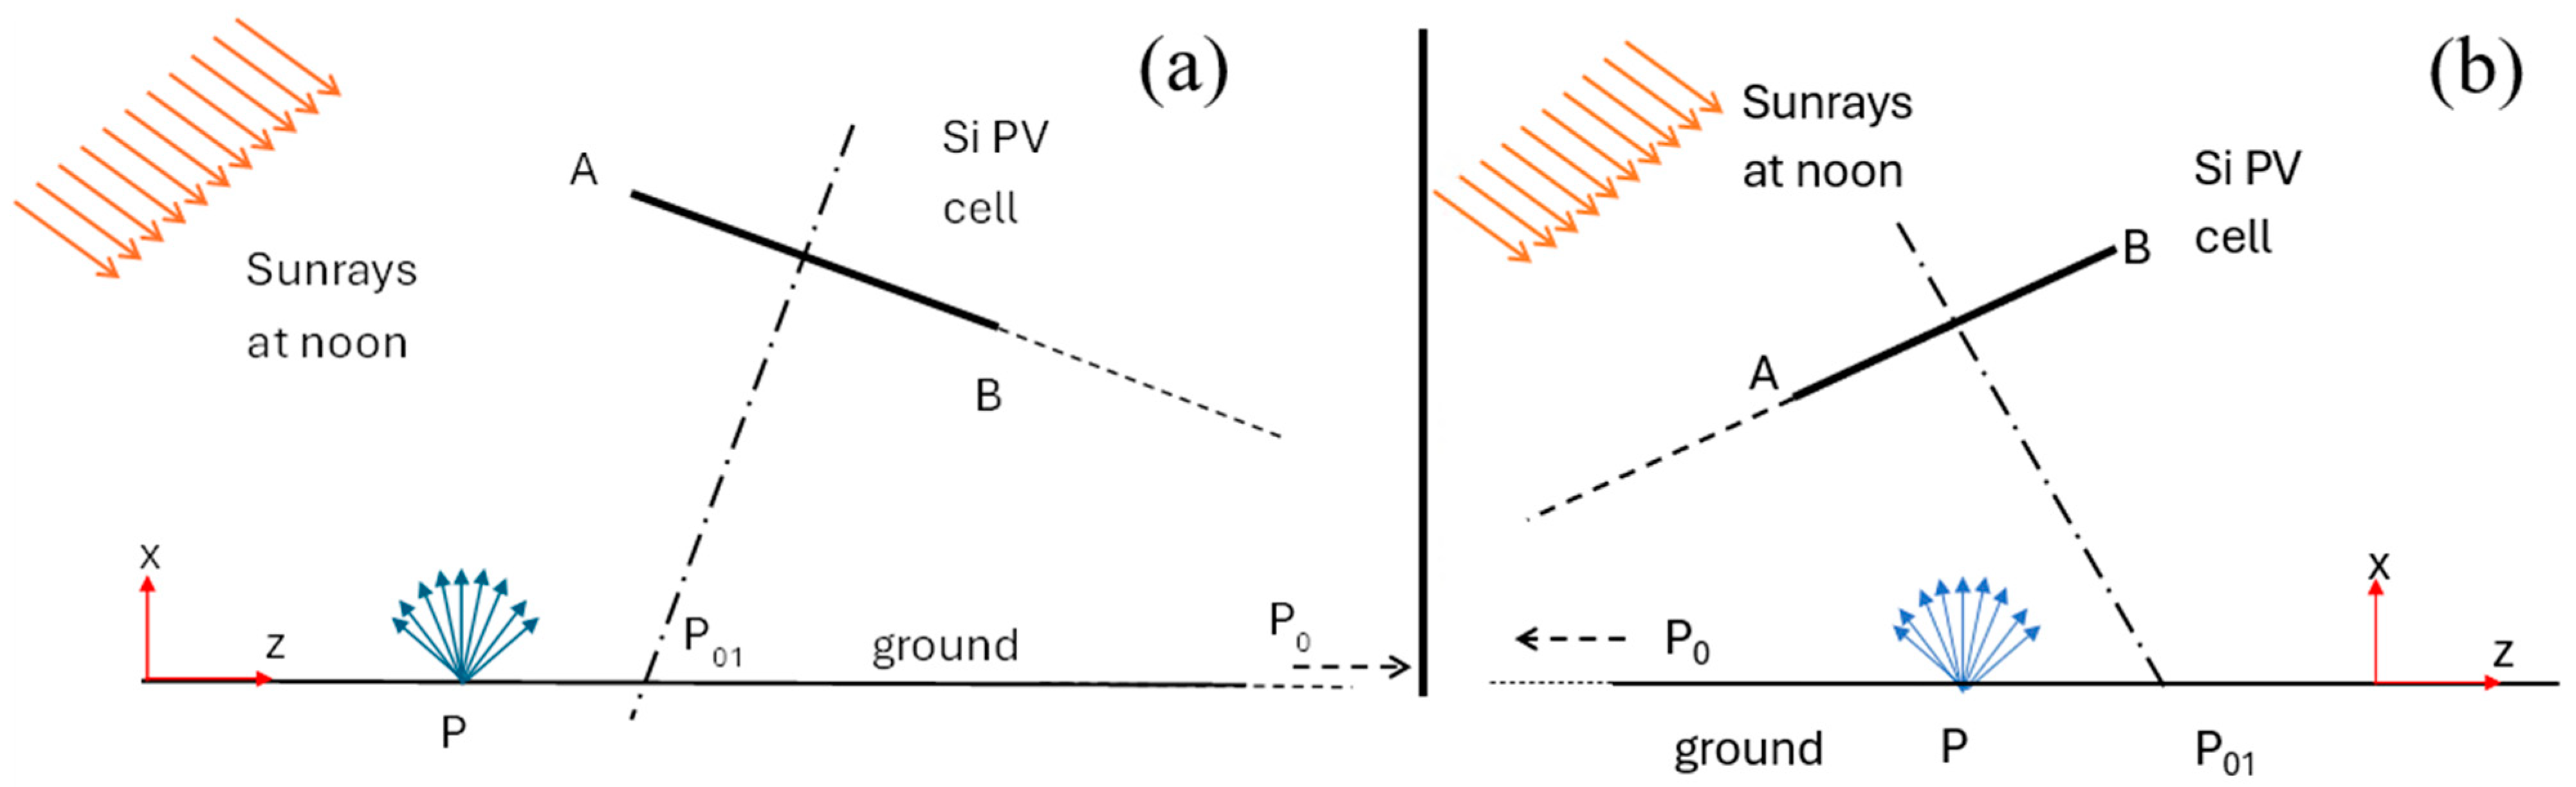
Table 1 lists the symbols used in the text. The conceptual system under consideration is described in Figure 1. The optical core is an orthogonal, dielectric transparent triangular wedge prism with vertex angle φ. Its longer cathetus is the top surface. A bifacial cell (grey in Figure 1) is optically coupled to the bottom side of the prism (hypotenuse) and operates in the NIR spectrum. A high-bandgap solar cell (orange in Figure 1) for the VIS spectrum is coupled to the backside of the prism (shorter cathetus). The prism vertex angle, φ < 45°, defines a geometric concentration gain, Ggeom = (AVIS-cell⁄Atop) > 1, where AVIS-cell is the area of the VIS cell on the back side of the prism and Atop is the area of the entrance surface at the top. Since Ggeom only concerns the VIS spectral region, the concentrator is labeled as “asymmetric”. Light concentration and spectral splitting are performed through total internal reflection (TIR) at the upper glass–air interface and via two complementary dichroic mirrors. A NIR transmitting mirror is placed before the bifacial cell and a VIS transmitting mirror is placed before the high-bandgap cell. The optical performance of the system in direct sunlight has already been analyzed in Ref. [25]. Optical efficiency values reaching 88% and above 80% are demonstrated over an incident angular range of approximately 50°.
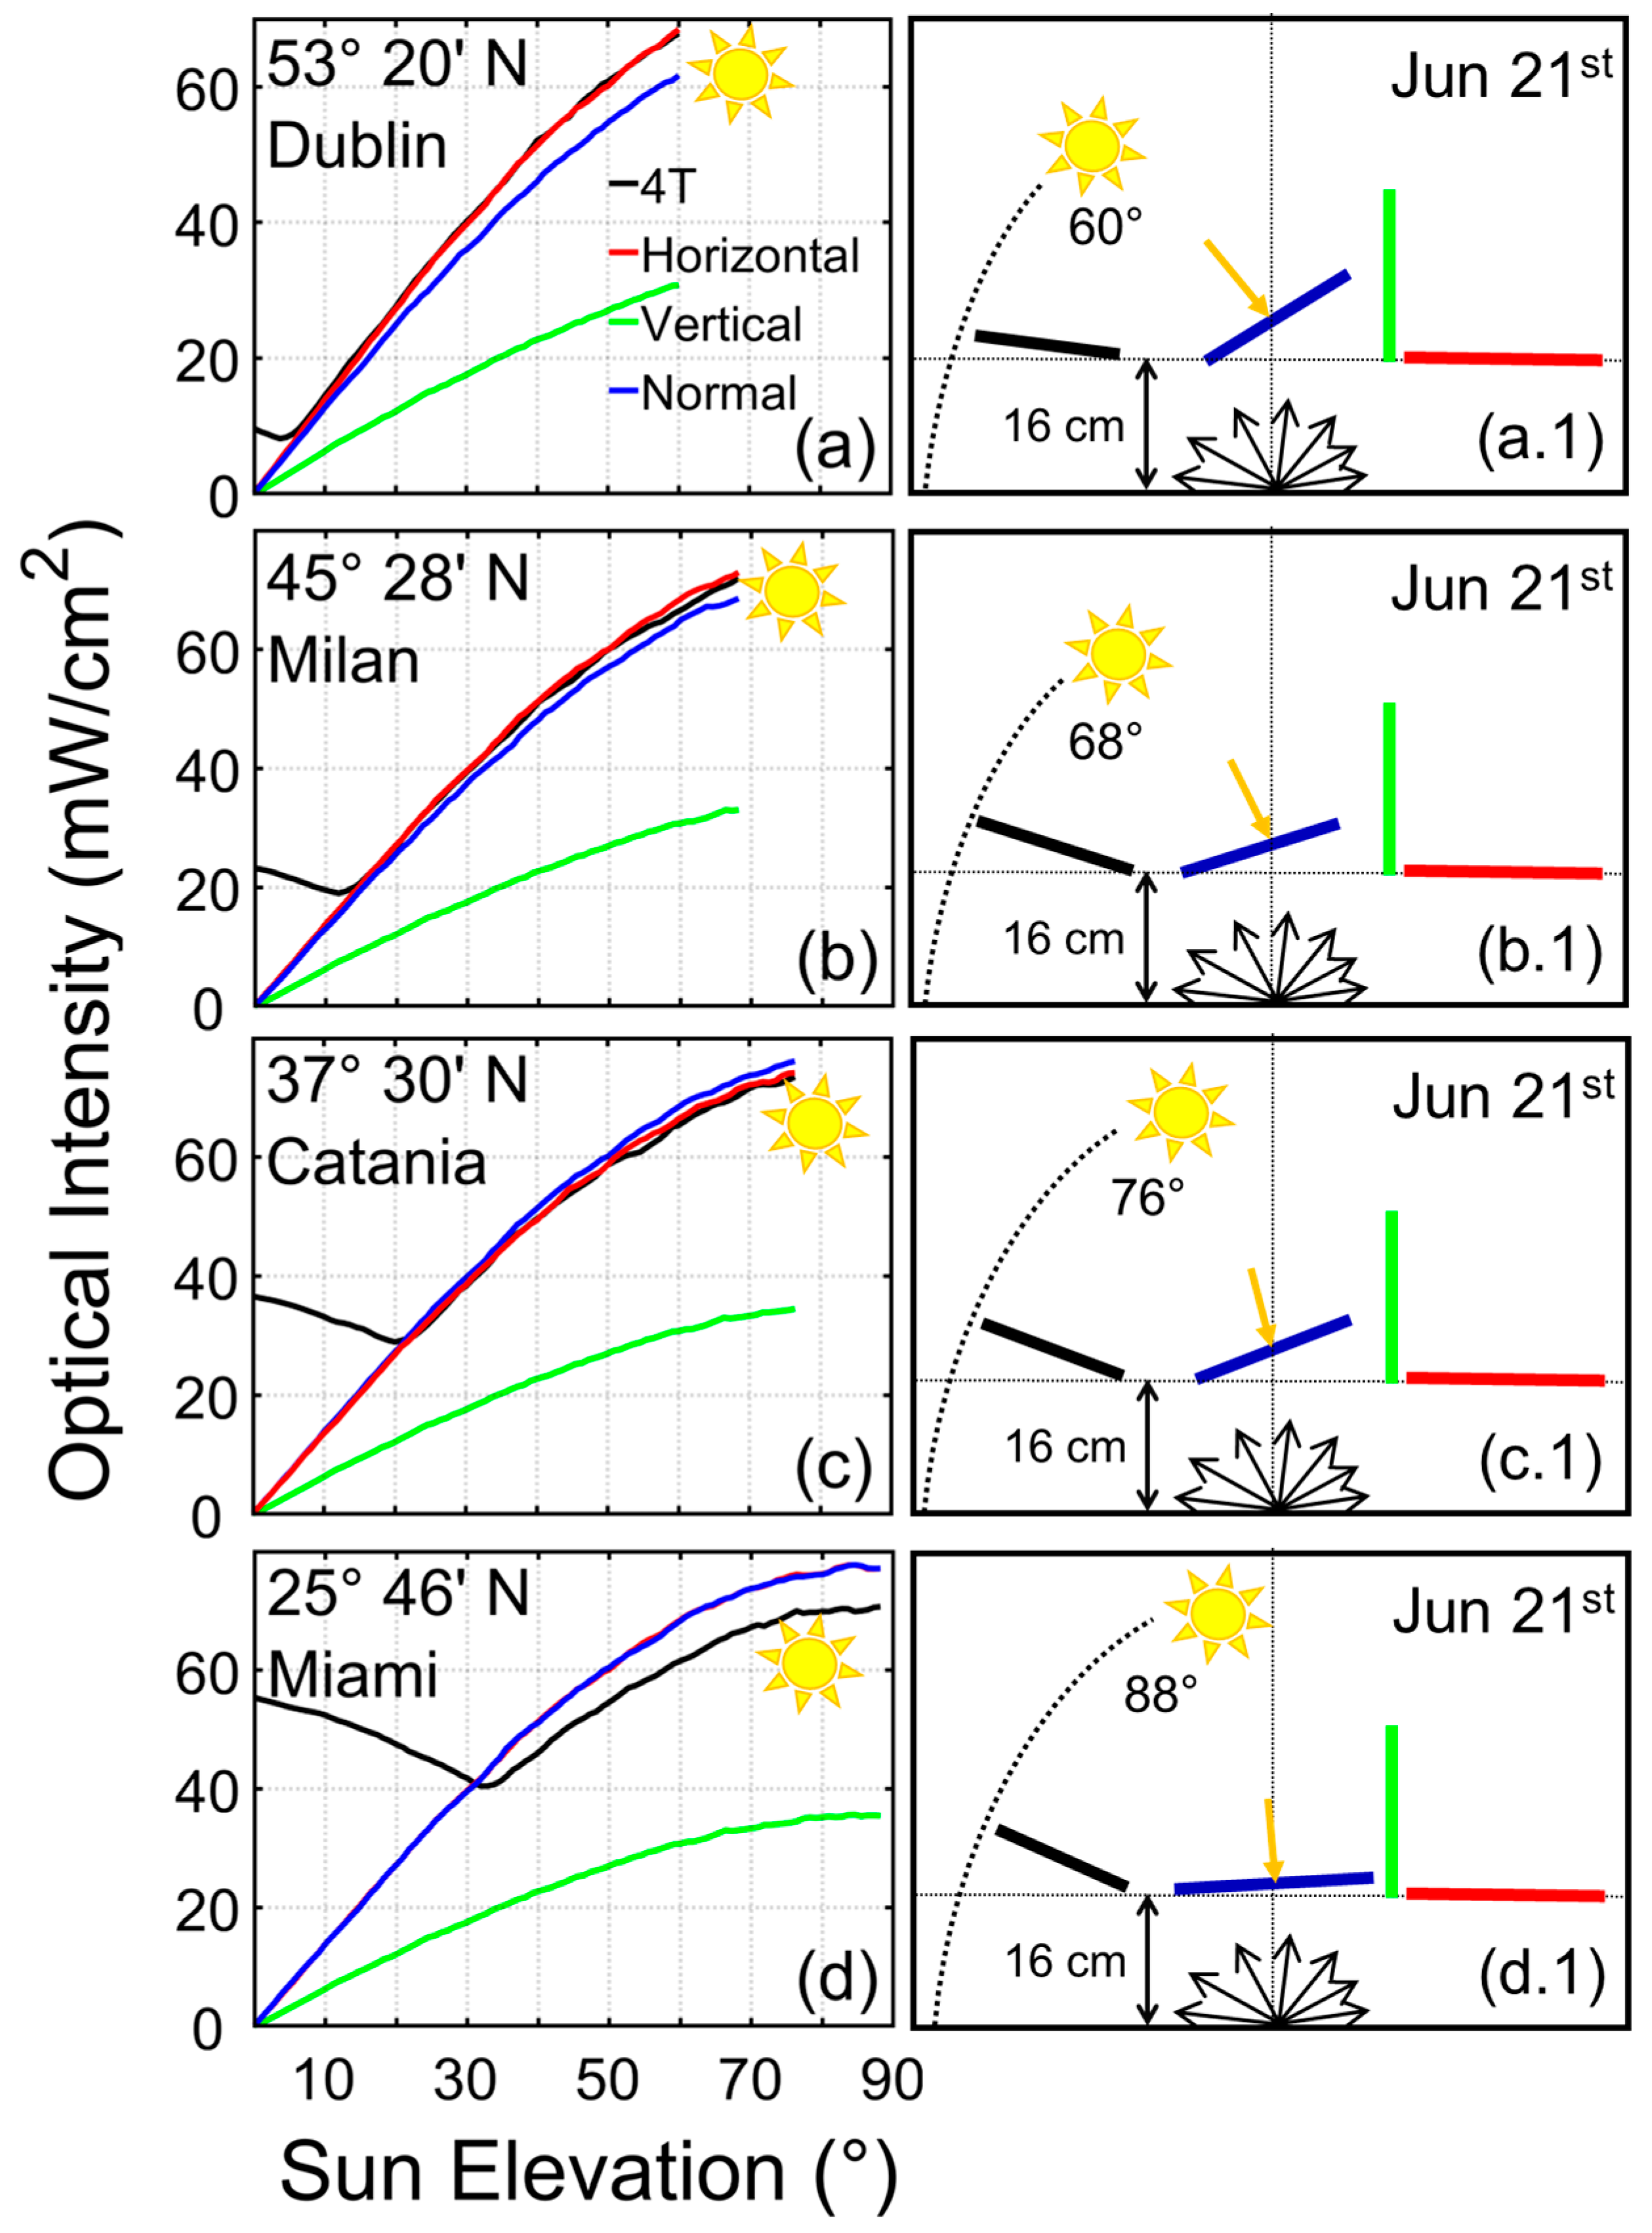
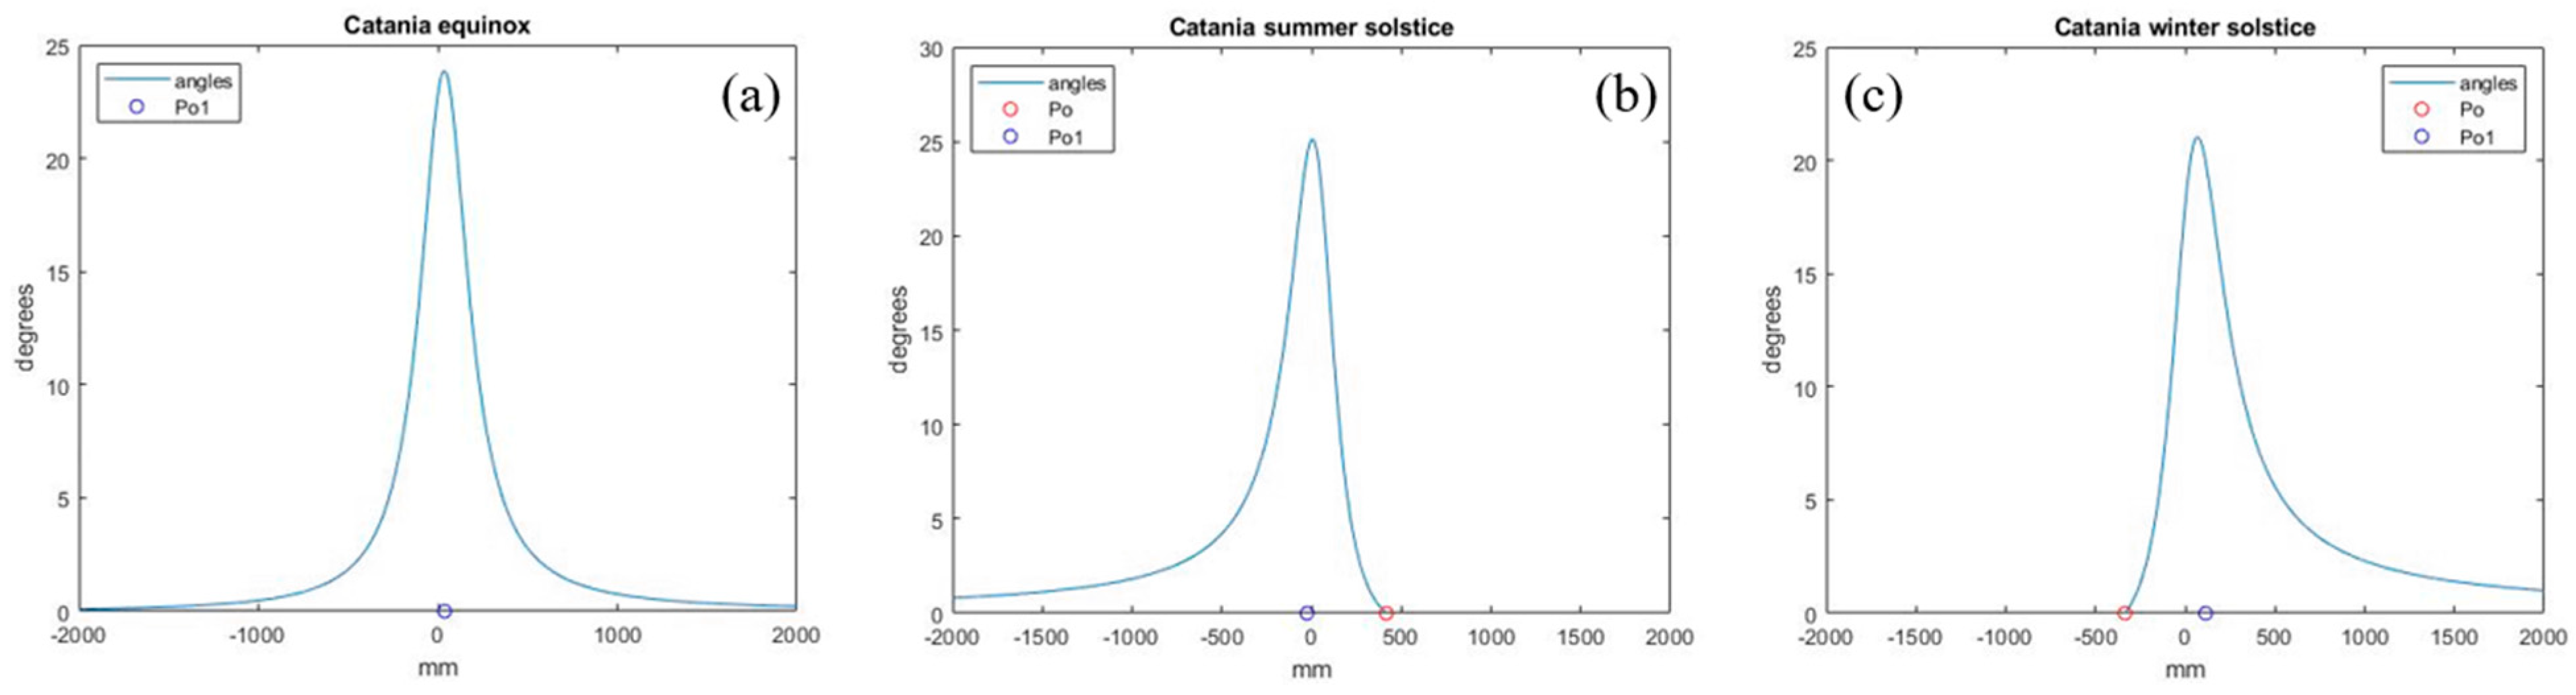
The orientation of the prism in the field is quantified by the inclination angle, β. The values of β are set such that the TIR at the upper interface is guaranteed for direct sunlight at all sun elevation values, ϕs, up to the noon value at the specific installation site, ϕs,MAX. In order to highlight the role played by the site latitude, ϕ, simulations were performed for four different possible locations in the Northern Hemisphere: Dublin, Ireland (ϕN = 53°20′ N); Milan, Italy (ϕN = 45°28′ N); Catania, Italy (ϕN = 37°30′ N); Miami, USA (ϕN = 25°46′ N).
In Table 2, the locations are listed in the first column and indexed with i = 1:4. In the second column, the corresponding values of ϕis,MAX are shown, referring to the day of the summer solstice. The data come from a database available online: www.sunearthtools.com [36]. The third column reports the corresponding orientation angles of the bifacial solar cell in 4T configuration with respect to the ground αi = 90° − (ϕis,MAX + φ + β).
For TIR to occur, the angle of incidence, θi, of sunlight on the top surface must exceed a limiting value, θiL, that depends on the prism vertex angle, φ, and the refractive index, n, of the dielectric material composing the prism [25]. In turn, φ sets the value for β, where negative β values correspond to north-facing orientations that can occur at ϕN < 45° installation sites [25]. Such orientations seem rather strange; however, it is precisely this condition that improves the albedo collection, as is detailed below. Initially, the same wedge geometry as reported in [25] is considered, with vertex angle φ = 14.47° and n = 1.5, leading to θiL = 21°. The 4T configuration is considered to work using a bifacial Si HJT (Silicon Heterojunction Technology) cell from 3Sun Enel-GP S.p.A. [37] and a monofacial GaAs (gallium arsenide) reference cell from ReRa Solutions B.V. [38]. The bifacial cell on the bottom side of the prism is a rectangle of 80 mm × 20 mm. The high-bandgap cell measures 20 mm × 20 mm and is optically coupled to the back side of the prism.
The solar cell performance is simulated by a non-sequential numerical model using a commercial 3D ray tracing software (ZEMAX OpticStudio, 22.2 Professional). Data post-processing was performed in the MATLAB (R2019a) environment. Solar irradiation from above is simulated by a direct light source and a uniform diffusion surface represents the ground illuminating the back side of the Si cell. The analysis process is described in detail in Appendix A, Appendix B, Appendix C and Appendix D.
This work starts by comparing the backscattered light collected on the back side of bifacial cells, of equal shape and clearance height, h [39], oriented according to the 4T configuration and according to the standard flat configurations. Specifically, the three standard flat configurations analyzed are horizontal (i.e., parallel to the ground), vertical (i.e., perpendicular to the ground), and normal (i.e., perpendicular to the incoming direct sunlight at midday). The values of the backscattered optical power collected on the back side of the bifacial cell in the 4T and standard configurations are, respectively, denoted by P4T and Pst, and they depend on the sun elevation and the orientation of the solar cell. The ROPI of the 4T configuration compared to the standard configuration can therefore be defined as follows:
R O P I = P 4 T P s t P s t
By integrating P4T and Pst as functions of ϕs throughout the day, it is possible to calculate and study the daily ROPI under different possible operating conditions. The final purpose is to evaluate the benefit that ROPI brings to the overall optical power collected by the PV system and, finally, to perform an overall evaluation of the PCE.
Furthermore, a comparison of the Total Optical Power (TOP) collected by the different bifacial configurations at the four latitudes has been calculated using the ZEMAX software. In the standard flat cases this corresponds to the integration of the optical power collected on both the front and back sides of the bifacial cell over the AM1.5G solar spectrum, summing the direct irradiance and the albedo irradiance. In the 4T configuration, the contribution of the albedo irradiance on the back side of the bifacial cell is added to the contribution of the direct illumination coming from the top surface of the prism, collected separately by the VIS and NIR solar cells. Dichroic mirrors with a cut-off wavelength at λ = 805 nm are considered. Indeed, referring to the External Quantum Efficiency (EQE) curves of the two solar cells considered [29], a wavelength of 805 nm represents the crossover point between the EQE of the Si HJT bifacial cell and the EQE of the GaAs cell, with the EQE for the Si cell being higher than that for the GaAs cell at longer wavelengths.
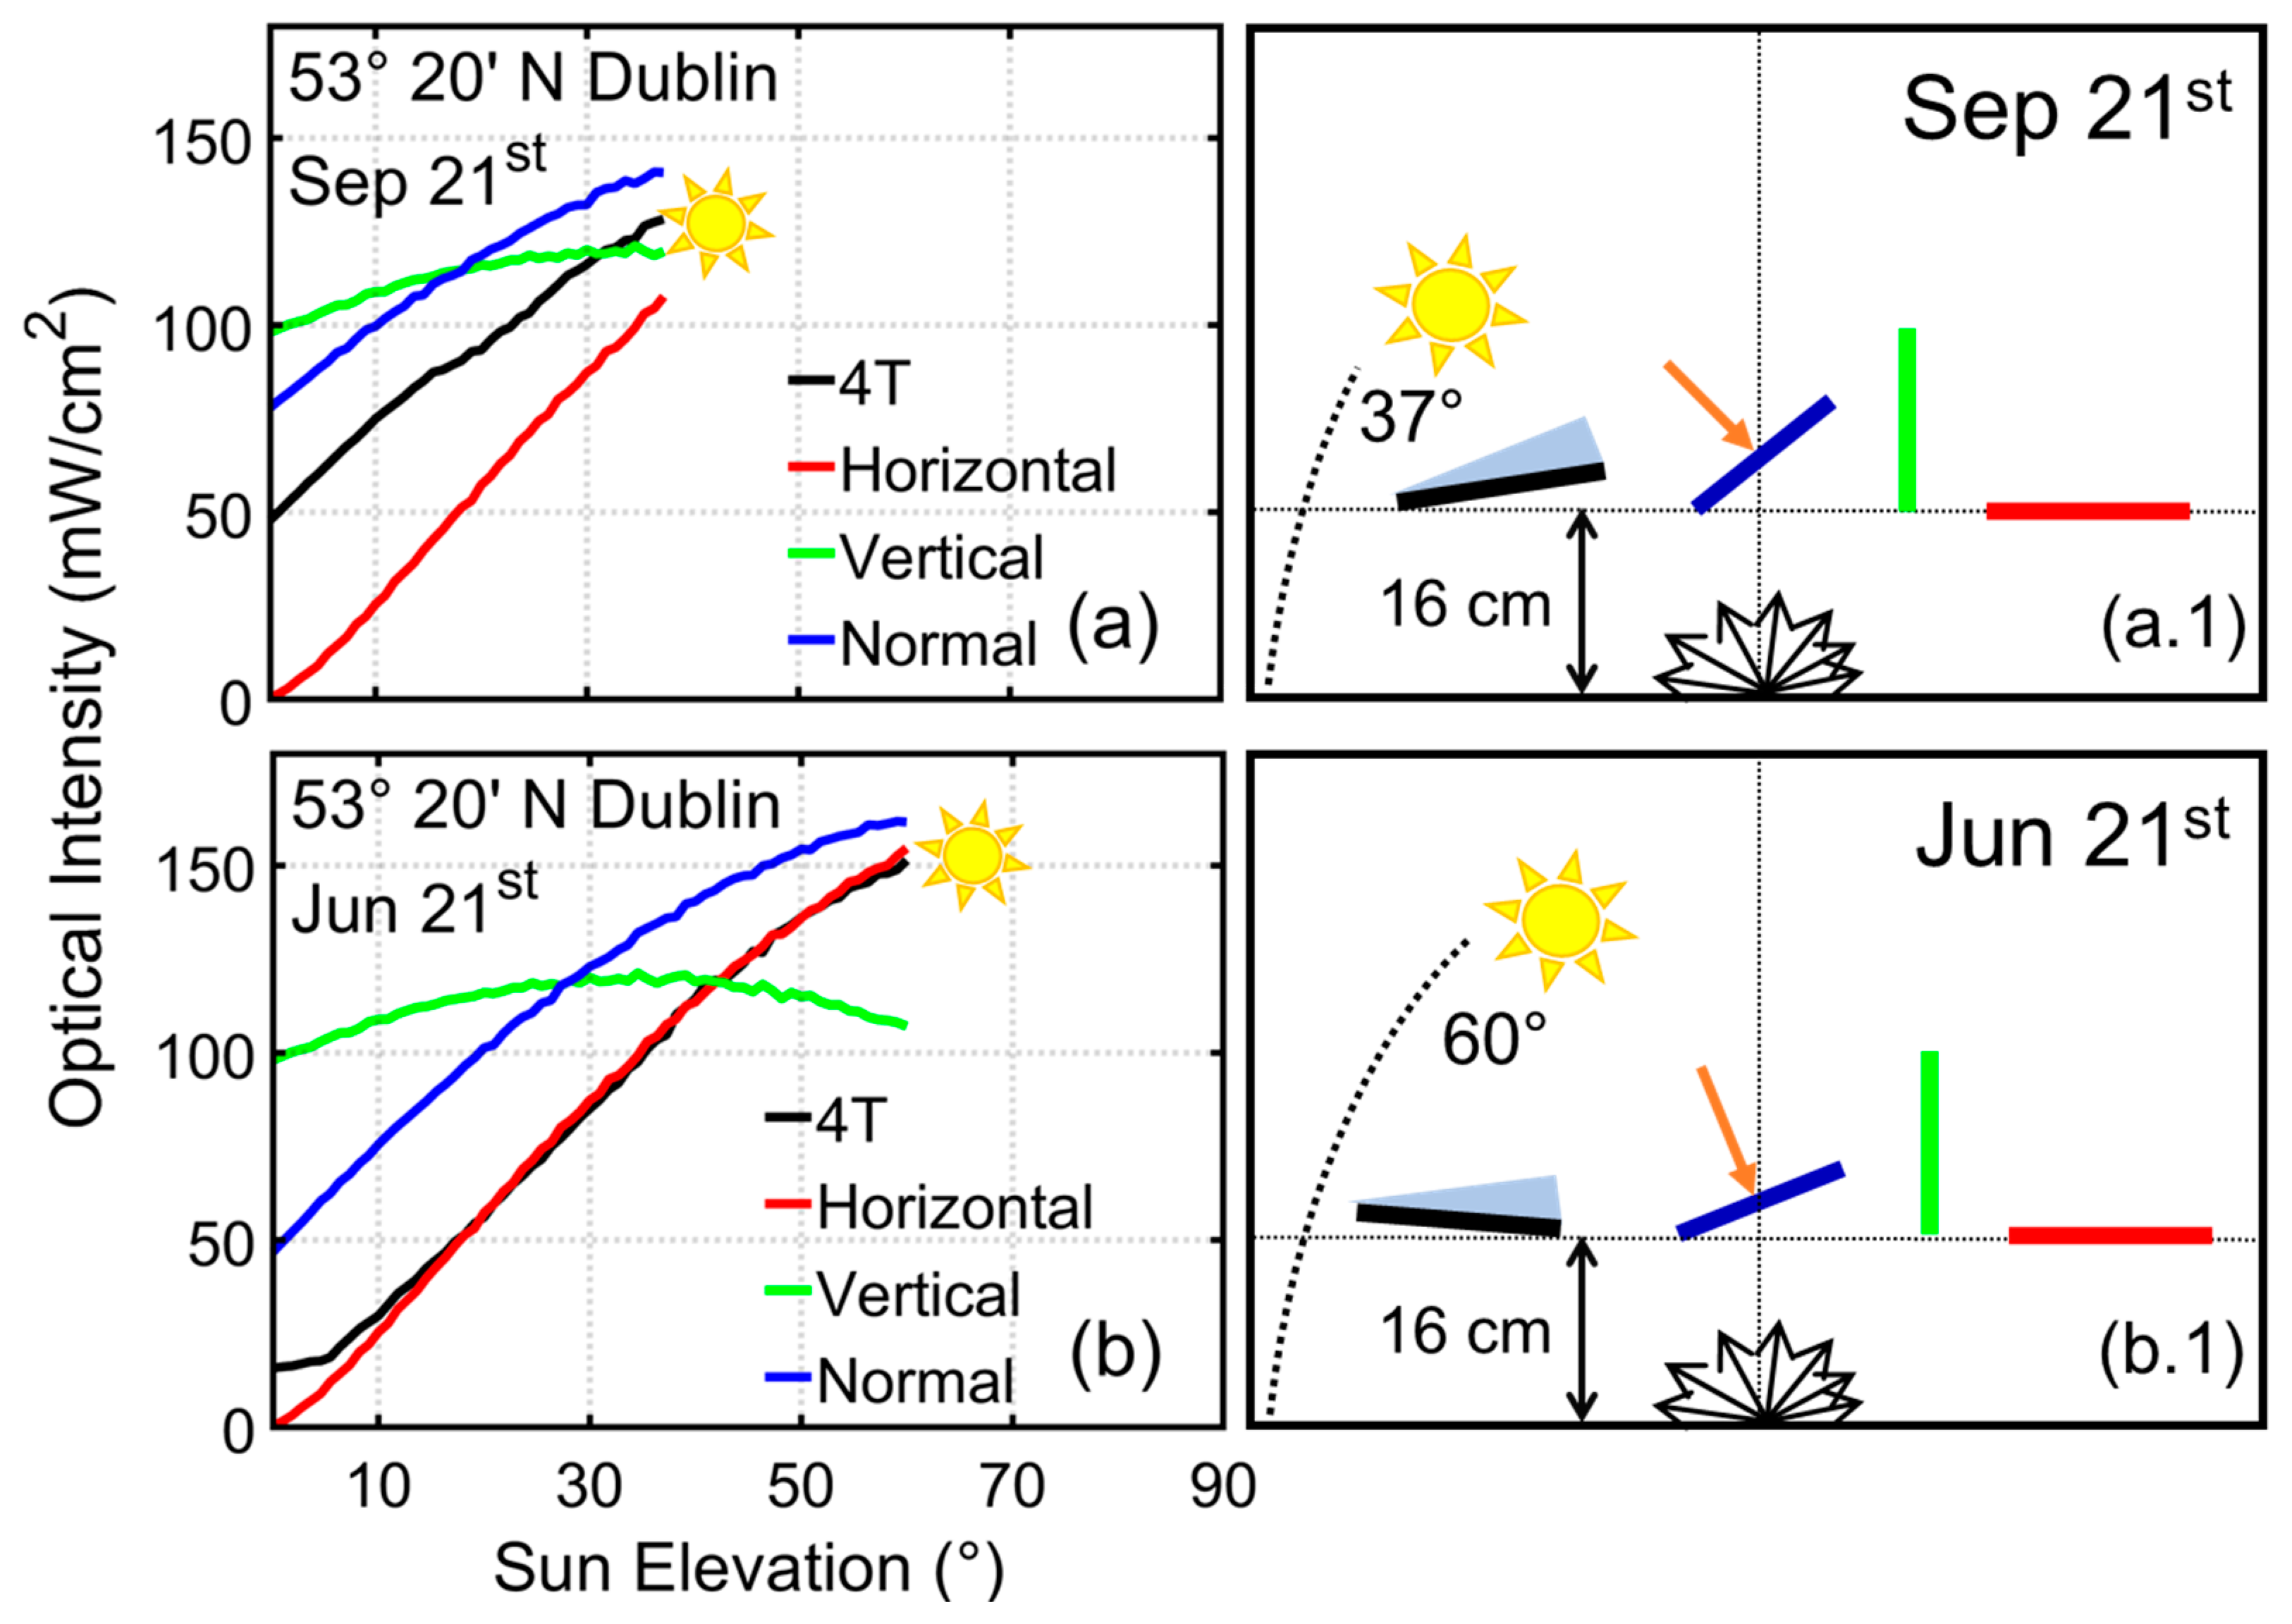
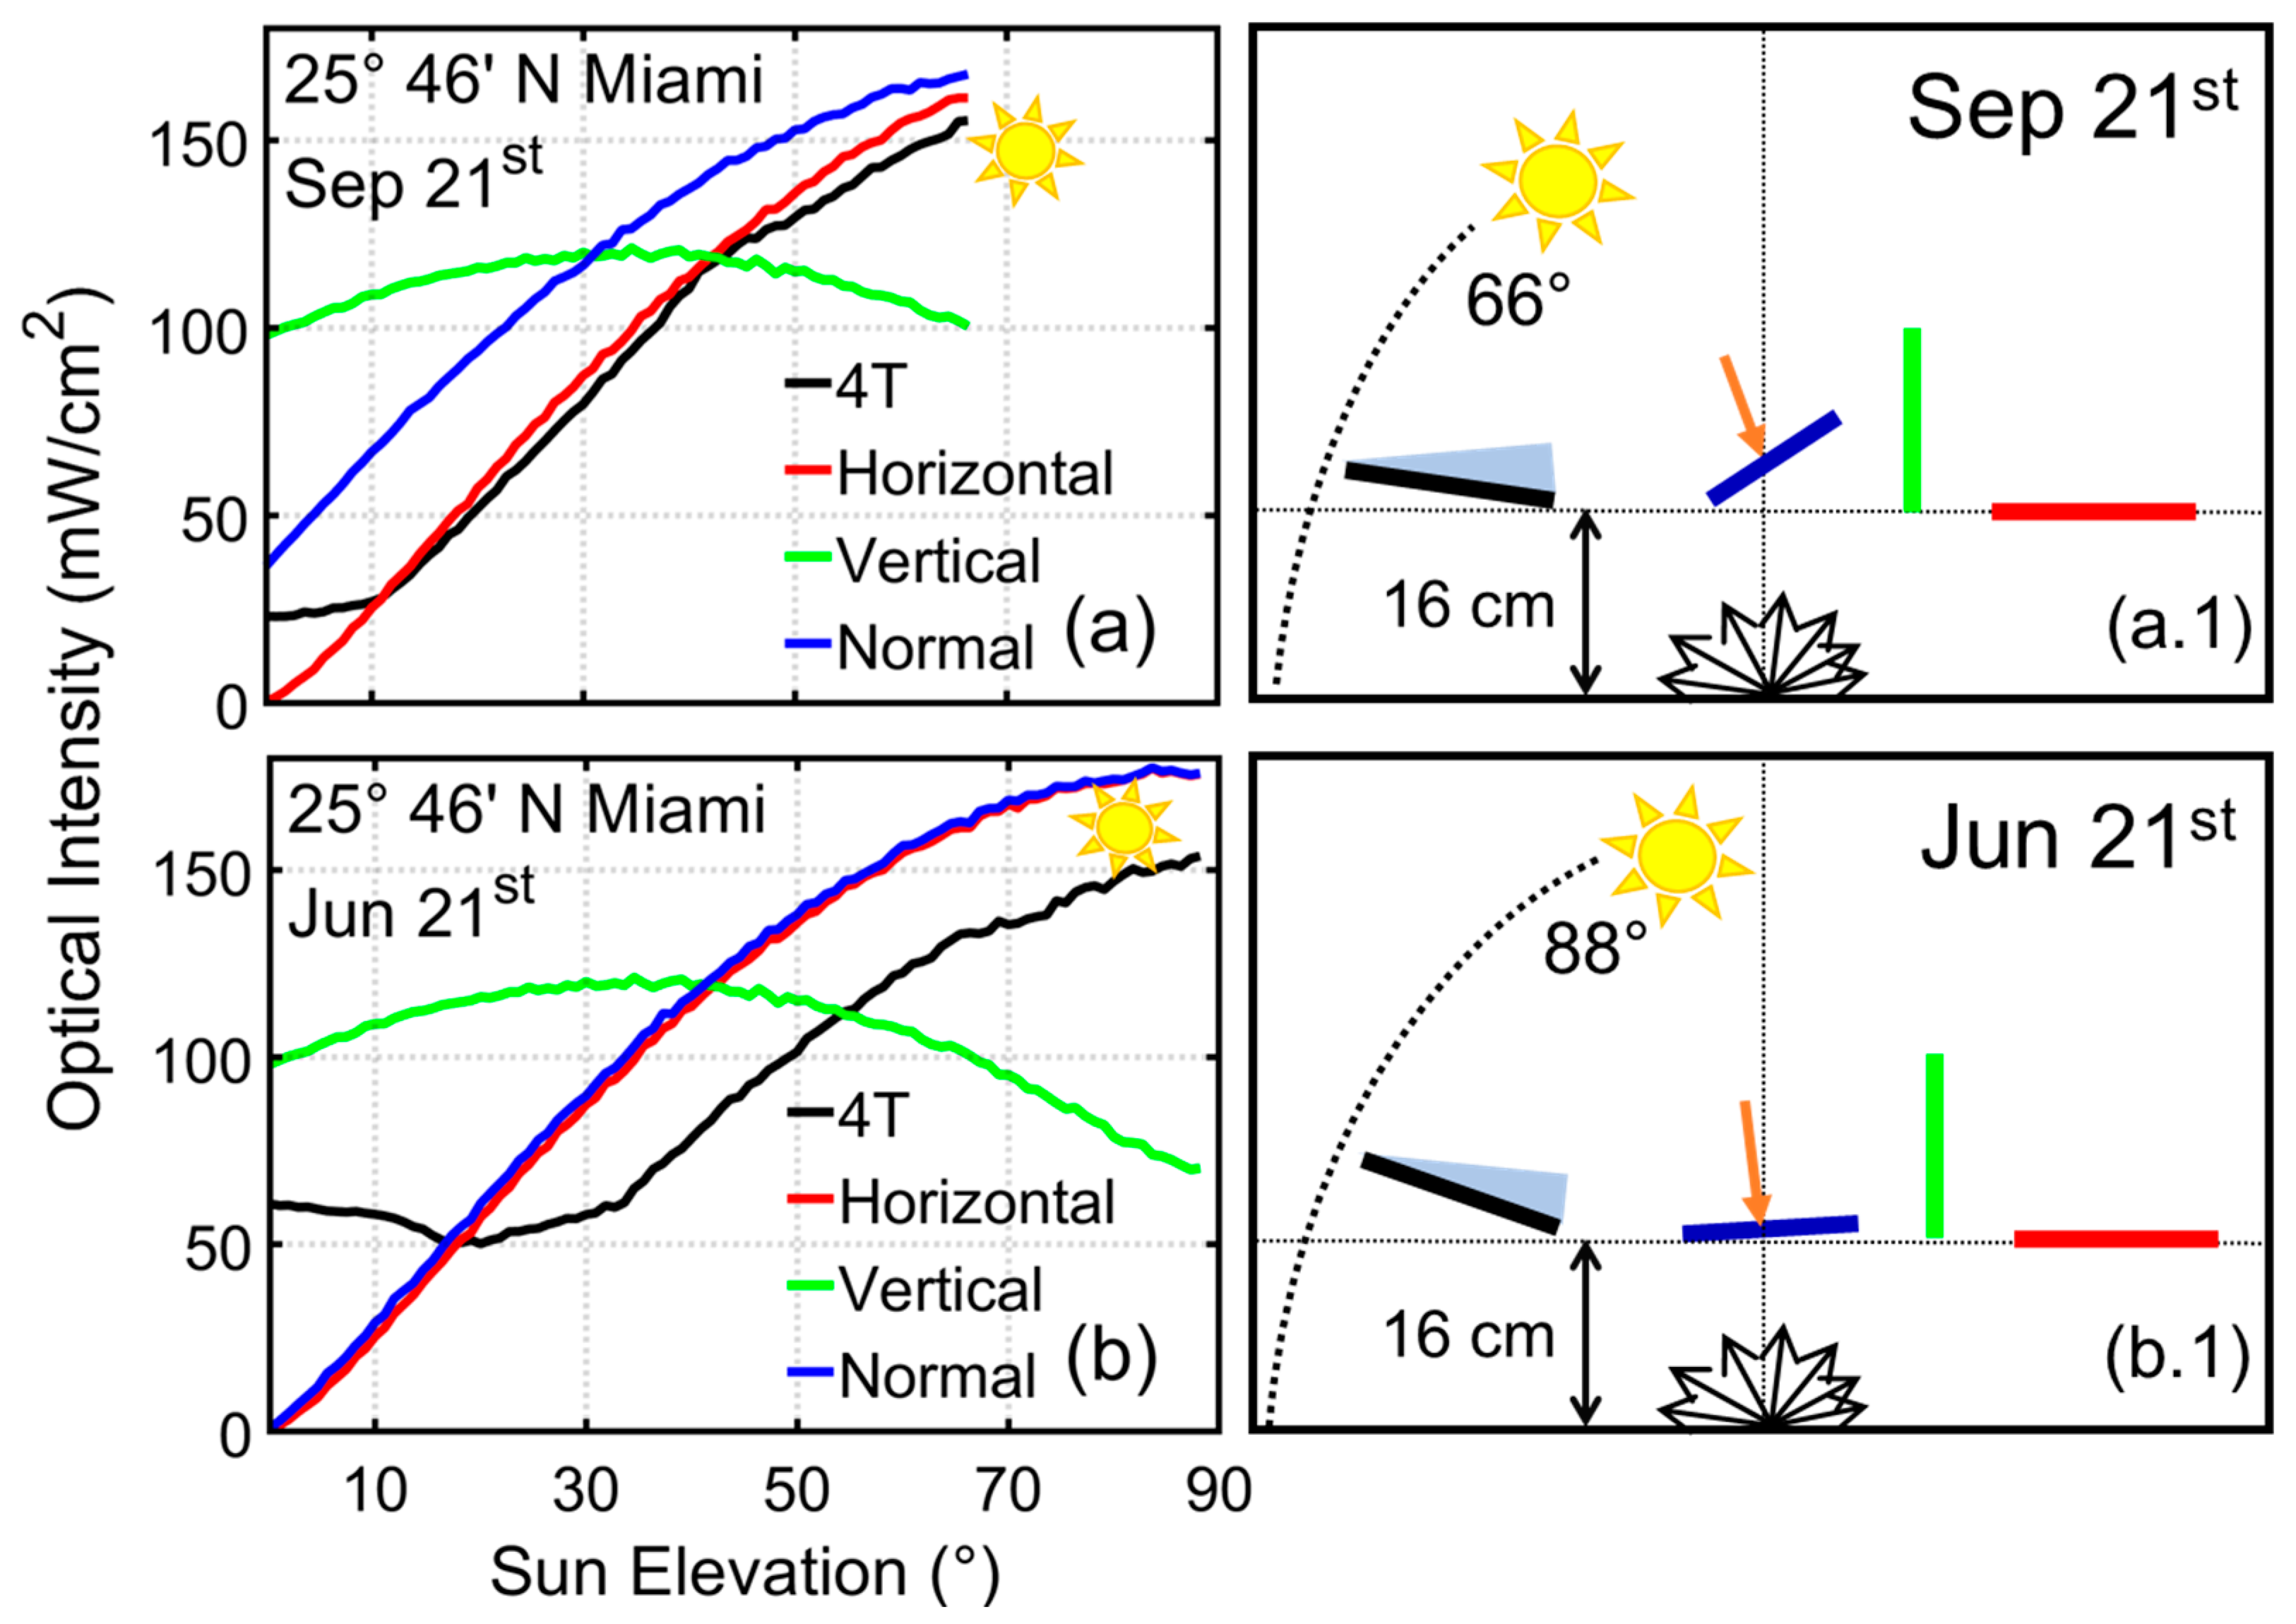
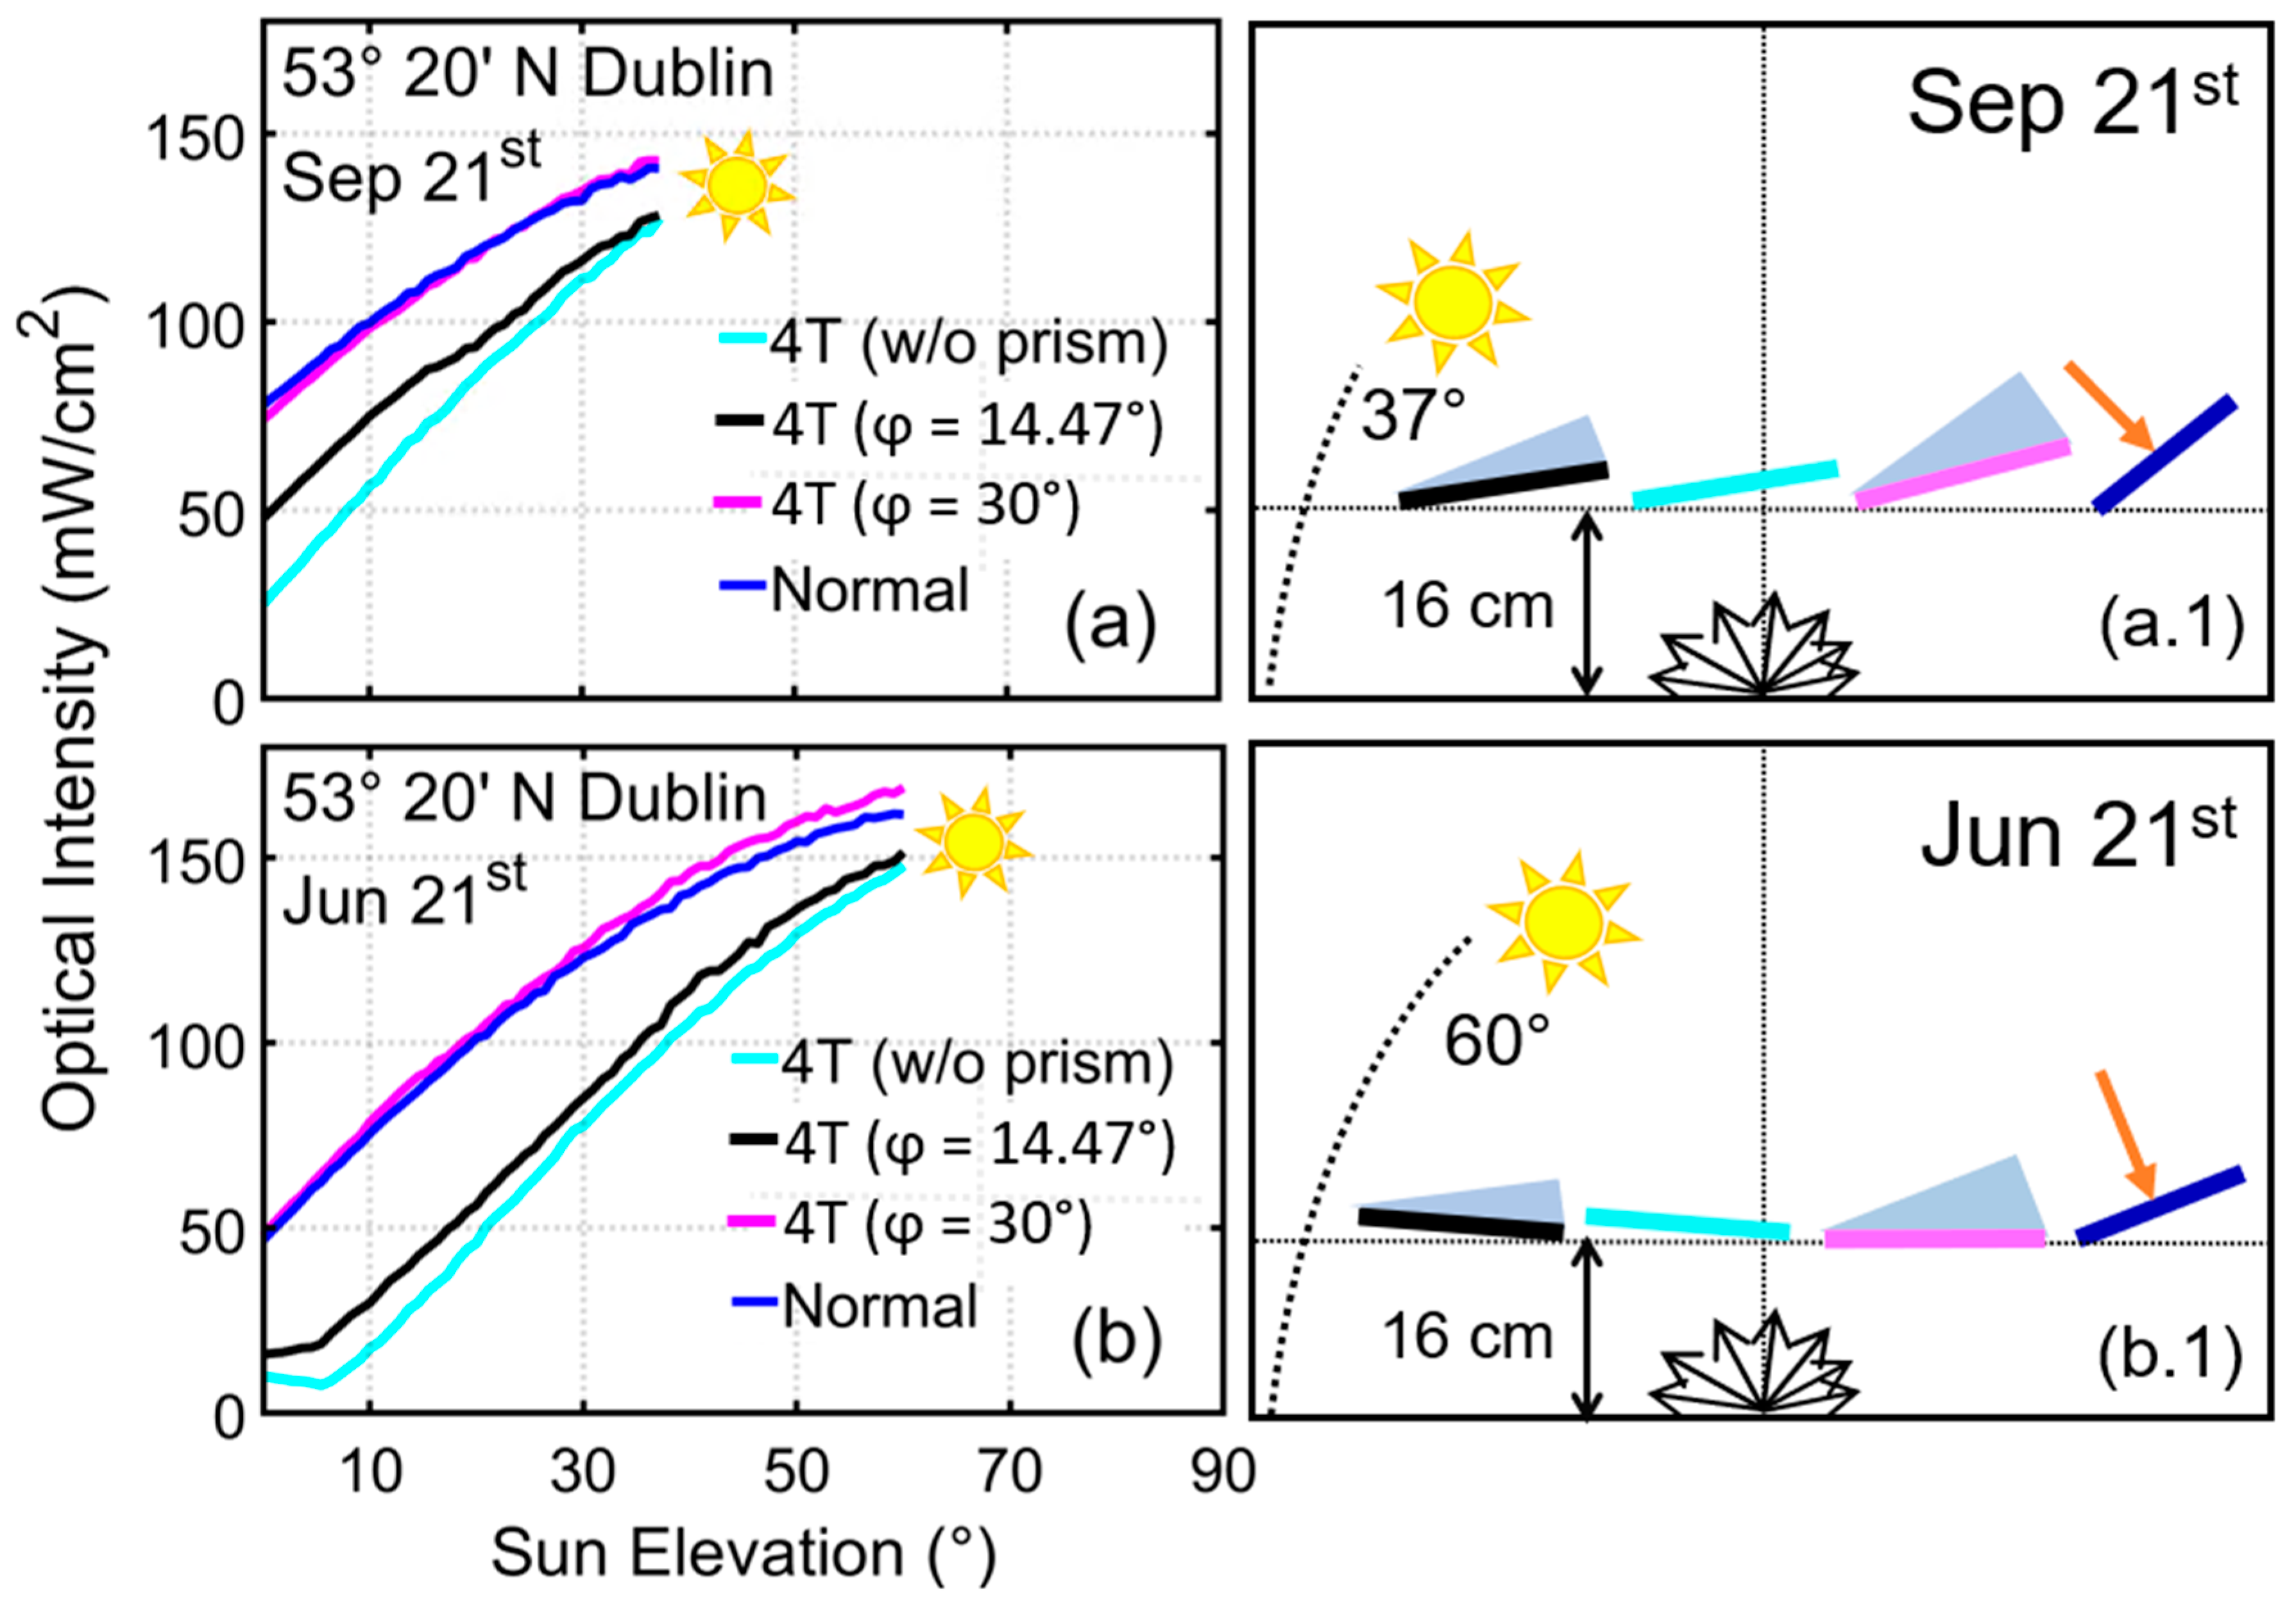
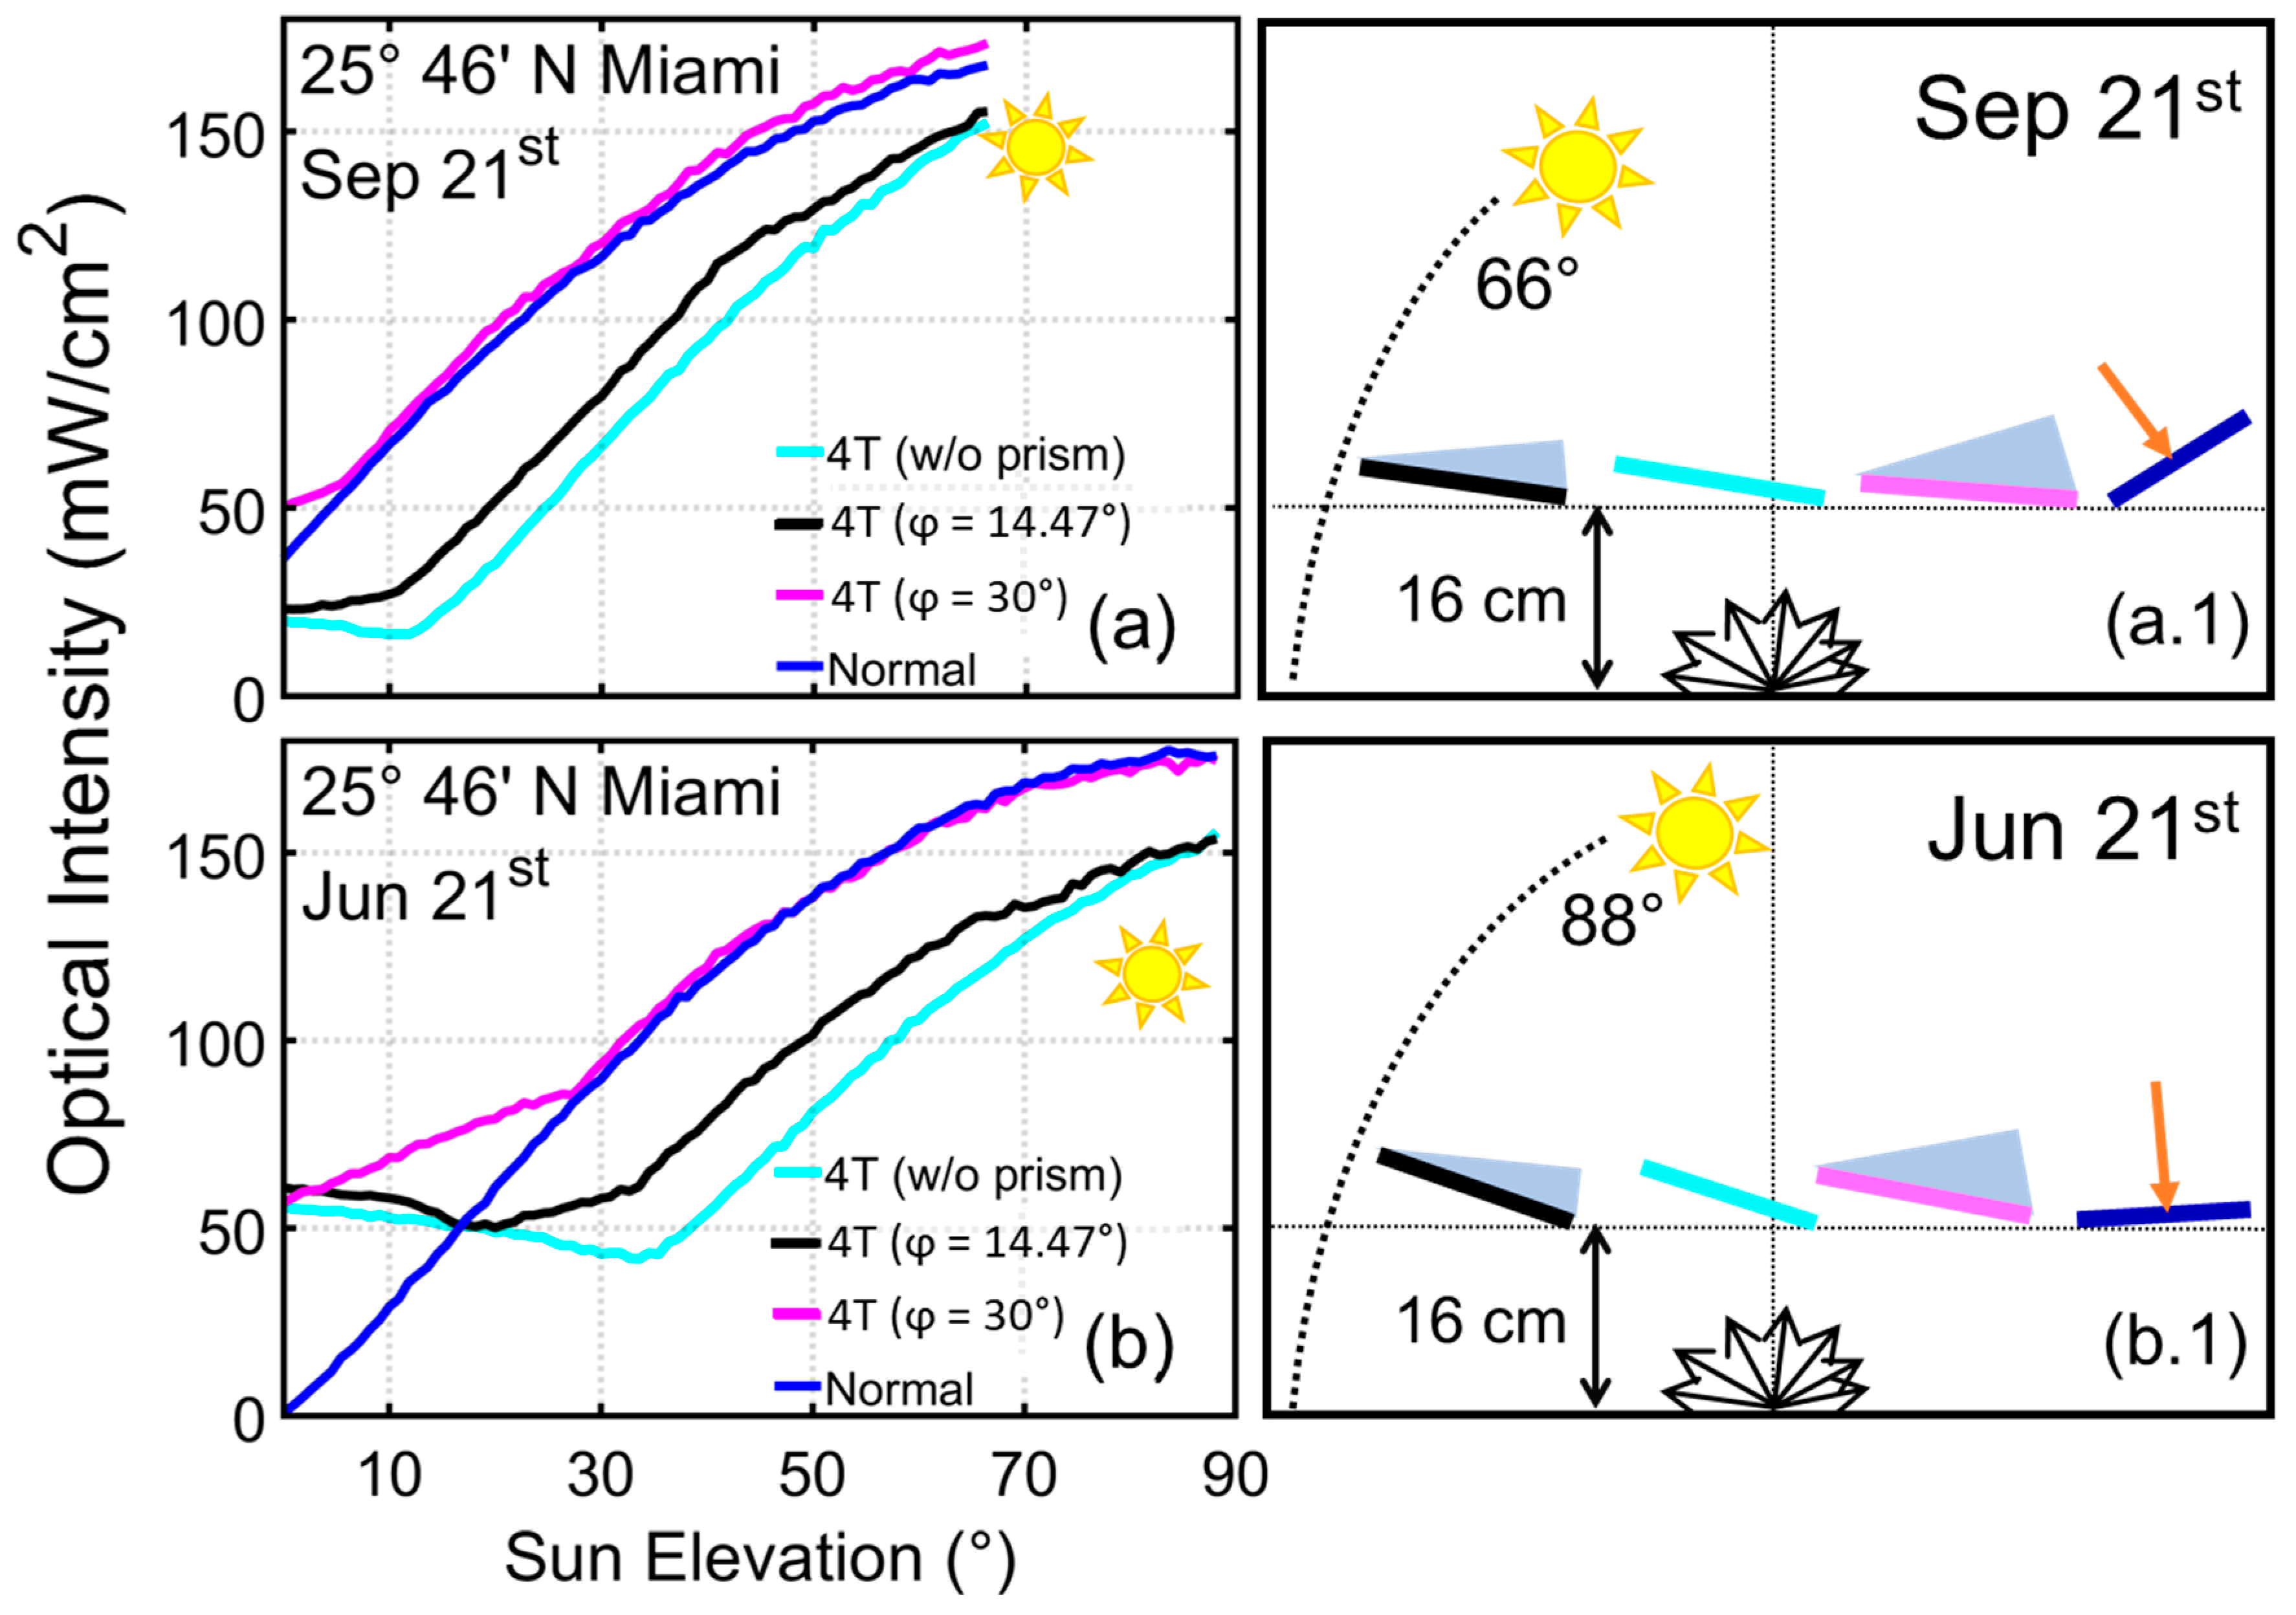
By orienting the PV system to the midday of the summer solstice, the TOP was evaluated for all latitudes as a function of the solar elevation, ϕs. In the Dublin and Miami reference cases, the TOP was also evaluated by orienting the PV system according to the equinox noon, and the role of the vertex angle, φ, was explored. A comparison is made between the TOP values evaluated for a bifacial cell with standard flat normal orientation, for a bifacial cell oriented in 4T configuration with φ = 14.47°, with φ = 30°, and in the absence of wedge optics (φ = 0°). The following considerations are assumed to be valid for an azimuthal angle γ = 0°, i.e., in the presence of an azimuthal tracking system. By varying γ, i.e., under non-sagittal illumination, the only effect is a decrease in the incoming solar flux proportional to cos(γ); meanwhile, it has been shown that the functioning of light-guiding optics on sagittal and non-sagittal/oblique rays is equivalent [25].
The PCE was estimated by assuming the electrical parameters of the cells as per the datasheet, namely Voc,HJT = 0.73 V, FFHJT = 0.8, bifaciality factor = 90%, Voc,GaAs = 1.019 V, FFGaA = 0.82, and considering the spectral EQE of a Si HJT cell and the EQE of a GaAs cell, respectively. The input photon flux was calculated by sorting the spectrally resolved TOP by photon energy. Then, after multiplying by the EQE values and the electron charge and after spectral integration, the ideal photocurrent output per unit time is obtained, which represents the short-circuit current of the solar cells (Isc). The electrical output power, Pout,el = Isc ∙Voc ∙FF, is estimated independently for the two cells and summed to obtain the total Pout,el (TPout,el). The reference locations of maximum and minimum latitude, Dublin and Miami, were considered, and TPout,el at noon was calculated on the days of the equinox and the summer solstice. Moreover, to exemplify the overall advantage of adopting a 4T configuration with φ = 30° compared to the normal one, the values of TPout,el at midday of the summer and winter solstices were calculated in the case of equinox orientation, only for the Miami site.

3. Results and Discussion

3.1. Albedo Collection of Bifacial Cells

A comparative analysis of the optical performance of bifacial cells oriented according to the 4T configurations, horizontal, vertical, and normal, is presented for the four different installation sites, identified by i, from 1 to 4. Figure 2, panels (a)–(d), show the optical intensity collected on the back side, oriented according to the local value ϕis,MAX, as ϕs increases up to ϕis,MAX at the summer solstice. The 4T configuration is the one with the most northerly orientation.
All simulations were performed at a clearance height of h = 160 mm. More details on the calculation performed to define the clearance height are included in Appendix B and the results are shown in Figure A2. It can be noted that the effective domain of the existence of the curves is limited to the value of ϕis,MAX, reached at the summer solstice at each specific latitude. Examining Figure 2, it can also be noted that the 4T configuration performs better than the horizontal and normal configurations at lower latitudes. Furthermore, low values of ϕs, i.e., close to sunrise and sunset during the day, represent conditions for a more favorable albedo collection from the back side. In general, a variation in ϕs corresponds to a variation in the self-shadowing pattern of the ground-based PV element, which influences the amount of backscattered light collected. Actually, according to the values of β and φ, at lower installation latitudes and at grazing irradiation angles, ϕs, the back side of the bifacial cell in the 4T configuration exits the self-shadowing pattern for a whole range of elevation angles, 0 < ϕs < (φ−β), with β < φ and φ > 0 (see Figure 1).
The albedo collection improvement obtained from the 4T orientation is quantified by evaluating the ROPI as a function of ϕs. Daily ROPI values can be obtained by summing the daily angular excursion, 0 < ϕs < ϕ s , M A X i , j , at the four locations and on the dates of the equinoxes and summer/winter solstices (i.e., September 21st, June 21st, and December 21st, indexed by j = 1,2,3). For clarity, the values of ϕ s , M A X i , j at location i and day j are summarized in Table 3.
The results are reported in Table 4, Table 5 and Table 6, which quantitatively confirm the significant bifacial advantage of the 4T orientation compared to the standard configurations. The daily ROPI is always greater than one, due to the reduced self-shadowing effect in the 4T configurations. Moreover, comparing the values calculated on the same day, an increasing trend is evident as the ϕN angles decrease. This is also qualitatively evident by directly observing the curves in Figure 2. Actually, as ϕN increases, the upper surface of the PV element is increasingly oriented towards the south, and the 4T configuration increasingly resembles the normal one, the advantage of which becomes less significant. In each selected installation site, the highest daily ROPI values are achieved under typical winter grazing irradiance conditions. Considering the overall results shown in Table 4, Table 5 and Table 6, this trend is evident. The Miami site installation in winter shows the highest daily ROPI values: ROPIHorizontal = 75%, ROPIVertical = 293%, and ROPINormal = 75%, with the horizontal and normal orientations almost coinciding. This suggests that the 4T configuration potentially outperforms standard flat configurations, increasing the efficiency of bifacial cells in typical disadvantageous conditions.

3.2. Total Optical Power Collection

The data described in the previous sections refer to improvements in optical power collection on the back side of the bifacial cell. A more general comparison is needed by summing the Total Optical Power (TOP) collected on both the front and back sides of the PV system. In the 4T configuration the TOP collected is equal to the sum of the optical power collected by two different detectors: the front side of the GaAs cell and both the front and the back sides of the bifacial cell. Differently, in the standard configurations, the TOP collected is provided only by the Si bifacial cell.
The TOP values evaluated at different latitudes are shown in Figure 3a–d, calculated over the daily angular excursion of the sun’s elevation 0 < ϕ s < ϕ s , M A X i for PV systems oriented according to ϕ s , M A X i , s u m m e r s o l s t i c e . The significant advantage in optical collection on the back side of the bifacial cell of the 4T configuration compared to the standard configuration, as shown in Figure 2 and ROPI Table 4, Table 5 and Table 6, is here compensated by a less efficient collection on the front side. In fact, for the vertical configuration, the TOP is independent of ϕN and outperforms the 4T configuration up to ϕs = 34.5°. This winning performance is here easily understood in terms of both direct radiation collection and albedo on the front side.
To better understand the dependence of the Total Optical Power (TOP) on the orientation of the PV system, a comparison between the conditions of ϕ s , M A X i , s u m m e r s o l s t i c e and ϕ s , M A X i , e q u i n o x was performed choosing Dublin and Miami as the two reference sites of maximum and minimum latitude, ϕN. The curves are plotted in Figure 4a,b for the Dublin case and in Figure 5a,b for the Miami case. Panels (a.1,b.1) provide sketches of the orientation variations for the 4T and normal configurations resulting from the solstice vs. equinox choice. As a result, TOP variations occur, although there is no clear improvement over the standard vertical configuration for ϕs < 34.5°.
Conversely, at higher values of ϕs, the TOP collection with normal orientation is always the best.
A further test concerns the role of the vertex angle, φ. To this purpose, once again, the representative sites of Dublin and Miami were selected for a comparison between solstice and equinox. In the present case, the normal configuration is compared with a 4T configuration with φ = 14.47°, with a 4T configuration with φ = 30°, and with a standard flat configuration where the bifacial cell shares the same orientation as the 4T configuration, but in the absence of the wedge prism. The value φ = 30° is chosen because it falls within the range that guarantees the condition for θiL = 0. The TOP, as a function of ϕs, is reported in Figure 6a,b for the Dublin case and in Figure 7a,b for the Miami case. Examining Figure 6 and Figure 7, it can be observed that, ceteris paribus, the removal of the spectral splitting optics is detrimental to the TOP collection. Conversely, an increase in φ improves the TOP collection and this is even more evident at the summer solstice. In any case, the normal configuration remains the preferred one in terms of optical collection efficiency.

3.3. Electrical Performance and PCE

However, it is necessary to specify that the results shown and discussed so far do not take into account the most qualifying aspect that distinguishes the operation of 4T PV systems, namely the use of solar cells with separate electrical collection in the NIR and VIS spectra. Specifically, the exploitation of high bandgap cells in the VIS band guarantees higher Voc values for the same photocurrent, so an improvement in optical efficiency is not a necessary condition to obtain a better PCE (Power Conversion Efficiency).
Therefore, it has been verified that there is an actual advantage in choosing the 4T configuration compared to the standard configurations. To increase the total TPout,el at the same optical input power, Pin,opt, the figure of merit Relative Power Increase (RPI) is defined as follows:
R P I = T P o u t , e l 4 T T P o u t , e l s t T P o u t , e l s t
In Equation (2), T P o u t , e l 4 T and T P o u t , e l s t are the total electrical power evaluated in the 4T and standard flat configurations, respectively.
Table 7 and Table 8 report the TPout,el values collected for the different configurations at midday during the summer solstice in Dublin and at the equinox in Miami, respectively. In these two cases, the orientation of the PV systems coincides with the collection conditions (i.e., orientation and collection both based on the equinox/solstice noon). The normal and vertical configurations are compared with the 4T configuration (φ = 0°, φ = 14.47° and φ = 30°) and the ideal photocurrent values for each cell are shown. The normal configuration shows a higher TPout,el than the vertical configuration. In turn, the 4T configuration (φ > 0°) shows better performance than the normal configuration. The highest values are obtained at the Miami site, with an RPI = 6% for φ = 14.47° and RPI = 16% for φ = 30°. The worst-performing cases of equinox at the Dublin site and solstice at the Miami site are reported in Appendix E (Table A1 and Table A2).
RPI variations at the Miami site were further investigated for the cases of 4T (φ = 30°) and normal configurations, since the PV systems are oriented to the equinox and the optical power is harvested at noon during the winter and summer solstices. Table 9 reports the values of TPout,el and RPI, which exceed 16% throughout the year. These results suggest that a stationary equinox orientation can be considered at the Miami site. Different orientations may be more profitable at different installation sites. For completeness, a comparison of the PCE at noon for the normal and 4T configurations with a vertex angle of φ = 30° in Miami maintaining the equinox orientation has been calculated for the illumination conditions at the equinox and at the summer and winter solstices.
Table 10 reports the power conversion values for the same input illumination area. The last row shows the relative increase values of the PCE, which reaches a maximum of 23% at the winter solstice, thus confirming the advantage of the 4T configuration even in the case of fixed installation.

4. Conclusions

The performances of a conceptual design of a four-terminal bifacial photovoltaic system (4T PV system) were evaluated using numerical analysis and compared with typical standard flat configurations. The comparison was performed at different possible installation sites and allowing azimuthal sun tracking. The 4T system uses low-concentration, spectrally splitting optics in the shape of a right-wedge prism, which promotes albedo collection while reducing self-shadowing, and it couples a Si HJT bifacial cell to a single-junction GaAs cell. Silicon HJT bifacial cells were also considered for standard flat configurations. A perfect optical coupling between the spectral splitting concentrator and the solar cells is assumed. The datasheet values for Voc and FF of the solar cells are considered as input parameters. A standard AM1.5G solar spectrum, with an albedo coefficient of 0.8, is considered as the input.
The 4T and standard configurations have been evaluated against each other by defining the Relative Optical Power Increase (ROPI) for albedo collection and the Relative Power Increase (RPI) for the total electrical output power. The 4T configuration offers better performance than the standard flat configuration for lower-latitude installations. ROPI values up to 293% and RPI values up to 20% can be obtained at a latitude of ϕN = 25°46′ N (Miami, FL, USA). Considering the estimated Power Conversion Efficiency (PCE), a relative increase of 23% is calculated for the Miami site at the winter solstice for the 4T configuration compared to the normal flat configuration. The results presented here suggest that, although azimuthal sun tracking remains advantageous, it is possible to maintain a stationary orientation of the 4T system throughout the year. This choice is economically attractive and could offset the expected cost increases due to the increased manufacturing complexity. Looking ahead, a thorough estimation of the Levelized Cost of Energy for the 4T PV system at specific installation sites is recommended. Overall, the proposed design could be profitably exploited as a small-sized and versatile “tile” in bifacial integrated photovoltaic systems, provided that the 4T approach is a resource to exploit reliable, cost-effective, and high-efficiency solar cells for the visible spectrum. This study is preliminary to the implementation of a prototype to be tested in an outdoor environment.

Author Contributions

Conceptualization, S.M.P. and A.F.; methodology, S.M.P., A.F. and S.L.; software, A.F., D.F. and F.M.; investigation, F.M. and D.F.; data curation, F.M. and D.F.; writing—original draft preparation, F.M., D.F. and S.M.P.; writing—review and editing, D.F. and P.S.; supervision, S.M.P.; funding acquisition, S.M.P. All authors have read and agreed to the published version of the manuscript.

Funding

This research was funded by CNR-UVR AMICO2_PoC, through Next Generation EU PoC 2022-PNRR del MIMIT-UIBM Mission1 Component 2 Investment 6.

Data Availability Statement

The data that support the findings of this study are available from the corresponding author upon reasonable request.

Conflicts of Interest

The authors declare no conflicts of interest.

Appendix A. Numerical Model—General

The performance of bifacial cells is simulated by developing a non-sequential numerical model using commercial 3D ray-tracing software (ZEMAX OpticStudio, 22.2 Professional). Data post-processing in MATLAB (R2019a) was also used. The model was run on a DELL workstation (Manufacturer Dell Inc. Round Rock, TX, USA. Mod. Precision 5820 Tower, 4 cores, 128GB of RAM, Intel-Xeon W-2155 processor @ 3.3GHz, NVIDIA Quadro P400 2GB graphics card). From the previous sections, it should be clear to the reader that the key ingredients of the 4T design are the vertex angle and the refractive index of the orthogonal wedge optics. Geometrically similar prisms of different lengths provide equivalent performances. In the present case, given the geometry of the chosen 4T configuration, a bifacial cell measuring 80 mm × 20 mm and a square GaAs cell measuring 20 mm at the side are considered. The clearance height, h, is selected considering optimized cell size ratios for the best bifacial operation [34]. By performing a numerical estimation over a suitable range of solar cell installation heights, a value of h = 160 mm was finally set. The primary optical source represents the direct component of sunlight and has a semi-angular divergence of 0.27°. A standard AM1.5G solar spectrum is considered [35] at the input and sampled on 24 equally spaced wavelength points, with spectrally integrated power intensity of 1000 W/m2. Spectrum sampling was performed in the wavelength range 400–1200 nm, depending on the transparency spectrum of optical material and the operating range of silicon cells.
The data on the summer solstice sun elevation values, ϕs,MAX, at different latitudes are provided in the online database “SunEarthTools.com” [36].
The ground was modeled as a Lambertian scattering surface with an albedo coefficient of 0.8, typical of a white diffusive ground (white paint or gravel ground) [40]; this acts as a secondary optical power source. A dedicated MATLAB code evaluates the total power flux scattered by the ground and collected by a rectangular detector, which simulates the back side of the bifacial solar cells facing the ground. Since the efficiency of the bifacial cell in collecting power diffused from the ground depends on its clearance height and the ground extension, a study was conducted to define the minimum ground surface that provides the most significant contribution to the performance of the simulated bifacial cells. The ground size is defined by considering the cell size, its shadow, and the perimeter effect of the ground boundaries. A scheme for the ground definition is provided in Figure A3. The details of the calculation are reported in Appendix B, Appendix C and Appendix D. Since the numerical modeling is stochastic, due to the randomness of the Lambertian emission on the ground, the test simulations were initially performed by running the ZEMAX model with an increasing number of rays, until a compromise between computational cost and repeatability of the results was found. The results and related details are reported in Figure A1. An optimal compromise of 4 × 10⁶ analysis rays was set and used for the simulations. Given a clearance height of h = 160 mm, the ground is adequately modeled by a square surface measuring 4 m at the side, since the collected power values are saturated for larger dimensions, as shown in Figure A4 and Figure A5 for the 2D and 3D analysis and discussed in detail in Appendix C and Appendix D.

Appendix B. Numerical Model for Diffused Light from the Ground

Appendix B.1. Primary Source

In the ZEMAX environment, the direct component of sunlight was modeled as a primary light source using a “source two angles” input, with a semi-angular divergence of 0.27°. The source was spectrally modeled by sampling 24 equally spaced wavelengths of the AM1.5G solar spectrum under standard conditions. The source power density was set to 1000 W/m2 and its orientation was rotated around the y-axis between 0° and 90° (the angles were defined with respect to the x-axis). The values of the sun’s elevation at the summer solstice at different latitudes were taken from the online database “SunEarthTools.com” [36].

Appendix B.2. Diffusive Ground

The numerical model in ZEMAX considers a diffusive Lambertian ground with an albedo coefficient of 0.8, typical of white diffusive ground (white paint or gravel ground) [40]. The frontal surface of the ground is “reflective” and the scattering model includes the parameters “scatter fraction” and “number of rays”, both set to 1. The uniform and constant albedo coefficients were modeled by adding a ground surface coating equal to “I.20” (i.e., 20% of the incoming direct component of sunlight is transmitted while 80% is isotropically reflected).
The source and ground were finally both set as square domains measuring 4 m × 4 m, as a result of geometric considerations evaluated by combining the ZEMAX simulation with a user-defined MATLAB code. The solar cells were kept fixed in the x-z plane. The size of the source and ground along the z-axis was calculated as detailed in the next section. After dimensioning the domains along the z-axis, the size along the y-axis varied. A value was finally chosen by evaluating the amount of power collected by the detector (representing the back side of the bifacial solar cell) as a function of the half-width parameter, Y, in the ZEMAX software (22.2 Professional). Furthermore, in order to verify the reproducibility of the simulated results, simulations were performed as functions of the number of analysis rays, as reported in Figure A1. This step is necessary due to statistical fluctuations in the results inherent in the Lambertian model used to simulate the diffusive ground. Figure A1 compares the simulated results for the optical power collected on the detector for each value of the half-width, Y, and obtained using 4 × 10⁶ analysis rays, taken as single shots (green line) and averaged over 10 shots (red line). The blue line plots single shots obtained by increasing the number of rays to the value of 4 × 10⁸. By examining Figure A1, it can be concluded that Lambertian diffusion does not significantly affect the repeatability of the results. Therefore, reliable simulations were performed using 4 × 10⁶ analysis rays to save machine time (from fractions of hours to a few minutes).
Figure A1. Evaluation of the ground size along the y-axis as a function of the “number of analysis rays”. An average of over 10 collected power values (blue curve) was compared to a single ray-tracing detection with 4 × 10⁶ rays (red curve) and 4 × 10⁸ rays (green curve). The detector simulates the back side of a bifacial silicon solar cell oriented according to the latitude of Milan on December 21st.
Energies 18 02044 g0a1
Furthermore, the curves in Figure A1 show a monotonically increasing trend of power collection with the half-width, Y, of the ground. A value of half-width of Y = 2 m can be considered a good compromise between size and power collection. This value is 25 times larger than the dimension, Z, of the bifacial solar cell, which is also in agreement with the literature [34].

Appendix B.3. Role of Clearance Height

After verifying the repeatability of the simulations, the issue of how the choice of clearance height affects the results was also investigated. As an example, the results reported in Figure A2 show the albedo collection on the back face of the bifacial solar cell as a function of the clearance height. A rectangular cell of 80 mm × 20 mm is considered and the cell orientation is kept fixed as that of the summer solstice at latitude 37°30′ N (Catania, Italy). The curve shown in Figure A2 saturates in the range between h = 100 mm and h = 200 mm, and decreases slightly beyond this range; therefore, h = 160 mm is considered a reasonable compromise value to include in the model to compare the ground-scattered light collection performance between the 4T system prism orientation and the standard bifacial cell orientation.
The comparison was performed by defining a merit function in ZEMAX, which evaluates the “total flux” collected for both orientations of the rectangular detector representing the back side of the bifacial solar cell.
Figure A2. Elevation analysis. Optical power intensity is collected as a function of clearance height. The silicon bifacial solar cell is oriented based on the summer solstice in Catania, Italy. The inset shows that saturation occurs between 10 cm and 20 cm.
Energies 18 02044 g0a2

Appendix C. Definition of Ground Size

Generally, the effect of light scattering on ground-mounted PV modules is simulated in systems comprising several rows of standard-sized modules so that the ground extension irradiating the back side of a module is limited by shading effects: in one direction, this is caused by the presence of the closest modules in the row; in the other direction, this is caused by the distance between the rows [19].
In the present case, a single, small-sized, self-supporting, isolated PV device is considered. Due to the limitations in the computing power and the number of usable rays in ZEMAX, some preliminary geometric considerations were needed in order to identify a minimum value for the ground extension, which would simulate the albedo collection reliably. In the 2D geometry in Figure A3a,b, the segment AB represents the bifacial solar cell. Considering the generic point, P, on the ground and a Lambertian diffusive model, the power emitted by the point P and reaching the segment AB is proportional to the angle APB.
Figure A3. Definition of the ground size based on the orientation of the silicon bifacial solar cell, as shown in (a,b). P0 is the intersection point on the ground.
Energies 18 02044 g0a3
A MATLAB program was created that calculates the APB angles as functions of the distance between point P and segment AB, representing the solar cell. The positions of points P01 and P0 are also calculated, with P01 being the intersection between the ground and the normal to the cell surface and being P0 the intersection of the ground line with the line AB. According to the irradiation conditions at the installation latitude and day of the year, Figure A4b and Figure A4c show the results for the installation in Catania, Italy, on the days of the solstices (June 21 and December 21) and equinoxes (September 21, coinciding with March 21) in Figure A4a. The plots are calculated considering a height of 160 mm for the solar cell above the ground. At solstices the positions of P01 and P0 are shown; meanwhile, on the equinox, only the position of P01 is shown, since P0 is out of range. As the position of point P approaches P01, the APB angle increases, which means that the contribution of point P to the albedo power collected by the solar cell also increases. Examining Figure A4, it is clear that, as the distance between point P and the cell approaches 2 m, the angular contribution becomes negligible. Hence, a 4 m extension of the ground, as reported in Figure A4, can be considered a good choice for achieving a compromise in our numerical analysis.
Figure A4. Results of the MATLAB program used for ground evaluation. (a) refers to the equinoxes, while the (b,c) refer to the solstices.
Energies 18 02044 g0a4

Appendix D. Computing Solid Angles for Albedo Collection

A second MATLAB program was then created that evaluates the solid angle, with which a generic point, P, of the ground is placed below the bifacial cell, taking into account a square terrain of 4 m on each side. Once the solid angle with which the point, P, sees the cell has been evaluated for each point, P, of the ground, it is possible to evaluate the power collected from the back side of a bifacial cell. The shaded P points and those beyond the P0 point obviously do not contribute and are therefore excluded. As an example, consider Figure A5a, which reports the solid angle values seen from the P points calculated for Catania at the winter solstice at h = 160 mm from the ground. Figure A5b shows the section with y = 0, in which point P0 has been highlighted. The ground points that are to the left of point P0 do not illuminate the back of the bifacial cell and are excluded from the power calculation.
Figure A5. Results of MATLAB solid angle calculation used for the evaluation of the power scattered by the ground. (a) shows the 3D view of the calculation and (b) is a section of it along y = 0.
Energies 18 02044 g0a5

Appendix E. Additional Tables

Table A1. Summary of photocurrent at each detector and output electrical power in Dublin during the equinox at noon for each configuration (4T without prism; 4T with 14.47° vertex angle; 4T with 30° vertex angle; normal; vertical) at constant area of input illumination.
53°20′ N—Dublin at the Equinox (at Noon–ϕs = 37°)
ConfigurationPhotocurrent (A)
Collected on the Cell Side
Total Pout,el (W)
GaAsSi Front Si Back
4T without prism-0.570.310.52
4T with 14.47° vertex angle 0.250.230.340.54
4T with 30° vertex angle0.360.310.370.39
Normal-0.750.250.58
Vertical-0.700.150.49
Table A2. Summary of photocurrent at each detector and output electrical power in Miami during the summer solstice at noon for each configuration (4T without prism; 4T with 14.47° vertex angle; 4T with 30° vertex angle; normal; vertical) at constant area of input illumination.
25°46′ N—Miami at the Summer Solstice (at Noon–ϕs = 88°)
ConfigurationPhotocurrent (A)
Collected on the Cell Side
Total
Pout,el (W)
GaAsSi FrontSi Back
4T without prism-0.600.490.63
4T with 14.47° vertex angle0.330.290.510.74
4T with 30° vertex angle0.360.300.580.82
Normal-0.710.550.74
Vertical-0.720.470.69

References

  1. Bonomo, P.; Frontini, F.; Loonen, R.; Reinders, A.H.M.E. Comprehensive review and state of play in the use of photovoltaics in buildings. Energy Build. 2024, 323, 114737. [Google Scholar] [CrossRef]
  2. Block, A.B.; Palou, J.E.; Courtant, M.; Virtuani, A.; Cattaneo, G.; Roten, M.; Li, H.Y.; Despeisse, M.; Hessler-Wyser, A.; Desai, U.; et al. Colouring solutions for building integrated photovoltaic modules: A review. Energy Build. 2024, 314, 114253. [Google Scholar] [CrossRef]
  3. Özkalay, E.; Virtuani, A.; Eder, G.; Voronko, Y.; Bonomo, P.; Caccivio, M.; Ballif, C.; Friesen, G. Correlating long-term performance and aging behaviour of building integrated PV modules. Energy Build. 2024, 316, 114252. [Google Scholar] [CrossRef]
  4. Li, G.; Xuan, Q.; Akram, M.W.; Golizadeh Akhlaghi, Y.; Liu, H.; Shittu, S. Building integrated solar concentrating systems: A review. Appl. Energy 2020, 260, 114288. [Google Scholar] [CrossRef]
  5. Meinardi, F.; Bruni, F.; Brovelli, S. Luminescent solar concentrators for building-integrated photovoltaics. Nat. Rev. Mater. 2017, 2, 17072. [Google Scholar] [CrossRef]
  6. Wu, Y.; Connelly, K.; Liu, Y.; Gu, X.; Gao, Y.; Chen, G.Z. Smart solar concentrators for building integrated photovoltaic façades. Sol. Energy 2016, 133, 111–118. [Google Scholar] [CrossRef]
  7. Piratheepan, M.; Anderson, T.N. Performance of a building integrated photovoltaic/thermal concentrator for facade applications. Sol. Energy 2017, 153, 562–573. [Google Scholar] [CrossRef]
  8. Kuhn, T.E.; Erban, C.; Heinrich, M.; Eisenlohr, J.; Ensslen, F.; Neuhaus, D.H. Review of technological design options for building integrated photovoltaics (BIPV). Energy Build. 2021, 231, 110381. [Google Scholar] [CrossRef]
  9. Richards, B.S.; Howard, I.A. Luminescent solar concentrators for building integrated photovoltaics: Opportunities and challenges. Energy Environ. Sci. 2023, 16, 3214–3239. [Google Scholar] [CrossRef]
  10. Pochont, N.R.; Sekhar, Y.R. Recent trends in photovoltaic technologies for sustainable transportation in passenger vehicles—A review. Renew. Sustain. Energy Rev. 2023, 181, 113317. [Google Scholar] [CrossRef]
  11. Nugraha, I.M.A.; Luthfiani, F.; Sotyaramadhani, G.; Widagdo, A.; Desnanjaya, I.G.M.N. Technical-economical assessment of solar PV systems on small-scale fishing vessels. Int. J. Power Electron. Drive Syst. 2022, 13, 1150–1157. [Google Scholar] [CrossRef]
  12. Koričan, M.; Frković, L.; Vladimir, N. Electrification of fishing vessels and their integration into isolated energy systems with a high share of renewables. J. Clean. Prod. 2023, 425, 138997. [Google Scholar] [CrossRef]
  13. Tiwari, M.; Sruthy, V.; Preetha, P.K. Foldable floating solar array for electric vessel. In Proceedings of the 3rd International Conference on Smart Systems and Inventive Technology (ICSSIT), Tirunelveli, India, 20–22 August 2020; pp. 586–593. [Google Scholar]
  14. Liang, T.S.; Pravettoni, M.; Deline, C.; Stein, J.S.; Kopecek, R.; Singh, J.P.; Luo, W.; Wang, Y.; Aberle, A.G.; Khoo, Y.S. A review of crystalline silicon bifacial photovoltaic performance characterisation and simulation. Energy Environ. Sci. 2019, 12, 116–148. [Google Scholar] [CrossRef]
  15. Green, M.A.; Dunlop, E.D.; Yoshita, M.; Kopidakis, N.; Bothe, K.; Siefer, G.; Hinken, D.; Rauer, M.; Hohl-Ebinger, J.; Hao, X. Solar cell efficiency tables (Version 64). Prog. Photovolt. Res. Appl. 2024, 32, 425–441. [Google Scholar] [CrossRef]
  16. Ganesan, K.; Winston, D.P.; Sugumar, S.; Jegan, S. Performance analysis of n-type PERT bifacial solar PV module under diverse albedo conditions. Sol. Energy 2023, 252, 81–90. [Google Scholar] [CrossRef]
  17. Kumar, P.; Shankar, G.; Pradhan, B. Recent progress in bifacial perovskite solar cells. Appl. Phys. A Mater. Sci. Process 2023, 129, 63. [Google Scholar] [CrossRef]
  18. Mahim, T.M.; Rahim, A.H.M.A.; Rahman, M.M. Review of Mono-and Bifacial Photovoltaic Technologies: A Comparative Study. IEEE J. Photovolt. 2024, 14, 375–396. [Google Scholar] [CrossRef]
  19. Fontani, D.; Jafrancesco, D.; Sansoni, P.; Nicolini, A.; Di Giuseppe, A.; Pazzaglia, A.; Castellani, B.; Rossi, F.; Mercatelli, L. Field optimization for bifacial modules. Opt. Mater. 2023, 138, 113715. [Google Scholar] [CrossRef]
  20. Shockley, W.; Queisser, H.J. Detailed balance limit of efficiency of p-n junction solar cells. J. Appl. Phys. 1961, 32, 510–519. [Google Scholar] [CrossRef]
  21. Akhil, S.; Akash, S.; Pasha, A.; Kulkarni, B.; Jalalah, M.; Alsaiari, M.; Harraz, F.A.; Balakrishna, R.G. Review on perovskite silicon tandem solar cells: Status and prospects 2T, 3T and 4T for real world conditions. Mater. Des. 2021, 211, 110138. [Google Scholar] [CrossRef]
  22. Raza, E.; Ahmad, Z. Review on two-terminal and four-terminal crystalline-silicon/perovskite tandem solar cells; progress, challenges, and future perspectives. Energy Rep. 2022, 8, 5820–5851. [Google Scholar] [CrossRef]
  23. Gupta, V.; Kumar, P.; Singh, R. Unveiling the potential of bifacial photovoltaics in harvesting indoor light energy: A comprehensive review. Sol. Energy 2024, 276, 112660. [Google Scholar] [CrossRef]
  24. Rühle, S.; Greenwald, S.; Koren, E.; Zaban, A. Optical waveguide enhanced photovoltaics. Opt. Express 2008, 16, 21801–21806. [Google Scholar] [CrossRef]
  25. Farina, A.; Carlotto, A.; Varas, S.; Chiasera, A.; Pietralunga, S.M. An asymmetric low concentrator and spectral splitting approach to bifacial four-terminal photovoltaic modules. Prog. Photovolt. Res. Appl. 2023, 31, 1299–1314. [Google Scholar] [CrossRef]
  26. Hamdan, M.; Brawiesh, A.K. Enhancement of PV performance using optical solar spectrum splitting. Energy Sources Part A Recovery Util. Environ. Eff. 2021, 43, 2000–2007. [Google Scholar] [CrossRef]
  27. Goldschmidt, J.C.; Do, C.; Peters, M.; Goetzberger, A. Spectral splitting module geometry that utilizes light trapping. Sol. Energy Mater. Sol. Cells 2013, 108, 57–64. [Google Scholar] [CrossRef]
  28. Scuto, A.; Corso, R.; Leonardi, M.; Milazzo, R.G.; MS Privitera, S.; Colletti, C.; Foti, M.; Bizzarri, F.; Gerardi, C.; Lombardo, S.A. Outdoor performance of GaAs/bifacial Si heterojunction four-terminal system using optical spectrum splitting. Sol. Energy 2022, 241, 483–491. [Google Scholar] [CrossRef]
  29. Hong, W.; Li, B.; Li, H.; Niu, X.; Li, Y.; Lan, J. Recent progress in thermal energy recovery from the decoupled photovoltaic/thermal system equipped with spectral splitters. Renew. Sustain. Energy Rev. 2022, 167, 112824. [Google Scholar] [CrossRef]
  30. Muteri, V.; Guarino, F.; Longo, S.; Bua, L.; Cellura, M.; Testa, D.; Bonzi, M. An Innovative Photovoltaic Luminescent Solar Concentrator Window: Energy and Environmental Aspects. Sustainability 2022, 14, 4292. [Google Scholar] [CrossRef]
  31. Kuhn, T.E. State of the art of advanced solar control devices for buildings. Sol. Energy 2017, 154, 112–133. [Google Scholar] [CrossRef]
  32. Cook, M.J.; Al-Hallaj, S. Film-based optical elements for passive solar concentration in a BIPV window application. Sol. Energy 2019, 180, 226–242. [Google Scholar] [CrossRef]
  33. Corso, R.; Matera, F.; Lombardo, S.A. Numerical Evaluation of Optimal Tilt Angle for Energy Production and Minimum Shadowing for Bifacial Solar Modules. In Proceedings of the Conference Record of the IEEE 50th Photovoltaic Specialists Conference (PVSC), San Juan, PR, USA, 11–16 June 2023; pp. 1–3. [Google Scholar]
  34. Galluzzo, F.R.; Zani, P.E.; Foti, M.; Canino, A.; Gerardi, C.; Lombardo, S. Numerical modeling of bifacial PV string performance: Perimeter effect and influence of uniaxial solar trackers. Energies 2020, 13, 869. [Google Scholar] [CrossRef]
  35. Reference Air Mass 1.5 Spectra. Available online: https://www2.nrel.gov/grid/solar-resource/spectra-am1.5 (accessed on 15 March 2025).
  36. Tools for Consumers and Designers of Solar. Available online: www.sunearthtools.com (accessed on 15 March 2025).
  37. Enel Green Power. Available online: www.enelgreenpower.com (accessed on 15 March 2025).
  38. ReRa Solutions. Available online: www.rerasolutions.com (accessed on 15 March 2025).
  39. Sánchez, H.; Meza, C.; Dittmann, S.; Gottschalg, R. The effect of clearance height, albedo, tilt and azimuth angle in bifacial PV energy estimation using different existing algorithms. In Proceedings of the III Iberoamerican Conference on Smart Cities (ICSC-2020), San José, CA, USA, 9–11 November 2020; pp. 315–331. [Google Scholar]
  40. Ramírez, A.Z.; Muñoz, C.B. Albedo Effect and Energy Efficiency of Cities. In Sustainable Development-Energy, Engineering and Technologies-Manufacturing and Environment; IntechOpen: Rijeka, Croatia, 2012. [Google Scholar]
Figure 1. General scheme of the 4T asymmetric photovoltaic concentrator and its orientation in the field at a latitude of ϕN < 45° in the Northern Hemisphere. The safety height is h. A negative inclination angle, β, corresponds to an orientation towards the north.
Energies 18 02044 g001
Figure 2. Optical intensity collected from the back side of the bifacial solar cell as the sun elevation varies up to the maximum value reached at noon on the summer solstice. Simulations are performed at four different latitudes (panels (ad)). Each panel (a.1d.1) is associated with a corresponding cartoon for an easier understanding of the different configurations considered. This is the detector that mimics the back side of the bifacial silicon solar cell oriented according to the 4T configuration (black) and the standard flat configurations, which are the horizontal (red), vertical (green), and normal (blue) configurations. In panel (d), as expected, the red and blue curves are superimposed. The clearance height is set to h = 160 mm.
Energies 18 02044 g002
Figure 3. Total Optical Intensity collected by the solar system as the sun’s elevation varies up to the maximum value reached at noon at the summer solstice. Simulations are performed at four different latitudes (panels (ad)). The x-axis limits are set between 0° and 90° to easily compare the sun elevation for each investigated latitude. The 4T bifacial configuration is compared to three typical standard flat configurations. In the 4T configuration (black curves) the TOP is equal to the sum of the optical power collected by each detector (i.e., GaAs cell, front side only, and Si cell, both front and back side). Differently, for the standard configurations the detector that mimics the entire bifacial silicon solar cell (i.e., front + back sides) was oriented according to the horizontal (red curves), vertical (green curves), and normal (blue curves) orientations, respectively. In panel (d), the red and blue curves, as expected, are superimposed. A clearance height h = 160 mm was considered.
Energies 18 02044 g003
Figure 4. Total Optical Intensity collected by the solar system as the sun’s elevation varies up to the maximum value reached at noon at the equinox (panel (a)) and at the summer solstice (panel (b)) at the latitude of Dublin, Ireland. For each panel, a cartoon (a.1,b.1) graphically shows the corresponding orientations. The 4T configuration is compared with three typical standard flat configurations. In the 4T configuration (black), the TOP is equal to the sum of the optical power collected by each detector (i.e., GaAs cell, front side only, and Si cell, both front and back side). Differently, for the standard configurations, the detector that mimics the entire bifacial silicon solar cell (i.e., front + back sides) was oriented according to horizontal (red), vertical (green), and normal (blue) orientations, respectively. A clearance height of h = 160 mm was considered.
Energies 18 02044 g004
Figure 5. Total Optical Intensity collected by the solar element, as the sun’s elevation varies up to the maximum value reached at noon at the equinox (panel (a)) and at the summer solstice (panel (b)) at the latitude of Miami, US. For each panel a cartoon (a.1,b.1) graphically shows the corresponding orientations. The 4T configuration is compared with three typical standard flat configurations. In the 4T configuration (black), the TOP is equal to the sum of the optical power collected by each detector (i.e., GaAs cell, front side only, and Si cell, both front and back side). Differently, for the standard configurations, the detector that mimics the entire bifacial silicon solar cell (i.e., front + back sides) was oriented according to horizontal (red), vertical (green), and normal (blue) orientations, respectively. A clearance height at h = 160 mm was considered.
Energies 18 02044 g005
Figure 6. Total Optical Intensity collected by the system as the sun elevation varies up to the maximum value reached at noon at the equinox (panel (a)) and at the summer solstice (panel (b)) at the latitude of Dublin, Ireland. For each panel, a cartoon (a.1,b.1) graphically shows the corresponding orientations. The 4T configuration with a vertex angle of 14.47° (black) is compared with the same 4T configuration but considering a vertex angle of 30° (purple); here, there is a normal flat configuration (blue) and a flat configuration with the same orientation of the bifacial cell as in the 4T orientation, but without any coupled optical system (cyan). The clearance height was set to h = 160 mm.
Energies 18 02044 g006
Figure 7. Optical intensity collected by the system as the sun’s elevation varies up to the maximum value reached at noon at the equinox (panel (a)) and at the summer solstice (panel (b)) at the latitude of Miami, US. For each panel, a cartoon (a.1,b.1) graphically shows the corresponding orientations. The 4T configuration with a vertex angle of 14.47° (black) is compared with the same 4T configuration, but considering a vertex angle of 30° (purple), with a normal flat configuration (blue), and with a flat configuration sharing the orientation of the bifacial cell, as in the 4T orientation, but without any coupled optical system (cyan). The clearance height was set to h = 160 mm.
Energies 18 02044 g007
Table 1. List of symbols.
SymbolUnitsDefinition
φdeg (°)vertex angle of the optical wedge prism
βdeg (°)inclination angle
ϕsdeg (°)sun elevation
ϕs,MAXdeg (°)sun elevation at noon
ΦNdeg (°)latitude angle (Northern Hemisphere)
αdeg (°)orientation of the bifacial cell with respect to the ground
θiLdeg (°)lower limit for the angle of incidence of sunlight
Vocvoltopen circuit voltage
Iscampereshort-circuit current
FF//Fill Factor
λmeteroptical wavelength
ROPI//Relative Optical Power Increase
TOPWattTotal Optical Power
PCE//Power Conversion Efficiency
RPI//Relative Power Increase (electrical)
Table 2. Summary of the sun elevation at the summer solstice of June 21st at four different latitudes (53°20′ N—Dublin, Ireland; 45°28′ N—Milan, Italy; 37°30′ N—Catania, Italy; 25°46′ N—Miami, USA), from a database available online [36]; the corresponding orientation of the bifacial solar cell in the 4T configuration is provided.
Latitude—TownSun Elevation (°)Orientation of 4T Bifacial Solar Cell α (°)
53°20′ N—Dublin60−5.47
45°28′ N—Milan68−13.47
37°30′ N—Catania76−21.47
25°46′ N—Miami88−33.47
Table 3. Summary of the values of the sun’s elevation at noon on three different days (June 21st, September 21st, and December 21st) at four latitudes (53°20′ N—Dublin, Ireland; 45°28′ N—Milan, Italy; 37°30′ N—Catania, Italy; 25°46′ N—Miami, USA) (from the database available online [36]).
Latitude—TownSun Elevation at Noon φ s , M A X (°)
Jun 21stSep 21st Dec 21st
53°20′ N—Dublin603713
45°28′ N—Milan684521
37°30′ N—Catania765329
25°46′ N—Miami886641
Table 4. Summary of the daily percentage Relative Optical Power Increase (ROPI) comparing the 4T configuration with the standard flat horizontal configuration (i.e., parallel to the ground) at four latitudes and for three different dates (summer solstice, equinoxes, and winter solstice). The values reported are integrated over the entire day (June 21st, September 21st, December 21st).
Latitude—TownROPIHorizontal (%)
Jun 21stSep 21stDec 21st
53°20′ N—Dublin19429
45°28′ N—Milan41153
37°30′ N—Catania81966
25°46′ N—Miami122575
Table 5. Summary of the daily percentage Relative Optical Power Increase (ROPI) comparing the 4T configuration with the standard flat vertical configuration (i.e., perpendicular to the ground) at four latitudes and on three different dates (summer solstice, equinoxes, and winter solstice). The values reported are integrated over the entire day (June 21st, September 21st, December 21st).
Latitude—TownROPIVertical (%)
Jun 21stSep 21stDec 21st
53°20′ N—Dublin128134186
45°28′ N—Milan133150239
37°30′ N—Catania141167270
25°46′ N—Miami149180293
Table 6. Summary of the daily percentage Relative Optical Power Increase (ROPI) comparing the 4T configuration with the standard flat normal configuration (i.e., perpendicular to the incoming solar rays at noon) at four latitudes and on three different dates (summer solstice, equinoxes, and winter solstice). The values reported are integrated over the entire day (June 21st, September 21st, December 21st).
Latitude—TownROPI Normal (%)
Jun 21stSep 21stDec 21st
53°20′ N—Dublin131540
45°28′ N—Milan111861
37°30′ N—Catania112270
25°46′ N—Miami122575
Table 7. Summary of ideal photocurrents on each cell and electrical output power in Dublin during the summer solstice at noon for each configuration (4T without prism; 4T with 14.47° vertex angle; 4T with 30° vertex angle; normal; vertical) at a constant area of input illumination.
53°20′ N—Dublin at the Summer Solstice (at Noon– ϕ s = 60°)
ConfigurationPhotocurrent (A)
Collected on the Cell Side
Total Pout,el (W)
GaAsSi FrontSi Back
4T without prism-0.490.420.53
4T with 14.47° vertex angle0.320.290.490.72
4T with 30° vertex angle0.360.300.500.77
Normal-0.720.440.68
Vertical-0.210.530.43
Table 8. Summary of ideal photocurrent on each cell and electrical output power in Miami during the equinox at noon for each configuration (4T without prism; 4T with 14.47° vertex angle; 4T with 30° vertex angle; normal; vertical) at a constant area of input illumination.
25°46′ N—Miami at the Equinox (at Noon– ϕ s = 66°)
ConfigurationPhotocurrent (A)
Collected on the Cell Side
Total Pout,el (W)
GaAsSi Front Si Back
4T without prism-0.570.490.62
4T with 14.47° vertex angle0.320.290.510.73
4T with 30° vertex angle0.360.310.570.81
Normal-0.720.470.69
Vertical-0.480.230.41
Table 9. Summary of the output power for the 4T configuration with 30° vertex angle and fixed-orientation normal configurations at equinox in Miami. Output power at constant input illumination area is collected during equinox and summer and winter solstices, respectively. The Relative Power Increase (RPI) is reported in the last row.
25°46′ N—Miami (Equinox Orientation)
ConfigurationTPout,el Collection (W)
EquinoxSummer SolsticeWinter Solstice
4T with 30° vertex angle 0.810.830.66
Normal0.690.690.57
Relative Power Increase16%20%16%
Table 10. Summary of noon PCE values for 4T configuration with 30° vertex angle and fixed-orientation normal configurations at equinox in Miami. PCE values are calculated at a constant input illumination area for data collection during equinox and summer and winter solstice, respectively. The relative increase in PCE at noon is reported in the bottom row.
25°46′ N—Miami (Equinox Orientation)
PCE (%) at NoonEquinoxSummer SolsticeWinter Solstice
4T φ = 30°303227
Normal262722
Relative Increase in PCE15%18%23%
Disclaimer/Publisher’s Note: The statements, opinions and data contained in all publications are solely those of the individual author(s) and contributor(s) and not of MDPI and/or the editor(s). MDPI and/or the editor(s) disclaim responsibility for any injury to people or property resulting from any ideas, methods, instructions or products referred to in the content.

