Article

Thermodynamic-Environmental-Economic Evaluations of a Solar-Driven Supercritical CO2 Cycle Integrated with Cooling, Heating, and Power Generation

College of Mechanical and Electrical Engineering, Qingdao University, Qingdao 266071, China
*
Author to whom correspondence should be addressed.
Energies 2025, 18(8), 1995; https://doi.org/10.3390/en18081995
Submission received: 12 March 2025 / Revised: 28 March 2025 / Accepted: 11 April 2025 / Published: 13 April 2025
(This article belongs to the Section A2: Solar Energy and Photovoltaic Systems)

Abstract

:
The combined cooling, heating, and power system is based on the principle of energy cascade utilization, which is conducive to reducing fossil energy consumption and improving the comprehensive utilization efficiency of energy. With the characteristics of a lower expansion ratio and larger recuperation of a supercritical carbon dioxide (SCO2) power cycle, a combined cooling, heating, and power (CCHP) system is proposed. The system is based on a SCO2 cycle and is driven by solar energy. The system is located in Qingdao and simulated by MATLAB/Simulink software (R2022b). Firstly, the thermodynamic performance of the CCHP system at the design condition is analyzed. The energy utilization efficiency of the CCHP system is 79.75%, and the exergy efficiency is 58.63%. Then, the thermodynamic, environmental, and economic performance analyses of the system under variable conditions are carried out. Finally, the solar multiple is optimized. The results show that the minimum levelized cost of electricity is 10.4 ¢/(kW·h), while the solar multiple is 4.8. The annual primary energy saving rate of the CCHP system is 85.04%, and the pollutant emission reduction rate is 86.05%, compared with the reference system. Therefore, an effective way to reduce environmental pollution and improve the utilization efficiency of solar energy is provided.

1. Introduction

The development of renewable energy is conducive to reducing the utilization of fossil energy and pollutant emissions. In recent years, the share of solar energy in the global energy structure has increased significantly. Concentrated solar thermal power generation is not only environmentally friendly but also grid-compatible [1]. Additionally, solar tower power generation has the characteristics of high concentration ratios and high thermal-to-electrical conversion efficiency, making it a research focus [2].
The development of the SCO2 cycle in solar thermal power generation systems has become a new research hotspot. When the turbine inlet parameter is 700 °C/35 MPa, the thermal efficiency of the SCO2 cycle reaches 51.82%, which is significantly higher than that of existing supercritical water–steam Rankine cycle power plants [3]. The density of CO2 is relatively high at the critical point (7.38 MPa, 31.3 °C), the power consumption of compression is reduced. Thus, the combination of solar power systems with the SCO2 power cycle has the potential for efficient utilization of solar energy at high operating temperatures. Higher cycle efficiency is achieved by modifying the SCO2 cycle layout [4]. Through the optimization and comparative analysis of different SCO2 power cycle layouts, it is found that the SCO2 recompression cycle exhibits better thermodynamic performance [5,6].
To enhance energy utilization efficiency and mitigate irreversible losses in power cycles, the waste heat of the power system is utilized. There are usually two types of waste heat utilization methods. One is to combine a bottom power cycle to achieve power generation, and the other is to recover waste heat for cooling, heating, and power generation.
When the top power cycle is a SCO2 power cycle, current investigations focus on two predominant bottom cycle configurations: the organic Rankine cycle (ORC) and the transcritical carbon dioxide (TCO2) cycle. Studies reveal substantial performance improvements in the combined cycle. For the SCO2 cycle combined with the ORC, Song et al. [7] demonstrated significant improvements, with the maximum power output enhancement reaching 58% and the specific investment cost reduction achieving 4% compared to SCO2 systems. Research by Fan et al. [8] on solar-driven SCO2-ORC system further confirmed the enhanced thermodynamic and economic performance of integrated systems. For the SCO2 cycle integrated with the TCO2 cycle, the thermal efficiency of the integrated system reaches up to 65.7% [9]. Advanced configurations developed by Fan et al. [10] employed two-stage cascaded SCO2–TCO2 cycles for waste heat recovery of gas turbines, finding that the thermal efficiency of the combined system increased by 4.32%, and the levelized cost of electricity (LCOE) decreased by 2.42% compared with the SCO2 recompression cycle.
Recovering waste heat from the power cycle to drive cooling and heating operations is also an effective way to improve the overall energy utilization of the system. The CCHP system is based on the principle of cascaded energy utilization to achieve the output of cooling, heating and electricity. Wu et al. [11] found that the micro-CCHP system based on the integration of a gas engine and an absorption chiller is always superior to the conventional separated system for heat loads exceeding 21 kW. As the turbine inlet temperature rises, both the turbine output work and the exergy efficiency of the SCO2 CCHP system increase [12]. However, Li et al. [13] found that the turbine inlet temperature was negatively correlated with the payback period and levelized energy cost. Therefore, it is necessary to evaluate the cogeneration system comprehensively. A novel hybrid CCHP system was introduced by Soleimani et al. [14], and its performance was evaluated from the perspectives of energy, exergy, environment and economic. The results showed that the CCHP system has higher efficiency and lower pollutant emissions than the reference system. Fan et al. [15] proposed a CCHP system integrated the SCO2 cycle with the ORC and the ejector refrigeration cycle, and the results showed that the exergy efficiency of the CCHP system is increased by 9.17% and the unit cost of the product is decreased by 5.05%. To evaluate the matching between the output of the CCHP system and the user’s demand, Feng et al. [16] proposed five dimensionless matching parameters to analyze the performance.
The utilization of solar energy and thermal energy storage is an effective way to reduce fossil energy consumption and improve the operational performance of the CCHP system. Distributed CCHP is the mainstream for small-scale solar thermal utilization. Solar energy resources vary due to weather and geographical conditions. Wu et al. [17] studied the performance of solar CCHP system in different regions. The results showed that the CCHP system is more effective in cold regions, where solar energy resources are abundant, and the heat demand of buildings is large and stable throughout the year. The application of thermal energy storage equipment addresses the intermittent and unstable characteristics of solar energy [18]. Wang et al. [19] proposed a solar photovoltaic/thermal CCHP system, and the optimal sizing of electrical energy storage and the thermal energy storage are obtained using an upper-level optimization model. Moreover, the optimization of the operation strategy and the capacity of the thermal energy storage equipment further improve energy efficiency. A novel CCHP system integrated with solar energy is analyzed by Chen et al. [20], and it is found that the cost increased with the thermal energy storage ratio. Liu et al. [21] adjusted the operation strategy according to the variation in electricity price, and the capacity of thermal energy storage is optimized, the equivalent electricity cost of the system was reduced, and the results showed that, when the solar multiple is 8.17, the LCOE reaches its lowest value.
However, the high initial investment of CCHP system remains a limitation for large-scale applications. Secondly, the load fluctuation of CCHP system is large. Adjusting the output of cooling, heating, and power according to the actual demand is also one of the difficulties in current research [22].
This paper innovatively proposes a solar-driven SCO2-combined cooling, heating, and power system, which adjusts the ratio of cooling, heating, and power by changing the split ratio. To cope with the intermittent and unstable characteristics of solar energy, the system integrates thermal energy storage equipment. The main contributions are summarized as follows:
(1)
A SCO2-combined cooling, heating, and power system with thermal energy storage driven by solar energy is proposed. The cascade utilization of energy is realized, and the system model is built and verified.
(2)
The system performance under different solar multiples is analyzed, and the solar multiples is optimized with the levelized cost of electricity as the optimization objective. According to the variations in users’ demands and solar irradiance, the thermodynamic, environmental, and economic performance of the system under typical days and variable conditions are investigated.
The structure of this paper is organized as follows: Section 2 introduces the system structure, the climatic parameters and building load. In Section 3, the mathematical model for the equipment and the evaluation criteria of thermodynamic, environmental, and economic are introduced, and the model is verified. Section 4 analyzes the performance of the system under design conditions and variable operating conditions throughout the year. Finally, the conclusions are illustrated in Section 5.

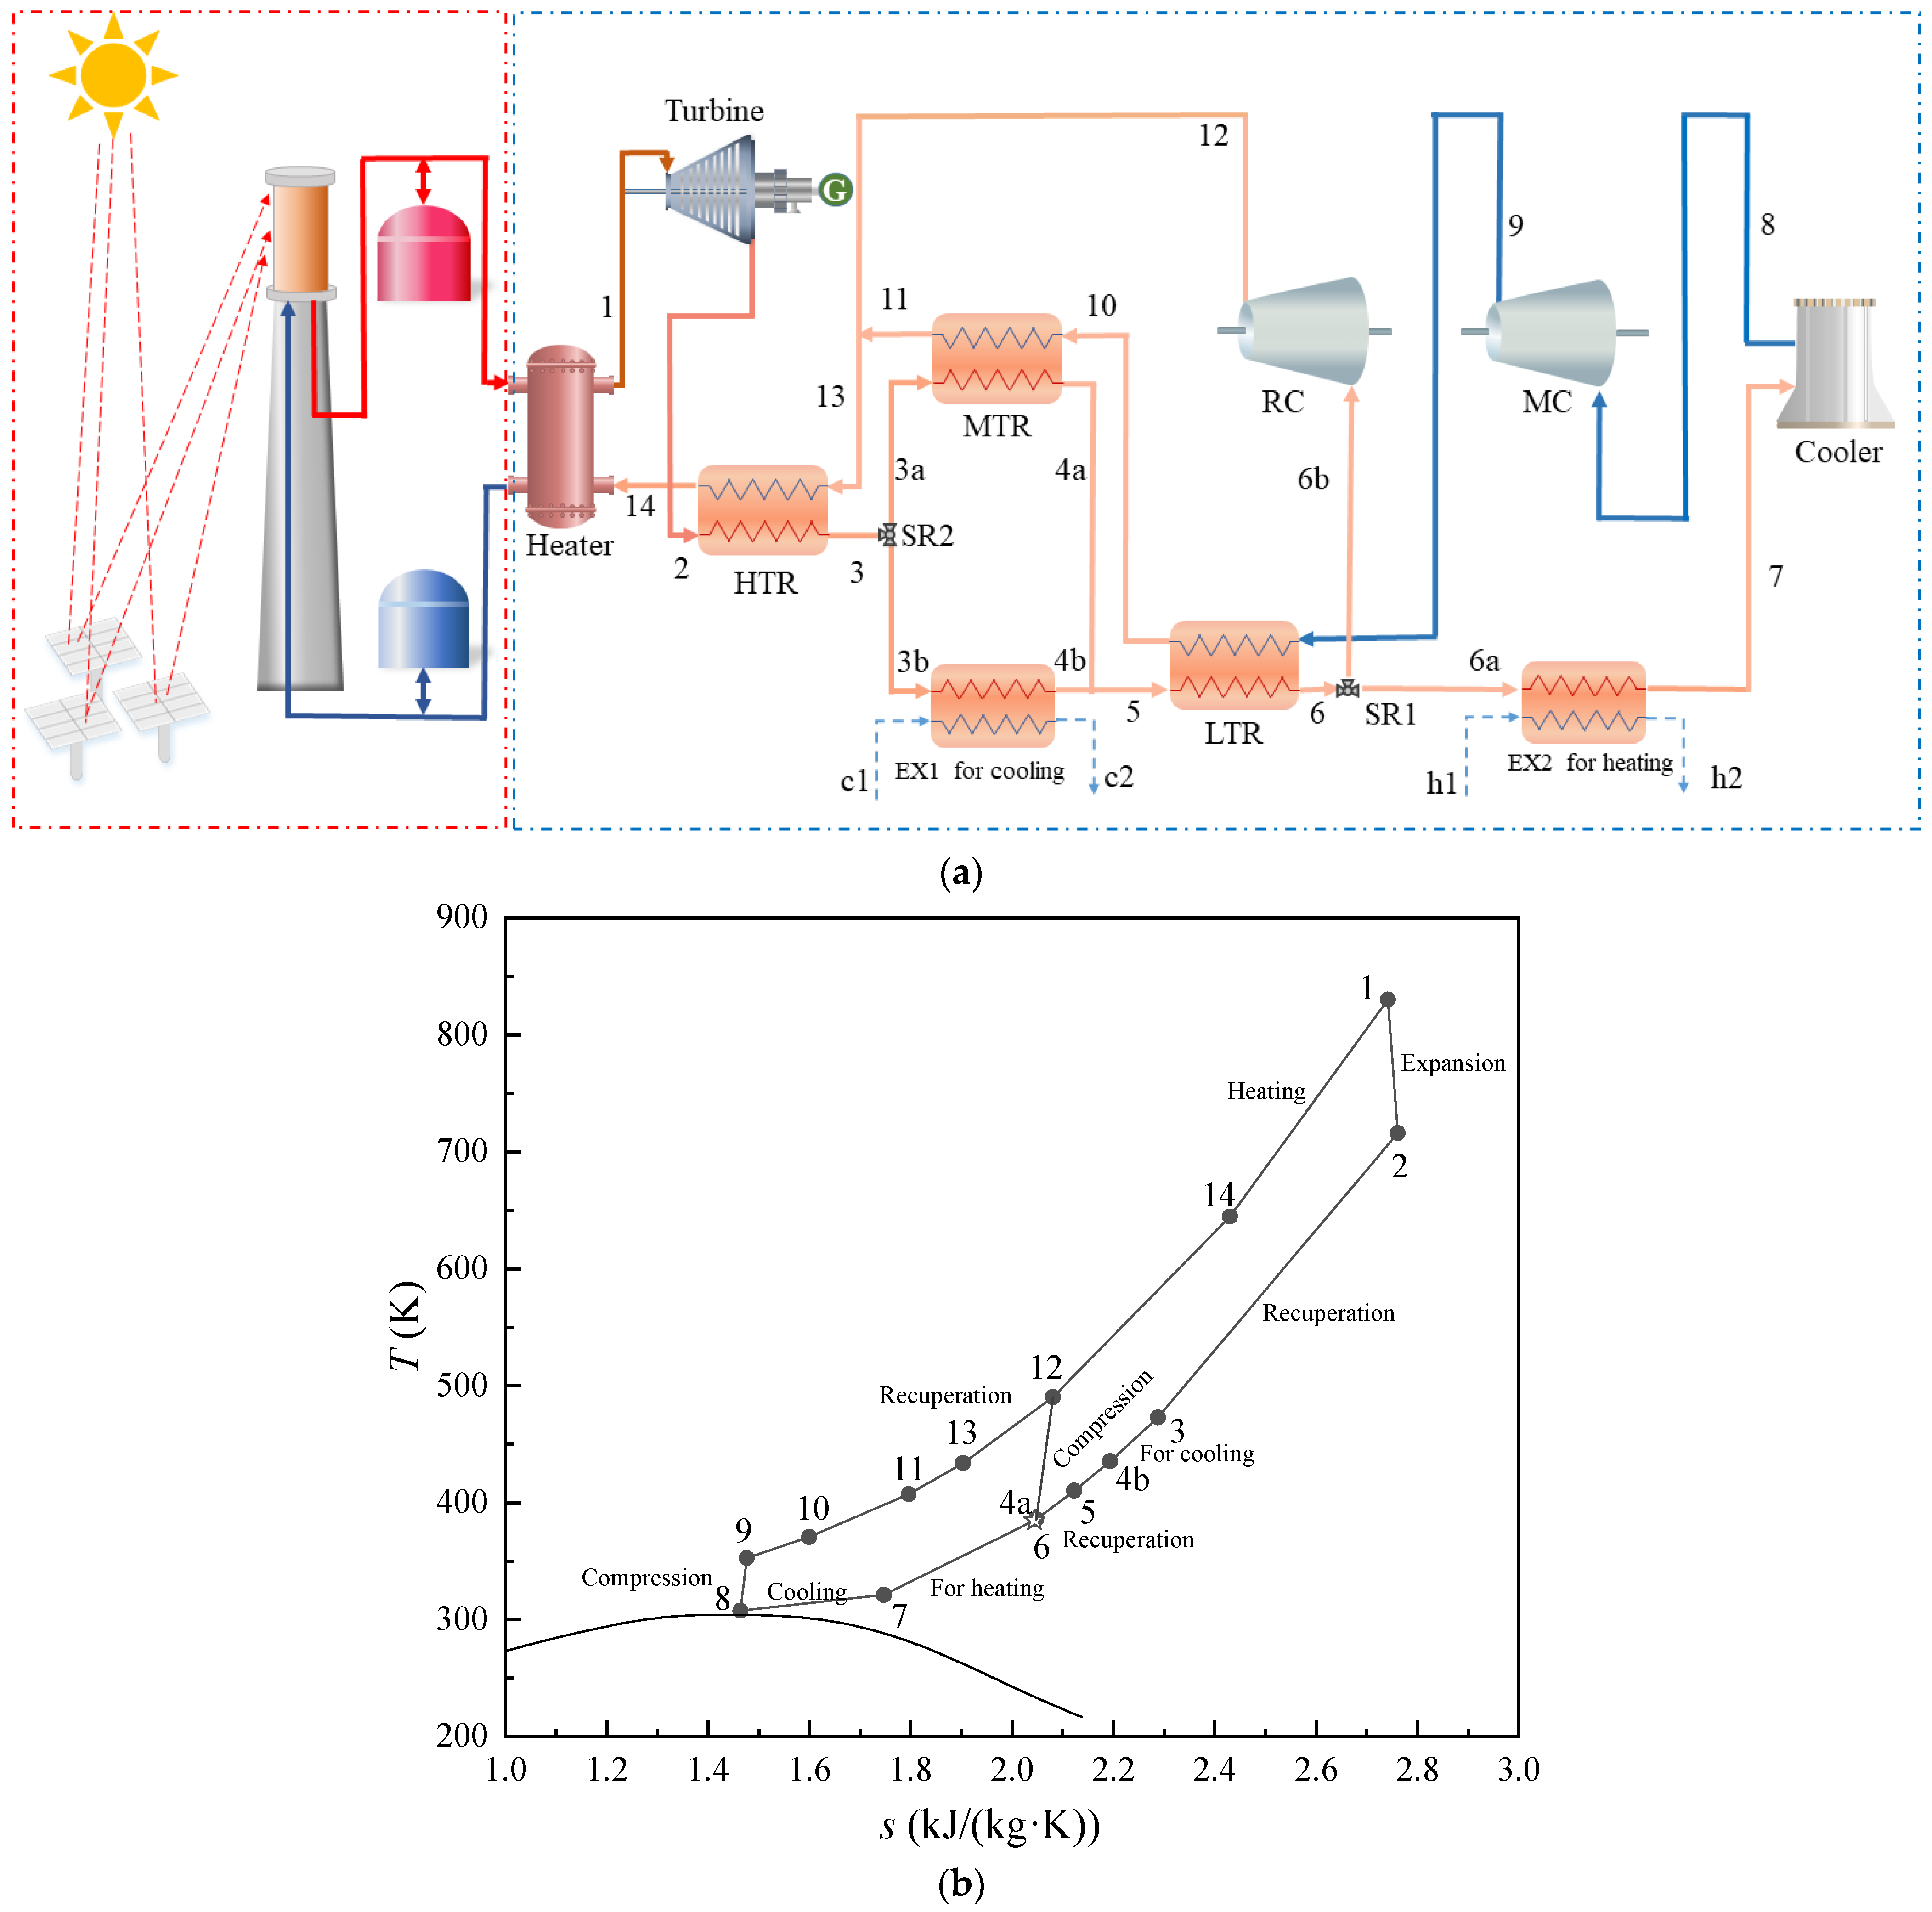
2. System Descriptions

2.1. System Configuration

The system proposed in this paper is composed of a solar tower collector and a SCO2 CCHP unit. The configuration of the solar-driven CCHP system is shown in Figure 1a. The CCHP system drives the generator to generate electricity through turbine operation and uses the medium and low-grade waste heat at the turbine outlet for cooling and heating. Power from the grid is used as a supplement when the output electricity is insufficient to meet the users’ needs. When the output cooling does not meet the users’ cooling load, the electric refrigeration unit is utilized. When the output heating energy is insufficient, heat from the heating network is purchased.
When the CO2 at the inlet of the main compressor reaches a critical point, it is then compressed to a high-pressure state by the main compressor (MC). The compressed fluid sequentially recovers waste heat through the low temperature recuperator (LTR) (9–10) and medium temperature recuperator (MTR) (10–11), ultimately merging with the recompressed stream at node 12. The flow through the high temperature recuperator (HTR) is reheated (13–14). Solar irradiation is concentrated onto the top collector through heliostat reflection, and the low-temperature molten salt from the cold tank is heated as it passes through the collector. The heated molten salt flow subsequently diverges into two streams: one directly supplies thermal energy to unit of CCHP, while the other is stored in the hot storage tank to maintain system operation during solar insolation deficits. The CO2 is heated by molten salt in the heater (14–1), then expands through the turbine for power generation (1–2). After releasing heat at the hot side of the HTR (2–3), the total mass flow rate is split into two streams. One stream enters the exchanger to drive absorption refrigeration (3b–4b), while the other stream flows through the MTR (3a–4a). These two streams recombine at node 5 before entering the LTR for further heat rejection (5–6). Then, the stream is split into two parts. One of the streams enters the exchanger to supply heating, while the other stream is compressed by the recompressor (RC). The CO2 is cooled to near-critical conditions in the air cooler (7–8) to complete the cycle. The T-s diagram of the CCHP is illustrated in Figure 1b.
There are two splits in the proposed system, and the split ratios (SR) are defined as SR1 and SR2. SR1 is the ratio of the mass flow through the main compressor to the total mass flow and SR2 is defined as the percentage of mass flow through MTR to the total flow.
S R 1 = m M C m t o t a l
S R 2 = m M T R m t o t a l
SR1 is constant, while SR2 varies according to users’ load fluctuations.
The separating production (SP) system is selected as the reference system. Electricity from the power grid meets the electrical load. The cooling energy provided by the electric chiller is used to meet the cooling requirement. Heat energy from the heating network is used to supply the users.

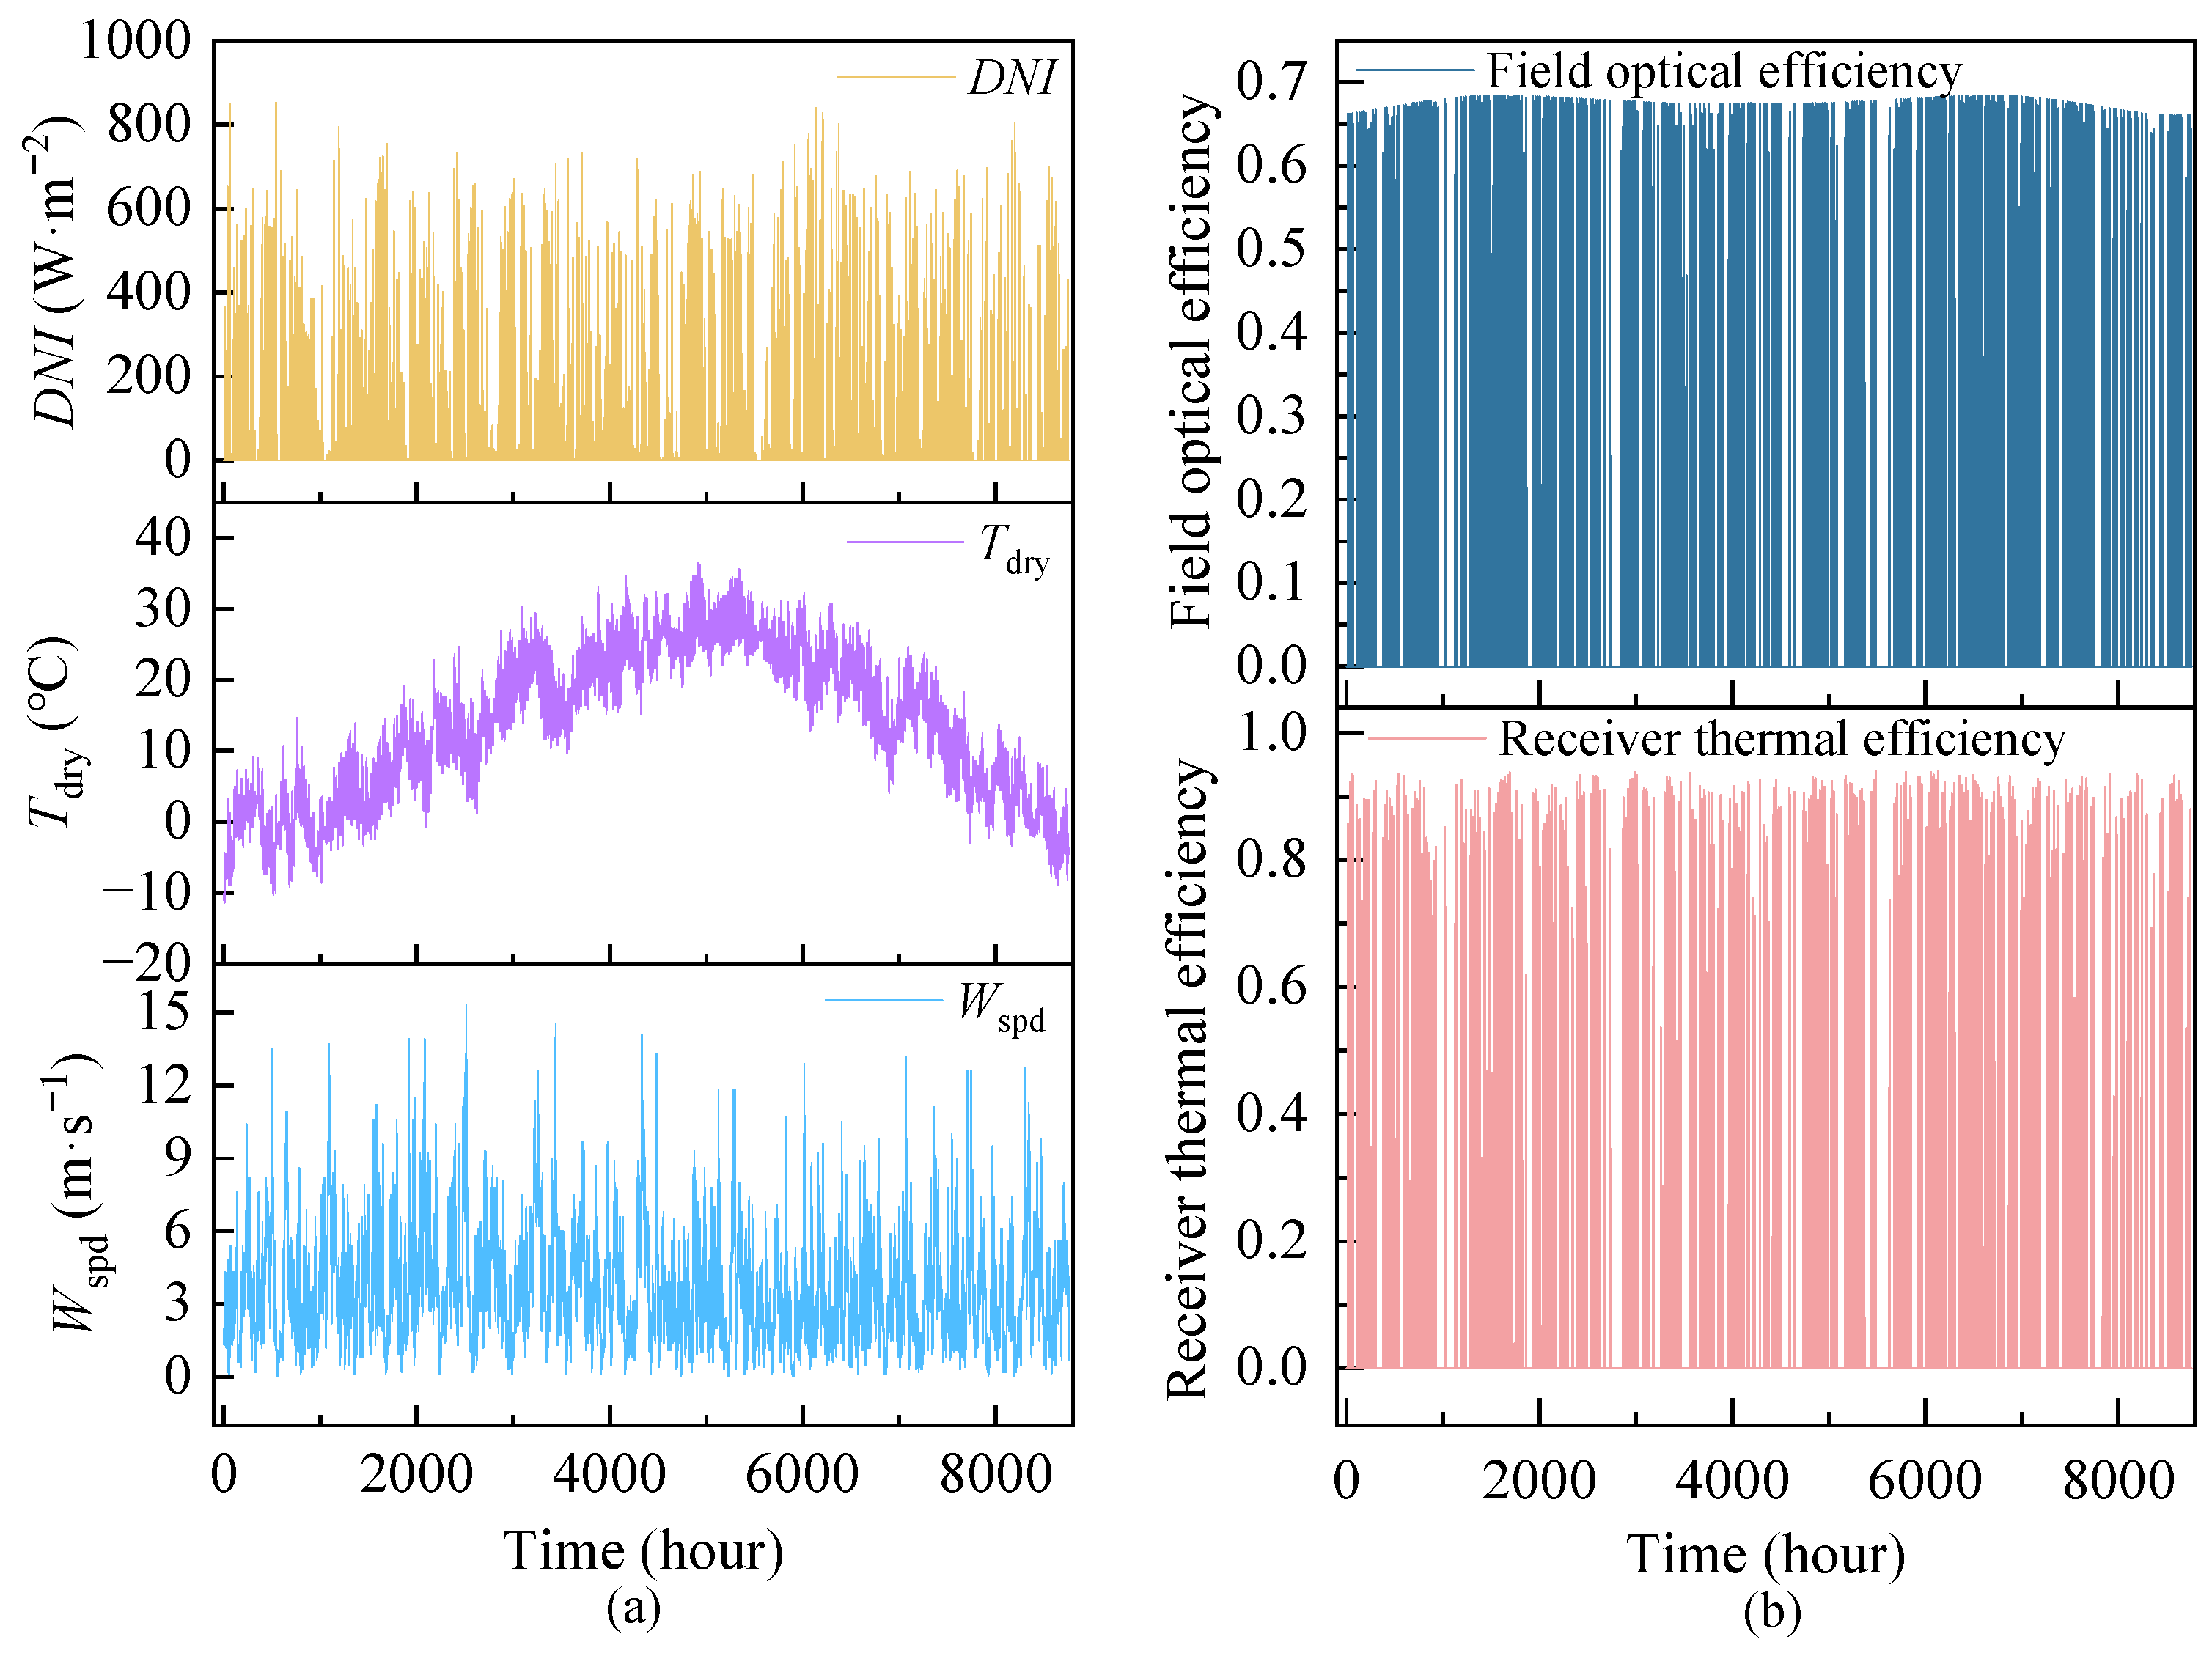
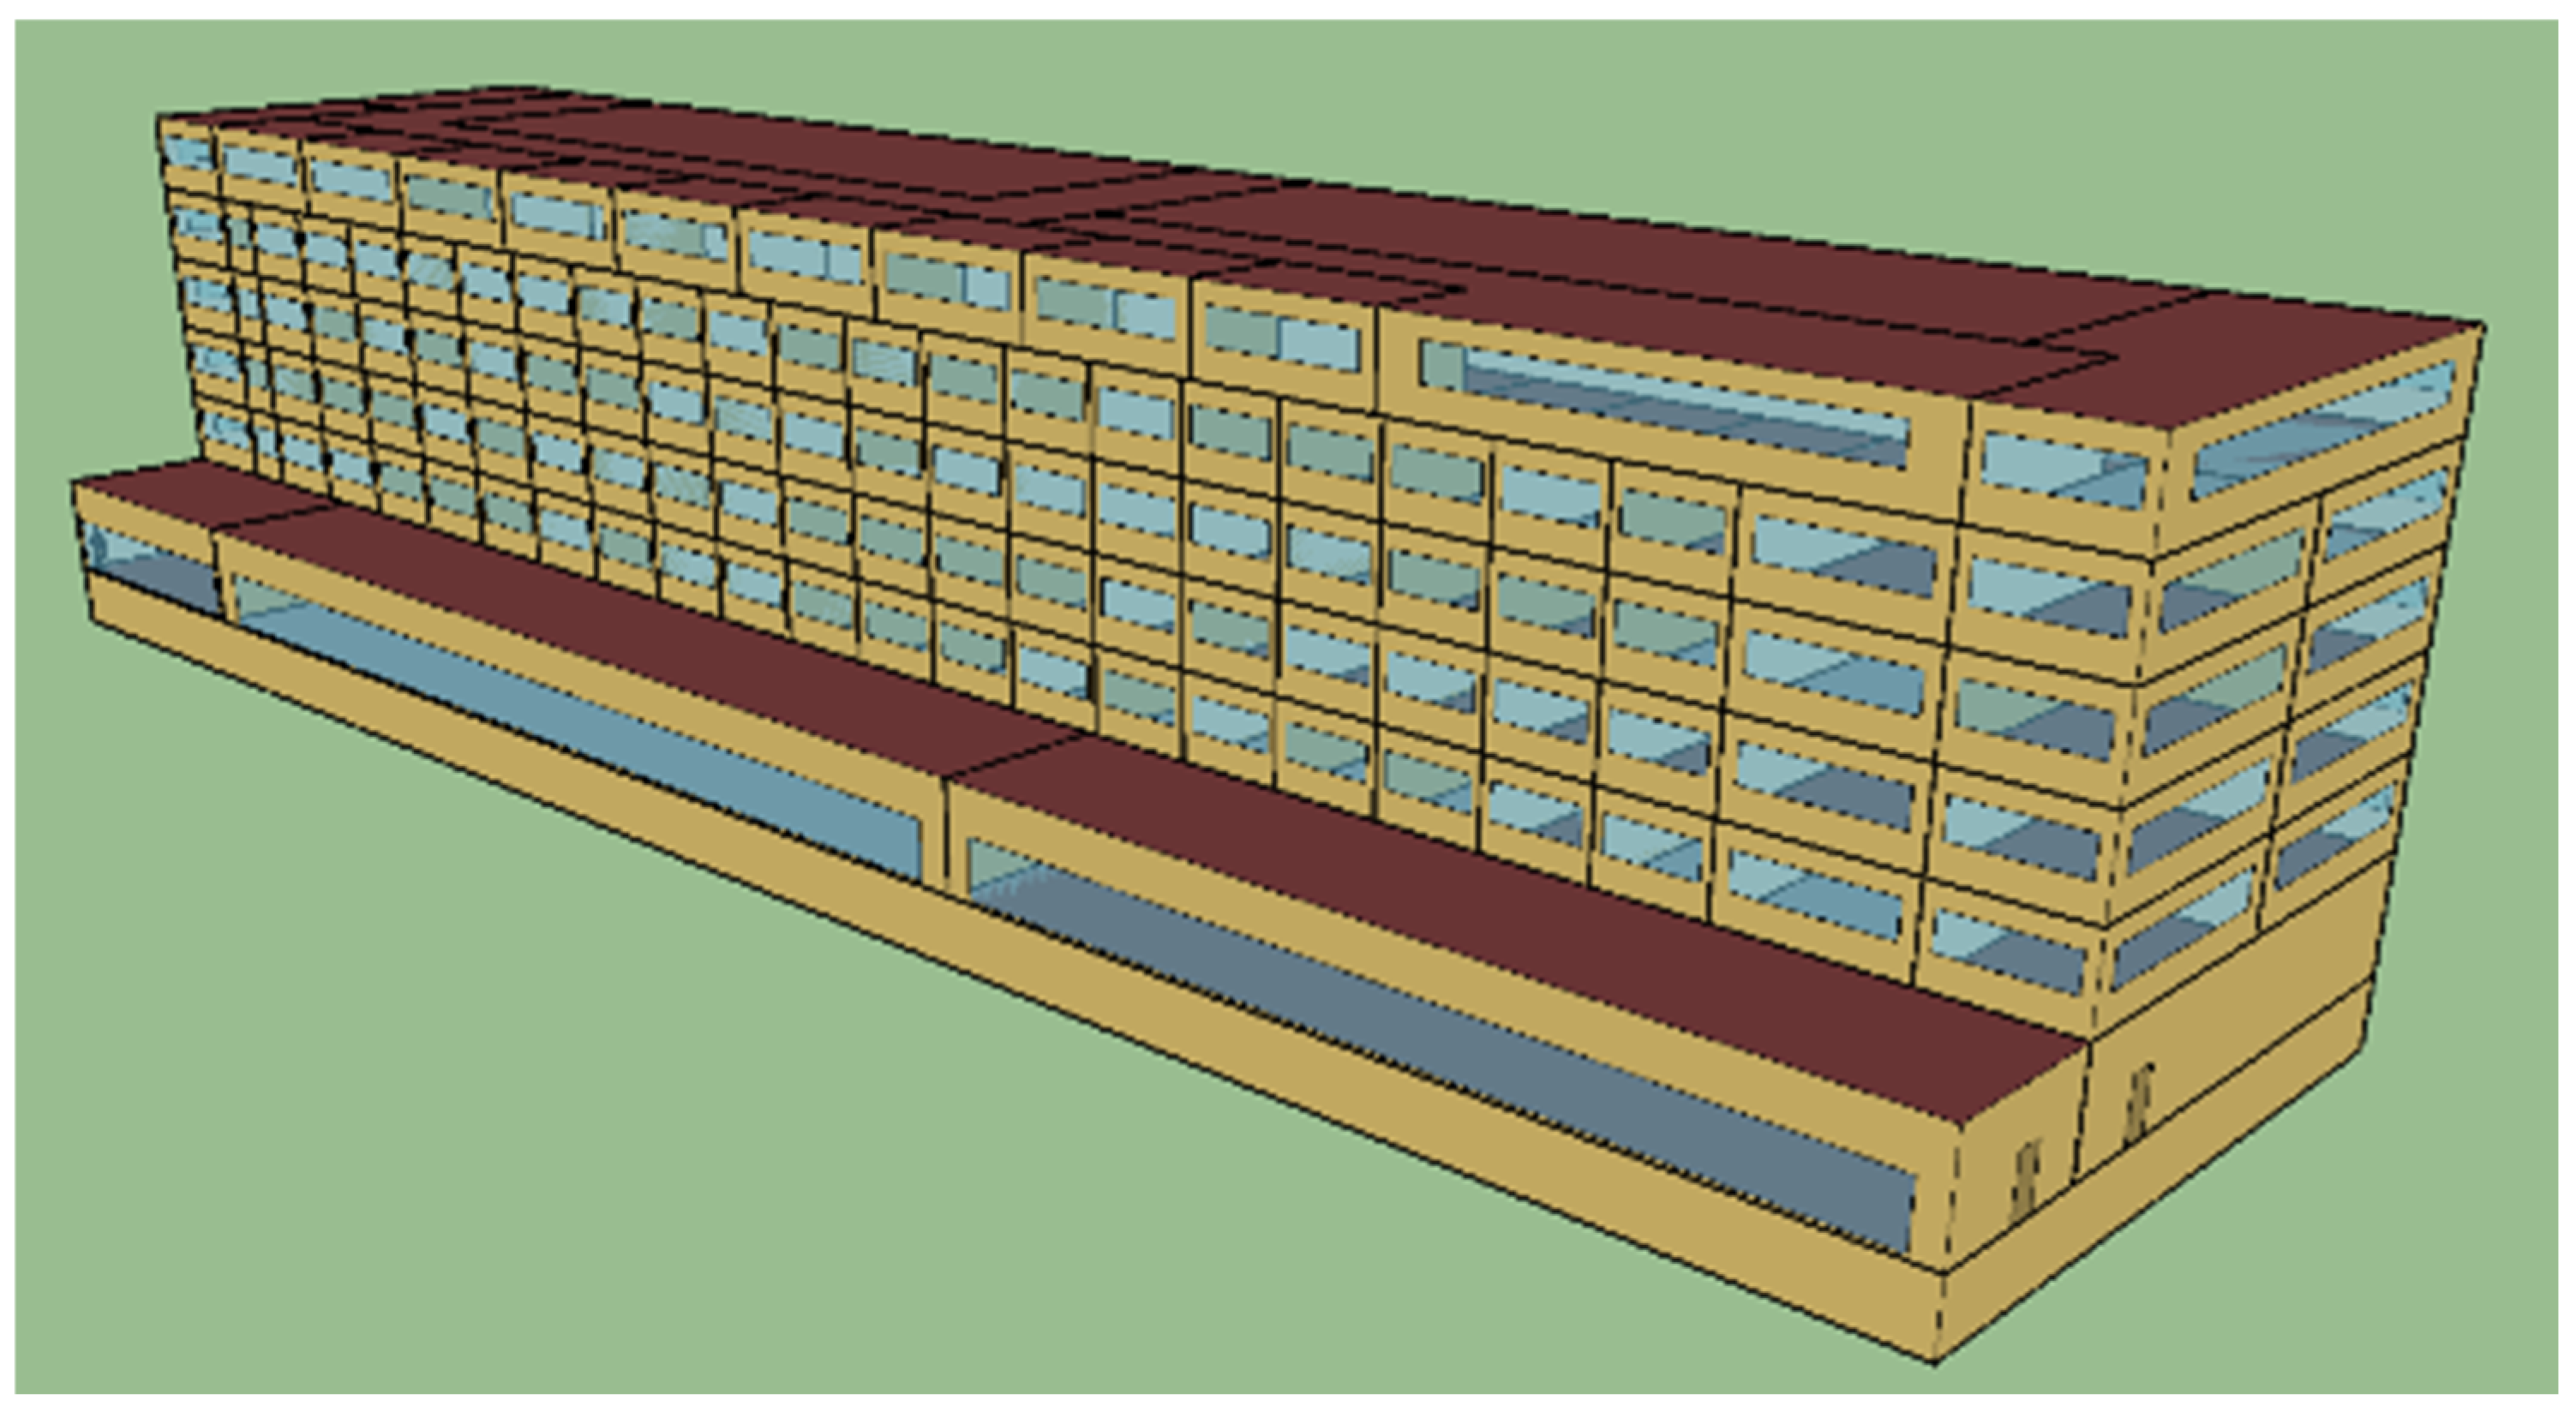
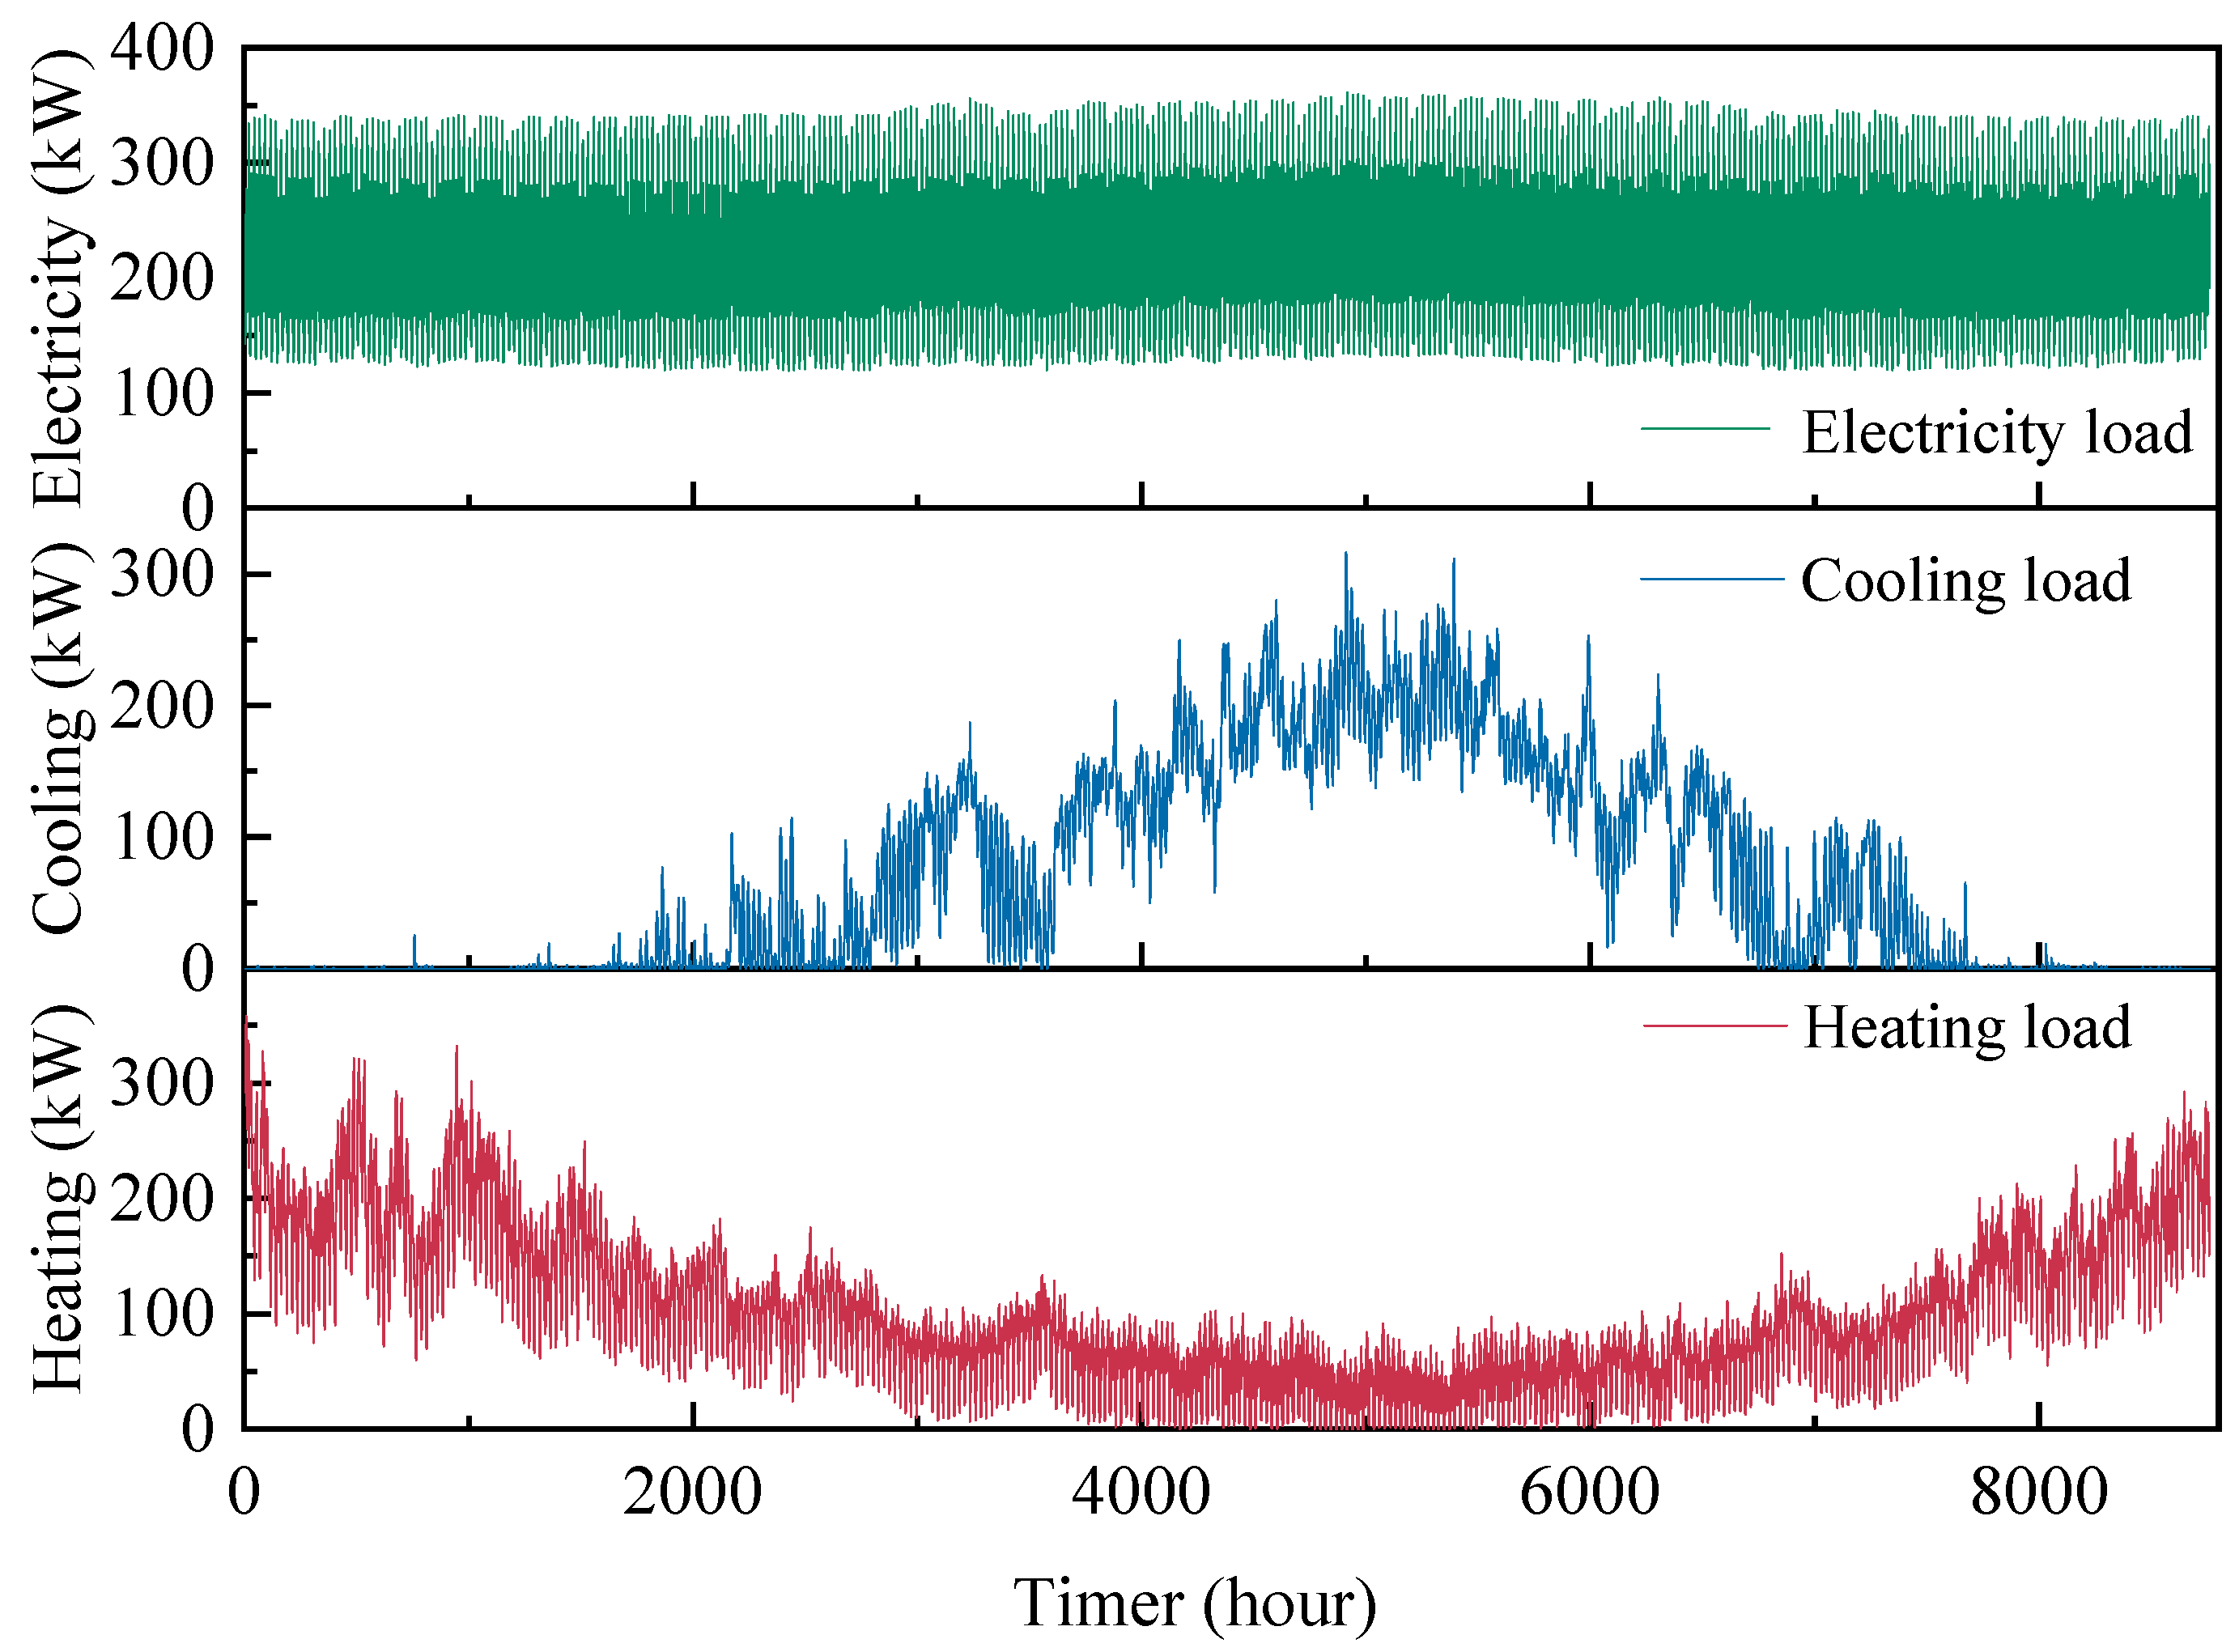
2.2. Energy Requirement of Users

The area is situated in Qingdao City (E119°30′–E121°00′, N35°35′–N37°09′). The reason is that Qingdao belongs to a temperate climate with modest solar irradiation and four distinct seasons. The hourly environmental parameters and collection efficiency are illustrated in Figure 2. The solar tower collection efficiency is defined as the product of receiver thermal efficiency and field optical efficiency.
The building databases are sourced from the U.S. Department of Energy (DOE). The schematic diagram of building model is shown in Figure 3, which is a hotel with a total floor area of 11,345.29 m2. The main parameters of the building model are shown in Table 1.
According to the environmental parameters and building model parameters, the annual hourly building energy consumption is calculated. The building load throughout the year is shown in Figure 4. The heating and cooling load is calculated as follows [23]:
Q load = Q 1 + Q 2 + Q 3 + Q 4
Q 1 = i = 1 N sl Q i
Q 2 = i = 1 N surfaces h i A i T si T z
Q 3 = i = 1 N zones m i C p T zi T z
Q 4 = m inf C p ( T T z )
where Q1 represents convective internal heat transfer, Q2 represents convective heat transfer from the zone surfaces, Q3 represents heat transfer due to inter zone air mixing, Q4 represents heat transfer due to the infiltration of outside air.
According to the calculation results of the annual building energy consumption, the cooling and heating loads are greatly affected by seasonal fluctuations. Seasonal variations significantly influence energy requirements. The demand for cooling is more intense in summer, while the demand for heating is greater in winter. The electricity demand remains comparatively stable throughout the year. The operation strategy of the following thermal load (FTL) is applied due to the energy demand characteristics of the users. Operational priority is assigned to heat loads during peak heating demand periods. During large cooling demand periods, the cooling load is preferentially satisfied. Furthermore, the cooling, thermal, and electrical output proportions can be dynamically modulated through the adjustment of the split ratio, thereby optimizing energy allocation.

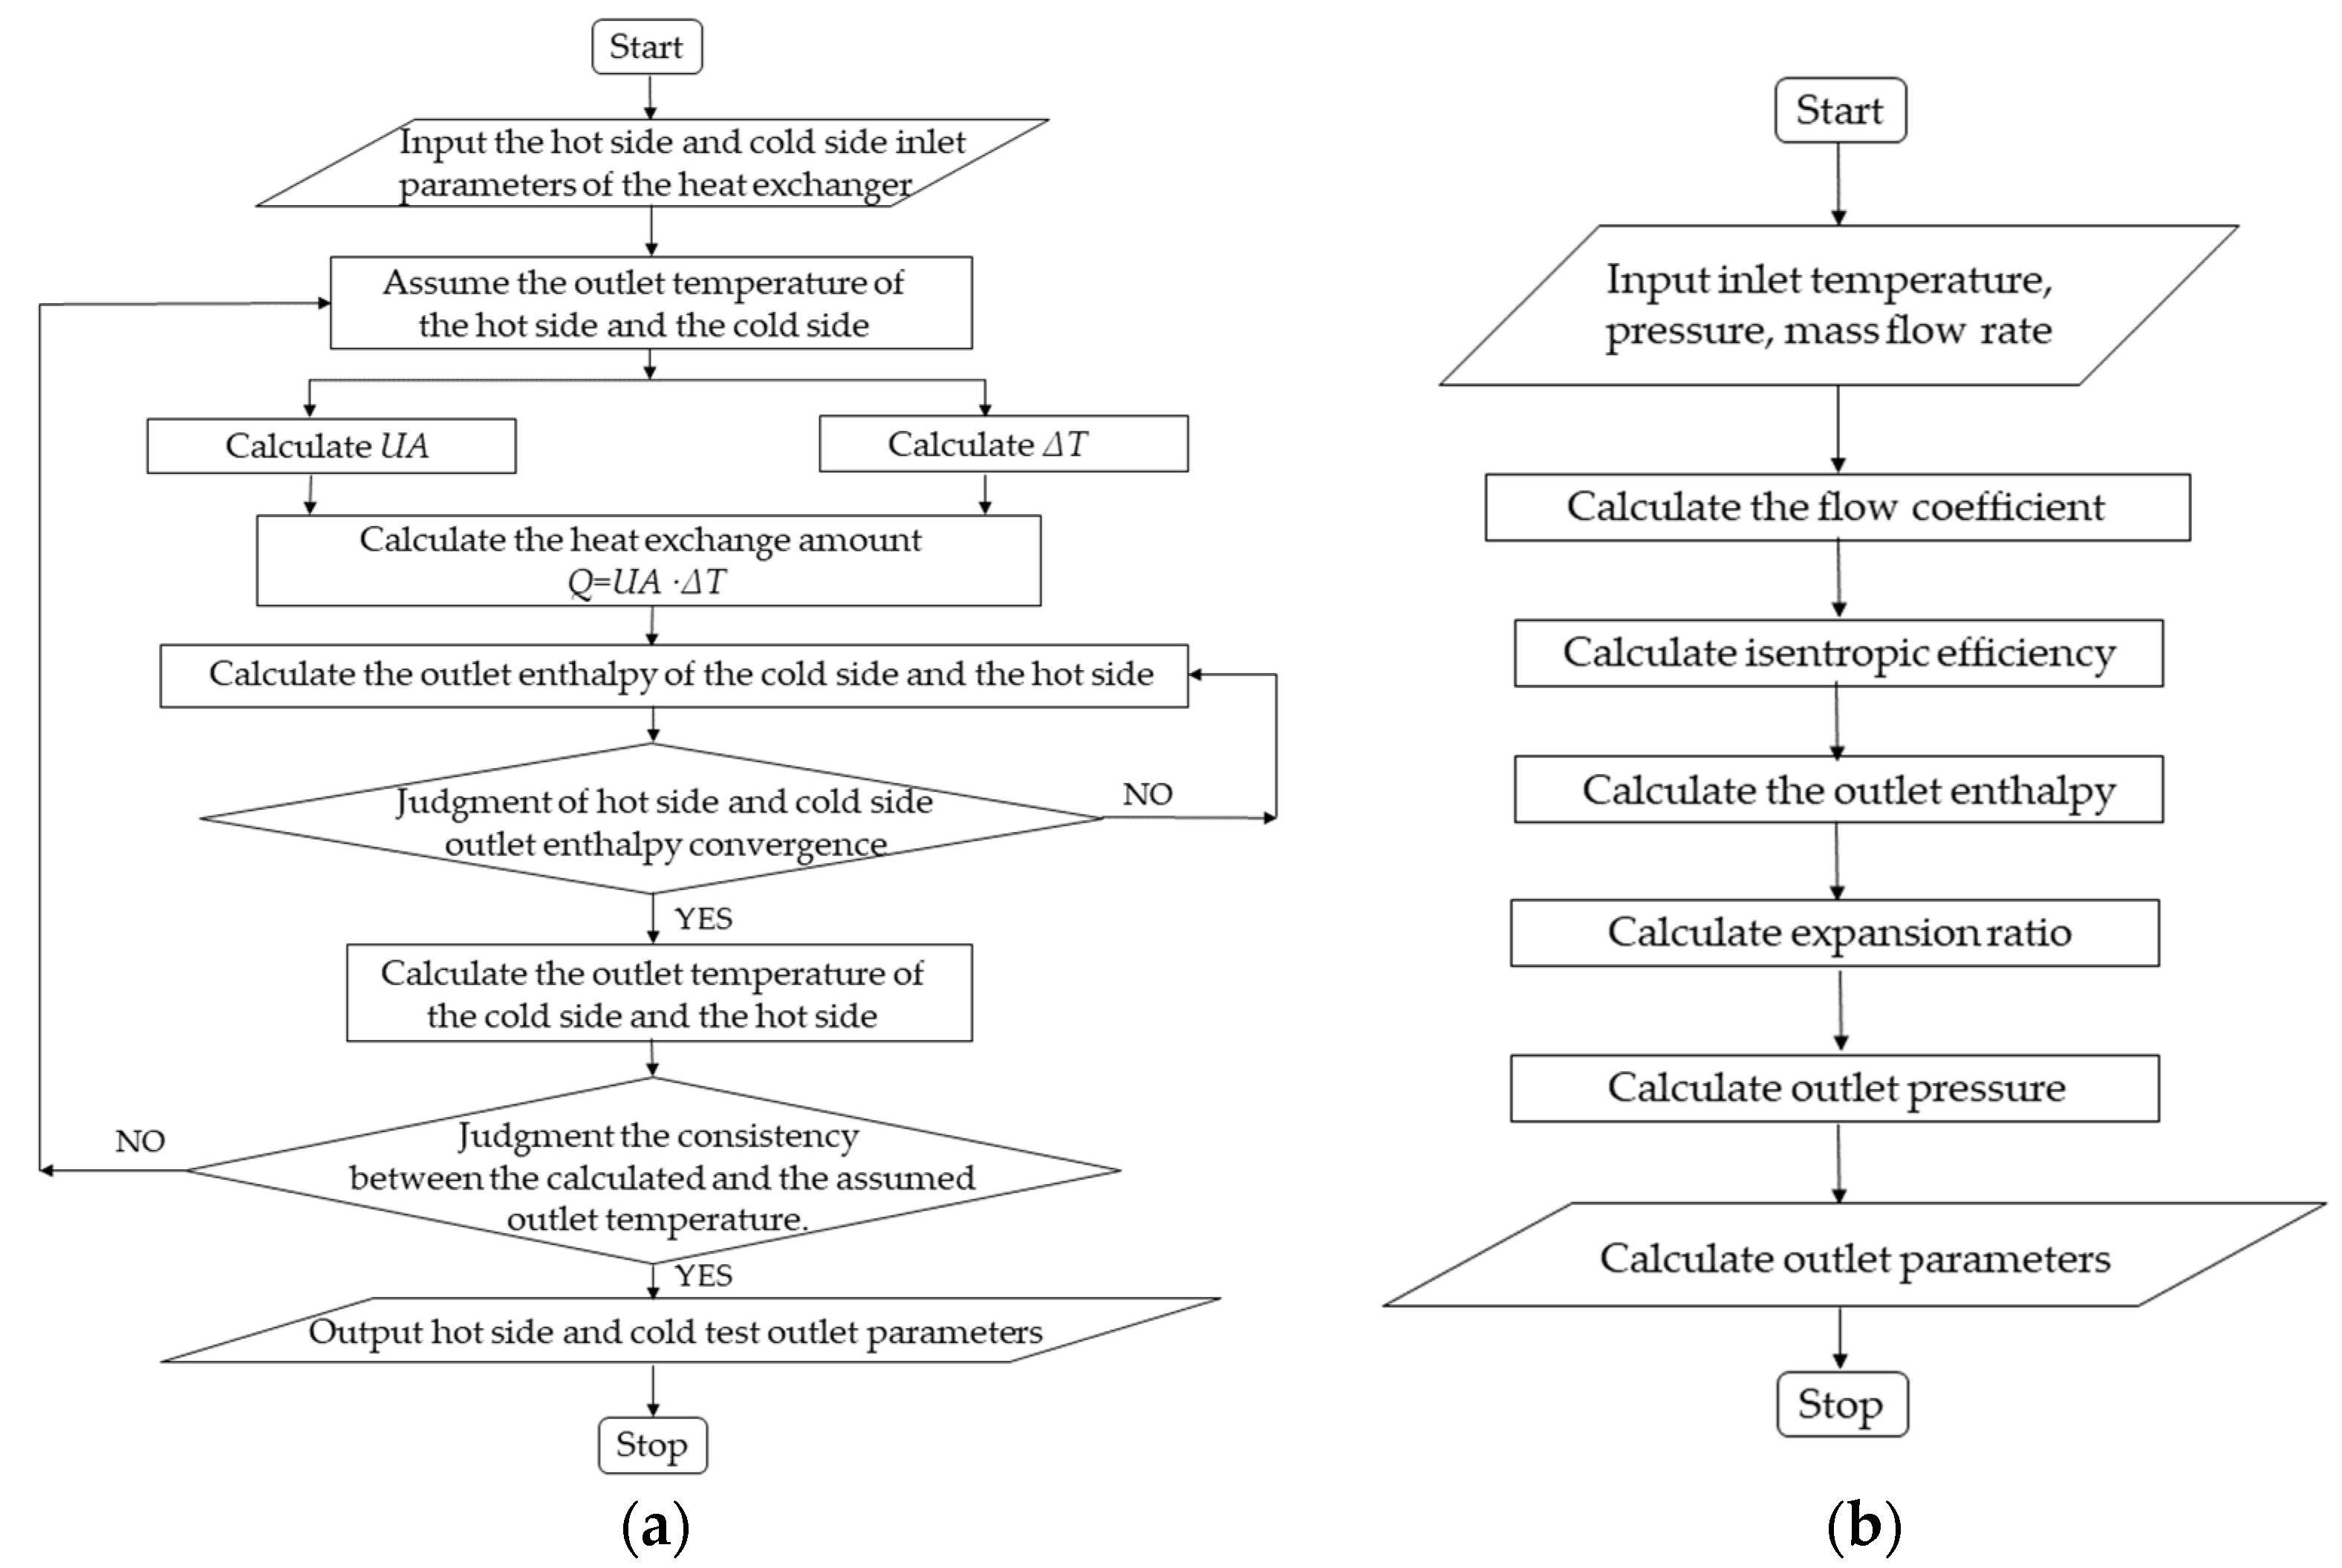
3. Calculation Model

3.1. Device Model

The system components mainly include heat exchangers and turbomachinery. Printed circuit heat exchangers (PCHE) are selected for the CCHP cycle. The heat exchanger is designed by the NTU-ε method. Each heat exchanger is divided into N sub-heat exchangers. The amount of heat exchange is calculated as follows:
Q = i = 1 N U A Δ T
where ΔT is logarithmic mean temperature difference.
The total conductance (UA) of the heat exchanger is the sum of the conductance values of all sub heat exchangers:
U A = i = 1 N N T U i C min , i
The number of transfer units (NTU) calculation formula of the sub heat exchanger is as follows:
N T U i = log 1 ε i C R , i 1 ε i
C R = C min C max
C min = min C h , i , C c , i
where the CR is the heat capacity ratio and Cmin,i and Cmax,i are the minimum and maximum heat capacity of the cold and hot sides of the sub-heat exchanger.
The heat transfer effectiveness of the sub heat exchanger is calculated as follows:
ε i = h hot , in h hot , out N C min , i T hot , in , i T cold , in , i
The turbine and compressor models refer to the performance of the literature published by Sandia Laboratory [24]. The compressor model is similar to the turbine model. By fitting the mechanical performance curve, the isentropic efficiency and expansion ratio are calculated as follows:
φ = m T in P in
E R tur = 3.09 0.8827 cos ( φ × 3.113 × 10 5 ) 0.5483 × sin ( φ × 3.113 × 10 5 )
η isec = 0.6688 × sin φ π 0.1526 × φ 10 2 + 105.26
where φ is the flow coefficient, ηisec represents the isentropic efficiency, ERtur represent the expansion ratio of turbine.
For an irradiation condition, the calculation of the system is divided into two distinct parts: heat exchangers and rotating machinery. The calculation flowchart of heat exchanger is shown in Figure 5a, and the calculation flowchart of rotating machinery is shown in Figure 5b. For variable irradiation conditions, each irradiation point is regarded as a quasi-steady state [25].

3.2. Evaluation Criteria

The steady-state mass balance formula of the system is
i m i = e m e
The energy balance equation is as follows:
Q W = e m e h e i m i h i
The exergy destruction rate of a component is as follows [26]:
E x D = j 1 T 0 T j Q j W + i E x i e E x e
where T0 represents the environmental temperature, taken as 298.15 K, Tj represents the temperature of the heat source, Qj is the heat supplied to the system, W represents the output work of the system, Exi is the inflow exergy, and Exe is the outflow exergy.
The energy analysis and exergy analysis of CCHP are carried out with the energy utilization efficiency and exergy efficiency as the evaluation criteria. The energy utilization efficiency is calculated as follows:
η eu = W net + Q heating + Q cooling Q in
W net = W tur W MC W RC
where Qin is the input heat for the system heat source, Qcooling is the heat provided by the system to the EX1, Qheating is the heat provided by the system to the EX2, Wtur is the work of turbine, WMC is the power consumed in the main compressor, and WRC is the power consumed in the recompressor.
The exergy efficiency is calculated as follows:
η ex = W net + E x 1 + E x 2 E x in
where the Exin is the exergy of heat source input, Ex1 is the exergy obtained on the cold side of EX1, kW; Ex2 is the exergy obtained on the cold side of EX2.
The primary energy saving rate is selected as the energy saving evaluation criterion, which is calculated as follows:
P E S = F SP F CCHP F SP
where FCCHP represents the primary energy consumption within the CCHP system and FSP represents the primary energy consumption of SP system under the same load output as CCHP system.
The system is evaluated from an thermodynamics, environmental, and economic perspective. The pollutant emission reduction rate (PER) and the equivalent levelized cost of electricity (LCOE) are as given in the evaluation criteria.
Pollutant emission reduction rate is calculated as follows:
P E R = 1 3 C D E R + 1 3 N O E R + 1 3 S D E R
where CDER is Carbon dioxide emissions reduction rate, NOER is Nitrogen oxides (NOx) emissions reduction rate, and SDER is Sulfur dioxide (SCO2) emissions reduction rate [27].
C D E R = C D E SP C D E CCHP C D E SP
N O E R = N O E SP N O E CCHP N O E SP
S D E R = S D E SP S D E CCHP S D E SP
The levelized cost of electricity (LCOE) [21] of the system is selected as the optimization index as follows:
L C O E = C A + C O & M E 0 ann
C O & M = 0.06 C A
where CA is the annual equipment investment amount and CO&M is the annual equipment operation and maintenance cost.
The equivalent power of heating and cooling of the CCHP system is calculated as follows:
E 0 ann = E cycle ann + Q h , cycle ann C O P h + Q c , cycle ann C O P ec
where E 0 ann is the annual equivalent power generated and COPh is the coefficient of performance of electrical heating, the value is 4 [21].
The initial investment cost of the equipment is mainly the investment of the heliostat field, solar tower, heat storage and SCO2 cycle equipment. The heater, HTR, MTR, EX1, EX2, and cooler are all heat exchanger equipment in the SO2 cycle. The calculation is as follows:
C A = M ( C tow + C helios + C hst + C SCO 2 )
C SCO 2 = C Heater + C HTR + C MTR + C LTR + C EX 1 + C EX 2 + C Cooling
M = i 1 ( 1 + i ) n
where M is annual depreciation rate of system equipment, i is the interest rate, the value is 0.05, n is the service life of the equipment, 25 years, Chelios is initial investment cost of heliostat field, Ctur is initial investment cost of turbine, Ctur is initial investment cost of compressor, Chst is initial investment cost of thermal energy storage tank, Cexh is initial investment cost for heating heat exchanger, and Ctow is the initial investment cost of solar tower. The cost function of the initial investment cost of the CCHP system equipment is shown in Table 2.

3.3. Verification of the Model

The system model is established based onMATLAB/Simulink software (R2022b), and the properties of the working fluid are determined using the NIST REFPROP database. The equipment models are composed of the heat exchanger model and rotating machinery model. In the calculation process of the heat exchanger, the iterative error is ensured to be less than 10−8. The fitting accuracy of the rotating mechanical performance curve is 99.95%. To illustrate the accuracy of the calculation, the verification of the calculation model is carried out. The input parameters are consistent with the literature [30], as shown in Table 3. The validation results are shown in Table 4. The error is below 3%, indicating the accuracy of the model. The physical properties of CO2 change dramatically near the critical point, consequently leading to a substantial error in the main compressor.

4. Results and Discussion

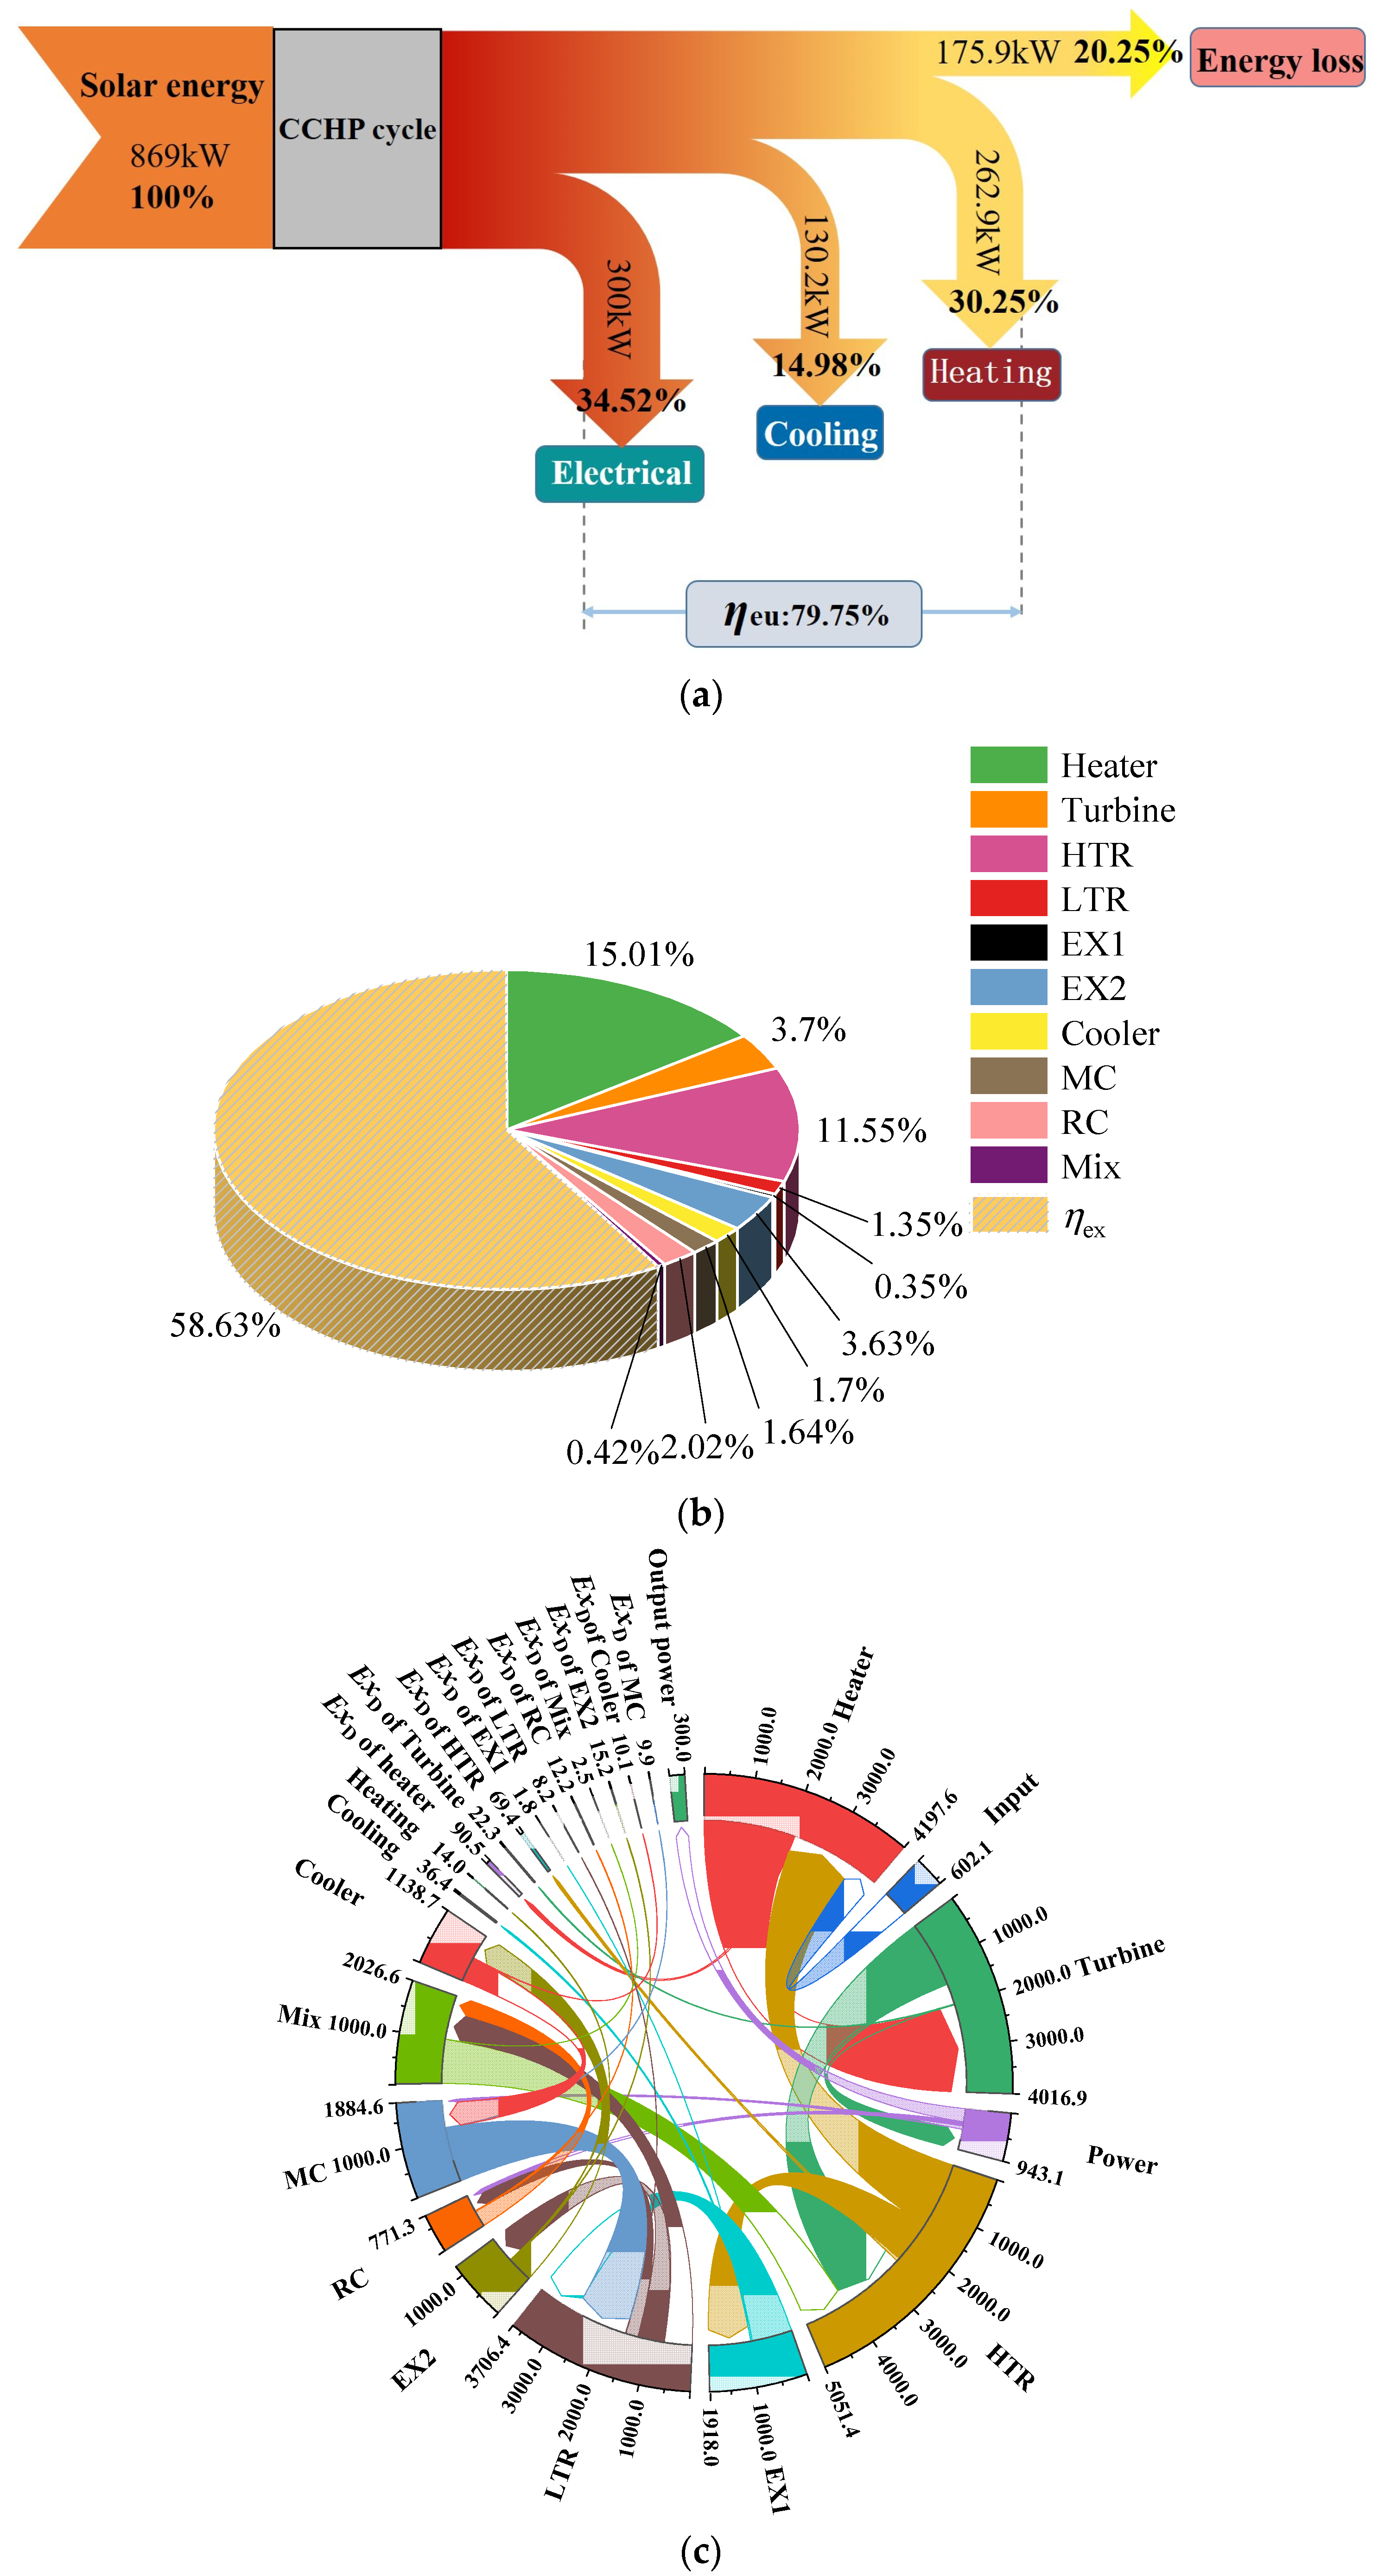
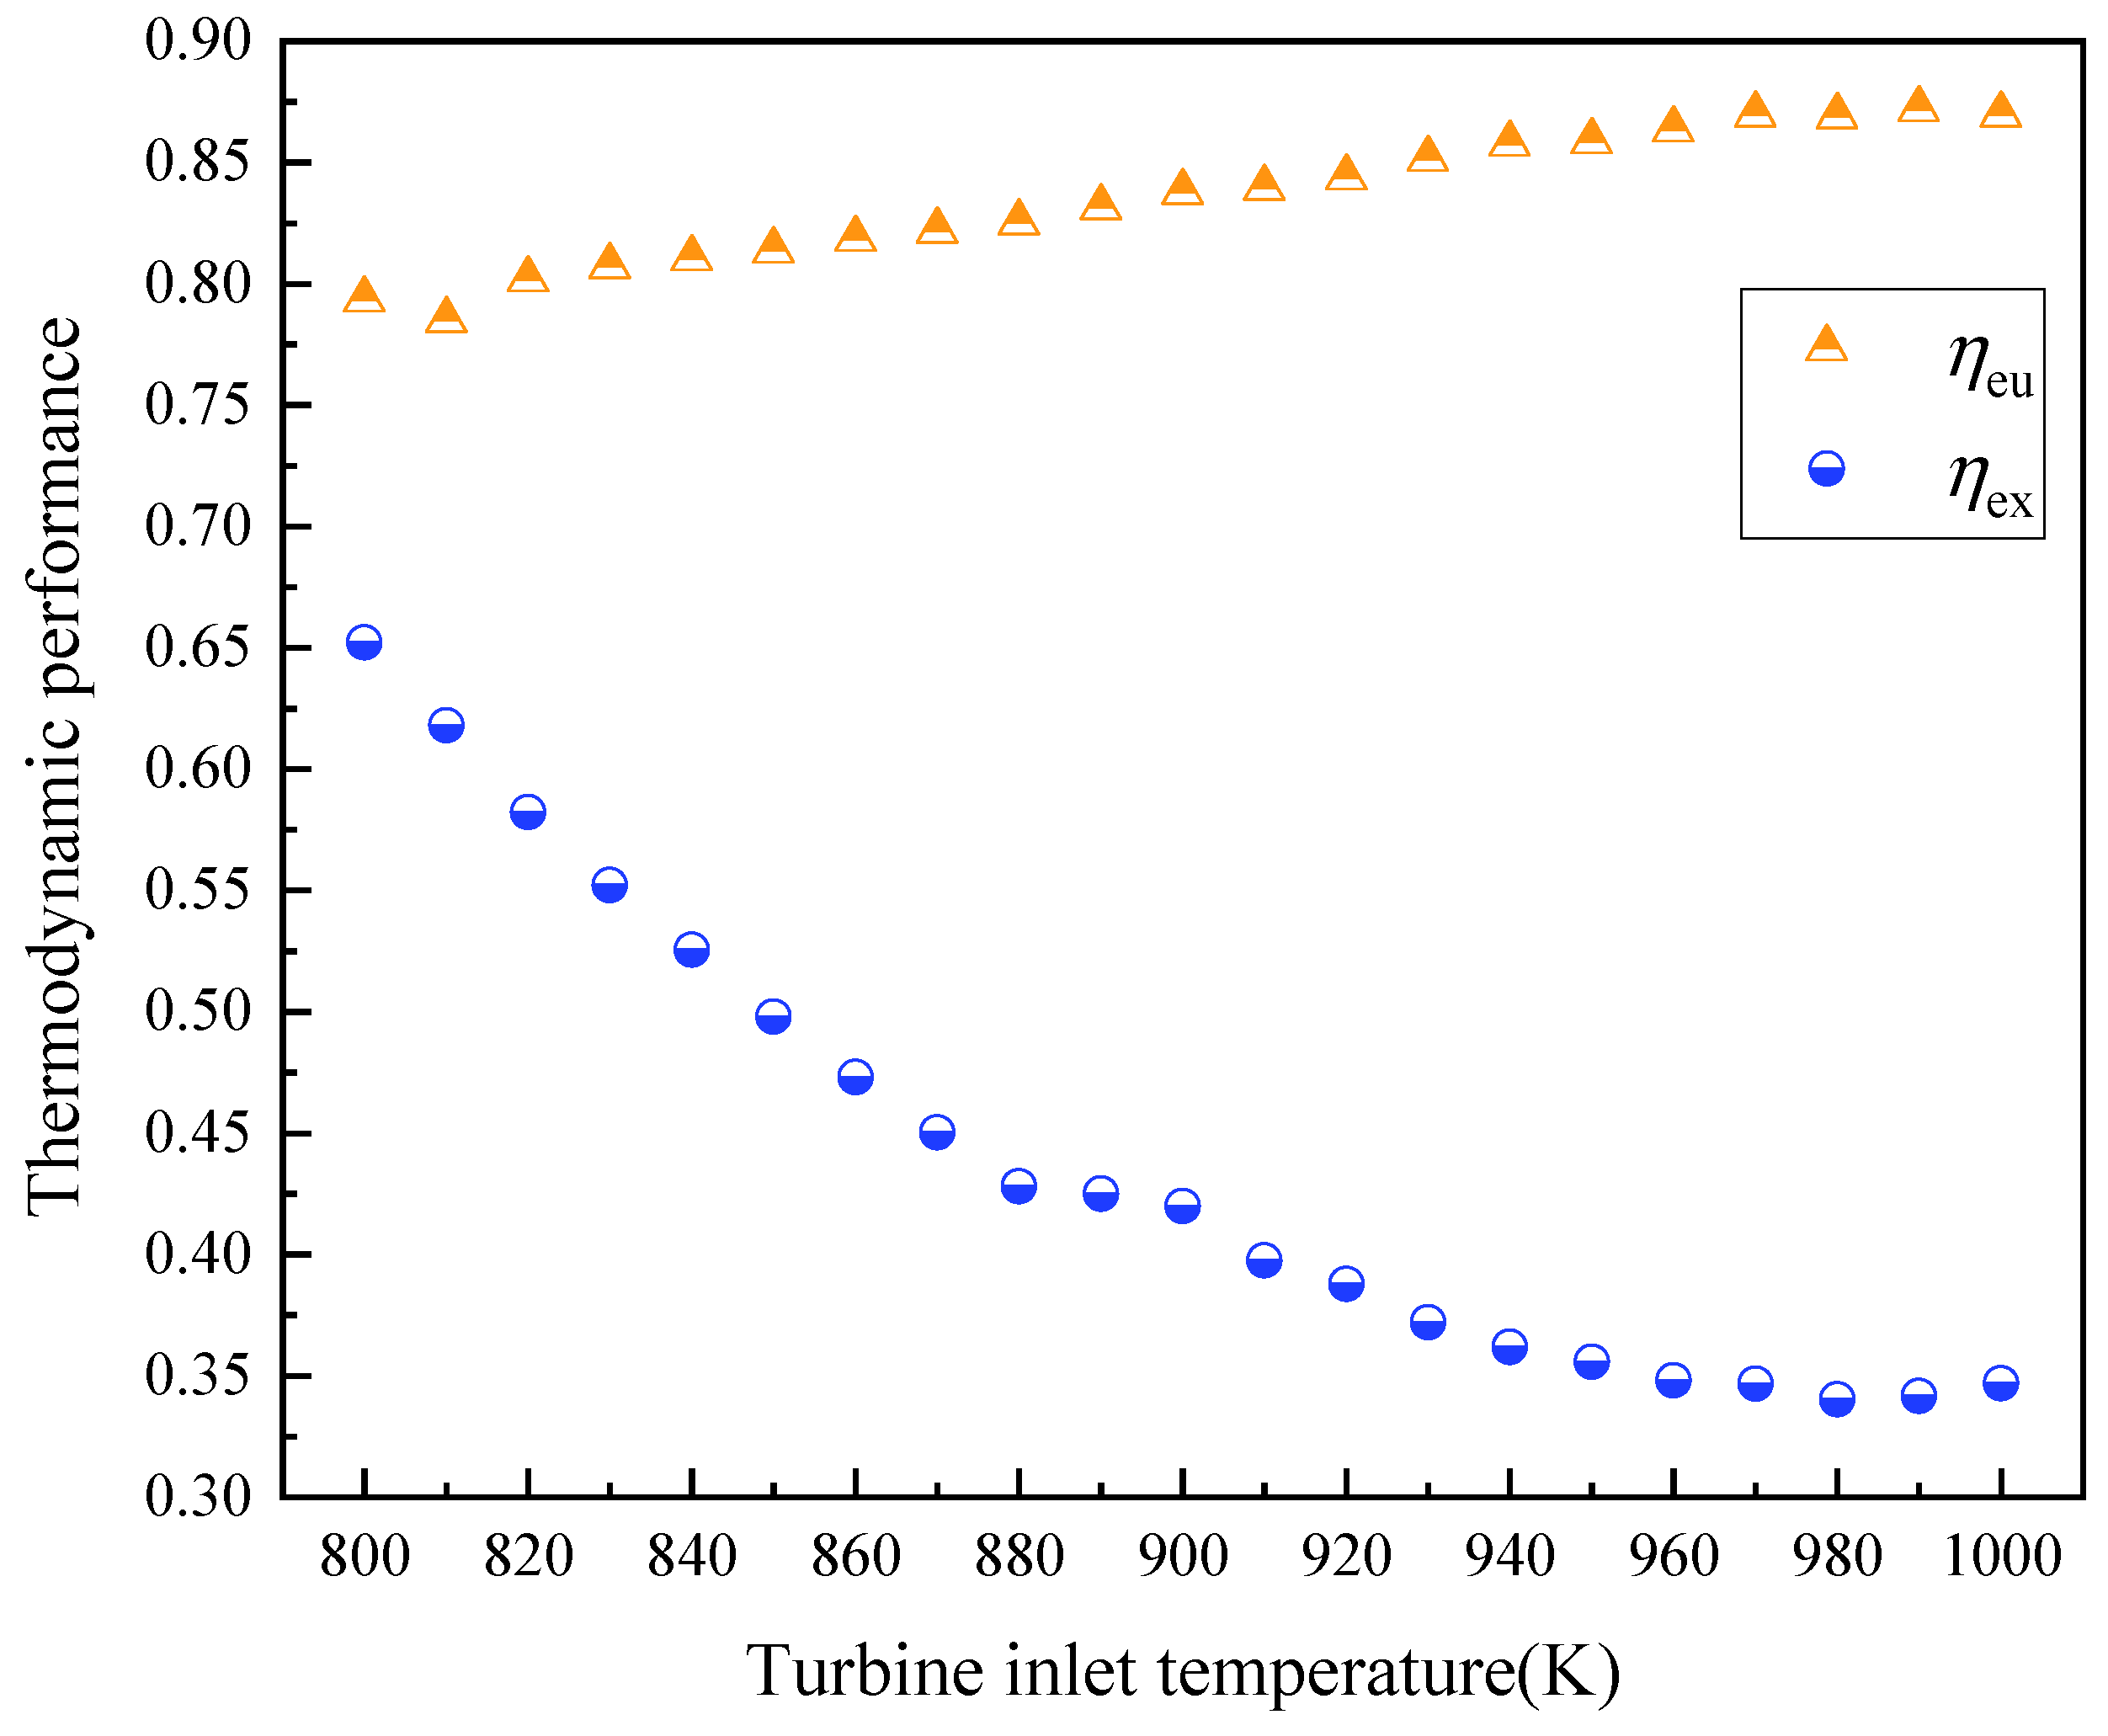
4.1. System Performances at the Design Condition

The main parameters of the design condition are summarized in Table 5, and the irradiation at 12:00 on March 14th is selected as the design point, because the irradiation intensity at this time is close to the annual average, and the cooling, heating, and electrical loads are balanced. The area of tower heliostat field is 4016 m2 in the design condition, and heat provided to the heater is 869 kW. The turbine inlet temperature of the CCHP system is 820.80 K.
The energy flow diagram of the CCHP system is shown in Figure 6a. When the energy provided by solar energy to the system is 859 kW, the electricity generation of the system is 300 kW. In addition, 130.2 kW is used for cooling, 262.9 kW is used for heating, and the energy loss during the conversion process is 175.9 kW. The largest proportion of energy is converted into electricity, accounting for 34.52%, followed by heating accounting for 30.25% and cooling accounting for 14.98%. Therefore, the energy utilization efficiency of the CCHP system is 79.75%, which is 31.30% higher than the SCO2 power cycle driven by concentrated solar energy [31]. The exergy destructions of the components are shown in Figure 6b. The exergy efficiency is 58.63% at the design condition. Compared with the SCO2 power cycle, the exergy efficiency of the CCHP system increases by 7.82% [32]. The reason is that the waste heat from the turbine outlet of the CCHP system is utilized to provide cooling and heating, and the irreversible loss is reduced. The total output of the system increases due to the production of cooling and heating, and the proportion of exergy destruction in each component is reduced. The exergy destruction of the heater accounts for the largest proportion of the exergy destruction in the conventional SCO2 power cycle. The exergy destruction of heater of CCHP system is 33.45% lower than that in the SCO2 power cycle. The CCHP system reduces the temperature difference between the hot and cold sides of the recuperator, thereby reducing the irreversible losses in the recuperators.
The largest exergy loss occurs in the heater, accounting for 15% in the CCHP system; this is because the temperature difference between the high temperature molten salt and CO2 in the heater is large, resulting in increased irreversibility at the heat transfer process. The exergy flow of the CCHP system at the design condition is shown in Figure 6c, illustrating the input, output, and loss of exergy of each piece of equipment.

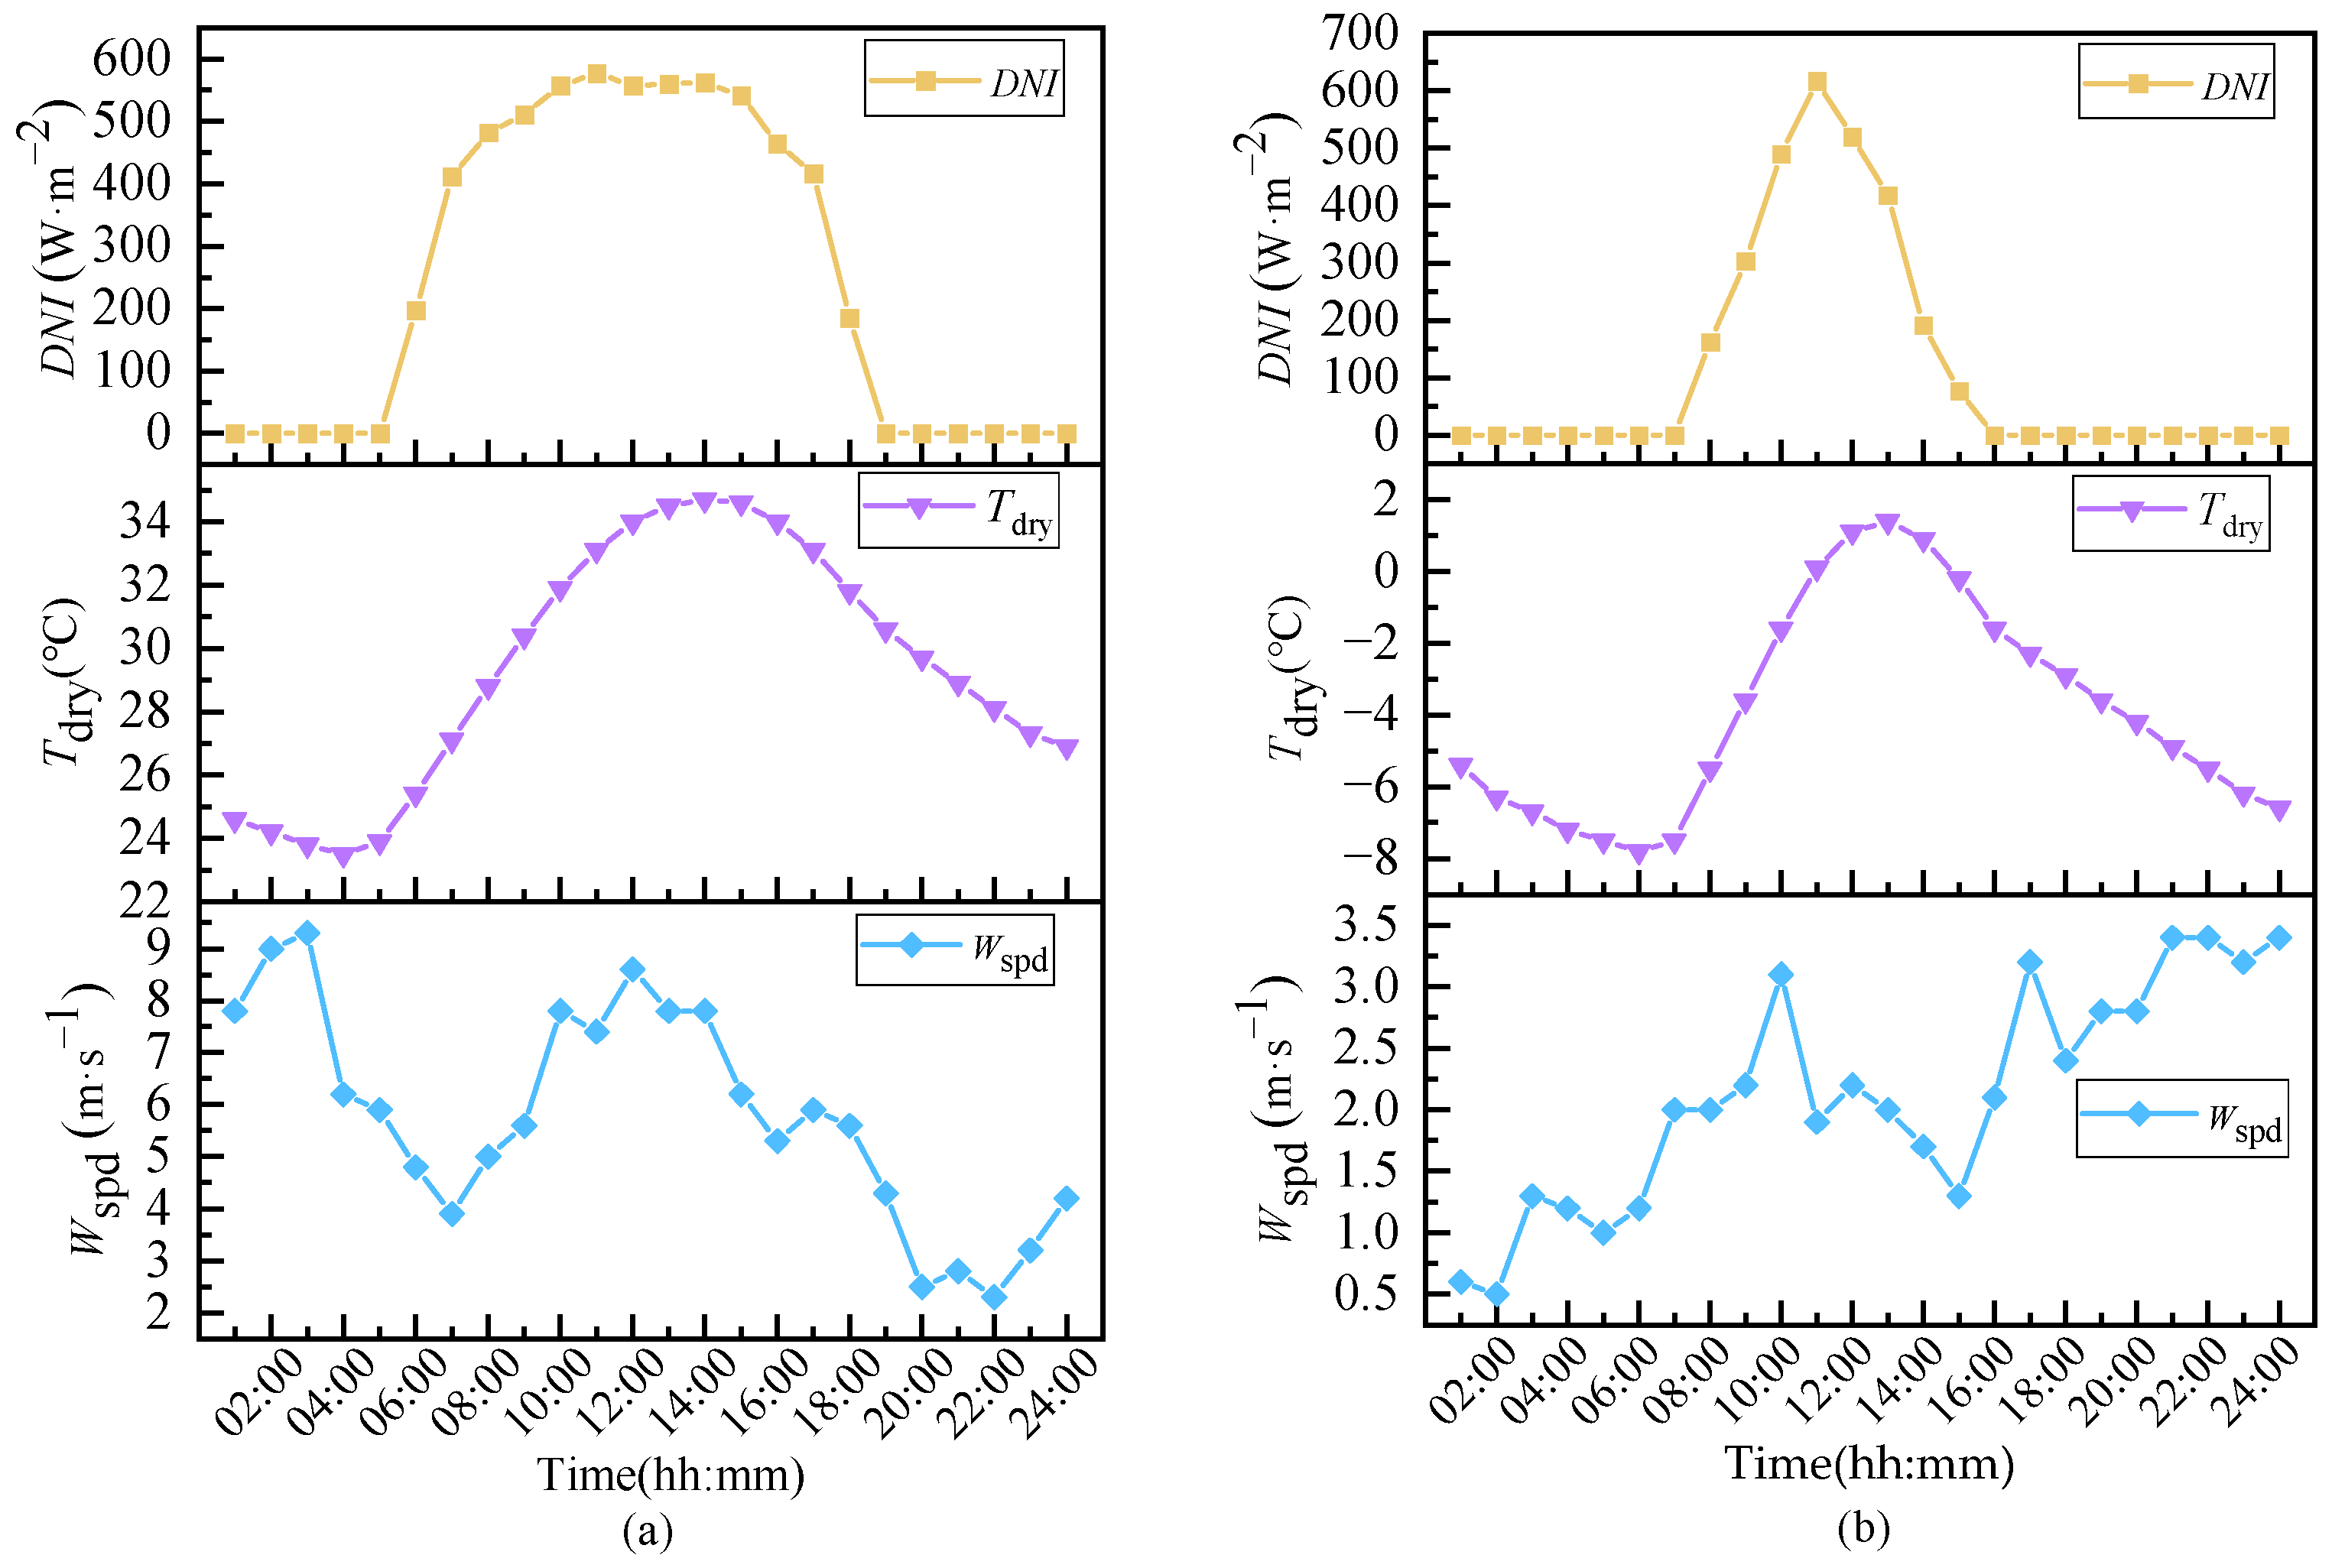
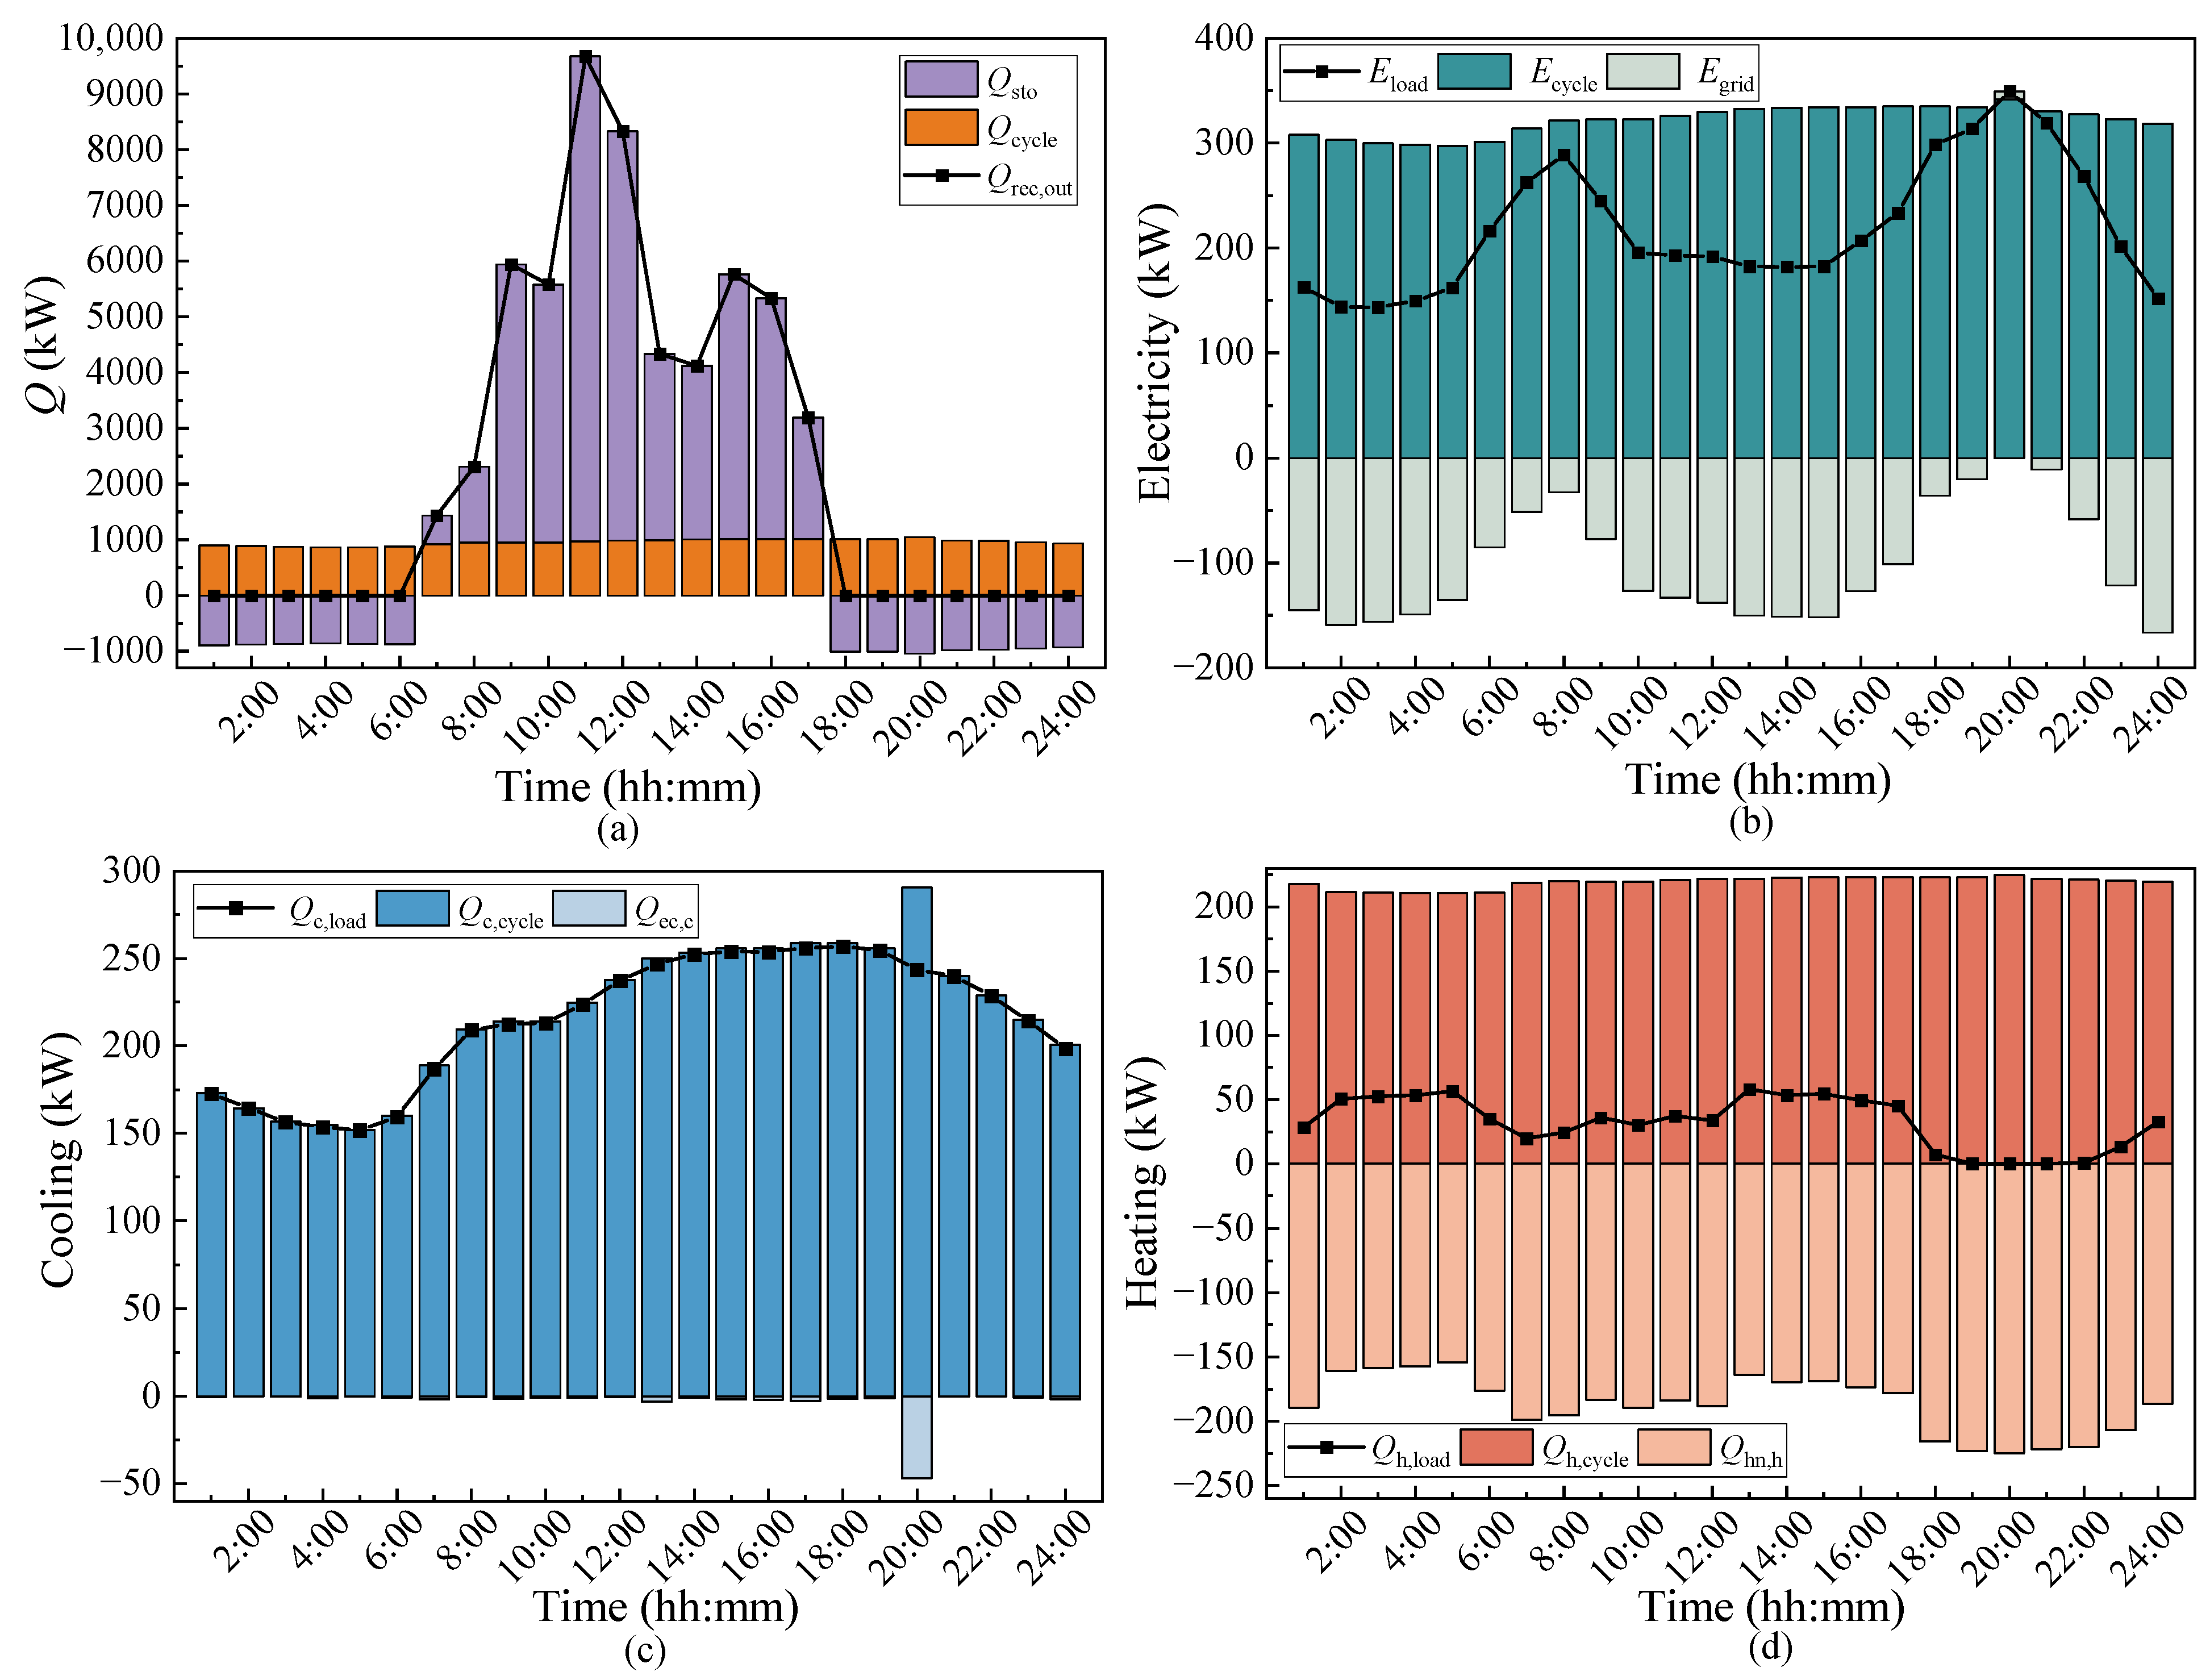
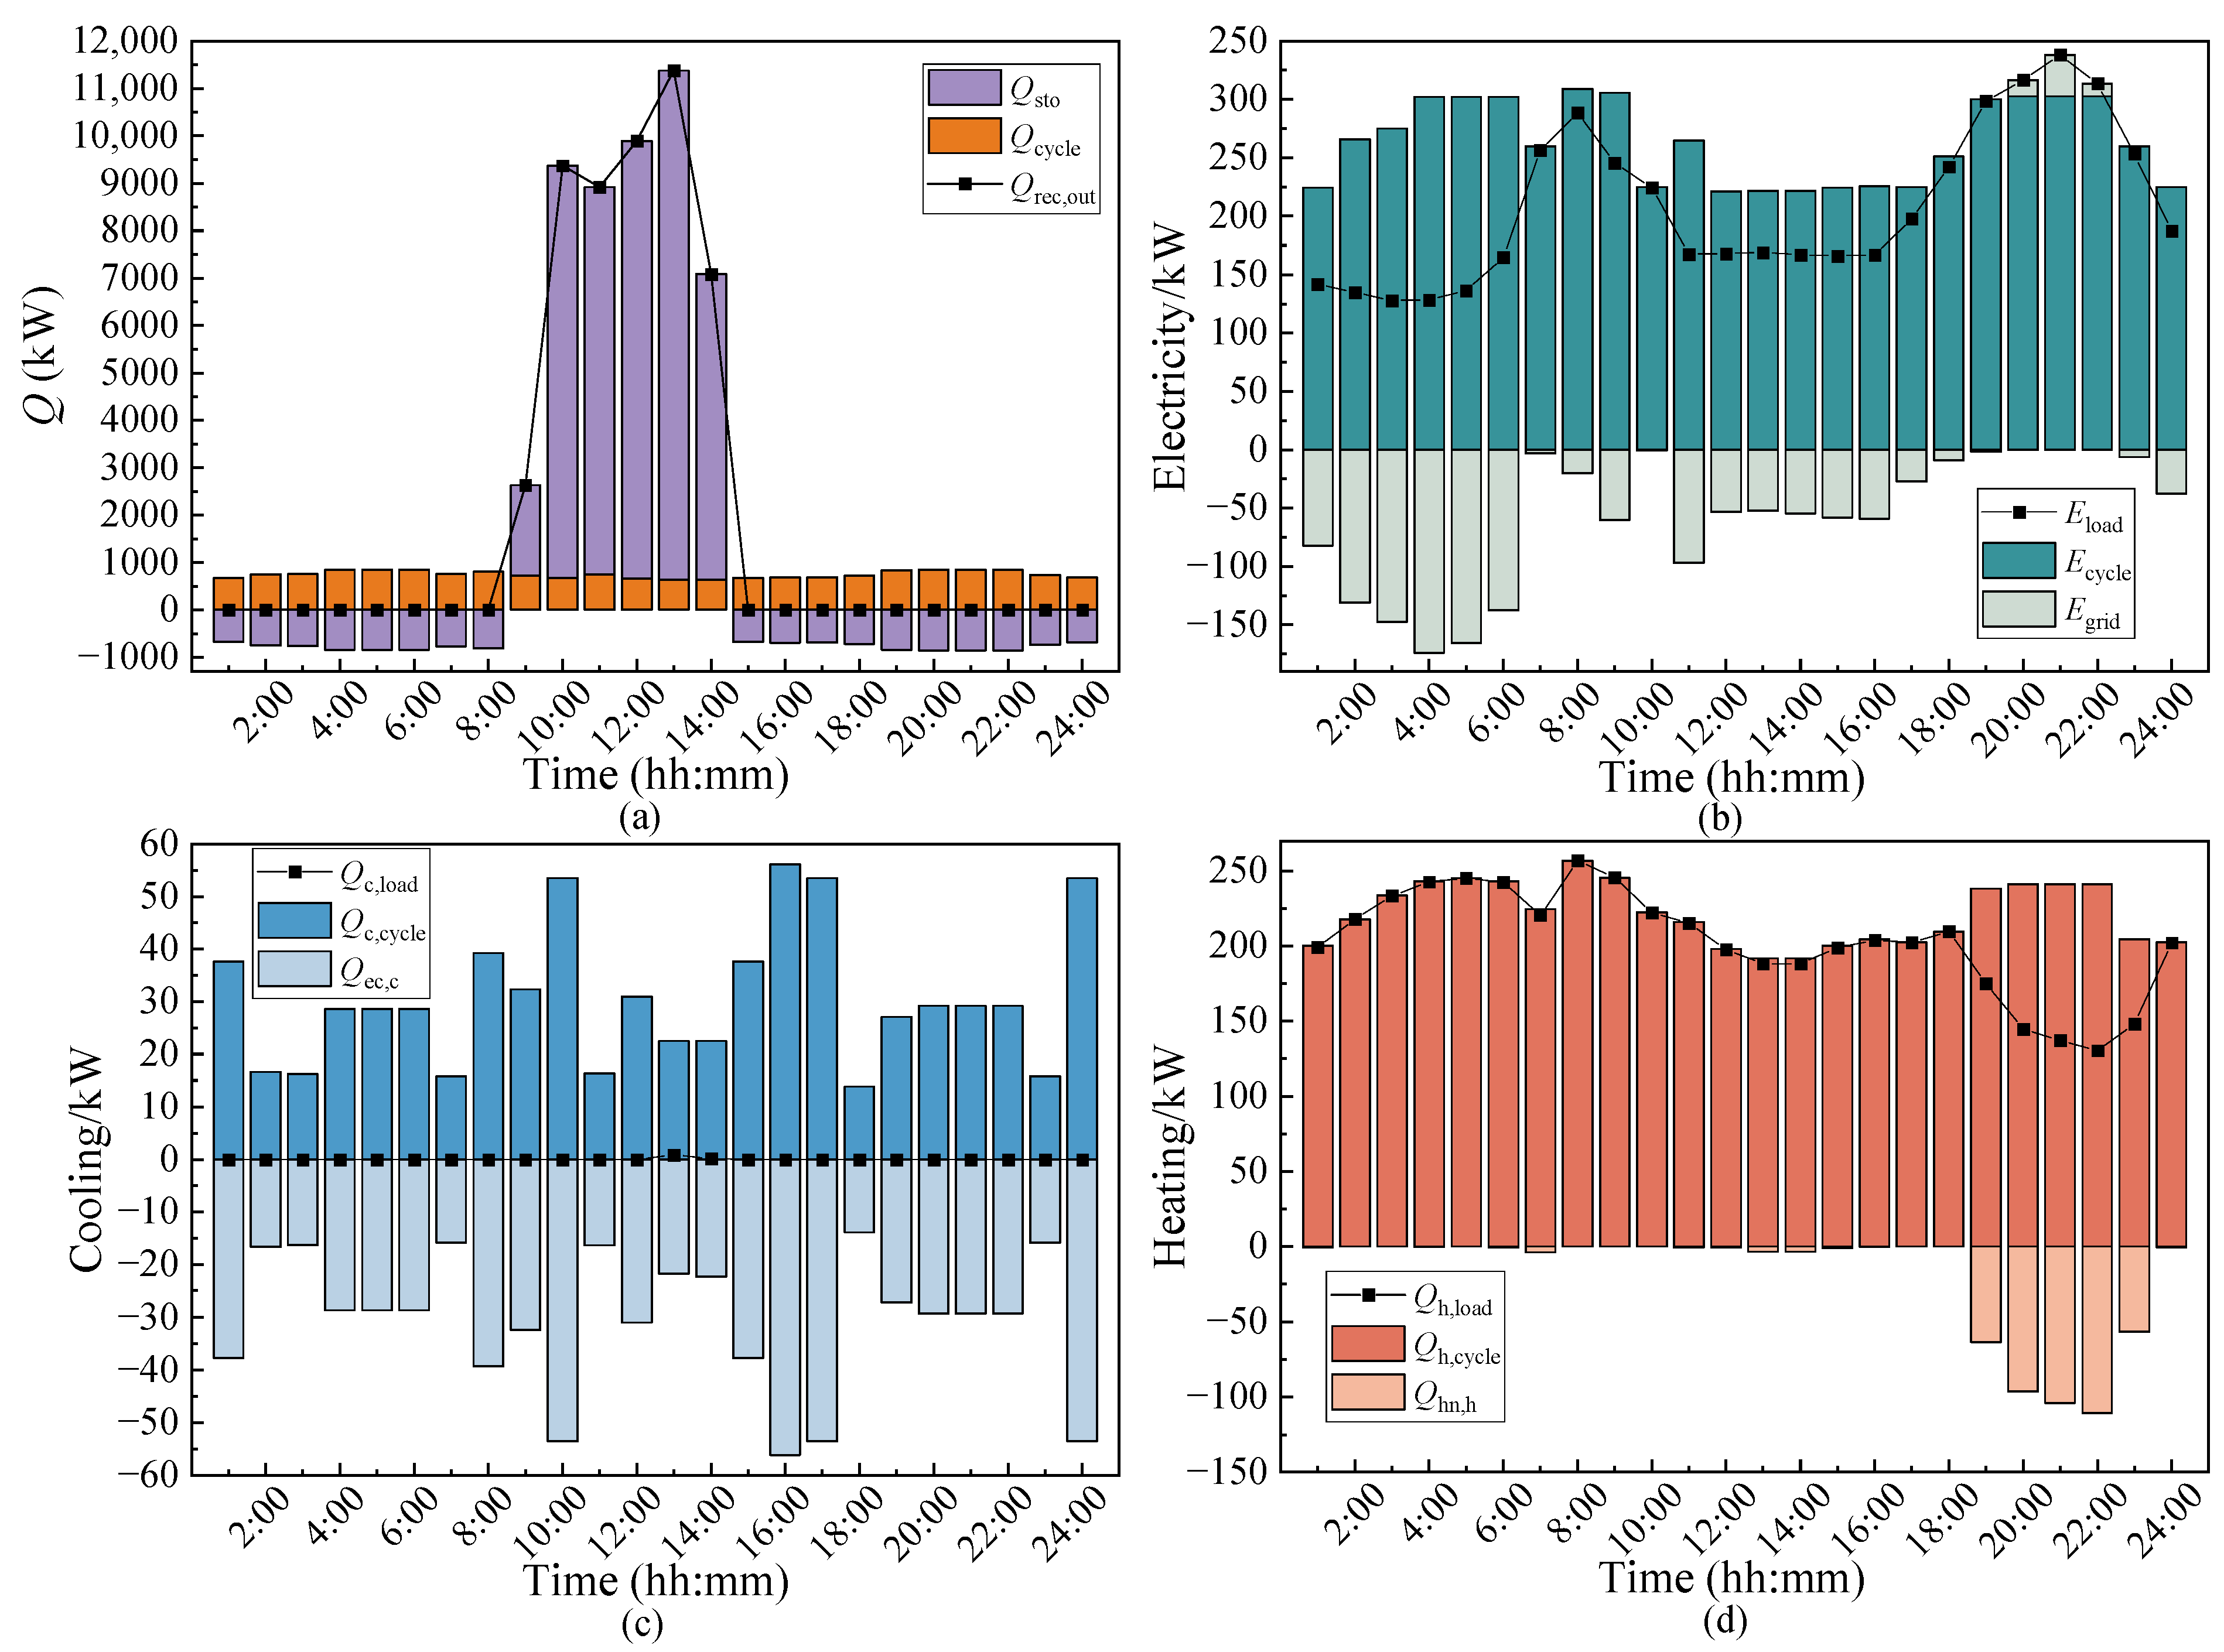
4.2. Thermodynamic Performances in Typical Days

The performance of the CCHP system under variable solar irradiation and users’ loads is investigated, and thermodynamic analyses are conducted on typical summer and winter days with a solar multiple of 4.8. The solar multiple (SM) refers to the ratio of the equivalent power that is provided by the heliostat site to the design power of the solar power plant [33].
Energy supply and demand are compared between the two seasons. The weather data including direct normal irradiance, ambient temperature, and wind speed for the summer and winter days are shown in Figure 7.
The total input mass flow rate of CO2 remains constant under variable irradiation conditions, and the inlet temperature of turbine changes with the fluctuation of heat absorption. The variations in thermodynamic performance of the system with turbine inlet temperatures are shown in Figure 8.
With the increase in turbine inlet temperature, the energy utilization efficiency first increases and then decreases. The exergy efficiency decreases with the increase in turbine inlet temperature. This is because, as the turbine inlet temperature increases, the power generation increases and the increase in recyclable waste heat increases the heating and cooling capacity, leading to an initial rise in energy utilization efficiency. When the turbine inlet temperature is too high, the increase in the recompressor inlet temperature increases the power consumption, causing the energy utilization efficiency to decline. The exergy efficiency is significantly affected by the exergy destruction in the refrigeration heat exchanger. When the turbine outlet temperature increases, the temperature difference between the cold and hot sides of the heat exchanger grows, resulting in higher irreversible loss.
The energy demand and supply on a typical summer day are shown in Figure 9. The Qrec,out represents the heat collection of the solar heliostat field, and Qsto is the thermal energy storage value. When the heat collection of the solar collector exceeds the heat Qcycle required by the system, the remaining heat is stored in the thermal energy storage tank. On the contrary, when the heat collection is not enough to meet the needs of the system, the molten salt flows out from the high-temperature storage tank to release heat; at this time, Qsto is negative. In summer, the cooling demand is the highest and the heating demand is the lowest. Increased summer solar irradiance elevates both turbine inlet temperature and heat recovery efficiency. The solar heat collection and thermal energy storage meet the cooling and heating needs.
The peak of the power load on the day mainly occurs at 8:00 and 20:00. The higher heat output of the system leads to more waste of cooling capacity, as shown in Figure 9c. Increasing the system’s heat supply will lead to more heat and the cold energy is wasted, so the power is taken from the power grid to supplement at 20:00. The Eload in the figure is the electric load, Ecycle is the electricity output of the system, Egrid is the power obtained from the power grid, and negative represents the power that sold to the power grid. Qc,load is the cooling load and Qc,cycle is the cooling capacity of the system. Qec,c is the electric cooling capacity, a negative value represents the excess cooling capacity. Qh,load is the heat load, Qh,cycle is the heating capacity of the system, Qhn,h is the heat taken from the heating network, and the negative number represents the excess waste heat.
On a typical summer day, the energy utilization efficiency and exergy efficiency of the system reached 82.74% and 58.82%, respectively. According to the operation strategy, the cooling load of the users is prioritized. Therefore, the supply and demand matching performance for cooling load is better. However, the heating capacity of the system is also high due to the high inlet temperature of the turbine.
The energy demand and supply on a typical summer day and on a typical winter day are shown in Figure 10. In winter, due to the lower solar irradiation and shorter sunshine duration, the solar energy collection period is from 9:00 to 14:00, making the system more dependent on thermal energy storage and external energy supplements. It is necessary to obtain electricity from the power grid to supplement the electric load from 20:00 to 22:00. In winter, the demand for heating is high, and there is almost no cooling demand. Therefore, solar energy heat collection and storage fulfill the cooling requirements of users as shown in Figure 10c. According to the operation strategy, the system gives priority to meeting the heat load, so the heat load also is satisfied. On typical winter days, the energy utilization efficiency and exergy efficiency of the system are 76.22% and 50.58%, respectively. The energy utilization efficiency and exergy efficiency are lower than those on typical summer days due to the lower solar irradiation intensity in winter. Additionally, because of the low turbine inlet temperature, the energy utilization efficiency is reduced, the irreversible loss of the system increases, and the exergy efficiency also decreases.
The changes in irradiation conditions affect the performance of the system. The solar collection, thermal energy storage, and thermodynamic performance of the system in a typical week in spring is shown in Figure 11. The amount of thermal energy storage is influenced by solar irradiation and users’ demand. In the typical spring week, the system achieves stable operation driven by solar energy for 132 h, as shown in Figure 11a. Furthermore, the energy utilization efficiency and exergy efficiency of the system is shown in Figure 11b, the average energy utilization efficiency of the typical spring week is 75.14%, and the average exergy efficiency of the typical spring week is 51.64%.

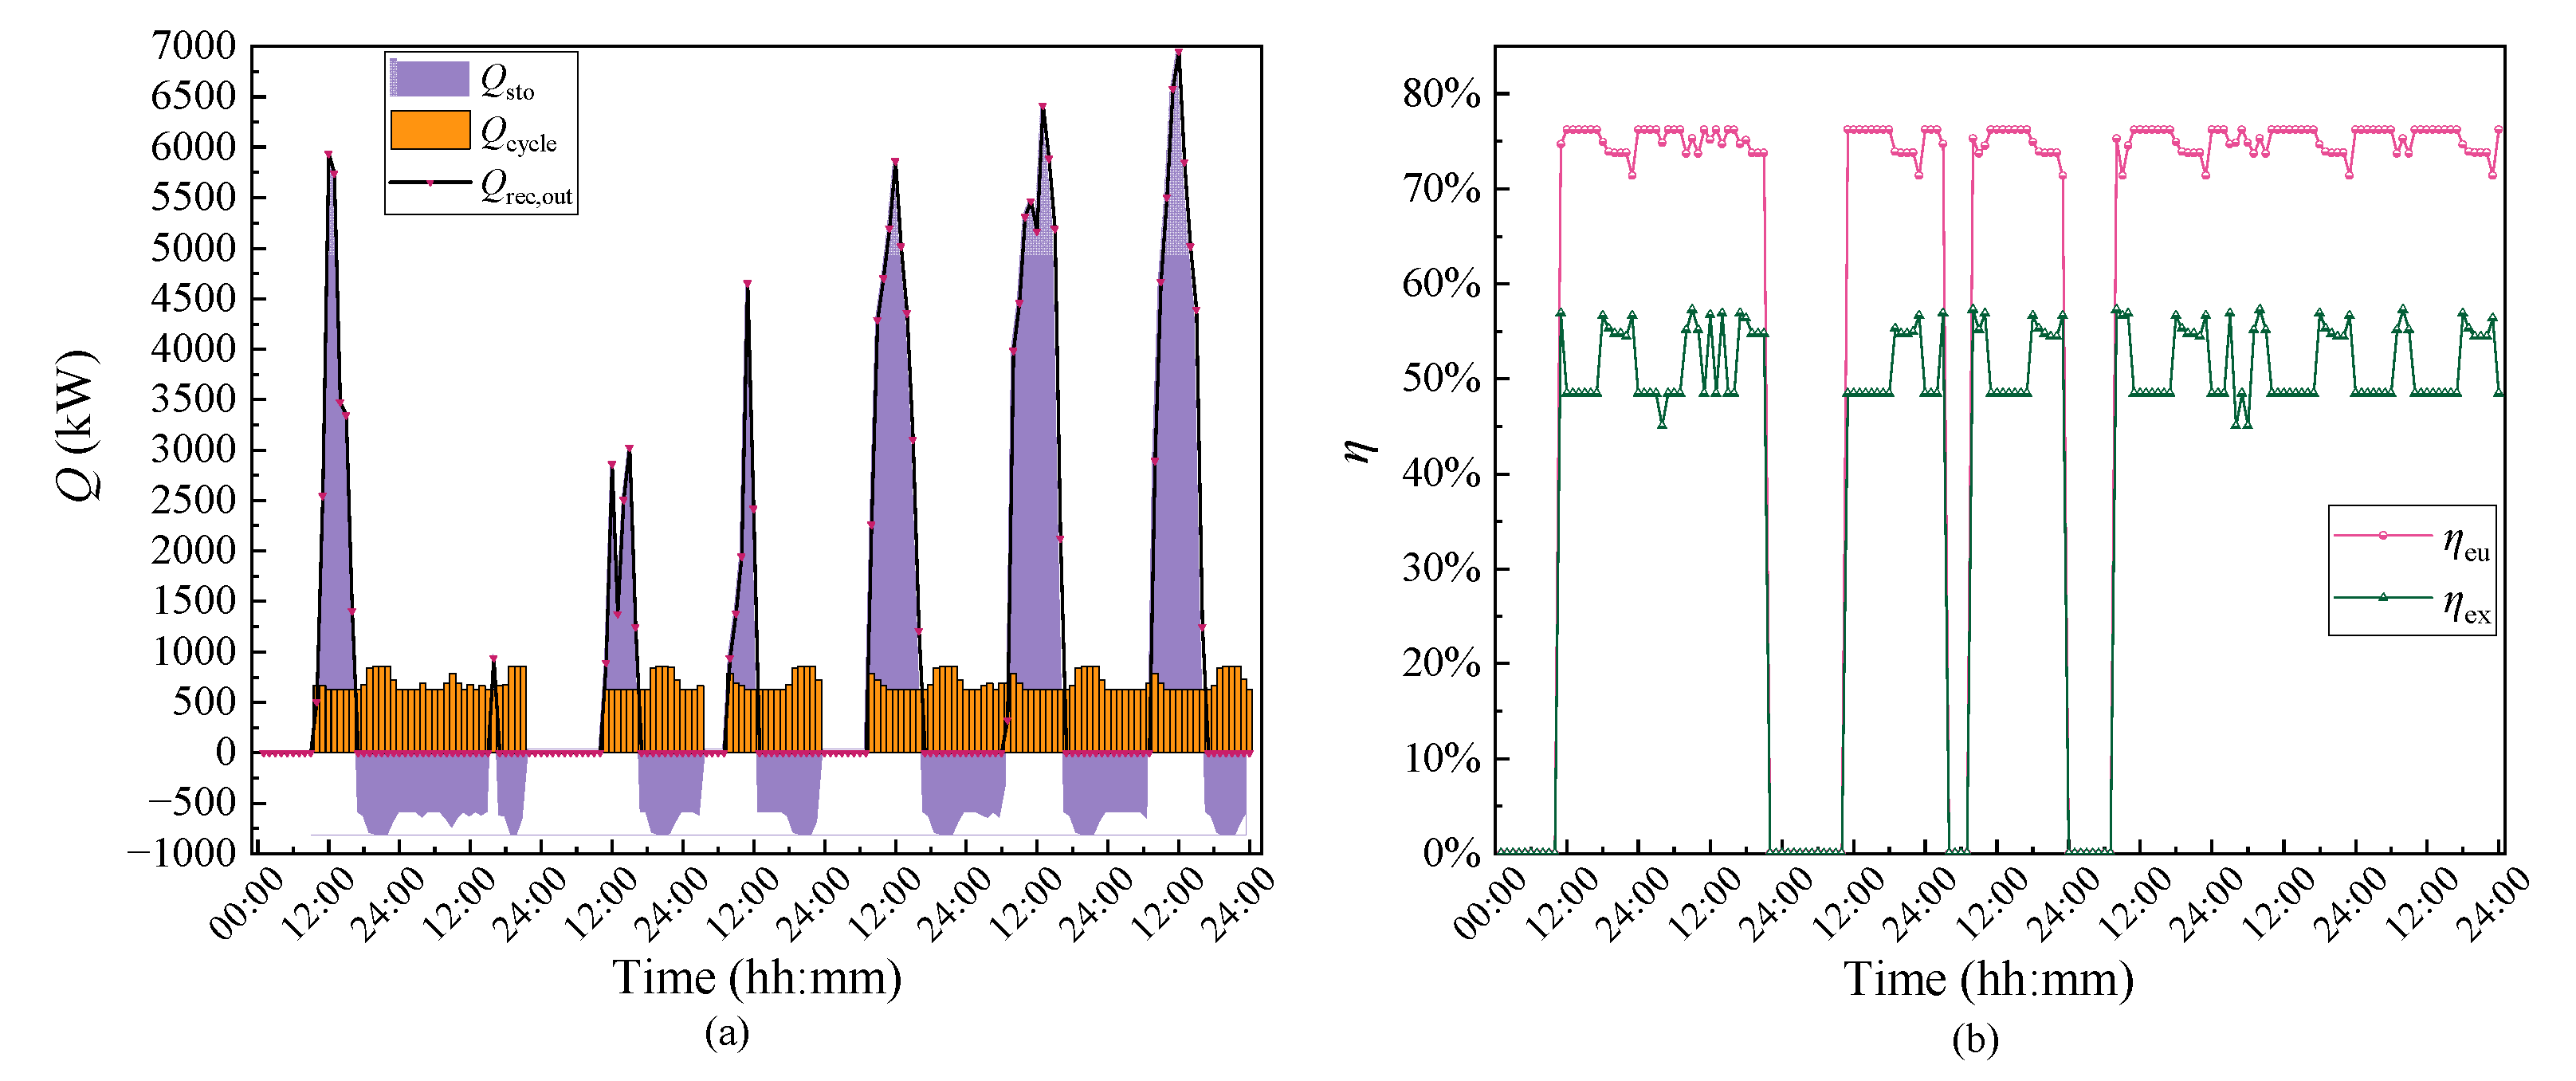
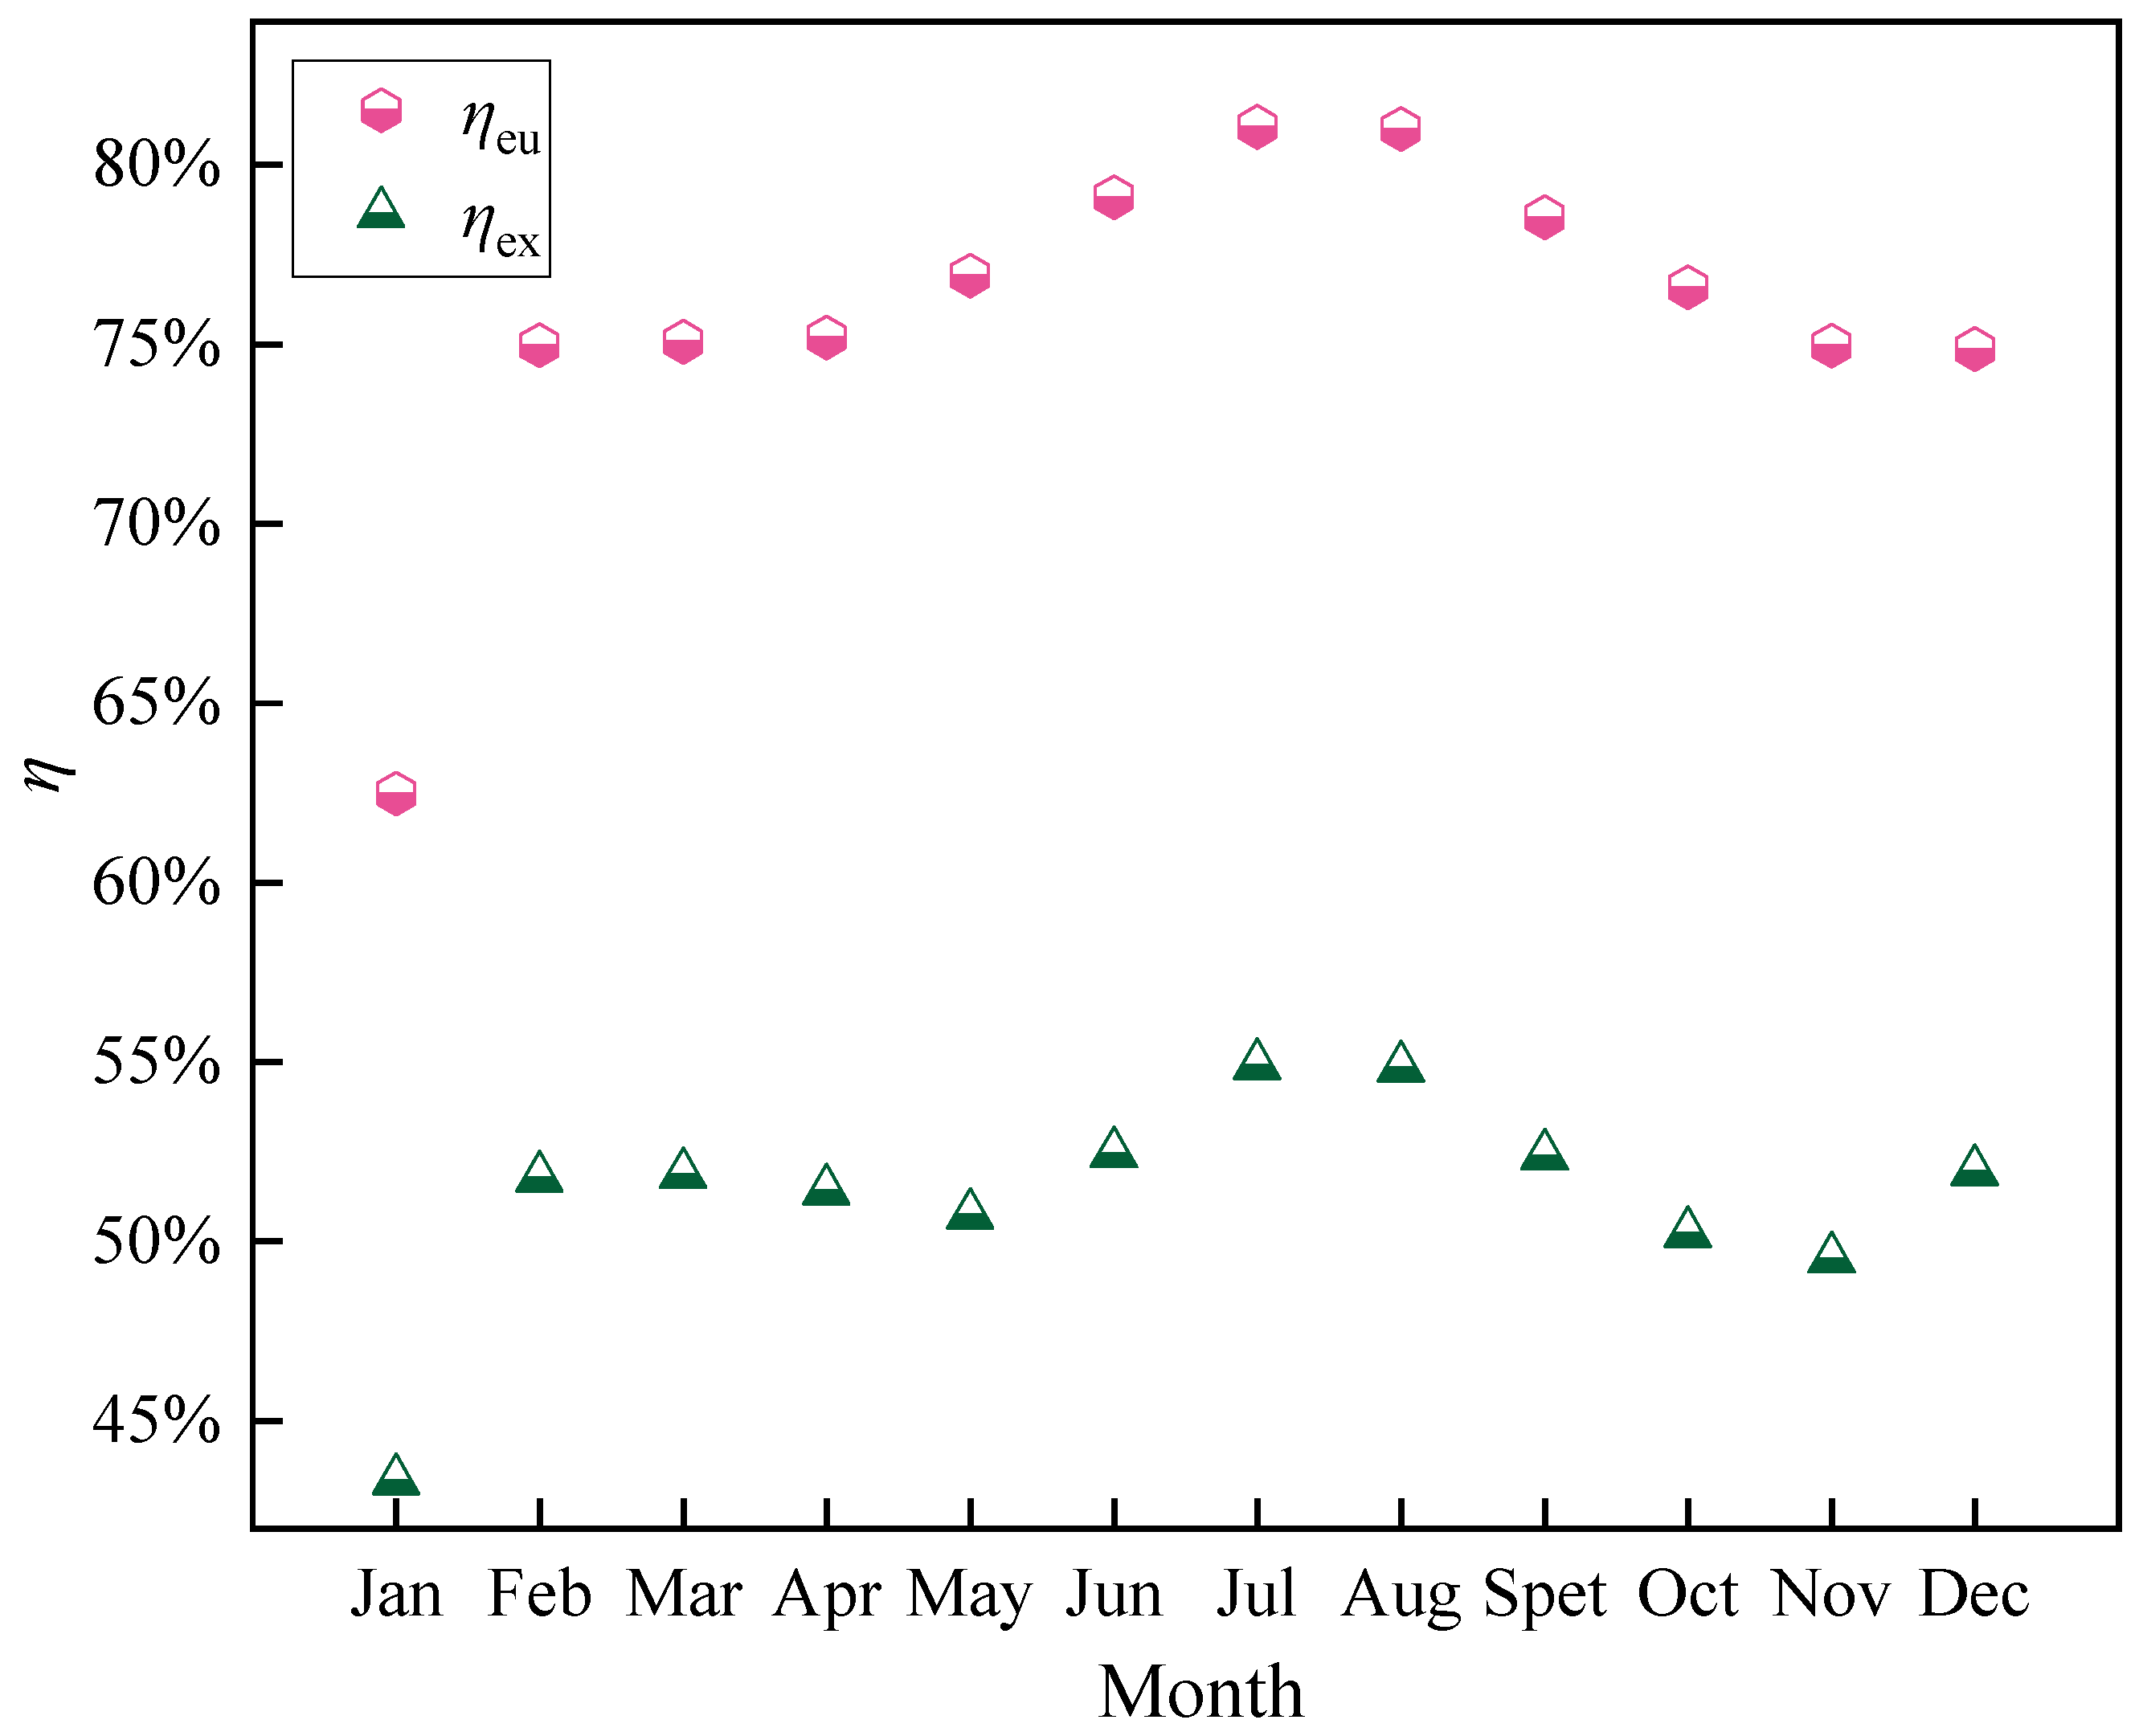
4.3. Annual Thermodynamic Performances

The annual thermodynamic and environmental performance of the CCHP system is analyzed. The energy efficiency and exergy efficiency in different months are shown in Figure 12. The monthly energy efficiency ranges from 62.48% to 81.06%, and the monthly exergy efficiency ranges from 43.34% to 54.91%. Due to the high turbine inlet temperature in July, the system is operating near the design condition, so the energy utilization rate in July is up to 81.06% and the efficiency in July is up to 54.91%. The energy utilization efficiency and exergy efficiency are the lowest in January, primarily due to the low irradiation in winter and the low turbine inlet temperature during the operation period of the system. The energy utilization efficiency of CCHP system in a whole year is in the range of 71.05–82.81%, and the exergy efficiency ranges from 45.03% to 59.77%. The annual energy utilization efficiency and exergy efficiency of CCHP system are 77.16% and 52.20%, respectively.
The thermodynamic and environmental performances in different months are shown in Figure 13. The primary energy saving rate and pollutant emission reduction rate are highest in May, reaching 99.58% and 99.7%, respectively. Due to the solar collection being higher this month, more user demand is met. The primary energy saving rate and pollutant emission reduction rate are relatively low in February, at 63.26% and 62.13%, respectively. Because of the low intensity of solar radiation, more external energy is needed.
Moreover, the pollutant emissions are also varied, and the CO2, NOx, and SO2 reduction rates compared with reference system are shown in Figure 13. The change in CO2 and SCO2 emission reduction rates is similar. In January, December, and February, the NOx emission reduction rate is lower than the CO2 emission reduction rate and SO2 emission reduction rate. The NOx emission of heating network is greater than the NOx emission of power generation [34]. In winter, the heating of the system output is not enough to meet the requirements of users. The increment of heat supplied by the heat network results in elevated NOx emissions, and the NOx emission reduction rate is lower. Conversely, in other months with lower heating loads, the NOx emission reduction rate is relatively high. Compared with the separate system, the primary annual energy saving rate is 93.70% and the pollutant emission reduction rate is 94.15%.

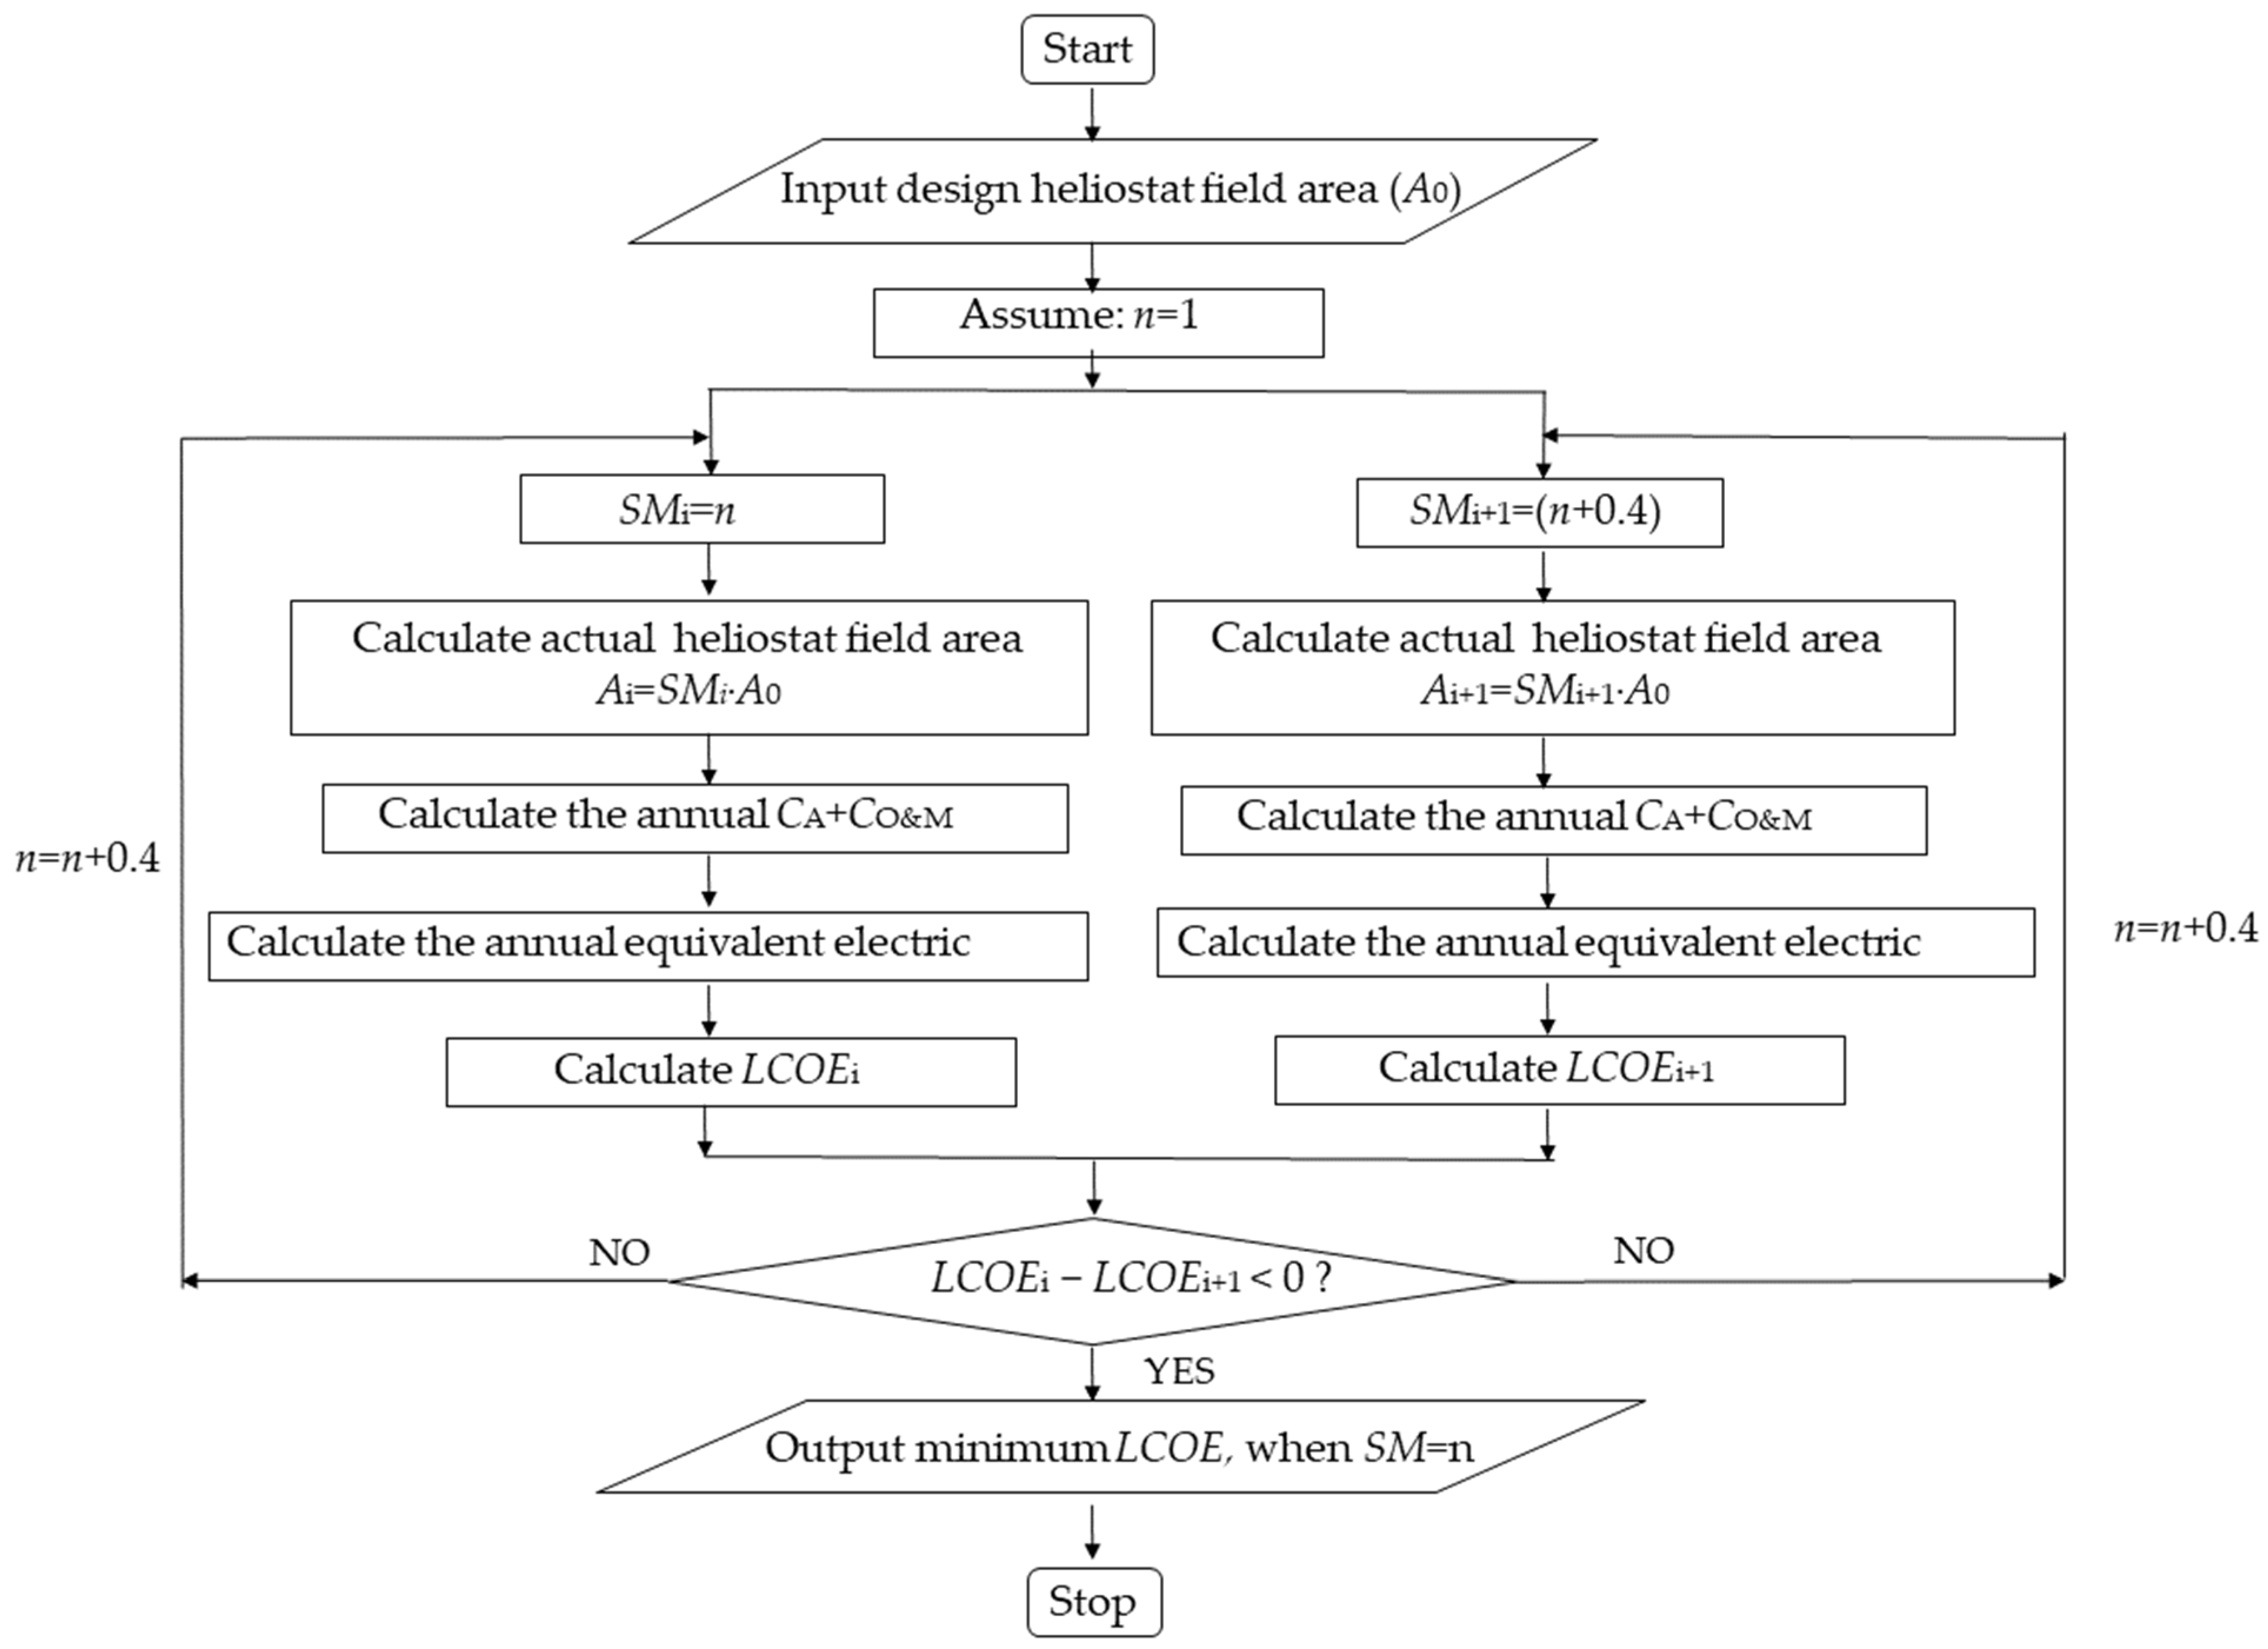
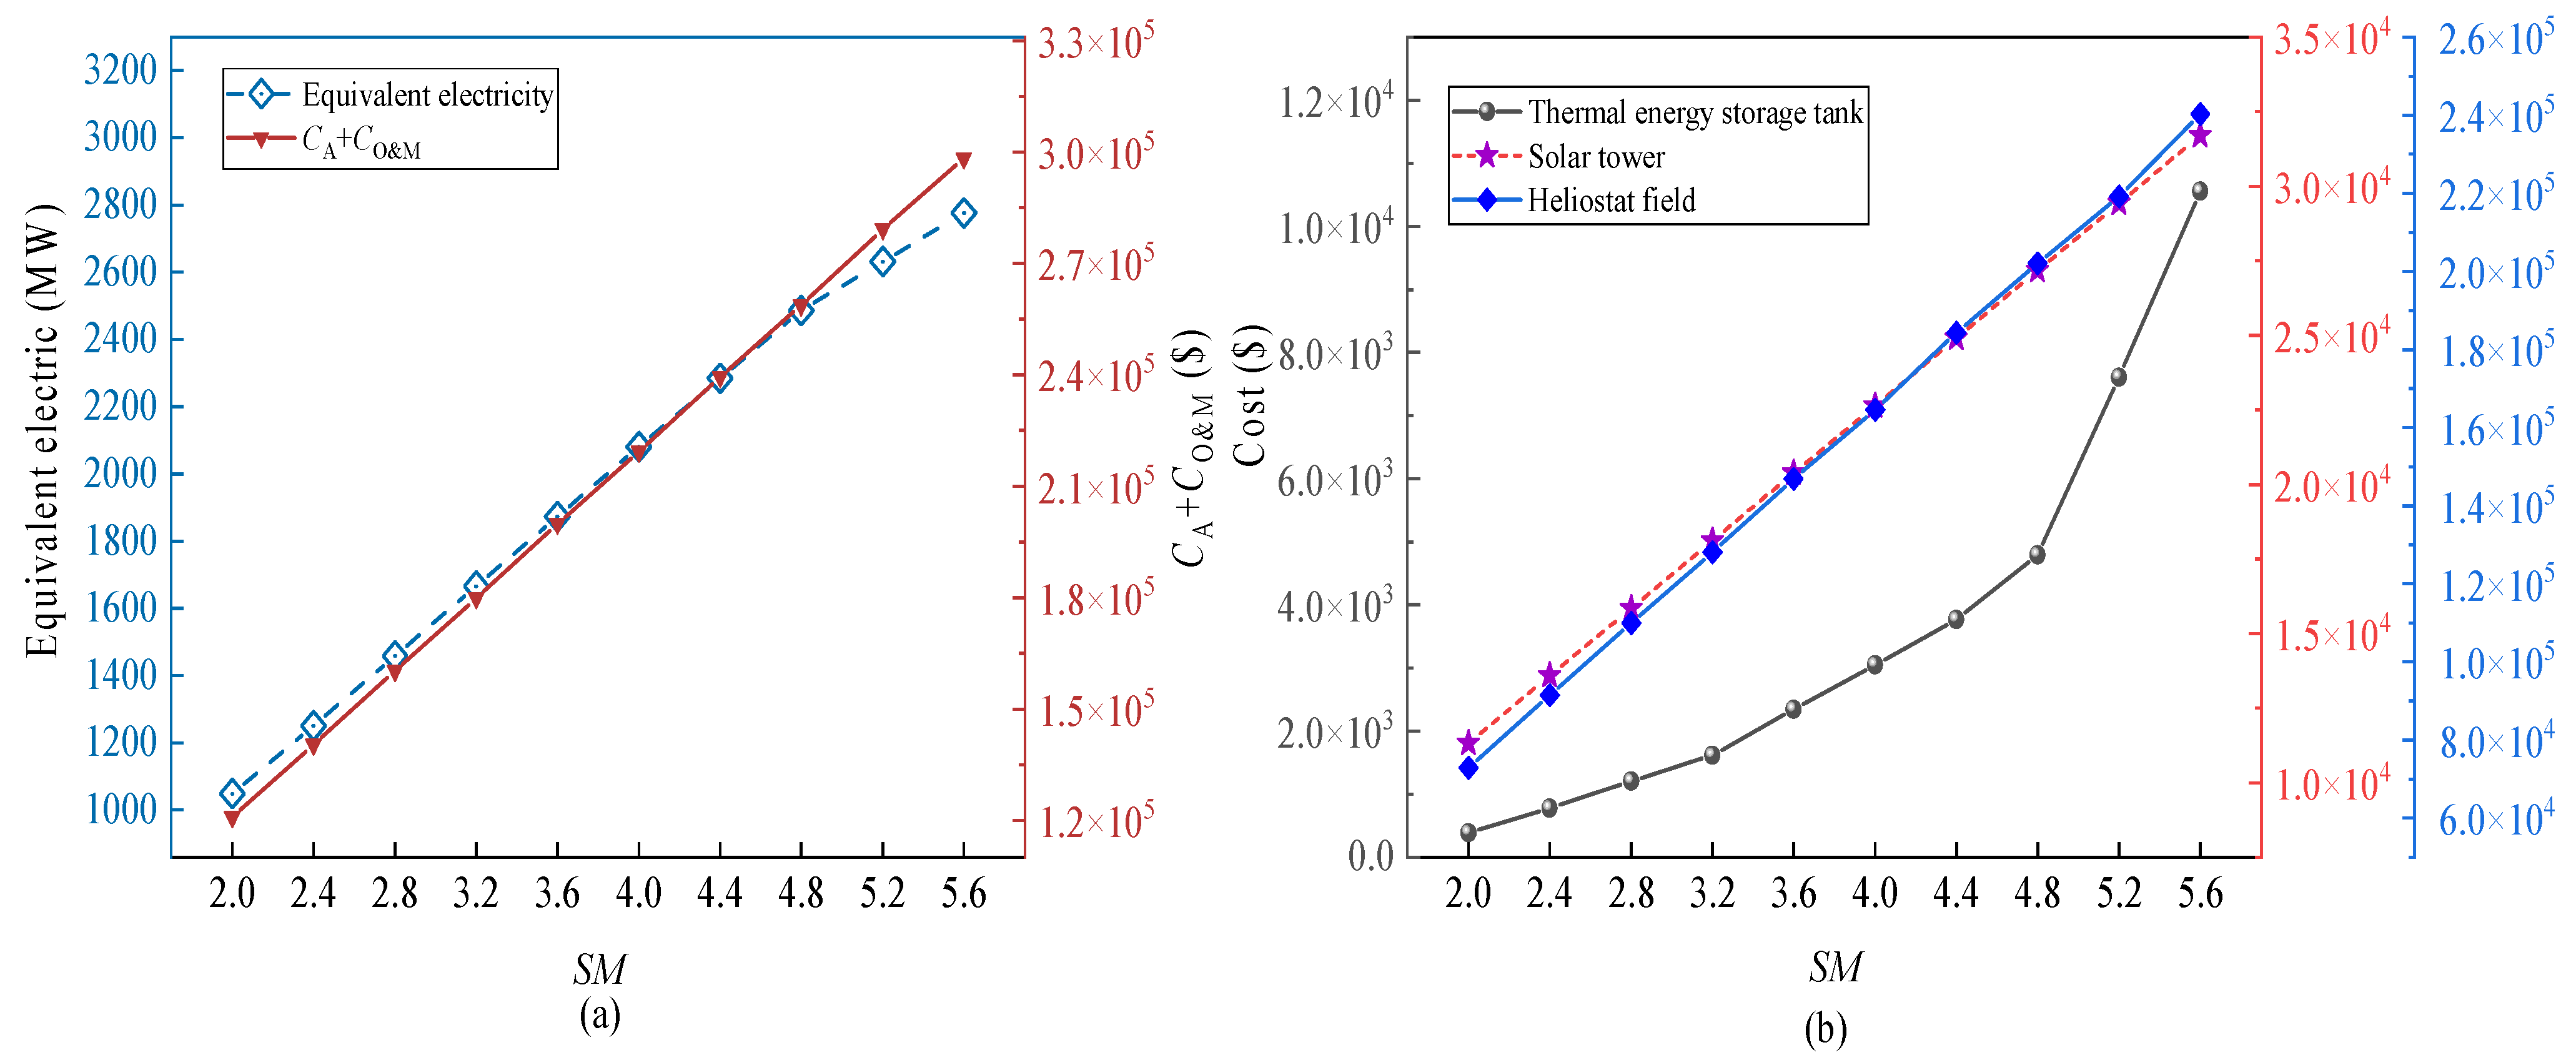
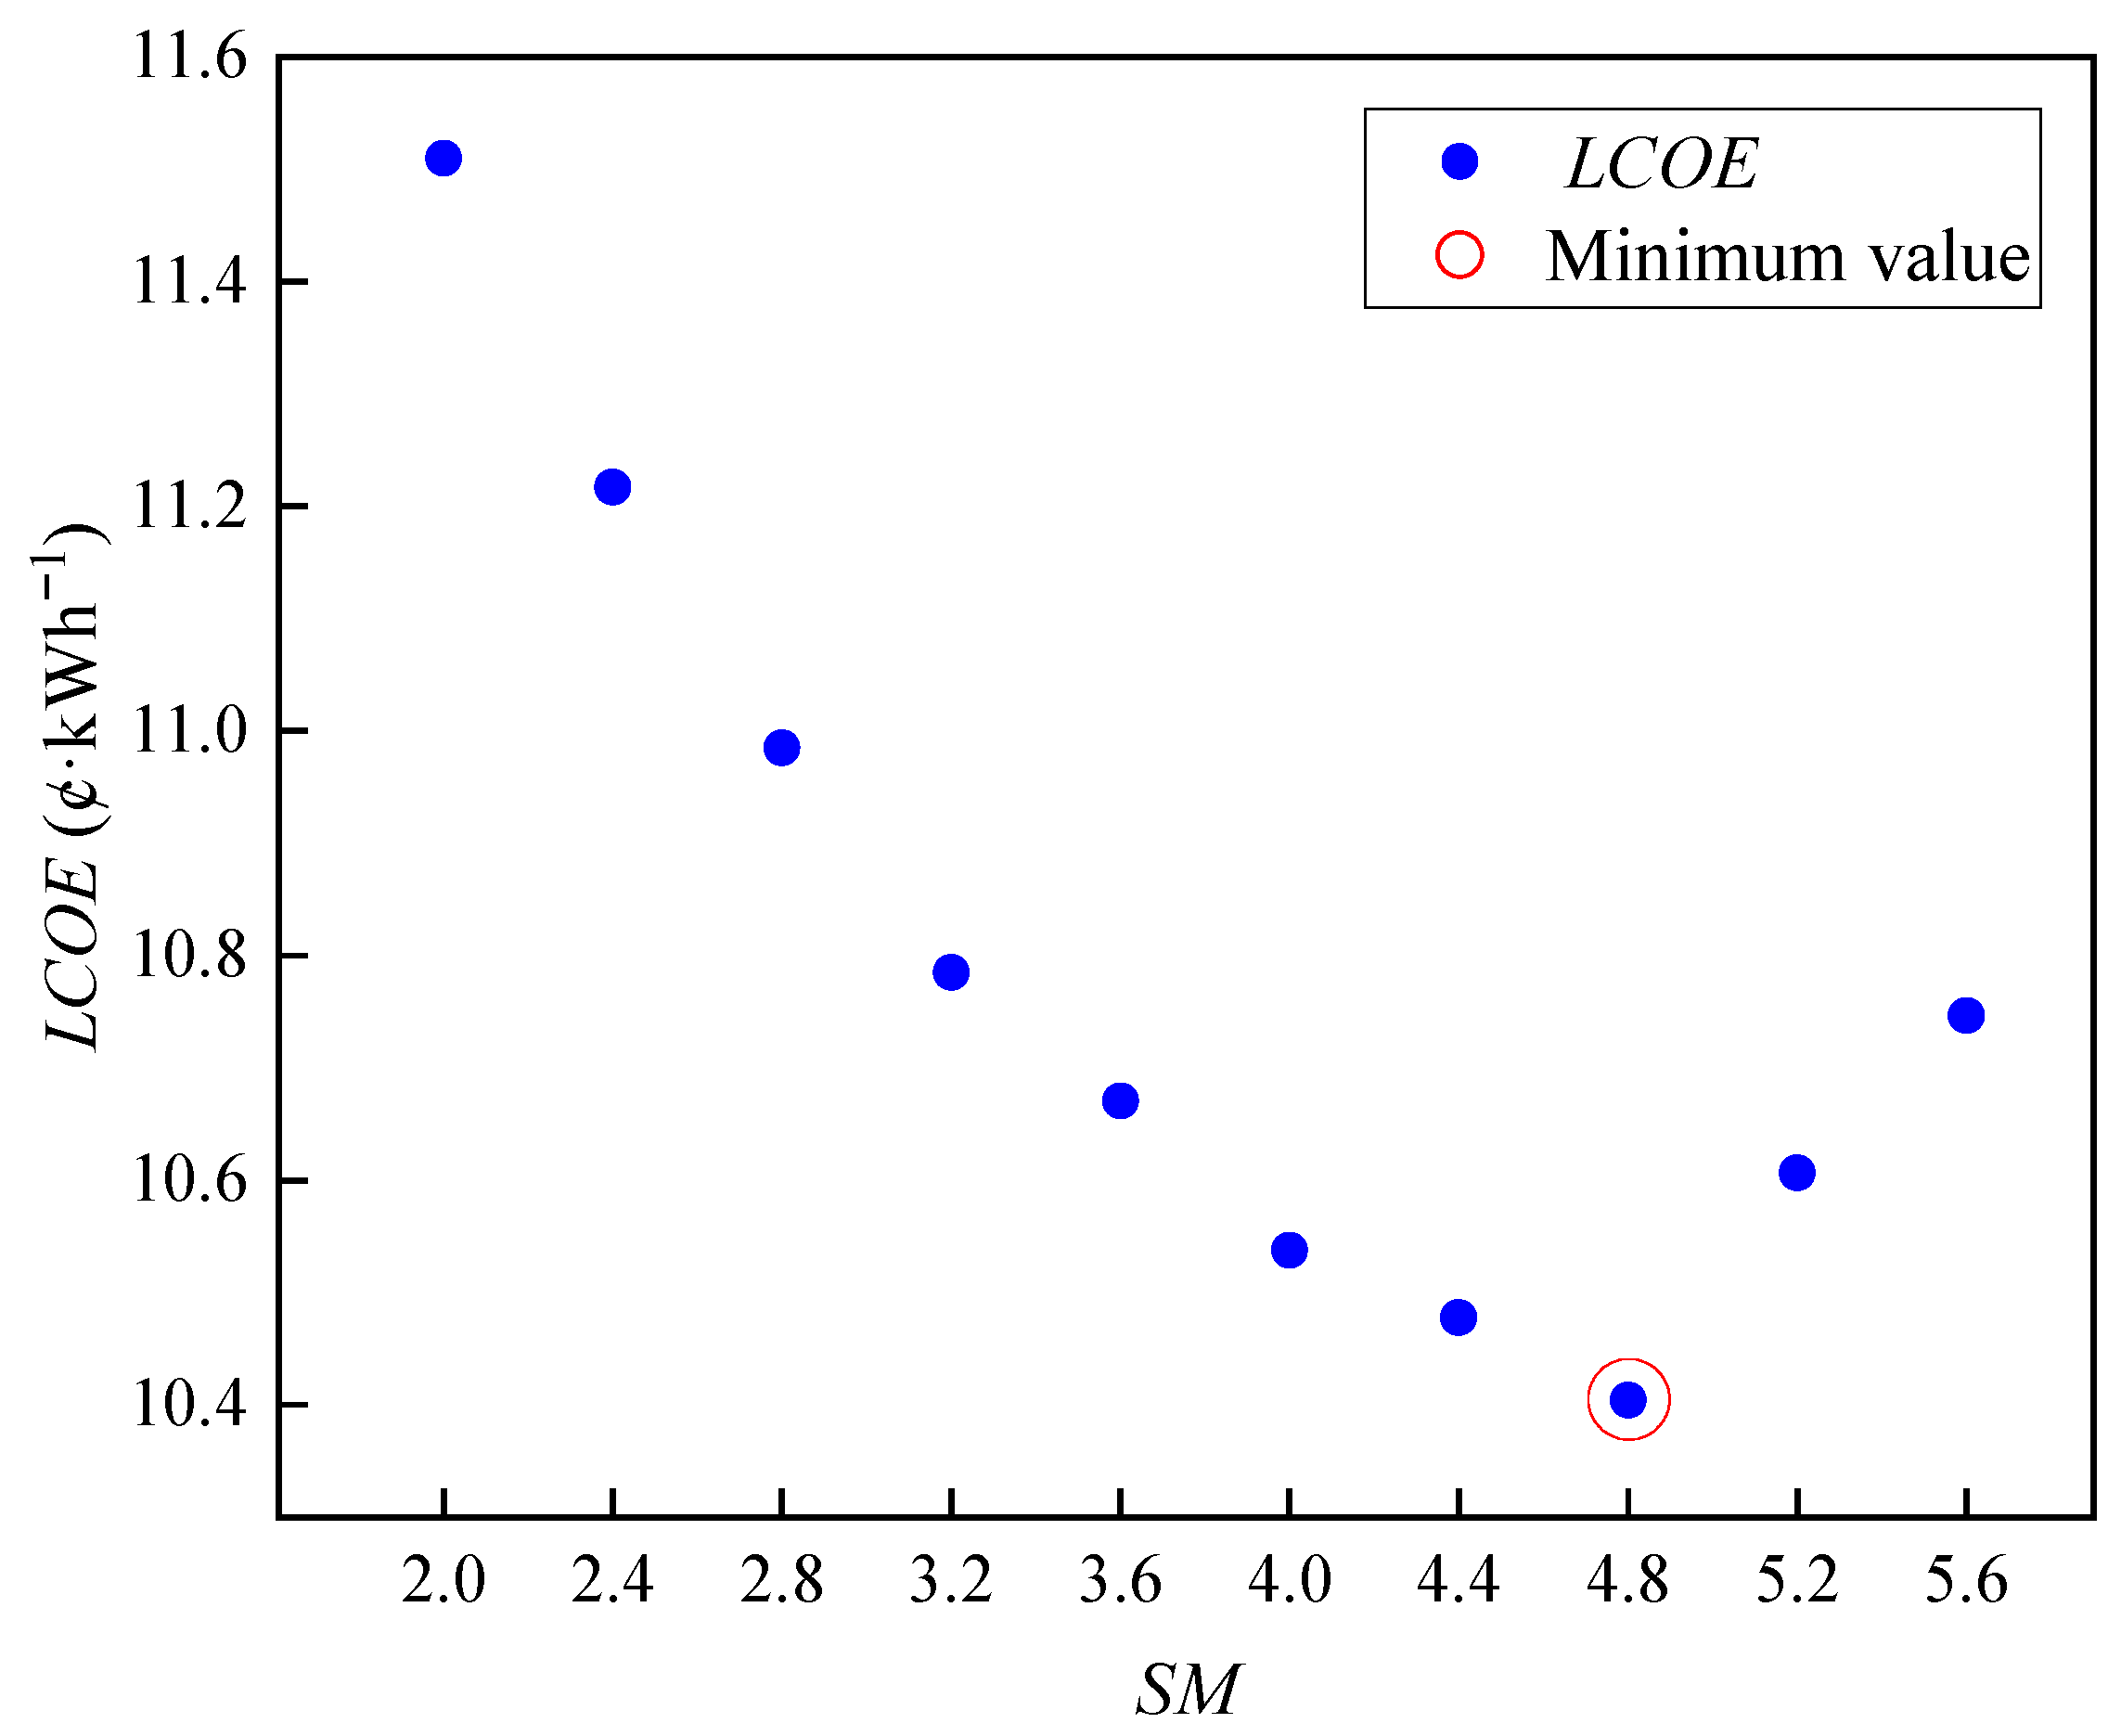
4.4. Optimization of Solar Multiple

The size of the heliostat field area not only affects the stability of the CCHP system, but also the economic performance of the system. In order to determine the optimal heliostat field area and thermal energy storage scale, optimization is carried out, with SM as the optimization parameter and LCOE as the optimization objective.
Firstly, the actual heliostat field area of different SM is calculated. Then, the annual initial investment cost, operation and maintenance cost, and equivalent electricity of the system under different SM are calculated. Finally, the calculated LCOE of different SM is determined, and the optimal SM is determined according to the minimum LCOE. The flow chart of the optimization program is shown in Figure 14.
The variations in cost and equivalent electricity under different solar multiple are shown in Figure 15a. As the solar multiple increases from 2 to 5.6, the initial investment cost, operation and maintenance cost, and equivalent electricity of the solar heliostat field show an increasing trend. When the solar multiple increases from 4.8 to 5.6, the growth of the equivalent electricity generated by the system slows down, which is lower than the growth rate of the initial investment cost and operation and maintenance cost of the solar heliostat field. With the increase in SM, the initial investment of the solar tower and heliostat field presents a linear upward, as shown in Figure 15b. The initial investment of thermal energy storage tank increases with the increase in SM, and the magnitude of the increase becomes greater with higher SM. This is because, when the system is capable of fulfilling the majority of user requirements, additional energy will be stored with the increment of SM, thereby leading to a significant increase in capacity of thermal energy storage.
Therefore, LCOE gradually decreases with the increase in solar multiple from 2 to 4.8, which is shown in Figure 16. The reason is that, when the solar multiple is small, the increase in solar multiple leads to the increase in thermal energy storage capacity, along with the cost increase. The system is thus able to utilize solar energy more effectively, and the annual cooling, heating, and electricity supply of the system increases. The solar multiple increases from 4.8 to 5.6, and the cost growth rate is higher than the equivalent power growth rate. At this point, because the thermal energy storage scale has basically satisfied the demand of users, the increase in the scale of the thermal energy storage will only increase the initial investment cost and operating and maintenance cost. When the SM is 4.8, the LCOE is at least 10.4 ¢/(kW·h), which is 5.22% lower than that of the concentrating solar power system [35]. This is mainly due to the improvement in the output of the CCHP system. The efficiency of solar-to-electricity efficiency in the references is 14.7% and the average direct normal irradiation is close to the irradiation in this paper. The increase in the energy utilization rate in CCHP system leads to an increase in the equivalent electricity, thus reducing the LCOE. At the condition of the optimal SM, the system driven by solar energy operates for 299 days in whole year, realizing operational stability.
When the SM is 4.8, the proportion of annual costs is shown in Figure 17. The electric charge represents the cost of buying electricity from the grid minus the cost of selling electricity. The investment proportion of the heliostat field is the largest, accounting for 60%. The investment proportion of the heater is the largest among the SCO2 cycle equipment, followed by HTR and turbine.
The thermodynamic and environmental performances of the system under different solar multiples are analyzed. The annual primary energy saving rate and pollutant emission reduction rate under different SM are shown in Figure 18. The primary energy saving rate and pollutant emission reduction rate increase as the solar multiple increases. This is because, as the solar multiple increases, the storage and utilization of solar energy increases, and the corresponding energy consumption and pollutant emissions are reduced. When the solar multiple is 4.8, the primary energy saving rate is 85.04%, and the pollutant emission reduction rate is 86.05%, the carbon dioxide emissions reduction rate is 85.06%, the nitrogen oxide emissions reduction rate is 88.20%, and the sulfur dioxide emissions reduction rate is 84.90%. Compared with the CCHP system of similar capacity, the carbon dioxide emission reduction rate is increased by 20%, which illustrates the feasibility of solar-driven SCO2 CCHP system [36].

5. Conclusions

A solar-driven SCO2 CCHP system is proposed. The CCHP system is evaluated from the perspectives of thermodynamic, environmental, and economic. The main conclusions are listed as follows:
(1)
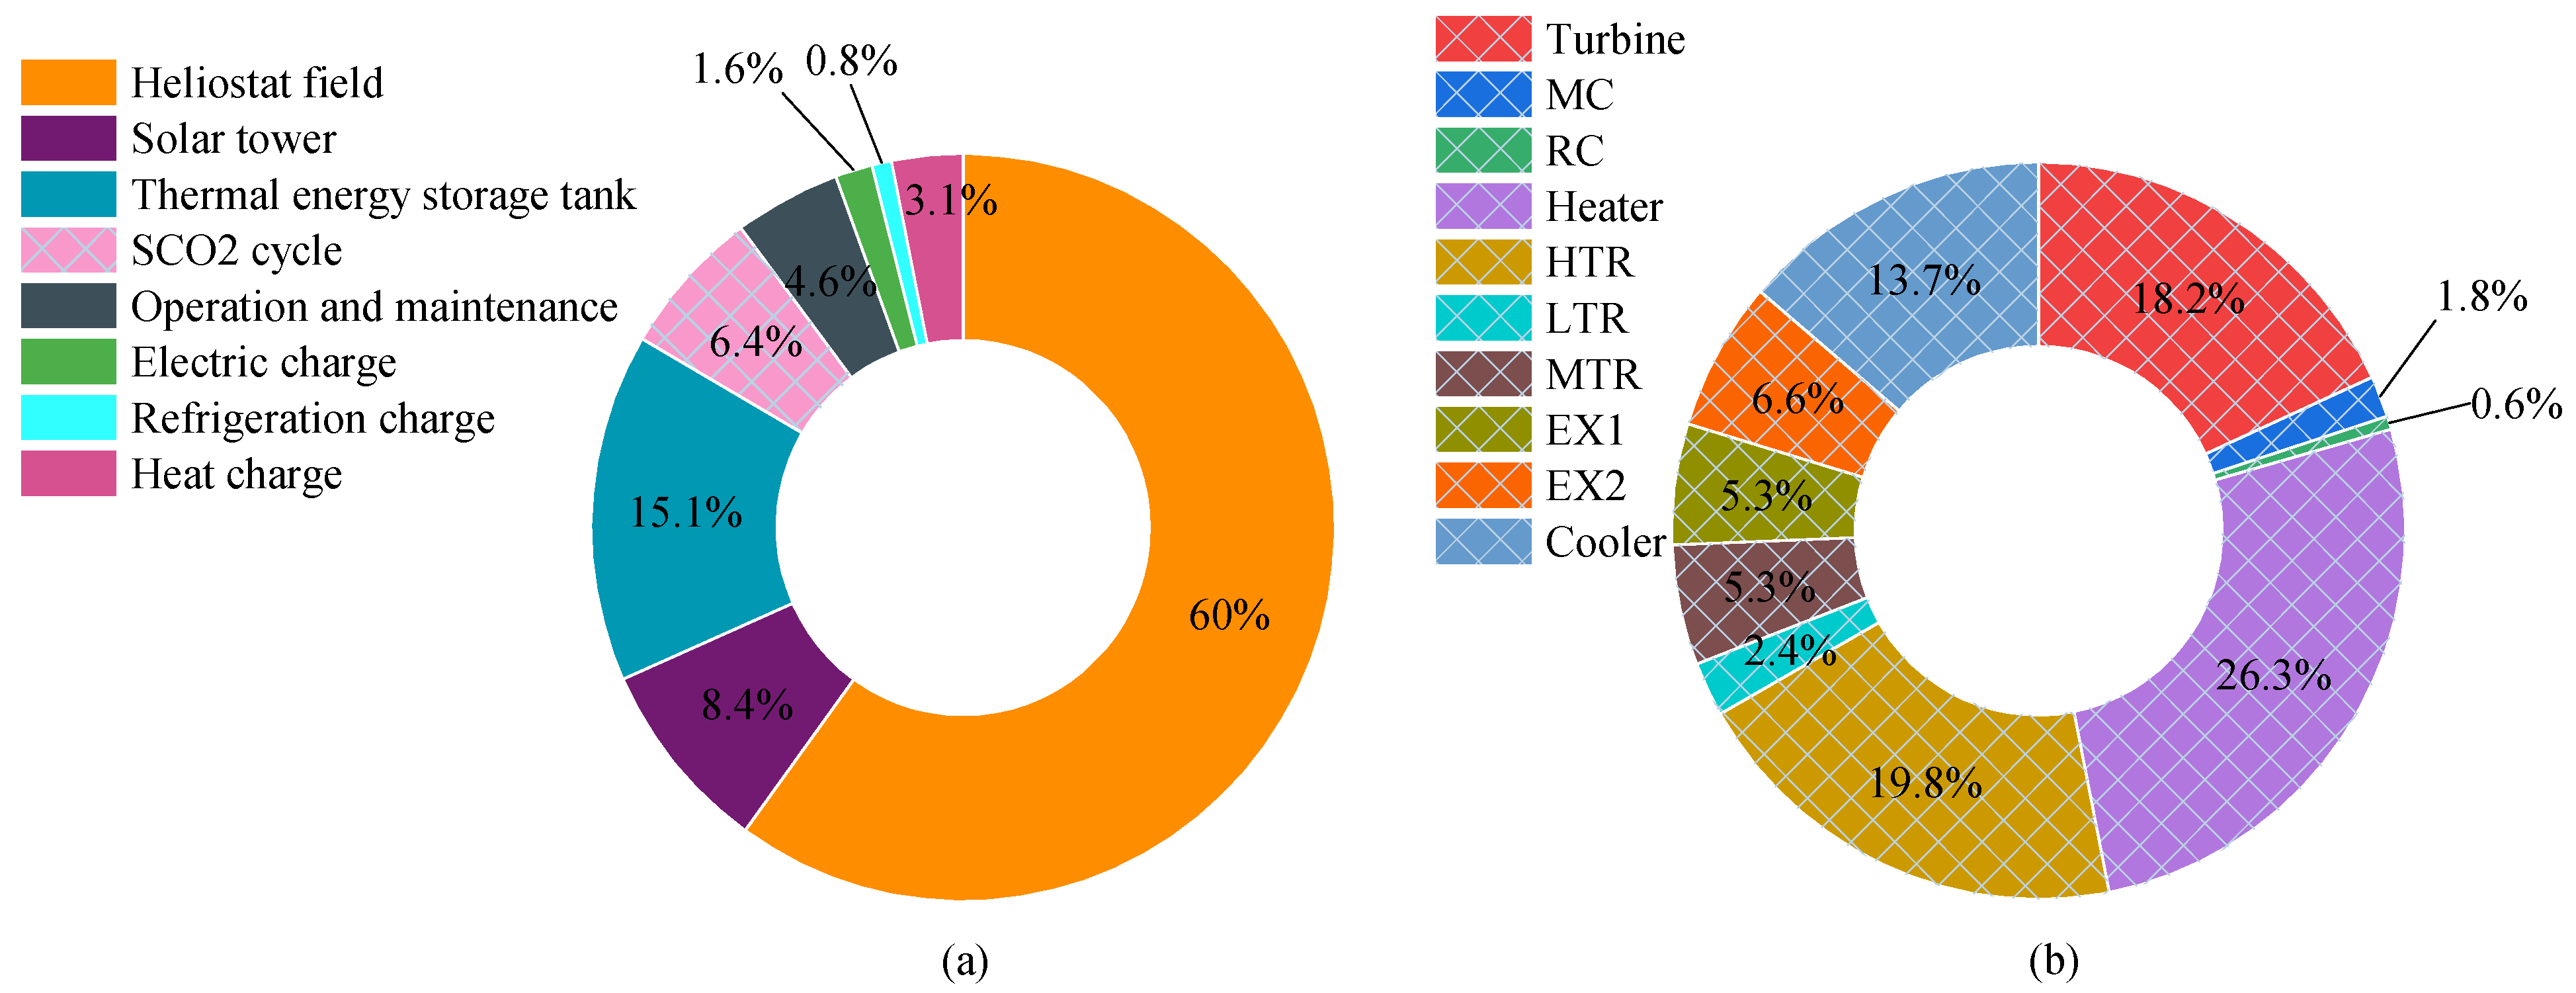
The thermodynamic performance of the CCHP system under the design conditions is analyzed. Under the design conditions, the energy utilization efficiency of the CCHP system is 79.75%, which is 31.30% higher than the SCO2 power cycle driven by concentrated solar energy. The exergy efficiency is 58.63% and the largest exergy loss occurs in the heater, accounting for 15%.
(2)
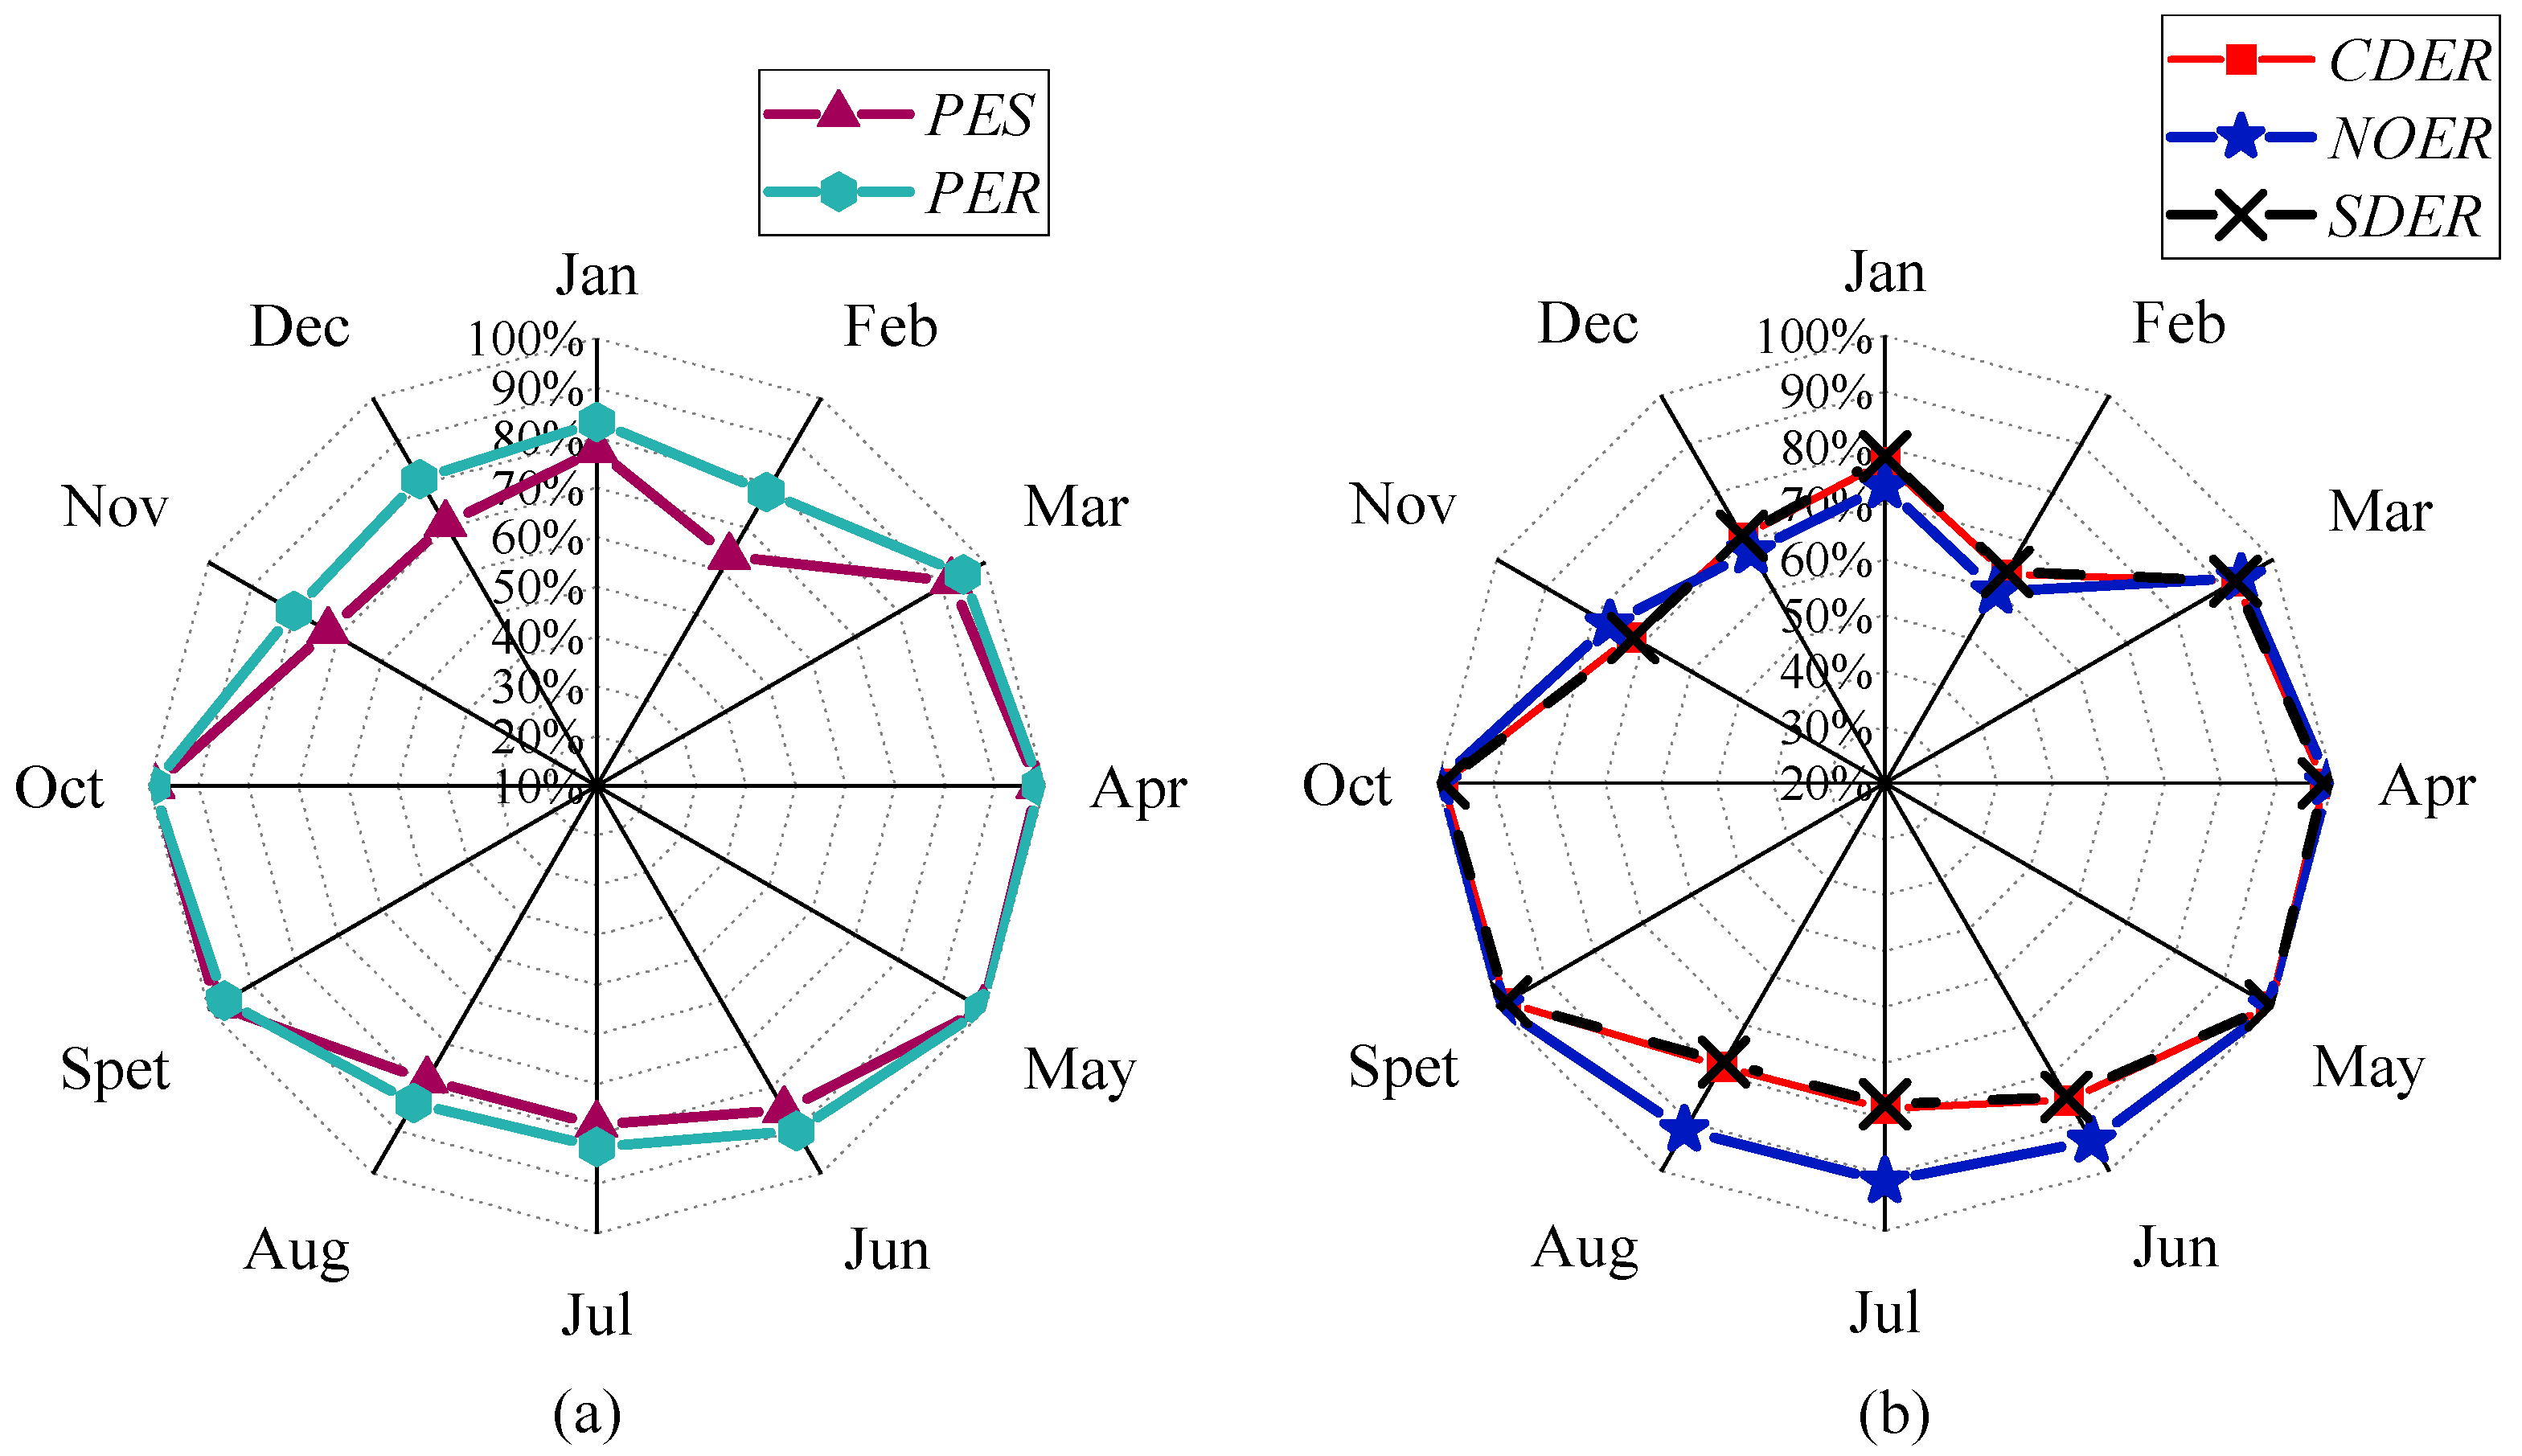
According to the changes in solar radiation and users’ loads, the thermodynamic and environmental performance of CCHP system in typical days and under annual conditions are analyzed. The annual energy utilization efficiency and exergy efficiency of CCHP system are 77.16% and 52.20%, respectively. Compared with the separating production system, the annual primary energy saving rate is 85.04%, and the pollutant emission reduction rate is 86.05%.
(3)
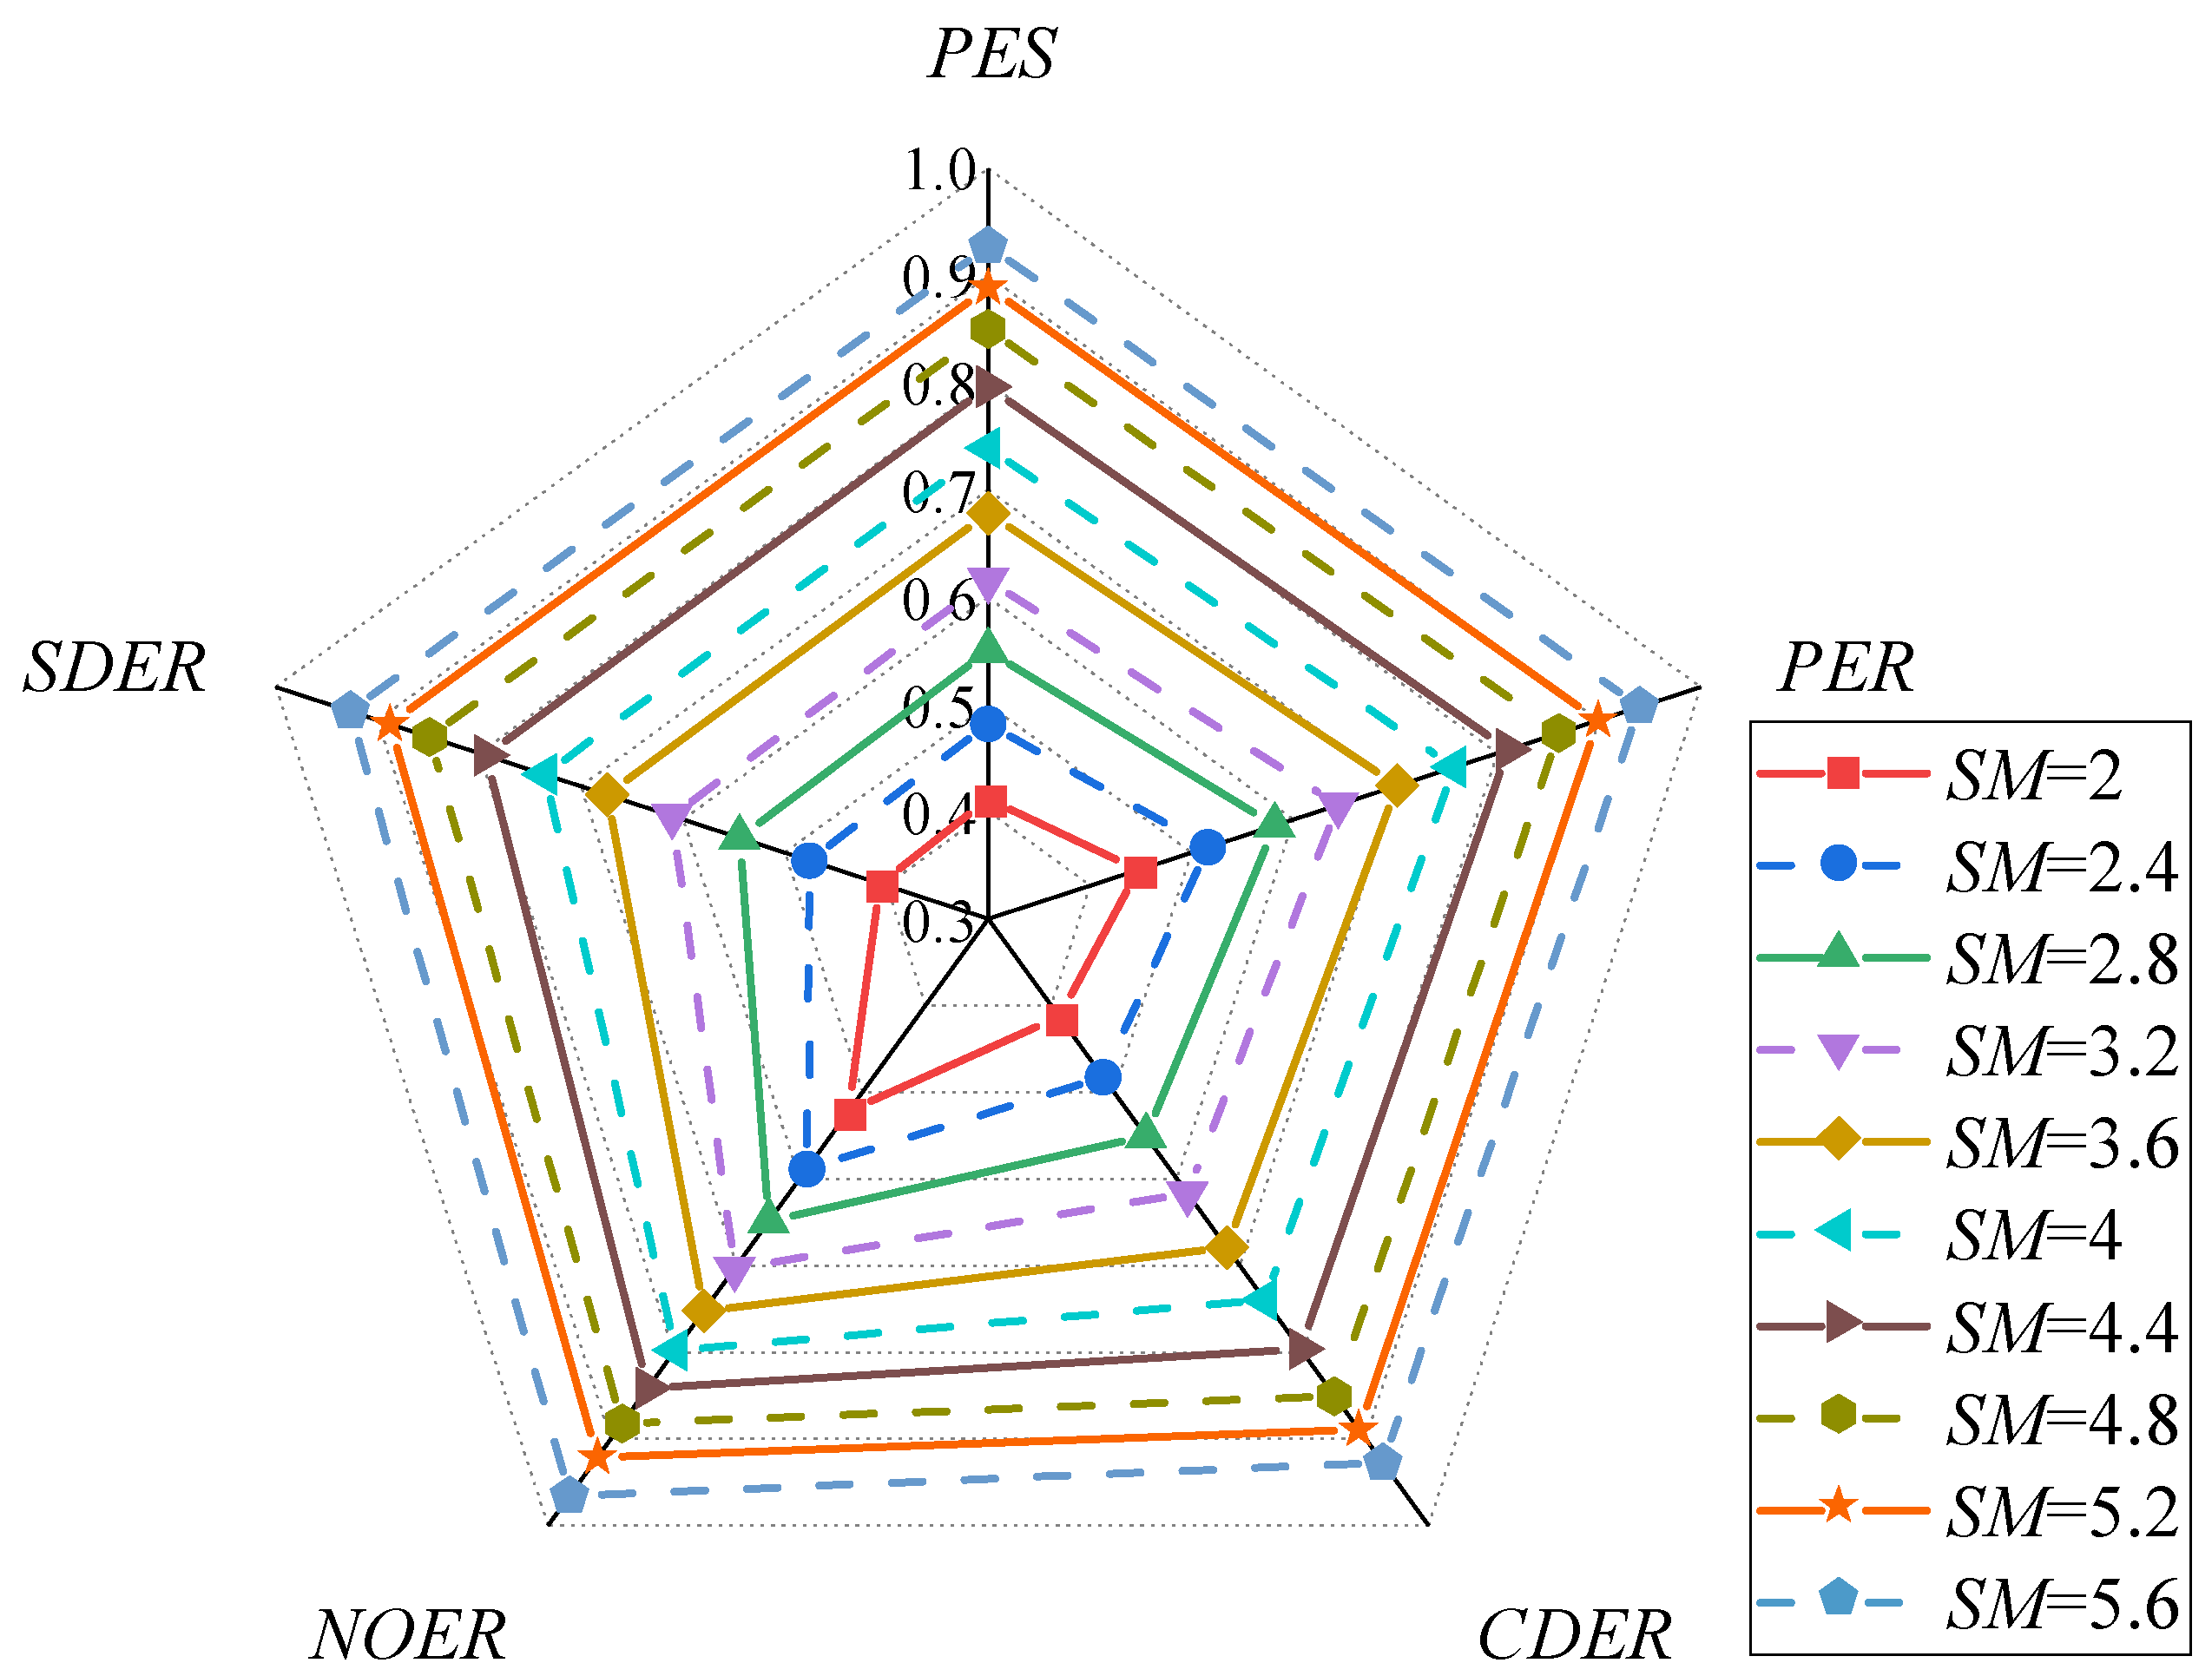
The system performance for different solar multiples is analyzed, and thermal storage capacity is determined. The SM is optimized with LCOE as the optimization objective, and the results show that, when the SM is 4.8, the LCOE is the lowest, at 10.4 ¢/(kW·h).
This paper considers the performance of the system under the operation strategy of following thermal load, the future works will compare the system performance with different operation strategies. Furthermore, the performance of the system in different climatic zones is also worth investigating.

Author Contributions

Conceptualization, X.W.; methodology, S.Y. and X.W.; software, S.Y. and D.M.; validation, X.S.; investigation, D.M. and X.Z.; data curation, X.S.; writing—original draft preparation, S.Y.; writing—review and editing, X.W.; visualization, S.Y. and X.Z.; funding acquisition, X.W. All authors have read and agreed to the published version of the manuscript.

Funding

This research was funded by Natural Science Foundation of Shandong Province, China (Grant NO. ZR2021QE298).

Data Availability Statement

The original contributions presented in the study are included in the article, further inquiries can be directed to the corresponding author.

Conflicts of Interest

The authors declare no conflicts of interest.

Nomenclature

Abbreviations
CCHPcombined cooling, heating, and power
CDERcarbon dioxide emissions reduction rate
DNIdirect normal irradiance
EX1heat exchanger1
EX2heat exchanger2
FTLfollowing thermal load
HTRhigh temperature recuperator
LTRlow temperature recuperator
LCOElevelized cost of electricity
MCmain compressor
MTRmedium temperature recuperator
NTUnumber of transfer units
NOERnitrogen oxide emissions reduction rate
NOxnitrogen oxide
PESprimary energy saving rate
PERpollutant emission reduction rate
RCrecompressing compressor
SCO2supercritical carbon dioxide
SO2sulfur dioxide
SPseparating production
SDERsulfur dioxide emissions reduction rate
SRsplit ratio
SMsolar multiple
TESthermal energy storage
UAconductance
PCHEprinted circuit heat exchangers
Symbols
Aarea
Ccost
CAequipment investment amount
Cpspecific heat capacity
COPcoefficient of performance
CRheat capacity ratio
CDESPCO2 emissions of SP system
CDECCHPCO2 emissions of CCHP system
exspecific exergy
Eelectricity
ERexpansion ratio
Ecycleelectricity output of the system
Egridpower obtained from the power grid
Eloadelectric load
ExDexergy destruction
Exiinflow exergy
Exeoutflow exergy
E 0 a n n equivalent electricity
Fprimary energy consumption
FCCHPprimary energy consumption of the CCHP system
FSPprimary energy consumption of the SP system
henthalpy
mmass flow rate
Mannual depreciation rate of equipment
NOESPannual NOX emissions of SP system
NOECCHPannual NOX emissions of CCHP system
Ppressure
PRpressure ratio
Qthermal energy
Q1convective internal heat transfer
Q2convective heat transfer from the zone surfaces
Q3heat transfer due to inter zone air mixing
Q4heat transfer due to infiltration of outside air
Qc,loadcooling load
Qcycleheat required by the system
Qc,cyclecooling capacity of the system
Qec,celectric cooling capacity
Qh,loadheating load
Qh,cycleheating capacity of the system
Qhn,hheat taken by the heating network
Qrec,outheat collection of the solar heliostat field
Qstothermal energy storage value
SDESPannual SO2 emissions of SP system
SDECCHPannual SO2 emissions of CCHP system
Ttemperature
Wpower
Wnetnet work
ƞeuenergy utilization efficiency
ƞexexergy efficiency
ηisecisentropic efficiency
ΔTlogarithmic mean temperature difference
Greek letters
εheat exchanger effectiveness
ƞefficiency
φflow coefficient
Subscripts
acabsorption chiller
annannual
ccooling
comcompressor
coldcold side of heat exchanger
exhheat exchange
ecelectric chiller
hheating
hnheating network
hstheat storage
hothot side of heat exchanger
inumber of the sub-heat exchanger
ininlet
outoutlet
O&Moperation and maintenance
turturbine
totaltotal

References

  1. Li, G.; Li, M.; Taylor, R.; Hao, Y.; Besagni, G.; Markides, C.N. Solar energy utilisation: Current status and roll-out potential. Appl. Therm. Eng. 2022, 209, 118285. [Google Scholar] [CrossRef]
  2. Merchán, R.P.; Santos, M.J.; Medina, A.; Calvo Hernández, A. High temperature central tower plants for concentrated solar power: 2021 overview. Renew. Sustain. Energy Rev. 2022, 155, 111828. [Google Scholar] [CrossRef]
  3. Sun, E.; Xu, J.; Li, M.; Liu, G.; Zhu, B. Connected-top-bottom-cycle to cascade utilize flue gas heat for supercritical carbon dioxide coal fired power plant. Energy Convers. Manag. 2018, 172, 138–154. [Google Scholar] [CrossRef]
  4. Guo, J.Q.; Li, M.J.; He, Y.L.; Jiang, T.; Ma, T.; Xu, J.L.; Cao, F. A systematic review of supercritical carbon dioxide(S-CO2) power cycle for energy industries: Technologies, key issues, and potential prospects. Energy Convers. Manag. 2022, 258, 24. [Google Scholar] [CrossRef]
  5. Wang, K.; Li, M.-J.; Guo, J.-Q.; Li, P.; Liu, Z.-B. A systematic comparison of different S-CO2 Brayton cycle layouts based on multi-objective optimization for applications in solar power tower plants. Appl. Energy 2018, 212, 109–121. [Google Scholar] [CrossRef]
  6. Xu, J.; Sun, E.; Li, M.; Liu, H.; Zhu, B. Key issues and solution strategies for supercritical carbon dioxide coal fired power plant. Energy 2018, 157, 227–246. [Google Scholar] [CrossRef]
  7. Song, J.; Li, X.; Wang, K.; Markides, C.N. Parametric optimisation of a combined supercritical CO2 (S-CO2) cycle and organic Rankine cycle (ORC) system for internal combustion engine (ICE) waste-heat recovery. Energy Convers. Manag. 2020, 218, 112999. [Google Scholar] [CrossRef]
  8. Fan, G.; Song, J.; Zhang, J.; Fu, Z.; Gong, X.; Dai, Y.; Markides, C.N. Thermo-economic assessment and systematic comparison of combined supercritical CO2 and organic Rankine cycle (SCO2-ORC) systems for solar power tower plants. Appl. Therm. Eng. 2024, 236, 121715. [Google Scholar] [CrossRef]
  9. Fan, G.; Li, H.; Du, Y.; Chen, K.; Zheng, S.; Dai, Y. Preliminary design and part-load performance analysis of a recompression supercritical carbon dioxide cycle combined with a transcritical carbon dioxide cycle. Energy Convers. Manag. 2020, 212, 112758. [Google Scholar] [CrossRef]
  10. Fan, G.; Lu, X.; Chen, K.; Zhang, Y.; Han, Z.; Yu, H.; Dai, Y. Comparative analysis on design and off-design performance of novel cascade CO2 combined cycles for gas turbine waste heat utilization. Energy 2022, 254, 124222. [Google Scholar] [CrossRef]
  11. Wu, J.-y.; Wang, J.-l.; Li, S. Multi-objective optimal operation strategy study of micro-CCHP system. Energy 2012, 48, 472–483. [Google Scholar] [CrossRef]
  12. Xu, X.X.; Liu, C.; Fu, X.; Gao, H.; Li, Y. Energy and exergy analyses of a modified combined cooling, heating, and power system using supercritical CO2. Energy 2015, 86, 414–422. [Google Scholar] [CrossRef]
  13. Li, T.; Gao, R.; Qi, J.; Yuan, Y. Thermos-economic performance of a novel CCHP system driven by low-grade thermal energy based on CO2 and organic fluids. Case Stud. Therm. Eng. 2024, 61, 104861. [Google Scholar] [CrossRef]
  14. Soleimani, M.; Mosaffa, A.H.; Fallah, M. Energy, exergy, environmental, and economic evaluations of a proposed CCHP system based on solar, biomass, SOFC, micro-turbine, and LiBr/water absorption chiller. Biomass Bioenergy 2024, 190, 107419. [Google Scholar] [CrossRef]
  15. Fan, G.; Li, H.; Du, Y.; Zheng, S.; Chen, K.; Dai, Y. Preliminary conceptual design and thermo-economic analysis of a combined cooling, heating and power system based on supercritical carbon dioxide cycle. Energy 2020, 203, 117842. [Google Scholar] [CrossRef]
  16. Feng, L.; Dai, X.; Mo, J.; Ma, Y.; Shi, L. Analysis of energy matching performance between CCHP systems and users based on different operation strategies. Energy Convers. Manag. 2019, 182, 60–71. [Google Scholar] [CrossRef]
  17. Wu, H.; Liu, Q.; Xie, G.; Guo, S.; Zheng, J.; Su, B. Performance investigation of a novel hybrid combined cooling, heating and power system with solar thermochemistry in different climate zones. Energy 2020, 190, 116281. [Google Scholar] [CrossRef]
  18. Li, M.-J.; Li, M.-J.; Jiang, R.; Du, S.; Li, X.-Y. Study on the dynamic characteristics of a concentrated solar power plant with the supercritical CO2 Brayton cycle coupled with different thermal energy storage methods. Energy 2024, 288, 129628. [Google Scholar] [CrossRef]
  19. Wang, J.; Chen, B.; Che, Y. Bi-level sizing optimization of a distributed solar hybrid CCHP system considering economic, energy, and environmental objectives. Int. J. Electr. Power Energy Syst. 2023, 145, 108684. [Google Scholar] [CrossRef]
  20. Chen, Y.; Wang, J.; Ma, C.; Gao, Y. Thermo-ecological cost assessment and optimization for a hybrid combined cooling, heating and power system coupled with compound parabolic concentrated-photovoltaic thermal solar collectors. Energy 2019, 176, 479–492. [Google Scholar] [CrossRef]
  21. Liu, L.; Wang, R.; Wang, Y.; Li, W.; Sun, J.; Guo, Y.; Qu, W.; Li, W.; Zhao, C. Comprehensive analysis and optimization of combined cooling heating and power system integrated with solar thermal energy and thermal energy storage. Energy Convers. Manag. 2023, 275, 116464. [Google Scholar] [CrossRef]
  22. Bataineh, K. Hybrid fuel-assisted solar-powered stirling engine for combined cooling, heating, and power systems: A review. Energy 2024, 300, 131506. [Google Scholar] [CrossRef]
  23. EnergyPlus. Available online: https://energyplus.net/documentation (accessed on 4 October 2024).
  24. Wright, S.A.; Radel, R.F.; Vernon, M.E.; Pickard, P.S.; Rochau, G.E. Operation and Analysis of a Supercritical CO2 Brayton Cycle; Advanced Nuclear Concepts Department, Sandia National Laboratories: Albuquerque, NM, USA; Livermore, CA, USA, 2010; No. SAND2010-0171. Available online: https://www.osti.gov/biblio/984129 (accessed on 4 October 2024).
  25. Yang, J.; Yang, Z.; Duan, Y. Part-load performance analysis and comparison of supercritical CO2 Brayton cycles. Energy Convers. Manag. 2020, 214, 112832. [Google Scholar] [CrossRef]
  26. Taheri, M.H.; Khani, L.; Mohammadpourfard, M.; Aminfar, H.; Akkurt, G.G. Multi-objective optimization of a novel supercritical CO2 cycle-based combined cycle for solar power tower plants integrated with SOFC and LNG cold energy and regasification. Int. J. Energy Res. 2022, 46, 12082–12107. [Google Scholar] [CrossRef]
  27. Wang, Z.; Cai, W.; Tao, H.; Wu, D.; Meng, J. Research on capacity and strategy optimization of combined cooling, heating and power systems with solar photovoltaic and multiple energy storage. Energy Convers. Manag. 2022, 268, 115965. [Google Scholar] [CrossRef]
  28. Thanganadar, D.; Asfand, F.; Patchigolla, K. Thermal performance and economic analysis of supercritical Carbon Dioxide cycles in combined cycle power plant. Appl. Energy 2019, 255, 113836. [Google Scholar] [CrossRef]
  29. Reznicek, E.P.; Neises, T.; Braun, R.J. Optimization and techno-economic comparison of regenerators and recuperators in sCO2 recompression Brayton cycles for concentrating solar power applications. Sol. Energy 2022, 238, 327–340. [Google Scholar] [CrossRef]
  30. Reyes-Belmonte, M.A.; Sebastián, A.; Romero, M.; González-Aguilar, J. Optimization of a recompression supercritical carbon dioxide cycle for an innovative central receiver solar power plant. Energy 2016, 112, 17–27. [Google Scholar] [CrossRef]
  31. Binotti, M.; Astolfi, M.; Campanari, S.; Manzolini, G.; Silva, P. Preliminary Assessment of sCO2 Power Cycles for Application to CSP Solar Tower Plants. Energy Procedia 2017, 105, 1116–1122. [Google Scholar] [CrossRef]
  32. Yousef, M.S.; Santana, D. Optimizing power, cooling, and hydrogen generation: A thermodynamic and exergoeconomic study of an advanced sCO2 trigeneration system. Case Stud. Therm. Eng. 2024, 53, 103902. [Google Scholar] [CrossRef]
  33. Montes, M.J.; Abánades, A.; Martínez-Val, J.M.; Valdés, M. Solar multiple optimization for a solar-only thermal power plant, using oil as heat transfer fluid in the parabolic trough collectors. Sol. Energy 2009, 83, 2165–2176. [Google Scholar] [CrossRef]
  34. Zhengzhou Boiler Co. Ltd. Available online: https://www.zzboiler.com/ (accessed on 24 April 2023).
  35. Hirbodi, K.; Enjavi-Arsanjani, M.; Yaghoubi, M. Techno-economic assessment and environmental impact of concentrating solar power plants in Iran. Renew. Sustain. Energy Rev. 2020, 120, 109642. [Google Scholar] [CrossRef]
  36. Wang, S.; Muhammad, I.; Li, H.; Chen, X.; Qin, M. Prime Mover Capacity Optimization and Thermodynamic Performance Analysis of Internal Combustion Engine Based CCHP System. J. Therm. Sci. 2023, 32, 1583–1594. [Google Scholar] [CrossRef]
Figure 1. Configuration of CCHP system. (a) Schematic of the CCHP. (b) T-s diagram of the CCHP.
Energies 18 01995 g001
Figure 2. (a) Hourly environment parameter of Qingdao. (b) Solar tower collection efficiency.
Energies 18 01995 g002
Figure 3. Schematic diagram of building model.
Energies 18 01995 g003
Figure 4. Building load.
Energies 18 01995 g004
Figure 5. Calculation flowcharts. (a) Flowchart of calculation of heat exchanger. (b) Calculation flowchart of rotating machinery.
Energies 18 01995 g005
Figure 6. Thermodynamic analyses at the design point: (a) Energy flow. (b) Exergy destructions. (c) Exergy flow.
Energies 18 01995 g006
Figure 7. Weather data of typical days. (a) Typical summer day. (b) Typical winter day.
Energies 18 01995 g007
Figure 8. The variations in thermodynamic performance with turbine inlet temperatures.
Energies 18 01995 g008
Figure 9. System performance on typical summer day: (a) Solar energy heat collection and storage. (b) Electricity demand and supply. (c) Cooling demand and supply. (d) Heating demand and supply.
Energies 18 01995 g009
Figure 10. System performance on typical winter day: (a) Solar energy heat collection and storage. (b) Electricity demands and supply. (c) Cooling demands and supply. (d) Heating demands and supply.
Energies 18 01995 g010
Figure 11. The system performance in a typical week in spring: (a) Heat amount. (b) Energy utilization efficiency and exergy efficiency.
Energies 18 01995 g011
Figure 12. Monthly performance of energy utilization efficiency and exergy efficiency.
Energies 18 01995 g012
Figure 13. Environmental performances of the system in different months: (a) Primary energy saving rate and pollutant emission reduction rate (b) CO2, SO2 and NOX emissions reduction rates.
Energies 18 01995 g013
Figure 14. Flow chart of the optimization program.
Energies 18 01995 g014
Figure 15. Variations in cost under different solar multiple: (a) Equipment initial investment and operation and maintenance costs. (b) Thermal energy storage tank, solar tower, and heliostat field.
Energies 18 01995 g015
Figure 16. Optimization of solar multiple.
Energies 18 01995 g016
Figure 17. The proportion of annual costs of CCHP system. (a) CCHP system operating costs (b) SCO2 cycle investment costs.
Energies 18 01995 g017
Figure 18. Annual thermodynamic and environmental analysis under different SM.
Energies 18 01995 g018
Table 1. Main parameters of building model.
ItemsValue
Number of above found floors6
Number of underground floors1
Total floor area/m211,345.29
Roof area/m21478
Number of people1239
Window area/m21214
Table 2. The cost function of CCHP system equipment investment.
ComponentsCost Function/$
Heat exchanger [28] C exh = 2500 U A
Turbine [28] C tur = 479.34 m tur , in 1 0.93 η tur 1 + exp 0.036 t tur , in 54.4 ln P R
Compressor [28] C com = 71.1 m com , in 1 0.92 η com P R ln P R
Thermal energy storage tank [29] C hst = 22 Q hst , max
Heliostat field [29] C helios = 156 A helios
Tower receiver [29] C tow = 100 Q heater
Table 3. Input parameters for model validation.
Decision and Performance ParametersRef.Input Value
MC inlet temperature313.15 K313.15 K
MC inlet pressure7.80 MPa7.80 MPa
HTR hot end inlet temperature807.05 K807.05 K
HTR hot end inlet pressure8.04 MPa8.04 MPa
HTR cold end inlet temperature548.05 K548.05 K
HTR cold end inlet pressure24.61 MPa24.61 MPa
Table 4. Validation results of recompression SCO2 Brayton cycle.
Decision and Performance ParametersRef.Present ModelError
MC outlet temperature399.95 K397.90 K0.51%
MC outlet pressure24.85 MPa24.18 MPa2.70%
HTR hot end outlet temperature560.95 K554.60 K1.13%
HTR hot end outlet pressure7.96 MPa7.97 MPa0.24%
HTR cold end outlet temperature775.55 K792.40 K2.17%
HTR cold end outlet pressure24.36 MPa24.46 MPa0.41%
Table 5. Main parameters of design condition.
ItemsValues
Heat absorption of the heater (kW)869
The total mass flow rate (kg/s)3.80
Turbine inlet temperature (K)820.80
Turbine inlet pressure (MPa)21
MC inlet temperature (K)307.80
MC inlet pressure (MPa)7.89
MC pressure ratio [24]2.64
RC pressure ratio [24]2.62
Turbine expansion ratio [24]2.59
Split ratio 10.68
Split ratio 20
Isentropic efficiency of main compressor (%) [24]83.85
Isentropic efficiency of recompressor (%) [24]80.20
Isentropic efficiency of turbine (%) [24]90
Disclaimer/Publisher’s Note: The statements, opinions and data contained in all publications are solely those of the individual author(s) and contributor(s) and not of MDPI and/or the editor(s). MDPI and/or the editor(s) disclaim responsibility for any injury to people or property resulting from any ideas, methods, instructions or products referred to in the content.

