Article

Coordinated Interaction Strategy of User-Side EV Charging Piles for Distribution Network Power Stability

1
Shenzhen Power Supply Bureau Co., Ltd., Shenzhen 515100, China
2
Department of Electrical Engineering, Shanghai Jiao Tong University, Shanghai 200240, China
*
Author to whom correspondence should be addressed.
Energies 2025, 18(8), 1944; https://doi.org/10.3390/en18081944
Submission received: 9 March 2025 / Revised: 27 March 2025 / Accepted: 1 April 2025 / Published: 10 April 2025
(This article belongs to the Topic Advances in Power Science and Technology, 2nd Edition)

Abstract

:
In response to the challenges of imbalanced economic efficiency of charging stations caused by disorderly charging of large-scale electric vehicles (EVs), rising electricity expenditure of users, and increased risk of stable operation of the power grid, this study designs a user-side vehicle pile resource interaction strategy considering source load clustering to enhance the economy and safety of electric vehicle energy management. Firstly, by constructing a dynamic traffic flow distribution network coupling architecture, a bidirectional interaction model between charging facilities and transportation/power systems is established to analyze the dynamic correlation between charging demand and road network status. Next, an EV charging and discharging electricity price response model is established to quantify the load regulation potential under different scenarios. Secondly, by combining urban transportation big data and prediction networks, high-precision inference of the spatiotemporal distribution of charging loads can be achieved. Then, a multidimensional optimization objective function covering operator revenue, user economy, and grid power quality is constructed, and a collaborative decision-making model is established. Finally, the IEEE69 node system is validated through joint simulation with actual urban areas, and the non-dominated sorting genetic algorithm II (NSGA-II) based on reference points is used for the solution. The results show that the optimization strategy proposed by NSGA-II can increase the operating revenue of charging stations by 33.43% while reducing user energy costs and grid voltage deviations by 18.9% and 68.89%, respectively.

1. Introduction

At present, the international community is facing a dual crisis of energy security and environmental degradation, exacerbated by the continuous escalation of carbon emissions and the depletion of limited fossil fuel reserves [1]. According to the International Energy Agency, the transportation sector accounts for approximately 24% of the global carbon dioxide emissions, with road vehicles accounting for over 75%. The industry’s heavy reliance on internal combustion engines makes it a key target for decarbonization efforts in the context of the Paris Agreement climate goals. In this context, scientific research is focused on the transition from traditional energy paradigms to renewable energy alternatives, including solar, wind, and hydrogen-based systems. However, the intermittency of these energy sources requires innovative energy storage and grid balancing solutions, and electric vehicles (EVs) will become a transformative force in energy transportation relationships [2,3,4].
The rapid electrification of fleets is catalyzing the transformation of the transportation industry. Electric vehicles not only represent a technological shift, but also a systematic reconfiguration of energy flow and infrastructure. Modern electric vehicles equipped with bidirectional charging functions can serve as mobile distributed energy storage systems, achieving vehicle-to-grid (V2G), vehicle-to-home, and vehicle-to-load functions [5,6,7,8,9]. During peak demand periods, aggregated electric vehicle batteries can inject up to 10–20 kW of electricity into the grid for each vehicle, effectively acting as a decentralized power bank. For example, a study by the National Renewable Energy Laboratory in 2023 showed that 1000 electric vehicles supporting V2G can reduce the off-peak load of urban distribution networks by 5–8%. On the contrary, intelligent charging algorithms optimize the utilization of off-peak power grids, and dynamic pricing models reduce charging costs by 15–30% while alleviating grid congestion [10].
In addition to grid stability, electric vehicles have also driven the structural transformation of the energy economy. By replacing 2.5 million barrels of oil per day, electrification reduces geopolitical dependence on fossil fuel exporting countries while achieving a closer integration of renewable energy generation. The inherent flexibility of electric vehicle charging loads allows for real-time alignment with renewable energy output fluctuations, which is crucial for the power grid [11]. For example, California’s “Smart Charging 2030” plan utilizes machine learning to synchronize electric vehicle charging with solar power generation curves, achieving a 40% reduction in grid storage demand.
Therefore, with the rapid growth of EV ownership and its unique driving characteristics and charging behavior patterns, it is bound to have a more profound impact on the overall operation status of the road and power grids. Given this, evaluating how to scientifically plan the layout of charging facilities, design and implement intelligent and environmentally friendly regulation strategies to maximize the energy storage potential of EVs, and optimize their charging and discharging behavior has become a major issue of concern and urgent need to be addressed by the academia, industry, and governments worldwide [12].
The controllable load and mobile energy storage characteristics of EVs enable them to participate in grid scheduling and improve the operational status of the grid. Reference [13] analyzed the fluctuation of power grid load and user costs and used the Q-learning optimization particle swarm algorithm to achieve optimal scheduling of electric vehicles. Work [14] considers external factors such as charging station revenue and various penalties as charging scheduling objectives and uses multi-agent deep reinforcement learning to solve the real-time charging problem of EVs. Work [15] proposes a real-time power allocation algorithm for EVs to improve scheduling accuracy, but this reference only considers the charging properties of EVs and does not take into account their power supply properties. Study [16] constructed a residential power grid to solve the curse of dimensionality in large-scale EV scheduling caused by deep learning. Research [17,18,19] optimized the charging and discharging behavior of EVs in the time dimension, improving the economy of the distribution network, but ignored the spatial characteristics of EVs in the road network. Reference [20] simplifies the planning problem by classifying EVs. Research [21] introduces a reward-and-punishment-based tiered carbon trading mechanism, considering the interaction between electricity and heat energy, to achieve EV scheduling while meeting low-carbon requirements. Most of the above literature only considers the benefits of the power grid and the characteristics of EVs as controllable loads and mobile energy storage while ignoring the unique properties of EVs as a means of transportation.
Work [22] proposed an EV charging and discharging scheduling strategy under the coupling of road network and power grid, considering the impact of dynamic traffic. Study [23] considers the comprehensive benefits of the power transportation coupling network and proposes an EV cluster regulation strategy.
In recent years, researchers have conducted extensive innovative research on charging control and scheduling for electric vehicles. Reference [24] constructed a dynamic road network model, which accurately simulated the driving path of vehicles by improving the Floyd algorithm. Combined with the electricity price response model, a master–slave game framework was established to achieve the multi-objective optimization of the benefits of the power grid, road network, and users. This study effectively reveals the spatiotemporal distribution characteristics of charging loads, providing theoretical support for scheduling strategy design. Work [25] introduces the Stackelberg game theory to construct a system optimization architecture and establishes a robust optimization model for the distribution network under uncertain photovoltaic output conditions, significantly reducing operating costs and improving the operational efficiency of charging stations. Study [26] further proposes a collaborative optimization architecture, which uses the Floyd algorithm to plan multi-objective optimal paths and utilizes back propagation neural network to achieve the rolling prediction of charging load and real-time dynamic adjustment of electricity prices. While reducing user charging costs, it effectively alleviates traffic congestion and grid voltage stability problems. The existing research often decouples traffic flow, power grid operation, and user behavior modeling, ignoring the deep correlation effects between the three.
Therefore, this article proposes a charging and discharging regulation strategy that considers vehicle–road network interactions and the spatiotemporal prediction of charging demand. Firstly, dynamic road network models and power grid models are established separately, with charging stations as the link to achieve the coupling relationship between the road network and power grid, and establish an EV charging and discharging electricity price response model. Secondly, based on the dynamic road network model and the travel characteristics of urban residents, the spatiotemporal distribution characteristics of EV charging load are predicted. Then, a multi-objective charging and discharging optimization regulation model is established, with charging station revenue, user charging costs, and voltage fluctuations as objective functions, to achieve a balance of interests among charging station operators, EV users, and the power grid. Finally, the method was applied to actual regions for simulation verification and solved using the non-dominated sorting genetic algorithm II (NSGA-II) based on reference points. The main contributions of this article are as follows:
  • High-precision charging load prediction: By constructing a complete travel chain model for EVs, dynamic simulation operation of vehicles in the road network can be achieved, and a spatiotemporal distribution prediction model that integrates dynamic road network state analysis can be developed to provide reliable data support for regulation strategies.
  • Systematically resolving conflicts among multiple stakeholders: Propose a multi-objective optimization framework aimed at balancing the interests of charging station operators, EV users, and the power grid, effectively alleviating the economic and safety contradictions caused by disorderly charging.
  • Road–Grid Deep Coupling Modeling: A co-simulation framework integrating dynamic road network and distribution grid models is developed, with charging stations as interactive nodes, to quantify the spatiotemporal correlations among traffic flow, user travel behavior, and grid load. This approach overcomes the limitations of traditional research that overemphasizes grid-side modeling while neglecting road network dynamics.
The structure of this article is as follows: Section 2 provides a detailed introduction to the “vehicle–road network” interaction-related models; Section 3 predicts the spatiotemporal distribution of charging load; Section 4 establishes a multi-objective charge and discharge optimization control model and solves it; Section 5 conducts simulation experiments and analyzes the performance of different algorithms; and Section 6 summarizes the work of this article.

2. “Vehicle–Road Network” Interaction-Related Modeling

2.1. Traffic Model

2.1.1. Road Network Topology

Guiyang (26°11′–26°55′ N, 106°07′–107°17′ E), situated in the karst-dominated mountainous terrain of southwestern China with 72.3% limestone landscapes, supports a population of 6.65 million through its multi-layered transportation network. The city functions as a strategic hub with 9042 km of highways (including the 125 km G6001 circumferential expressway), 149.13 km of metro lines, and 46 elevation-varied interchanges resolving topographic undulations up to 200 m. This infrastructure sustains connectivity across its 8043 km2 jurisdiction while addressing EV adoption pressures from 1.5 million registered vehicles. This study establishes a transportation network model for EV charging-discharging optimization in Guizhou Province city through three integrated phases. The methodology commenced with acquiring road network data from open-source geospatial platforms, where three critical road hierarchy categories were preserved through rigorous filtering to ensure structural fidelity. These datasets underwent spatial visualization and topological reconstruction using Quantum Geographic Information System (QGIS) [27], generating comprehensive network diagrams. Subsequently, an intersection numbering system was established to enable dynamic traffic modeling through standardized spatial referencing. Furthermore, web-crawled point of interest (POI) data, categorized following Baidu’s classification framework [28], were subjected to spatial clustering analysis, systematically classifying network nodes into five functional districts: residential zones, employment centers, commercial hubs, public service facilities, and green park areas. Figure 1 synthetically presents the derived network topology, node categorization, and strategically positioned charging infrastructure, collectively forming a multidimensional foundation for the subsequent EV energy management simulations that account for both spatial configurations and functional urban dynamics.

2.1.2. Related Traffic Data

Transportation data constitutes a multifaceted and heterogeneous domain encompassing multiple operational strata, with this investigation specifically addressing four critical dimensions: traffic flow metrics, vehicular trajectory patterns, public transit operational parameters, and road infrastructure status monitoring. The transportation model is constructed through the systematic integration of network topology with multi-source traffic datasets. However, the inherent complexity of such data—characterized by massive volume, spatiotemporal variability, and stochastic behavioral patterns—presents substantial challenges in simulating vehicular dynamics within evolving road networks. This paper uses real traffic congestion data as the core element. On this basis, data items related to traffic flow are further calculated and derived to describe the distribution of traffic flow as comprehensively as possible. The congestion index is shown in Figure 2.
To address these limitations, this research innovatively incorporates real-time traffic congestion intensity D as a pivotal modeling parameter. The congestion metric is mathematically defined as follows [29]:
D i t = i M L i ν i t i M L i ν F r e e , i t
where t denotes temporal discretization; i identifies a road segment i ; M represents the total road segments in the network; ν i t and ν F r e e , i t correspond to instantaneous vehicle speed and free-flow velocity, respectively; and L i denotes the unique identifier of the i -th road segment, which is used to distinguish different road segments in the model.
The congestion metrics are used to derive other traffic data such as speed, saturation, and volume for each road:
ν i t = i M L i D i t i M L i ν F r e e , i t
The roadway saturation index is mathematically formulated through a power law regression model:
( α i t ) k 2 + k 3 ( α i t ) 3 = k 1 ν F r e e , i t ν i t 1
Q i t = ν i t ν F r e e , i t C i
where k 1 , k 2 , and k 3 are regression parameters that vary depending on the road classification; α i t represents the saturation of the i th road segment at time t , specific values for these parameters can be found in the literature [30]; Q i t is the volume of traffic on the road; and C i indicates the basic capacity of the road.
To optimize driving routes for EVs, this study calculates road impedance using available traffic data and integrates it with road length to form road weights. Road impedance includes segment and node impedance, as detailed in [31]. The road weight is formulated as follows:
ω i t = β 1 ω i , 1 t + β 2 ω i , 2 t
where ω i t is the road weight; β 1 is the impedance weight; and β 2 is the length weight. This approach ensures accurate route planning by reflecting both traffic conditions and road characteristics.

2.2. Grid Model

To facilitate effective interaction among vehicles, roads, and power grids, an appropriate distribution network model based on a dynamic road network is essential [32]. This study uses the IEEE 69-node standard [33] model to analyze how EV charging behaviors impact grid load distribution, charging station revenue, and user costs. The jth node’s expression is:
A j , t = ( V j , t , P j , t , Q j , t )
where V j , t , P j , t , and Q j , t represent voltage, active power, and reactive power, respectively.

2.3. Coupled Model

In order to achieve effective integration among vehicles, roads, and power grids, this study puts forward a dynamic coupling model centered on charging stations and EVs. The aim of this model is to provide a theoretical foundation for the optimization of EV charging and discharging strategies [34]. The following coupling principles are, thus, introduced:
Capacity Constraint Coupling: Given the upper limit of grid node capacity, unrestricted load access can jeopardize grid safety [35]. Therefore, it is necessary to calculate the capacity margin after connecting the charging station to the grid node, avoiding power over-limit situations:
D l , j C = P j M a x P j B a s e + m a x 1 t 24 P l C h a r ( t ) P j M a x
where P j M a x is the maximum power that can be carried by a grid node; P j B a s e is defined as the base load of the grid node; and P l C h a r ( t ) denotes the charging power at a specified point in time t .
Coupling nodal significance: Grid nodes with higher loads are considered key hubs in power transmission, playing crucial roles in ensuring power quality and reliability. To maintain grid safety, high-load charging stations should avoid coupling with highly important grid nodes. To quantify importance, this study calculates the mean and standard deviation of the base load, categorizing grid nodes into high-, medium-, and low-load categories.
D j = H i g h , P j B a s e > μ P B a s e + σ P B a s e M i d d l e ,   ( μ P B a s e + σ P B a s e ) P j B a s e > 0 L o w , P j B a s e = 0
where μ P B a s e and σ P B a s e represent the average value and the standard deviation measure of the fundamental load of the power grid, respectively. Analogously, the charging stations are also categorized into three distinct tiers of significance.

2.4. Tariff Response Model

In the context of effective charging regulation, EV users are guided to select charging times that are reasonably distributed over time-sharing tariffs. This approach has been demonstrated to be an effective method of balancing the load on charging stations. The present study introduces a function that reflects the sensitivity of users to changes in electricity prices Φ C ( t ) . This function is utilized to quantify the user’s responsiveness to variations in electricity prices.
The expression of user charging responsiveness Φ C ( t ) is as follows:
Φ C ( t ) = Δ p l , m C ( t ) p s t a r t C ( t ) p s a t C ( t ) p s t a r t C ( t )
where the definition of Δ p l , m C ( t ) is given as the charging tariff difference between the lth charging station and the mth charging station in time period t; the symbols p s t a r t C ( t ) and p s a t C ( t ) denote the tariff initiation threshold and the saturation threshold of EV users’ response to charging demand in time period t , respectively. When Δ p l , m C ( t ) < p s t a r t C ( t ) , the user exhibits a lack of responsiveness, signifying that Φ C ( t ) = 0 ; when p s t a r t C ( t ) Δ p l , m C ( t ) p s a t C ( t ) , the customer response curve exhibits an upward trend; when Δ p l , m C ( t ) > p s t a r t C ( t ) , it indicates full responsiveness and Φ C ( t ) = 1 .
In circumstances where the maximum charging rate coincides with the maximum grid demand, the strategic allocation of power-rich electric vehicles to act as sources of reverse power to the grid can be a viable solution to alleviate grid pressure. This approach enables EV users to benefit from optimized energy management. The present study proposes a novel methodology for quantifying the discharge responsiveness of users under varied tariff structures. This methodology incorporates a novel function that reflects the sensitivity of users to fluctuations in discharge prices, thereby providing a more nuanced understanding of user behaviors and facilitating effective decision-making processes in energy management.
Φ D ( t ) = Δ p l , m D ( t ) p s t a r t D ( t ) p s a t D ( t ) p s t a r t D ( t )
where the user’s response degree Φ D ( t ) to the discharge price difference can be defined as follows: when the discharge price difference Δ p l , m D ( t ) between the lth and mth charging stations during time period t is less than the start threshold p s t a r t D ( t ) , the user does not respond, Φ D ( t ) = 0 ; when p s t a r t D ( t ) Δ p l , m D ( t ) p s a t D ( t ) , the user’s response degree increases linearly with the price difference; when Δ p l , m D ( t ) > p s a t D ( t ) , the user responds completely, Φ D ( t ) = 1 ; p s t a r t D ( t ) and p s a t D ( t ) represent the start threshold and saturation threshold for EV users’ response to discharge demand during time period t, respectively. This model effectively reflects the user’s response behavior under different discharge price differences, providing a basis for achieving orderly regulation.

3. Charging Load Spatiotemporal Distribution Forecasting

3.1. Analysis of EV Driving Characteristics

The driving characteristics of EVs have been shown to significantly influence the spatiotemporal distribution of charging demand. In this context, the present paper aims to delve into key factors such as initial driving time, starting location, initial SOC, parking duration, destination, route selection, and daily driving distance. By constructing a comprehensive travel chain model for EVs, it is possible to achieve dynamic simulation of vehicle operations within the road network. Utilizing this methodological approach furnishes a robust data foundation for the accurate prediction of the spatiotemporal distribution of charging demand. An investigation of the National Household Travel Survey (NHTS) data from 2009 illuminates the distributions of various driving characteristics, as depicted in Table 1.
The present study employs a hierarchical EV travel model. Firstly, the uniform distribution is replaced by a traffic survey-based origin clustering in urban functional zones (residential, commercial, and industrial areas). Secondly, spatiotemporal decision making is established through dynamic probability models integrating historical patterns (83% weekday morning departures from residential zones) and real-time traffic. Thirdly, charging demand prediction is enhanced via optimized travel chain simulations. The proposed framework is designed to strike a balance between accuracy and computational efficiency by employing structured probability mechanisms.
The assumption underlying this study is that the initial locations of EVs are distributed uniformly across all the regions. The selection of destination is determined by the starting location and initial driving time. To more reasonably determine the destination for each trip segment, a travel probability matrix is introduced, thereby refining the selection of destinations.

3.2. Energy Consumption Model Considering Environmental Temperature

The energy consumption of EVs is primarily determined by the power requirements of tires and air conditioning (AC). The power consumption of tires can be expressed as follows:
P t i r e ( v ) = m E V g f r + 1 2 ρ A f r o n t C d ( ν i t ) 2 ν i t
where P t i r e ( v ) represents the tire power when the EV is traveling at speed ν i t ; m E V and g denote the mass of EV and gravitational acceleration, respectively; f r is the rolling resistance coefficient; and ρ , A f r o n t , and C d represent air density, the frontal area of EV, and the aerodynamic drag coefficient, respectively.
AC start–stop probability model is referenced from the literature [36]. AC power can be represented as follows:
P A C ( T ) = P c o o l ( T ) , T > T c o o l , m i n P h e a t ( T ) , T < T h e a t , m i n 0 , otherwise
P c o o l T = P u n i t , c o o l K o p e n T P h e a t ( T ) = P u n i t , h e a t K o p e n ( T )
where P c o o l ( T ) and P h e a t ( T ) represent the cooling and heating powers of the air conditioner, respectively; T , T c o o l , m i n , and T h e a t , m i n denote environmental temperature, the minimum threshold for starting cooling and heating, respectively; P u n i t , c o o l and P u n i t , h e a t are the unit powers for cooling and heating, respectively; K o p e n ( T ) is the start–stop probability of the air conditioner. The average temperature of a certain city in 2024 is shown in Figure 3.
As demonstrated in Figure 3, it illustrates that the combined average has been chosen as the reference data below, taking into account the seasonal and weather variation requirements of real urban situations.
Therefore, the total energy consumption model for EV can be expressed as follows:
Δ S O C i = ( P c o o l + P h e a t + P t i r e ) t D C B η B
where t D represents the driving time; and C B and η B denote the battery capacity and battery efficiency, respectively. By employing the aforementioned models, we can comprehensively consider the energy consumption of EVs under different environmental temperatures, thereby enabling more accurate predictions of their charging demand’s spatiotemporal distribution.

4. Multi-Objective Charging/Discharging Optimization Control Model

The coordinated operation of EV involves complex stakeholder interests and practical operational constraints. To achieve synergistic optimization among EV users, charging stations, and power grids, this paper proposes a multi-objective optimization framework considering three critical objectives: minimizing user charging costs, maximizing station revenues, and regulating voltage fluctuations in the grid system.

4.1. Objective Functions

4.1.1. User Charging Cost

Total user expenses comprise two components:
min P 1 = f = 1 n C p C , l ( t ) Q g r i d , C f ( t ) + t f d e l a y λ t i m e
where n C is defined as the total number of EVs charged; p C , l ( t ) is the charging tariff of the lth charging station during the time period t ; P f denotes the charging power and charging duration of the fth EV; t f is charging duration of the fth EV; Q g r i d , C f ( t ) is the result obtained by multiplying the two; t f d e l a y represents travel time delay for the fth EV due to regulation; and λ t i m e is the time cost coefficient.

4.1.2. Charging Station Revenue Model

The objective function of the charging station is made up of two components: (1) the charging revenue between the charging point and the EV and (2) the revenue of the charging point from selling electricity between EV discharge and the grid.
max P 2 = f = 1 n C p C , l ( t ) p s e l l ( t ) Q g r i d , C f ( t ) + f = 1 n D p b u y ( t ) p D , l ( t ) Q g r i d , D f ( t )
where p s e l l ( t ) represents the grid selling price during time t ; Q g r i d , C f ( t ) is the quantity of energy that is sold to the grid by charging stations; p b u y ( t ) denotes grid purchasing price during time t ; and Q g r i d , D f ( t ) is defined as energy purchased from the grid by discharging stations.

4.1.3. Constraints

To ensure compliance with market regulations, the permitted charging prices at each station should stay within the administratively—set limits. Specifically, for grid-connected V2G systems, the pricing of bidirectional energy flow adheres to these constraints.
The following formulas precisely define these price constraints:
p C , l , m i n t p C , l ( t ) p C , l , m a x t
p D , l , m i n t p D , l ( t ) p D , l , m a x t
0 P l t P m a x E V C S
f = 1 n C Q g r i d , C f ( t ) = f = 1 n D Q g r i d , D f ( t )
V j m i n V j V j m a x
where real-time charging price p C , l ( t ) at station l during period t , bounded by p C , l , m i n t and p C , l , m a x t —administrative price limits ensuring regulatory compliance and preventing energy market distortions; similarly; p D , l ( t ) denotes the discharge price for V2G services, constrained within p D , l , m i n t and p D , l , m a x t to balance grid demand–supply dynamics while incentivizing EV-user participation in energy arbitrage; P l t denotes the active charging power at station l during time period t , constrained by P m a x E V C S —the maximum rated capacity determined by charger infrastructure and available EV; V j represents the measured voltage at grid node j during time t ; Q g r i d , C f and Q g r i d , D f , respectively, denote the energy exported to and imported from the grid by charging stations during time t , with Q g r i d , C f ( t ) quantifying V2G discharge capacity and user participation rate, while Q g r i d , D f ( t ) captures the energy procurement required to balance net energy flows and ensure grid stability through demand-response mechanisms [37].
The multi-objective charge/discharge optimization and regulation model proposed in this paper is a non-linear optimization problem, the solution to which is not possible using conventional methods. Therefore, the NSGA-II algorithm, which has strong convergence ability and good optimization searching ability, is used in this paper to solve the model, and the specific procedure is referred to in [38].
The power balance equation, which includes wind and solar power outputs, is given by the following:
j = 1 n G r i d P j P j L o s s = j = 1 n G r i d P j B a s e P j C + P j D + P j W i n d + P j S o l a r
where P j represents the active power at node j ; P j L o s s denotes the active power loss; and P j B a s e , P j C , and P j D represent the base load, charging power, and discharging power at node j , respectively; additionally, P j W i n d is the wind power output, reflecting contributions from installed wind turbines based on meteorological data and turbine performance; while P j S o l a r is the solar power output from photovoltaic panels, influenced by solar irradiance, panel efficiency, and shading effects.
In multi-objective optimization problems, it is impossible to find a solution that satisfies all the objective functions simultaneously; only the non-dominated solution set or Pareto solution set can be found. Moreover, the subjective selection of the optimal solution can result in a lack of objectivity. EV charge/discharge optimization and regulation process is illustrated in Figure 4.

4.2. Model Solution

The multi-objective charge/discharge optimization and regulation model developed in this study constitutes a non-linear programming problem that cannot be effectively addressed by conventional optimization techniques. To overcome this computational challenge, we employ NSGA-II methodology, recognized for its superior convergence characteristics and enhanced capability in navigating high-dimensional Pareto frontiers.
In multi-objective optimization frameworks, the inherent conflict between competing objectives necessitates the identification of Pareto-optimal solutions rather than a single optimal solution [39]. To mitigate subjective biases inherent in manual solution selection from the obtained Pareto set, we implement an enhanced compromise solution selection mechanism based on the modified gray target theory. This data-driven approach enables the objective quantification of solution quality through distance metric analysis within the objective space. The integrated optimization framework, encompassing both NSGA-II-based solution generation and the gray target-assisted decision-making process, is systematically illustrated in Figure 4. And the pseudocode of NSGA-II is showed in Table 2. The procedural architecture ensures methodological rigor while maintaining computational tractability for real-world EV charge/discharge management applications.
The recent advancements in heuristic-based scheduling solutions have demonstrated significant innovations in algorithmic design and application adaptability. Table 3 shows some heuristic algorithms in recent years and an evaluation of their computational efficiency and diversity of solutions. We choose NSGA-II because we find that it has higher computational efficiency and a richer diversity of solutions (it is not easy to fall into local optimality). In the subsequent example analysis, it is compared with similar algorithms (MOPSO and MOSPO), and NSGA-II has a better optimization effect in this work.

5. Case Studies

5.1. Relevant Settings

The load data of the power grid in this paper adopts the base load of the IEEE 69-node distribution system. In 2023, BYD led domestic sales, up 50.3%, capturing over a third of the market [43]. This makes it a representative case for EV charging behavior research. It is assumed that 10,000 EVs were introduced into the control area, with the EV model being BYD E6. The relevant parameters are shown in Table 4. To achieve the coordinated optimization of EV charging and power grid operation, this study employed NSGA-II as the optimal approach. This algorithm is known for its strong convergence ability and optimization search capability, making it effective in handling multi-objective optimization problems. In addition to this, this study also introduced some heuristic methods, such as the multi-objective particle swarm optimization (MOPSO) algorithm and multi-objective stochastic paint optimization (MOSPO) algorithm, to further verify and compare the optimization results. When applying the NSGA-II algorithm and two comparative algorithms, the population size was set to 100 and the maximum number of iterations was set to 200, respectively. The other algorithm parameters are shown in Table 5. The simulation environment of this paper is based on MATLAB R2023a, with a computer configuration of Intel i5-12500 and 64 GB of RAM.

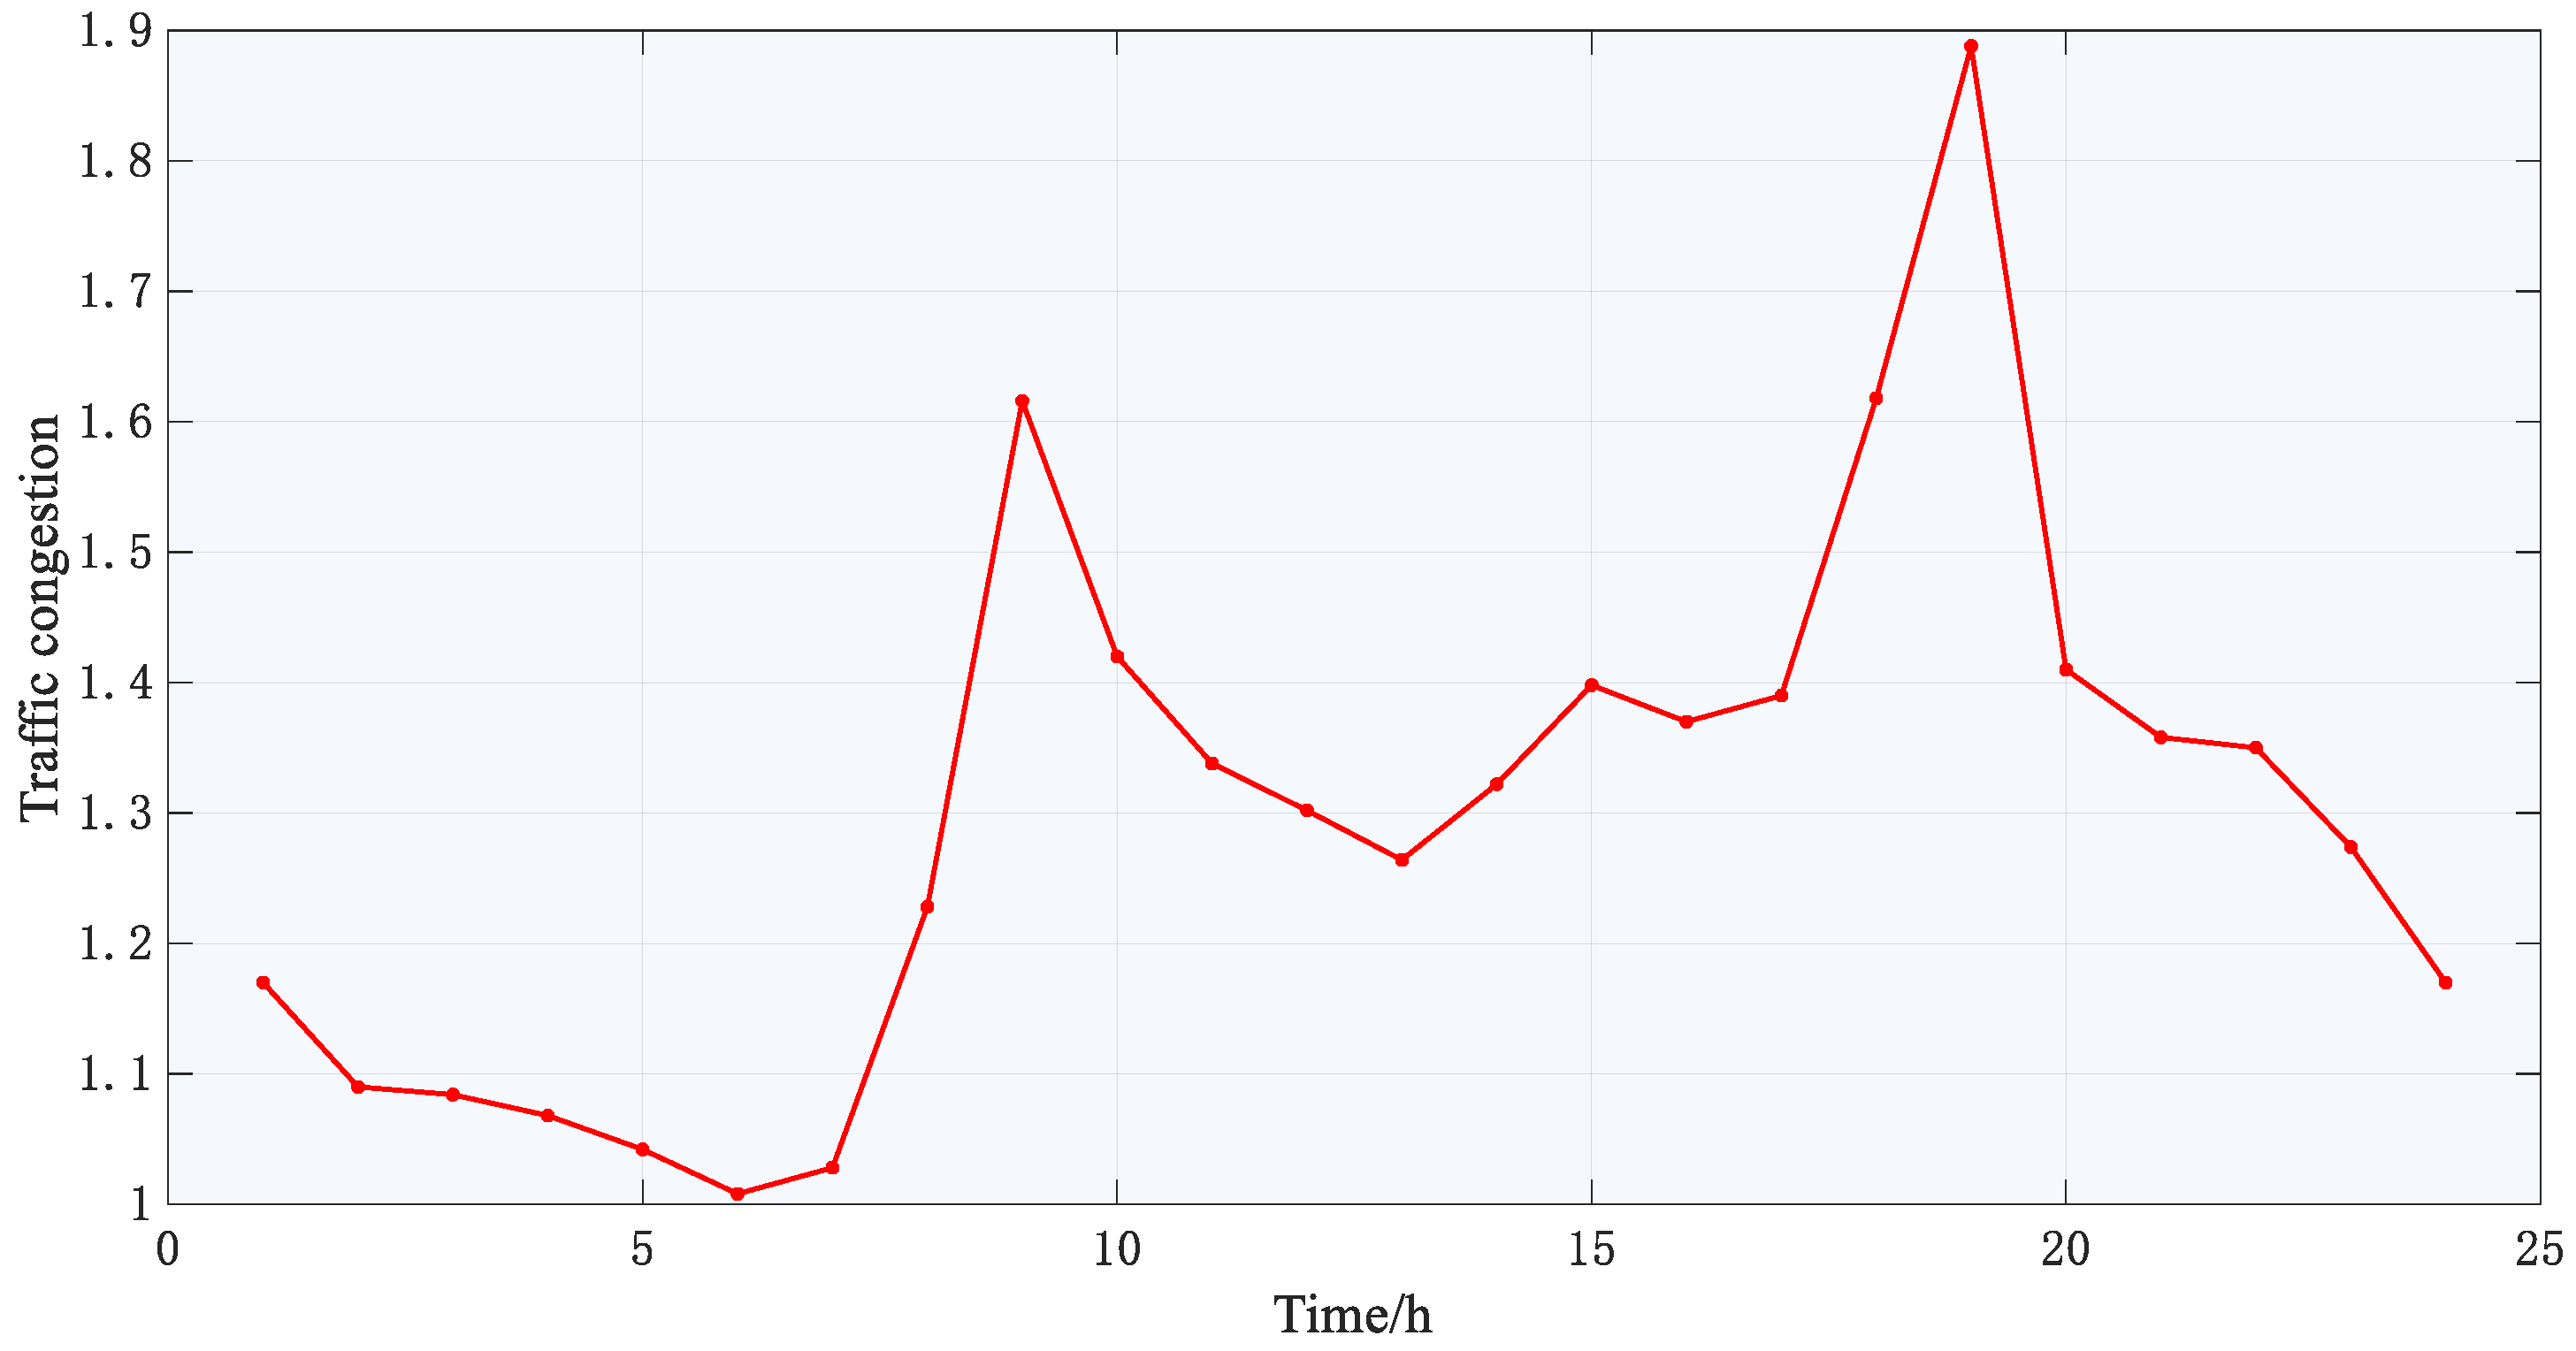
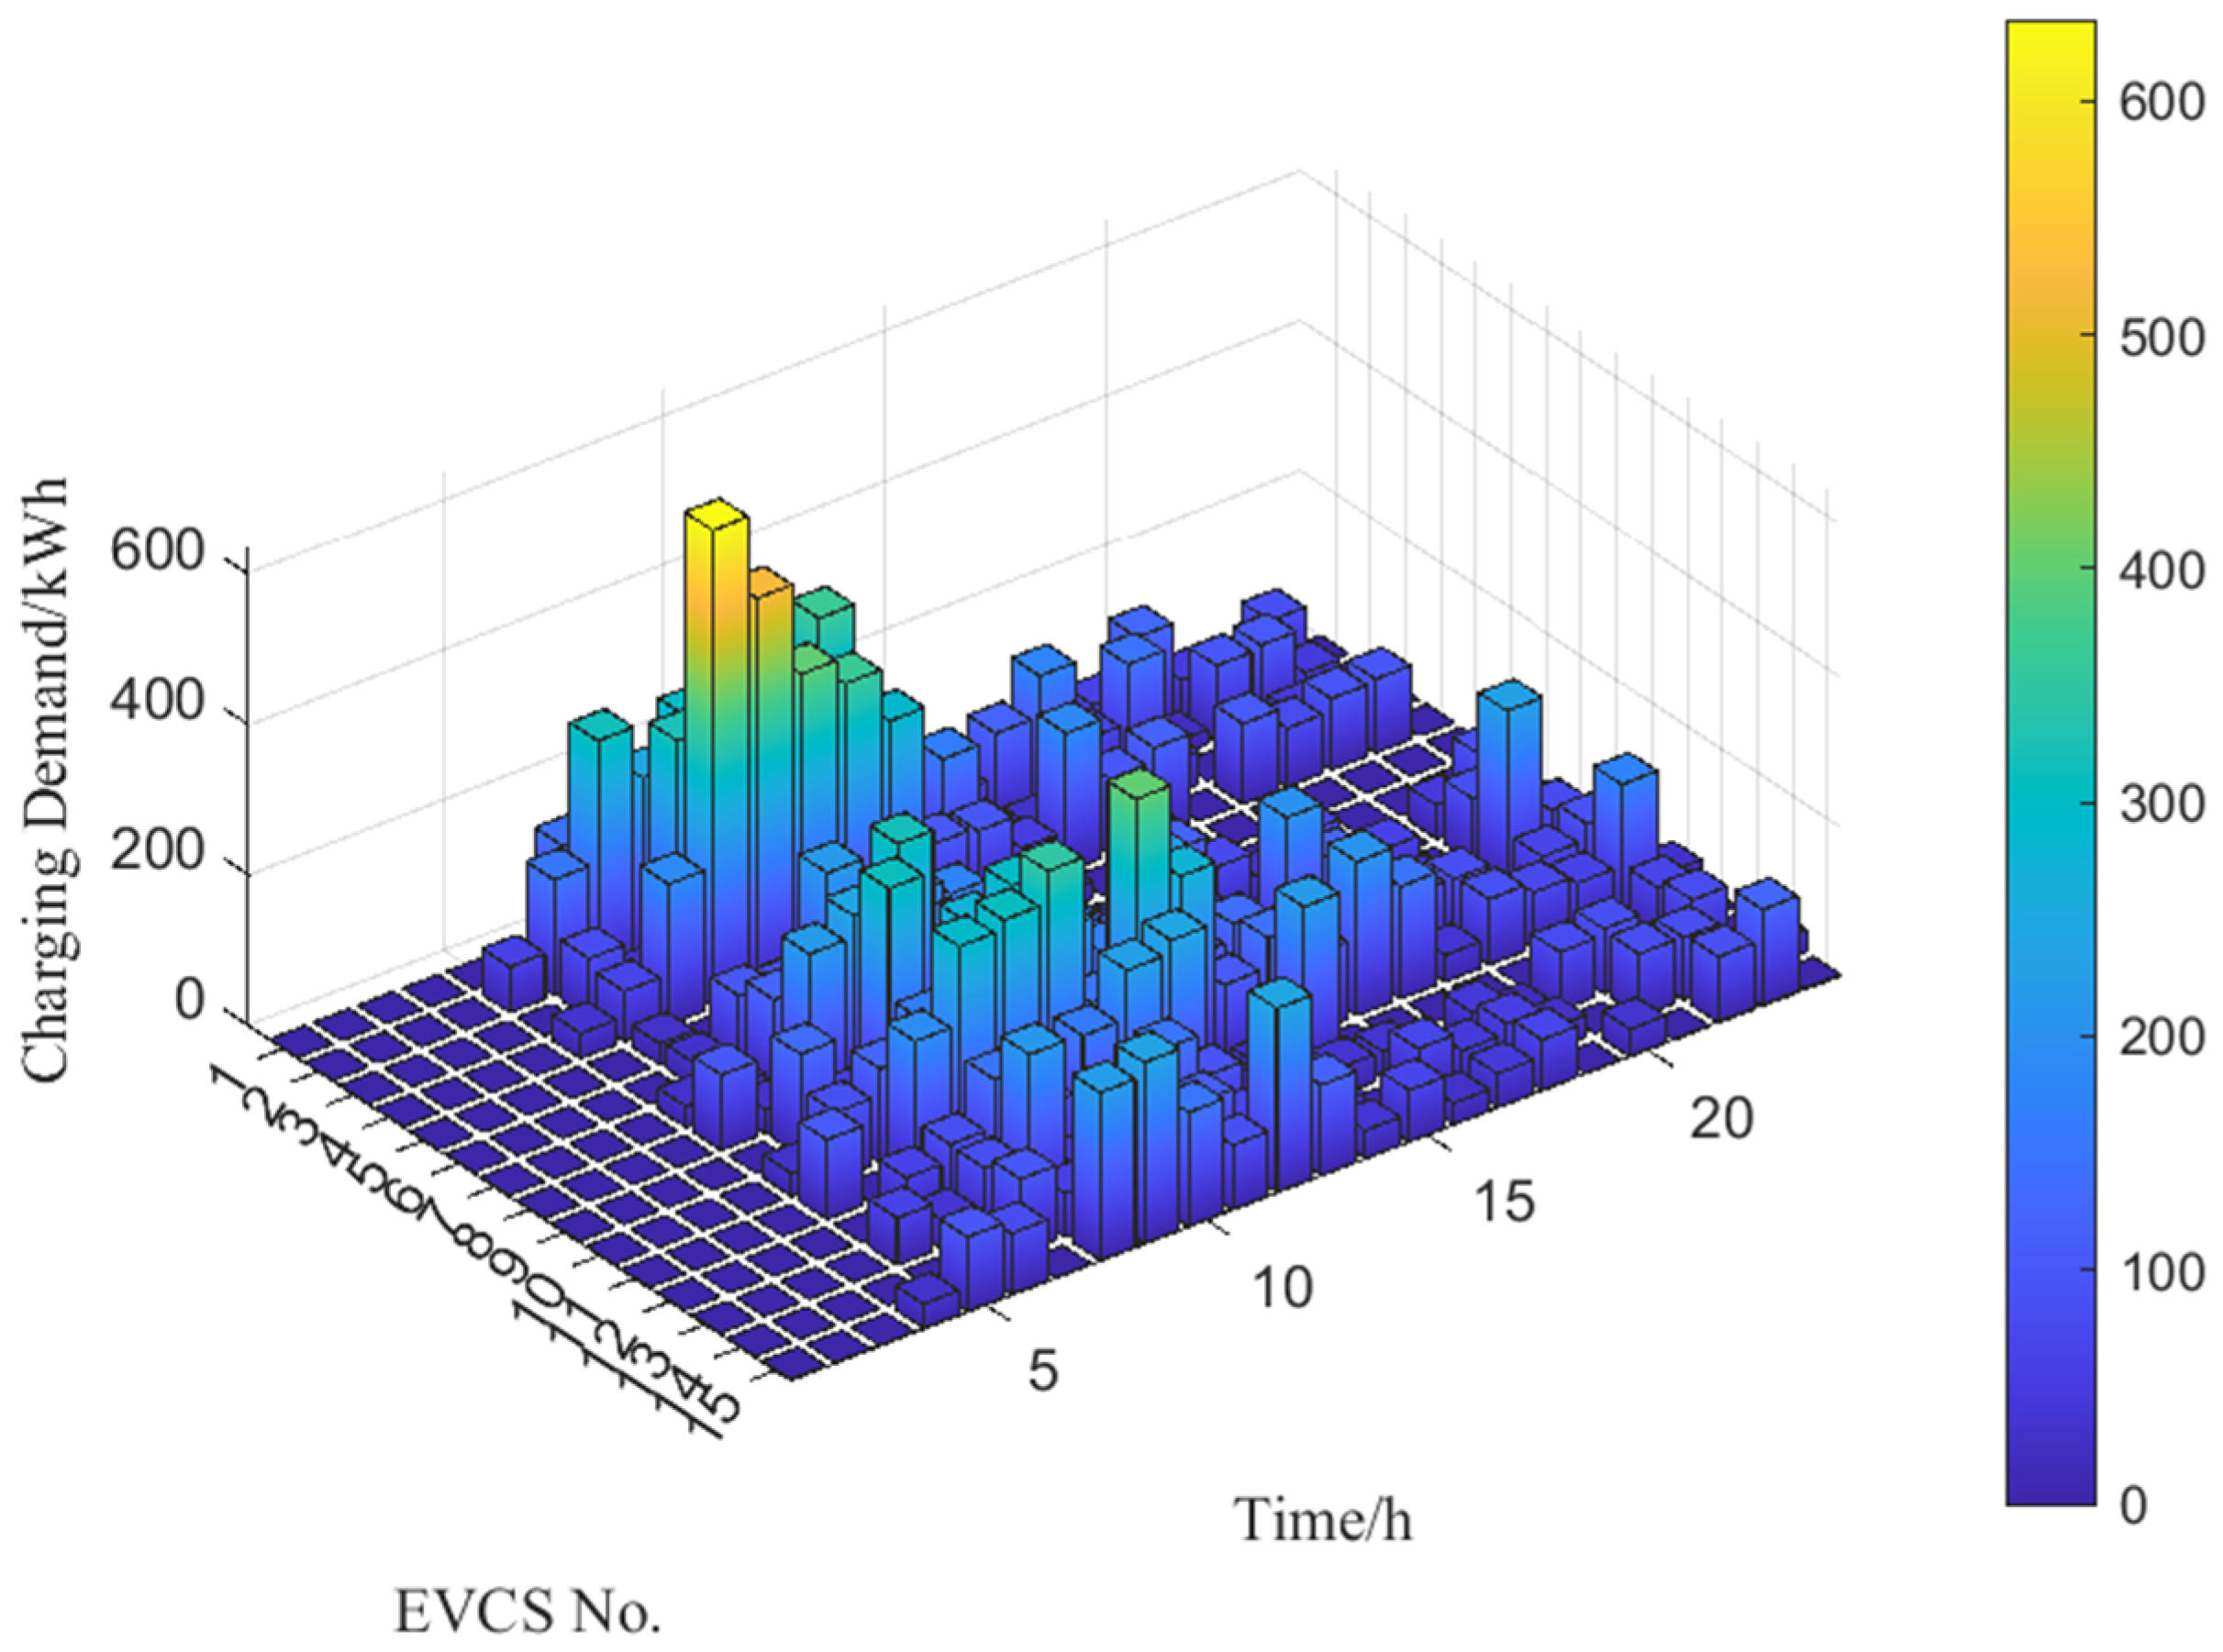
5.2. Analysis of Prediction Results

Based on the coupled model, the locations of the charging stations connected to the IEEE 69-node distribution system are selected, as shown in Figure 5.
Figure 6 illustrates the temporal and spatial distribution of charging demand at the road network nodes. In terms of time, the charging demand in this area generally exhibits a bimodal structure, which aligns with the commuting patterns of urban residents. Node #85 at 8:00 and node #44 and node #80 at 10:00 all show significant charging peaks. Combined with Figure 1, it can be observed that node #85 belongs to a public service area, while node #44 and node #80 are located in work zones. These two types of areas are typically destinations for residents’ work, hence the high charging demand during these periods. Node #19 and node #84 show pronounced charging peaks at 23:00, both of which are residential areas, consistent with residents’ travel characteristics.
Figure 7 is a schematic diagram of the charging load after the road network charging demand is aggregated to the charging stations. It can be seen from Figure 7 that the temporal distribution of the charging station load is consistent with the temporal distribution of the road network charging demand, generally presenting a bimodal structure. Charging stations #2 and charging stations #8 have more prominent charging loads during the period of 7:00–12:00. Combined with Figure 1, it can be observed that these two charging stations are located near work zones and public service areas, and charging station #2 is situated on a major traffic route, thus resulting in a significant charging load.

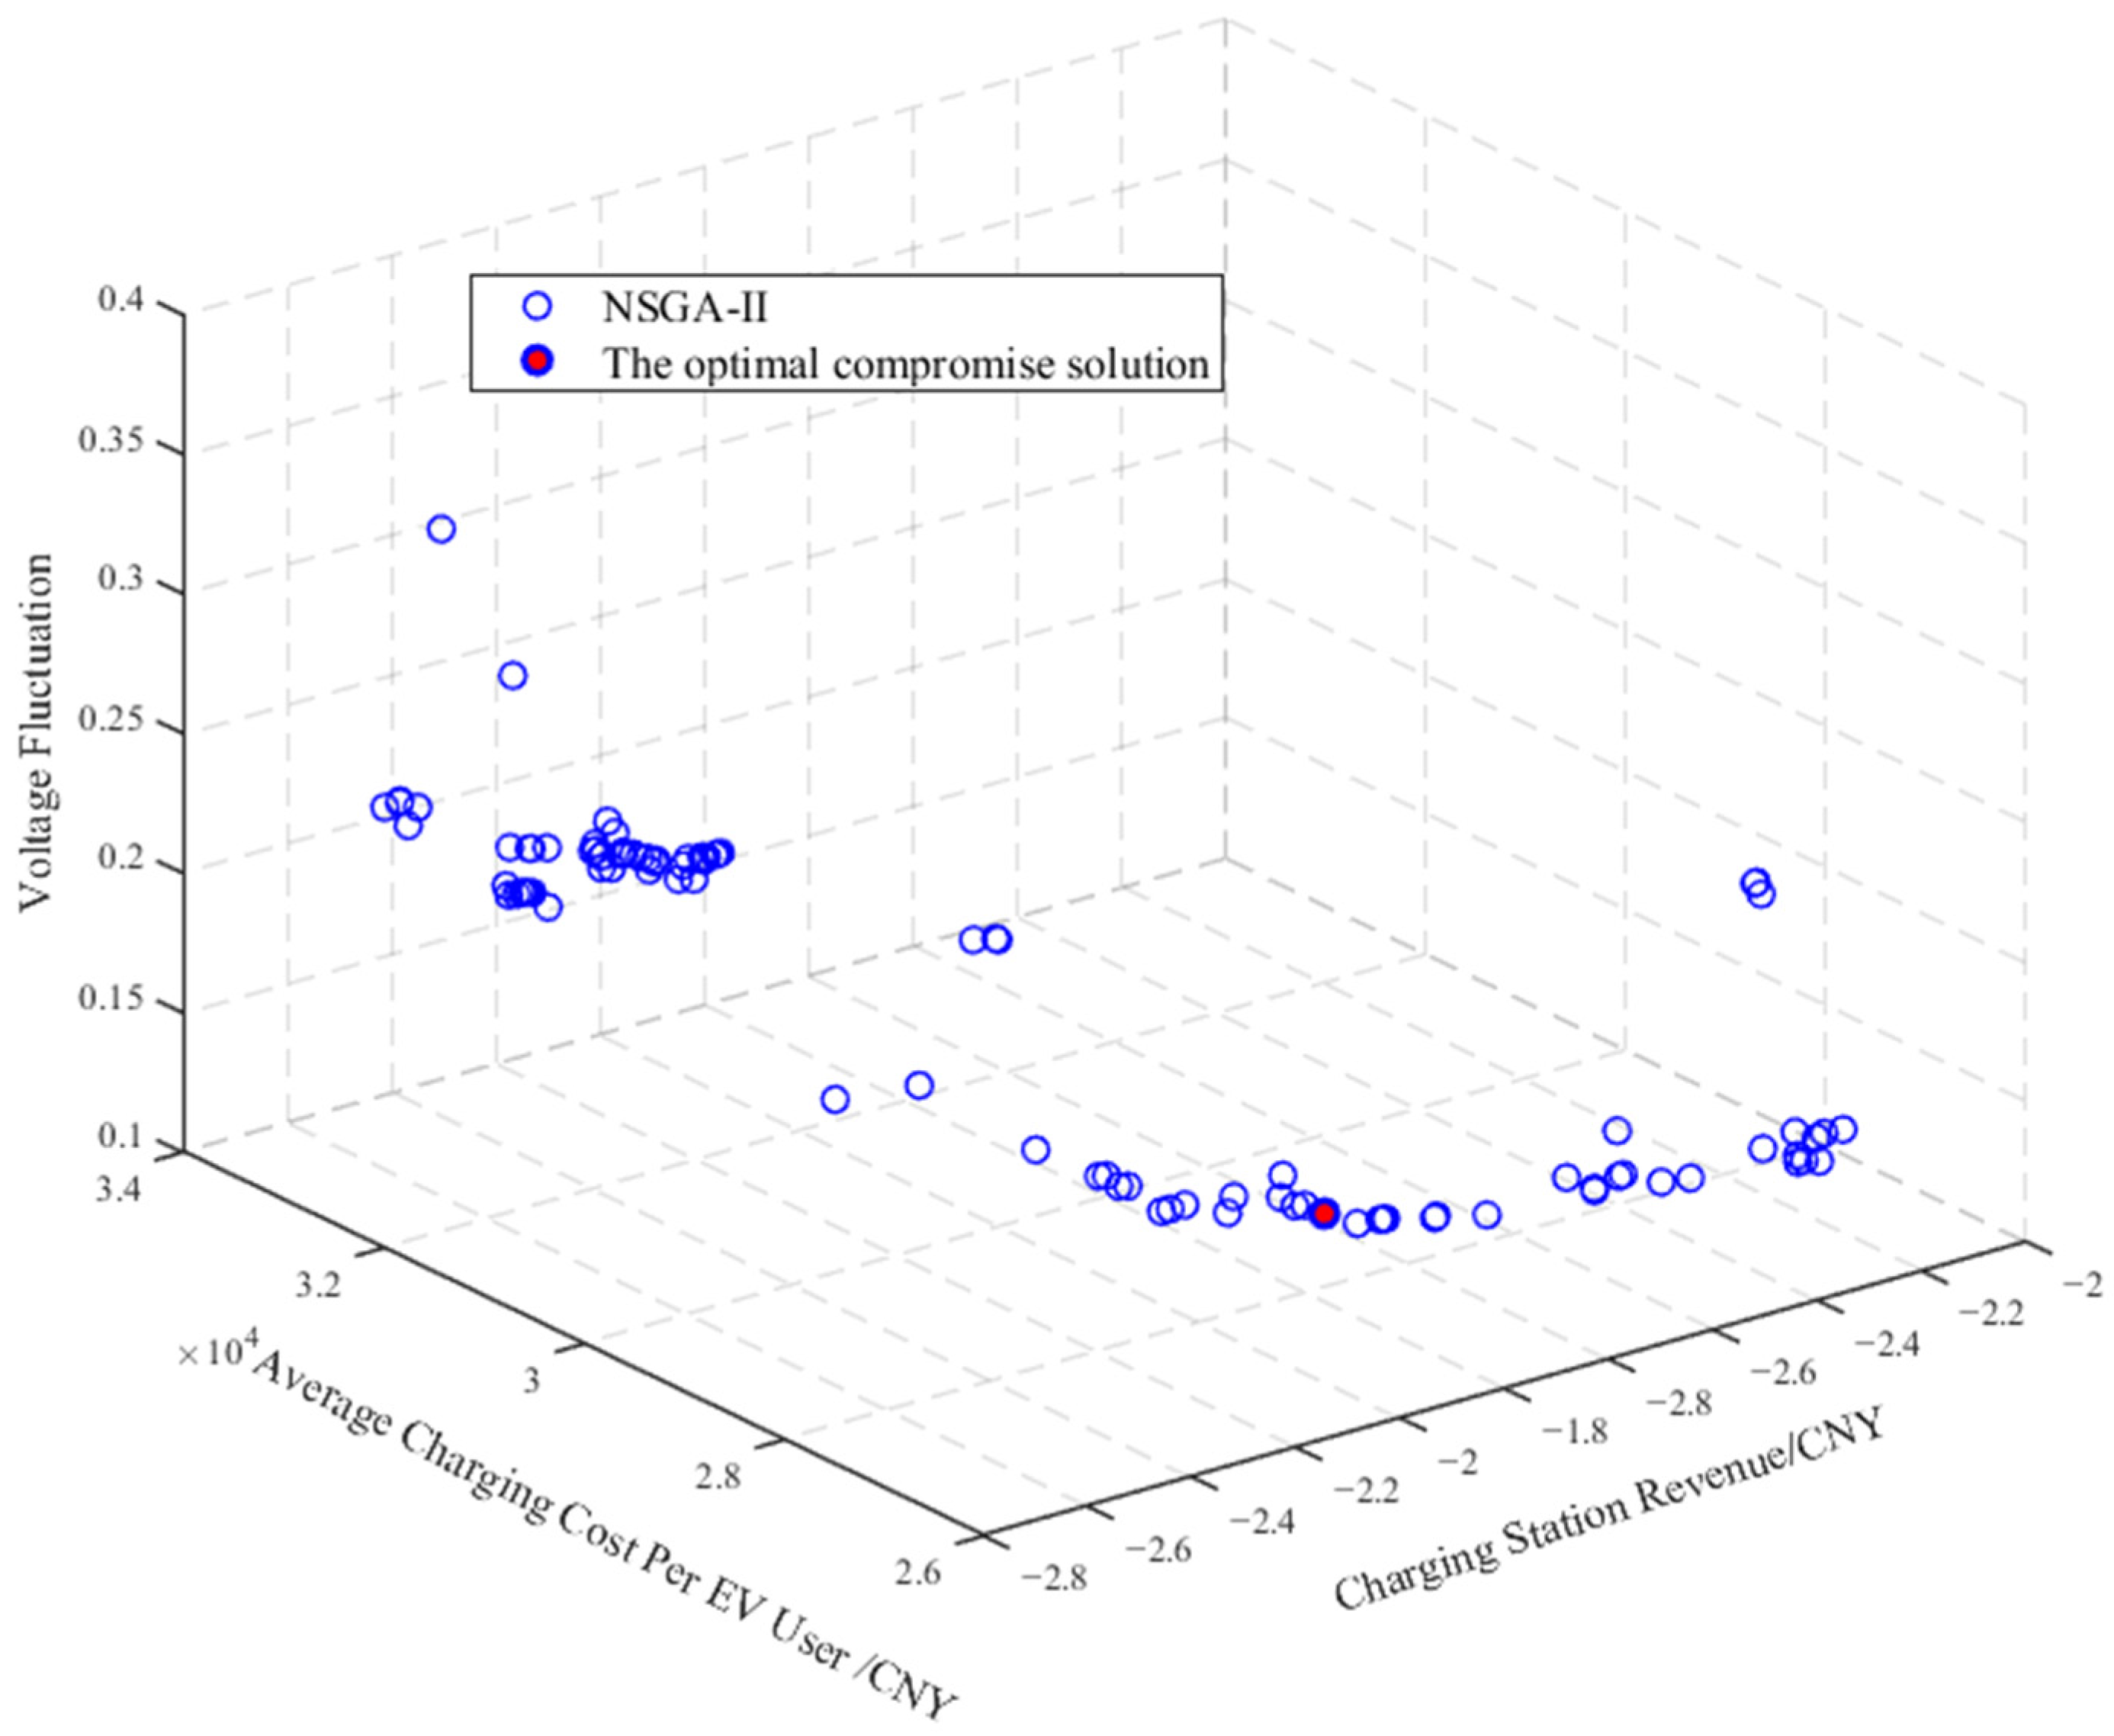
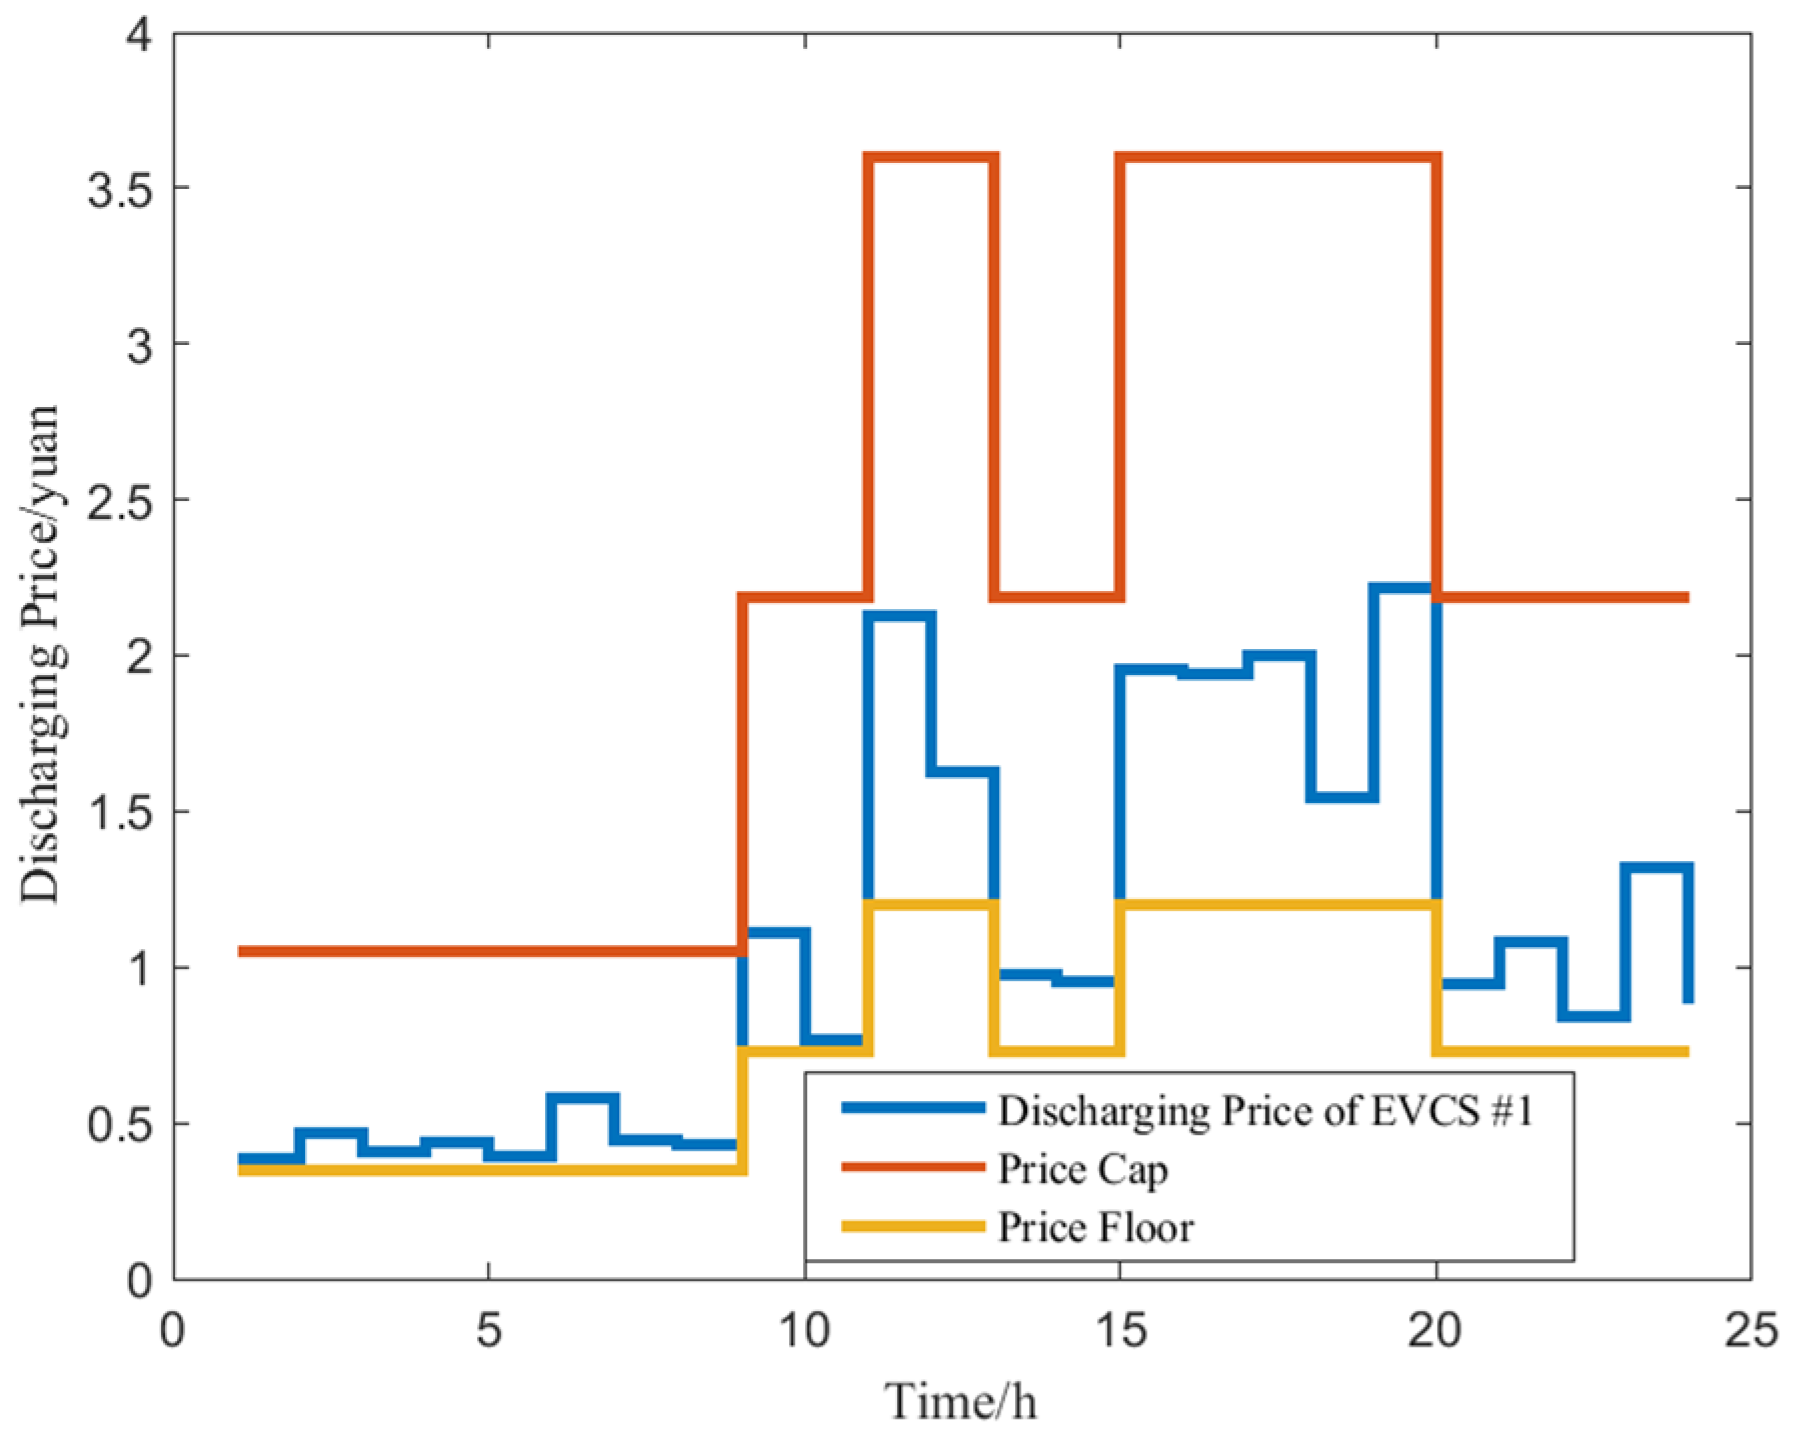
5.3. Analysis of Optimization Results

Figure 8 illustrates the trade-offs among three key metrics in charging station operations: charging station revenue, voltage fluctuation, and average charging cost per EV user. The blue circles represent the Pareto front solutions found by the NSGA-II algorithm, showing the compromises between these three metrics in different solutions. The red diamond identifies the optimal compromise solution, achieving the best balance between increasing charging station revenue, reducing voltage fluctuations, and lowering user charging costs. The graph demonstrates that NSGA-II can effectively find solutions among multiple conflicting objectives. It should be noted that the values in Figure 8 are the optimization results, while the final results in Table 6 are the calculated values.
Table 6 presents the comparison between the optimization results of various algorithms and the initial state. It can be clearly observed from Table 6 that NSGA-II and MOSPO have a significant impact on enhancing the economic benefits of charging stations. Specifically, after applying the NSGA-II algorithm, the revenue of the charging station reaches CNY 23,195.97, an increase of CNY 5811.83 compared to the initial state, achieving a remarkable growth of 33.43%. Similarly, MOSPO also brings a 14.62% increase in revenue. However, it is worth noting that the increase in charging station revenue often conflicts with users’ charging costs. In the optimization results of the MOSPO algorithm, despite a significant increase in charging station revenue, the users’ charging cost jumps to CNY 87.43, which undoubtedly undermines the economic interests of users. The same applies to the optimization results of the MOPSO algorithm, where although the users’ charging cost is reduced to CNY 44.52 compared to the initial state, the charging station revenue decreases by 17.06%. In contrast, the NSGA-II algorithm demonstrates a more balanced performance during the optimization process. This algorithm not only successfully enhances the charging station revenue but also effectively reduces users’ charging costs. Specifically, the charging cost using the NSGA-II algorithm is CNY 46.07, which is 18.78% lower than that of uncoordinated charging. This result alleviates the economic conflict between the charging station and users to some extent.
Moreover, all three algorithms consider the application of V2G technology during the optimization process. The introduction of this technology significantly reduces the voltage fluctuations in the power grid. Among them, the NSGA-II algorithm stands out, with voltage fluctuations reduced to 0.14, a decrease of 68.89%. The application of V2G technology not only helps stabilize the power grid but also provides additional revenue opportunities for EV users.
In summary, the NSGA-II algorithm demonstrates advantages over the other two algorithms in multiple aspects, including enhancing charging station revenue, reducing user charging costs, minimizing voltage fluctuations, and generating discharging revenue for EV users. The optimization achieved by this algorithm realizes a win-win situation for charging stations, users, and the power grid, providing a valuable reference for the optimization of EV charging strategies.
Figure 9 and Figure 10 show the charging and discharging electricity prices of the charging stations, respectively. The overall charging and discharging prices of each charging station exhibit a bimodal structure over time.
Electric vehicle charging prices are indeed generally low in China. This is because the government subsidizes and regulates charging facility prices to promote electric vehicle adoption. Market research indicates that private fast-charging stations charge about CNY 1.6–1.8 per kWh during peak hours [44], roughly equivalent to USD 0.2. Branded stations like ZEEKER and Li Auto super-charging stations have similar price ranges. For instance, ZEEKER charges around CNY 1.25 per kWh at peak times [45]. Tesla’s super-charging stations charge CNY 1.45–2.4 per kWh [46]. These prices show that electric vehicle charging in China is relatively inexpensive due to market and policy factors. Despite the low prices, they still influence users’ charging behavior, as users consider price differences when choosing charging times and locations, especially when there are price variations among stations.
Figure 11 and Figure 12 present the specific charging and discharging prices of charging station #1, respectively. Combined with Figure 7, it can be observed that during peak charging demand periods, the charging station increases the charging price to enhance its own revenue. However, to ensure user interest, the charging price does not remain at a high level continuously. To reduce voltage fluctuations, the charging station increases the discharging price during periods of high grid load, encouraging users to actively participate in coordinated discharging. Additionally, during low-load periods, increasing the discharging price can effectively increase the revenue of both the charging station and users.
Figure 13 shows the voltage levels after optimization by various algorithms. It can be observed from Figure 13 that the optimization results of all three algorithms effectively improve the voltage levels of the power grid. Among them, the voltage level optimized by NSGA-II exhibits greater volatility at 10:00, while it remains more stable than the other algorithms at other times, which is consistent with the results in Table 6.

6. Conclusions

To fully tap into the potential of EVs as dynamic loads and distributed power sources, this study proposes a user-side vehicle pile resource interaction strategy based on source load clustering, which achieves the multi-objective balance of charging station revenue, user economy, and grid power quality through collaborative optimization of EV charging and discharging behavior. Based on the dynamic transportation distribution network coupling architecture, a bidirectional interaction model is constructed, combined with urban commuting feature big data and deep spatiotemporal prediction network to generate high-precision charging load distribution data, and a V2G technology-based electricity price response model is established to quantify the potential for load regulation. The simulation of coupling between the IEEE69 node system and the actual urban road network and power grid shows the following:
(1) The NSGA-II algorithm achieved a 33.43% increase in revenue for charging stations, significantly better than MOPSO (−17.06%) and MOSPO (14.62%);
(2) The energy consumption cost of users decreased by 18.86% and 21.51% under NSGA-II and MOPSO, respectively, while MOSPO increased its cost by 54.14% due to excessive pursuit of grid optimization;
(3) The integration of V2G technology reduces the voltage deviation of various schemes by 44.44–68.89%, with NSGA-II reducing it by 68.89%.
The research has verified the potential for collaborative optimization under the established layout of charging stations, which will be extended to the direction of joint optimization of charging station site selection and charging and discharging strategies in the future.

7. Discussion

The user-side vehicle stack resource interaction strategy proposed in this article shows great potential in unleashing the collaborative benefits of electric vehicle integration. NSGA-II has significant advantages in multi-objective optimization. Especially, its charging station revenue increased by 33.43% and voltage deviation decreased by 68.89%, highlighting its effectiveness in balancing competitive interests. These results demonstrate the crucial role of NSGA-II in coordinating the charging/discharging behavior of electric vehicles, particularly under dynamic grid conditions. This strategy combines V2G technology with spatiotemporal prediction networks, revealing a feasible approach to enhance the resilience of the power grid while promoting a user-centric energy ecosystem.
The adaptability of the framework proposed in this study to different urban transportation modes and renewable energy penetration rates deserves further exploration. For example, transferring the dynamic traffic allocation network coupling architecture to megacities with different adoption rates of electric vehicles may completely change urban energy management. In addition, the voltage deviation between various schemes has been reduced by 44.44–68.89%, indicating an opportunity to optimize distributed energy coordination during peak demand periods. This article does not involve any content related to battery degradation. And, this will be studied in future research.
Future research should prioritize the joint optimization of charging infrastructure site selection and operation strategies, utilizing real-world mobile datasets to improve spatiotemporal load forecasting. At the same time, more detailed consideration will be given to the classification of hardware charging for electric vehicles. In addition, research on incentive mechanisms that combine user participation with grid stability goals, such as dynamic pricing models to address local energy shortages, can unlock scalable V2G deployment.

Author Contributions

Conceptualization, X.S.; methodology, Z.C.; validation, Z.Z.; formal analysis, Y.L.; investigation, Y.Z.; writing—original draft preparation, J.Z.; writing—review and editing, Q.A. and M.H. All authors have read and agreed to the published version of the manuscript.

Funding

This research was funded by Research and Application of Regional Scale User Side Resource Collaborative Interaction Technology, grant number 090000KC22120002.

Data Availability Statement

Data are available upon request due to restrictions (e.g., privacy, legal, or ethical reasons).

Conflicts of Interest

Authors Juan Zhan, Mei Huang, Xiaojia Sun, Zuowei Chen, Zhihan Zhang, Yang Li and Yubo Zhang were employed by the Shenzhen Power Supply Bureau Co., Ltd. The remaining authors declare that the research was conducted in the absence of any commercial or financial relationships that could be construed as a potential conflict of interest.

Nomenclature

Abbreviations D i t traffic congestion index
ACair conditioning α i t saturation level
EVselectric vehicles Q i t traffic flow on road segment i at time t
MOPSOmulti-objective particle swarm optimization C i basic capacity
MOSPOmulti-objective stochastic paint optimization ω i t road weight
NHTSNational Household Travel Survey V j , t node voltage
NSGA-IInon-dominated sorting genetic algorithm II P j , t active power
POIpoint of interest Q j , t reactive power
QGISquantum geographic information system Φ C ( t ) price sensitivity function
V2Gvehicle-to-grid Δ p l , m C ( t ) price difference
Model parameters P u n i t , c o o l cooling power unit
V the output voltage of cell λ t i m e time penalty coefficient
L i road segment identifier t f d e l a y travel time delay
ν i t instantaneous vehicle speed p C , l real-time charging price
ν F r e e , i t free-flow speed

References

  1. Manoharan, Y.; Hosseini, S.E.; Butler, B.; Alzhahrani, H.; Senior, B.T.F.; Ashuri, T.; Krohn, J. Hydrogen fuel cell vehicles; current status and future prospect. Appl. Sci. 2019, 9, 2296. [Google Scholar] [CrossRef]
  2. Yang, B.; Li, J.; Shu, H.; Cai, Z.; Tang, B.; Huang, X.; Zhu, M. Recent advances of optimal sizing and location of charging stations: A critical overview. Int. J. Energy Res. 2022, 46, 17899–17925. [Google Scholar] [CrossRef]
  3. Sun, L.M.; Yang, B. Optimal planning of electric vehicle charging station based on spatio-temporal distribution prediction of charging demand. Power Gener. Technol. 2024, 1–12. Available online: http://kns.cnki.net/kcms/detail/33.1405.TK.20240914.1014.002.html (accessed on 1 March 2025).
  4. Hu, Y.W.J.; Yang, B.; Wu, P.Y.; Wang, X.; Li, J.; Huang, Y.; Su, R.; He, G.; Yang, J.; Su, S.; et al. Optimal planning of electric-heating integrated energy system in low-carbon park with energy storage system. J. Energy Storage 2024, 99, 113327. [Google Scholar] [CrossRef]
  5. Alaee, P.; Shao, J.; Bemš, J.; Guerrero, J.M. Coordinated routing optimization and charging scheduling in a multiple-charging station system: A strategic bilevel multi-objective programming. Sustain. Energy Grids Netw. 2025, 42, 101659. [Google Scholar] [CrossRef]
  6. Shin, J.; Hwang, W.S.; Choi, H. Can hydrogen fuel vehicles be a sustainable alternative on vehicle market?: Comparison of electric and hydrogen fuel cell vehicles. Technol. Forecast. Soc. Change 2019, 143, 239–248. [Google Scholar] [CrossRef]
  7. Wang, Z.H. Research on electric vehicle orderly charging and vehicle-network interaction technology under the dual carbon goal. Electr. Power Eng. Technol. 2021, 40, 1. [Google Scholar]
  8. Zhang, H.; Moura, S.J.; Hu, Z.; Song, Y. PEV fast-charging station siting and sizing on coupled transportation and power networks. IEEE Trans. Smart Grid 2016, 9, 2595–2605. [Google Scholar] [CrossRef]
  9. Chen, K.Y.; Niu, Y.G. Real-time scheduling strategy of electric vehicle based on vehicle-to-grid application. Power Syst. Prot. Control 2019, 47, 1–9. [Google Scholar]
  10. Hu, W.P.; He, L.F.; Chen, J.J. A bi-layer optimization based schedule considering large-scale electric vehicles. Power Syst. Prot. Control 2016, 44, 22–28. [Google Scholar]
  11. Luo, X.; Cheng, J.; Wang, L.X. Spatio-temporal optimal scheduling of electric vehicles based on equivalent load real-time tariff and node real-time tariff guidance. Power Syst. Technol. 2025, 1–17. [Google Scholar] [CrossRef]
  12. Xu, J.J.; Cheng, Y.L.; Zheng, T.F.; Liu, H.J.; Zhu, S.L.; Wu, Z.J. Optimal scheduling of electric vehicle clusters considering characteristics and adjust ability of charging behavior. Autom. Electr. Power Syst. 2023, 47, 23–32. [Google Scholar]
  13. Pang, X.F.; Fang, X.; Yu, Y.; Zheng, Z.; Li, H. Optimal scheduling method for electric vehicle charging and discharging via Q-learning-based particle swarm optimization. Energy 2025, 316, 134611. [Google Scholar] [CrossRef]
  14. Li, Y.J.; Zhang, Z.S.; Xing, Q. Real-time online charging control of electric vehicle charging station based on a multi-agent deep reinforcement learning. Energy 2025, 319, 135095. [Google Scholar] [CrossRef]
  15. Liu, N.; Chen, Q.F.; Liu, J.; Lu, X.; Li, P.; Lei, J.; Zhang, J. A heuristic operation strategy for commercial building microgrids containing Evs and PV system. IEEE Trans Ind. Electron. 2015, 62, 2570. [Google Scholar] [CrossRef]
  16. Jia, R.D.; Pan, H.X.; Zhang, S.L.; Hu, Y. Charging scheduling strategy for electric vehicles in residential areas based on offline reinforcement learning. J. Energy Storage 2024, 103, 114319. [Google Scholar] [CrossRef]
  17. Chen, J.; Zhang, X.D.; Li, L.Y.; Zhang, H.; Pan, R.; Su, Y. Two-stage game collaborative scheduling optimization of EV shared charging based on electricity-carbon joint mechanism. Power Syst. Technol. 2024, 48, 3584–3594. [Google Scholar]
  18. Sun, X.; Jiang, H.L.; Xie, J.D.; Wang, S.M.; Wang, S. Charging and discharging scheduling mechanism of electric vehicles in park based on user credit index. J. Shanghai Jiaotong Univ. 2025, 59, 1–17. [Google Scholar] [CrossRef]
  19. Yan, L.M.; Zeng, J.W.; Xu, J.J.; Peng, C.; Zhao, S.Q.; Jia, Y. Scheduling strategy of distribution grid with electric vehicles and photolatic based on evolutionary dynamics game. Acta Energiae Solaris Sin. 2024, 45, 316–323. [Google Scholar]
  20. Wang, S.Q.; Liu, B.; Hua, Y.P.; Li, Q.; Zhou, J.; Xiang, Y.; Tang, B. Dispatchable capability of aggregated electric vehicle charging in distribution systems. Energy Eng. 2024, 122, 129–152. [Google Scholar] [CrossRef]
  21. Gao, Y.; Xu, Y.H.; Zhang, T.; Song, W.Y.; Wang, P.; Xi, L. Multi-microgrid system optimization scheduling including electric vehicle coordinated charging and reward and punishment ladder carbon trading. Electr. Power Constr. 2025, 46, 174–188. [Google Scholar]
  22. Ran, Y.Z.; Liao, H.H.; Liang, H.J.; Lu, L.; Zhong, J. Optimal scheduling strategies for EV charging and discharging in a coupled power-transportation network with V2G scheduling and dynamic pricing. Energies 2024, 17, 6167. [Google Scholar] [CrossRef]
  23. Liu, Z.J.; Dai, J.; Yang, L.R. Flexibility mining and optimal scheduling for electric vehicle clusters considering dynamic coordination of power-transportation coupling network. Autom. Electr. Power Syst. 2024, 48, 127–137. [Google Scholar]
  24. Zheng, Y.S.; Li, F.; Dong, J.L.; Luo, J.T.; Zhang, M.; Yang, X.L. Optimal dispatch strategy of spatio-temporal flexibility for electric vehicle charging and discharging in vehicle-road-grid mode. Autom. Electr. Power Syst. 2022, 46, 88–97. [Google Scholar]
  25. Zhang, C. A robust optimization scheduling strategy for “vehicle-road-network” systems considering dual uncertainty. Sustain. Energy Grids Netw. 2025, 42, 101654. [Google Scholar] [CrossRef]
  26. Jiang, X.F.; Wei, W.; Wang, Y.C.; Chen, G.; Zhang, R.T.; Liao, K.; Xiao, Q. Orderly charging guidance strategies for electric vehicles under EVs-traffic-distribution collaborative optimization. J. Electr. Power Sci. Technol. 2023, 38, 44–56. [Google Scholar]
  27. Lakshmikanthi, V.P.; Rao, M.D. Applications of QGIS and machine learning for road crash spot identification. Earth Sci. Inform. 2024, 17, 2331–2346. [Google Scholar]
  28. He, B.; Yang, B.; Han, Y.; Zhou, Y.; Hu, Y.; Shu, H.; Su, S.; Yang, J.; Huang, Y.; Li, J.; et al. Optimal EVCS planning via spatial-temporal distribution of charging demand forecasting and traffic-grid coupling. Energy 2024, 313, 133885. [Google Scholar] [CrossRef]
  29. Zhang, H.; Du, Q.; Zhang, S.; Yang, R. A semantically enhanced label prediction method for imbalanced POI data category distribution. ISPRS Int. J. Geo-Inf. 2024, 13, 364. [Google Scholar] [CrossRef]
  30. Deng, Y.X.; Huang, Y.P.; Huang, Z.C. Charging and discharging capacity forecasting of electric vehicles based on random forest algorithm. Autom. Electr. Power Syst. 2021, 45, 181–188. [Google Scholar]
  31. Wei, Y.; Sze, C.; Viswanathan, N.; Li, Z.; Alpert, C.J.; Reddy, L.; Huber, A.D.; Tellez, G.E.; Keller, D.; Sapatnekar, S.S. Techniques for scalable and effective routability evaluation. ACM Trans. Des. Autom. Electron. Syst. 2014, 19, 1–37. [Google Scholar] [CrossRef]
  32. Xie, X.Y.; Liu, X.X.; Li, C.; Hu, Z.P.; Liu, K.; Chen, T. Distribution network reconfiguration considering distributed generation and electric vehicle cluster scheduling. Electr. Power 2023, 56, 119–125. [Google Scholar]
  33. Baran, M.E.; Wu, F.F. Optimal capacitor placement on radialdistribution systems. IEEE Trans. Power Deliv. 1989, 4, 725–734. [Google Scholar] [CrossRef]
  34. Liu, H.; Zhang, J.; Wang, Y. Dynamic coupling model for vehicle-road-power grid interaction: A multi-agent-based optimization framework for EV charging and grid services. Renew. Sustain. Energy Rev. 2024, 210, 114731. [Google Scholar]
  35. Li, D.S.; Adama, z.; Liao, J.T.; Yang, H. An energy management strategy with renewable energy and energy storage system for a large electric vehicle charging station. eTransportation 2020, 6, 100076. [Google Scholar] [CrossRef]
  36. Han, Y.M.; He, B.; Yang, B.; Li, J.L. Optimal planning of electric vehicle charging stations combined with battery energy storage systems considering driving characteristics. J. Shanghai Jiaotong Univ. 2024, 1–29. [Google Scholar] [CrossRef]
  37. Verma, S.; Pant, M.; Snasel, V. A comprehensive review on NSGA-II for multi-objective combinatorial optimization problems. Inst. Electr. Electron. Eng. 2021, 9, 57757–57791. [Google Scholar] [CrossRef]
  38. Li, J.L.; Yang, B.; Hu, Y.W.J.; Zhang, R. Location and capacity planning of electricity hydrogen hybrid energy storage system considering demand response. Power Syst. Technol. 2023, 47, 3698–3714. [Google Scholar]
  39. Li, X.; Zhang, Y.; Wang, H.; Liu, Z. A grey target-based multi-objective optimization framework for EV charging scheduling considering grid flexibility and user preferences. IEEE Trans. Sustain. Energy 2023, 1, 512–525. [Google Scholar]
  40. Qiu, Z.Y.; Mo, Y.B. CHP system ED optimization based on improved snow geese algorithm. Mod. Electron. Tech. 2025, 48, 127–135. [Google Scholar]
  41. Li, W.; Xiao, Y.; Feng, H. Multi-objective real-time scheduling optimization study of multi-energy supply system based on improved flower pollination algorithm. J. Harbin Eng. Univ. 2025, 1–8. Available online: http://kns.cnki.net/kcms/detail/23.1390.U.20250313.1201.004.html (accessed on 26 March 2025).
  42. Li, L.B.; Gao, Y.B.; Dai, L.L.; Gao, G.Q. Multi-strategy improved white shark algorithm for wind and hydrogen storage microgrids optimal Scheduling. J. Huazhong Univ. Sci. Technol. (Nat. Sci. Ed.) 2025, 1–7. [Google Scholar] [CrossRef]
  43. Lu, C. Research on the optimization of new energy vehicle marketing strategies: A case study of BYD. Mod. Mark. 2025, 55–57. [Google Scholar]
  44. Wu, D. Electric Charging Pile Time-Slot Price, Which Time-Slot Electricity Is the Cheapest. Wu Di Electric. 2022. Available online: https://www.modiauto.com.cn/bk/53133.html (accessed on 26 March 2025).
  45. Pacific Auto. How Much Does It Cost to Charge at ZEEKR Super Charging Station? Pacific Auto. 2024. Available online: https://www.pcauto.com.cn/jxwd/4382/43828413.html (accessed on 26 March 2025).
  46. Sohu. Evening Charging at Half-Price! Tesla Launches “Off-Peak Supercharging” in China: As Low as 1.2 CNY per kWh During Off-Peak Hours. Sohu. 2022. Available online: https://www.sohu.com/a/562838243_120960892# (accessed on 26 March 2025).
Figure 1. Road network topology, node classification, and charging station location.
Energies 18 01944 g001
Figure 2. Traffic congestion index.
Energies 18 01944 g002
Figure 3. The average temperature of Guiyang city.
Energies 18 01944 g003
Figure 4. EV charging and discharging optimization control flow chart.
Energies 18 01944 g004
Figure 5. IEEE69 topology and charging station access location.
Energies 18 01944 g005
Figure 6. The spatial and temporal distribution of road network node charging load.
Energies 18 01944 g006
Figure 7. Charging load of charging station.
Energies 18 01944 g007
Figure 8. Pareto solutions of NSGA-II.
Energies 18 01944 g008
Figure 9. Charging price of charging station.
Energies 18 01944 g009
Figure 10. Discharging price of charging station.
Energies 18 01944 g010
Figure 11. Charging price of charging station #1.
Energies 18 01944 g011
Figure 12. Discharging price of charging station #1.
Energies 18 01944 g012
Figure 13. Voltage level optimized by each algorithm.
Energies 18 01944 g013
Table 1. Driving characteristic distribution table.
Driving CharacteristicNode TypeDistribution ModelFitting Parameters
Initial Driving Time-Weibull Distribution λ = 7.986
k = 6.696
Initial SOC-Normal Distribution σ = 0.2
μ = 0.5
Parking DurationResidential AreaLog-normal Distribution μ L = 4.893
σ L = 0.51
Work AreaWeibull Distribution λ = 3032.83
k = 1.043
Other AreasGeneralized Extreme Value Distribution k = 0.765
α = 35.419
μ = 63.477
Driving Distance-Normal Distribution σ = 0.88
μ = 3.3
Table 2. Pseudocode of NSGA-II.
Step 1: Set   NSGA - II   parameters :   Population   Size   ( N ) ,   Max   Generations   ( G ) ,   Crossover   Rate   ( p c ) ,   Mutation   Rate   ( p m )
Step 2:Initialize population with random solutions
Step 3:FOR1   g e n = 1   G  DO
Step 4:           Evaluate objective functions for all solutions
Step 5:           Perform Fast Non-Dominated Sorting to identify Pareto fronts ( F 1 ,   F 2 ,   ,   F k )
Step 6:            FOR 2   each   front   F i   DO
Step 7:            Calculate   Crowding   Distance   for   solutions   in   F i
Step 8:           END FOR2
Step 9:                  Select parents using Binary Tournament:
      
Prefer solutions from better fronts
      
If same front, choose higher crowding distance
Step 10:                  Apply genetic operators:
      
SBX   Crossover   ( p c )
      
Polynomial   Mutation   ( p m )
Step 11:           Combine parent and offspring populations
Step 12:           Perform Environmental Selection:
      
Fill new population front-by-front
      
Truncate last front using crowding distance
Step 13:END FOR1
Step 14: Output   Non - Dominated   Solutions   in   first   front   ( F 1 )
Table 3. Algorithm summary.
AlgorithmNSGA-IIABMSG [40]IFP [41]DWSO [42]MOPSOMOSPO
Key FeaturesFast non-dominated sortingDynamic Brownian motion perturbationMulti-objective fusion functionSplit problem decomposition architecturePareto dominance and repository maintenanceColor theory-inspired search mechanism
Computational EfficiencyHighHighMediumMediumHighHigh
DiversityHighMediumHighMediumHighHigh
Year200220242024202020212022
Table 4. EV-related parameter table.
ParametersValue
Weight of EV/(kg)1900
Battery Capacity of EV/(k·Wh)60
Transmission Efficiency0.92
Motor Efficiency0.91
Table 5. The related parameter table of each algorithm.
AlgorithmParametersValue
NSGA-IICrossover Percentage0.5
Mutation Percentage0.5
Mutation Rate0.02
MOPSOInertia Weight0.5
Intertia Weight Damping Rate0.99
Personal Learning Coefficient1
Global Learning Coefficient2
Mutation Rate0.1
MOSPOGrid Inflation Parameter0.1
Number of Grids per each Dimension30
Leader Selection Pressure Parameter4
Extra (to be deleted) Repository Member Selection Pressure2
Table 6. Optimization results of each algorithm.
AlgorithmCharging Station Revenue/(CNY)Average Charging Cost Per EV User/(CNY)Voltage Fluctuation
Initial State17,384.1456.720.45
NSGA-II23,195.9746.070.14
MOPSO14,418.3444.520.20
MOSPO19,926.4687.430.25
Disclaimer/Publisher’s Note: The statements, opinions and data contained in all publications are solely those of the individual author(s) and contributor(s) and not of MDPI and/or the editor(s). MDPI and/or the editor(s) disclaim responsibility for any injury to people or property resulting from any ideas, methods, instructions or products referred to in the content.

