Article

Mud Loss Analysis Through Predictive Modeling of Pore Pressure and Fracture Gradients in Tin Fouye Tabankort Field, Western Illizi Basin, Algeria

1
Laboratory of Geology of the Sahara, Kasdi Merbah University, Ouargla 30000, Algeria
2
LabSTIC Laboratory, Guelma 24000, Algeria
3
Department of Drilling and Oil Field Mechanics, Faculty of Hydrocarbons, Kasdi Merbah University, Ouargla 30000, Algeria
4
Department of Petroleum Engineering, Faculty of Engineering and Technology, Future University in Egypt (FUE), Cairo 11835, Egypt
*
Author to whom correspondence should be addressed.
Energies 2025, 18(7), 1836; https://doi.org/10.3390/en18071836
Submission received: 27 February 2025 / Revised: 24 March 2025 / Accepted: 1 April 2025 / Published: 5 April 2025
(This article belongs to the Special Issue Development and Utilization in Geothermal Energy)

Abstract

:
This study examines the distribution of pore pressure (PP) and fracture gradient (FG) within intervals of lost circulation encountered during drilling operations in the Ordovician reservoir (IV-3 unit) of the Tin Fouye Tabankort (TFT) field, located in the Illizi Basin, Algeria. The research further aims to determine an optimized drilling mud weight to mitigate mud losses and enhance overall operational efficiency. PP and FG models for the Ordovician reservoir were developed based on data collected from five vertical development wells. The analysis incorporated multiple datasets, including well logs, mud logging reports, downhole measurements, and Leak-Off Tests (LOTs). The findings revealed an average overburden gradient of 1.03 psi/ft for the TFT field. The generated pore pressure and fracture gradient (PPFG) models indicated a sub-normal pressure regime in the Ordovician sandstone IV-3 reservoir, with PP values ranging from 5.61 to 6.24 ppg and FG values between 7.40 and 9.14 ppg. The analysis identified reservoir depletion due to prolonged hydrocarbon production as the primary factor contributing to the reduction in fracture gradient, which significantly narrowed the mud weight window and increased the likelihood of lost circulation. Further examination of pump on/off cycles over time, coupled with shallow and deep resistivity variations with depth, confirmed that the observed mud losses were predominantly associated with induced fractures resulting from the application of excessive mud weight during drilling operations. Based on the established PP and FG profiles, a narrow mud weight window of 6.24–7.40 ppg was recommended to ensure the safe and efficient drilling of future wells in the TFT field and support the sustainability of drilling operations in the context of a depleted reservoir.

1. Introduction

Wellbore instability poses a significant challenge in drilling operations [1,2]. The excavation process alters the in situ stress field surrounding the borehole, leading to potential failure of the formation [3]. The stress state at any given depth is characterized by a vertical stress component, primarily governed by overburden pressure (OVP) and horizontal principal stresses influenced by tectonic forces and pore fluid pressure [4]. Maintaining wellbore stability requires establishing an equilibrium between the in situ stress field and the applied wellbore pressure. Control of the wellbore pressure via the drilling mud is therefore crucial for ensuring both formation integrity and operational safety.
The mud window represents a critical paradigm in petroleum engineering, delineating the operational parameters essential for maintaining wellbore integrity during drilling processes. This analytical construct is fundamentally predicated on two fundamental geological parameters: pore pressure (PP) and fracture gradient (FG), which collectively define the permissible range of drilling fluid weight [5]. Mismanagement of the mud window not only risks operational safety but also significantly contributes to non-productive time (NPT), which has become a key performance metric in the oil and gas industry. For example, Dodson et al. [6] reported that 24 % of NPT in the Gulf of Mexico’s shelf gas wells was associated with challenges such as shallow gas flows, kicks, and mud losses. Such incidents not only delay operations but also lead to increased operational costs, environmental risks, and potential abandonment of wells.
PP, a fundamental geomechanical property, quantifies the intrinsic fluid pressure within rock formation pore spaces [7]. Conversely, fracture gradient represents the maximum pressure threshold at which the surrounding rock matrix experiences structural failure [8]. The interplay between these two parameters defines the mud window—a narrow operational corridor that drilling engineers must meticulously manage to prevent potential geological catastrophes such as formation collapse or uncontrolled fluid migration.
Pioneering research by Eaton [9] first systematized the conceptual understanding of PP prediction, establishing foundational methodologies for interpreting subsurface pressure dynamics. Subsequent investigations by Mouchet and Mitchell [10] further elaborated on the critical relationship between PP and wellbore stability, highlighting the potential catastrophic consequences of inadequate pressure assessment. Furthermore, empirical studies by Teufel et al. [11] and more recent research by Kassem et al. [12] have demonstrated the increasing complexity of mud window management in depleted reservoir systems. These investigations underscore the dynamic nature of in situ stress regimes and their profound implications for drilling fluid weight optimization.
PP and FG modeling play a critical role in optimizing well design, mitigating drilling risks, and ensuring formation stability, particularly in depleted reservoirs. Several recent studies have demonstrated the effectiveness of PP-FG models in these settings. For instance, Ghosal et al. [13] developed a comprehensive simulation for carbon capture and storage (CCS) applications, integrating fracture gradient and pore pressure predictions to enhance the stability of depleted reservoirs in Southeast Asia. Similarly, Hashemi and Kovscek [14] employed coupled flow–geomechanics modeling to analyze pore pressure gradients and stress alterations following reservoir depletion, specifically focusing on depleted reservoirs in the Gulf of Mexico. Beyond predictive modeling, field-specific investigations have provided insights into real-time wellbore stability challenges. Kuakool et al. [15] developed pre-drill 1D geomechanical models for optimizing drilling programs in Thailand’s Phitsanulok Basin, where deviations in pressure trends were observed in depleted sand intervals, highlighting the need for localized pore pressure calibration. Meanwhile, Melikov et al. [16] introduced an innovative approach for real-time pore pressure prediction during drilling operations in the offshore “White Tiger” Oilfield, incorporating continuous modeling adjustments to mitigate instability risks. Although significant advancements have been made in predictive PP and FG modeling, many studies primarily focus on theoretical simulations and fail to incorporate real-time analyses of mud loss incidents occurring during active drilling in hydrocarbon reservoirs. The present study builds upon previous research by investigating actual mud loss events in the Tin Fouye Tabankort (TFT) field, located in the northwestern part of the Illizi Basin, Algeria. This field has experienced persistent challenges related to mud losses, particularly during the drilling of vertical development wells targeting the Ordovician sandstone reservoir (IV-3 unit). By integrating empirical field data with geomechanical modeling, this research provides a more comprehensive understanding of wellbore instability mechanisms and their implications for drilling operations in this reservoir. The primary objectives include quantifying the distributions of PP and fracture gradient across the intervals of observed mud losses, identifying the causal mechanisms, and proposing an optimized mud weight window calibrated to the current reservoir conditions. This optimized window is intended to facilitate safer and more efficient drilling operations, minimizing risks and ensuring operational continuity for future wells.

2. Materials and Methods

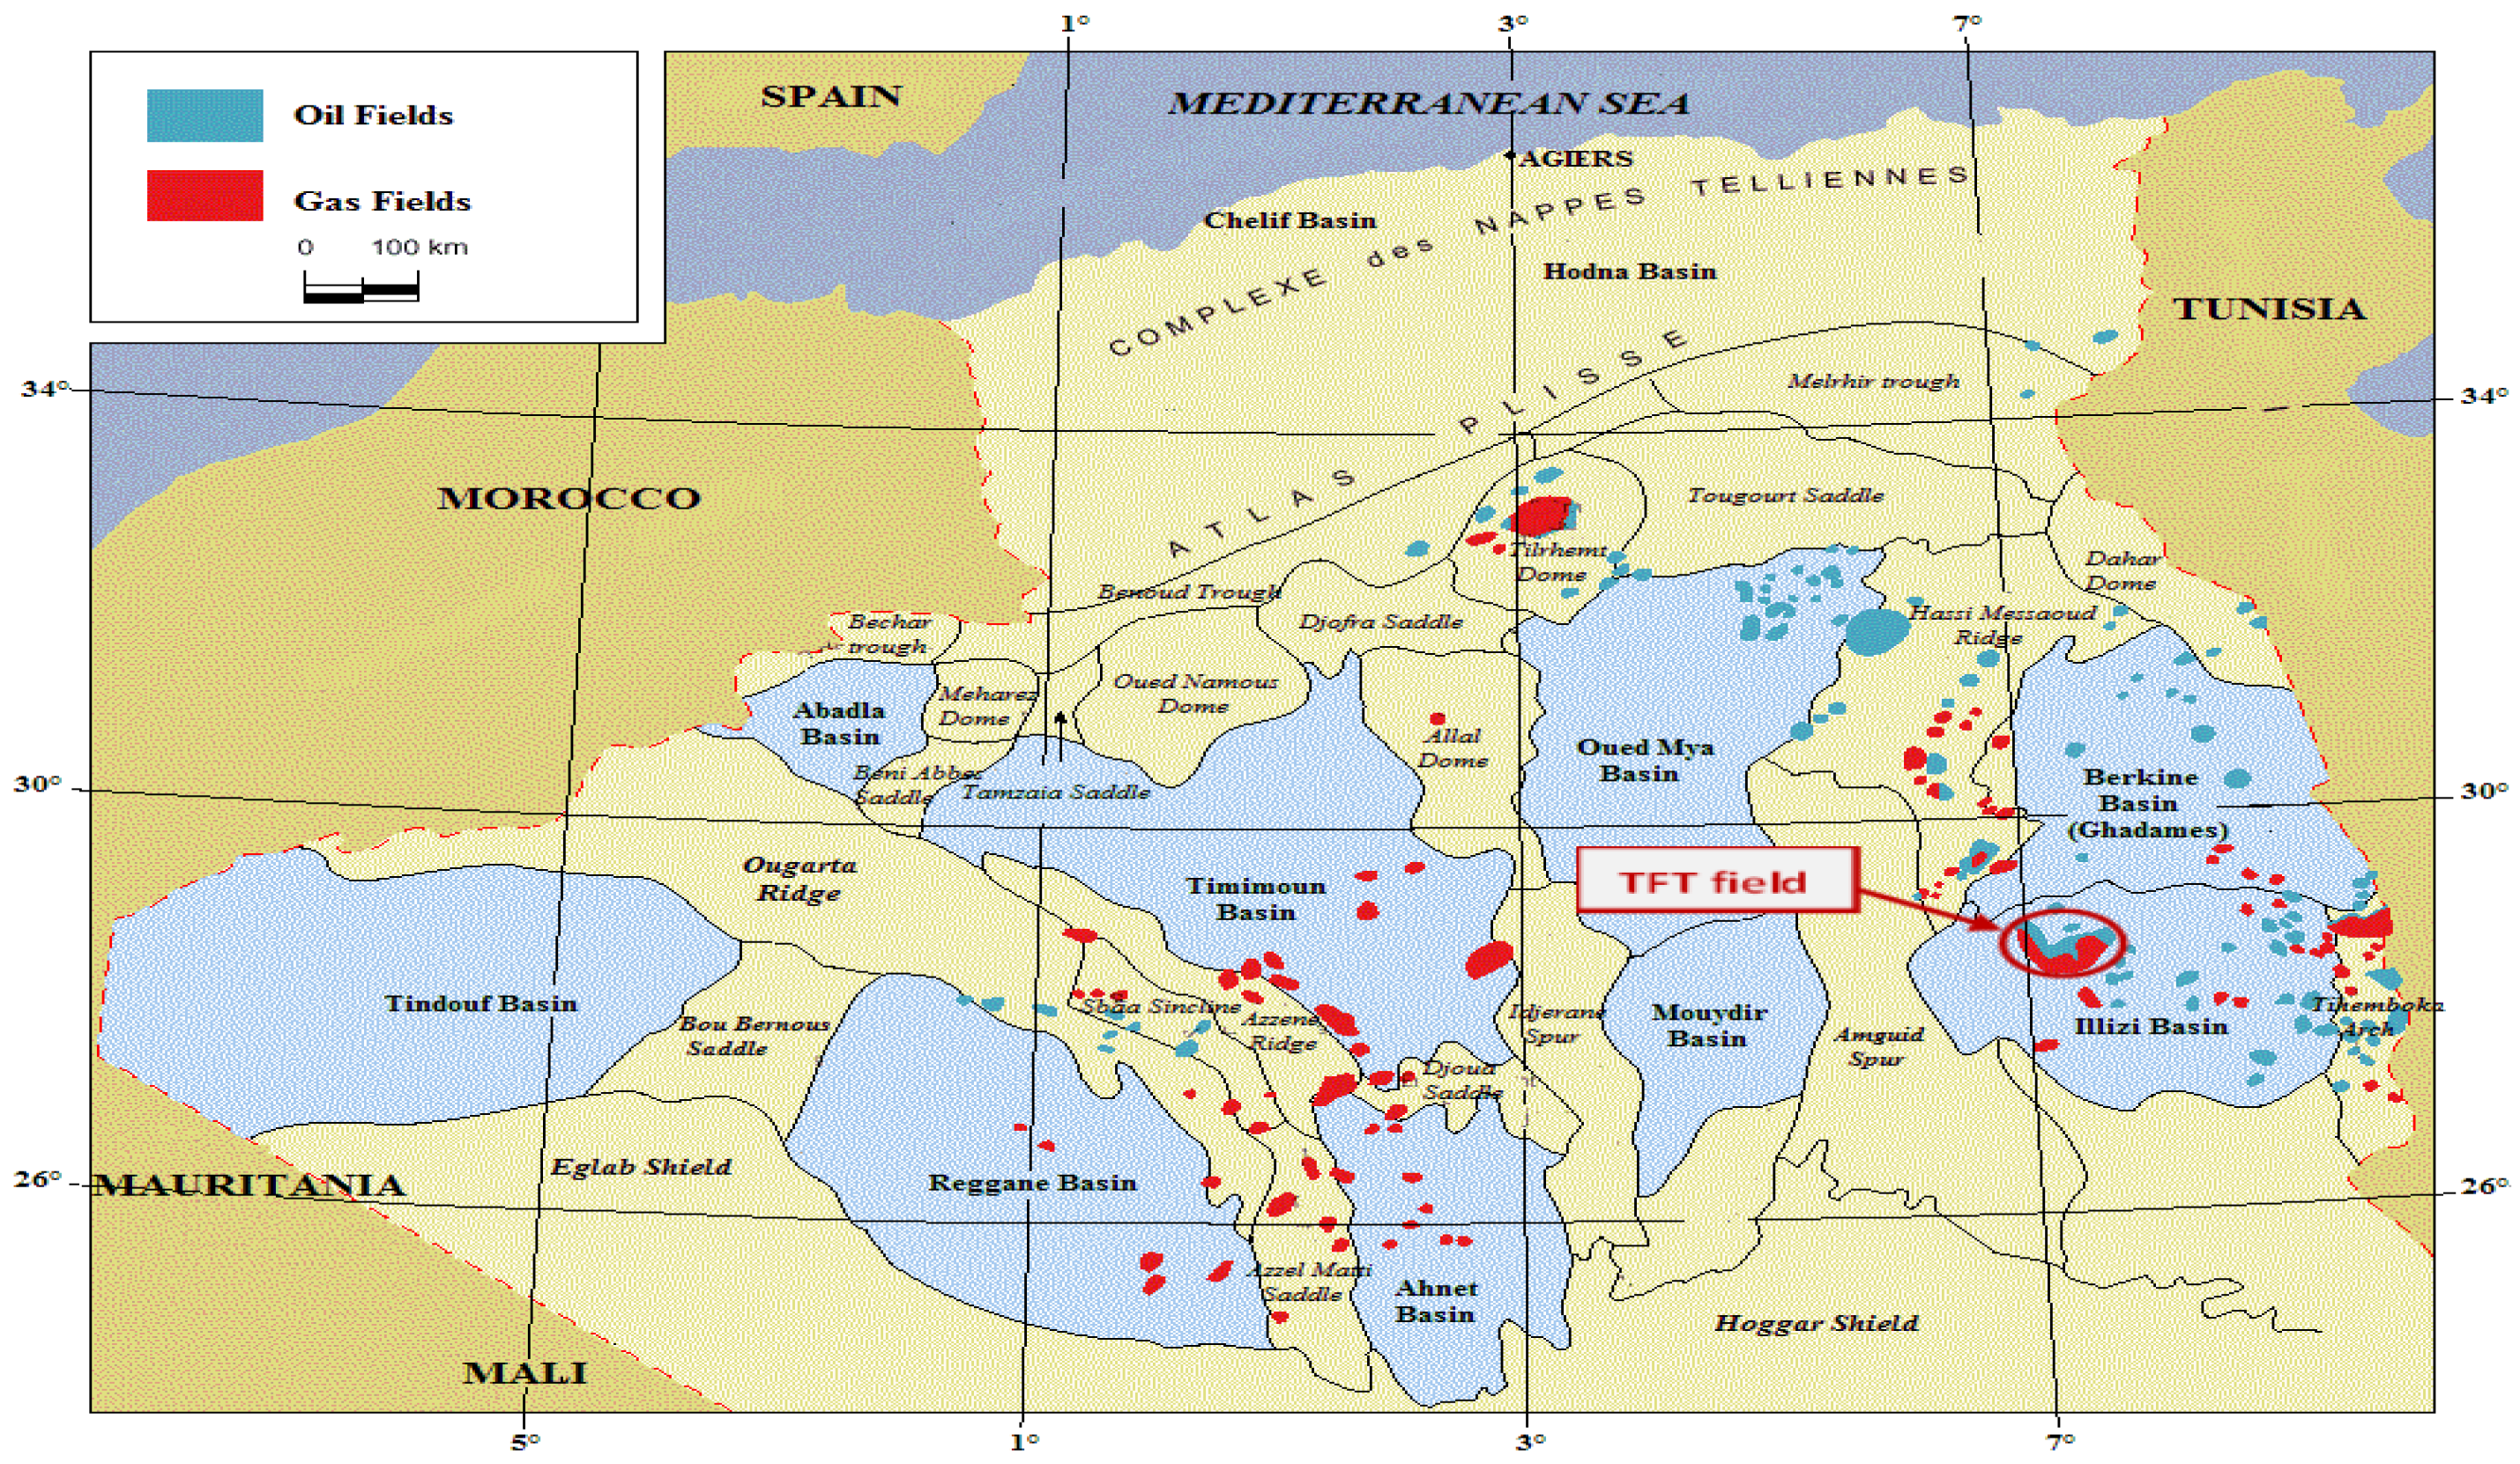
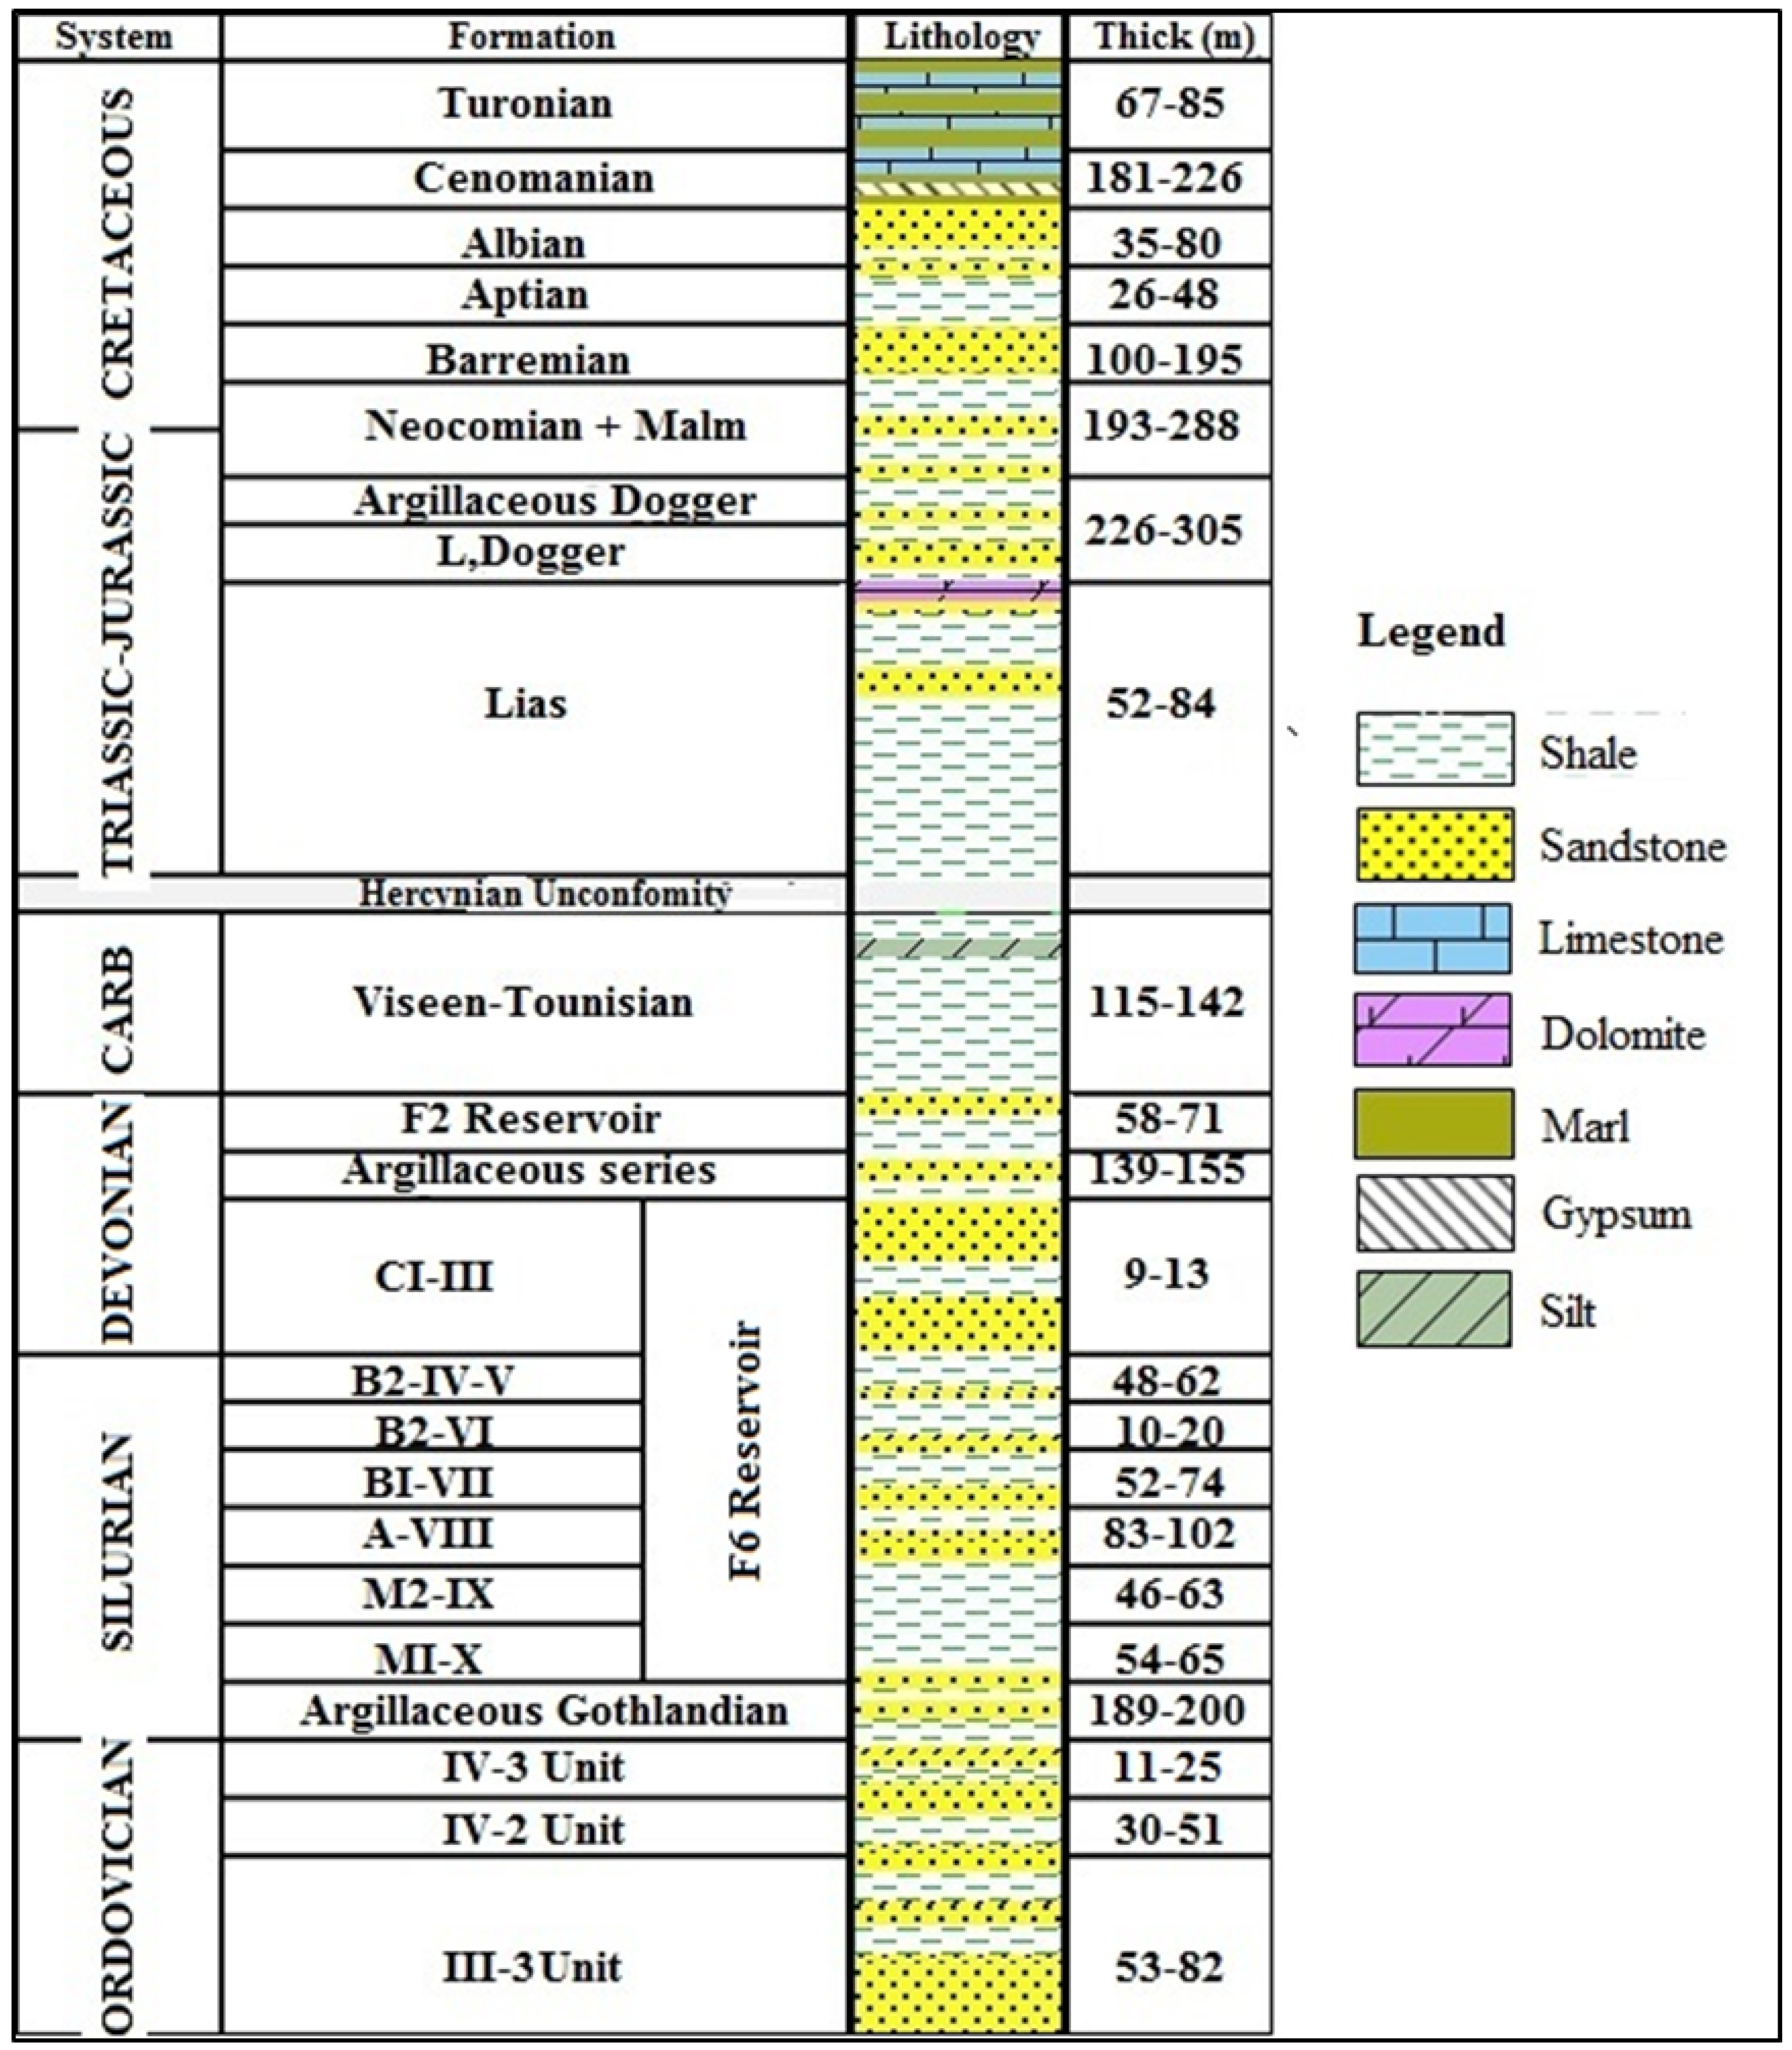
2.1. Description of Study Area

The Illizi Basin, located in the eastern province of Algeria, spans an area of approximately 108,424 km2 and has been a focal point for petroleum exploration since 1956 [17]. It belongs to a series of cratonic basins in the Algerian Sahara that are situated along the northern edges of the Precambrian Reguibat and Hoggar massifs. Structurally, the basin is bound by the Amguid Ridge to the west, the Tihemboka Ridge to the east [18], the Berkine (Ghadames) Basin to the north, and the Hoggar Massif to the south (Figure 1) [19]. Hydrocarbon generation in the Illizi Basin occurred primarily during the Middle to Late Jurassic and Early Tertiary periods [20]. Structural traps within the basin were predominantly formed during Mesozoic and Tertiary deformation events, driven by vertical movements of the Precambrian basement [21]. These features, combined with the basin’s favorable geological conditions, have established it as a significant site for hydrocarbon exploration and production.
The TFT field, situated in the north-western part of the Illizi Basin, approximately 360 km SSE of the Hassi Messaoud field, is a mature oil- and gas-producing area. The field’s gas cap was first discovered in 1961, followed by the identification of oil in 1965. Production commenced in 1967 [17]. The primary reservoir in the field is the Ordovician sandstone, which is characterized by two distinct units: IV-3 and IV-2 (Figure 2). These units consist of periglacial sediments, with the IV-3 unit serving as the main reservoir due to its uniform petrophysical properties and consistent thickness. In contrast, the IV-2 unit exhibits poorer reservoir quality and significant variability in thickness [17].

2.2. Data Source

The dataset analyzed in this study comprises five vertical development wells drilled in the Ordovician reservoir of the TFT field. Four of these wells (TF2, TF3, TF4, and TF5) were drilled recently (2022–2023) and encountered lost circulation while the 6 in. hole section was being drilled. In contrast, the fifth well (TF1) was drilled earlier, in the year 2000. All wells were specifically designed to target hydrocarbon production from the Ordovician sandstone reservoir (IV-3 Unit), which has a variable thickness ranging between 11 and 25 m (Table 1).
A comprehensive dataset comprising logging measurements and operational records was employed to analyze the reservoir’s geomechanical characteristics and address challenges related to lost circulation. The dataset included gamma-ray logs, density logs, and sonic slowness measurements for both compressional and shear waves, offering critical insights into lithology, formation density, and elastic properties. These parameters were pivotal in estimating PP and FG distributions. In addition to logging data, operational records such as mudlogging reports, drilling reports, Leak-Off Tests (LOTs), and Repeat Formation Tests (RFTs) were integrated to enhance the precision of the geomechanical analysis. Gamma-ray logs provided a reliable means of lithological differentiation, while density logs were instrumental in calculating OVP—a key component in stress distribution models [22]. Sonic slowness measurements enabled the determination of Poisson’s ratio, a crucial elastic property that plays a central role in modeling the mechanical behavior of the formation under varying stress conditions [23].

2.3. Procedure

2.3.1. Estimation of Poisson’s Ratio

The mechanical properties of rock significantly influence wellbore stability [24,25,26]. These properties are typically categorized into two groups: rock strength parameters and elastic properties, the latter including Poisson’s ratio [27]. In this study, Poisson’s ratio (v) is estimated using the following Equation [28]:
v = V p 2 2 V s 2 2 ( V p 2 V s 2 )
where V p and V s represent the compressional and shear wave velocities, respectively, in units of meters per second.
The static Poisson’s ratio is conventionally determined through laboratory testing on core samples; however, due to the unavailability of core data in this study, an alternative approach was adopted. Specifically, the dynamic Poisson’s ratio, derived from sonic log measurements, was utilized as an approximation of the static Poisson’s ratio, following methodologies established in previous research [19,29]. To ensure the validity and reliability of this assumption for geomechanical characterization, the estimated dynamic Poisson’s ratio was compared with static values reported in prior studies conducted within the same region [30].

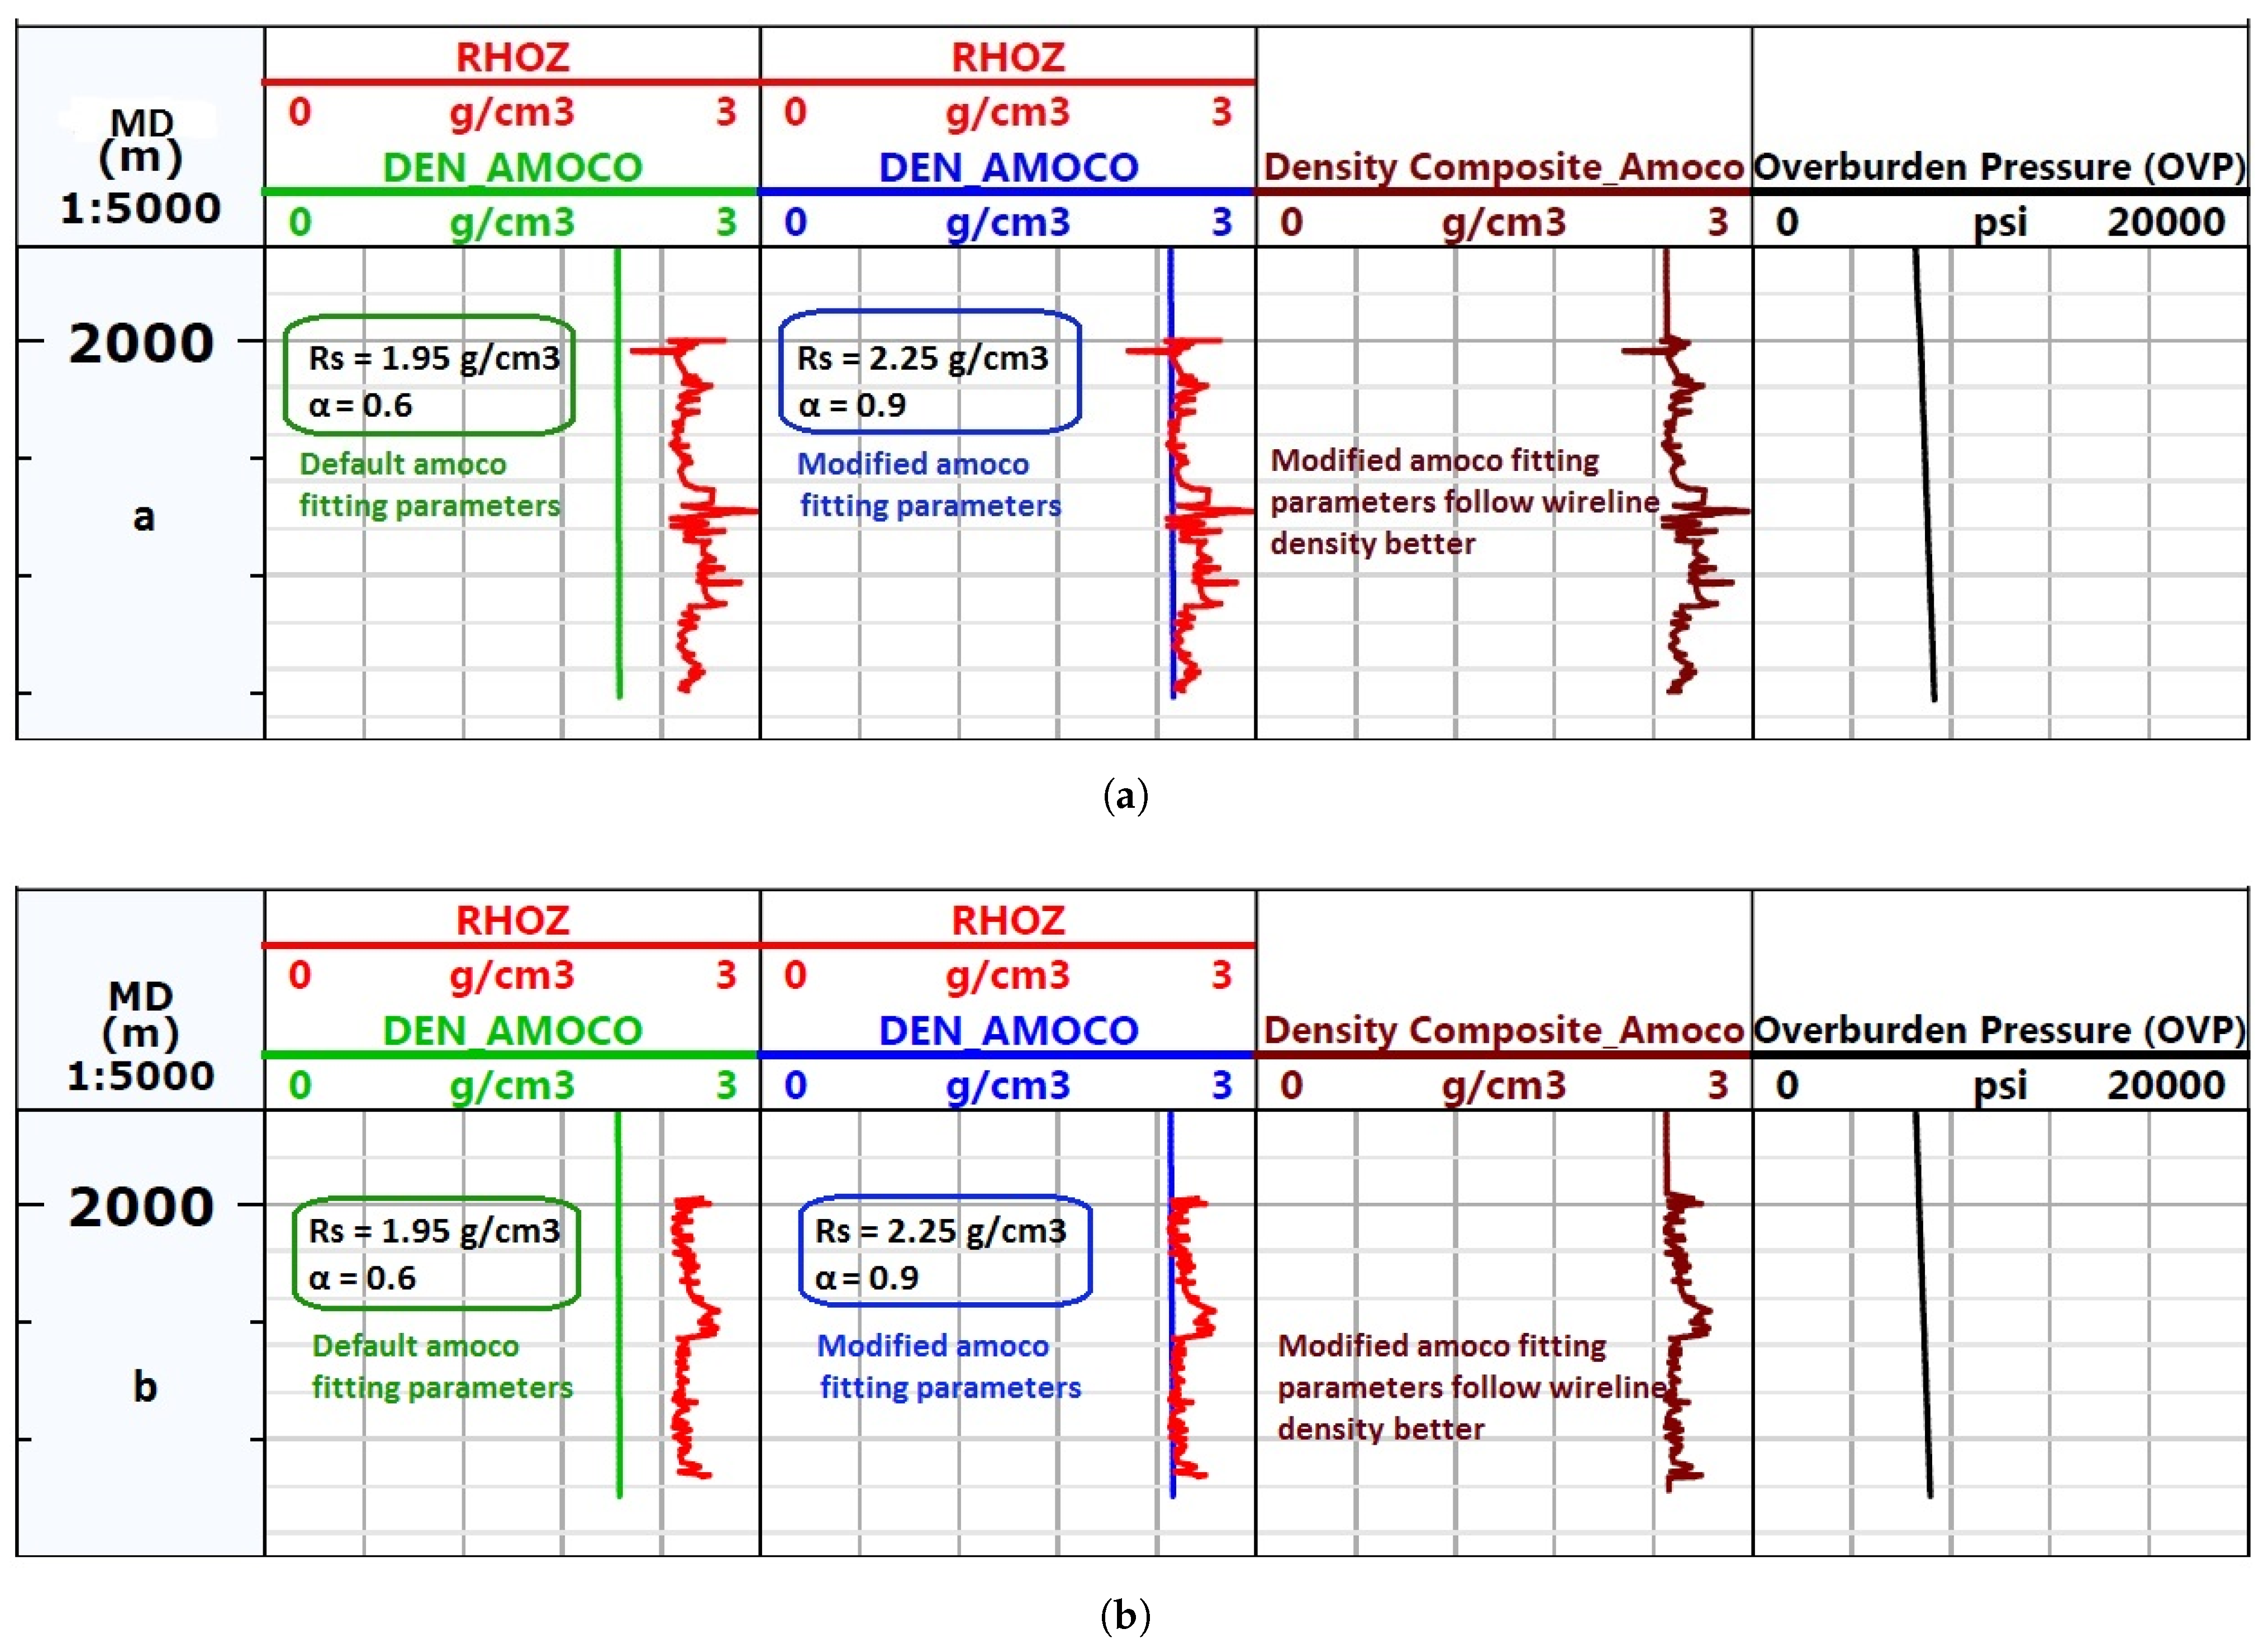
2.3.2. Estimation of OVP

OVP, also known as vertical stress (Sv), is the pressure exerted on a subsurface formation by the cumulative weight of overlying sediments and pore fluids [19]. This parameter is fundamental to geomechanical analysis, serving as the principal vertical stress component in stress distribution models. It is particularly critical for the accurate determination of PP and FG distributions, which are essential for ensuring wellbore stability and optimizing drilling operations. OVP can be estimated using bulk density log data, as described by Plumb et al. [31], through the following formula:
O V P = 0 H ρ ( H ) g d H
where O V P is the vertical stress, ρ ( H ) is the the bulk density of the overlying sediments and fluids (varies with depth), and g represents the gravitational acceleration.
Accurate data analysis is essential for all studied wells to ensure reliable geomechanical assessments. Due to the absence of bulk density logs from the surface, the Amoco equation was utilized to generate pseudo-density profiles for the missing sections. This approach is widely recognized and has been employed in numerous studies [19,32,33]. After the pseudo-density was calculated, it was integrated with the existing bulk density log data to produce a composite density profile, which was then used to estimate the OVP. In the study conducted by Radwan et al. [33], the default Amoco fitting parameters for vertical stress were modified to better align with the geological characteristics of the study area. Specifically, they adjusted the mudline density to 2.15 g/cm3 and the Amoco exponent to 0.85. In the present study, the default values (1.95 g/cm3 for mudline density and 0.6 for the Amoco exponent) did not match the observed wireline density trends. Through iterative testing and calibration using data from Wells TF3 and TF4, optimal values of 2.25 g/cm3 for shallow density and 0.9 for the Amoco exponent were identified. These adjusted parameters were subsequently applied across all studied wells to enhance the accuracy of the density profile. Figure 3 illustrates the discrepancies between the default Amoco fitting parameters and the modified values derived for Wells TF3 and TF4, highlighting the improved alignment with observed density trends achieved through parameter refinement. Figure 3a,b show the composite density profiles (Track 04) for calculating overburden pressure (Track 05) in Wells TF3 and TF4, respectively. Track 02 represents Amoco density using default fitting parameters (1.95 and 0.6), and Track 03 is the Amoco density using modified fitting parameters (2.25 and 0.9), which follows the wireline density (red) trend better.

2.3.3. Estimation of PP

PP refers to the pressure exerted by fluids within the pore spaces of a geological formation. It plays a pivotal role in ensuring primary well control during drilling operations by balancing formation PP with the hydrostatic pressure of the drilling fluid [34]. Effective well control is maintained within two critical boundaries: the maximum PP and the minimum fracture pressure. Maintaining this balance is essential for avoiding wellbore instability, influxes, or blowouts [35]). In this study, PP gradients were estimated using compressional sonic slowness logs. Normal compaction trends (NCTs) were established within shale zones to serve as a baseline for the analysis. Subsequently, the sonic Eaton equation was applied to derive PP gradients, as expressed below [36]:
P P = O B G ( O B G P h ) D T n D T 3
where P h is the hydrostatic pressure (0.433 psi/ft), and O B G is the overburden gradient. D T n is the compressional sonic log response against shale along NCT. D T is the compressional sonic slowness log.
Shale zones were identified using gamma-ray logs, supported by lithological information from mudlogging cuttings as recorded in the master log [37]. These shale intervals were critical for defining the NCT and ensuring the accuracy of the PP estimations.

2.3.4. Estimation of FG

Accurately determining the FG, which represents the minimum horizontal stress, is essential for wellbore stability and fracture design [38]. Methods such as LOTs, mini/micro-fracture tests, and hydraulic fracture analysis provide direct and precise measurements of this parameter [39]. In this study, two established methodologies were utilized to estimate the FG: The first method, developed by Eaton and Eaton, calculates the FG using the following Equation [28]:
F G e a t o n = v 1 v ( O B G P P ) + P P
Eaton’s method facilitates the incorporation of lithological variations [40], such as shale and sandstone, into FG estimations by accounting for the influence of Poisson’s ratio, which is derived from Equation (3). According to Zhang and Wieseneck [41], this approach is particularly suitable for older geological formations, including Cretaceous-aged and pre-Cretaceous formations. In these cases, Eaton’s method remains applicable when Poisson’s ratios are computed using sonic log data, allowing for more accurate fracture gradient predictions in deep, complex reservoirs.
The second method, employed in Well TF1, estimates the FG using the effective stress ratio as proposed by Matthews and Kelly [42]. The FG is estimated using the following equation:
F G m k = P P + K ( O B G P P )
where K is the effective stress ratio, a parameter derived from LOT measurement.
RFT and LOT measurements were conducted in the Ordovician reservoir for Well TF1 to provide calibration for PP and FG estimates derived from indirect methods. However, in Wells TF2, TF3, TF4, and TF5, the execution of these measurements was precluded by the occurrence of lost circulation within the Ordovician IV-3 unit. This loss event significantly constrained the ability to obtain direct data, thereby limiting the calibration and validation of geomechanical parameters in these wells.
Sonic log-based methods, such as Eaton’s approach, are widely employed for PP prediction. However, these methods are inherently subject to limitations that can introduce uncertainties in estimated PP values. Several factors beyond effective stress, including the presence of organic matter, free hydrocarbons, and diagenetic alterations, can significantly influence sonic velocity responses, leading to discrepancies in PP estimations [43]. Additionally, unconsolidated sediments and heterogeneous lithologies may distort velocity readings, further reducing the accuracy of sonic log-based models [44]. In this study, a comparative analysis was conducted by correlating calculated values with measured mud weights. This approach has been previously employed in other research as a means to complement sonic velocity measurements and minimize prediction errors [19].

3. Results

3.1. Poisson’s Ratio and OVP

The results of this study demonstrate that Poisson’s ratio for the Ordovician sandstone reservoir ranges from 0.055 to 0.18 (Table 2), indicating limited lateral deformation relative to axial stress. Conversely, Poisson’s ratio for shales exhibits values between 0.20 and 0.29, indicative of their higher ductility and enhanced capacity for lateral deformation under axial loading. These observations agree with the findings of English et al. [30], who performed uniaxial and triaxial mechanical tests on core samples from the southern Illizi Basin, confirming the contrasting mechanical responses of sandstone and shale formations.
OVP was estimated using composite density logs from the five analyzed wells. The calculations revealed an average OBG of 1.036 psi/ft at a depth of approximately 2130 m ± 15 m. For instance, in Well TF1, the OVP was determined to be 7205 psi at a depth of 2132 m, corresponding to a gradient of 1.03 psi/ft. The consistent OBG values observed across all wells suggest that the vertical stress regime in the studied field has remained stable over time, despite the effects of prolonged hydrocarbon production.

3.2. PP and FG Modeling

3.2.1. Well TF1

The development of PPFG model for Well TF1 was conducted to characterize the geomechanical properties of the Ordovician IV-3 unit (Figure 4). The pore pressure was estimated using sonic log data, calibrated against direct pressure measurements obtained from RFT over the interval 2001–2014 m. The PP exhibited a gradient of 0.422 psi/ft, corresponding to an average pressure of 2784 psi (8.13 ppg). This value is slightly below the hydrostatic pressure typically used during drilling operations. The fracture pressure was determined to have a gradient ranging between 0.53 and 0.60 psi/ft (10.19–11.53 ppg), equating to approximately 3705 psi. This estimate was calibrated using LOT data obtained at a depth of 1999 m. The obtained FG was compared with the findings of Baylocq et al. [45], which documented fracture gradient values ranging from 0.54 to 1.06 psi/ft in the region. The higher gradient values observed in wells located in the southern part of the field were attributed to tectonic effects. Operational reports from the rig indicate that the 6 in. section was drilled using oil-based mud (OBM) with a density ranging between 8.18 and 8.22 ppg. This mud weight proved to be a reliable proxy, maintaining a slightly overbalanced condition without exceeding the FG. Notably, no instances of mud loss were reported in the daily drilling records, confirming the effectiveness of the selected mud weight in maintaining wellbore stability and avoiding circulation losses.

3.2.2. Well TF2

During the 6 in. drilling phase, operations encountered the Silurian Argillaceous Gothlandian formation, along with the Ordovician IV-3 and IV-2 units. Upon drilling through the cement, the operators proceeded with OBM at a density of 7.76 ppg, covering the interval from 2050 m to 2059 m. At this depth, lost circulation occurred within the Ordovician IV-3 unit. Despite multiple attempts to seal the loss zone by injecting lost circulation material (LCM) pills, these efforts proved ineffective. The operators faced substantial delays in resuming drilling, necessitating tripping operations, reducing the mud weight to 7.59 ppg, and circulating at variable flow rates until mud returns were re-established.
Analysis of the generated PPFG model for Well TF2 (Figure 4) indicated that the current PP and FG for the Ordovician IV-3 unit were calculated at 5.81 ppg and within the range of 7.40 to 8.27 ppg, respectively. The initial drilling fluid density of 7.76 ppg (equivalent circulating density (ECD) = 7.92 ppg; flow rate = 1250 L/min) was subsequently reduced to 7.59 ppg (ECD = 7.74 ppg; flow rate = 1250 L/min). However, both mud weights exceeded the FG at certain intervals, resulting in bottom hole pressure surpassing the fracture threshold and triggering lost circulation. When the flow rate was reduced to 800 L/min, the ECD decreased, subsequently minimizing the loss rate. Drilling continued under conditions of partial fluid loss.

3.2.3. Well TF3

Prior to initiating the drilling of the new 6 in. section, the existing mud with a density of 9.01 ppg was replaced by a lighter mud of 7.76 ppg. Drilling commenced at a depth of 2002 m following the removal of the cement. However, at 2006 m, lost circulation was encountered. In response, LCM pills with concentrations ranging from 300 kg/m3 to 800 kg/m3, were pumped into the wellbore, but these efforts were unsuccessful in fully mitigating the losses. A reduction in the mud weight to 7.59 ppg, coupled with a decrease in the flow rate from 1250 L/min to 500 L/min, eventually led to a noticeable decline in the loss rate. Analysis of the PPFG model for Well TF3 revealed that in the Ordovician reservoir (IV-3 unit), the mud weight applied during drilling, ranging between 7.76 ppg and 7.43 ppg (ECD between 7.93 ppg and 7.59 ppg at flow rates of 1250–800 L/min), exceeded the FG profile, which varied between 7.56 ppg and 8.78 ppg at certain intervals (Figure 4). This overpressure condition contributed to the occurrence of lost circulation. Upon further reducing the flow rate to 500 L/min, the ECD dropped below the fracture pressure threshold, effectively halting the losses and stabilizing the wellbore.

3.2.4. Well TF4

The operational sequence for this well proceeded as follows: The initial drilling mud with a density of 9.01 ppg was displaced by a lower-density mud of 7.76 ppg. Cement was drilled out over the interval from 1995 m to 2000 m, marking the initiation of formation drilling at 2000 m. Mud losses were observed at depths of 2003 m, 2007 m, and 2016 m, corresponding to the top of the Ordovician IV-3 unit. In response, LCM pills with concentrations ranging between 600 kg/m3 and 1400 kg/m3 were introduced into the wellbore; however, these mitigation efforts were ineffective in halting fluid losses. A reduction in flow rate, coupled with a decrease in mud weight to 7.43 ppg, successfully curtailed the losses. Drilling operations continued under controlled flow conditions to mitigate the risk of partial mud losses and maintain wellbore stability. The PPFG model developed for Well TF4 revealed that, under static conditions, the applied mud weight in the range of 7.43 to 7.76 ppg surpassed the fracture gradient, which varied between 7.67 and 9.14 ppg across certain intervals of the Ordovician sandstone IV-3 unit (Figure 4). This discrepancy suggests that during dynamic drilling conditions, ECD exceeded the FG, further exacerbating the potential for fluid losses. The occurrence of lost circulation is attributed to the utilization of a drilling mud window that was not adequately aligned with the present state of the reservoir.

3.2.5. Well TF5

Following the displacement of the drilling mud from 9.01 ppg to 7.51 ppg and the removal of cement between 1968 m and 1972 m, formation drilling commenced at a depth of 1972 m. Mud losses were encountered at 1979 m, corresponding to the top of the Ordovician sandstone reservoir (IV-3 unit). Similar to other wells, LCM pills were deployed, and the mud weight was further reduced to 7.35 ppg to facilitate the continuation of drilling operations. As illustrated in Figure 4, the PPFG model reveals that the mud weight profile closely overlaps the FG profile across a significant interval. This overlap indicates that the ECD exceeded the fracture gradient, causing mud losses.

4. Discussion

A comparative analysis with the earlier drilled well (TF1), where no mud losses were reported, revealed a consistent pattern of mud losses in the other four studied wells (TF2, TF3, TF4, and TF5). Examination of the generated PP and FG profiles indicated that the mud weight applied during drilling exceeded the FG in multiple intervals, resulting in lost circulation within the Ordovician sandstone reservoir (IV-3 unit). Detailed analysis of the estimated parameters (Table 3) showed an average depletion in reservoir pressure of 744 psi (ΔPP = 5.13 MPa), accompanied by a reduction in fracture pressure of approximately 855 psi (ΔFP = 5.896 MPa).
The hydrocarbon production from the Ordovician reservoir in the TFT field commenced in 1967 [46], with peak production achieved in 1976 at a rate of approximately 122.05 thousand barrels per day (bpd) of crude oil and condensate (Figure 5). Current economic projections estimate that production will continue until the field reaches its economic limit in 2059. However, this prolonged extraction has resulted in the depletion of this reservoir, which has notably impacted wellbore stability during drilling operations. Reservoir depletion has led to alterations in the in situ stress magnitudes and the mud weight window, narrowing the operational range available for drilling. These changes have increased the risk of exceeding the FG, thereby contributing to mud losses and associated operational challenges. The findings underscore the critical need for adaptive drilling strategies, including the reassessment of mud weight parameters, to account for the evolving geomechanical conditions of the reservoir.

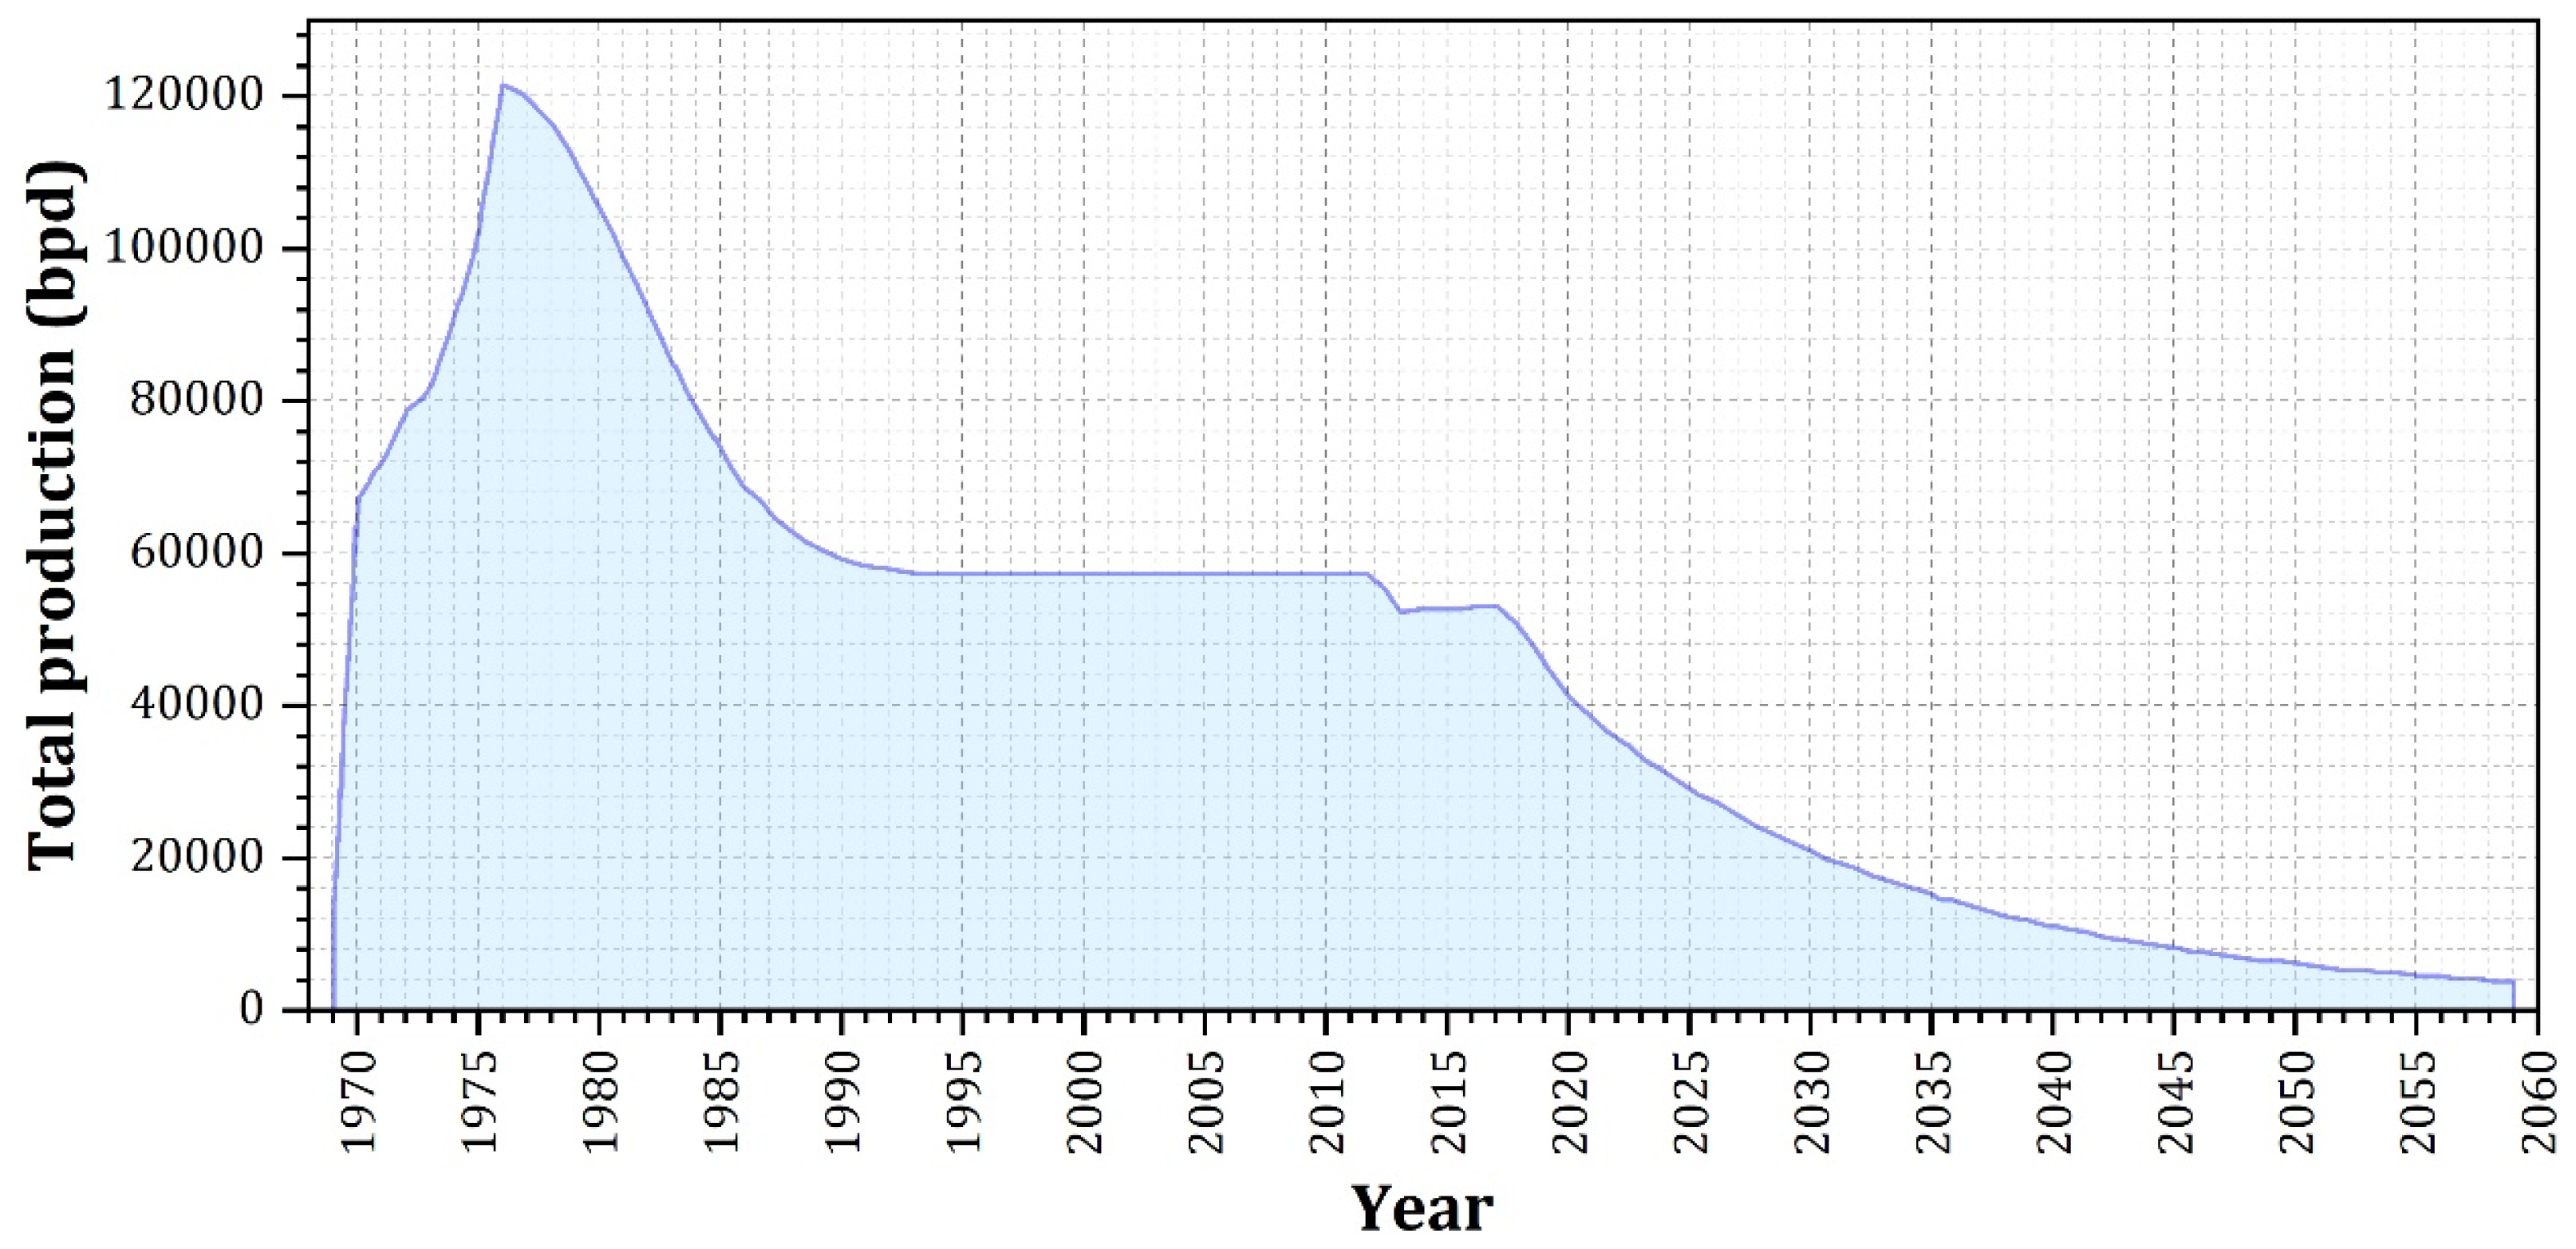
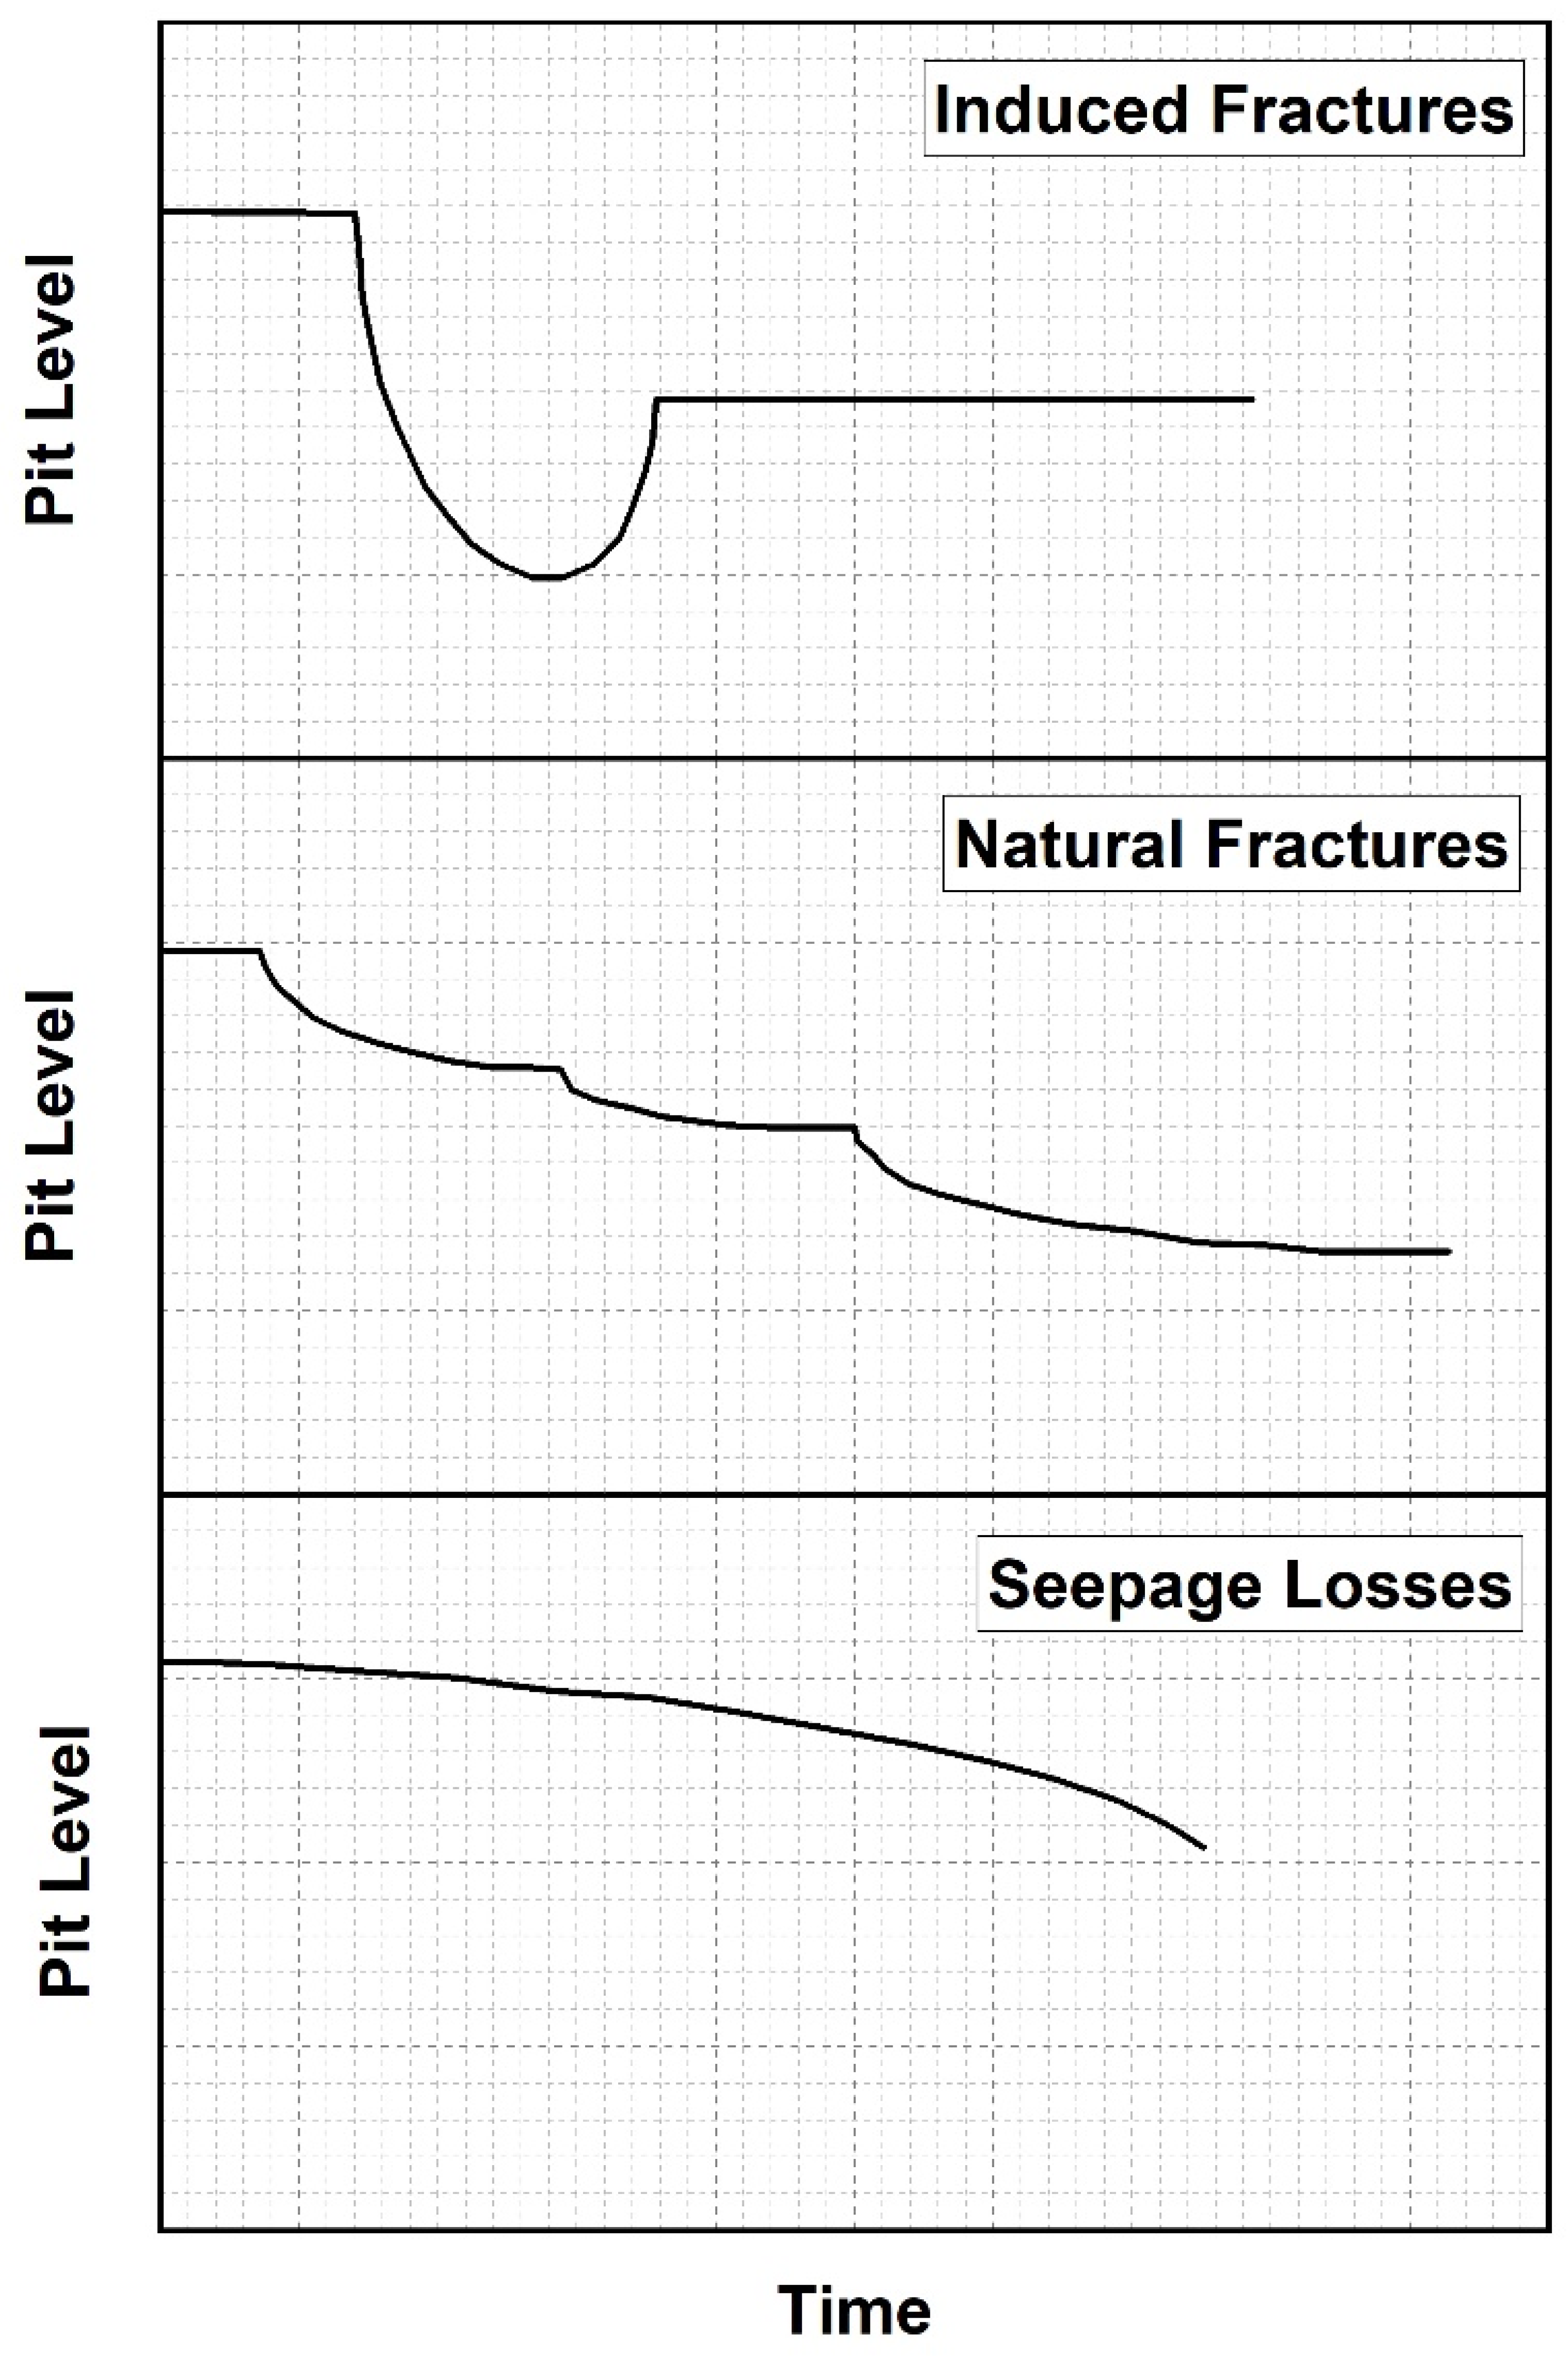
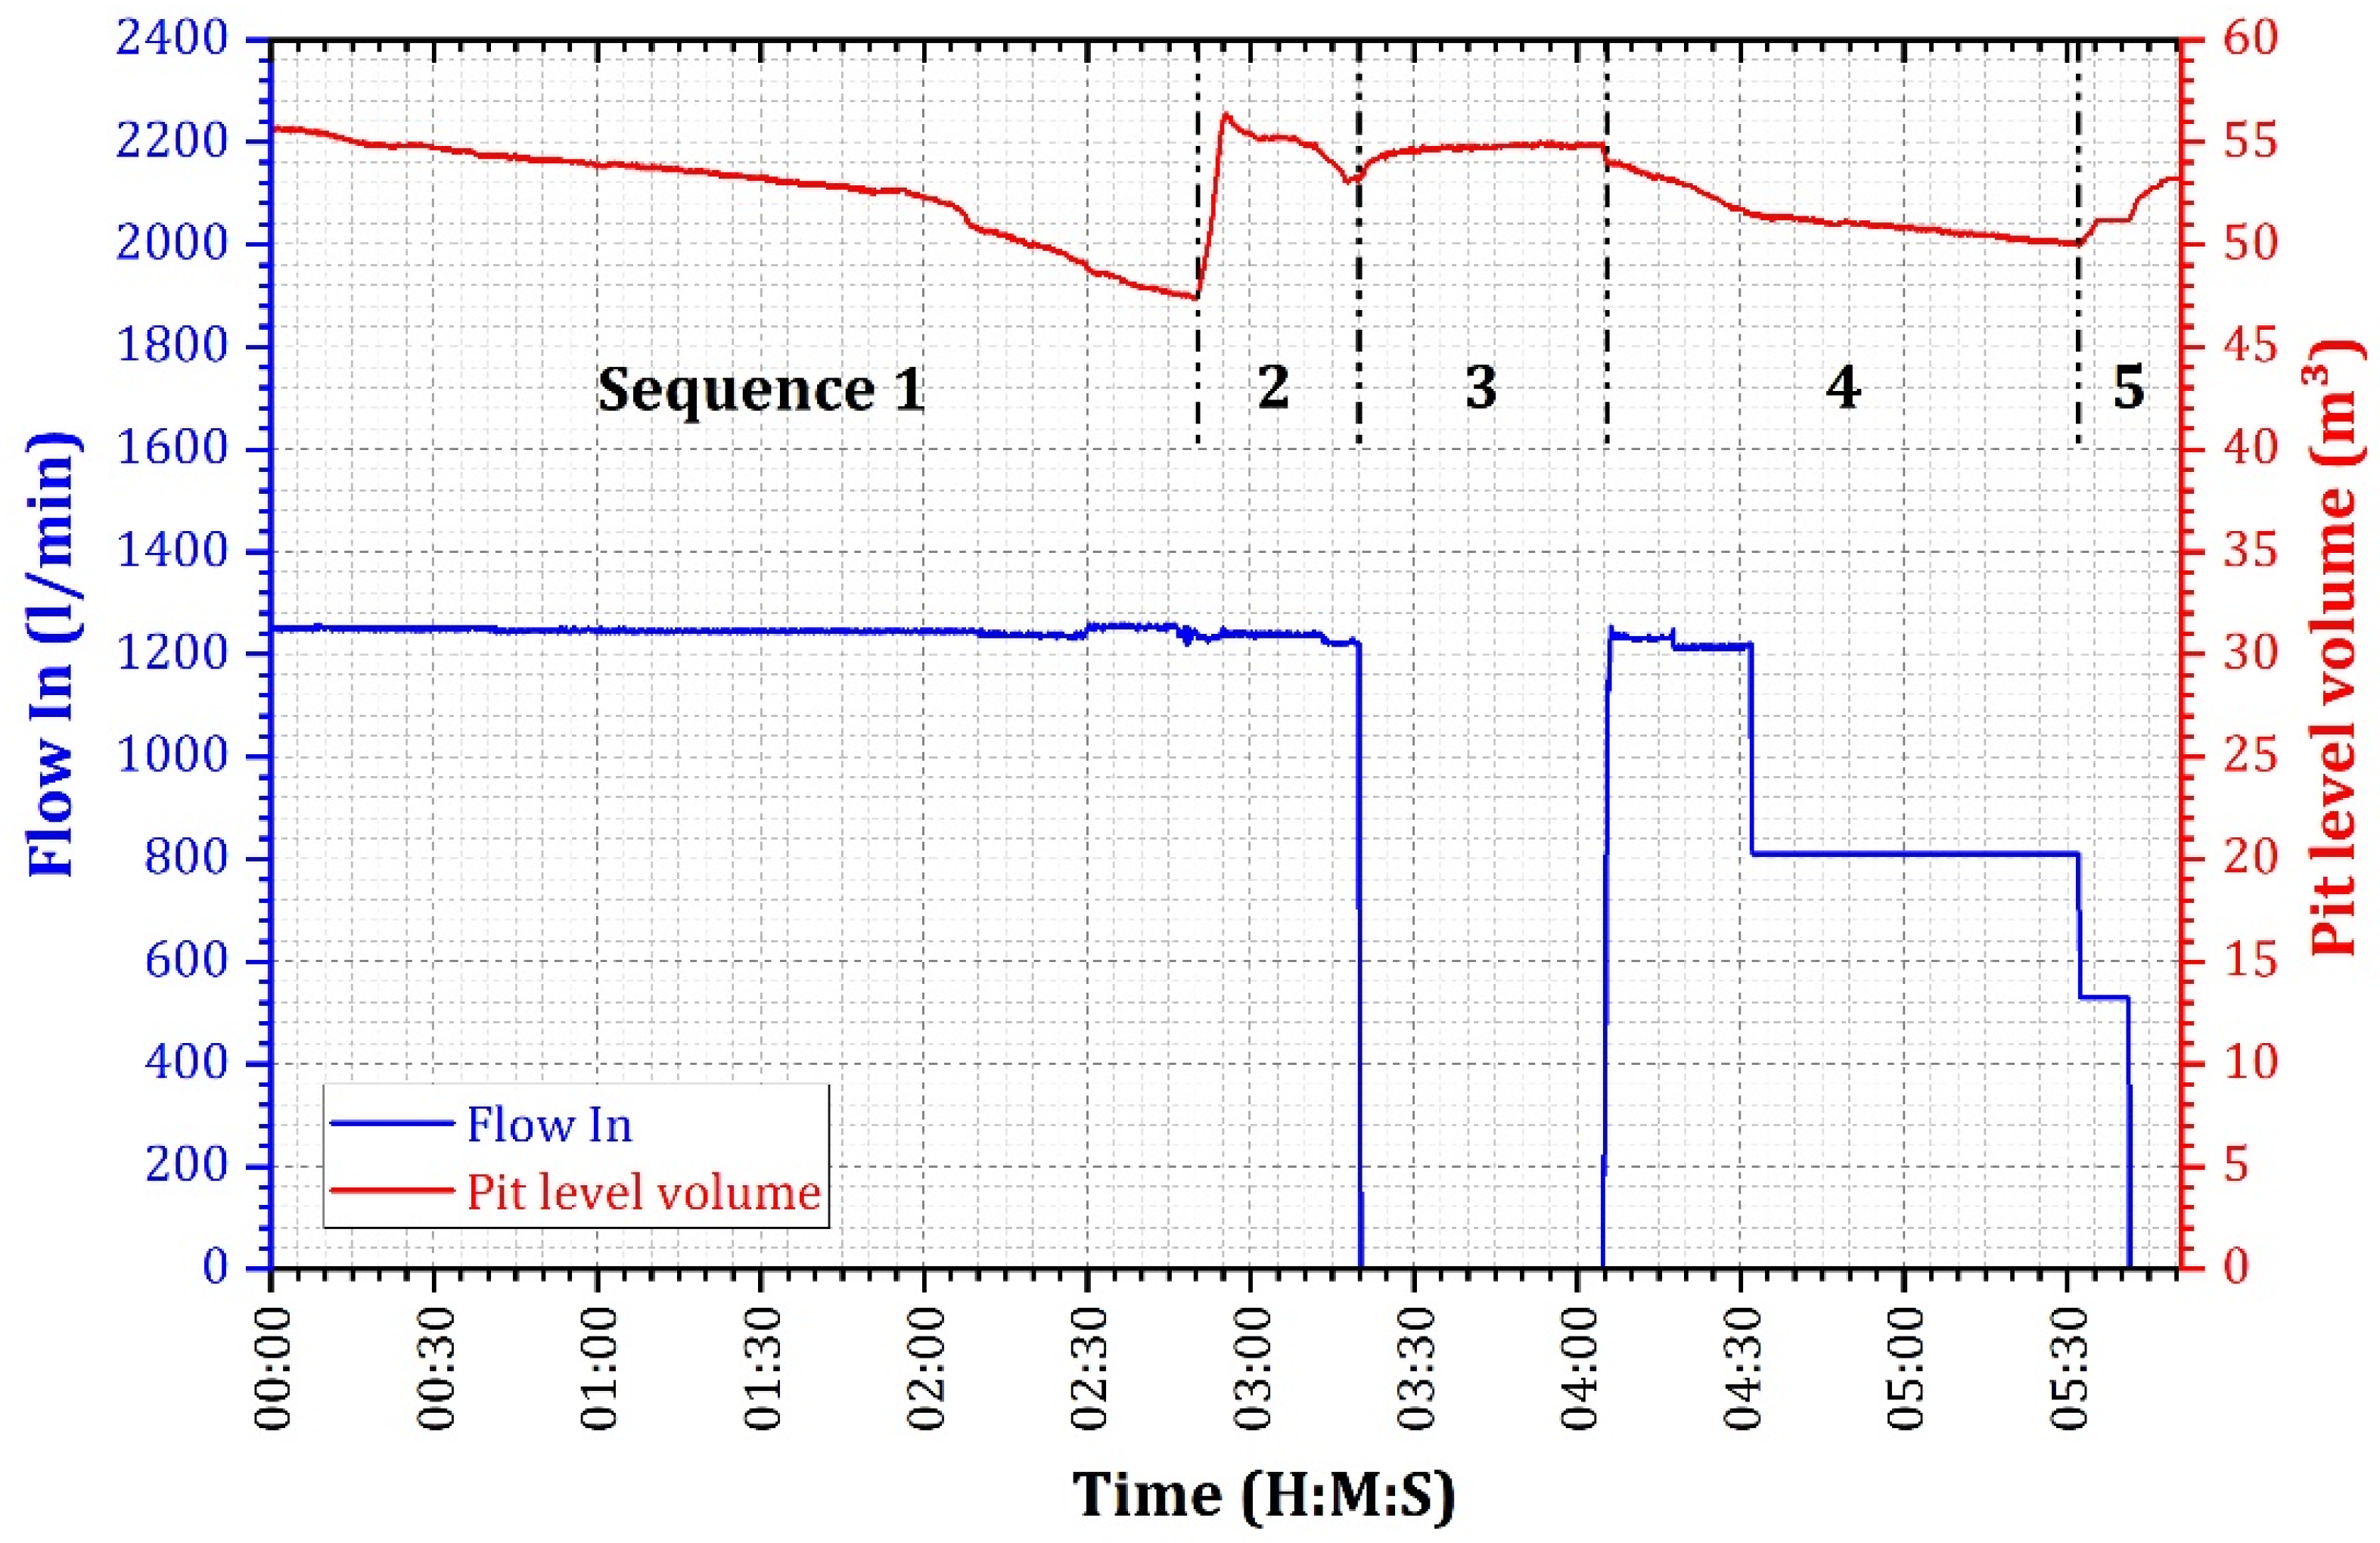
Mud Losses Monitoring While Drilling

Lost circulation can be classified into natural and induced losses, each governed by distinct mechanisms. Natural losses occur through pores or matrix in high-permeability formations, such as coarse sands, gravels, and depleted reservoirs, where mud losses are common when pore sizes exceed the mud particle size by a factor of three [47]. Permeable natural fractures, with apertures ranging from microns to several millimeters, also contribute significantly to circulation losses due to their ability to facilitate fluid migration [47]. Additionally, cavernous formations, formed over geological timescales in soluble rocks like limestone, dolomite, and salt, create voids of varying sizes, from microscopic to large tunnels, resulting in severe mud losses. Induced losses, on the other hand, occur when the ECD exceeds the formation’s FG, causing the formation to fracture. These losses are often linked to pressure surges during drilling, leading to the opening of induced fractures and subsequent fluid loss. The most commonly utilized method for detecting mud losses during drilling involves monitoring changes in the level of the mud pits. Figure 6 qualitatively illustrates the response of mud losses over time, as reflected by variations in mud pit levels. The temporal behavior of pit level changes differs depending on the type of formation loss: pores, natural fractures, or induced fractures. Losses into porous formations typically begin slowly and increase gradually over time, as the fluid permeates the pore spaces. In contrast, losses into natural fractures exhibit a distinct pattern, characterized by an initial rapid loss followed by a gradual decline as the fractures reach equilibrium with the fluid pressure [48,49]. For drilling-induced fractures, the behavior is more complex and highly sensitive to changes in fluid pressure. Fracture apertures respond dynamically to variations in pressure, leading to alternating loss or gain of drilling fluid. For instance, turning the pumps off and on during drilling can result in frequent pressure fluctuations, causing induced fractures to alternately open and close [50]. This dynamic process directly influences the flow behavior, with intermittent fluid losses or gains depending on the pressure differential across the fracture plane.
The same approach is used in this study; pit-level monitoring is combined with mud flow dynamics to evaluate fluid losses during drilling operations. The distinctive signatures observed in the combined dataset enabled discrimination between losses attributed to pre-existing fractures and those associated with hydraulically induced fractures formed during the drilling process. In this context, Figure 7 presents a comprehensive analysis of the evolution of drilling parameters in Well TF3, integrating pit-level monitoring with mud flow dynamics to systematically assess fluid loss behavior within the study area.
The analysis of Figure 7 is divided into five distinct sequences, highlighting the mud losses dynamics during drilling operations. Sequence 1 corresponds to the drilling of the 6 in. hole section within the IV-3 unit, during which partial mud losses were observed at a rate exceeding 1 m3/h. To mitigate these losses, mud transfer operations were undertaken, reducing the mud weight and consequently lowering the loss rate (Sequence 2). In Sequence 3, the mud pumps were switched off during pipe connection operations, resulting in a stabilized mud level with a slight increase attributed to backflow. This behavior reflects the reduction in dynamic pressure when the pumps are off, allowing the induced fractures to partially close under the natural formation stress. The observed slight increase in mud level suggests that the losses are pressure-dependent, a characteristic commonly associated with hydraulically induced fractures. Sequence 4 involved a stepwise reduction in the mud flow rate to 1300 L/min and subsequently to 800 L/min. This adjustment led to a significant decrease in the mud loss rate, demonstrating a direct correlation between flow rate and loss mitigation. In Sequence 5, further reduction in the flow rate to 500 L/min resulted in the cessation of mud losses and a slight rise in the mud pit level. This response strongly supports the hypothesis of induced fractures, as their closure is highly sensitive to pressure changes. At a flow rate of 500 L/min, the pressure dropped below the fracture closure pressure, enabling partial or full closure of the induced fractures. The observed sensitivity of mud losses to flow rate changes provides compelling evidence that the losses are attributable to induced fractures rather than natural fractures.
A comparative analysis of Figure 6 and Figure 7 reveals that the overall slope of Sequence 1 exhibits a pattern that closely aligns with the characteristic curve of seepage losses. However, a more detailed analysis of the period between 00:00 and 02:05, which falls within this sequence, suggests that the observed pit-level decrease during this timeframe was primarily attributed to normal drilling operations rather than seepage losses. As drilling progressed, the drilling mud was continuously displaced to fill the newly formed wellbore, while additional mud volume was lost with the cuttings removed at the shale shakers. Furthermore, surface equipment, including the mud cleaner and centrifuge, also contributed to surface-level mud reductions. These combined factors account for the gradual pit-level decline, indicating that the reduction was a result of routine drilling processes rather than seepage-related losses.
Another method utilized to validate the hypothesis of induced fractures involves the utilization of real-time Logging-While-Drilling (LWD) measurements. This approach is particularly effective in distinguishing naturally occurring fractures from those induced during drilling operations by analyzing the separation of shallow and deep resistivity measurement curves over time [51]. Such analysis facilitates the identification of fracture characteristics and allows for targeted adjustments to the drilling program, thereby mitigating the effects of induced fractures on wellbore stability and enhancing operational efficiency. In this study, real-time resistivity data acquired from Well TF3 was evaluated to investigate fracture behavior and the formation’s response to drilling operations. Figure 8 illustrates a distinct divergence between shallow and deep resistivity measurements in the interval between 2006 and 2013 m, which correlates with the reported mud loss events. This observation provides further evidence of the relationship between elevated shallow resistivity and the presence of induced fractures within these zones. The resistivity analysis conclusively indicates that the observed mud losses in the studied intervals are predominantly caused by induced fractures. The anomalies in shallow resistivity, characterized by abrupt increases and significant variability, are indicative of OBM infiltrating the fractures. These findings, supported by gamma-ray data and corroborating observations, strongly suggest that the fractures were induced during drilling operations because of mud pressures exceeding the formation’s fracture resistance.
To mitigate mud losses resulting from induced fractures, various drilling strategies can be implemented to enhance wellbore stability. Wellbore strengthening techniques, such as the application of optimized lost circulation materials (LCMs), play a crucial role in sealing fractures and preventing further fluid losses. Additionally, mud weight optimization is essential to ensure that wellbore pressure remains within the safe operating window, thereby minimizing the risk of fracture propagation. Furthermore, Managed Pressure Drilling (MPD) provides a real-time pressure control mechanism, allowing for precise adjustments to bottom-hole pressure and reducing the impact on fractured formations. When integrated with real-time monitoring technologies, these mitigation strategies can significantly minimize mud losses and improve wellbore stability, particularly in depleted reservoirs.

5. Conclusions

This study provided a comprehensive analysis of PP, OVP, and FG within the Ordovician sandstone reservoir of the TFT field, with the objective of identifying the primary factors contributing to mud losses experienced during drilling operation. Prolonged hydrocarbon production has led to significant depletion of the reservoir, resulting in a notable reduction in pore pressure from 2784 psi to 2041 psi, which, in turn, has caused a corresponding decrease in the fracture gradient from 3705 psi to 2850 psi. This narrowing of the pressure window, driven by depletion-induced stress redistribution, has increased the risk of lost circulation and wellbore instability during drilling operations. To mitigate these challenges, a drilling mud weight window of 6.24 to 7.40 ppg is recommended, reflecting the estimated boundaries of pore pressure and fracture gradient in the Ordovician IV-3 reservoir. Adopting the optimized mud weight window significantly improves wellbore stability, thereby minimizing the risk of lost circulation and the associated operational costs. By effectively reducing mud losses, this approach decreases the reliance on additional drilling fluids and lost circulation materials (LCMs), resulting in direct cost savings. Furthermore, maintaining an optimal mud weight mitigates wellbore instability, reducing non-productive time (NPT) caused by well control incidents and remedial interventions. Precise mud weight selection enhances drilling efficiency, lowers operational expenditures, and ultimately improves the economic viability of the project. Future research could expand on this analysis by conducting a comprehensive cost–benefit evaluation to quantify these advantages in similar depleted reservoirs, providing valuable insights for reservoir management and drilling optimization strategies.
The findings underscore the critical need for adaptive drilling strategies that account for evolving reservoir conditions, highlighting the importance of continuous monitoring and adjustment of mud weight to ensure operational efficiency. However, the study also revealed certain limitations that constrained the depth of the analysis, most notably the unavailability of image log data, which hindered the ability to conduct a more thorough geomechanical assessment. The absence of such data limited the accurate identification of fracture orientation, the characterization of in situ stress fields, and the determination of mechanical properties within the reservoir rock—key factors necessary for a holistic understanding of subsurface conditions and fracture mechanics. Future investigations should prioritize the acquisition and integration of borehole image logs into geomechanical modeling to enhance the accuracy of fracture width distribution and fracture initiation pressure (FIP) estimation, both of which are critical for wellbore strengthening and the optimization of lost circulation material (LCM) design. These logs provide high-resolution visualizations of fracture geometry, orientation, and density, allowing for a more precise assessment of formation behavior under stress conditions. Accurate fracture width distribution is essential for the effective selection and design of LCMs, ensuring that the particle size distribution (PSD) of the materials aligns with fracture aperture dimensions, thereby improving fracture sealing efficiency and mitigating fluid losses.
Additionally, further geomechanical studies are recommended to evaluate in situ stress magnitudes and directions, characterize the mechanical properties of loss-prone intervals, and analyze stress path evolution to better understand the subsurface stress state and the effects of reservoir depletion. Such studies will provide valuable insights into the mechanisms governing mud losses and fracture propagation, enabling the design of more effective drilling programs and contributing to the long-term sustainability of petroleum production in the region. By addressing current data gaps and advancing the understanding of reservoir geomechanics, operators can enhance drilling efficiency, minimize operational risks, and extend the productive lifespan of mature reservoirs, ensuring the continued viability of hydrocarbon extraction in the TFT field.

Author Contributions

Conceptualization, R.L., M.H., H.M., F.M. and O.M.; methodology, R.L., M.H., H.M. and F.M.; software, R.L., H.M. and F.M.; validation, R.L., H.M., F.M. and O.M.; formal analysis, M.H., H.M., F.M. and O.M.; investigation, R.L. and F.M.; resources, R.L. and F.M.; writing—original draft preparation, R.L. and F.M.; writing—review and editing, R.L., H.M., F.M. and O.M. visualization, H.M., F.M. and O.M.; supervision, O.M.; project administration, F.M. and O.M.; funding acquisition, R.L., F.M. and O.M. All authors have read and agreed to the published version of the manuscript.

Funding

This research received no external funding.

Data Availability Statement

All data will be available from the corresponding author upon request.

Acknowledgments

The authors would like to express their sincere gratitude to Sonatrach and especially to the personnel of the Production Division, Base Irara, Hassi Messaoud, for their invaluable help in the preparation of this scientific paper.

Conflicts of Interest

The authors declare that there are no conflicts of interest regarding the publication of this manuscript.

Abbreviations

The following abbreviations are used in this manuscript:
ECDEquivalent circulating density
FGFracture gradient
LCMLost circulation material
LOTLeak-Off Test
LWDLogging While Drilling
NCTNormal compaction trends
NPTNon-productive time
OBGOverburden gradient
OBMOil-based mud
OVPOverburden pressure
PPPore pressure
PPFGPore pressure fracture gradient model
RFTRepeat Formation Test
SvVertical stress
TFTTin Fouye Tabankort
TVDTrue vertical depth

References

  1. Zhao, L.; Yuan, C.; Shan, K.; Gao, M.; Long, X.; Xu, M.; Ao, T.; Yang, Y. Expandable profile liner technology for mitigating lost circulation and wellbore instability in geothermal drilling. Renew. Sustain. Energy Rev. 2025, 209, 115109. [Google Scholar] [CrossRef]
  2. Elrayah, A.A.I. Enhancing drilling operations: Prioritizing wellbore integrity, formation preservation, and effective mud waste control (case study). J. Eng. Appl. Sci. 2024, 71, 86. [Google Scholar] [CrossRef]
  3. Ounegh, A.; Hasan-Zadeh, A.; Khanaposhtani, M.M.; Kazaemzadeh, Y. Wellbore stability analysis based on the combination of geomechanical and petrophysical studies. Results Eng. 2024, 24, 103016. [Google Scholar] [CrossRef]
  4. Gholilou, A.; Vialle, S.; Madadi, M. Determination of safe mud window considering time-dependent variations of temperature and pore pressure: Analytical and numerical approaches. J. Rock Mech. Geotech. Eng. 2017, 9, 900–911. [Google Scholar] [CrossRef]
  5. Alawami, M.; Al-Yami, A.; Gharbi, S.; Al-Rubaii, M. A Real Time Geomechanics Drilling Mud Window to Enhance Drilling Efficiency. In Proceedings of the SPE EOR Conference at Oman Petroleum & Energy Show, Muscat, Oman, 21 March 2022. SPE-200033-MS. [Google Scholar] [CrossRef]
  6. Dodson, J.; Dodson, T.; Schmidt, V. Gulf of Mexico ’trouble time’ creates major drilling expenses: Use of cost-effective technologies needed. Offshore 2004, 64, 46–48. [Google Scholar]
  7. AEhsan, M.; Manzoor, U.; Chen, R.; Hussain, M.; Abdelrahman, K.; Radwan, A.E.; Ullah, J.; Iftikhar, M.K.; Arshad, F. Pore pressure prediction based on conventional well logs and seismic data using an advanced machine learning approach. J. Rock Mech. Geotech. Eng. 2024; in press. [Google Scholar]
  8. Khoshnaw, F.; Jaf, P.; Farkha, S. Pore, abnormal formation and fracture pressure prediction. WIT Trans. Ecol. Environ. 2014, 186, 579–593. [Google Scholar] [CrossRef]
  9. Eaton, B.A. Fracture gradient prediction and its application in oilfield operations. J. Pet. Technol. 1969, 21, 1353–1360. [Google Scholar] [CrossRef]
  10. Mouchet, J.P.; Mitchell, A. Abnormal Pressures While Drilling: Origins, Prediction, Detection, Evaluation, 2nd ed.; Manuals Techniques; Elf Aquitaine: Boussens, France, 1989. [Google Scholar]
  11. Teufel, L.W.; Rhett, D.W.; Farrell, H.E. Effect of reservoir depletion and pore pressure drawdown on in situ stress and deformation in the Ekofisk field, North Sea. In Proceedings of the 32nd U.S. Symposium on Rock Mechanics (USRMS), Norman, OK, USA, 10–12 July 1991. ARMA-91-063. [Google Scholar]
  12. Kassem, A.A.; Sen, S.; Radwan, A.E.; Abdelghany, W.K.; Abioui, M. Effect of depletion and fluid injection in the Mesozoic and Paleozoic sandstone reservoirs of the October Oil Field, Central Gulf of Suez Basin: Implications on drilling, production and reservoir stability. Nat. Resour. Res. 2021, 30, 2587–2606. [Google Scholar] [CrossRef]
  13. Ghosal, D.; Daungkaew, S.; Karpfinger, F.; Chansiriwilaikul, N.; Han, S.E.; Cavalleri, C.; Kumar, V.; Hademi, N. Creating a Blueprint for Successful CCS in Southeast Asia: Roadmap to a Sustainable Future. In Proceedings of the International Petroleum Technology Conference, Kuala Lumpur, Malaysia, 18–20 February 2025. [Google Scholar] [CrossRef]
  14. Hashemi, S.S.; Kovscek, A. Numerical Simulation of CO2 Storage in the Soft Sediments of Depleted Reservoirs in the Gulf of Mexico. In Proceedings of the SPE Western Regional Meeting, Palo Alto, CA, USA, 16–18 April 2024. [Google Scholar] [CrossRef]
  15. Kuakool, S.; Rahmati, H.; Al-Ismaeeli, O.; Awae, H.; Suk-iam, S.; Kulananpakdee, K. Pre-Drill 1D Geomechanical Earth Models for Optimizing Drilling Programs in the Phitsanulok Basin, Thailand. In Proceedings of the SPWLA Asia-Pacific Regional Conference, Bangkok, Thailand, 6–9 October 2024. [Google Scholar]
  16. Melikov, R.; Krasnikov, A.; Tatur, O.; Stishenko, S.; Lobashov, V.; Chaschin, S.; Anh, N.L.; Chung, H.N.; Sustavov, V.; Âu, P.V. Implementing Innovative Technology to Provide Pore Pressure Prediction During Drilling Operations: A Case Study of the ‘White Tiger’ Offshore Oilfield. In Proceedings of the International Geomechanics Conference, Kuala Lumpur, Malaysia, 18–20 November 2024. [Google Scholar] [CrossRef]
  17. Askri, H.; Belmecheri, A.; Benrabah, B.; Boudjema, A.; Boumendjel, K.; Daoudi, M.; Drid, M.; Ghalem, T.; Docca, A.M.; Ghandriche, H.; et al. Geology of Algeria. In Well Evaluation Conference Algeria (WEC); Schlumberger: Houston, TX, USA, 1995; pp. 1–93. [Google Scholar]
  18. Wendt, J.; Kaufmann, B.; Belka, Z. Devonian stratigraphy and depositional environments in the southern Illizi Basin (Algerian Sahara). J. Afr. Earth Sci. 2009, 54, 85–96. [Google Scholar] [CrossRef]
  19. Baouche, R.; Sen, S.; Ganguli, S.S. Pore pressure and in-situ stress magnitudes in the Bhiret Hammou hydrocarbon field, Berkine Basin, Algeria. J. Afr. Earth Sci. 2020, 171, 103945. [Google Scholar] [CrossRef]
  20. Daniels, R.; Emme, J.J. Petroleum system model, eastern Algeria, from source rock to accumulation: When, where and how. In Proceedings of the Seminar on Source Rocks and Hydrocarbon Habitat in Tunisia, Tunis, Tunisia, 15–18 November 1995; Entreprise Tunisienne d’Activités Petrolieres Memoir: Tunis, Tunisia; pp. 101–124. [Google Scholar]
  21. Echikh, K. Geology and hydrocarbon occurrences in the Ghadames basin, Algeria, Tunisia, Libya. Geol. Soc. London, Spec. Publ. 1998, 132, 109–129. [Google Scholar] [CrossRef]
  22. Khamehchi, E.; Khaleghi, M.R.; Abbasi, A.; Mahdavi Kalatehno, J. Estimating the Formation Fracture Pressure Through Geomechanical Modeling. In Applied Matrix Acidizing of Carbonate Reservoir; Petroleum Engineering; Springer Nature: Cham, Switzerland, 2024; pp. 45–73. [Google Scholar] [CrossRef]
  23. Alneasan, M.; Behnia, M.; Bagherpour, R. The effect of Poisson’s ratio on the creation of tensile branches around dynamic faults. J. Struct. Geol. 2020, 131, 103950. [Google Scholar] [CrossRef]
  24. Abdollahipour, A.; Soltanian, H.; Pourmazaheri, Y.; Kazemzadeh, E.; Fatehi-Marji, M. Sensitivity analysis of geomechanical parameters affecting a wellbore stability. J. Cent. South Univ. 2019, 26, 768–778. [Google Scholar] [CrossRef]
  25. Fjaer, E.; Holt, R.M.; Horsrud, P.; Raaen, A.M.; Risnes, R. Petroleum Related Rock Mechanics, 2nd ed.; Elsevier Science Publishers B.V.: Amsterdam, The Netherland, 2008; pp. 1–53. [Google Scholar] [CrossRef]
  26. Cui, L.; Cheng, A.H.; Abousleiman, Y. Poroelastic Solution for an Inclined Borehole. J. Appl. Mech. 1997, 64, 32–38. [Google Scholar] [CrossRef]
  27. Han, Y.; Liu, C.; Phan, D.; AlRuwaili, K.; Abousleiman, Y. Advanced wellbore stability analysis for drilling naturally fractured rocks. In Proceedings of the SPE Middle East Oil and Gas Show and Conference, Manama, Bahrain, 18–21 March 2019. SPE-195021-MS, D032S077R002. [Google Scholar] [CrossRef]
  28. Eaton, B.A.; Eaton, T.L. Fracture gradient prediction for the new generation. World Oil 1997, 218, 93–100. [Google Scholar]
  29. Wang, H. Theory of Linear Poroelasticity with Applications to Geomechanics and Hydrogeology, 1st ed.; Princeton University Press: Princeton, NJ, USA, 2000. [Google Scholar]
  30. English, J.M.; Finkbeiner, T.; English, K.L.; Cherif, R.Y. State of stress in exhumed basins and implications for fluid flow: Insights from the Illizi Basin, Algeria. Geol. Soc. Lond. Spec. Publ. 2017, 458, 89–112. [Google Scholar] [CrossRef]
  31. Plumb, R.A.; Evans, K.F.; Engelder, T. Geophysical log responses and their correlation with bed-to-bed stress contrasts in Paleozoic rocks, Appalachian Plateau, New York. J. Geophys. Res. 1991, 96, 14509–145280. [Google Scholar] [CrossRef]
  32. Sen, S.; Corless, J.; Dasgupta, S.; Maxwell, C.; Kumar, M. Issues faced while calculating overburden gradient and picking shale zones to predict pore pressure. In Proceedings of the First EAGE Workshop on Pore Pressure Prediction, Pau, France, 19–21 March 2017. [Google Scholar] [CrossRef]
  33. Radwan, A.E.; Abudeif, A.M.; Attia, M.M.; Mohammed, M.A. Pore and fracture pressure modeling using direct and indirect methods in Badri Field, Gulf of Suez, Egypt. J. Afr. Earth Sci. 2019, 156, 133–143. [Google Scholar] [CrossRef]
  34. Aadnoy, B.S.; Looyeh, R. Petroleum Rock Mechanics: Drilling Operations and Well Design, 2nd ed.; Gulf Professional Publishing: Cambridge, MA, USA, 2019. [Google Scholar]
  35. Vega, M.P.; de Moraes Oliveira, G.F.; Fernandes, L.D.; Martins, A.L. Monitoring and control strategies to manage pressure fluctuations during oil well drilling. J. Pet. Sci. Eng. 2018, 166, 337–349. [Google Scholar] [CrossRef]
  36. Eaton, B.A. The equation for geopressure prediction from well logs. In Proceedings of the SPE Annual Technical Conference and Exhibition, Dallas, TX, USA, 28 September–1 October 1975. [Google Scholar] [CrossRef]
  37. Sen, S.; Ganguli, S.S. Estimation of pore pressure and fracture gradient in Volve field, Norwegian North Sea. In Proceedings of the SPE Oil and Gas India Conference and Exhibition, Mumbai, India, 9–11 April 2019. [Google Scholar] [CrossRef]
  38. Fang, Z.; Zamikhan, N.; Tarang, R.T.; On, C.K.; Huver, P.H. An Integrated Geomechanical Approach to Accurately Predicting the Fracture Gradient for Mitigating Drilling Losses of Challenging Wellbores. In Proceedings of the SPE/IADC Drilling Conference and Exhibition, The Hague, The Netherlands, 5–7 March 2019. [Google Scholar] [CrossRef]
  39. Jamshidian, M.; Mansuri Zadeh, M.; Mohammadzadeh, O.; Abdideh, M. Developing a geomechanical model to predict breakdown pressure in a vertical borehole using failure analysis: A case study. Geomech. Geophys. Geo-Energ. Geo-Resour. 2024, 10, 179. [Google Scholar] [CrossRef]
  40. Udo, K.I.; George, N.J.; Akankpo, A.O.; Azuoko, G.B.; Aka, M.U. Determining fracture pressure gradients from well logs. Int. J. Adv. Geosci. 2020, 81, 5–9. [Google Scholar] [CrossRef]
  41. Zhang, J.; Wieseneck, J. Challenges and surprises of abnormal pore pressures in shale gas formations. In Proceedings of the SPE Annual Technical Conference and Exhibition, Denver, CO, USA, 30 October–2 November 2011. [Google Scholar] [CrossRef]
  42. Matthews, W.R. How to predict formation pressure and fracture gradient from electric and sonic logs. Oil and Gas 1967, 20, 92–106. [Google Scholar]
  43. Banerjee, A.; Chatterjee, R. Pore pressure modeling and in situ stress determination in Raniganj basin, India. Bull. Eng. Geol. Environ. 2022, 81, 49. [Google Scholar] [CrossRef]
  44. Zhang, J. Pore pressure prediction from well logs: Methods, modifications, and new approaches. Earth-Sci. Rev. 2011, 108, 50–63. [Google Scholar] [CrossRef]
  45. Baylocq, P.; Sahnoune, A.; Martin, A.; Sims, M. Tin Fouye Tabankort gas field-how understanding of abnormal fracture propagation and reservoir uncertainties led to successful hydraulic fracturing operations. In Proceedings of the SPE Europec featured at EAGE Conference and Exhibition, The Hague, The Netherlands, 20–22 October 1998. [Google Scholar] [CrossRef]
  46. Alem, N.; Assassi, S.; Benhebouche, S.; Kadi, B. Controls on hydrocarbon occurrence and productivity in the F6 reservoir, Tin Fouyé-Tabankort area, NW Illizi Basin. Geol. Soc. Lond. Spec. Publ. 1998, 132, 175–186. [Google Scholar] [CrossRef]
  47. Beda, G.; Carugo, C. Use of mud microloss analysis while drilling to improve the formation evaluation in fractured reservoir. In Proceedings of the SPE Annual Technical Conference and Exhibition, New Orleans, LA, USA, 30 September–3 October 2001. [Google Scholar] [CrossRef]
  48. Majidi, R.; Edwards, S.; Zhang, J.; Sant, R.; Last, N. Drilling depleted sands: Geomechanics, challenges and mitigations. In Proceedings of the SPE Annual Technical Conference and Exhibition, Houston, TX, USA, 28–30 September 2015. [Google Scholar] [CrossRef]
  49. Dyke, C.G.; Wu, B.; Milton-Tayler, D. Advances in characterizing natural-fracture permeability from mud-log data. SPE Form. Eval. 1995, 10, 160–166. [Google Scholar] [CrossRef]
  50. Majidi, R.; Miska, S.Z.; Zhang, J. Fingerprint of Mud Losses into Natural or Induced Fractures. In Proceedings of the SPE European Formation Damage Conference, Noordwijk, The Netherlands, 7–10 June 2011. [Google Scholar] [CrossRef]
  51. Bratton, T.R.; Rezmer-Cooper, I.M.; Desroches, J.; Gille, Y.E.; Li, Q.; McFayden, M. How to diagnose drilling induced fractures in wells drilled with oil-based muds with real-time resistivity and pressure measurements. In Proceedings of the SPE/IADC Drilling Conference and Exhibition, Amsterdam, The Netherlands, 27 February–1 March 2001. [Google Scholar] [CrossRef]
Figure 1. Location of Illizi Basin in eastern province of Algeria. The studied TFT field has been marked by circle [17], modified.
Energies 18 01836 g001
Figure 2. TFT field Lithostratigraphy, unpublished Sonatrach internal report, 2020, modified.
Energies 18 01836 g002
Figure 3. Discrepancies between the default Amoco fitting parameters and the modified values derived for Wells TF3 and TF4: (a) Composite density profile (Track 04) for calculating overburden pressure (Track 05) in TF3. (b) Composite density profile (Track 04) for calculating overburden pressure (Track 05) in TF4.
Energies 18 01836 g003
Figure 4. Interpreted PP, OVP, and FG profiles of the studied wells in the TFT field.
Energies 18 01836 g004
Figure 5. Production evolution of crude oil in the TFT field.
Energies 18 01836 g005
Figure 6. Type of loss zone from pit-level trace [50].
Energies 18 01836 g006
Figure 7. Pump on/off signature during mud losses in induced fractures in Well TF3.
Energies 18 01836 g007
Figure 8. Shallow resistivity, deep resistivity, and gamma rays while drilling in mud loss zones in Ordovician reservoir IV-3 unit (Well TF3).
Energies 18 01836 g008
Table 1. Tops of Ordovician reservoir units in the studied wells. In Wells TF2 and TF5, the top of III-3 unit has not been penetrated by drilling (data collected from internal unpublished report of Sonatrach Company).
Wells
Ordovician UnitTF1TF2TF3TF4TF5
Top (m)IV-3 Unit20012057200320001979
IV-2 Unit20142073201420252000
III-3 Unit2066-20702056-
TD21302128215021202120
Table 2. Estimation of Poisson’s ratio in the studied wells.
Poisson’s Ratio
FormationLithology Well
TF1TF2TF3TF4TF5
IV-3Sandstone0.10–0.130.06–0.140.05–0.190.04–0.150.06–0.18
Shale0.14–0.20////
IV-2Sandstone0.12–0.140.06–0.18/0.08–0.190.09–0.18
Shale0.18–0.290.15–0.230.14–0.270.18–0.290.17–0.28
III-3Shale0.16–0.29/0.18–0.280.19–0.26/
Table 3. Estimated pore pressure and fracture gradients in the Ordovician reservoir. The last column shows the ECD used while drilling.
WellFormationPore Pressure (PP)Fracture Gradient (FG)Drilling Mud Weight
psi/ftppgpsi/ftppgppg
TF1IV-30.4228.110.531–0.6010.32–11.538.178–8.512
IV-20.4538.710.53–0.6810.19–13.07
III-30.4518.670.56–0.6910.76–13.26
TF2IV-30.3035.810.385–0.4307.40–8.277.598–7.765
IV-20.31–0.445.96–8.460.400–0.6107.69–11.73
TF3IV-30.3256.240.393–0.4567.56–8.787.431–7.765
IV-20.387.300.430–0.6308.27–12.11
III-30.387.300.450–0.7008.65–3.46
TF4IV-30.3156.060.398–0.4757.67–9.147.431–7.765
IV-20.4258.170.480–0.6809.23–13.07
III-30.407.690.520–0.59010.00–11.34
TF5IV-30.2925.610.387–0.4397.45–8.447.348–7.515
IV-20.41–0.447.88–8.460.45–0.678.65–12.88
Disclaimer/Publisher’s Note: The statements, opinions and data contained in all publications are solely those of the individual author(s) and contributor(s) and not of MDPI and/or the editor(s). MDPI and/or the editor(s) disclaim responsibility for any injury to people or property resulting from any ideas, methods, instructions or products referred to in the content.

