1. Introduction
Economic and legal conditions of the European power industry enforce higher participation of biomass in the thermal energy mix per power unit, due to the necessity of carbon dioxide emission reduction. Still, many power units in Europe are utilizing hard coal as a main fuel. Coal boilers with a thermal output higher than 50 MW are usually built using pulverized fuel fired technology because of the high efficiency of those units, which compensates for their high investment costs. An essential part of these power units is coal preparation installation based on vertical spindle mills, i.e., ring-ball and roller-bowl mills [
1,
2]. Milling and co-milling of large amounts of raw biomass in this type of pulverisers significantly lowers the mill capacity and deteriorates pulverized fuel milling quality, which results from the grinding mechanism employed by vertical spindle mills [
3]. Raw biomass has an anisotropic and fibrous structure, which makes milling by compression an ineffective process [
4,
5]. To ensure higher shares of biomass utilization conventional coal mills would have to be replaced with knife or beater pulverisers, characterized by higher milling capacity and lower energy consumption during biomass comminution. This approach would result in high initial investment expenditure, long construction duration, and later significant maintenance costs for milling elements exchange [
6]. Due to these disadvantages, an adjustment of fuel parameters for existing milling installations was proposed, by means of thermal pre-treatment of raw biomass.
The torrefaction process is widely considered a suitable pretreatment of biomass solid fuels. This process is carried out in order to improve the physicochemical properties of biomass, which brings its properties near to low-calorific coals [
7]. During the pretreatment process, raw biomass is heated in an inert or low-oxygen atmosphere at approximately atmospheric pressure and a temperature of about 200–320 °C, with a residence time of 5–120 min (typically 15–60 min) [
8]. The process is meant to achieve the desired properties of biomass fuel with minimal loss of the initial chemical energy of the fuel (resulting mainly from the devolatilization of biomass during torrefaction treatment). Torrefied biomass contains, typically, 70% of its initial weight and 90% of its original energy content, which makes its storage and transportation more cost-effective [
7,
9]. Biomass mainly consists of lignin, cellulose, hemicellulose, and other compounds like sugars and salts, starches, proteins, hydrocarbons, ash, and water. The mixture of these constituents differs with age, species, growth conditions, and growth location [
10]. Thermal degradation of hemicellulose, cellulose, and lignin during the torrefaction process leads to the production of a uniform-quality energy carrier with improved grindability, hydrophobic properties, and resistance to biological agents. The resulting fuel parameters depend on many factors, such as the torrefaction reactor design, process medium, temperature, and heat exposure time [
11,
12,
13,
14,
15]. Increased brittleness of torrefied biomass results mainly from shrinkage of lignocellulose and cracks forming in the structure of lignin, leading to a decrease in plastic and viscoelastic properties of biomass [
16].
Industrial mill capacity depends mainly on mill design, operational conditions, fuel parameters, and the desired fineness of the product [
2,
17,
18]. In the case of existing power units designed for milling installation, the range of mill operational parameters and product required fineness are fixed, so most of the changes in achievable mill capacity result from fuel parameters. Fuel chemical composition and mechanical properties cannot be used to predict mill capacity, and because of that empirical testers for determining fuel grindability were developed. Grindability can be described as energy consumption for the milling process related to the result of that process, i.e., change in the particle size distribution of the product [
19]. Different mill types utilize different comminution mechanisms and their combination, i.e., compression, tear, impact, abrasion, and shear [
20,
21,
22]. Each type of grindability tester should utilize the same comminution mechanism as the industrial mill, for which the test was developed. The majority of mill manufacturers predict mill capacity, during the comminution of a given fuel, with the use of calculation formulas or correction curves, based on the value of fuel grindability. Mill capacities obtained based on grindability indices are usually only roughly accurate and can differ from industrial data [
17,
23]. Grindability determination methods can be divided into batch and semi-continuous tests, which vary in terms of the obtained results quality and the degree of complexity of the test. Batch methods utilize fixed mass/volume samples comminuted in one cycle and the semi-continuous methods aim to simulate a steady-state continuous comminution process by means of multiple grinding cycles [
23,
24,
25,
26].
Vertical spindle mill capacity can be qualitatively predicted based on the Hardgrove Grindability Index (HGI) value of a given fuel. The Hardgrove Grindability test utilizes a batch process, which does not simulate the complex separation process occurring in industrial mills. Due to the relatively simple test procedure and international standardization, HGI is the most commonly used grindability determination method for hard coals, comminuted with ring-ball and roller-bowl mills [
23,
27]. A wide variety of materials grindability determination methods were developed for other types of mills. As an example, the Bond Work Index (BWI) concerns ore materials milled in rotary ball mills. The BWI method simulates continuous grinding closed-circuit, with the use of multiple grinding and screening cycles and the introduction of the new feed material between the cycles, the procedure is carried out until steady-state conditions are obtained [
28,
29]. Several attempts to adapt existing grindability methods for torrefied biomass were made, such as that described in [
6,
30]; unfortunately, simple batch or even semi-continuous grindability testers cannot entirely simulate all the complex processes that occur in industrial vertical spindle mills. In the case of new fuels, such as torrefied biomass, it is crucial to determine the grinding behaviour of the new energy carrier introduced into the market. For this reason, the presented investigations encompass both grindability determination (published earlier in [
31]), and semi-industrial scale grinding tests for four types of torrefied biomass. In both laboratory scale and semi-technical scale investigations the same kinds of torrefied biomass were utilized.
2. Experimental
The main objective of this research was to determine the grindability of torrefied biomass and conduct semi-industrial scale grinding tests. Investigations of torrefied biomass grindability were performed using a modified Hardgrove Index (HGIm) and a semi-industrial scale experimental milling plant equipped with a ring-ball mill. Additionally, the grindability of raw biomass before the torrefaction process was determined.
2.1. Materials and Sample Preparation
The following types of raw biomass were used in this study: alder chips (R1), palm kernel shells from (R2–3), and willow chips (R4).
Table 1 shows the characteristics of the used raw fuels. The moisture content of the samples ranged from 20.5 wt.% to 29.4 wt.%. The R1 sample had more than four times lower ash content than the rest of the samples. The R2–3 sample was characterized by the highest Higher Heating Value (20.6 MJ/kg). For other samples, this parameter did not exceed 20 MJ/kg. Volatile fractions were in the range of 72.0 wt.% to 77.4 wt.%.
Also, samples of torrefied biomass were tested (marked as T1, T2, T3, and R4—corresponding to respective samples marked with R denotation).
Table 2 shows the parameters of the torrefaction process of raw biomass. Samples T1, T2, and T4 were torrefied by the same manufacturer at 350 °C in an atmosphere with low oxygen concentrations (tor-gas) and close to atmospheric pressure (pressure slightly lower than atmospheric: 0.8–1 Pa). The duration of these torrefaction processes was equal to 20 min. Additionally, the torrefaction reactor gases were used as tor-gas to fuel the process. In the case of T3, the process was carried out at 310 °C in an atmosphere with low oxygen concentrations (tor-gas) and close to atmospheric pressure. The duration of the process was 40 min, and the torrefaction reactor gases were used as tor-gas to fuel the process.
Table 3 shows the characteristics of torrefied fuels utilized in the investigations. The samples were characterized by moisture content in the range of 8.3 wt.% to 17.7 wt.%. The ash contents were 1.8–6.6 wt.%. For all samples, the HHV parameter was from 22.8 MJ/kg to 25.2 MJ/kg. Volatile fractions were in the range of 54.6 wt.% to 58.0 wt.%. Comparing above mentioned values with those obtained for raw biomass, the moisture content is lower in the range of 28–60%. Additionally, the ash content is 1.7 to 3.0 times higher, and the calorific value is over 10% higher. Finally, the content of volatile fractions for torrefied biomass is lower than for raw biomass by 19–31%.
2.2. Method
The proposed modified Hardgrove Grindability Index (HGI
m) for biomass was calculated using Equation (1). According to [
30], the standard HGI method is not an adequate method for biomass samples, due to the significantly lower density of biomass. Therefore, during the HGI
m investigation, volumetric samples of 50 cm
3 were adopted.
where
HGIm—modified Hardgrove Grindability Index for tested material, -;
P75—cumulative percentage passed through 75 µm opening sieve, %.
Two ranges of the torrefied biomass sample particle sizes were applied during the investigations: 0.6–1.18 mm and 0.2–1.18 mm. For raw biomass, only the 0.6–1.18 mm particle size range was investigated. Compared to standard Hardgrove tests, the other testing parameters remained unchanged [
25]. It should be noted that the main difference between standard HGI and HGI
m is the utilization of volumetric samples in the modified method, instead of fixed 50 g mass samples. Due to the wide-ranging bulk densities of the biomass fuels, the standard HGI test tends to give false low grindability values for low density biomass. This is the result of overfilling of the test mill’s grinding unit, which causes some parts of the sample to not properly comminuted. It can be said that the standard Hardgrove Grindability test gives realistic results only for biomass with bulk densities comparable with hard coal. In comparison, the modified Hardgrove grindbility test gives better quality results because the volume of the sample is always 50 cm
3.
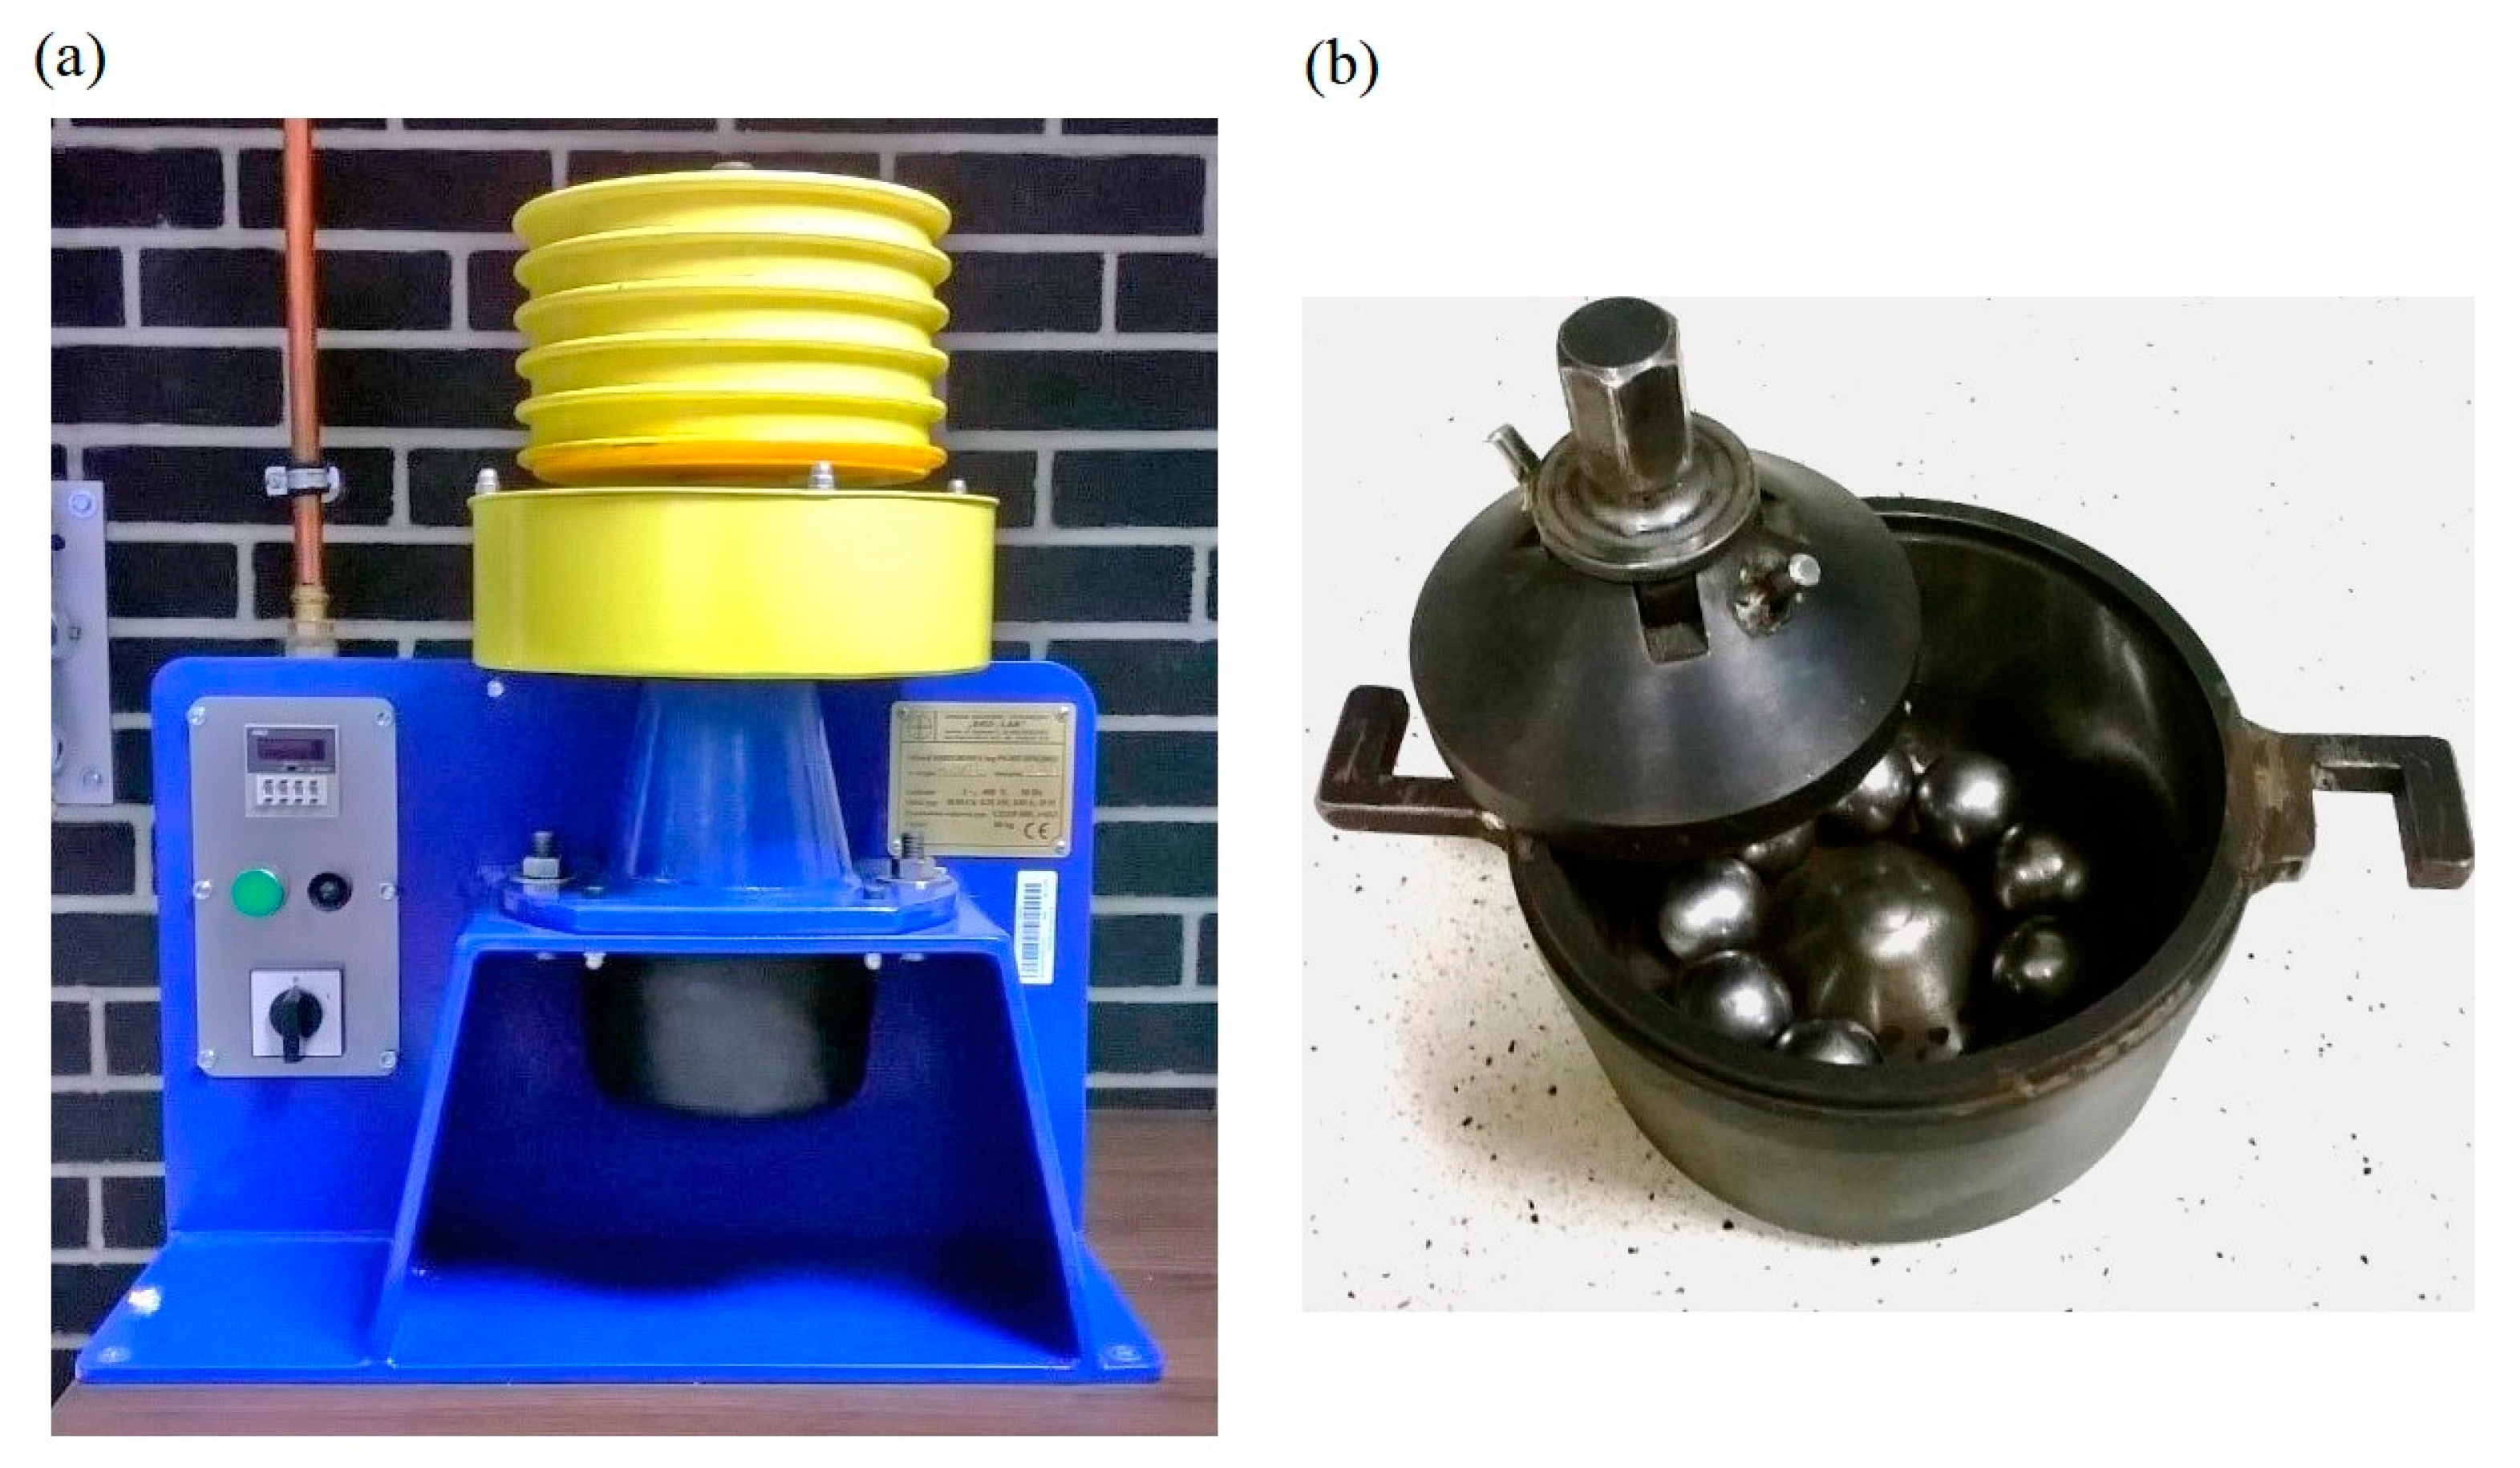
Representative initial samples of 3 kg of raw (R1, R2–3, and R4) and torrefied (T1, T2, T3, and T4) biomasses were used. It should be mentioned that the initial biomass samples were characterized by a high amount of fine fractions. The desired size fractions were sifted out of the initial biomass samples. Next, the samples were prepared in a knife mill with adjustable rotational speed and replaceable sieves in the range of 1 to 12.5 mm using the gradual pulverization method. The required grain size fraction was sifted out carefully using a vibratory sieve shaker. Finally, for each raw and torrefied biomass, three 50 cm
3 samples were milled, for 60 revolutions, in the Hardgrove tester (
Figure 1). Afterward, sieve analysis of the obtained product was performed using a jet sieve. The content of the fractions produced during the test (and not occurring in the pre-milled sample) was determined using a set of the following sieve meshes:
- -
For 0.6–1.18 mm samples, mesh sizes: 75, 90, 125, 180, 200, 355, 500 μm;
- -
For 0.2–1.18 mm samples, mesh sizes: 75, 90, 125, 180 μm.
Three torrefied biomasses were tested during the semi-industrial scale investigations: alder chips and two types of palm kern shells—T1, T2, and T3. An experimental milling plant equipped with a ring-ball mill (
Figure 2), essentially performs the same processes as the industrial milling installation in the power unit.
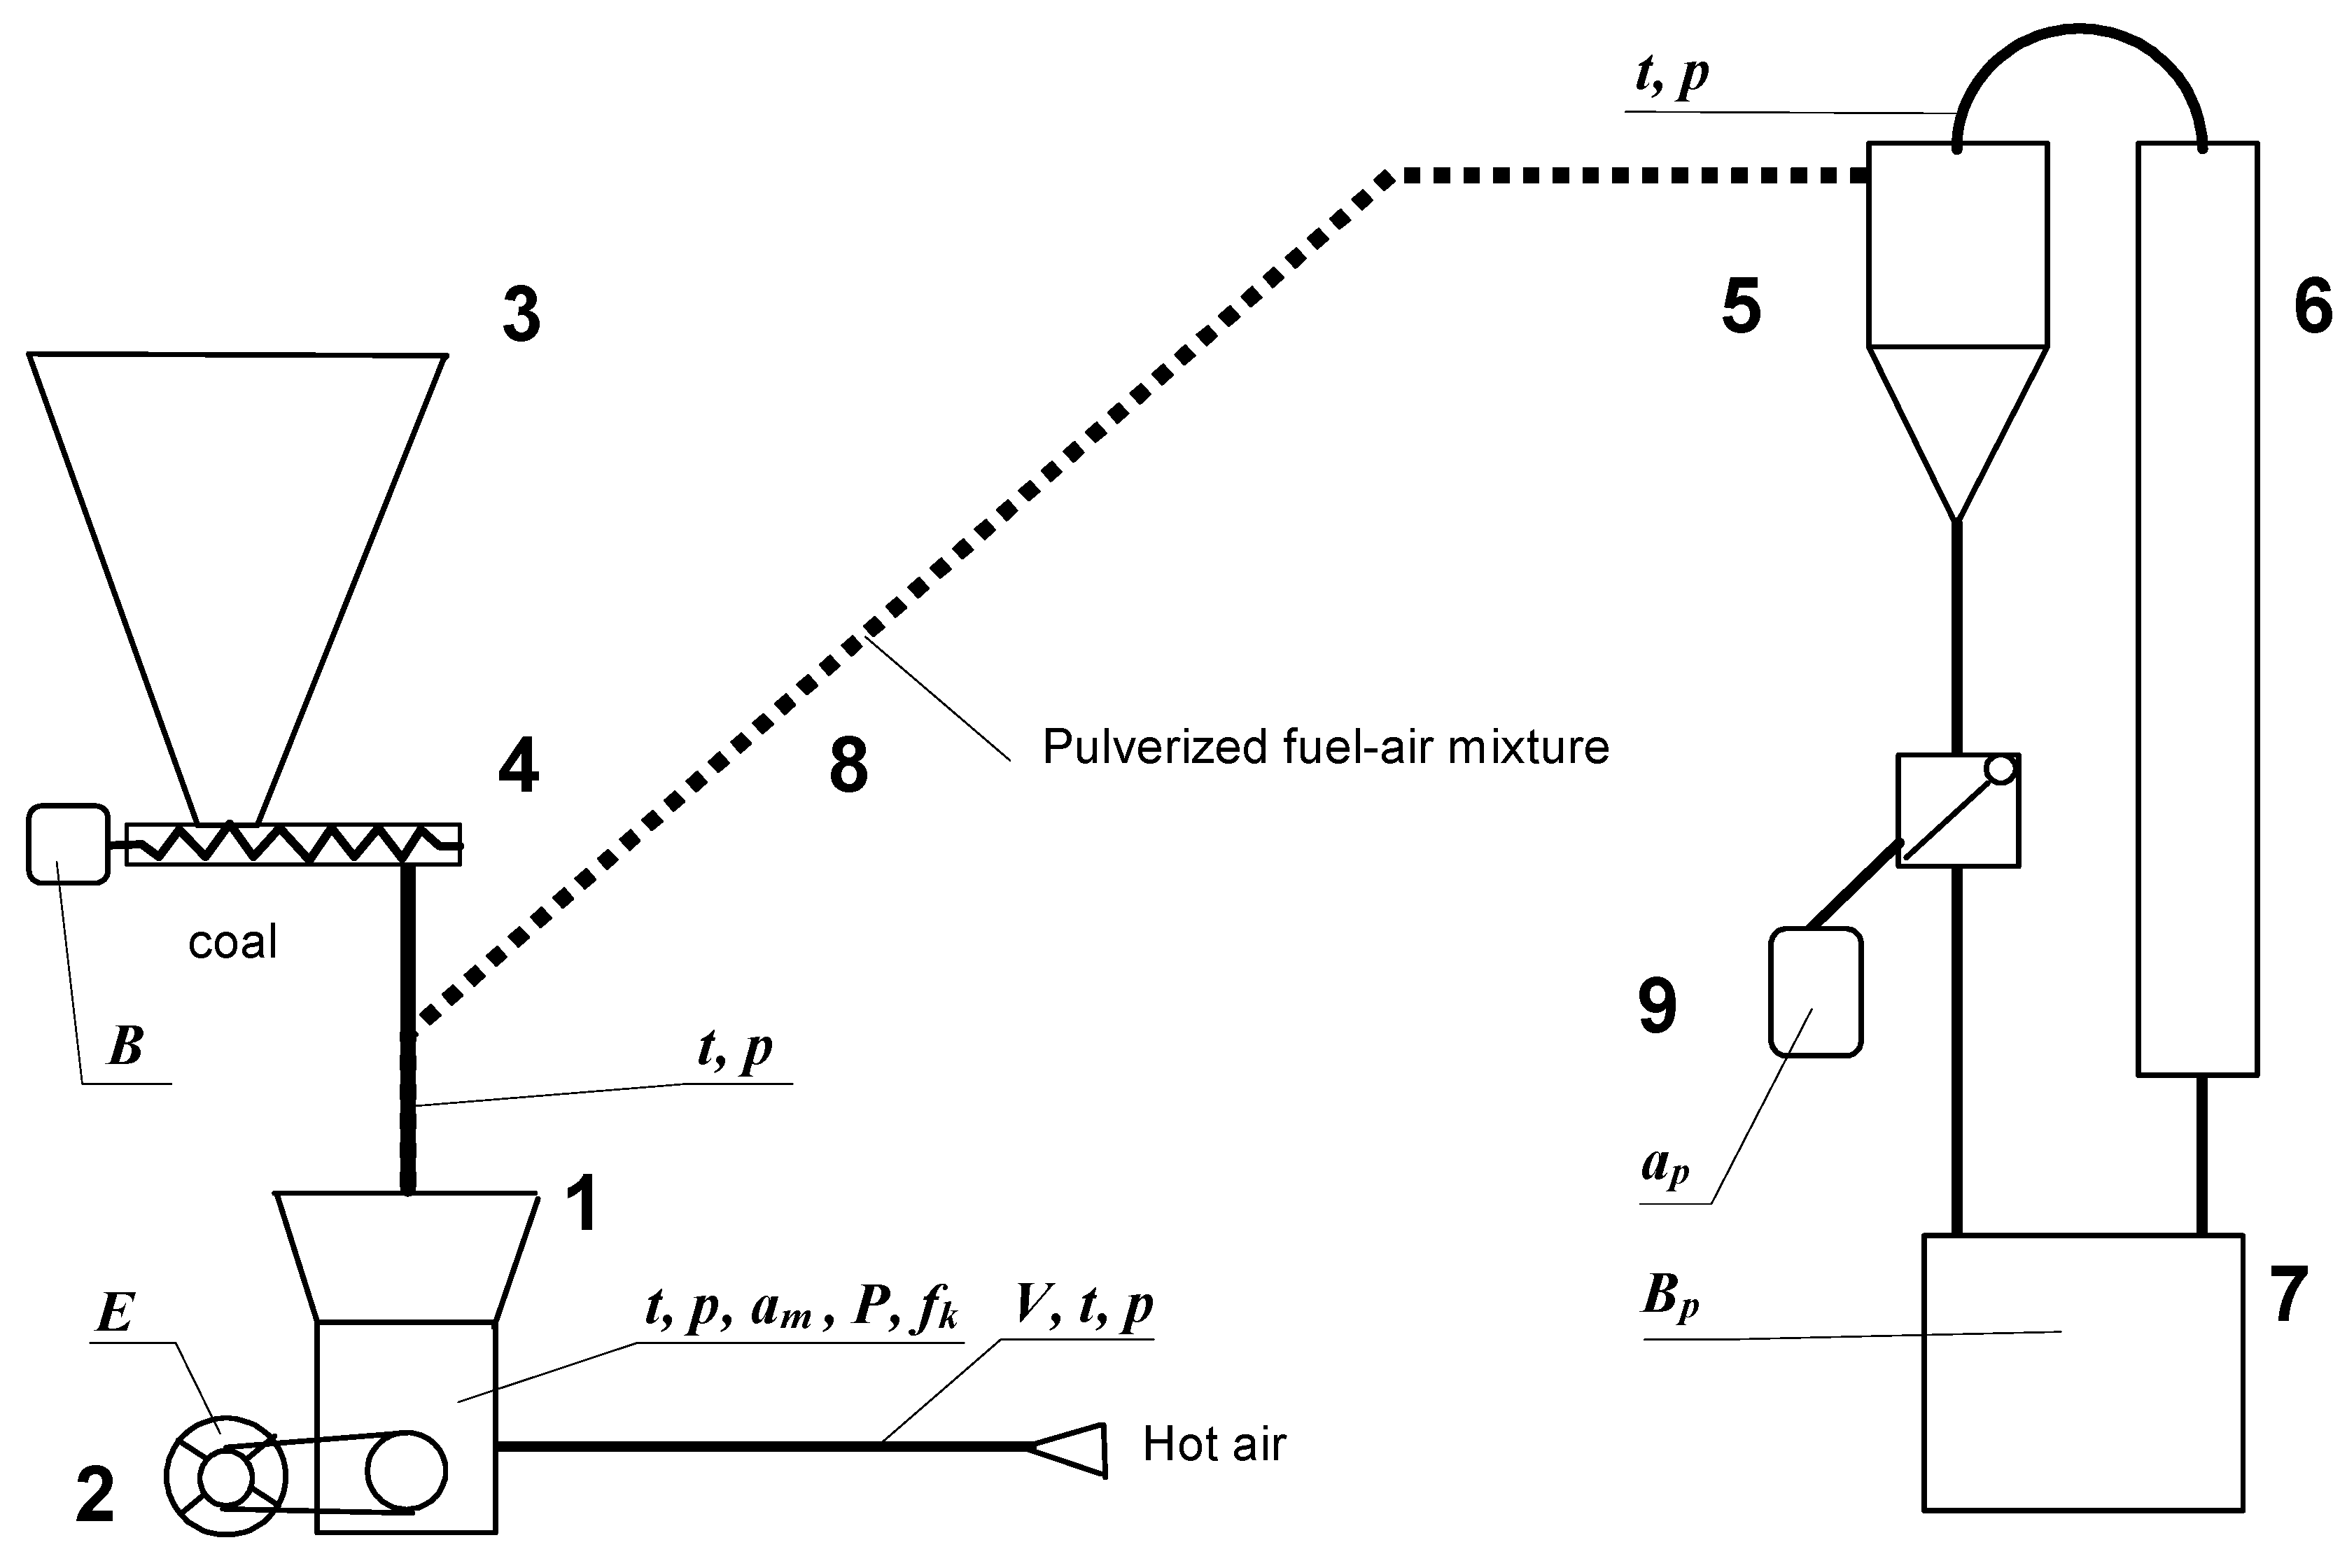
The semi-technical scale installation consists of a coal feeding unit (coal container with loading winch, spiral feeder), ring-ball mill (equipped with 10 balls grinding unit for the tests), air heating and transport unit (multistage air blower, combustion chamber equipped with natural gas burner and air ducts), pulverized-fuel transport ducts, and separation and sampling unit (cyclone dedusting separator, fabric-bag filter, product container, pulverized fuel sampling device and pulverized fuel ducts), as shown in
Figure 3.
The ring-ball mill with a 10 balls grinding unit (100 mm ball diameter) is a geometrically similar model to MKM-33 mill (nominal capacity 33 t/h), in a scale of 1:7.5. Additionally, the mill is equipped with an interchangeable grinding unit with seven balls (125 mm ball diameter, for obtaining a higher mill capacity). The grinding units have a similar outer diameter Dz ≈ 427 mm. A frequency inverter Micromaster 440 (7.5 kW) was applied to power the mill motor. The inverter along with Siemens Simatic S7-1200 (manufactured by Siemens AG, based in Munich, Germany) allows for the following: grinding ring rotational speed adjustment, energy consumption measurement, motor power, and torque changes observation, and motor data acquisition.
The basic values that characterize the operation of the semi-industrial scale ring-ball mill are as follows:
- −
mill capacity B;
- −
cumulative retained values (fines particle size distribution): R90, R120, and R120;
- −
the power of the mill motor Nm;
- −
pressure drop in mill Δpm;
- −
pressure drop in grinding chamber Δpk;
- −
mass ventilation V.
Values facilitating the comminution process analysis:
- −
effective grinding power Nm—Nm,0 (Nm,0—idle run power);
- −
thickness of the coal layer under the balls fk;
- −
pressure drop due to the presence of a solid phase in the grinding chamber Δps.
A pressure drop in the mill and ventilation characterizes the energy consumption for pulverized fuel-air mixture transport. One of the auxiliary parameters to evaluate the operation of the mill is the circulation factor across the path grinding chamber classifier. A relative measure of circulation factor can be considered as a pressure drop caused by comminuted coal concentration (material) on the length between the air gap (the gap between the bowl rim and the mill housing) and the upper part above (outlet) the grinding chamber Δps. A pressure drop caused by the solid-phase presence Δps (so-called mill filling) is assumed as the difference between total flow resistance and flow resistance caused by only gas flow to the milling chamber.
For 10 ball grinding unit (dk = 100 mm), the nominal value of crushing ring angular velocity ω = 10.5 s−1 and the grinding unit load P = 9.8 kN. Maximal mill capacity during coal comminution (coal HGI ≈ 63 H) is equal to Bm ≈ 68 g/s, and product cumulative retained is R0.09 ≈ 20% and R0.20 ≈ 1%. For those conditions, the pressure drop in the mill reaches the value of Δpm ≈ 15.0 hPa, at ventilation V1 ≈ 140 g/s.
3. Results and Discussion
The results of raw and torrefied biomass grindability testing based on the modified Hardgrove test are presented in
Table 4 and
Table 5 for the particle size range of 0.6–1.18 mm, and in
Table 6 for the particle size range of 0.2–1.18 mm. The product particle size distributions shown in the tables are based on the average results of three grindability tests, for each biomass type.
The comparison of the modified Hardgrove test results obtained for torrefied and raw biomass samples points to a significant increase in the biomass grindability index after the torrefaction process. The torrefied biomass cumulative percentage passed for the 75 μm mesh size is approximately ten times higher for alder chips, six and three times higher for palm kernel shells T2 and T3 samples, respectively, and nine times higher for willow chips.
The results obtained for the 0.6–1.18 and 0.2–1.18 particle size ranges both show similar tendencies in the torrefied biomass grindability categorization. Nevertheless, the respective values of HGIm (based upon P75) are slightly different for samples T1, T2, and T4. Only sample T3 showed that HGIm remained unaffected by the change in the sample particle size range. A wider grain size range of sample particles can cause suppression of the milling effect due to the high energy demand for the fine fraction grinding (samples T1 and T2), which is not necessarily a negative factor. In most industrial milling installations, coal and biomass are fed into the mill with a relatively high amount of fine fractions. In the case of the torrefied willow sample, P75 is increased for the 0.2–1.18 mm particle size range, which may be the effect of the higher content of brittle particles in the sample’s wider range.
It must be noted that torrefied biomass with high HGIm values, despite its high grindability, can be problematic when comminuted in industrial mills. The HGI tester is a batch device and cannot be used to predict a continuous grinding circuit precisely. For milling low-density materials, such as torrefied biomass, structural changes in the industrial mill classifier could be necessary for the circuit’s proper operation. The obtained results can be used to categorize torrefied biomass fuels due to their grindability and as basic information in semi-technical scale studies on torrefied biomass comminution features.
Selected operational characteristics of a semi-industrial scale ring-ball mill, during torrefied biomass samples grinding, are shown in
Table 7,
Table 8 and
Table 9, whereas the most significant results are depicted in
Figure 4,
Figure 5 and
Figure 6. The tables contain the operational parameters of the mill and comminution investigation results for four selected tests (in summary, more than 20 points of mill operation were investigated), for each examined biomass: T1, T2, and T3, wherein for both PKS samples (T2 and T3) two tests relate to “hot” and two to “cold” (without heating drying-transport air) conditions. The cold and hot tests were performed because some materials tend to grind better in “cold” conditions.
The relatively best grindability features were exhibited by torrefied alder, with the highest mill capacity of approximately 35 g/s being achieved; however, the milling quality was low (coarse product), see
Table 7 and
Figure 4. Torrefied alder was characterized by low density and relatively high moisture content (12–31 wt.%). A large surface of torrefied biomass particles caused an increase in the flow capacity of the classifier and consequence, resulted in coarser pulverized material granulation. Due to the extremely high grindability of the material (HGI
m > 200), there is no capacity restraint with regard to the grinding unit. This is evidenced by the relatively low thickness of the material layer under the balls and low mill energy consumption. To improve the separation process and milling quality, the moisture content of the torrefied biomass should be lowered to <10 wt.%. In further investigations, the mill could be fed with a mixture of torrefied alder and higher density torrefied biomass. Further efforts should aim to modernize (increase the volume) the classifier.
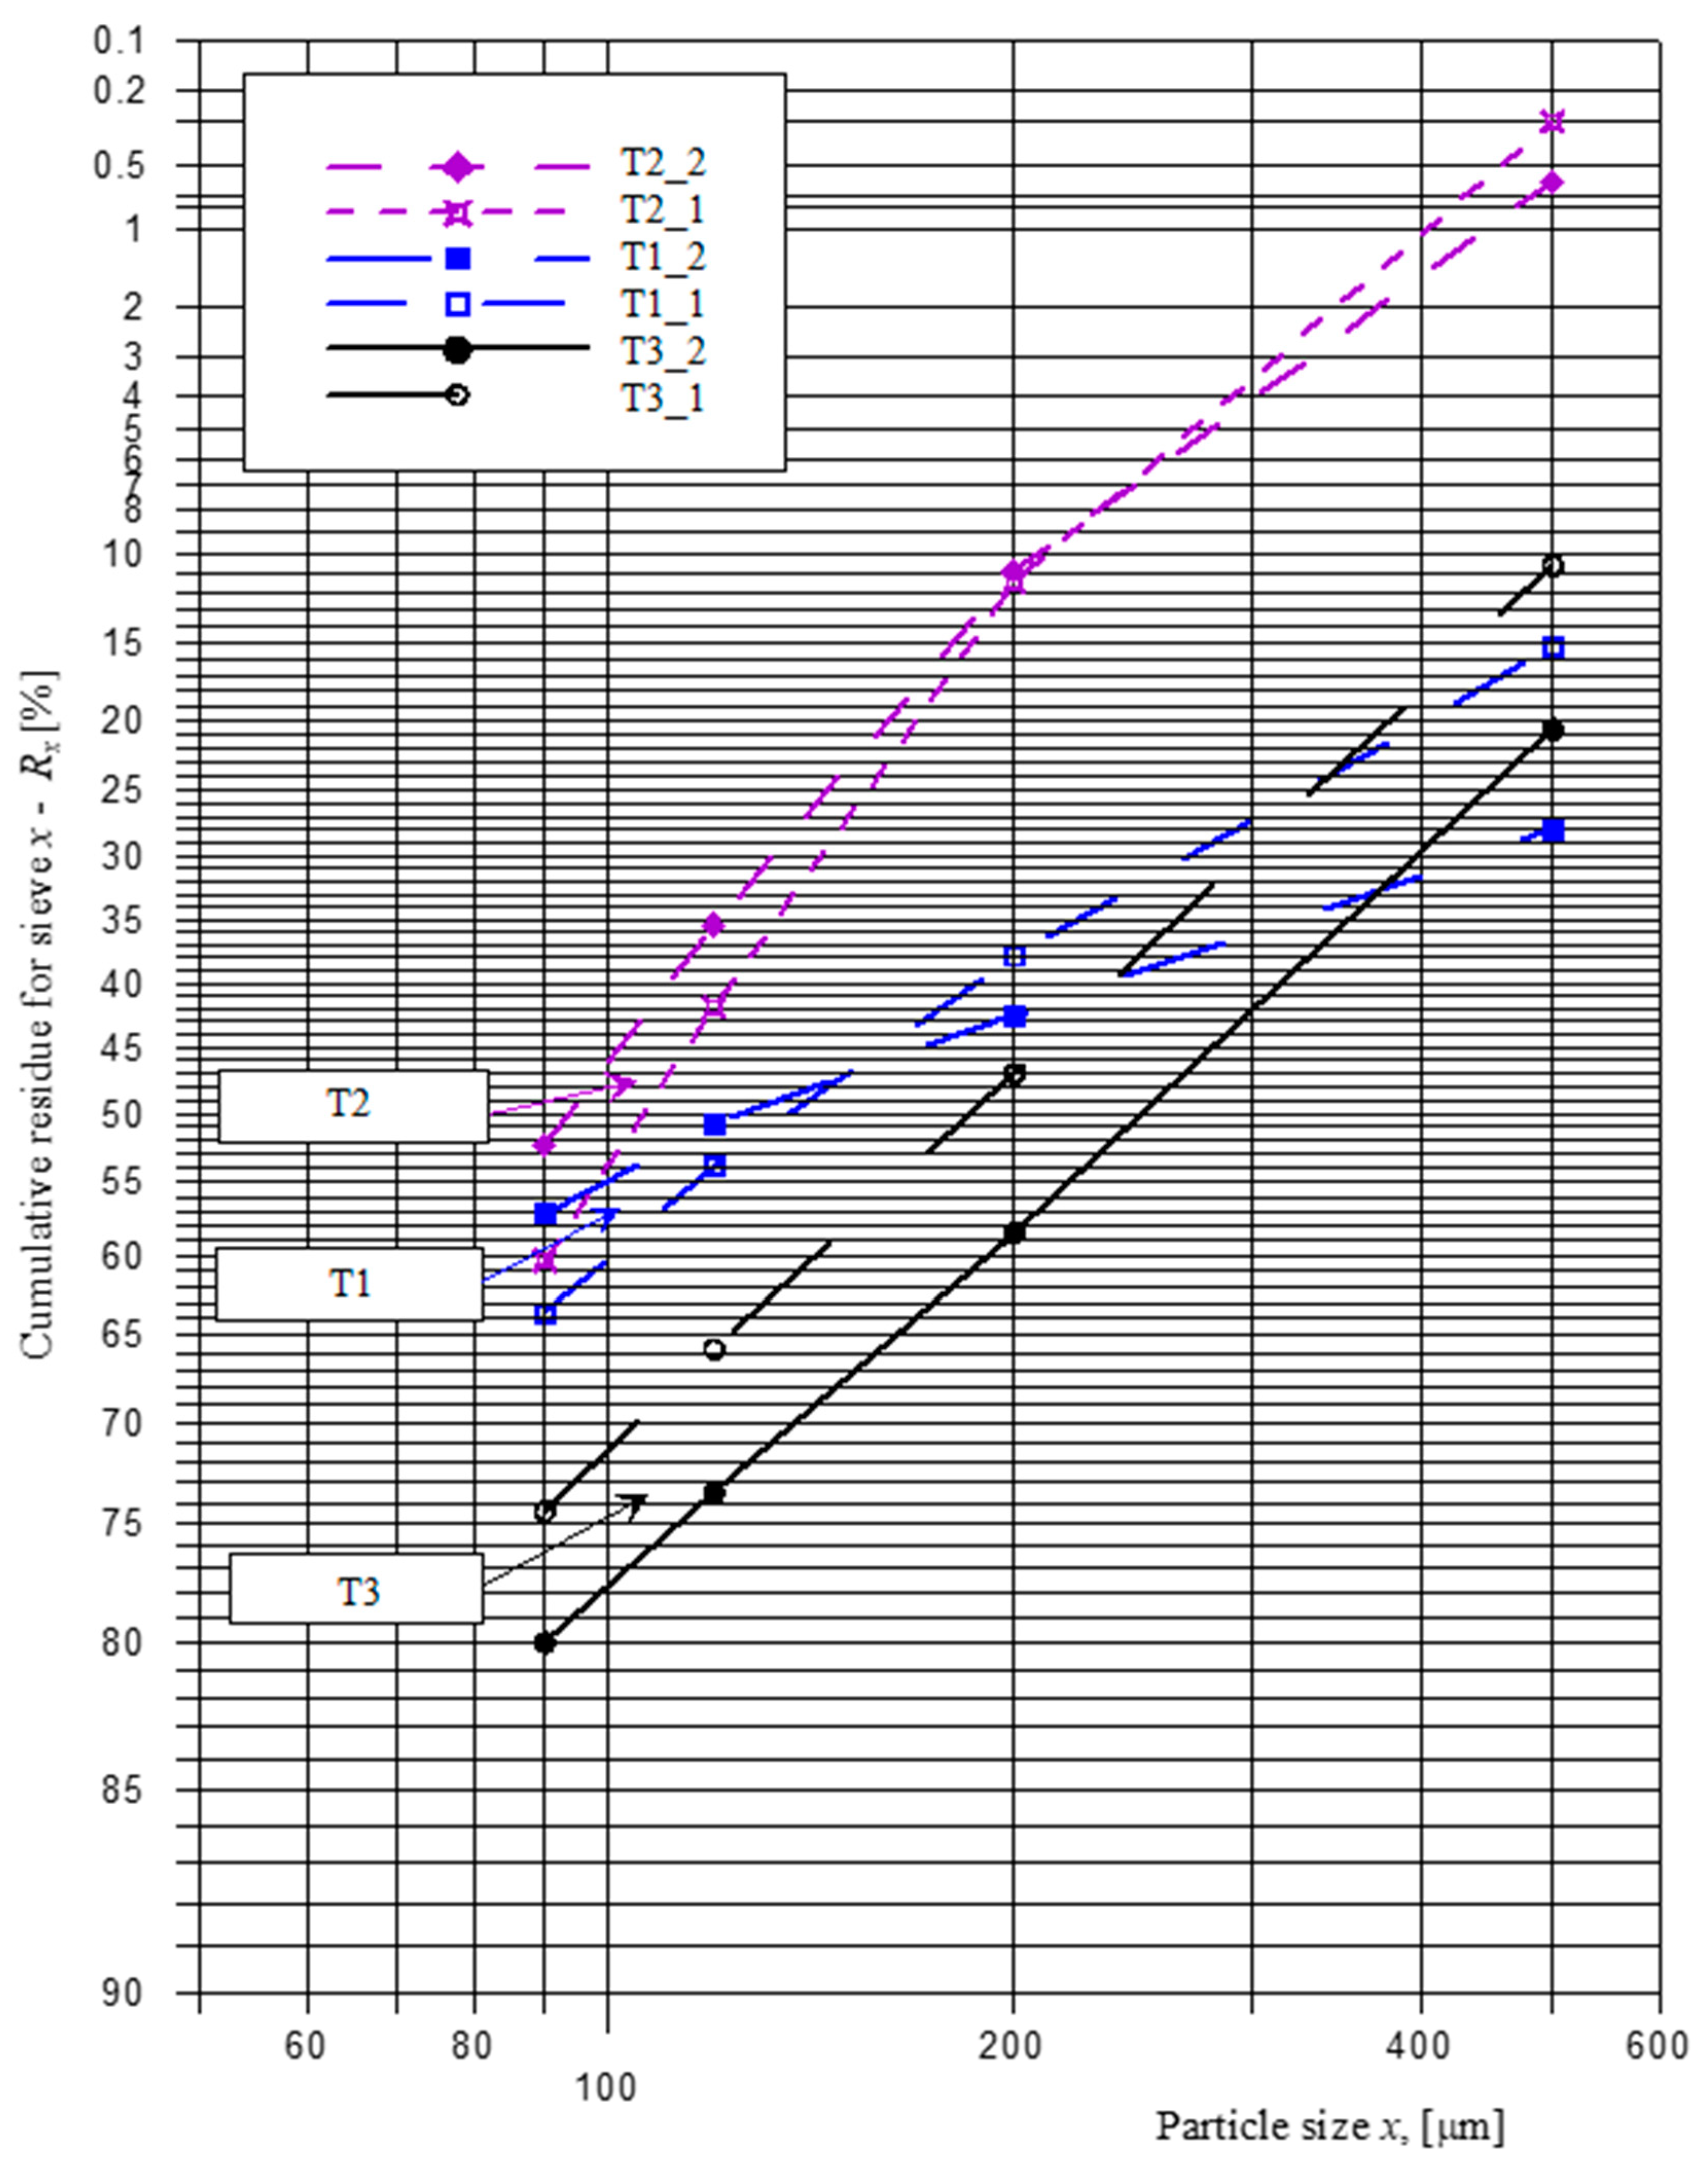
Both torrefied PKS (T2 and T3 samples) exhibited very low grinding properties, see
Figure 5 and
Figure 7. Mill capacities were lower than B ≈ 20 g/s, which is about 30% of the mill’s capacity during coal comminution. This is probably because of the relatively low grindability in comparison to torrefied alder and willow.
Torrefied PKS grinding operation was characterized by very high flow resistance (high circulation of pulverized fuel). After switching off the material feeder, the mill emptying process lasted for about 30 min or more. Excessive accumulation could have been caused by the presence of some content of poorly torrefied biomass in comminuted material. It was indicated by a sieve and visual analysis of pulverized fuel sampled over the tests. In the final testing phase, especially during mill emptying (after switching off the material feeder) the product was brighter, thicker, and looser. During the emptying of the mill, samples from the grinding chamber were collected, in which shiny (slippery) particles in the shape of spheres—size from 0.3 to 0.5 mm—were visible. These particles could have been shaped during repeated crushing of insufficiently torrefied flexible parts of the biomass feed. The relatively thick and dense palm kern shells (PKS) are probably not equally torrefied across the thickness of the shell. Despite the required average content of volatile matter in torrefied PKS, the inner layer may exhibit elastoplastic properties.
Comminution tests for torrefied PKS were conducted both with and without heating of the air drying–transport air—so-called “hot” and “cold” test conditions. Tests for “cold” conditions gave slightly better results. There was less accumulation of the material in the grinding chamber (higher grinding effect), which was confirmed by observing the higher energy consumption of the mill motor.
Particle size distribution of the torrefied PKS product was diversified, see
Figure 7. Coarser particles were produced for T3 samples grinding—R
0.5 ≈ 10 wt.% More tests were conducted for T3, in comparison to fewer tests with T2. Better milling quality of the T2 product could result from a higher torrefaction temperature and deeper penetration of the torrefaction process in the material volume. It should be noticed that for T2 biomass, energy consumption was almost two times lower than for T3, while the layers of material under balls were comparable (comparison of
Figure 5 and
Figure 6). This was achieved despite T3 biomass having lover HGI m than T2. Also torrefied alder chips had higher grinding energy than T2, even though its HGIm was significantly higher. It is worth mentioning that the capacity of the mill was not constrained during torrefied alder comminution, which was not the case for T2 and T3 biomasses. A possible reason for T2 biomass to have a lower grinding energy requirement is earlier mentioned higher torrefaction temperature, which caused creation of very brittle surface layer. In the case of the HGIm sample, it was carefully prepared before the grinding process, so all the layers of the biomass were present, including untoreffied inner part. During semi-industrial scale milling tests an elasto-plastic inner part of the torrefied palm kern shell accumulated in the grinding chamber. The highly torrefied outer part of the palm kern shells was easily ground, and quickly left the grinding chamber, which was probably the cause of low grinding energy.
It is possible to increase the capacity of the mill using a mixture of torrefied biomass, e.g., torrefied PKS + torrefied wood (soft material) in a specific ratio to achieve a target mill output. In this case, the grindability of the mixture is equal to a weighted average of mixture components.


