1. Introduction and Background
Access to electricity stands at the heart of modern civilization and is essential for residential, commercial, and infrastructural operations. Despite its vital contribution to human development, this service remains inaccessible to a substantial portion of humanity, particularly in Sub-Saharan Africa [
1]. The United Nations has recognized this challenge under Sustainable Development Goal 7 (SDG7), which targets universal access to affordable, reliable, and modern energy services by 2030 [
2]. The African continent possesses abundant energy resources, particularly renewable sources such as wind and solar, with an estimated potential of 350 GW of hydroelectric power, 110 GW of wind energy, 15 GW of geothermal energy, and 1000 GW of solar energy [
3]. Despite this potential, the continent’s electricity access rate remains among the lowest worldwide, with a strong imbalance between urban and rural areas. Only selected countries in West Africa, such as Ghana and Cape Verde, have achieved more equitable access between rural and urban regions, while the overall situation remains challenging [
3].
Universal access to modern, reliable, sustainable, and affordable energy services requires innovative and holistic strategies that surpass conventional methods. Manual planning processes cannot address the scale of this challenge, given the hundreds of millions without electricity access. Geospatial analysis and complex algorithms have therefore become essential components of automated planning tools. These tools can process large volumes of data, run different scenarios, and provide optimized electrification strategies fitted to local conditions. Geographic information systems (GISs)—particularly QGIS, an open-source platform with extensive plugin capabilities—have emerged as essential tools for integrating, analyzing, and visualizing the complex spatial data required for informed electrification planning. GIS-based energy system modeling in the literature falls into three main categories. First, energy models optimize generation and the energy mix, ranging from top-down macroeconomic to bottom-up technical approaches. Second, electric models focus on network optimization through power flow studies. Finally, comprehensive models, such as GISEle [
4,
5,
6], integrate both generation optimization and network design, enabling comparisons between grid and off-grid solutions using LCOE calculations. These integrated approaches recognize the importance of proper spatial organization in the planning process, where clustering algorithms are essential for organizing potential customers into energy communities [
7]. The methodology encompasses center-based methods using central points to represent clusters (e.g., K-means, K-medians, K-medoids) [
8], as well as hierarchical clustering, which builds a tree-like structure of clusters through either agglomerative or divisive approaches, offering flexibility in cluster formation without requiring predefined cluster numbers [
9]. Additionally, density-based clustering methods like DBSCAN identify clusters of different shapes and sizes based on point density [
7,
10,
11], while model-based clustering assumes data generation from probability distributions [
12,
13]. Recent studies demonstrate the practical application of these clustering techniques in energy planning. Ref. [
14] implemented clustering algorithms as part of a combinatorial optimization method for selecting participants and optimizing solar energy allocation in renewable energy communities (RECs), achieving improved energy sharing and reduced CO
2 emissions. The study demonstrated how clustering can effectively organize consumers while considering multiple objectives, including self-consumption and economic viability. In the context of Sub-Saharan Africa, clustering algorithms have proven particularly valuable. Ref. [
15] applied clustering techniques to analyze technology adoption patterns in rural communities of Northern Ghana, revealing important correlations between community empowerment and renewable energy acceptance. Their work highlights how clustering can inform both technical planning and social aspects of electrification. Additionally, Ref. [
16] utilized clustering methodologies to rank hybrid renewable energy systems for Ghanaian industrial applications, demonstrating how these techniques can optimize system configurations across different scales and contexts.
Grid-routing algorithms, particularly graph theory-based approaches, have played a vital role in optimizing network design for rural electrification. The minimum spanning tree (MST) algorithm, implemented through either Prim’s or Kruskal’s algorithm, has emerged as a reliable solution for minimizing total network distance while ensuring connectivity, becoming a consolidated approach in the literature [
17,
18,
19]. This theory has been validated through several practical implementations. In Zimbabwe’s Chegutu district, Ref. [
18] demonstrated the effectiveness of Kruskal’s algorithm by optimizing an electricity grid network, achieving a reduction of approximately 74 km in the length of 11 kV power lines. Similarly, in Kenya, Ref. [
19] achieved savings of over 25% in system cabling costs compared to classical shortest-path routing designs through a modified MST approach. Kruskal’s algorithm has proven to be especially effective for sparse networks typical of rural areas, while Prim’s algorithm performs better with dense networks. However, these approaches have important limitations: they do not incorporate technical constraints within the procedure itself, potentially leading to electrically infeasible solutions, and the basic MST algorithm only considers point-to-point connections between villages, not accounting for possible connections to intermediate points along existing lines. Recent work proposed by [
17] has addressed these limitations through artificial intelligence search methods evolved from the A* algorithm, enabling efficient inter-village power connections even in areas with complex topography and allowing trade-offs between computation speed and optimality. Alternatively, Ref. [
20] presented a constraint-based local search approach for solving the edge-disjoint rooted distance-constrained MST problem. This method effectively addresses the routing problem while incorporating path-length constraints and budget limitations.
Cost analysis methodologies are critical for assessing the economic viability of energy projects in rural electrification. The Levelized Cost of Electricity (LCOE) emerges as the primary metric, reflecting the average cost per unit of electricity generated over a system’s lifetime. This enables informed decisions between grid extension and off-grid solutions. The authors of [
21] used this metric to evaluate rural electrification options in North Korea, analyzing the trade-off between grid extension and hybrid energy systems (HESs). The study revealed a clear economic breakpoint: for villages located beyond 9.69–20.57 km from the existing grid, hybrid systems combining solar PV, wind turbines, lead–acid batteries, and diesel generators proved to be more cost-effective than grid extension. This type of analysis demonstrates how LCOE calculations can provide concrete decision-making thresholds for selecting between centralized and decentralized electrification solutions.
In the literature, several comprehensive tools have been developed that integrate these clustering and routing methodologies for rural electrification planning. These tools combine energy modeling (generation optimization) with electric infrastructure modeling (network design) to provide integrated planning approaches. They typically incorporate optimal generation mix determination, distribution network design, grid versus off-grid assessments, and economic evaluation through LCOE calculations. GISEle, developed by Politecnico di Milano, represents a comprehensive approach that merges energy and electric models. It employs GIS, graph theory, and terrain analysis to develop optimal electric network topology [
4,
5]. The tool addresses the following three critical aspects of rural electrification planning: determining optimal electrification solutions between grid and off-grid options, sizing generation portfolios for off-grid systems, and designing electric networks. The reference electrification model (REM) offers another sophisticated approach, supporting both large-scale planning and local electrification projects. REM utilizes advanced clustering and optimization algorithms to create the lowest-cost electrification systems, grouping consumers into mini-grid, grid extension, or stand-alone system clusters that minimize total system costs. The tool processes diverse inputs such as building locations, solar irradiance, topography, and infrastructure costs to generate comprehensive solutions [
22]. Similarly, the open-source spatial electrification tool [
23] is a decision support tool that determines the least-cost electrification technology solutions to connect communities lacking electricity access; it also estimates the required investment required to deliver the projects that will facilitate these electrification connections. Compared to other methodologies, it uses a tree search algorithm complemented by locality-sensitive hashing to identify the nearest neighbor that may be qualified for grid extension. Other tools take different methodological approaches. The open-source network planner employs a two-step process, first by calculating minimum-cost grid expansion using MST methodology and then by identifying least-cost electrification options for each community [
24]. Similarly, GEOSIM, used by the World Bank in African projects, incorporates social and economic development potential in its analysis methodology [
25]. This diverse ecosystem of planning tools offers important context for understanding the relative advantages and limitations of different approaches to automated electrification planning. In this paper, a novel procedure is proposed; in order to validate it and highlight its strengths and limitations—a direct comparison with GISEle is conducted.
Manual planning activities cannot address the scale of this challenge, given the complex interplay among the technical, geographical, and economic factors revealed in the literature review. While existing tools have demonstrated the effectiveness of clustering and routing algorithms individually, there remains a critical need for an integrated solution within the widely used QGIS platform. The present work aims to fill this gap by developing automated, user-friendly planning tools that make advanced methodologies accessible to all stakeholders while leveraging QGIS’s extensive geospatial capabilities and plugin ecosystem. The approach will automate workflows, streamlining electrification planning while allowing flexibility for local constraints and preferences. It will enable rapid large-scale assessments by efficiently processing geospatial data—essential for vast unelectrified regions like Sub-Saharan Africa. Data-driven decision-making will be enhanced by systematically comparing grid extension and mini-grid solutions based on technical and economic factors, leveraging QGIS’s visualization tools for clear communication with stakeholders. Integration into QGIS ensures interoperability with existing datasets and workflows, combining specialized electrification tools with broader spatial analysis capabilities.
The structure of this paper is organized as follows:
Section 2 presents the modeling framework and methodology, detailing both the Buffering plugin for data pre-processing and the Grid Routing and Cost Allocation plugin for network design and economic assessment.
Section 3 demonstrates the implementation and validation of these tools through a comprehensive case study in Zambia.
Section 4 provides a comparative analysis with GISEle, highlighting the complementary strengths of different planning approaches. Finally,
Section 5 presents conclusions and suggests future improvements for the developed tools.
2. Material and Methods
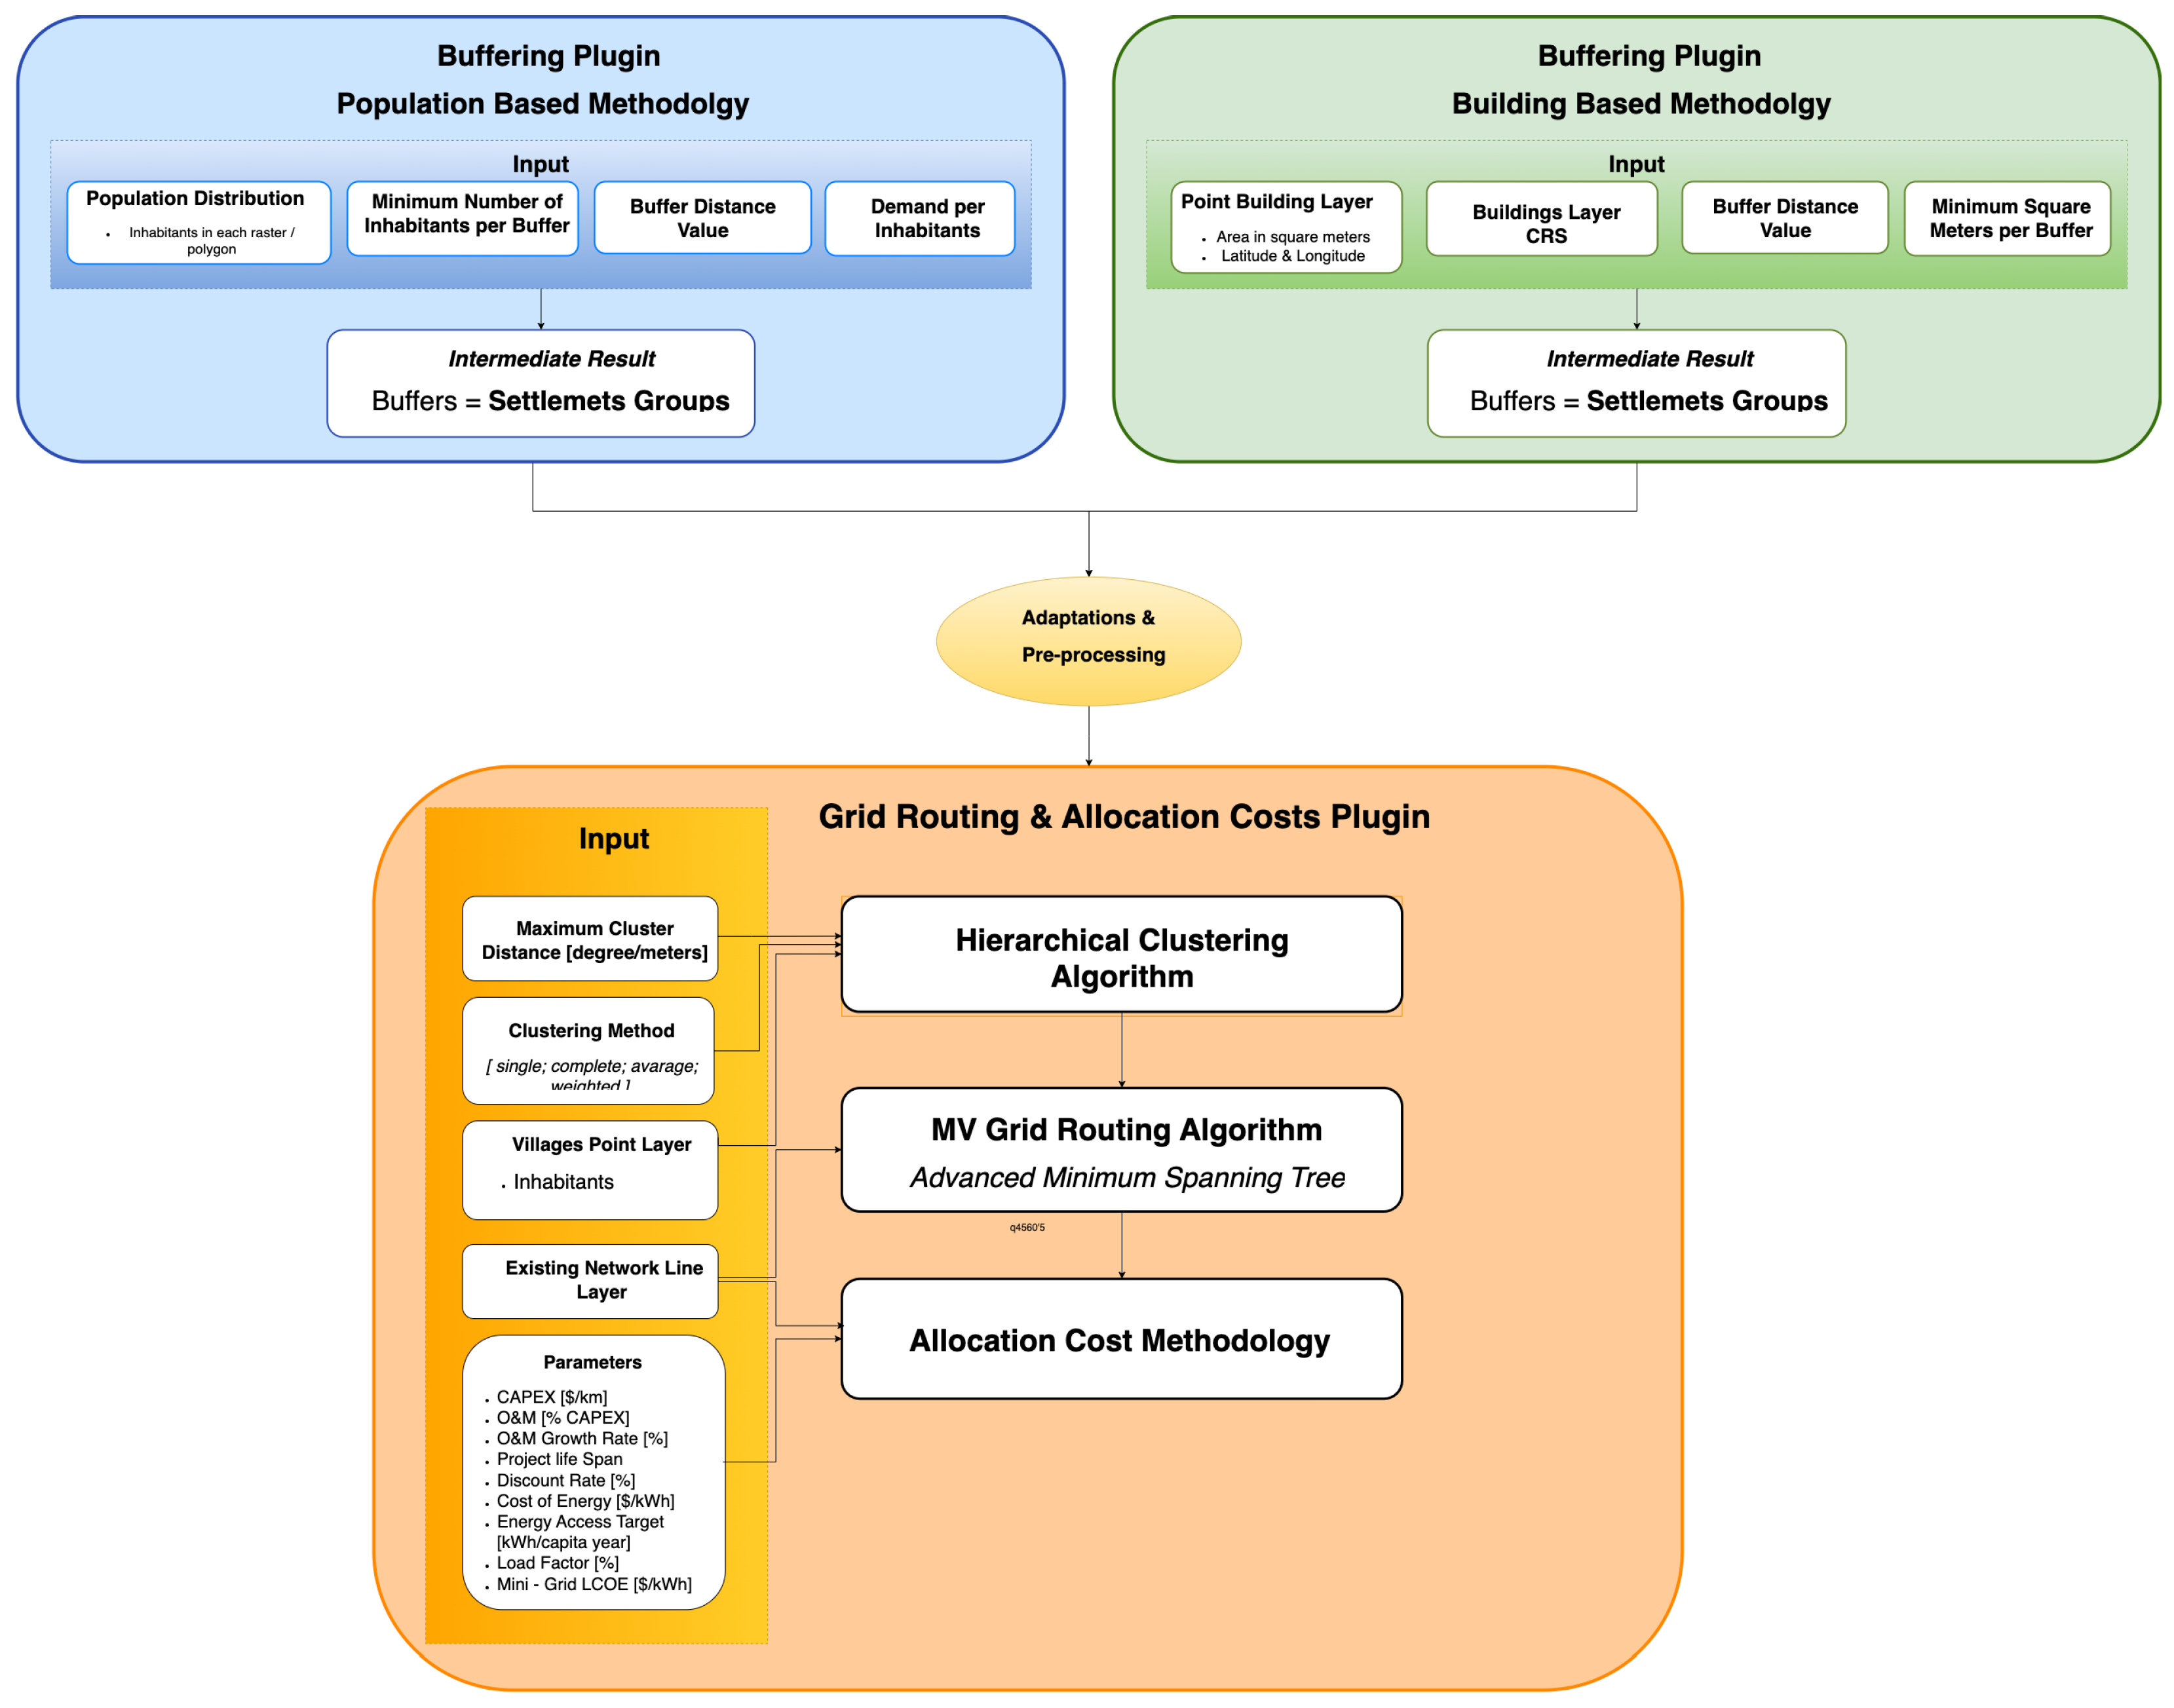
The methodology developed in this work encompasses two distinct procedures working in synergy to optimize rural electrification planning, as shown in
Figure 1. To validate their effectiveness and demonstrate their practical application, these procedures have been implemented in Zambia, a country facing significant electrification challenges representative of the Sub-Saharan African context. This section delineates both the methodological framework and the specific geographical context in which it was applied for assessment purposes.
2.1. Study Setting
The framework’s application in Zambia provided an ideal testing ground for the developed tools, given the country’s significant electrification challenges. With only 47.8% of the population having access to electricity and rural electrification rates as low as 14.5%, Zambia represents the challenges faced by many Sub-Saharan African nations [
26]. The country’s unique energy landscape, characterized by heavy dependence on hydropower (87.8% of electricity generation [
27]) and significant untapped renewable energy potential, particularly solar power with average irradiance levels of 5.5 kWh/m
2/day [
28], presents both challenges and opportunities for electrification planning. While other countries such as the Central African Republic and Mauritania were also considered for this implementation based on Tractebel Engineering’s prior engagements, Zambia was ultimately selected due to the availability of high-quality geospatial data, representative established national electrification challenges strategy, and the opportunity to complement ongoing electrification efforts by the national utility Zambia Electricity Supply Corporation (ZESCO).
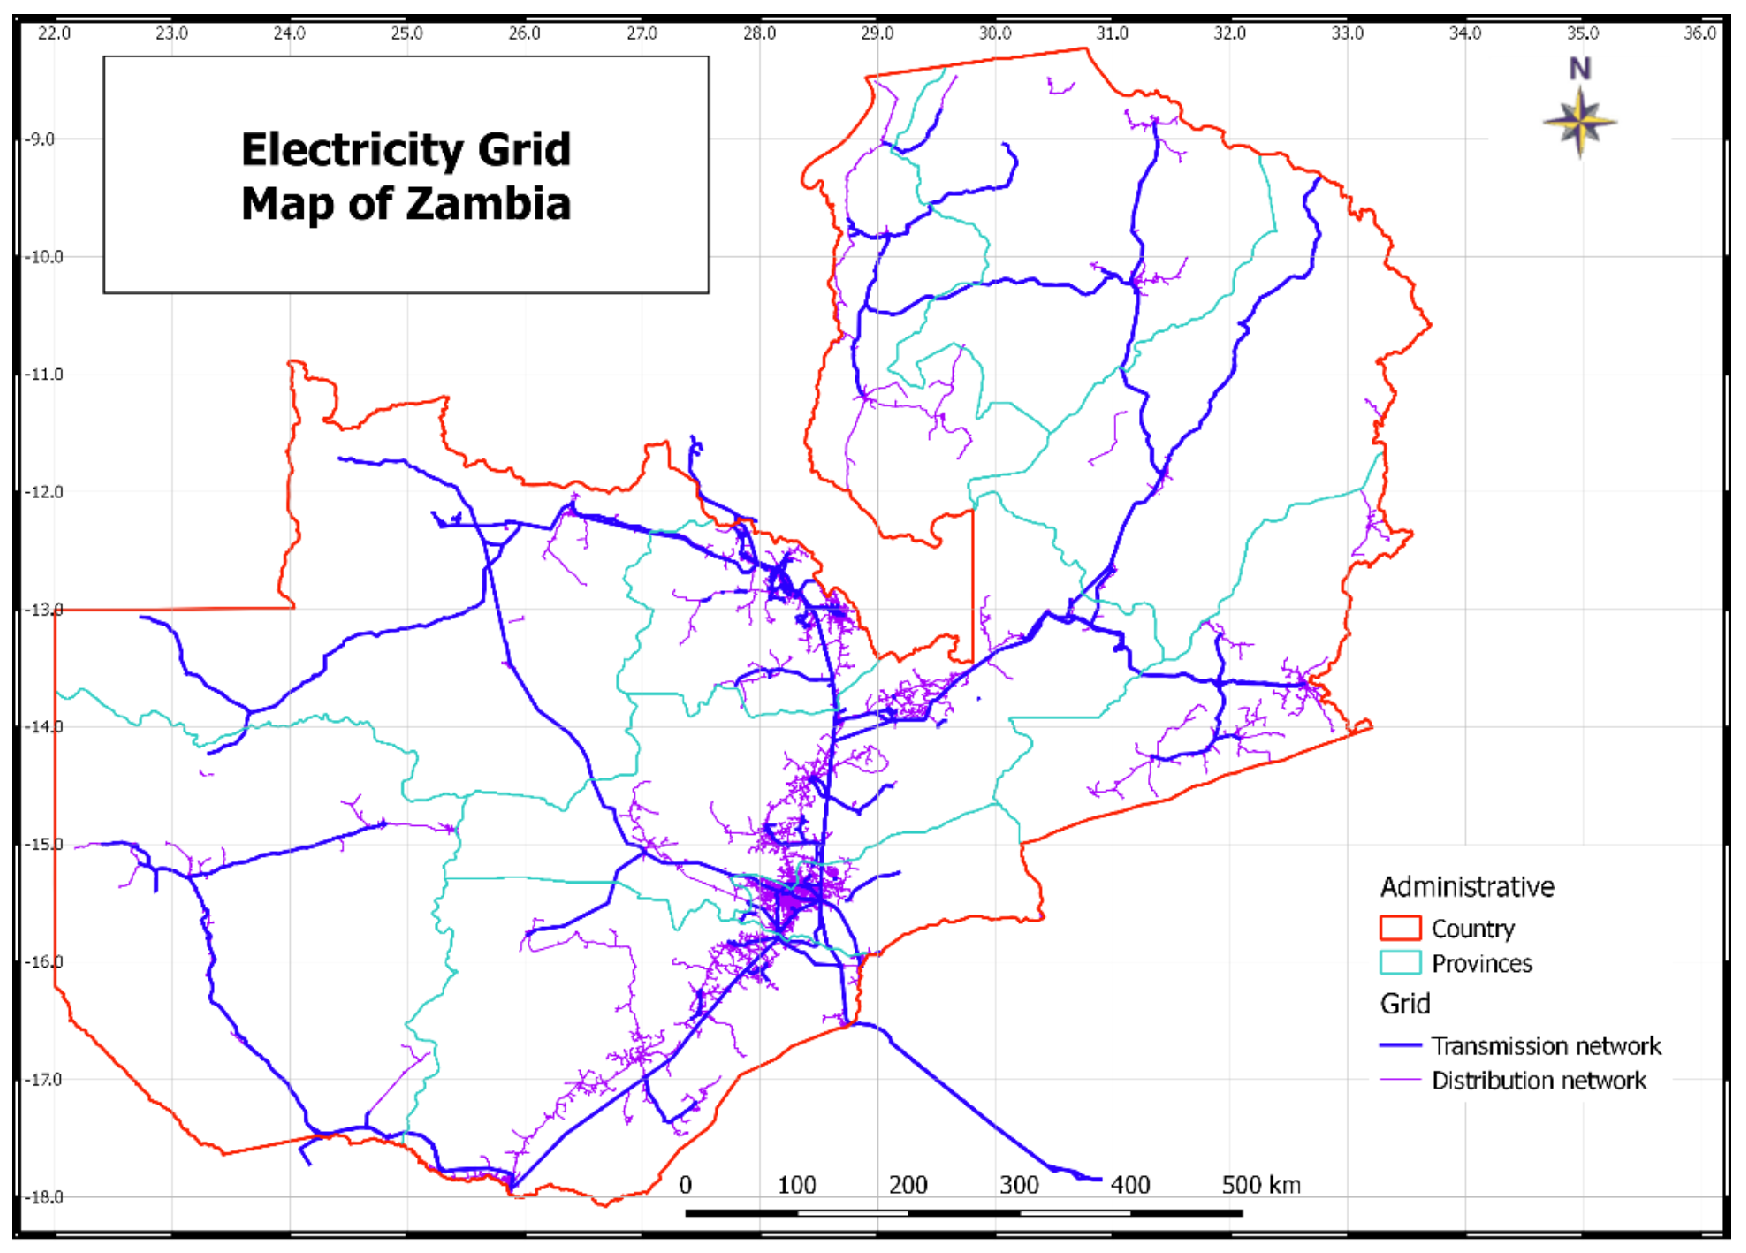
The implementation began with an analysis of Zambia’s existing electrical infrastructure, which comprises over 11,100 km of high-voltage transmission lines and an extensive distribution network divided into four operational divisions: Lusaka, Copperbelt, Northern, and Southern. In
Figure 2, the described network is presented. The characteristics of the existing network, including 175 primary substations and approximately 18,862 MV/LV transformers, provided crucial baseline data for planning the extension of the network [
29]. ZESCO’s ambitious development program, requiring investments ranging from USD 44 to 223 million annually through 2020–2039, provided a relevant context for testing the tools’ capabilities in supporting strategic planning decisions.
2.2. Proposed Geospatial Tools
The methodology developed in this work implements two specialized QGIS plugins that provide a comprehensive framework for rural electrification planning, integrating data processing, spatial analysis, and economic assessment capabilities. Each plugin addresses distinct but complementary aspects of the planning process, enabling a systematic approach to electrification decision-making.
The first plugin, the Buffering plugin, represents the initial step in the electrification planning process, designed to process raw geospatial data into meaningful settlement groups that can inform electrification strategies. The plugin supports two distinct methodologies, each tailored to different types of input data. The first methodology implements a population-based approach, which utilizes high-resolution population distribution data from Columbia University [
30]. This dataset offers granular population information with a resolution of approximately 30 m, enabling accurate demographic analysis for electrification planning. The second methodology employs a building-based approach, leveraging Open Building data [
31]. This comprehensive dataset includes building footprints across Africa, South Asia, and Latin America, providing detailed information about building sizes and confidence scores, which allows for infrastructure-based settlement identification. Both approaches employ a sophisticated buffering process, though with different parameters. Data quality was ensured through appropriate filtering measures for both datasets. The Columbia University population data incorporated census information and high-resolution satellite imagery to maintain demographic accuracy. For the Open Building dataset, quality control was implemented by filtering the initial 7.9 million buildings to include only those with confidence levels exceeding 80%, resulting in 3.2 million buildings for analysis while preserving comprehensive spatial coverage.
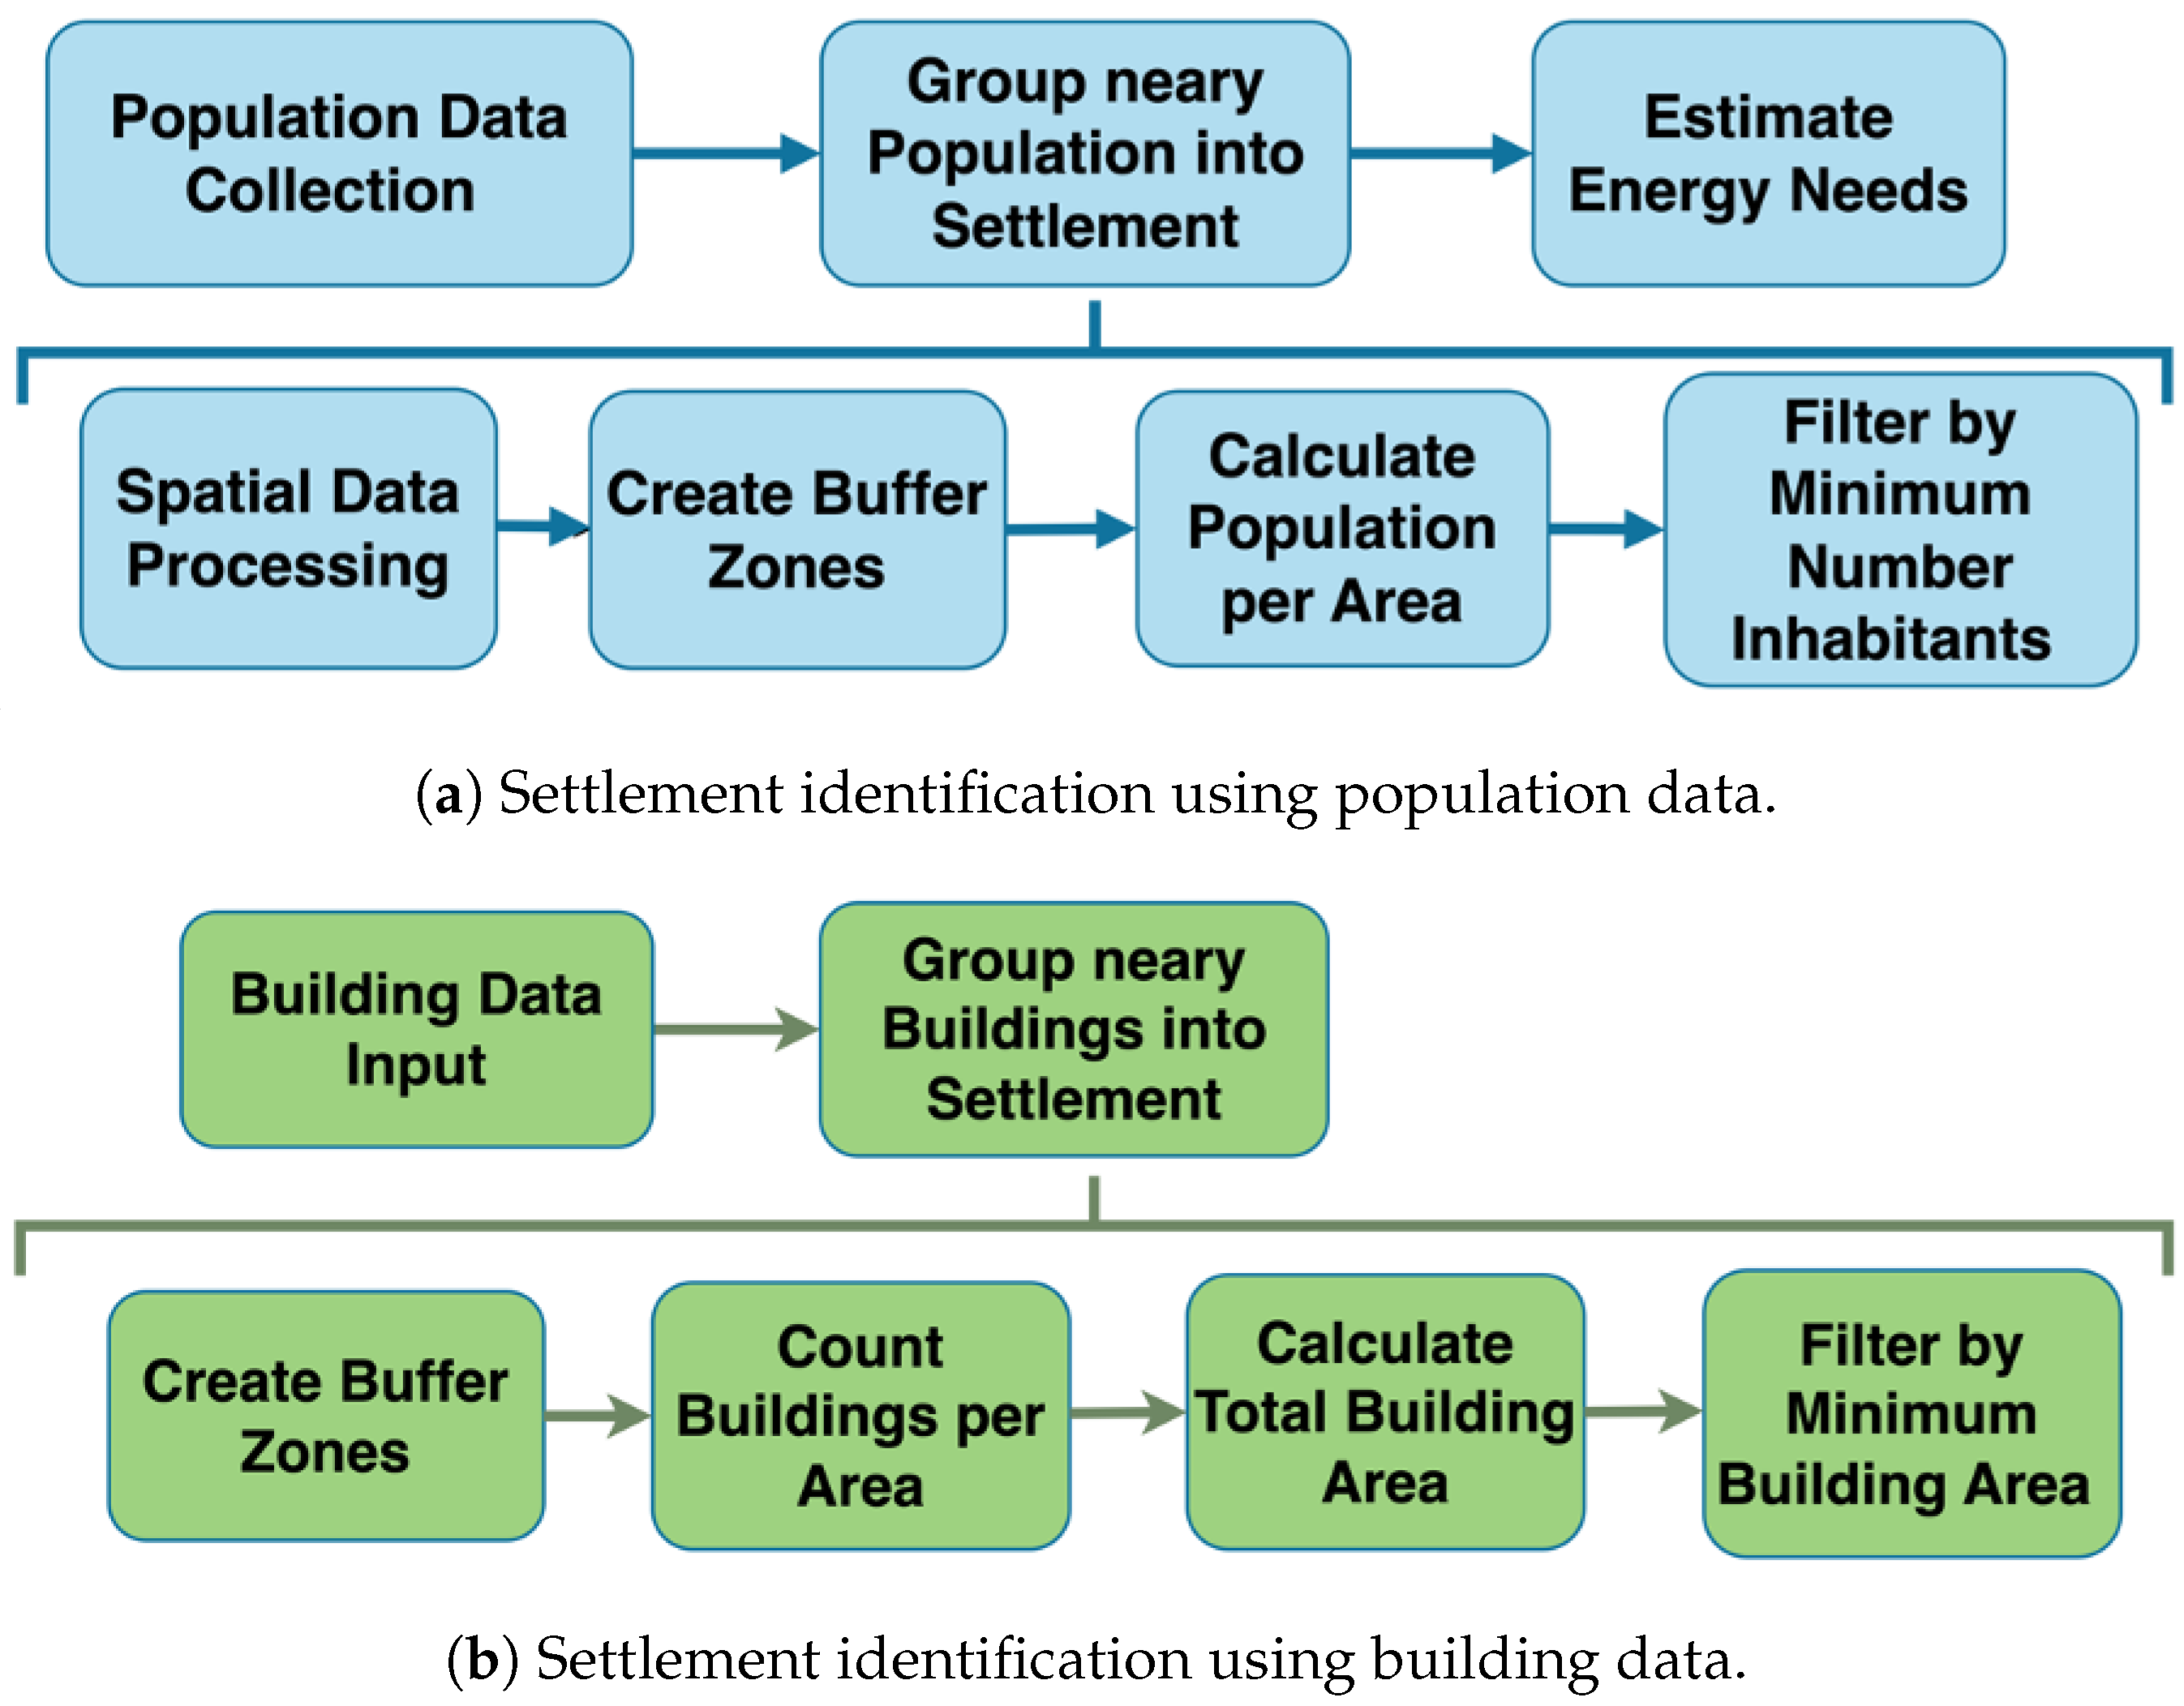
Population-based processing considers minimum inhabitant thresholds within buffer zones to determine potential electrification areas, while building-based processing evaluates minimum square meter thresholds of building areas within buffer zones for the same purpose, as illustrated in
Figure 3. Despite the data source, the plugin generates geospatial layers of settlement groups representing potential service zones, which can be used for subsequent electrification planning stages. Additionally, it provides population and building density metrics for each identified group. These settlement groups serve as the foundation for planning both local infrastructure development through LV lines and larger infrastructure developments using MV lines. The processed data become critical inputs for the second plugin’s network design and cost allocation processes, as shown in
Figure 1. The pseudo-code for this procedure is presented in Algorithm 1.
| Algorithm 1 Pseudo-code for the Buffering plugin—building methodology |
- 1:
Input point building layer and set parameters (buffer distance, CRS, minimum area) - 2:
Convert buffer distance from meters to appropriate units based on CRS - 3:
Create buffer zones around building points with the specified distance - 4:
Create a spatial index for buffer zones to optimize performance - 5:
Convert multipart geometries to single-part geometries - 6:
Count number of buildings within each buffer polygon - 7:
Create a spatial index for the counted polygons - 8:
Calculate the total building area within each buffer polygon - 9:
Create a spatial index for polygons with area information - 10:
Extract only buffer zones exceeding the minimum square meters threshold - 11:
Output filtered building groups
|
Following the output from the Buffering plugin, the Grid Routing and Cost Allocation plugin advances the electrification planning process with sophisticated network design and economic assessment capabilities. This second phase begins with hierarchical clustering through agglomerative methods, enabling adaptive grouping of villages based on spatial relationships. The clustering algorithm can be refined through various linkage methods (single, complete, average, weighted) to optimize settlement grouping based on local conditions and geographical constraints. Secondly, network reticulation represents a fundamental redefinition of the traditional MST approach. While sharing some characteristics with conventional MST algorithms, this innovative approach enables connections to any point along the existing network through an iterative procedure, rather than limiting connections to predefined nodes. Formally, the modified MST approach is defined as follows: given a set of unconnected village clusters, , an existing network, N, consisting of connected segments, and a distance function, , representing the Euclidean distance between points a and b, our algorithm iteratively connects each unconnected cluster to either the existing network or to a cluster previously connected.
For each iteration,
i, we select the connection
that minimizes the following:
where
is the set of currently unconnected clusters,
is the set of already-connected clusters, and
can be any point along the existing network,
N, or any point representing a connected cluster.
This differs from traditional MST algorithms in that the connections can be made to any point along existing line segments, not just to nodes; the algorithm follows a greedy approach based on the proximity to both the existing network and already-connected clusters; finally, the process incorporates both inter-cluster and intra-cluster connections hierarchically. Although this does not guarantee global optimality in the mathematical sense of a traditional MST, it provides a practical solution that better reflects the physical realities of grid extension planning, where intermediate connections along power lines are both technically feasible and economically advantageous.
Finally, the plugin introduces a novel allocation cost methodology that distributes grid extension costs among electrified villages based on their relative peak power demand, leading to a fair allocation mechanism, as present in Equation (
2), which results from Equations (
3)–(
6). The allocation methodology considers several key parameters across the project’s lifetime. Each village’s energy profile is characterized by its annual energy demand (
, measured in kWh) and peak power demand (
, in kW), which directly influence the power flow in the connected line segments (
, in kW). The economic assessment incorporates both temporal and financial factors; the analysis spans a period of years (
y), applying a discount rate,
r, to account for the time value of money. The cost structure includes initial investment costs (
), annual maintenance expenses (
), and ongoing energy costs (
), all expressed in dollars throughout the project timeline. This comprehensive approach ensures that both technical requirements and economic considerations are properly weighted in the final allocation of costs among villages.
The village-specific LCOE for grid extension is calculated as follows:
The present value of the village’s annual energy demand is given by the following:
The village peak power demand is calculated considering the load factor:
The net present value of line costs includes investment, maintenance, and energy costs:
Finally, the cost allocation factors are determined by the ratio of a village’s peak power demand to the total peak power demand flowing through each line segment:
By distributing costs based on these weighting factors,
, each village’s contribution to the grid extension cost is directly proportional to its use of the infrastructure. This approach can be formally justified firstly by the cost recovery, that is, the total costs of each line segment are fully allocated among the villages served, ensuring financial sustainability:
Secondly, usage proportionality, that is, villages with higher energy demands bear proportionally higher costs:
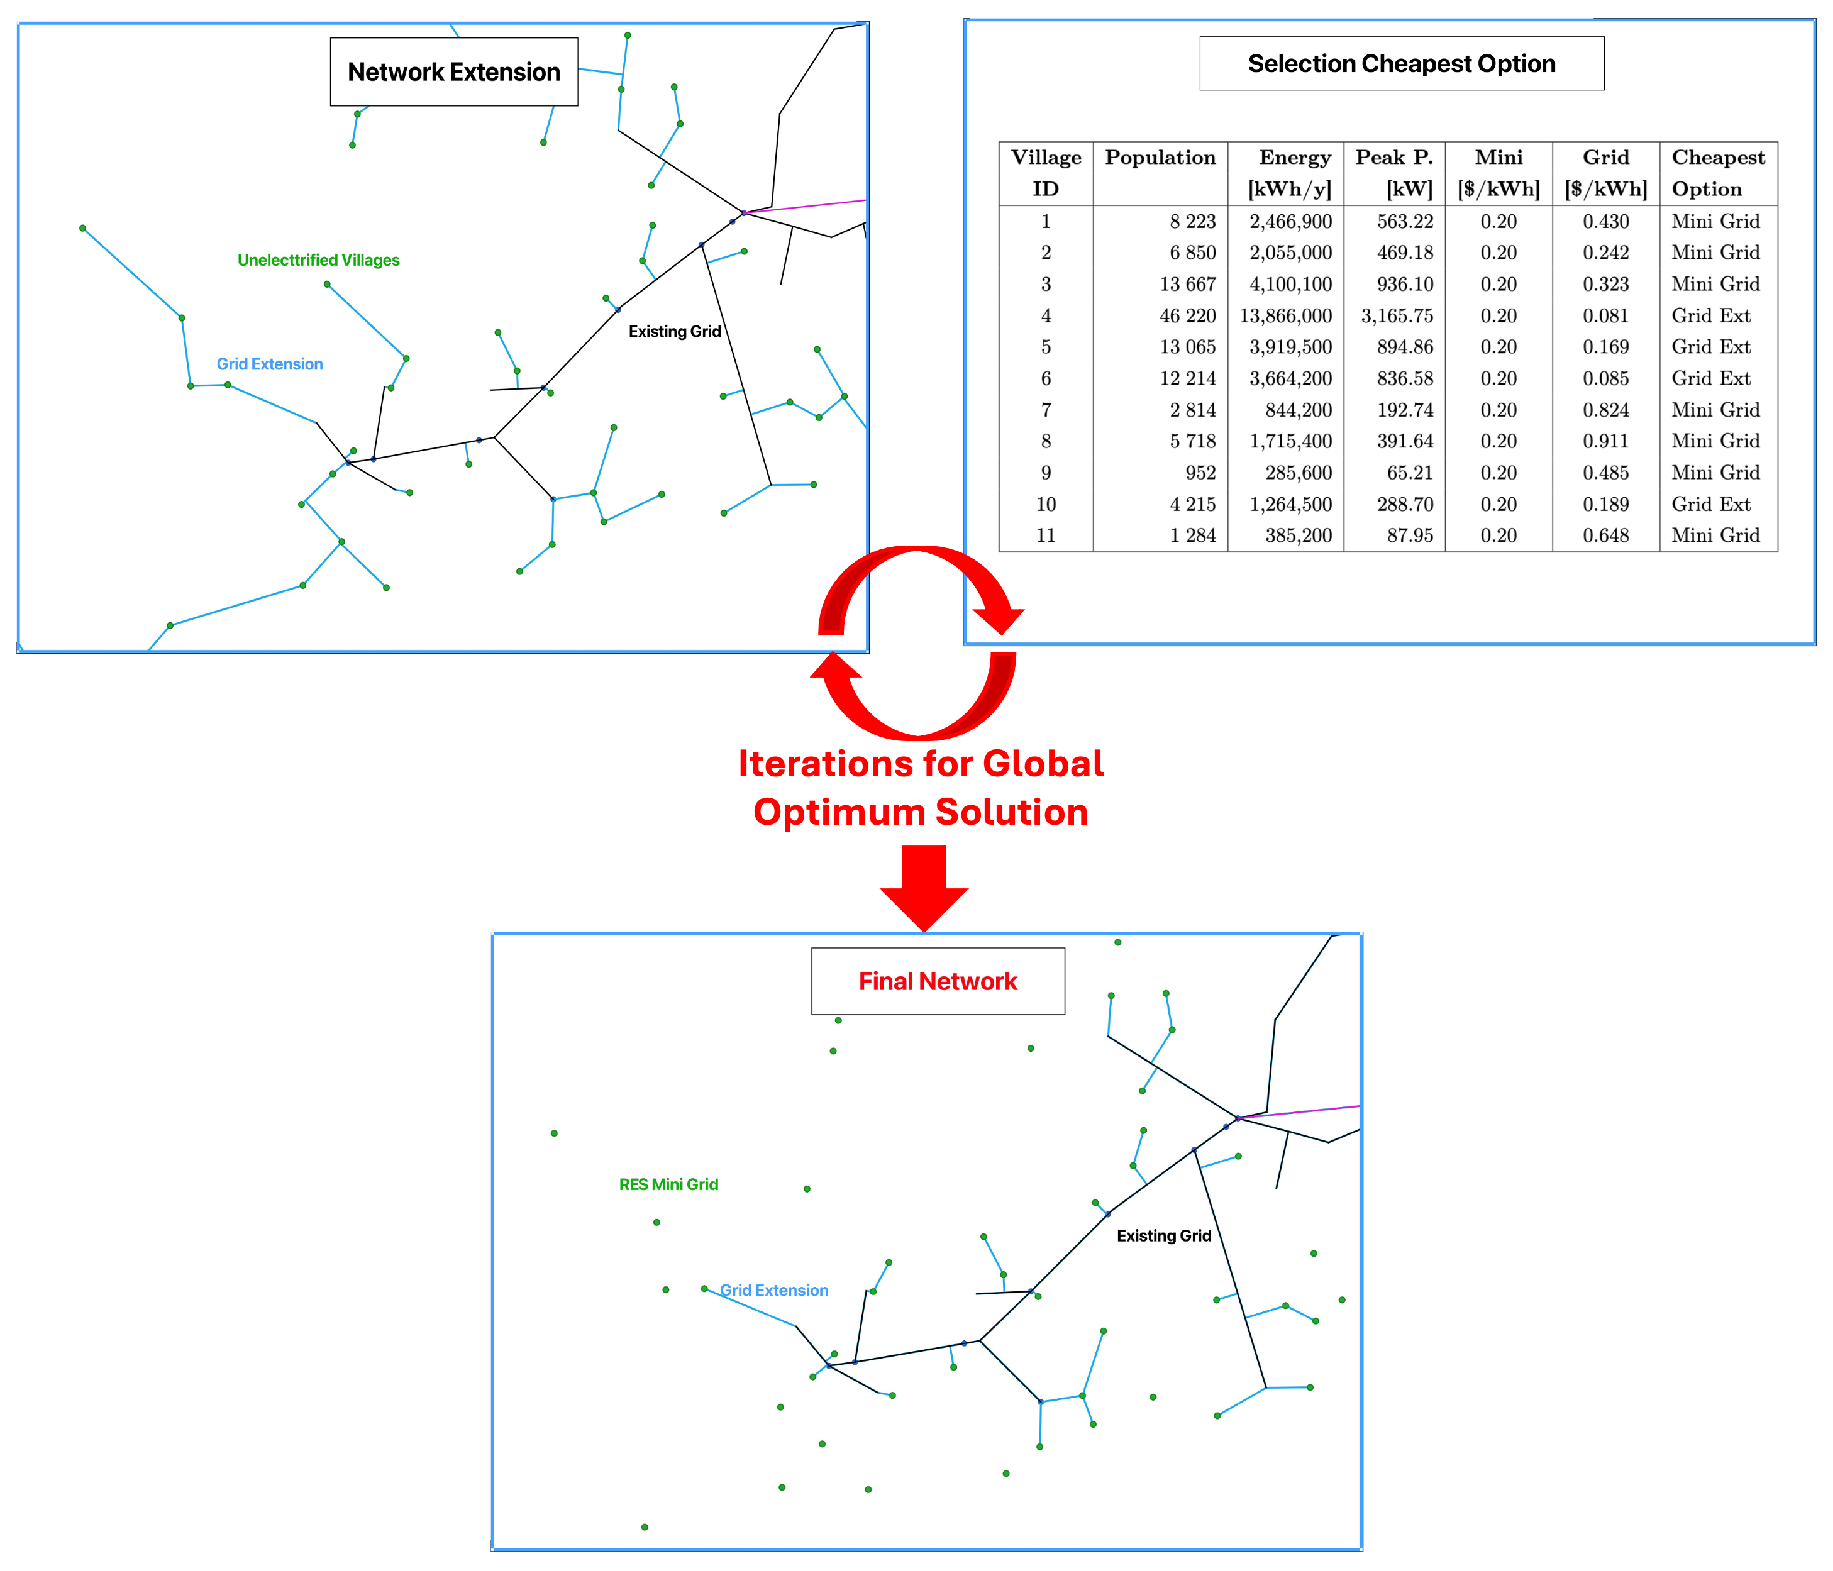
Finally, iterative optimization. This approach calculates village-specific LCOEs through an iterative process that considers various factors including energy demand, load factors, and operation and maintenance costs. The methodology incorporates a sophisticated comparison between grid extension and mini-grid options, with iterations continuing until a stable solution is reached where the cheapest option remains unchanged for all villages, as shown in
Figure 4.
This comprehensive approach considers the complex interplay between individual village demands, spatial distribution, and overall network structure, providing policymakers with village-specific LCOE values rather than a single grid LCOE for entire extensions. While these values serve as investment indicators rather than actual tariffs, they enable informed decision-making about electrification strategies. The pseudo-code for this procedure is presented in Algorithm 2.
| Algorithm 2 Pseudo-code for Grid Routing and Cost Allocation |
- 1:
Input unelectrified villages with inhabitant data and preexisting network - 2:
Perform hierarchical clustering on building centroids using distance criterion - 3:
Split clusters with fewer than three villages into individual clusters - 4:
Assign unique IDs to villages and calculate energy demand and peak power - 5:
Iteratively connect unconnected clusters to the closest connection point - 6:
for each unconnected cluster do - 7:
Find the minimum distance to the connected network or already-connected cluster - 8:
Add connection line to the grid-routing layer - 9:
Connect villages within the cluster using MST - 10:
Update the connected network - 11:
end for - 12:
Identify lines directly connected to the preexisting network - 13:
Find interconnected line groups and assign unique extension IDs - 14:
Split lines at intersections and assign node IDs - 15:
Calculate line lengths, energy transported, and peak power - 16:
Compute NPV costs for each line segment - 17:
for each extension do - 18:
Create a cost allocation table for villages and lines - 19:
Update grid LCOE for each connected village - 20:
end for - 21:
Compare grid LCOE with mini-grid LCOE to determine the cheapest electrification option - 22:
while grid extension features change do - 23:
Recalculate with only villages where grid extension is cheapest - 24:
Update allocation tables and LCOE values - 25:
Recompare grid and mini-grid costs - 26:
end while - 27:
Filter the final grid to include only cost-effective connections
|
3. Implementation and Validation
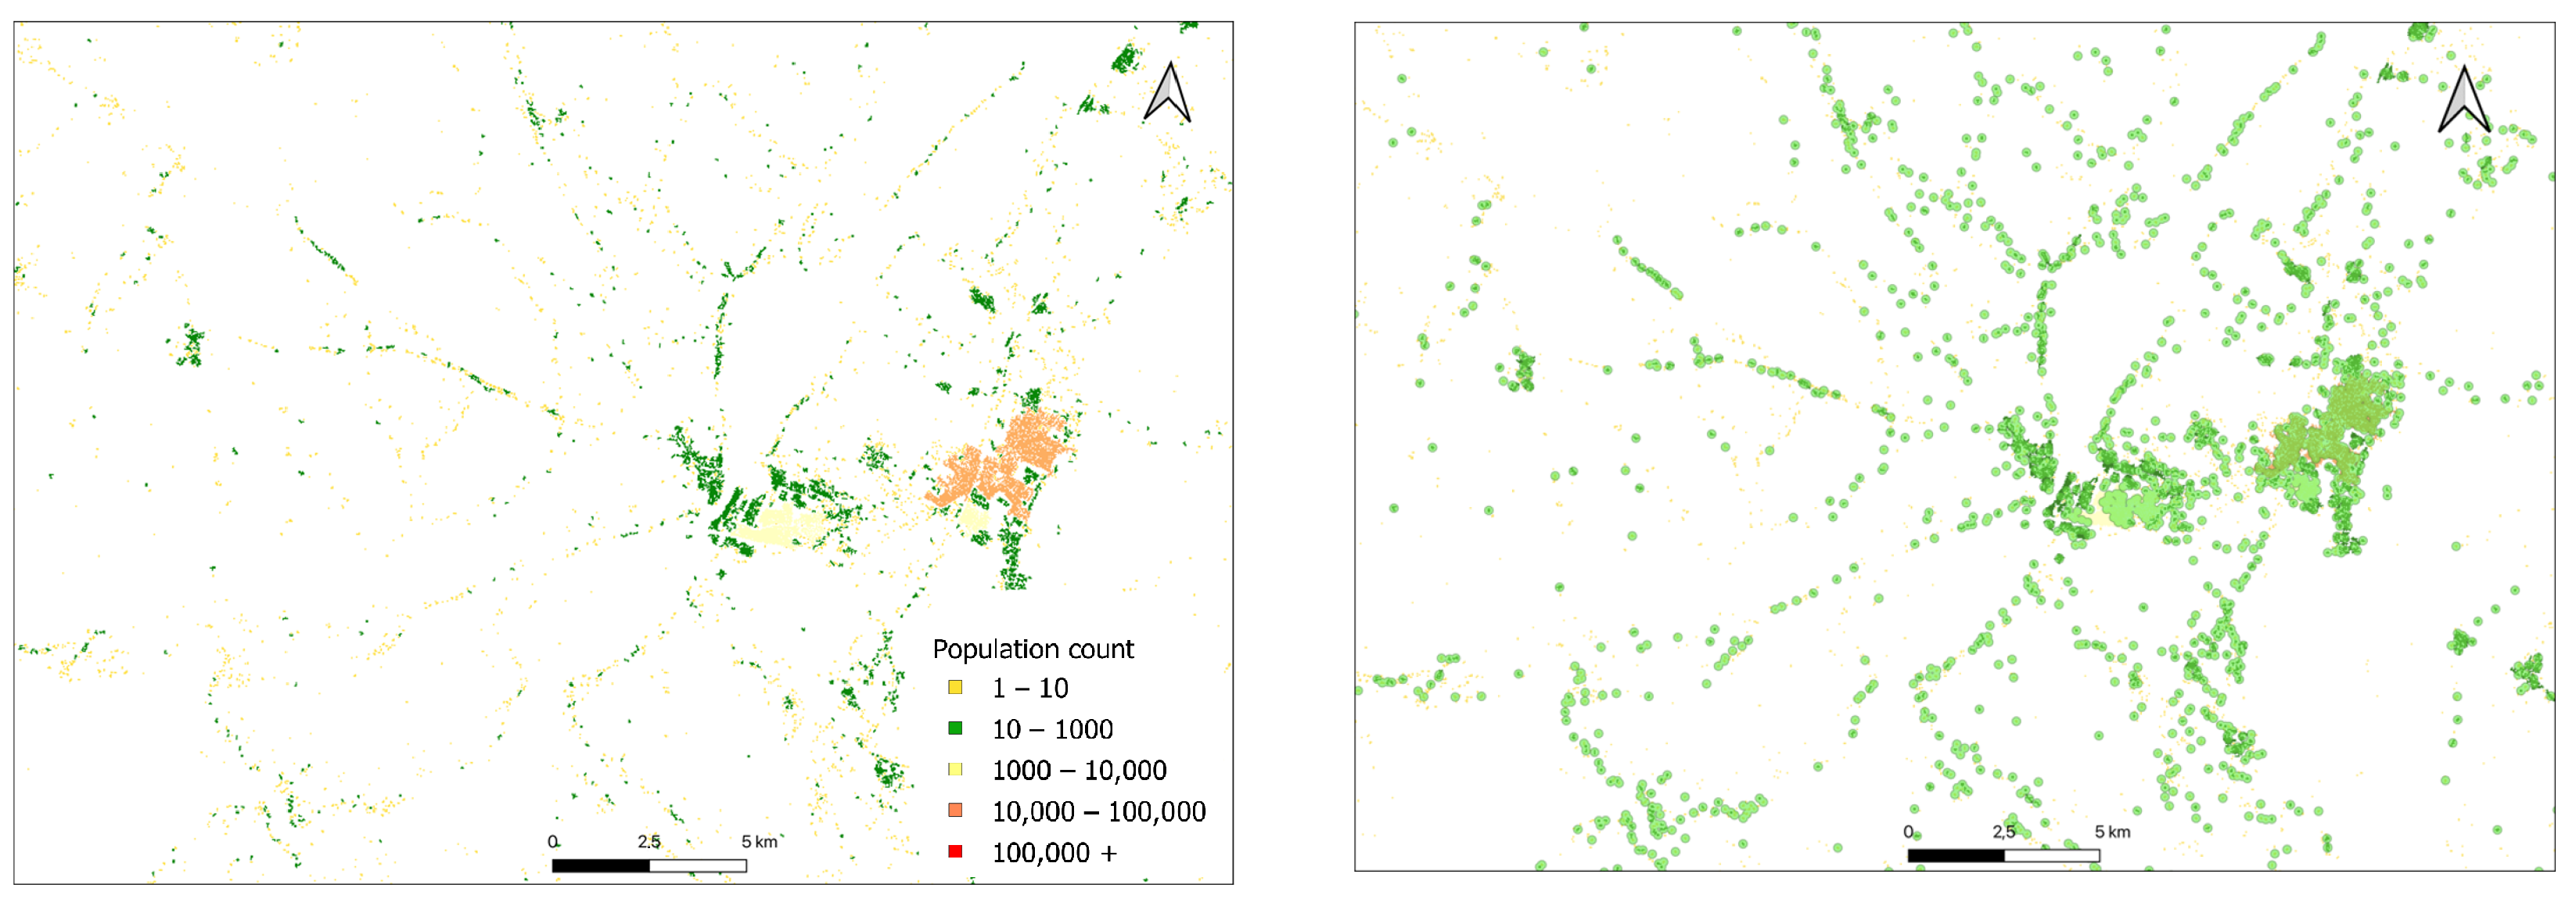
The Buffering plugin successfully processed two distinct data sources, namely, Columbia University’s population density data and the Open Building data, achieving significant data reduction while maintaining essential information for planning purposes. The population-based methodology reduced the initial 1,570,281 groups of inhabitants to 175,302 significant settlement groups. This consolidation process maintained population distribution patterns while identifying viable electrification zones, achieving an input data reduction of 88.8%, which facilitated the subsequent analysis steps.
Figure 5 shows the graphical input and output of the procedure.
The building-based methodology processed a dataset of 3.2 million buildings with confidence levels above 80%, filtered from an initial dataset of 7.9 million. The methodology consolidated these into 162,142 buffers, achieving an input data reduction of 94.9%, with an average of 19 buildings per cluster. The total building area analyzed decreased marginally from 280.7 km
2 to 277.9 km
2, indicating the effective preservation of significant structures while eliminating noise in the data.
Figure 5 shows the graphical input and output of the procedure.
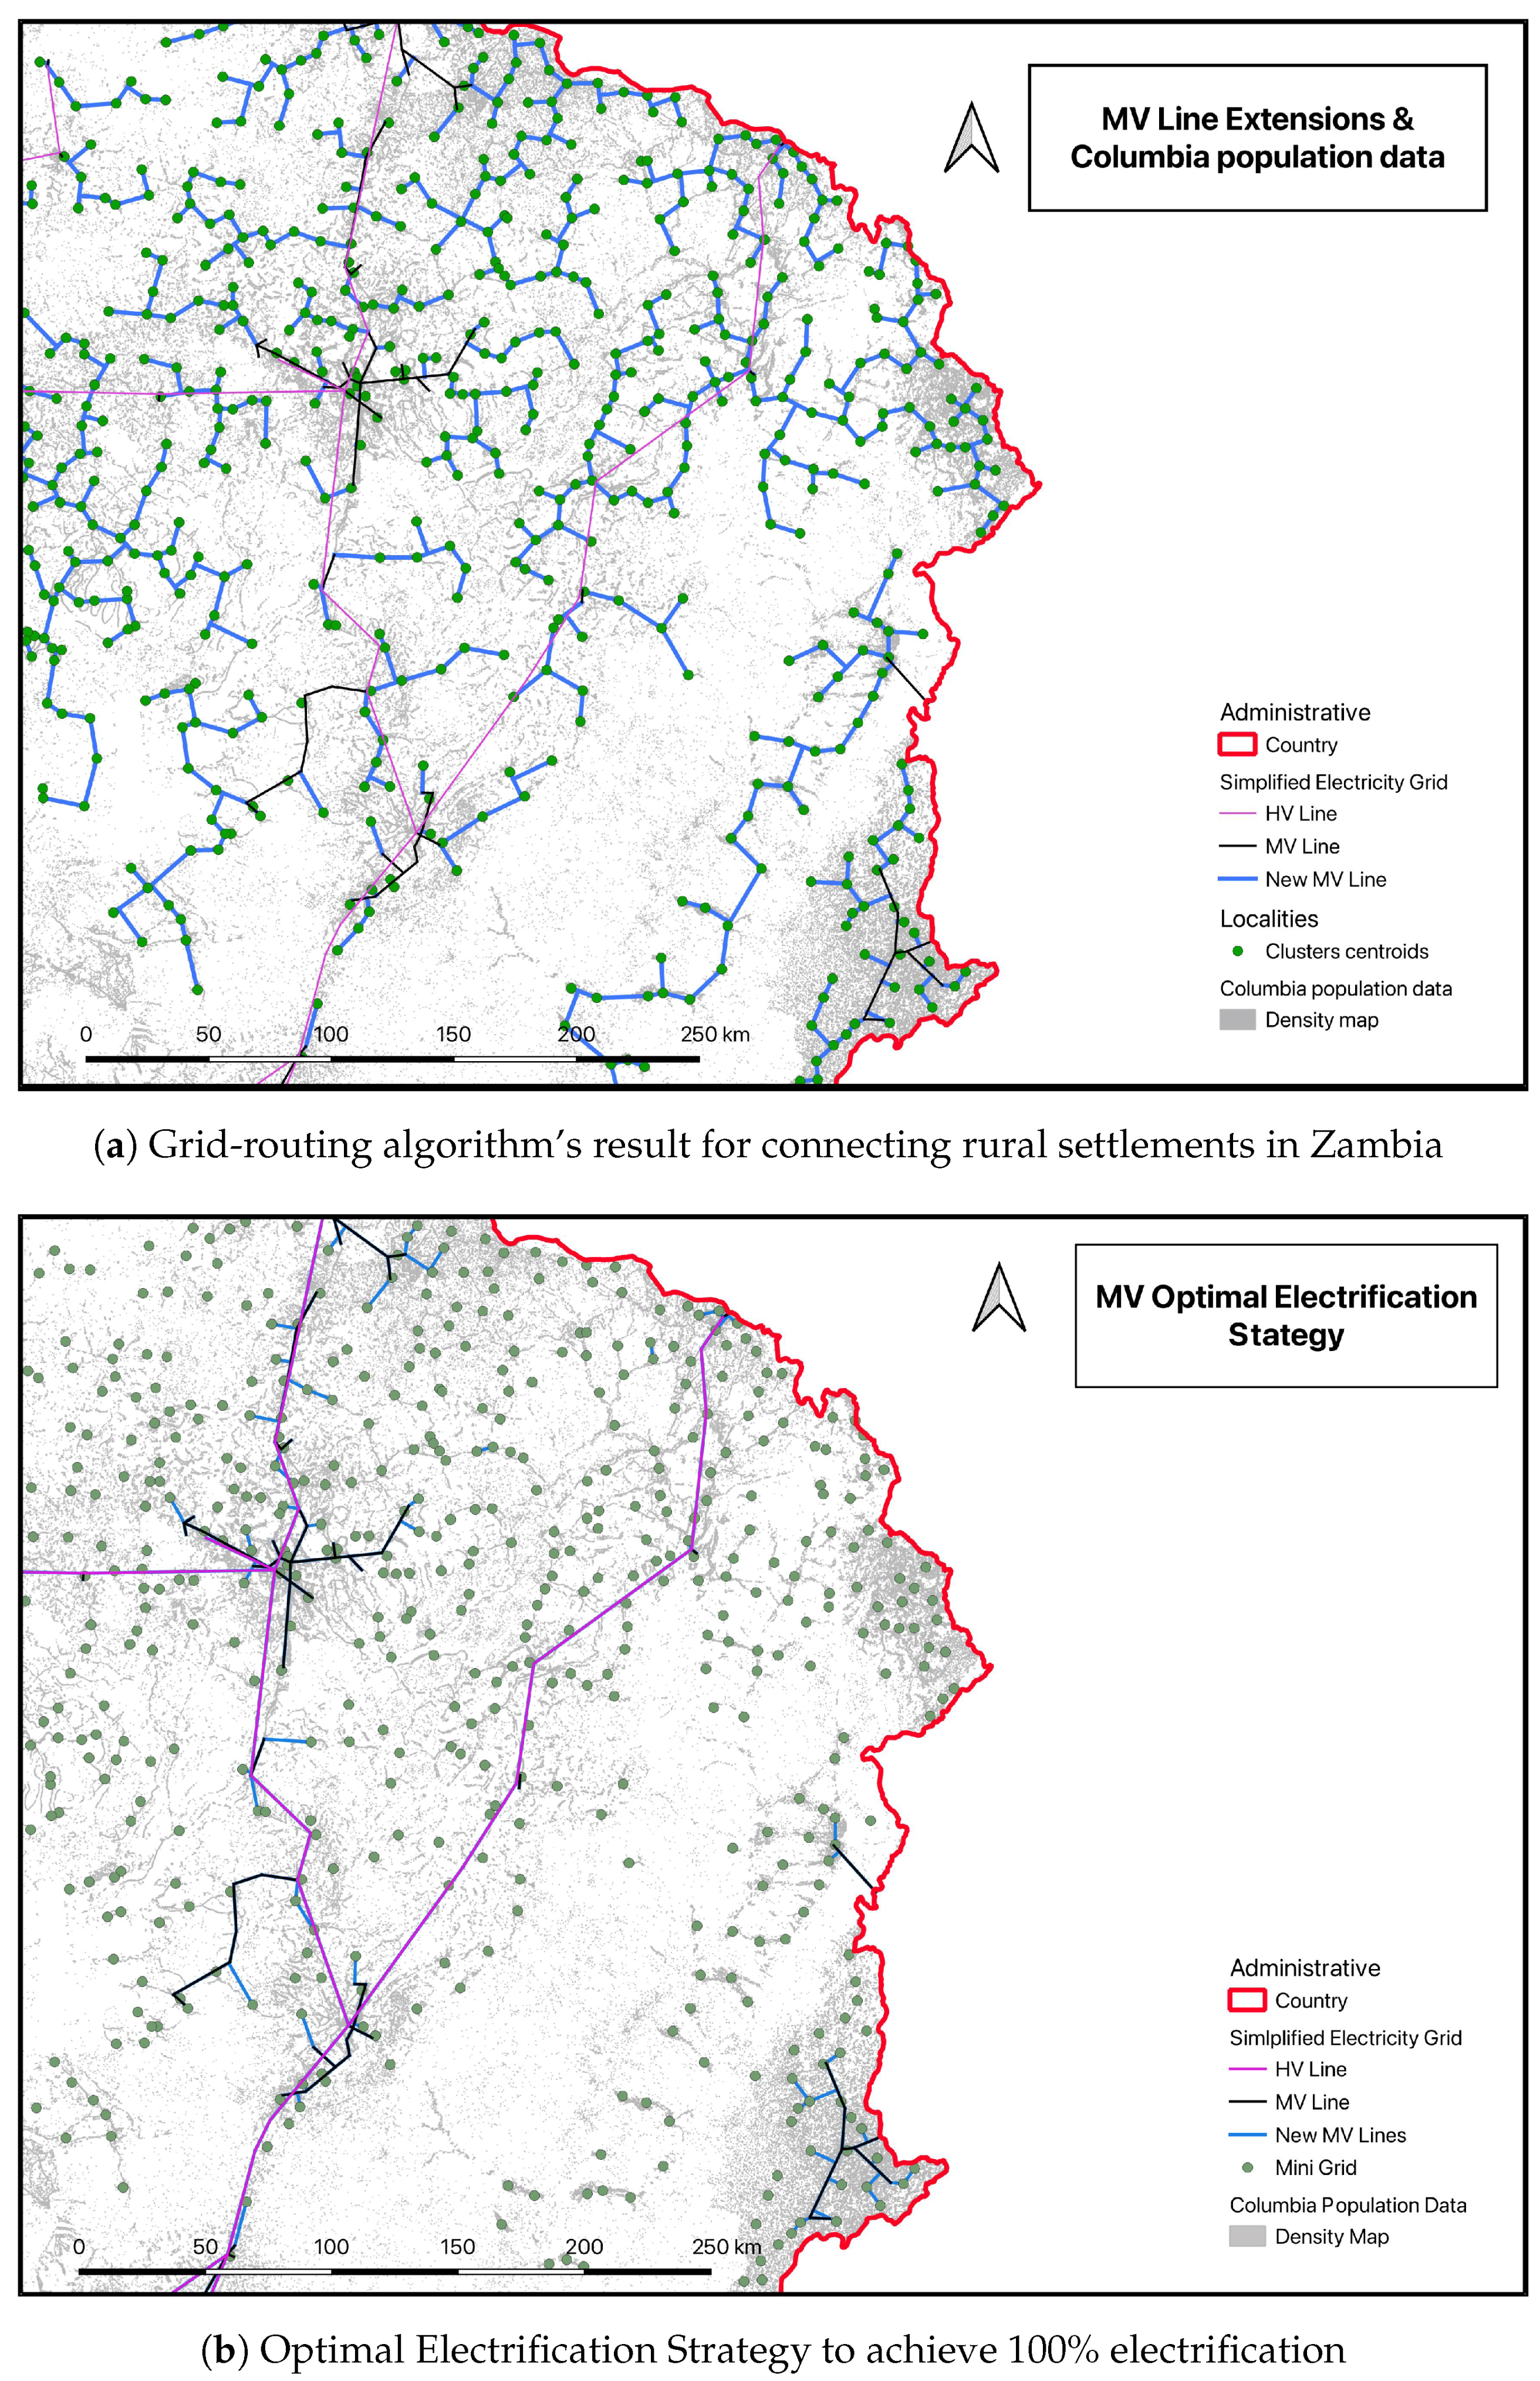
Regarding the second plugin, named Grid Routing and Cost Allocation, the hierarchical clustering analysis took the ‘localities’ layer as input, which contained concentrated areas of population or settlements made of centroid points of clustered populations needed to optimize the electrification at the MV level. Using a 1 km distance threshold and the single linkage method, the clustering algorithm revealed a key characteristic of Zambian rural settlements: their extreme dispersion caused each village to form its own cluster, even when the threshold was increased to 2 km. This choice of 1 km is justified by its technical alignment with the maximum allowable length of the LV network, which is a standard index commonly used by DSOs in rural electrification projects and supported by relevant literature [
4]. This outcome highlights the unique challenges of rural electrification in Zambia, where low population density significantly impacts infrastructure planning. The grid-routing algorithm adapted to this dispersed settlement pattern by focusing on inter-cluster connections without using intra-cluster networks, which connect the different villages inside a cluster, due to each village forming its own cluster. The algorithm successfully generated a network of MV line extensions based on minimum Euclidean distance principles, connecting villages either to the existing network or to previously connected settlements, as shown in
Figure 6a. This initial grid routing represents the complete network design that would be required to connect all unelectrified communities to the grid, without yet considering economic viability. The network topology is optimized to minimize the total length of lines while ensuring connectivity for all settlements.
Following this initial network design, the cost allocation analysis was performed using parameters calibrated to Zambian conditions (including an energy cost of 0.08 USD/kWh and a line cost of 25,000 USD/km), based on industry expertise and relevant references [
32,
33]. This analysis revealed clear patterns in optimal electrification strategies by calculating village-specific LCOEs for grid extension and comparing them against mini-grid alternatives. Villages near existing infrastructure generally favored grid extension, as their LCOEs remained below the 0.20 USD/kWh mini-grid threshold. This threshold is supported by a real-life study conducted within the United Nations Development Programme [
34]. In contrast, the trend indicates that more remote settlements are better suited for mini-grid solutions, as their grid extension LCOEs often exceed this threshold.
Figure 6b shows the final optimized results after the economic assessment, where only economically viable grid extensions are retained (blue lines), while more distant communities are identified for mini-grid solutions (green dots).
This analysis converged after three iterations, providing a stable and economically justified electrification strategy for each village in the study area as reported in
Table 1. These results demonstrate the plugins’ effectiveness in processing complex spatial data, identifying viable electrification zones, and generating cost-optimized infrastructure plans at a country scale. The tools successfully automated critical planning decisions while maintaining transparency in the decision-making process.
4. Comparative Analysis with Existing Optimization-Based Open-Source Tools
This section presents a detailed comparison between the developed procedures and GISEle, an existing open-source tool for rural electrification planning. Through specific case studies and examples from Zambia, we examine methodological differences, computational approaches, and their practical implications for addressing rural electrification challenges.
GISEle, a tool developed by
Politecnico di Milano represents a comprehensive approach to rural electrification planning that merges elements of energy and electric models. It employs GIS, graph theory, and terrain analysis to develop optimal electric network topology. The tool covers the necessary steps for rural electrification planning: finding the optimal electrification solution by choosing between on-grid and off-grid solutions, sizing the generation portfolio for off-grid systems, and electric network design. The optimization problem is formulated as an MILP model with the objective function of minimizing the overall NPC costs for the expansion project:
where
,
, and
, respectively, represent the construction of a link between
i and
j, the MG electrification option for cluster
c, and the effective connection to the primary substation,
s. Consequently,
,
,
, and
denote the NPC for the connection lines
, the cost for the MG in the community,
c, and the cost of using the primary substation,
s. From a methodological standpoint, the optimization framework in GISEle incorporates electrical grid constraints, including maximum loading limits for power lines and substations, as well as a linearized nodal voltage formulation. The voltage drop,
, in lines
i-
j is computed using the linear approximation in Equation (
10):
where
R and
X denote the line resistance and reactance,
P and
Q denote the active and reactive power, and
denotes nominal voltage. A complete description of the chosen comparative tool is reported in [
4].
A key distinction between the approaches lies in their connection point methodology. GISEle requires predefined substation locations as starting points for network extensions, following a traditional power system planning approach. In contrast, the proposed QGIS plugins show more flexibility by allowing connections to any point along the existing MV network. This fundamental difference means the presented approach can identify potentially more cost-effective connection points anywhere along the existing infrastructure, representing a significant advantage over conventional planning methodologies. Additionally, while GISEle’s total cost calculations incorporate penalty factors as relative additional costs to the baseline cost per electric line kilometer, the proposed approach maintains a simpler, more direct cost structure. However, the present approach has limitations, namely, the cost allocation based on line usage may not fully represent infrastructure development requirements, as many lines must be built regardless of individual village decisions due to network interconnections. This contrasts with holistic optimization approaches, such as GISEle, which consider the entire system simultaneously but require significantly more computational resources and face scalability issues (see
Table 2 for a detailed comparison of the two approaches).
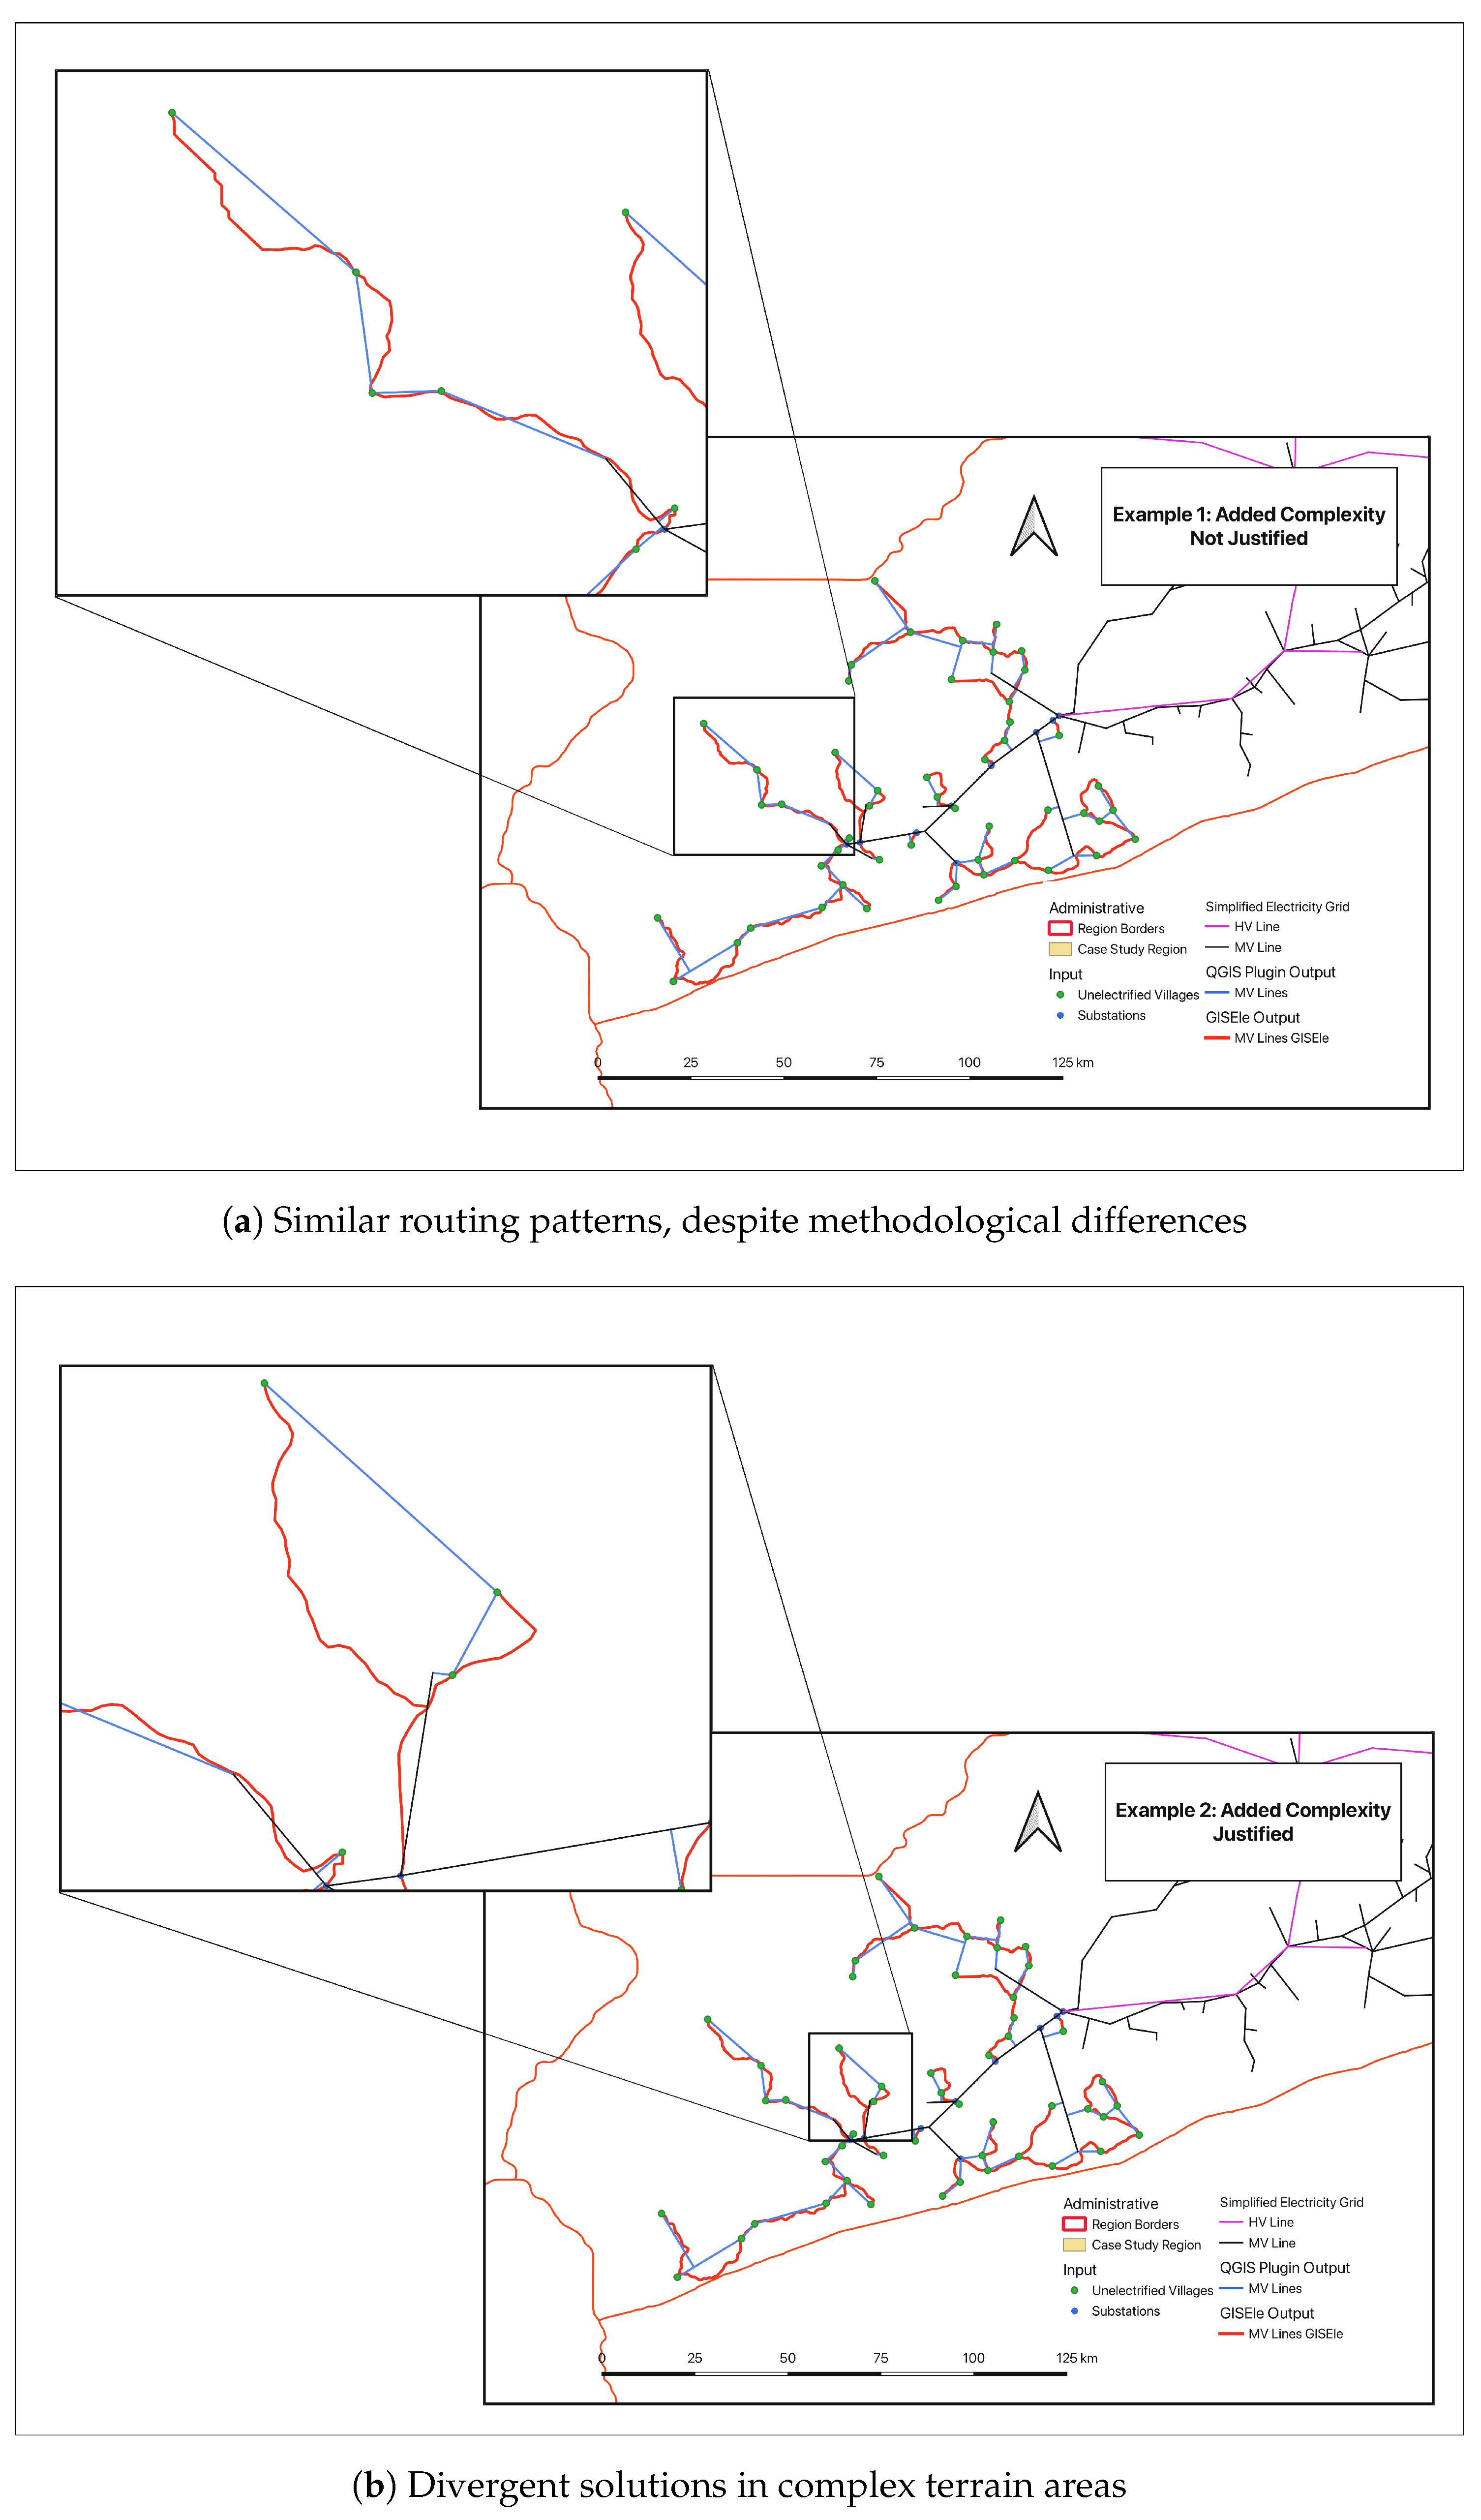
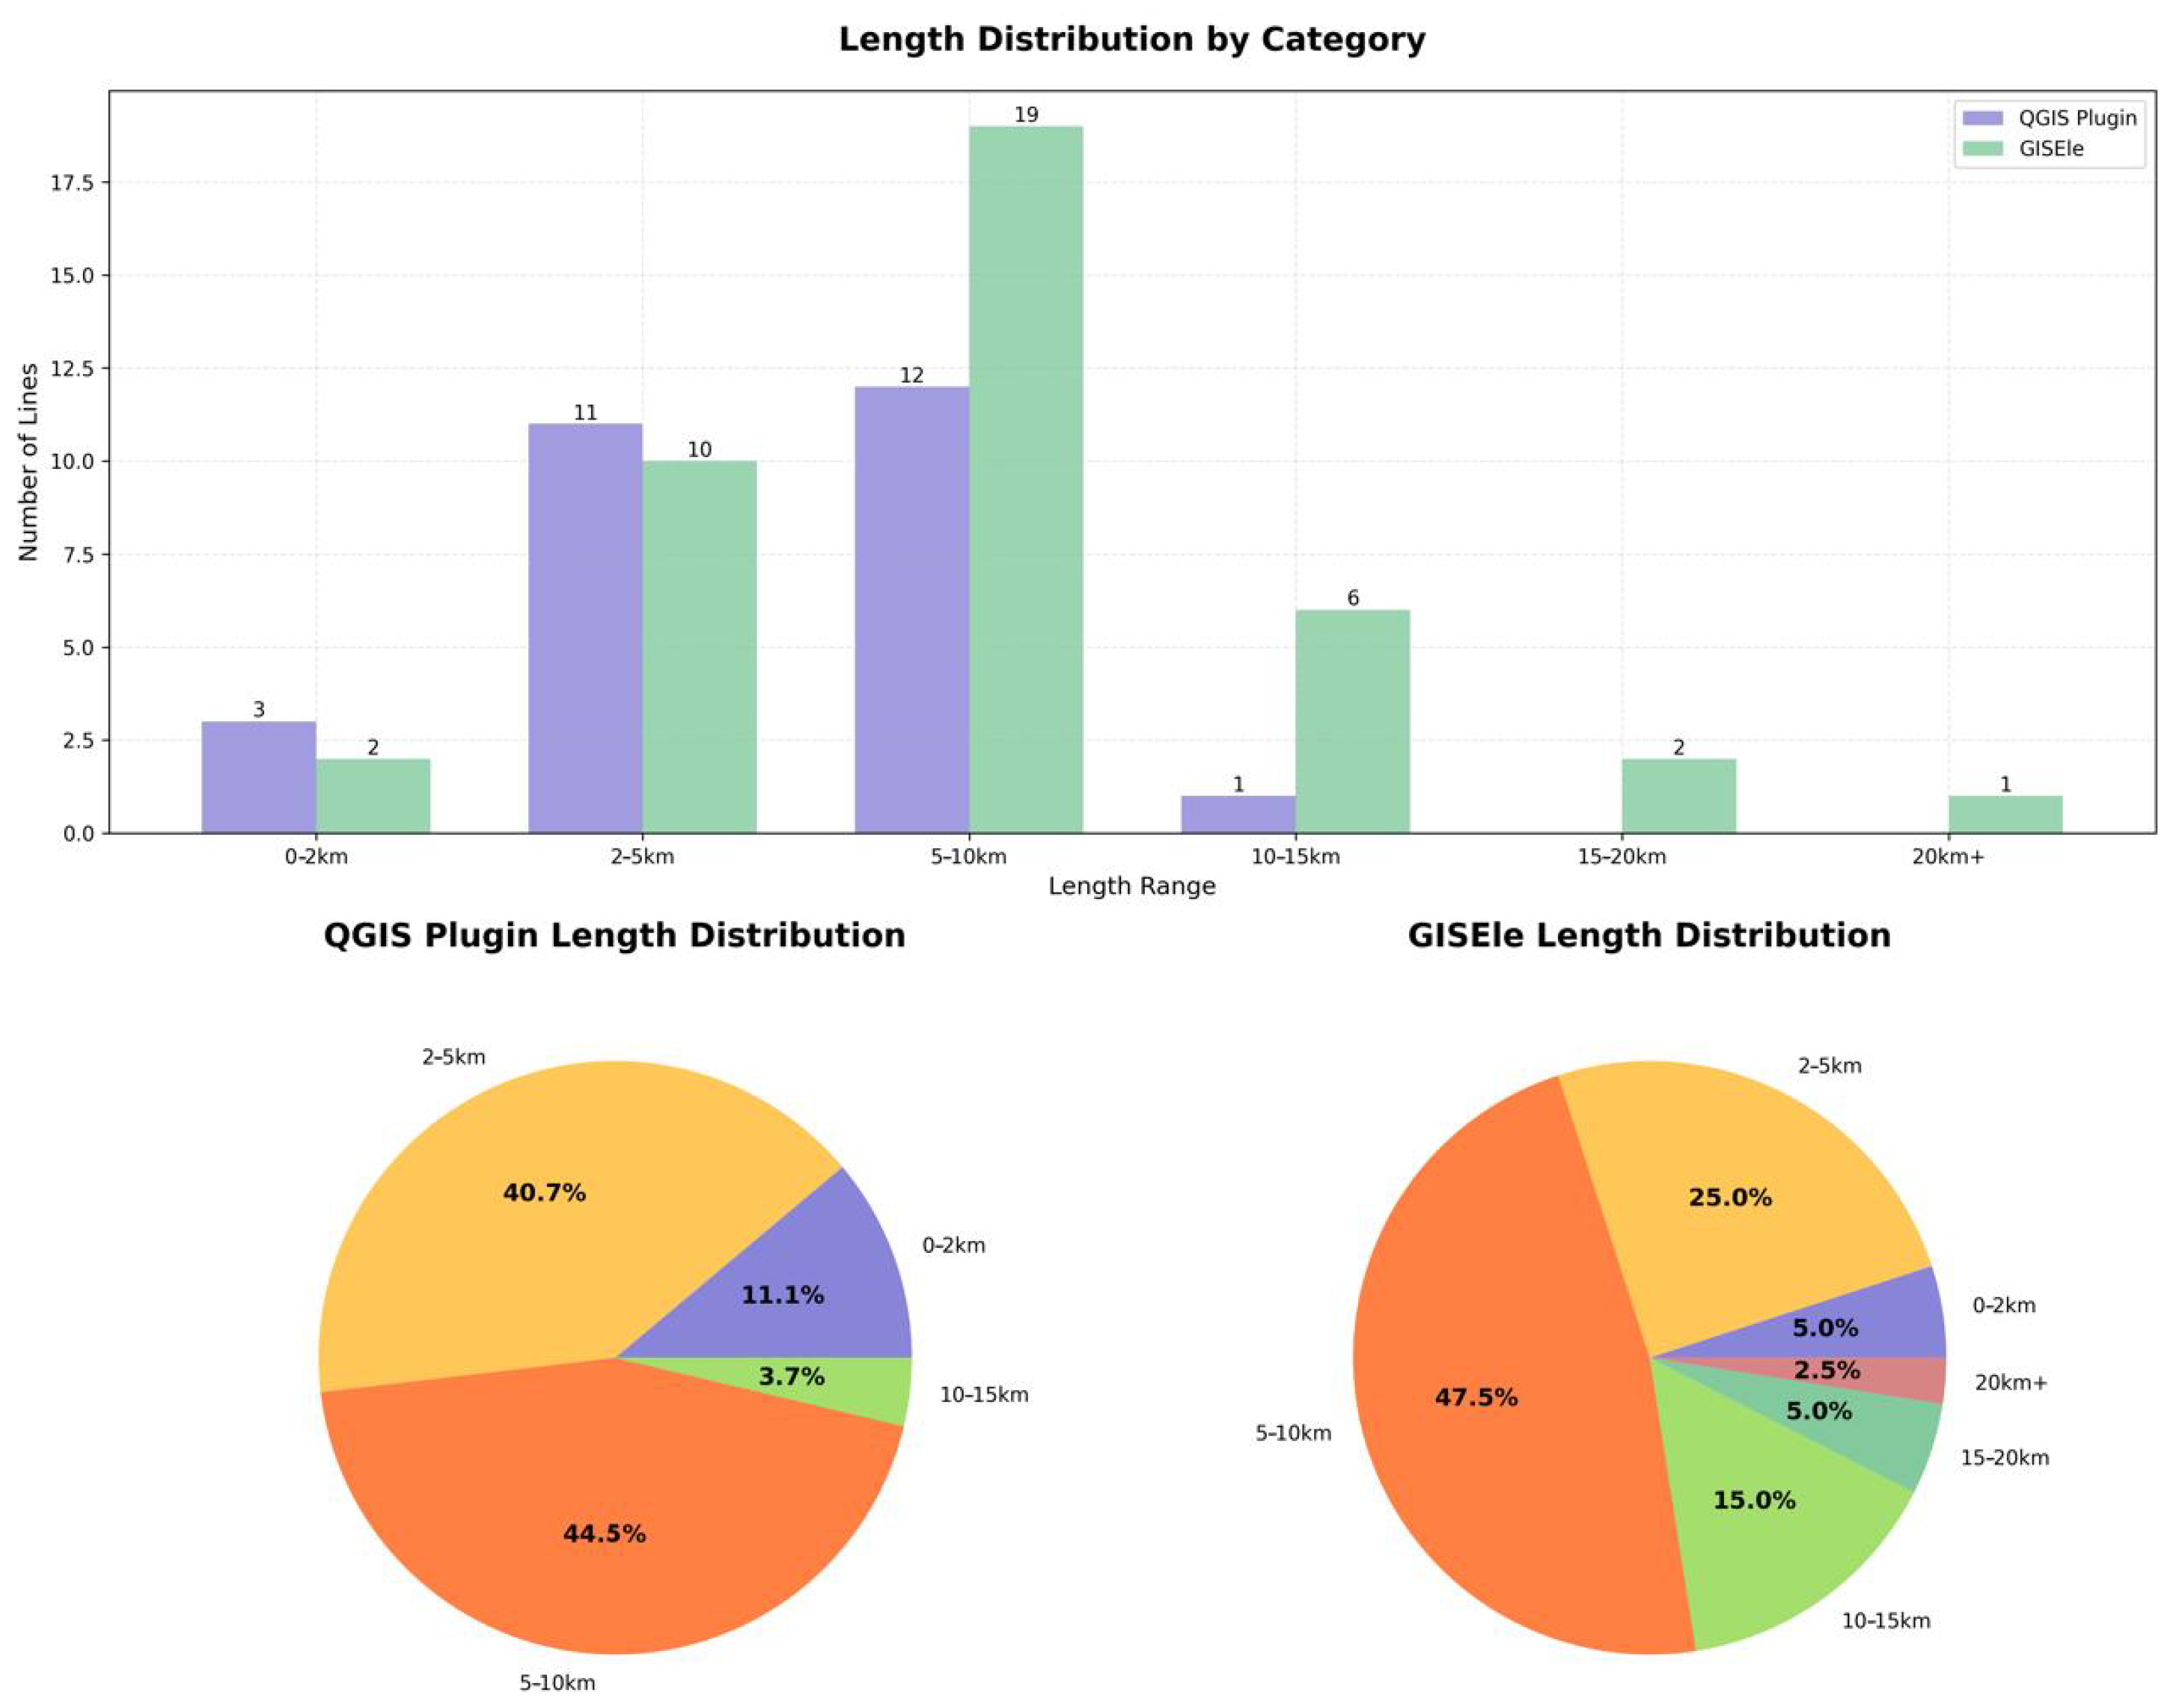
To enable meaningful comparison, a specific study area in Zambia was selected with standardized input data for both tools. The initial grid-routing solutions revealed distinct approaches to network expansion. The QGIS plugins favored shorter, more direct routes between unelectrified villages and the existing MV network, creating a distributed expansion pattern with multiple connection points. GISEle’s approach demonstrated a more centralized planning strategy, with proposed MV lines forming longer main feeders emanating from specific substation points. Two representative examples illustrated when the additional complexity of GISEle’s approach provides essential benefits versus when the presented approach’s simpler methodology suffices:
Figure 7a shows a case where both tools propose essentially the same order of village connections. The figure highlights a specific region where the comparison between GISEle’s routing (shown in red) and the plugin’s routing (shown in blue) revealed striking similarities in connection patterns. Despite GISEle’s more complex approach, which follows terrain contours and likely road networks, the plugin’s simpler direct-path approach achieved comparable results, with a total length of 48 km, versus GISEle’s 53 km. This 10% difference in total length demonstrates that in areas with relatively straightforward geography, the added computational complexity of terrain-aware routing may not significantly impact the routing solution.
On the other hand,
Figure 7b demonstrates a scenario where terrain characteristics significantly affect routing decisions. In this region, characterized by more complex topography, GISEle’s solution (red lines) follows natural corridors and road networks to avoid geographical barriers. The plugin’s approach (blue lines) proposes not only a different order of village connections but also direct paths that would be impractical to implement in the actual terrain. As a result, the plugin’s estimated extension length of 21 km substantially underestimates the required MV line length compared to GISEle’s more realistic terrain-aware solution of 30 km. This 30% underestimation highlights cases where terrain-aware routing provides critical insights into infrastructure planning.
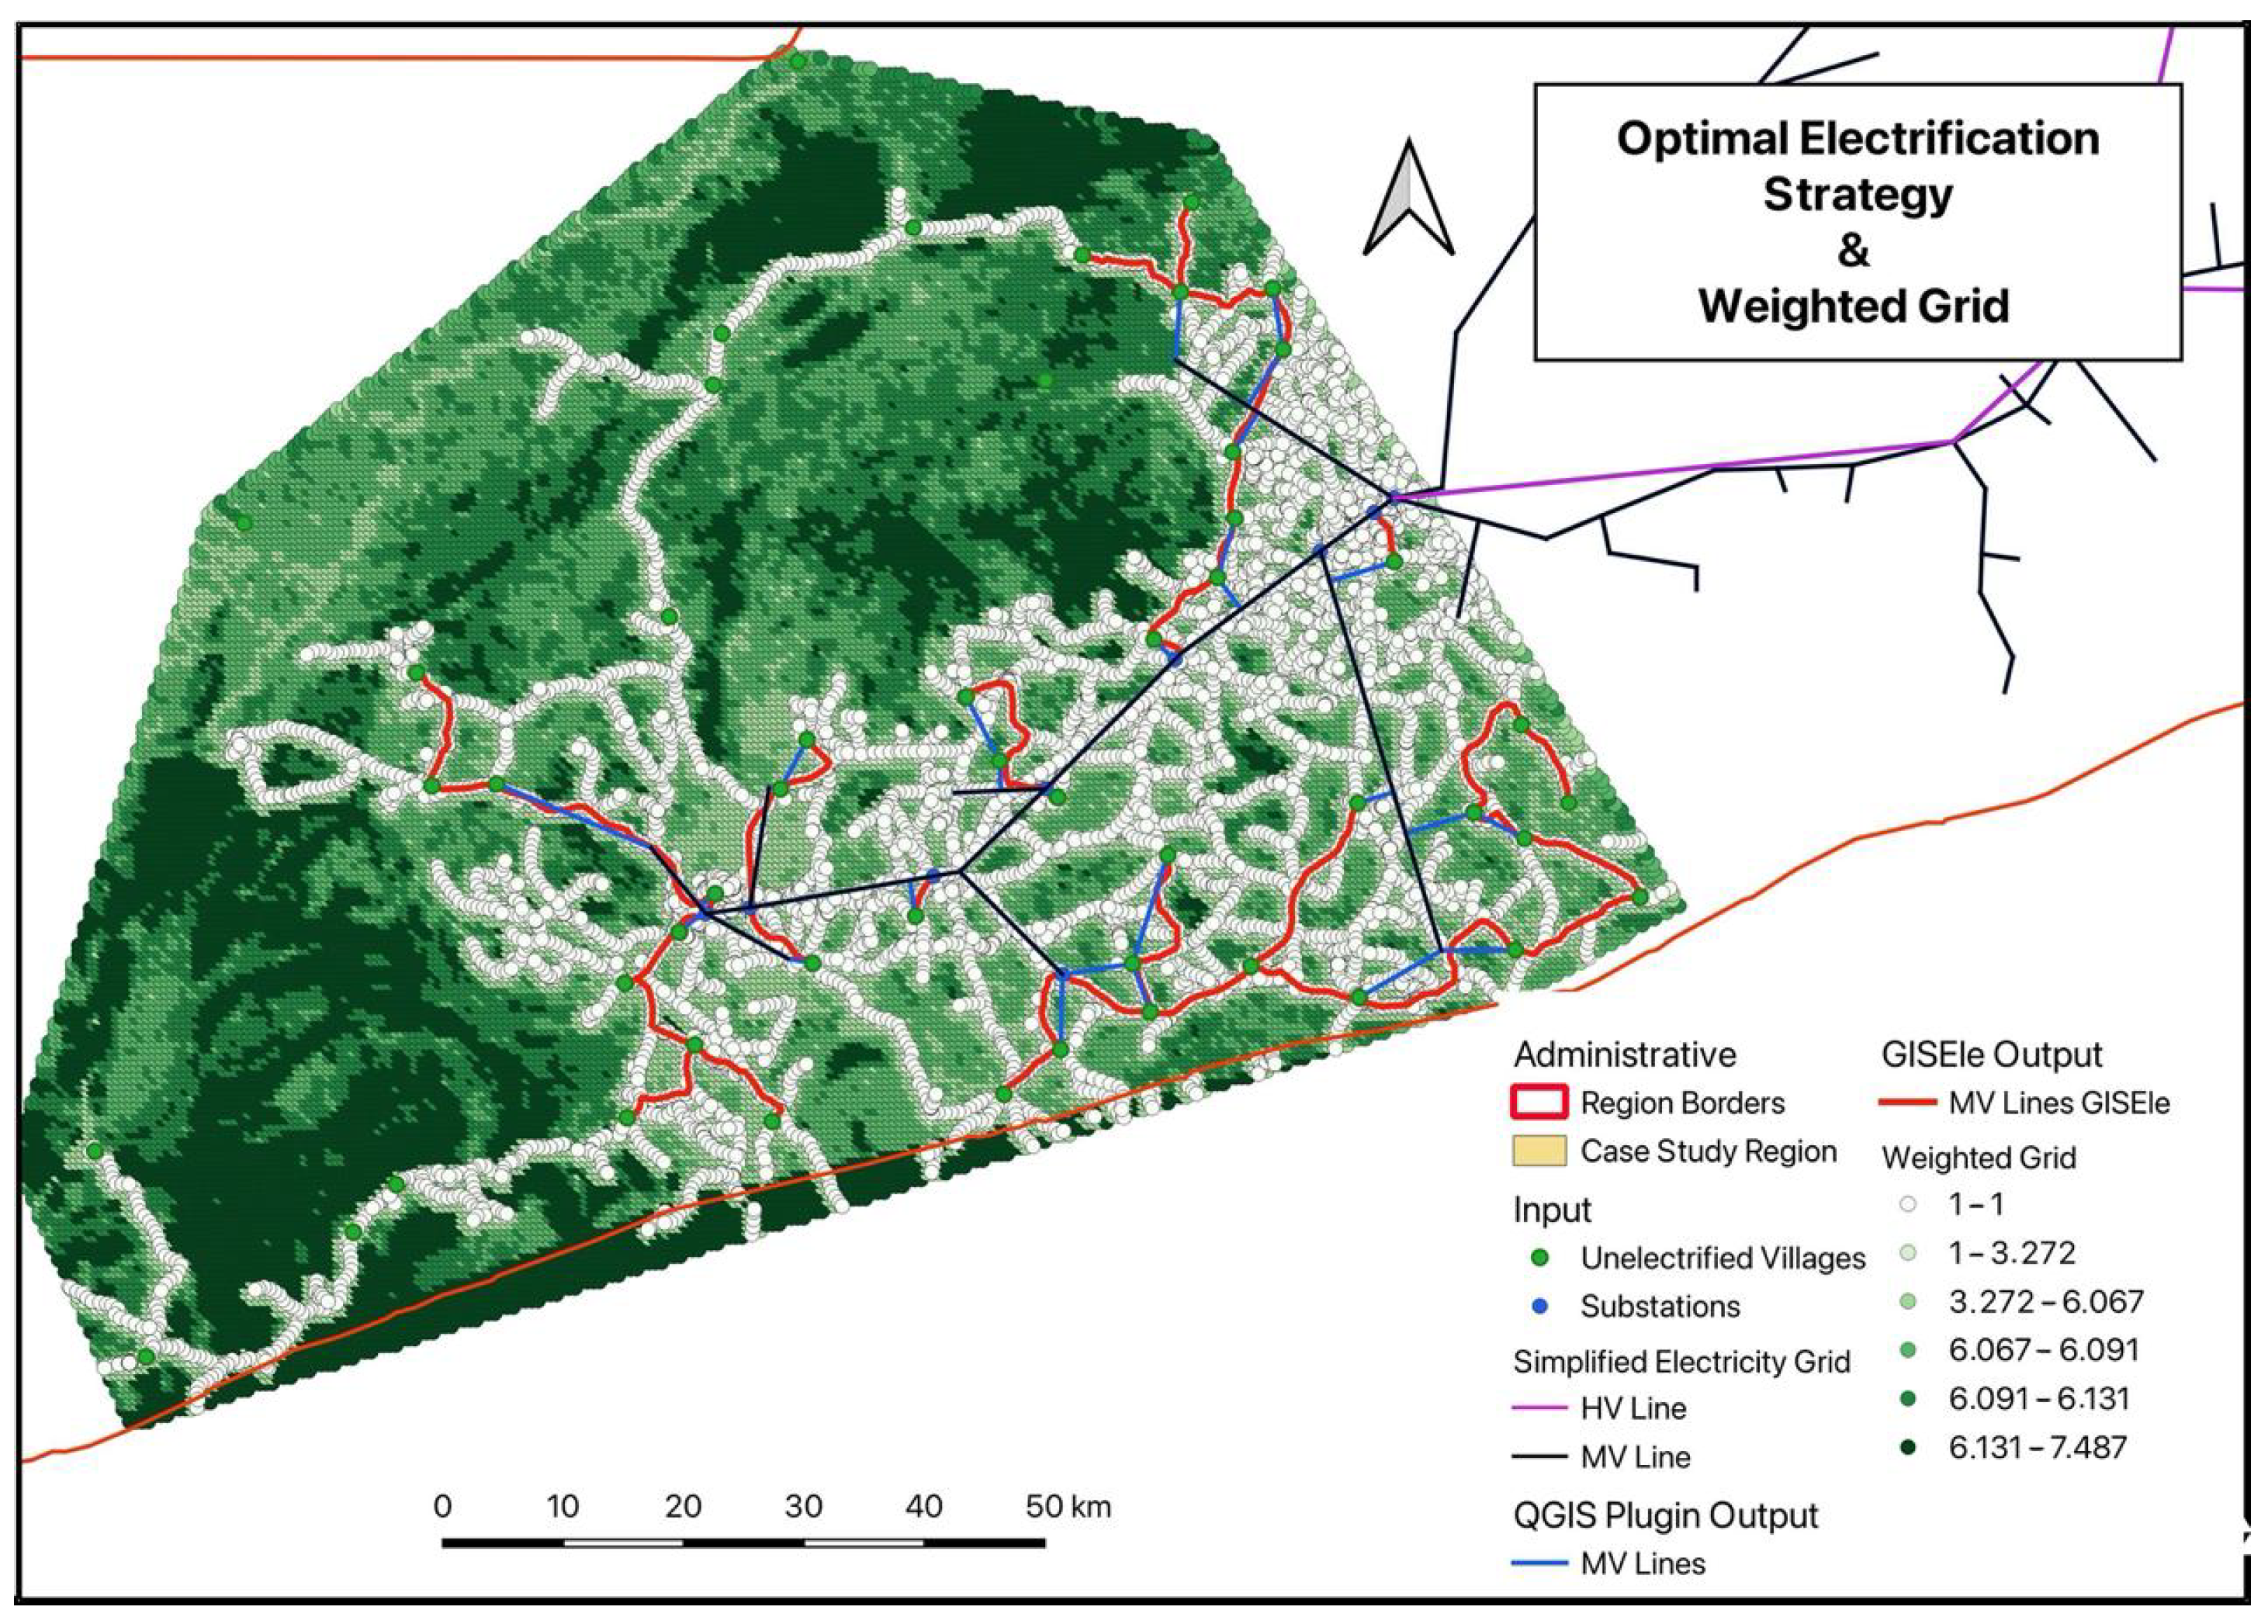
This terrain-aware routing explains the divergences between the two solutions. This is particularly noticeable in the western portion of
Figure 8, where the complex terrain clearly influences the routing decisions, leading to paths that follow more accessible corridors despite not being the shortest possible connections.
The economic assessment phase further refined the solutions of both tools, with the presented approach generally favoring a more conservative stance on grid extension decisions. This approach prefers mini-grid solutions for communities beyond a certain distance threshold, while GISEle continues to support some longer extensions that follow existing routes, as shown in
Figure 7. Numerically, this can be derived from
Table 3, which presents aggregated results for the two solutions. Comparing the simple point-to-point connection with an exact routing solution reveals a potentially significant cost underestimation as reported in
Figure 9.
This difference arises from the tools’ distinct approaches to cost methodology and mini-grid LCOE calculation. In the presented approach, the mini-grid LCOE is fixed at 0.200 USD/kWh, while GISEle calculates village-specific mini-grid LCOEs based on local conditions. GISEle’s dynamic LCOE calculation can result in higher mini-grid costs for low-density populations, potentially making the grid extension the more economical option. The analysis concludes that both tools serve complementary purposes in rural electrification planning. The Grid Routing and Cost Allocation plugin excels in rapid, country-scale assessments with reduced data requirements, while GISEle provides more detailed analysis, particularly where terrain complexity significantly impacts implementation. This comparison suggests an optimal two-stage approach, as follows: first, using the proposed plugins for initial large-scale assessment and prioritization, which is crucial in rural electrification, followed by detailed analysis with GISEle in areas where terrain complexity requires more sophisticated planning approaches.
5. Conclusions and Future Improvements
The development and validation of two QGIS plugins represent significant contributions to advancing universal electricity access by making sophisticated planning methodologies more accessible. The Buffering plugin has proven effective in processing both population and building-based data, significantly reducing data volume while preserving essential planning information. The Grid Routing and Cost Allocation plugin has introduced key advancements, including hierarchical clustering for dispersed rural settlements, flexible network connections leveraging existing infrastructure, and village-specific LCOE calculations to optimize grid extension strategies. These tools successfully automated complex planning decisions while ensuring transparency and scalability.
The analysis demonstrated the plugins’ effectiveness in processing spatial data, identifying viable electrification zones, and generating cost-optimized infrastructure plans at a national scale. The Zambia case study highlighted their capability to handle millions of data points, producing actionable electrification strategies that balance technical feasibility with economic viability. Compared to GISEle, the developed plugins prioritize computational efficiency and accessibility, making them particularly suitable for large-scale planning. While GISEle offers more terrain-aware routing sophistication, the plugins’ user-friendly interface and ability to analyze extensive geographical areas efficiently provide significant advantages in nationwide electrification planning.
Despite these strengths, limitations remain. The Grid Routing and Cost Allocation plugin does not account for voltage drop analysis or power losses, which are crucial for electrical network planning. It also simplifies terrain considerations and applies a uniform mini-grid LCOE across all regions, potentially overlooking location-specific variations. Additionally, the absence of road network integration in routing decisions may limit the practicality of implementation. While these limitations exist, they are often difficult to integrate into a scalable framework capable of handling country-level analyses. A key conclusion of this work is the need for complementarity between the compared tools, advocating for a two-stage approach that enhances the effectiveness of rural electrification planning. Future work should focus on enhancing these tools by incorporating dynamic mini-grid LCOE calculations, integrating sophisticated terrain analysis while maintaining computational efficiency, and refining the grid-routing algorithm to optimize settlement connections. Further improvements should include low-voltage network design capabilities and a line-type determination system to enhance overall planning accuracy and practicality.


 ,
, 
