Article

Multi-Timescale Nested Hydropower Station Optimization Scheduling Based on the Migrating Particle Whale Optimization Algorithm

by
Mi Zhang
1,
Guosheng Zhou
2,
Bei Liu
3,
Dajun Huang
2,
Hao Yu
2 and
Li Mo
1,*
1
Hubei Key Laboratory of Digital Valley Science and Technology, School of Civil and Hydraulic Engineering, Huazhong University of Science and Technology, Wuhan 430074, China
2
Hubei Energy Group Loushui Hydropower Co., Ltd., Enshi 445800, China
3
Changjiang Survey, Planning, Design and Research Co., Ltd., Wuhan 430010, China
*
Author to whom correspondence should be addressed.
Energies 2025, 18(7), 1780; https://doi.org/10.3390/en18071780
Submission received: 11 March 2025 / Revised: 21 March 2025 / Accepted: 21 March 2025 / Published: 2 April 2025
(This article belongs to the Section A: Sustainable Energy)

Abstract

:
Exploring efficient and stable solution methods for hydropower generation optimization models is crucial for enhancing reservoir power generation efficiency and achieving the sustainable use of water resources. However, existing studies predominantly focus on single-timescale scheduling models, failing to fully exploit multi-timescale runoff information. Additionally, commonly used solution algorithms often face challenges such as premature convergence, susceptibility to local optima, and dimensionality issues. To address these limitations, this paper proposes the Migrating Particle Whale Optimization Algorithm (MPWOA), which initializes the population using chaotic mapping, incorporates a particle swarm mechanism to enhance exploitation during the spiral predation phase, and integrates the black-winged kite migration mechanism to improve stochastic search performance. Validation on classical test functions and the Jiangpinghe River of the multi-timescale nested optimal scheduling model demonstrates that MPWOA exhibits faster convergence and stronger optimization capabilities and significantly improves power generation. The multi-timescale nested scheduling scheme derived from this algorithm effectively utilizes runoff information, offering a practical and highly efficient solution for hydropower scheduling.

1. Introduction

Hydropower plays a crucial strategic role in the development of clean energy in China and is a key component of electric power infrastructure construction [1]. With the largest total water resources in the world and abundant development potential, China still faces a relatively low utilization rate of these resources. Improving the efficient use of these resources through scientific and effective management is essential for promoting their sustainable development [2,3]. Consequently, the field of water conservancy engineering is increasingly focused on improving the power generation efficiency of hydropower stations through rational allocation and optimal scheduling [4]. In the actual optimization of hydropower station scheduling, some existing studies have incorporated coordinated scheduling with wind and solar energy to address the issue of insufficient consideration of hydropower seasonality [5]. Additionally, certain studies have considered constraints such as random inflows and ecological requirements in the short term to meet both irrigation and power generation benefits [6].
However, the actual process of optimizing hydropower scheduling must consider not only short-term runoff variations but also long-term runoff patterns, balancing short-term benefits with long-term benefits.
Most existing hydropower station scheduling models focus on single-timescale power generation optimization [7,8,9]. Long-term scheduling schemes are typically developed based on initial forecast information. However, as time progresses, these static schemes struggle to adapt dynamically to changing inflow conditions, resulting in deviations from actual conditions. Moreover, there is often a lack of effective coordination and linkage between long-term scheduling schemes and short- and medium-term plans. Runoff data characteristics and uncertainties vary significantly across different time scales, making it difficult to effectively utilize runoff variations in each period. Additionally, reservoir operation requires balancing short-term benefits with long-term objectives while considering economic efficiency and risk control, further increasing scheduling complexity. Although some studies have improved model algorithms for single-timescale scheduling, the absence of coordinated multi-timescale information integration limits the overall efficiency of hydropower operation. Hierarchical nested optimization technique [10,11,12] addresses this challenge by integrating multi-timescale optimal scheduling, designing layered models compatible with runoff patterns, and iteratively nesting the models across different levels. This approach effectively mitigates the issues of strong independence and poor coordination between long-term and short-term scheduling. Nevertheless, developing efficient solution algorithms for multi-timescale nested optimization remains a critical scientific problem that urgently needs to be addressed.
At present, the primary methods for solving the hydropower station scheduling problem include traditional optimization methods, such as dynamic programming [13], and swarm intelligence optimization algorithms, such as the particle swarm optimization algorithm [14,15]. Swarm intelligence algorithms have gained widespread application due to their simplicity, lack of gradient information requirements, and ease of implementation, which compensate for the low solution accuracy and “dimensional disaster” challenges of traditional optimization algorithms.
The Whale Optimization Algorithm (WOA) is a new type of intelligent optimization algorithm based on the feeding behavior of whales, proposed by Mirjalili [16] et al. It has the advantages of few parameters, simple principles, and strong searching ability. Studies have applied WOA to various problems in the optimal scheduling of hydropower plants. For example, Qiang Huet [17] et al. introduced chaotic mapping and Levy flight strategy to optimize the hyper-parameters of a neural network, improving the data characteristics of reservoir scheduling. Kun Yanget [18] et al. applied WOA to the short-term scheduling of the Three Gorges hydropower plant by improving WOA through binary coding. Wen-chuan Wang [19] et al. used WOA to optimize variational model decomposition, improving runoff prediction accuracy. However, although WOA shows obvious advantages in solving complex optimization problems, its application in multi-timescale nested optimal scheduling models is still less studied. In addition, the original algorithm still faces shortcomings such as easy-to-fall-into local optimum and slow convergence speed in practice, which need to be further improved.
To address these issues, this paper proposes an improved algorithm, the Migrating Particle Whale Optimization Algorithm (MPWOA). The algorithm enhances population diversity using cubic chaos mapping, incorporates the migration mechanism of the black-winged kite algorithm [20], and integrates the update mechanism of the particle swarm optimization algorithm [21]. These improvement strategies significantly boost the optimization efficiency and exploitation capabilities of the original WOA. To evaluate its applicability and superiority, the MPWOA is applied to the power generation scheduling problem of the Jiangpinghe River hydropower station, with a focus on its performance in multi-timescale nested optimization. This study aims to explore new approaches for the optimal utilization of water resources and provide theoretical and practical support for hydropower station scheduling management.

2. Multi-Timescale Nested Reservoir Optimization Scheduling

In the study of scheduling at different time scales for hydropower plants, the key lies in understanding the intrinsic connection between scheduling models at different time scales and exploring how to effectively nest them [22]. In this paper, the nested connection between the multi-timescale nested optimal scheduling models mainly lies in the fact that the upper long-term scheduling model provides constraint boundaries for the lower short-term scheduling model. Specifically, these constraints are represented by the operating results of water levels at the end of each scheduling period in the upper plan, which serve as boundary conditions for the formulation of the lower scheduling plan. This ensures that the short-term scheduling operates within the framework of the long-term scheduling plan.
In this paper, a multi-timescale optimal scheduling model based on the maximum optimization criterion of power generation is established. The model is divided into upper and lower layers, with the upper layer model taking the year as the scheduling cycle and ten days as the scheduling period, while the lower layer model takes the ten days as the scheduling cycle and the day as the scheduling period. To effectively establish a nested coupling mechanism between scheduling models across different time scales, a top-down recursive control strategy can be employed. Specifically, the long-term runoff process is first input into the upper-level optimization model to generate its scheduling plan. The end water level of each scheduling period in the upper-level model is then used as the target end water level for the lower-level model in the corresponding period. This step-by-step recursive process ensures that the upper-level model imposes control constraints on the lower-level model’s end water levels, thereby achieving seamless coordination and coupling between scheduling models at different time scales.

2.1. Objective Function

E u p = m a x t 1 = 1 T 1 A Q t 1 H t 1 Δ t 1
E d o w n = m a x t 2 = 1 T 2 A Q t 2 H t 2 Δ t 2
where E u p , E d o w n are the power generation of the upper and lower models; A is the coefficient of hydropower plant output; T 1 , T 2 are the total number of time periods in the scheduling cycle of the upper and lower models; Q t 1 , Q t 2 are the power generation flows of the upper and lower models in time periods t 1 , t 2 , respectively; H t 1 , H t 2 are the water heads of the upper and lower models in time periods Δ t 1 , Δ t 2 .

2.2. Constraints

(1)
Water balance constraints
V t = V t 1 + ( I t Q t ) Δ t
where V t and V t 1 represent the reservoir storage at the end of periods t and t 1 , respectively. I t denotes the average inflow to the reservoir during period t , and Q t represents the average outflow from the reservoir during period t .
(2)
Water level constraints
Z t m i n Z t Z t m a x
where Z t m i n and Z t m a x represent the minimum and maximum water level constraints of the reservoir during period t , respectively.
(3)
Flow constraints
Q t m i n Q t Q t m a x
where Q t m i n and Q t m i n represent the minimum and maximum outflow constraints of the reservoir during period t , respectively.
(4)
Output constraints
N t m i n N t N t m a x
where N t m i n and N t m a x represent the minimum and maximum power output constraints of the power station during period t , respectively.
(5)
Water level variation constraints
Z t Z t 1 Z
where Z is the maximum variation constraint of the water level in the adjacent time period.
(6)
Initial and final water level constraint
Z 0 d o w n = Z t 1 , 0 u p Z T 2 d o w n = Z t 1 , 1 u p
where Z 0 d o w n and Z T 2 d o w n represent the initial and final water levels of the reservoir in the lower-level scheduling model during the scheduling period, respectively. Similarly, Z t 1 , 0 u p and Z t 1 , 1 u p represent the initial and final water levels of the upper-level scheduling model during the t 1 scheduling period. Here, one scheduling cycle T 2 of the lower-level model corresponds to one scheduling period t 1 of the upper-level model.

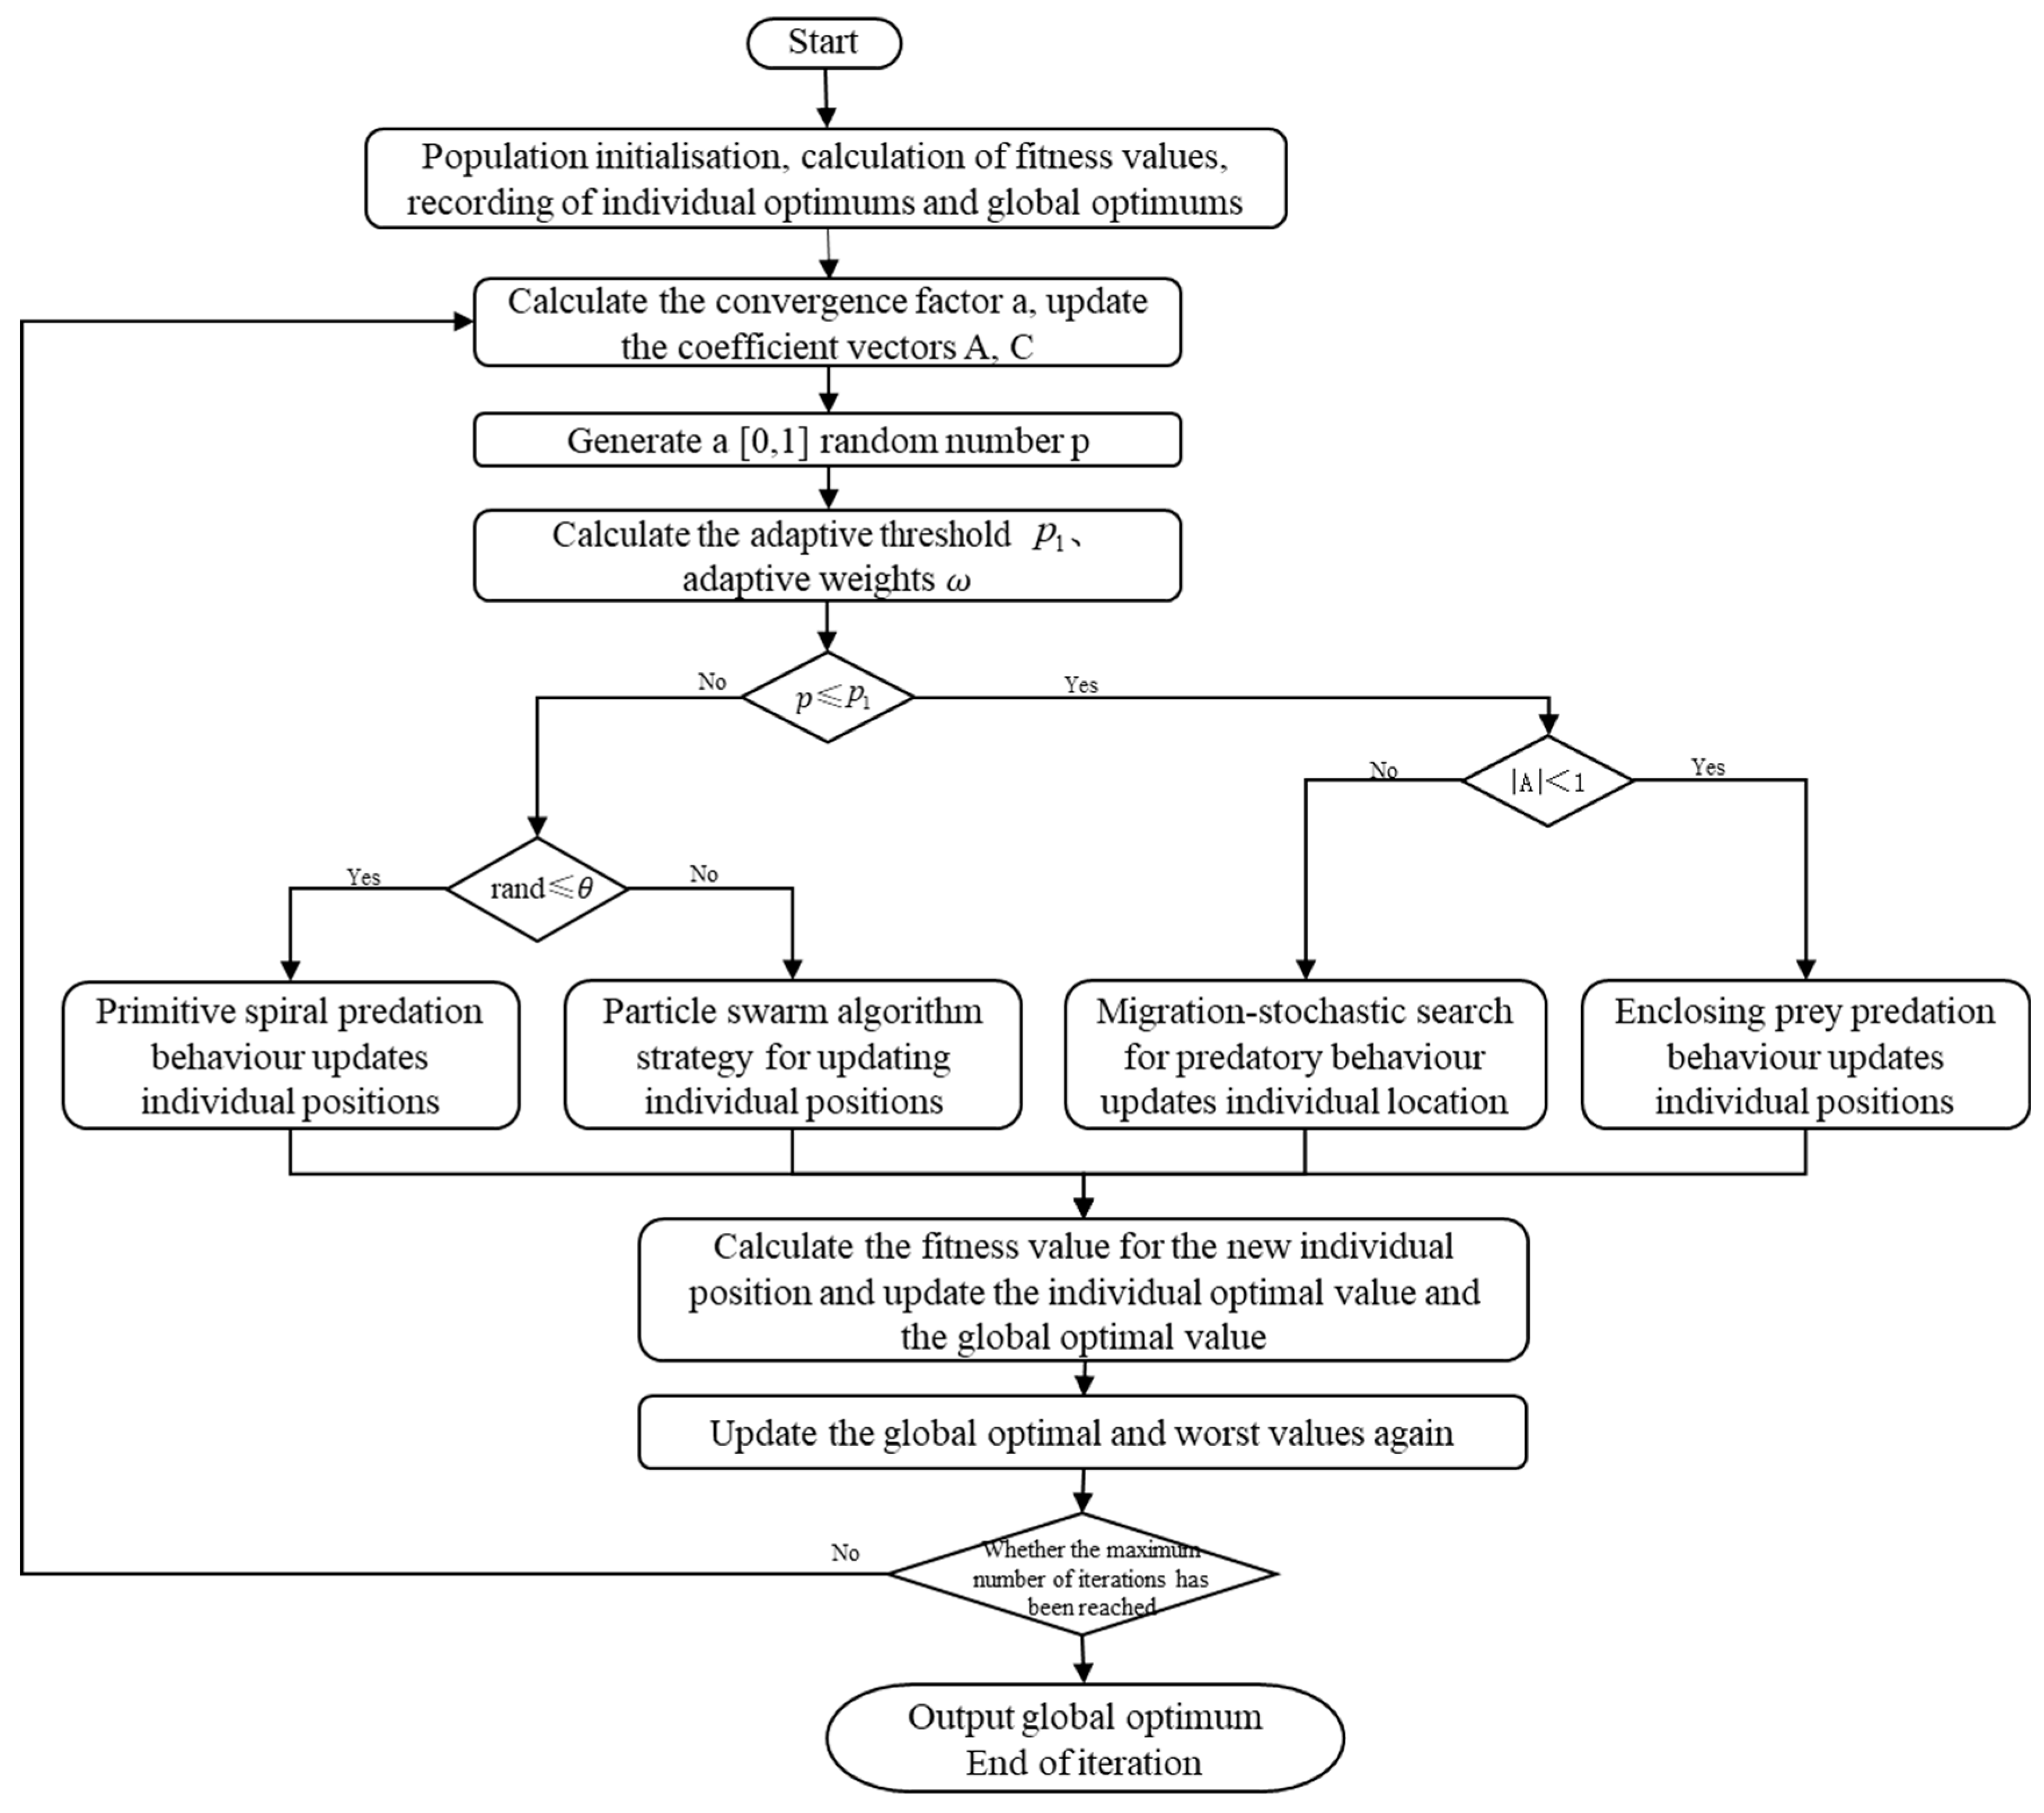
3. Improved Whale Optimization Algorithm

The Whale Optimization Algorithm (WOA) is a mathematical model inspired by the foraging behavior of whales. In the WOA, all whale positions represent feasible solutions to the problem. The algorithm begins with a set of random solutions, and in each iteration, the position of each individual is updated based on either a randomly selected individual or the best solution obtained so far, with the position of the best individual representing the optimal solution of the model. The WOA consists of three main phases: encircling prey, spiral bubble hunting attack, and random search for prey. Although the WOA offers advantages such as fewer parameters and a simple model structure, it suffers from drawbacks including a tendency to fall into local optima and insufficient search capability. To address these issues in the original algorithm, this paper proposes an improved Whale Optimization Algorithm—Migration Particle Whale Optimization Algorithm (MPWOA). The population is initialized using chaotic mapping to improve diversity. In the spiral predation phase, a particle swarm mechanism is introduced. This allows individual particles to interact with the global best solution, improving the local search capability. Additionally, the Black Kite migration mechanism is used to guide individuals when the population stagnates or lacks diversity. This enhances the global search ability and increases the chances of escaping local optima. The specific steps are as follows:

3.1. Chaotic Mapping Initialization

The characteristics of chaotic mapping are randomness, sensitivity, and a blend of determinism, which helps increase the global search performance of the algorithm. In this paper, cubic chaotic mapping is used to initialize the population, which makes the positions of the initialized population more uniform and representative. This avoids the issue of high similarity among individuals generated by the original algorithm. The cubic chaotic mapping first generates chaotic sequences according to the following equation:
C C u b i c = c 0 · r a n d · 1 r a n d 2
where r a n d is a random number in the range (0, 1), and the parameter c 0 = 2.595 is chosen based on empirical experience. The cubic chaotic mapping exhibits good traversal properties within the interval (0, 1). The chaotic sequence is then mapped to the decision variable space of the optimization problem. The specific steps are as follows:
(1)
According to Equation (9), N individuals are generated, each with D dimensions, yielding the chaotic sequence values as follows:
C = C 11 C 12 . . . C 1 D C 21 C 22 . . . C 2 D . . . . . . C i j . . . C N 1 C N 2 . . . C N D
where C i j represents the value of the j -th dimension of the i -th chaotic individual.
(2)
In accordance with Equation (11)
x i j = a i j + C i j × ( b i j a i j )
The generated chaotic sequence values are mapped to the value space of decision variables to obtain the initial population. Where a i j and b i j represent the lower and upper bounds of the value space, respectively, and x i j is the decision variable value in the j -th dimension of the i -th individual.

3.2. Encircling Prey Process

In the initial stage, the WOA algorithm assumes that the position of the current best candidate solution is the location of the target prey. After the target prey position is defined, other whales attempt to encircle the target prey. The behavior of encircling the prey is expressed mathematically as follows:
X m + 1 = X * m A × D L
D L = C × X * m X m
A = 2 × a × r a
C = 2 × r
where m represents the current iteration number, A and C are coefficients, X is the current solution’s position, X * is the position of the current best solution, r is a random vector in the range (0, 1), and a  is the convergence factor, which decreases linearly from 2 to 0 during the iteration process, as shown in Equation (16):
a = 2 2 m M a x i t e r
where M a x i t e r represents the maximum number of iterations.

3.3. Particle-Spiral Bubble Hunting Process

In the spiral hunting process, whales gradually approach the prey by ascending in a spiral manner and capture it by continually shrinking the encircling loop. During this phase, in order to simultaneously simulate the whale’s shrinking encirclement mechanism and the spiral updating mechanism, the hunting strategy is selected by comparing the randomly generated p-value with the probability critical value of 50%. However, as the number of iterations increases, this equal-probability hunting approach can cause the algorithm to fall into local optima. To address this issue, this paper proposes an adaptive probability critical value p 1 to balance the local and global search ability of the algorithm with the following expression:
p 1 = 1 l o g 10 1 + m M a x i t e r
X m + 1 = X * m A × D L , p < p 1 X * m + D * × e b l × cos 2 π l , p p 1
where D * = X * m X m represents the distance between the current individual and the best individual, where b is a constant for defining the logarithmic spiral shape, l is a random number in the range of (−1, 1), and p is a random number in the range of (0, 1).
In addition, when updating individuals through the spiral update mechanism, the original spiral update mechanism is improved by taking advantage of the particle swarm algorithm’s fast convergence and simple computation, and the spiral update and particle swarm update are selected according to a certain probability θ . The improved update mechanism is as follows:
The updating formula for the velocity as well as the position of the particle is as follows:
X m + 1 = X m + V m + 1 , r a n d θ X * m + D * × e b l × cos 2 π l , r a n d < θ
V m + 1 = ω   V m + c 1 r 1 X * ( m ) X m + c 2 r 2 X G ( m ) X m
where V m + 1 denotes the current particle velocity; r a n d is a random number between [0, 1]; ω , c 1 , c 2  are constants, r 1 , r 2 are uniformly distributed random numbers in (0,1); θ  represents the particle hopping probability; and X G ( m ) represents the global optimal position in the whole population.

3.4. Migration-Random Search

The Black-winged Kite Optimization Algorithm [20] is an optimization algorithm inspired by the migration and hunting behavior of the black-winged kite. Each black-winged kite represents a feasible solution, and its main update mechanisms include the attack behavior and the migration behavior. The attack behavior mechanism is used for global search, while the migration strategy dynamically selects the best solutions to ensure successful migration. Based on the migration principles of the black-winged kite, this paper improves the random search phase of the original Whale Optimization Algorithm by incorporating part of the migration behavior mechanism into the whale update mechanism, thereby enhancing the local search ability of the original Whale Optimization Algorithm. The mathematical expression is as follows:
X m + 1 = X r a n d A × D r a n d + C 0 , 1 × X m X * m
where D r a n d = C × X r a n d m X m , is the distance between the current individual and a random individual, X r a n d is a randomly selected whale individual, and C 0 , 1 represents a random number obeying the Cauchy distribution.
After incorporating the above improvement strategy, the implementation flowchart of the MPWOA algorithm is shown in Figure 1:

4. Discussion

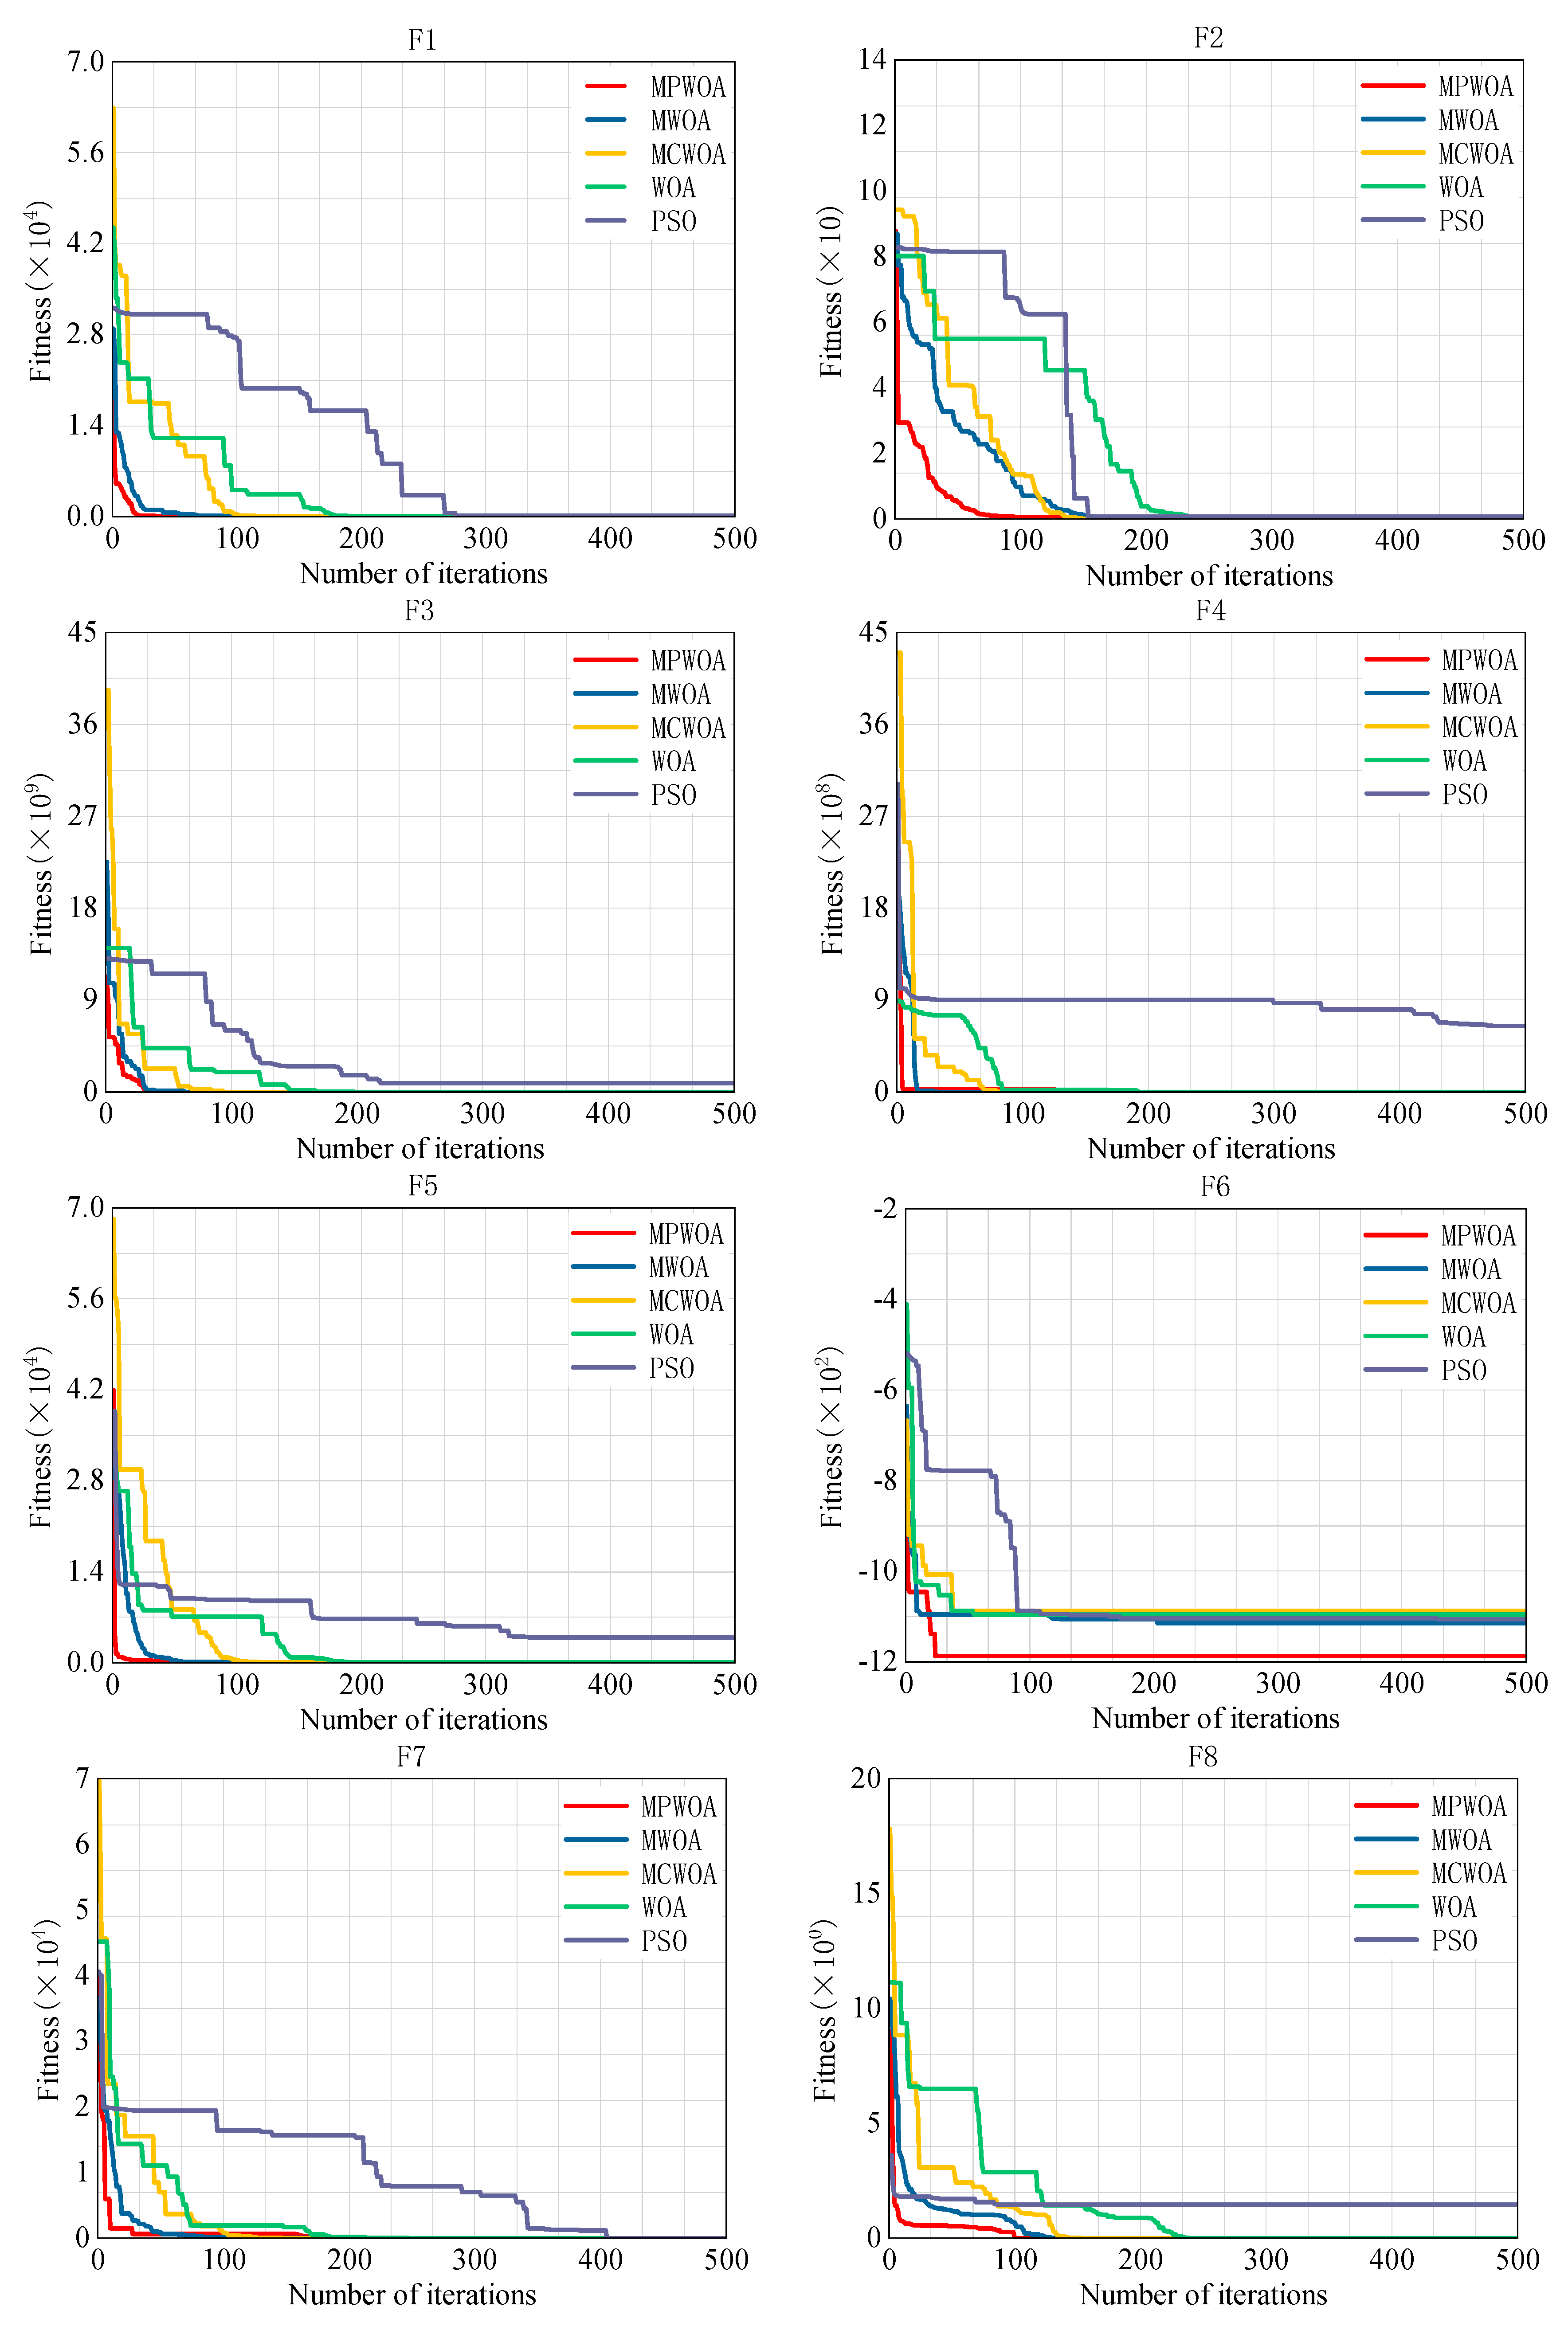
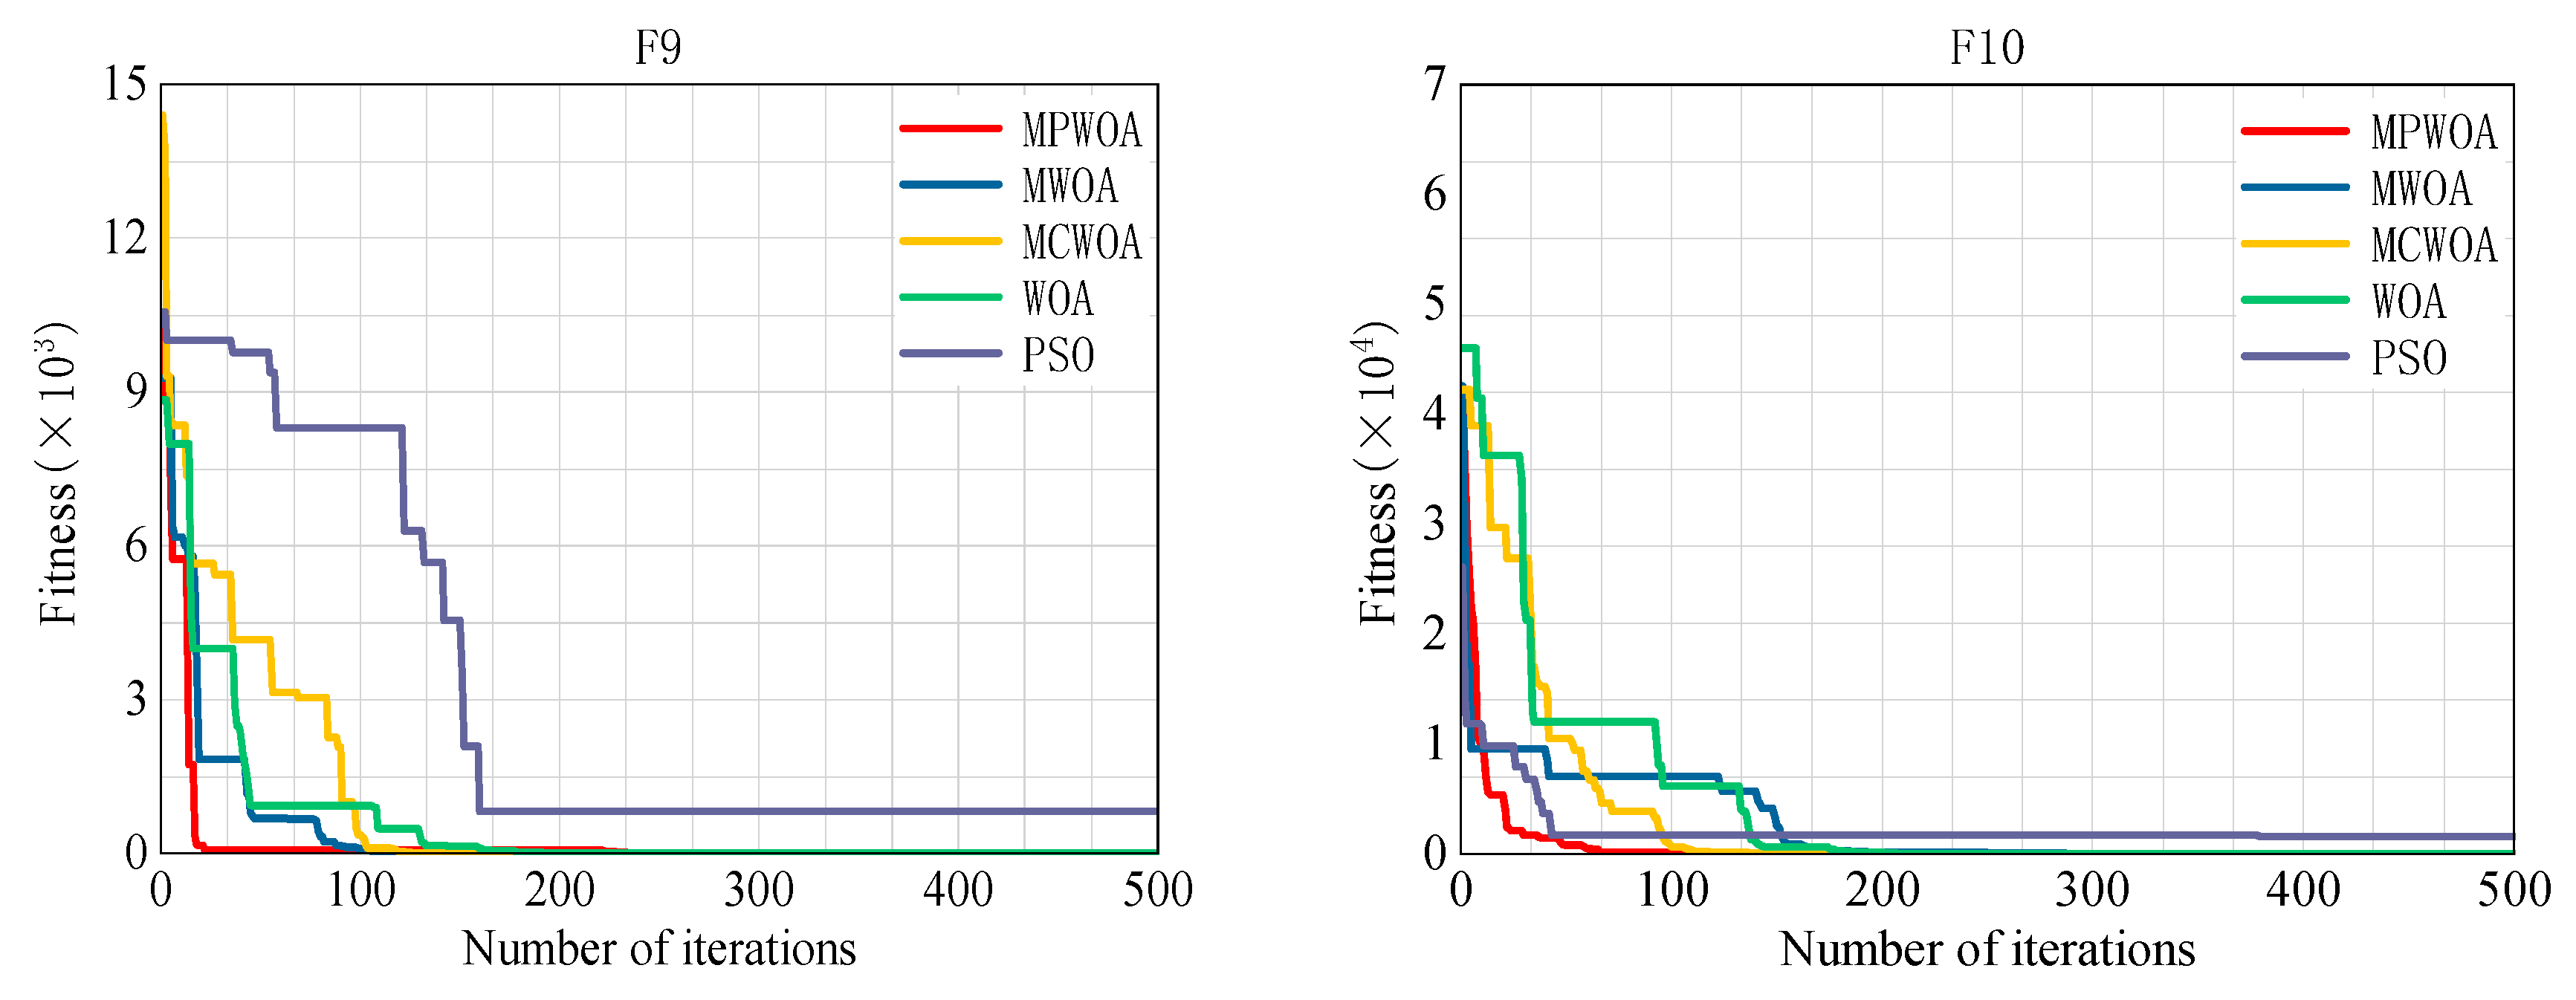
4.1. Test Function Verification of the MPWOA Algorithm
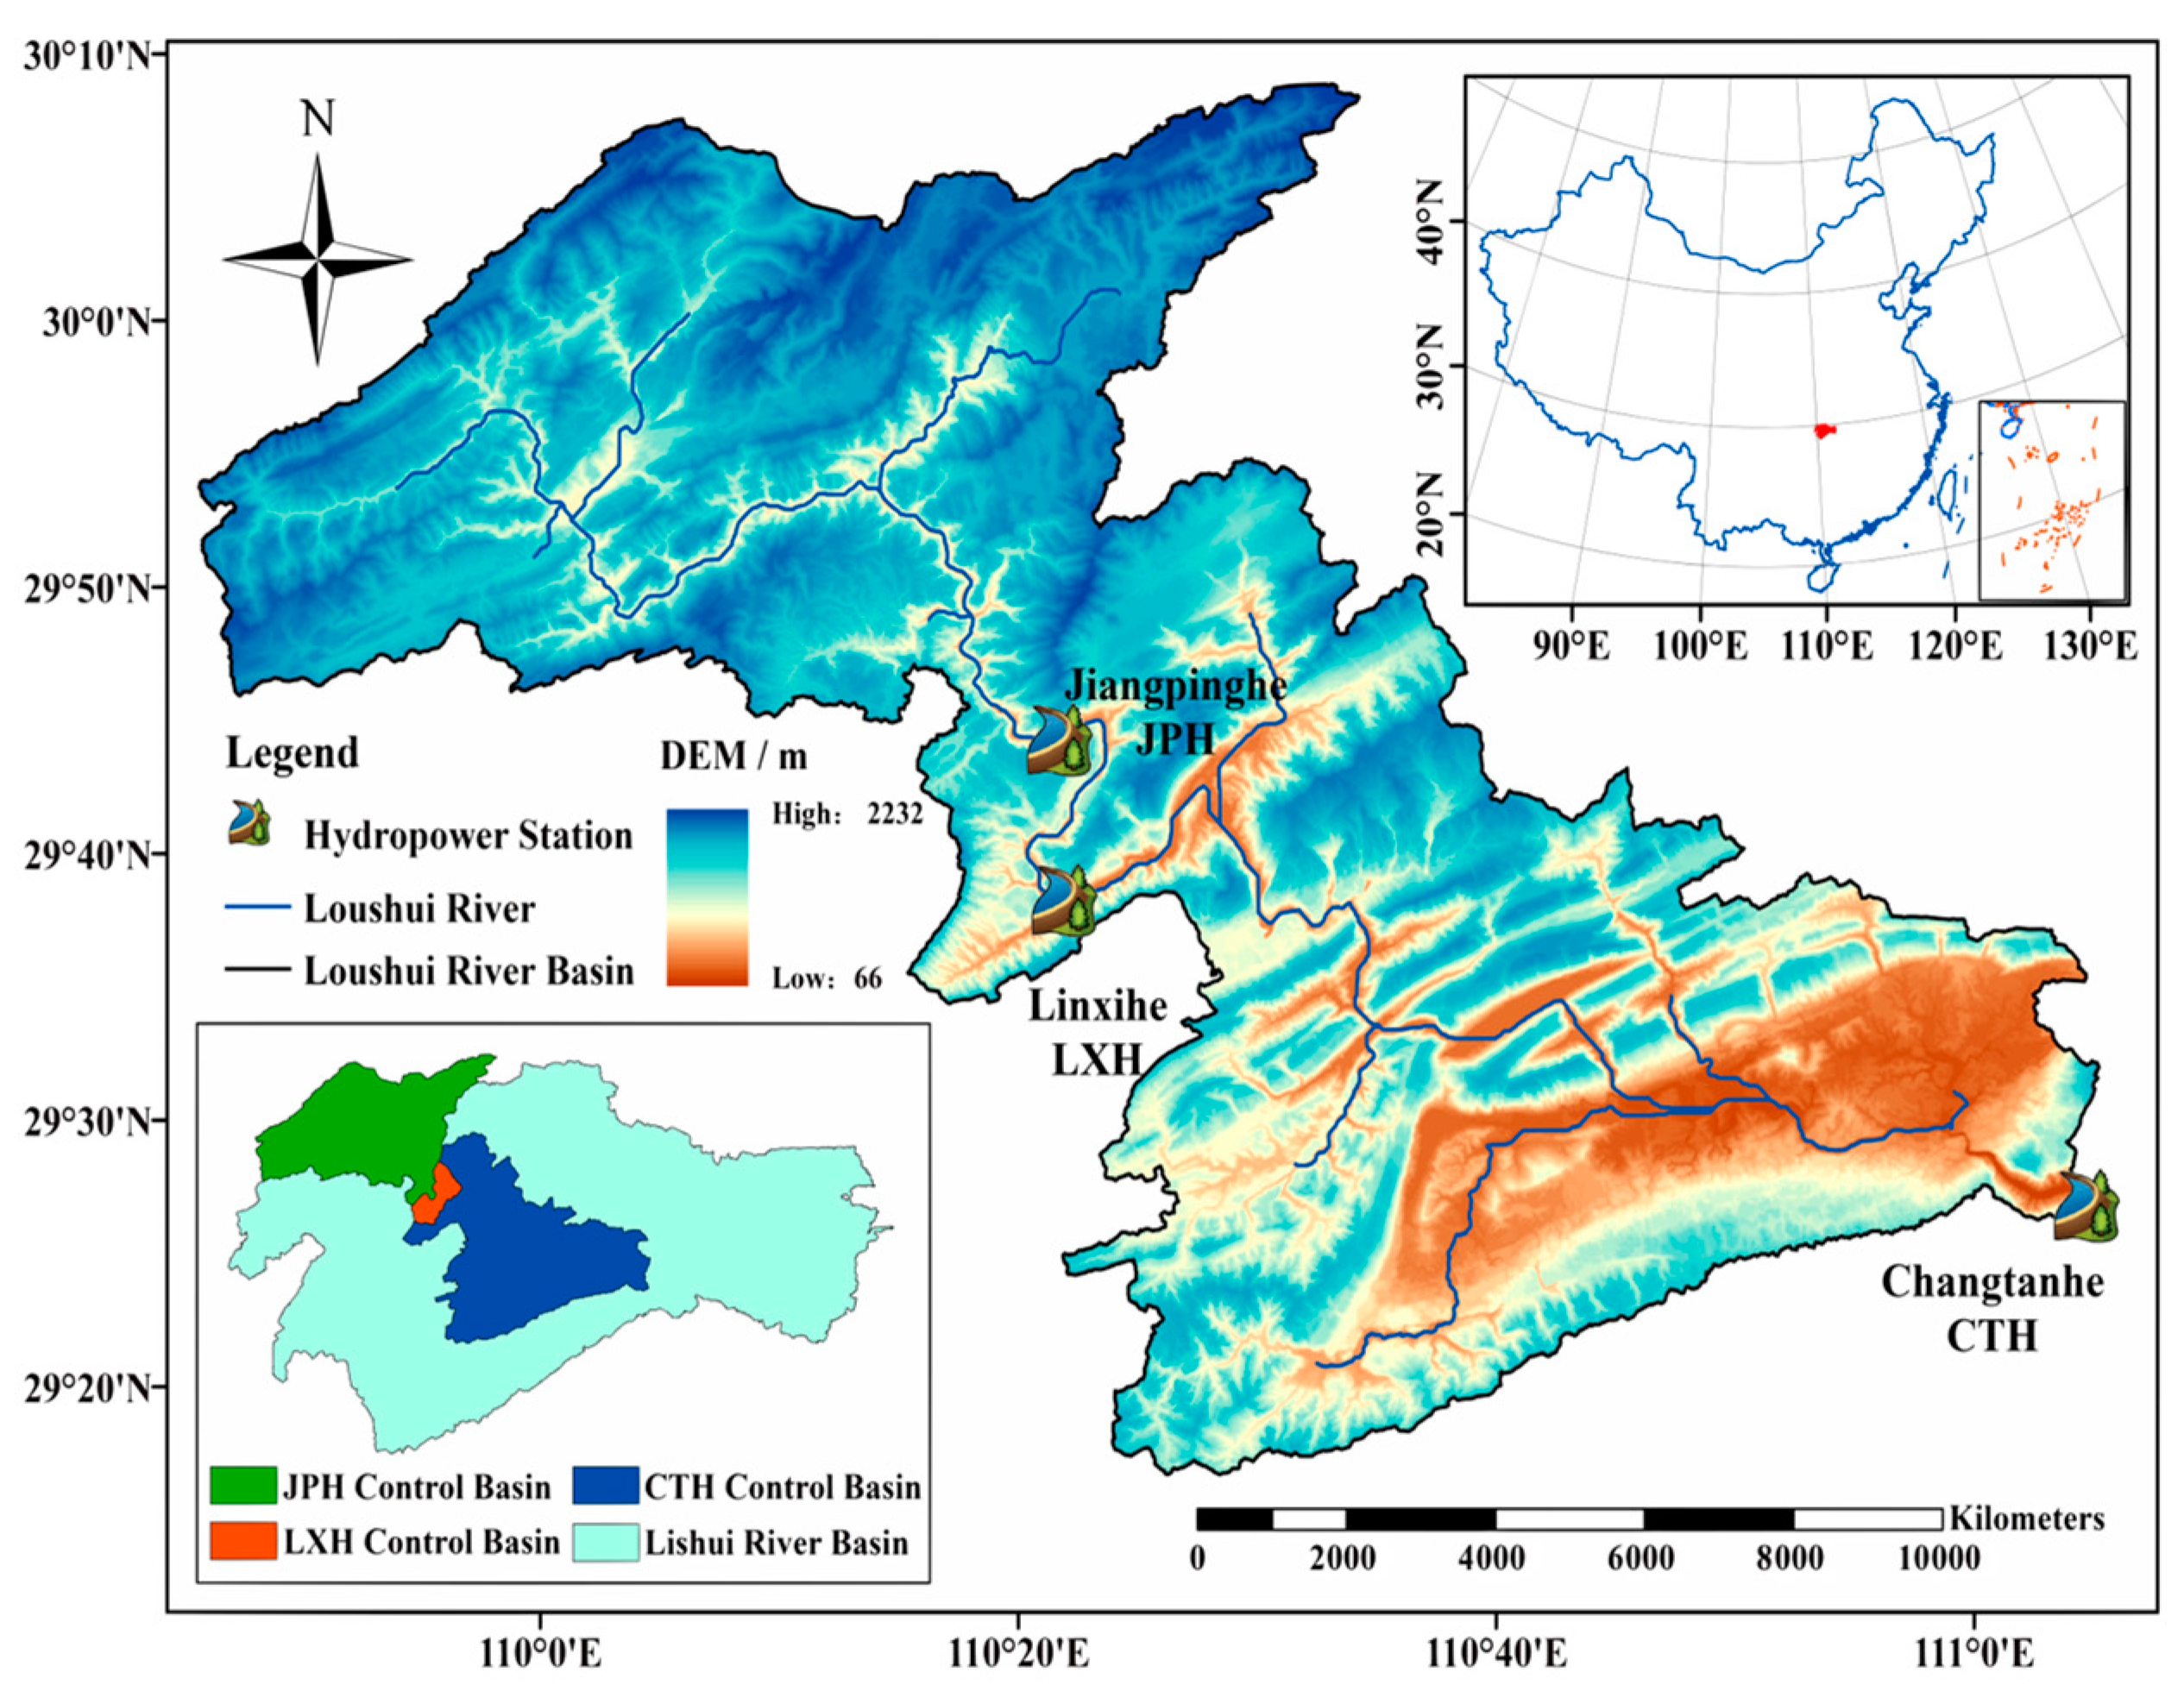
As shown in Table 1, 10 groups of commonly used test functions are selected for algorithm performance validation, including five groups of unimodal functions and five groups of multimodal functions. The calculation results of the five algorithms—Migrating Particle Whale Optimization Algorithm (MPWOA), Migrating Whale Optimization Algorithm (MWOA), Migrating Chaotic Whale Optimization Algorithm (MCWOA), Standard Whale Optimization Algorithm (WOA), and Standard Particle Swarm Algorithm (PSO)—are compared. In order to ensure the reasonableness of the experiment, the following parameters are uniformly set: the dimension size D = 20 , the number of populations N p o p = 30 , the number of iterations M a x i t e r = 500 , and 50 independent repeats of the run. The algorithm parameters were set as follows: b = 1 , θ = 0.7 , c 1 = 1.5 , c 2 = 2 , w = 0.7 .
Through the comparison of the test function results in Table 2 and Figure 2 above, it can be seen that among the 10 groups of test functions, the MPWOA algorithm demonstrates higher solution accuracy and faster convergence speed. Its ability to find an optimal solution is significantly better than the other four comparative algorithms, which indicates that the improvements made to this algorithm are reasonable and effective in terms of the test function.
However, the test results of the test function can only show the superiority of the algorithm to a certain extent. Further analysis and validation are required when applying it to specific engineering problems.

4.2. Case Overview

The Jiangpinghe River Hydropower Station is located on the upper reaches of the Loushui River, as shown in Figure 3. The dam site controls a catchment area of 2140 km2, accounting for 42.4% of the total Loushui River basin. The river length above the dam site is approximately 110 km, with an average channel slope of 11.8‰. The normal water level is 470.00 m, and the dead water level is 427.00 m. The station has an installed capacity of 450 MW and a total reservoir storage capacity of 1.366 billion m3. Below the normal water level, the reservoir capacity is 1.256 billion m3, the dead storage capacity is 578 million m3, and the regulation capacity is 678 million m3. The storage coefficient is 0.27, and the reservoir has multi-year regulation capabilities. Its operational focus is primarily on power generation, with flood control as a secondary objective.

4.3. Case Study

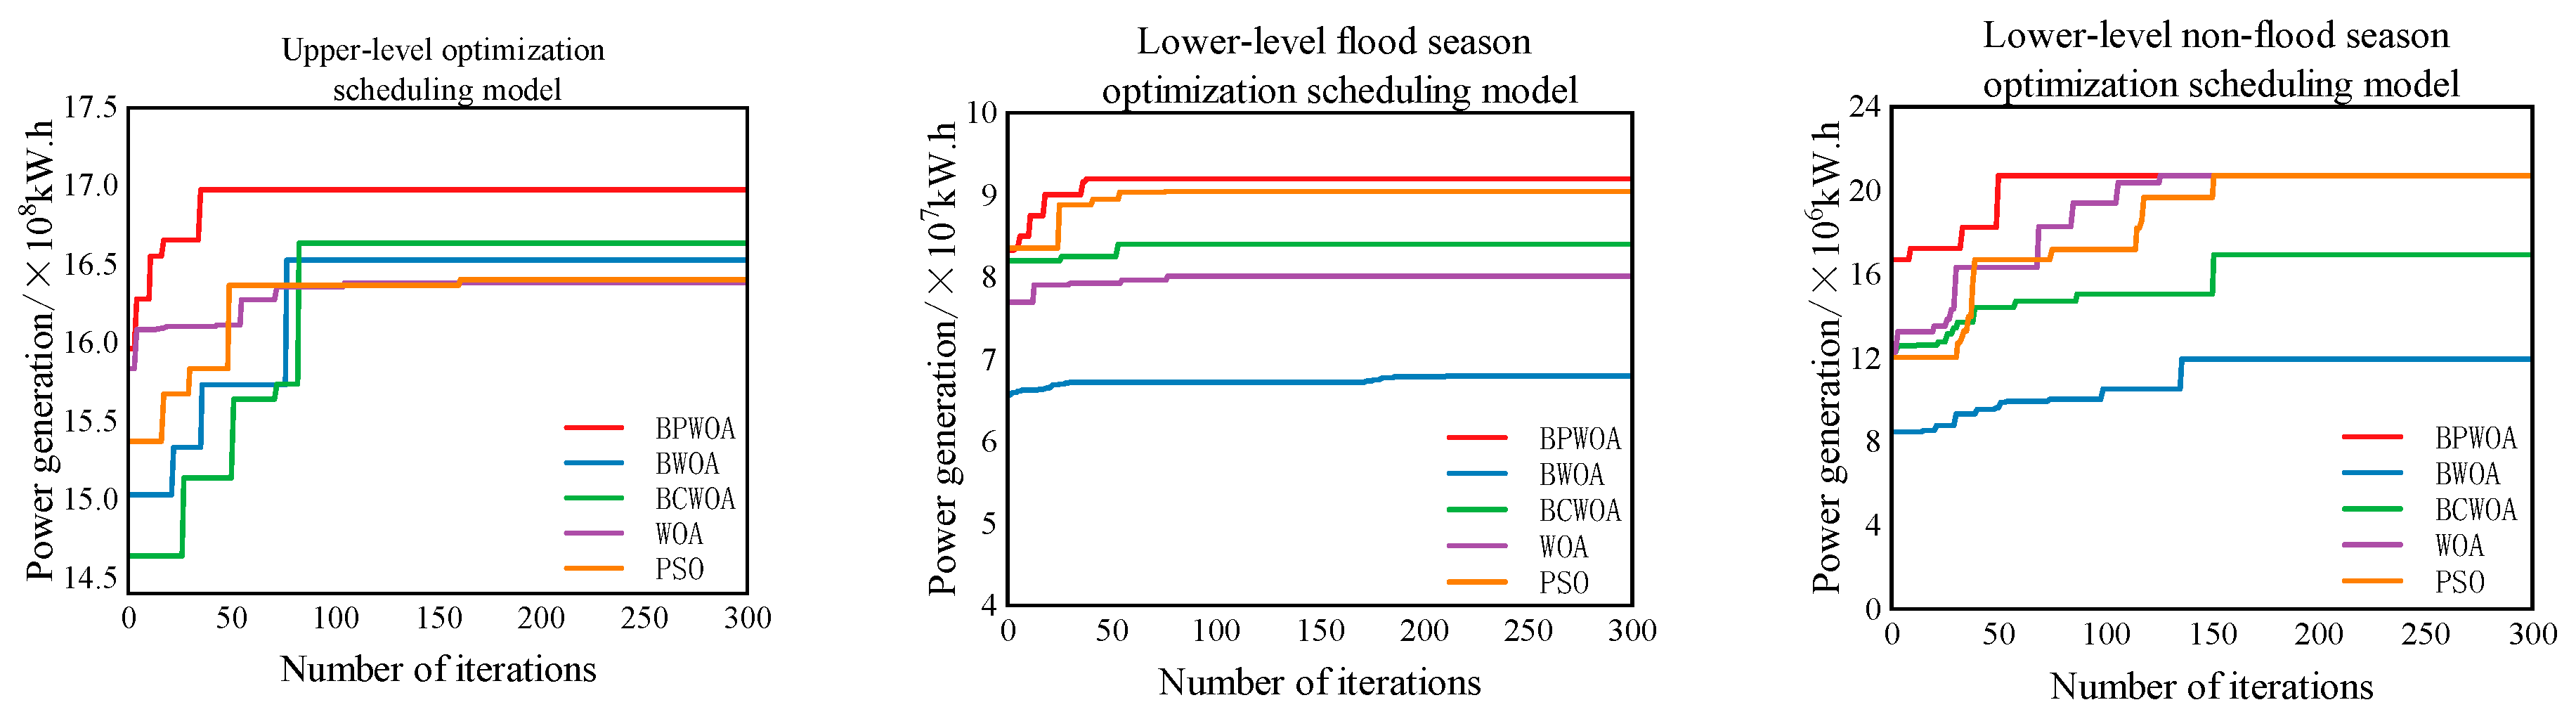
4.3.1. Practical Analysis of the MPWOA Algorithm

In this study, the water levels of the Jiangpinghe River Hydropower Station are selected as decision variables, with inflow runoff as input. The population of N p o p individuals is randomly initialized, and the algorithm iterates through the optimization process. The objective is to maximize power generation, which serves as the fitness evaluation criterion for solving the multi-timescale nested power generation optimization scheduling problem. The steps for solving the multi-timescale nested power generation optimization scheduling problem using the MPWOA algorithm are as follows:
Step 1: Set the algorithm parameters, including population size N, individual dimension D, maximum iteration count M a x _ i t e r , and particle jump probability θ . Load the basic data of the hydropower station, including the water level–storage curve, discharge flow curve, inflow to the upper model, as well as the constraints for output, water level, flow, etc. The fitness value is the objective function value of the power generation optimization scheduling model, as given in Equations (1) and (2).
Step 2: Generate chaotic sequence values using the cubic chaotic mapping, and map them to the decision variable space. Initialize the population by generating N individuals using Equation (11) where each individual represents a water level process. Calculate the fitness F for each individual, evaluate the fitness of the initial population, and record both the individual’s best and global best positions. Check whether the generated water level processes satisfy the constraints. If they do, proceed to the next step; if not, adjust the water levels by setting the upper limit if it exceeds the maximum or setting the lower limit if it falls below the minimum.
Step 3: Calculate the convergence factor a , coefficient vectors A , C and the adaptive critical value p 1 . Check if p p 1   holds true. If it does, continue to the next step. If it does not, update the individual positions using Equation (19) based on the particle-spiral bubble hunting process.
Step 4: Check if the coefficient vector A < 1 holds true. If it does, enter the contraction encircling phase and update the individual position using Equation (12). If not, update the individual position using the migration-random search strategy described in Equation (21).
Step 5: After updating the individual positions in Step 3 and Step 4, calculate the fitness of the new individuals and update the individual’s best and global best positions.
Step 6: Check if the maximum iteration count M a x _ i t e r   has been reached. If not, continue the iterations and return to Step 3 to repeat the iteration process. If the maximum iteration count is reached, output the global best solution as the scheduling plan for the upper optimization model, obtaining the water level guidance process for the upper optimization scheduling.
Step 7: Input the water level guidance process from Step 6 into the lower model. Set the algorithm parameters the same as in Step 1 and load the inflow flow and corresponding constraints for the lower optimization scheduling model.
Step 8: Repeat the upper model’s calculation process by following the population generation and update methods in Steps 2, 3, 4, 5, and 6 to update the water level process for the lower model. Record the global best position of the lower model and output the global best solution as the scheduling plan for the lower optimization model.
To validate the practicality and effectiveness of the MPWOA algorithm in the multi-timescale optimal scheduling model, this study conducts related experiments based on the inflow runoff data of the Jiangpinghe River for the year 2021. To ensure the universality of the experimental results, five algorithms—MPWOA, MWOA, MCWOA, WOA, and PSO—are used to solve the upper-layer long-term scheduling model and the lower-layer optimization scheduling model. Additionally, the lower-level optimal scheduling model is selected for in-depth study during specific periods of the flood season and the non-flood season to compare the performance of different algorithms under different scheduling conditions. The number of iterations for each run is set to 300, and the experiments are independently repeated 40 times. The optimal values from each run are recorded, and the average, maximum, minimum, and standard deviation of the 40 optimal results are calculated.
The optimization scheduling performance of the MPWOA, MWOA, MCWOA, WOA, and PSO algorithms at different time scales is shown in Table 3, Table 4 and Table 5. The analysis results indicate that the MPWOA algorithm demonstrates exceptional performance in both the upper-layer and lower-layer optimization scheduling models, with superior values in terms of mean, maximum, and minimum results, along with higher stability and shorter computation time. Specifically, in the upper-layer optimization scheduling results, the optimal mean value obtained by the MPWOA algorithm is 1.68 billion kW·h, which represents an improvement of 2.0%, 2.3%, 1.2%, and 0.8% over the MWOA, MCWOA, WOA, and PSO algorithms, respectively. The algorithm also exhibits the best performance in terms of both maximum and minimum values. In the lower-layer flood-season ten-day optimization scheduling results, the optimal mean value for the MPWOA algorithm is 91.93 million kW·h, which is 35.3%, 10.0%, 14.3%, and 1.6% higher than the MWOA, MCWOA, WOA, and PSO algorithms, respectively. In the non-flood-season ten-day optimization scheduling, it outperforms the other algorithms by 73.4%, 22.5%, 2.0%, and 0.1%, with the flood-season optimization effect being particularly significant. These results demonstrate that the proposed improvement strategy is rational and effective, significantly enhancing the optimization capability of the improved algorithm.
Further, when comparing the standard deviations of the algorithms, the MPWOA algorithm has the smallest standard deviation in both the upper and lower models, indicating that it is more stable in the multi-timescale optimal scheduling model. Finally, in terms of computational efficiency, the MPWOA algorithm takes the shortest time compared to the other algorithms in 300 iterations of computation, which further proves the improvement of the algorithm in terms of computational efficiency.
In summary, the MPWOA algorithm excels in several key performance indicators of optimal scheduling, not only in terms of optimization results but also in terms of algorithm stability and computational efficiency, thus verifying the effectiveness of the proposed improvement strategy.
Figure 4 illustrates the power generation iteration process under the upper and lower optimization scheduling models. From the figure, it can be observed that the MPWOA algorithm has the best iterative optimization capability. Not only does it achieve the highest convergent fitness value, but, also, under the same timescale optimization, the MPWOA algorithm converges more quickly. Furthermore, when comparing the optimization scheduling process during two different periods at the lower layer, it is found that the number of iterations required to reach stability during the flood season is fewer than that during the non-flood season. This is because the inflow during the flood season is higher, leading to a more frequent full power generation scenario at the hydropower station. The search space for the algorithm’s population is relatively smaller, making it easier to find the optimal value compared to the non-flood season.
Figure 5 and Figure 6 show the power output process of MPWOA, MWOA, MCWOA, WOA, and PSO algorithms in each model. From Figure 5, it can be seen that the output trend of each algorithm in the upper optimal scheduling is basically the same, with higher output levels during the flood season and lower output levels during the non-flood season, which aligns with the basic characteristics of actual scheduling operations. This indicates that the application of the above algorithms in practical hydropower optimization scheduling is both reasonable and reliable. In the lower flood season ten-day optimal scheduling, the output process of the MPWOA algorithm is relatively smooth, with higher output levels, which can make full use of the water resources during the flood season, reflecting a better scheduling performance. In the lower non-flood season ten-day optimal scheduling, the output processes of the five algorithms are essentially the same. Affected by the insufficient incoming water during non-flood season, all algorithms maintain a lower output level under the premise of ensuring the safe operation of the power station, which is in line with the actual operation requirements. This further verifies the effectiveness and applicability of the MPWOA algorithm in optimal scheduling and, at the same time, reflects the good adaptability of different algorithms to operational constraints.
From the above results, it can be seen that the proposed improved algorithm strategies are reasonable and effective, which can not only significantly improve the algorithm’s optimization performance but also effectively avoid falling into the local optimum. At the same time, the algorithm has strong practical application in engineering, which is of great significance for improving the power generation optimization of hydropower stations.

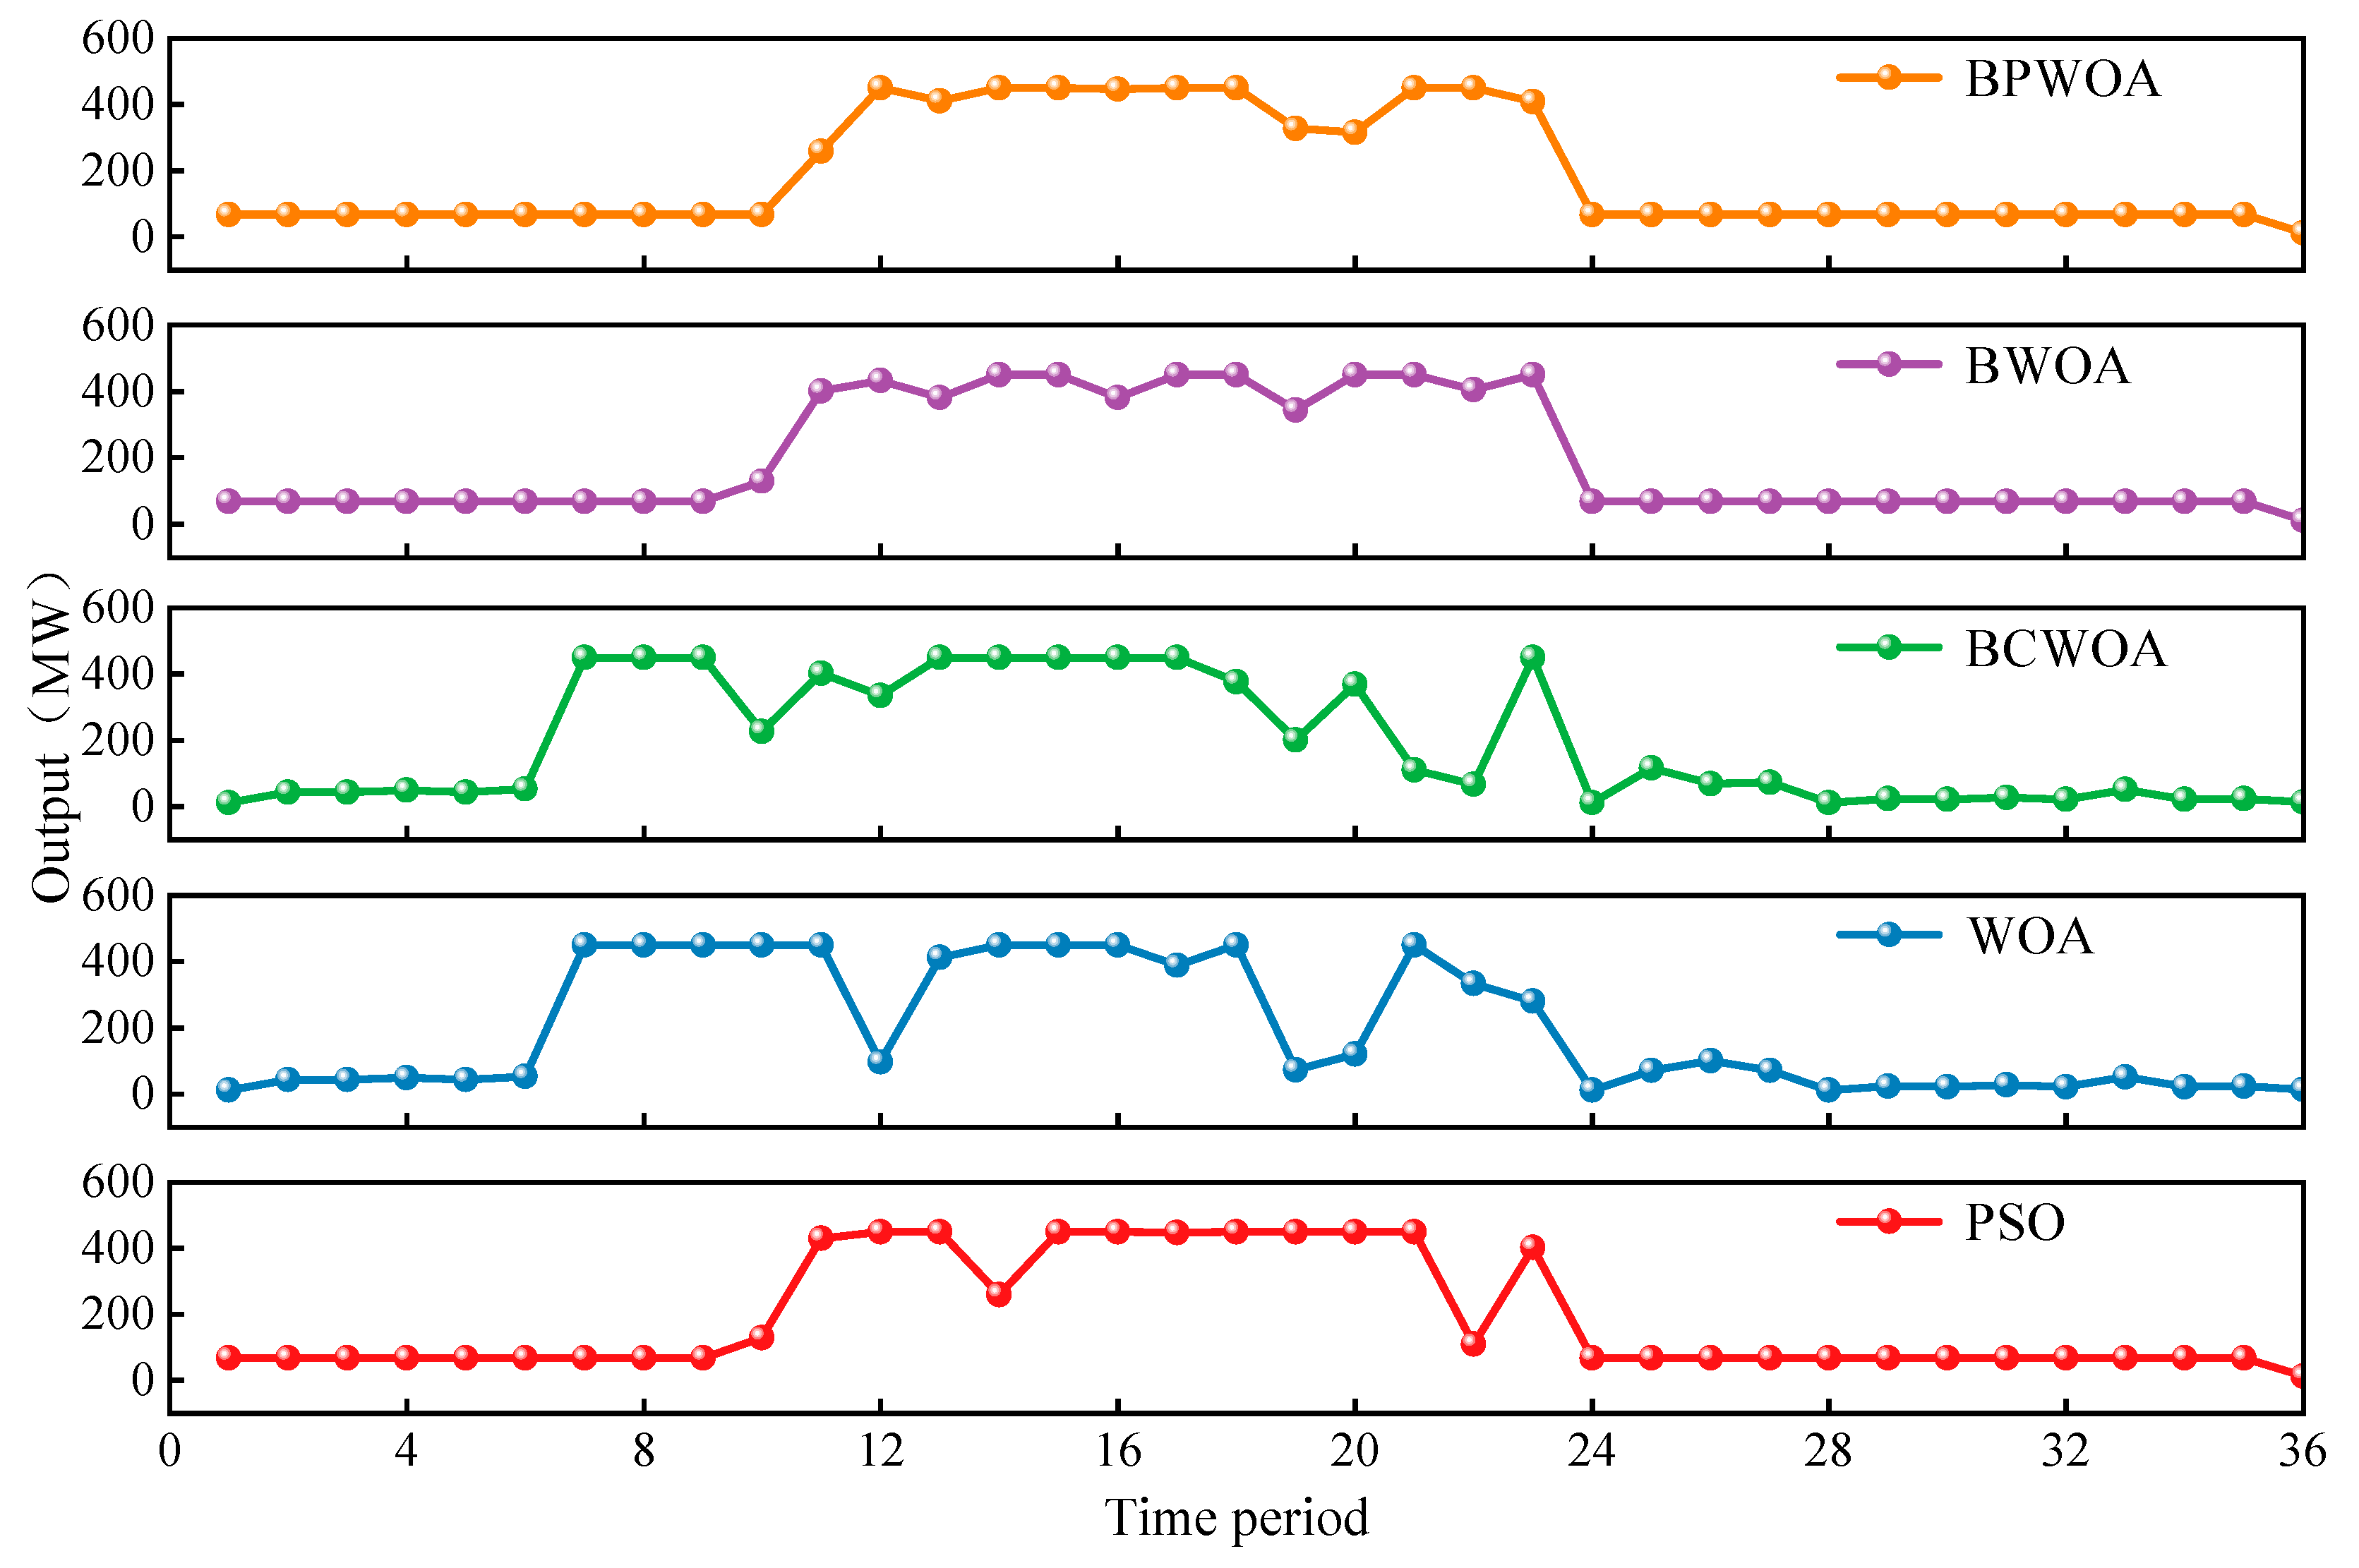
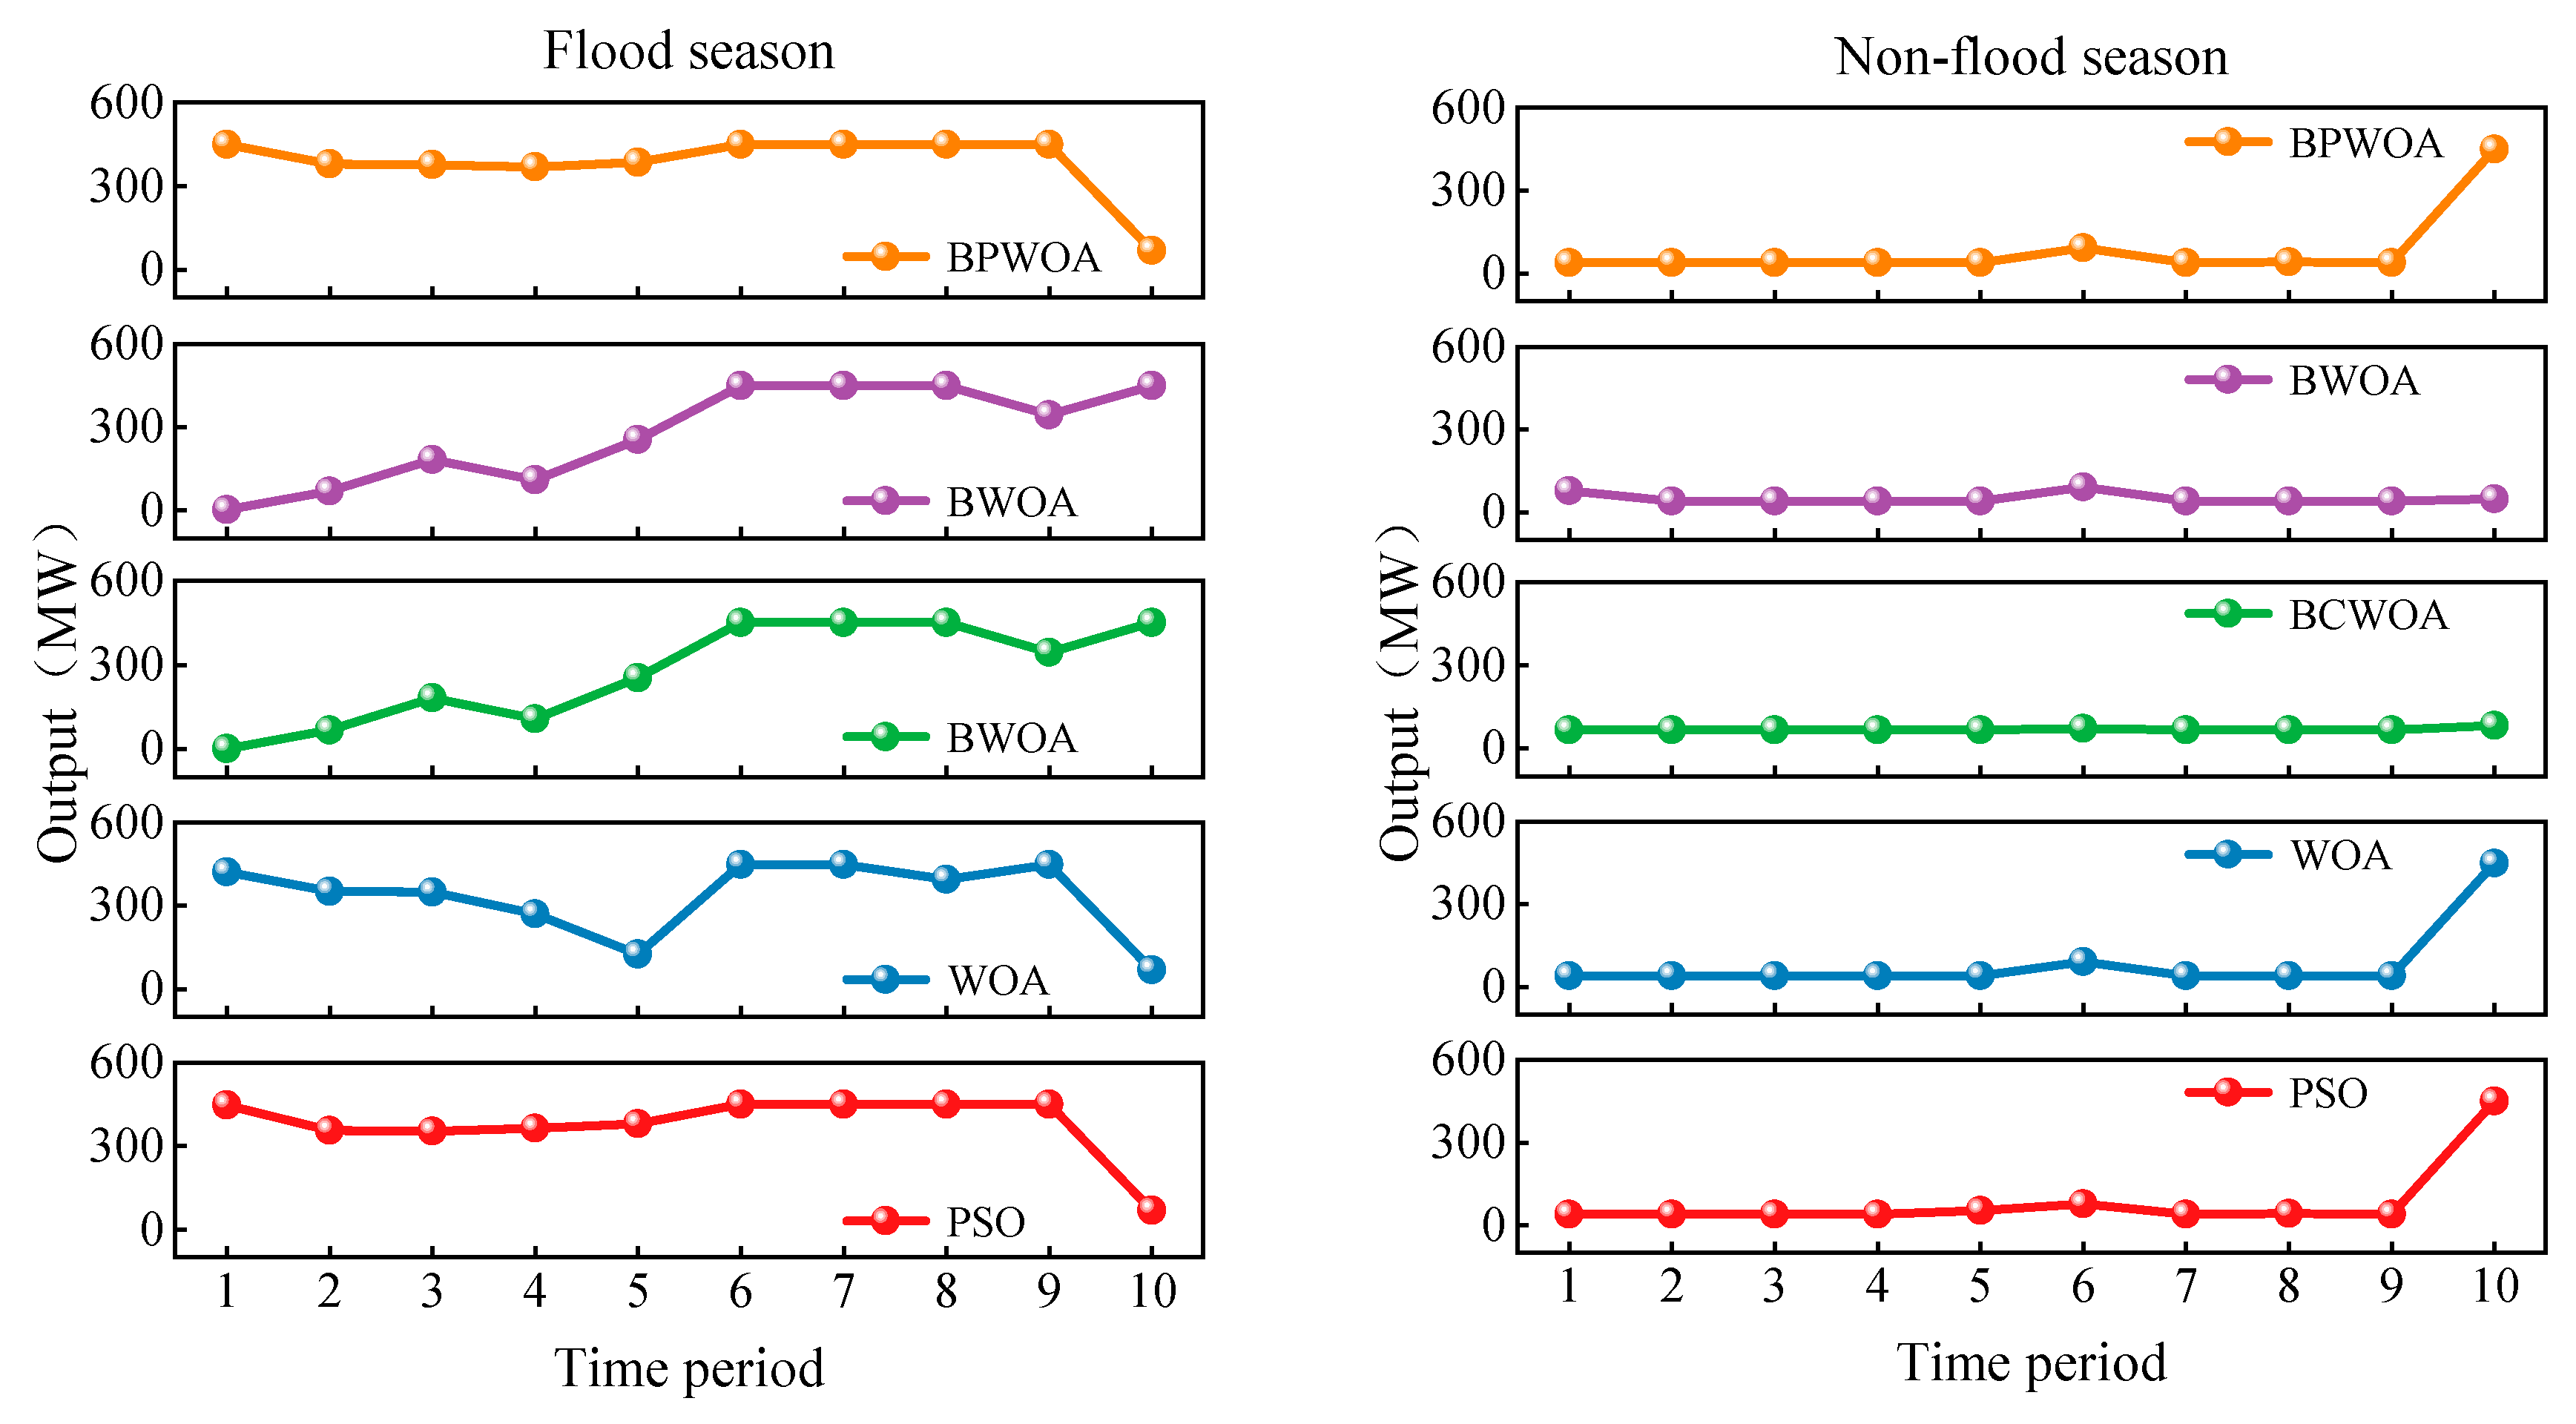
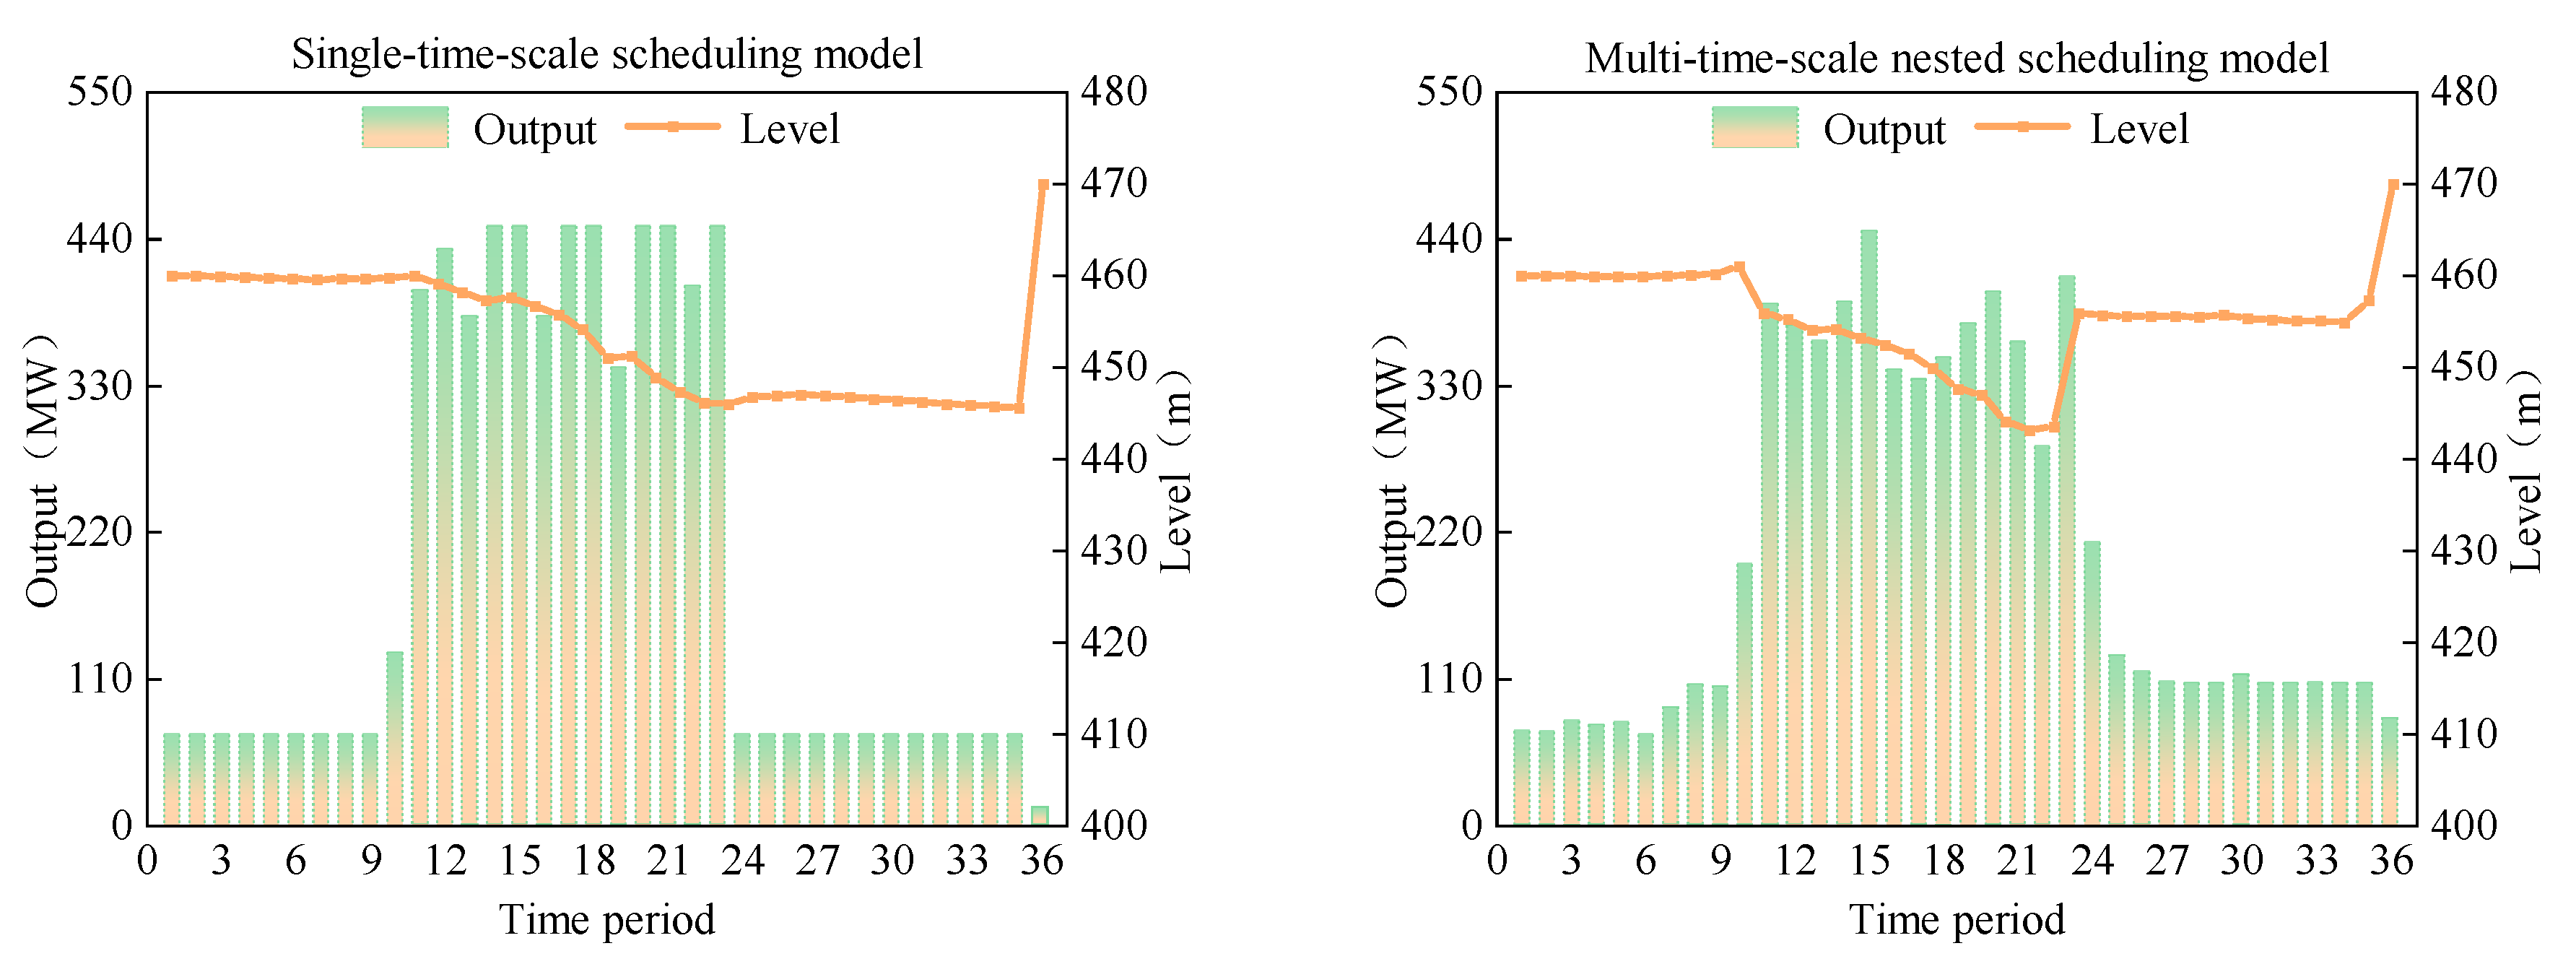
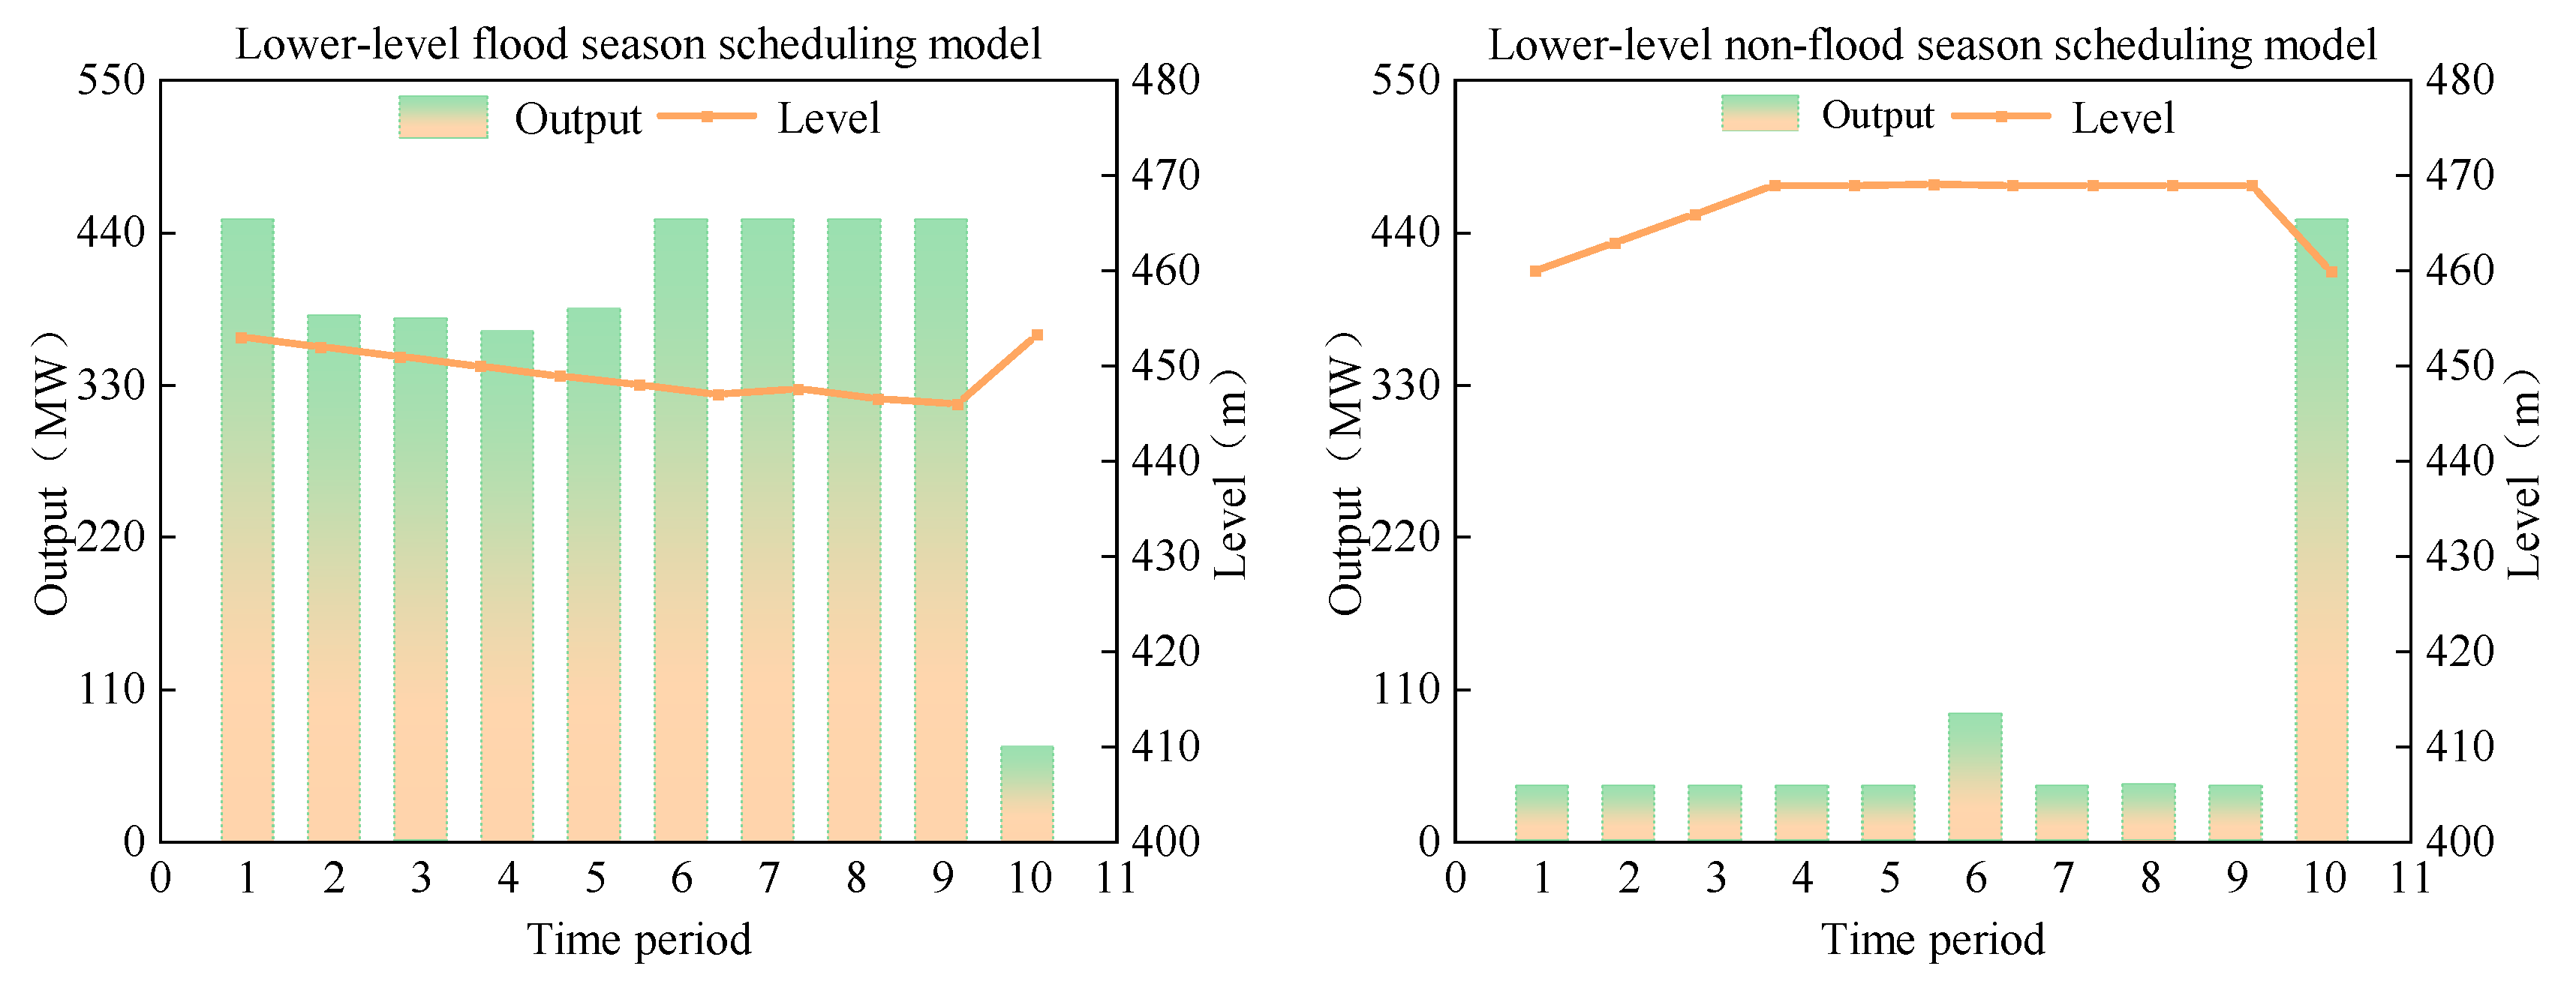
4.3.2. Analysis of Scheduling Results Under the MPWOA Algorithm

This section analyzes the performance of the MPWOA algorithm in solving the multi-timescale nested optimization scheduling scheme, further exploring the advantages of the multi-timescale optimal scheduling model compared to traditional single-timescale scheduling models. Additionally, it evaluates whether the application of the MPWOA algorithm in this model is reasonable and effective, providing theoretical support and practical evidence for the model and algorithm’s applicability.
Based on the actual operational data from 2021, the actual power generation was 940 million kW·h. Using the MPWOA algorithm, the power generation of the single-timescale scheduling model increased to 1.69 billion kW·h, and the multi-timescale optimal scheduling model further improved to 1.75 billion kW·h. This indicates that the algorithm has strong global optimization capability and good local search performance in solving power generation optimization scheduling models. It can effectively balance the generation targets with the scheduling demands under multi-timescale nesting, providing reliable technical support for optimizing water resource utilization and improving power generation efficiency.
Further analysis of Figure 7 reveals the power generation process for the actual operational data, the single-timescale scheduling model, and the multi-timescale optimal scheduling model. After optimization by the MPWOA algorithm, the power generation during the flood season in both the single-timescale and multi-timescale optimal scheduling model is significantly higher than the actual operational process, demonstrating notable optimization effects. Meanwhile, the optimized power generation process is less fluctuating and more stable. This indicates that the multi-timescale optimal scheduling model, through organic coordination and optimization of scheduling decisions across different time scales, effectively reduces the risk of excessive resource exploitation that may result from a single-timescale scheduling model.
Additionally, the scheduling process of the multi-timescale optimal scheduling model is more consistent with the actual operational process, reflecting better alignment with real operational trends. This consistency not only indicates that the multi-timescale optimal scheduling model can more accurately reflect actual operational patterns, but it also helps avoid scheduling schemes that deviate excessively from real operating conditions, thus improving the operability and credibility of the optimization results in practical applications. In terms of optimization performance, the multi-timescale optimal scheduling model outperforms the single-timescale model, further proving its advantages in adapting to complex hydrological conditions and multi-timescale scheduling demands. This provides scientific technical support and practical references for enhancing the power generation benefits and scheduling reliability of hydropower stations. Although the application of the MPWOA algorithm in the multi-timescale nested scheduling model has achieved significant results, further research is needed to enhance the model’s adaptability to extreme hydrological conditions, such as severe droughts and floods.
Figure 8 and Figure 9 illustrate the water level output process for single-timescale scheduling and multi-timescale nested scheduling. It can be seen that both models maintain a high level of output during the flood season and a low level of output during the non-flood season. Compared to single-timescale scheduling, the multi-timescale nested scheduling model optimizes in layers across different time scales. It balances the global power generation goal on a longer time scale. At the same time, it better responds to changes in water levels and output on shorter time scales. The output process shows smoother characteristics. During the flood and dry seasons, the output process aligns more closely with actual scheduling trends. This avoids the problem in single-timescale scheduling where over-prioritizing full power output could lead to excessive water level fluctuations or insufficient regulation accuracy. As a result, the optimization effect better meets the actual scheduling needs. Figure 9 shows the relationship between water level and output power during flood season and non-flood season in the lower model of the multi-timescale optimal scheduling model. The results show that during the flood season, the output process is close to the maximum output but slightly lower, and the water level is in a downward trend. During the non-flood season, due to insufficient incoming water, the output is lower, and the water level gradually rises.

5. Conclusions

In this paper, a Migrating Particle Whale Optimization Algorithm (MPWOA) was proposed to enhance the standard Whale Optimization Algorithm. We conducted a comparative analysis with four other algorithms—MWOA, MCWOA, WOA, and PSO. The improved algorithm’s optimization performance was verified through test functions and its application to a multi-timescale optimal scheduling model. The main conclusions are as follows:
(1)
The Migrating Particle Whale Optimization Algorithm (MPWOA), based on the black-winged kite migration mechanism and particle swarm algorithm, showed superior optimization capabilities in both 10 test functions and hydropower generation scheduling models. Compared to MWOA, MCWOA, WOA, and PSO, MPWOA exhibited faster convergence and more stable search performance. It also significantly reduced the risk of falling into local optima. Furthermore, MPWOA demonstrated strong adaptability in solving multi-timescale, nonlinear, and multi-constraint hydropower scheduling problems. This adaptability helped improve the rational allocation and efficient use of water resources, thus providing a scientifically effective solution for hydropower station scheduling optimization.
(2)
The MPWOA achieved notable improvements in addressing hydropower generation scheduling problems, enhancing both long-term scheduling in the upper model and short-term scheduling in the lower model. The algorithm effectively leverages water resources, maximizes power generation efficiency, and provides a scientific, efficient solution for optimal scheduling.
(3)
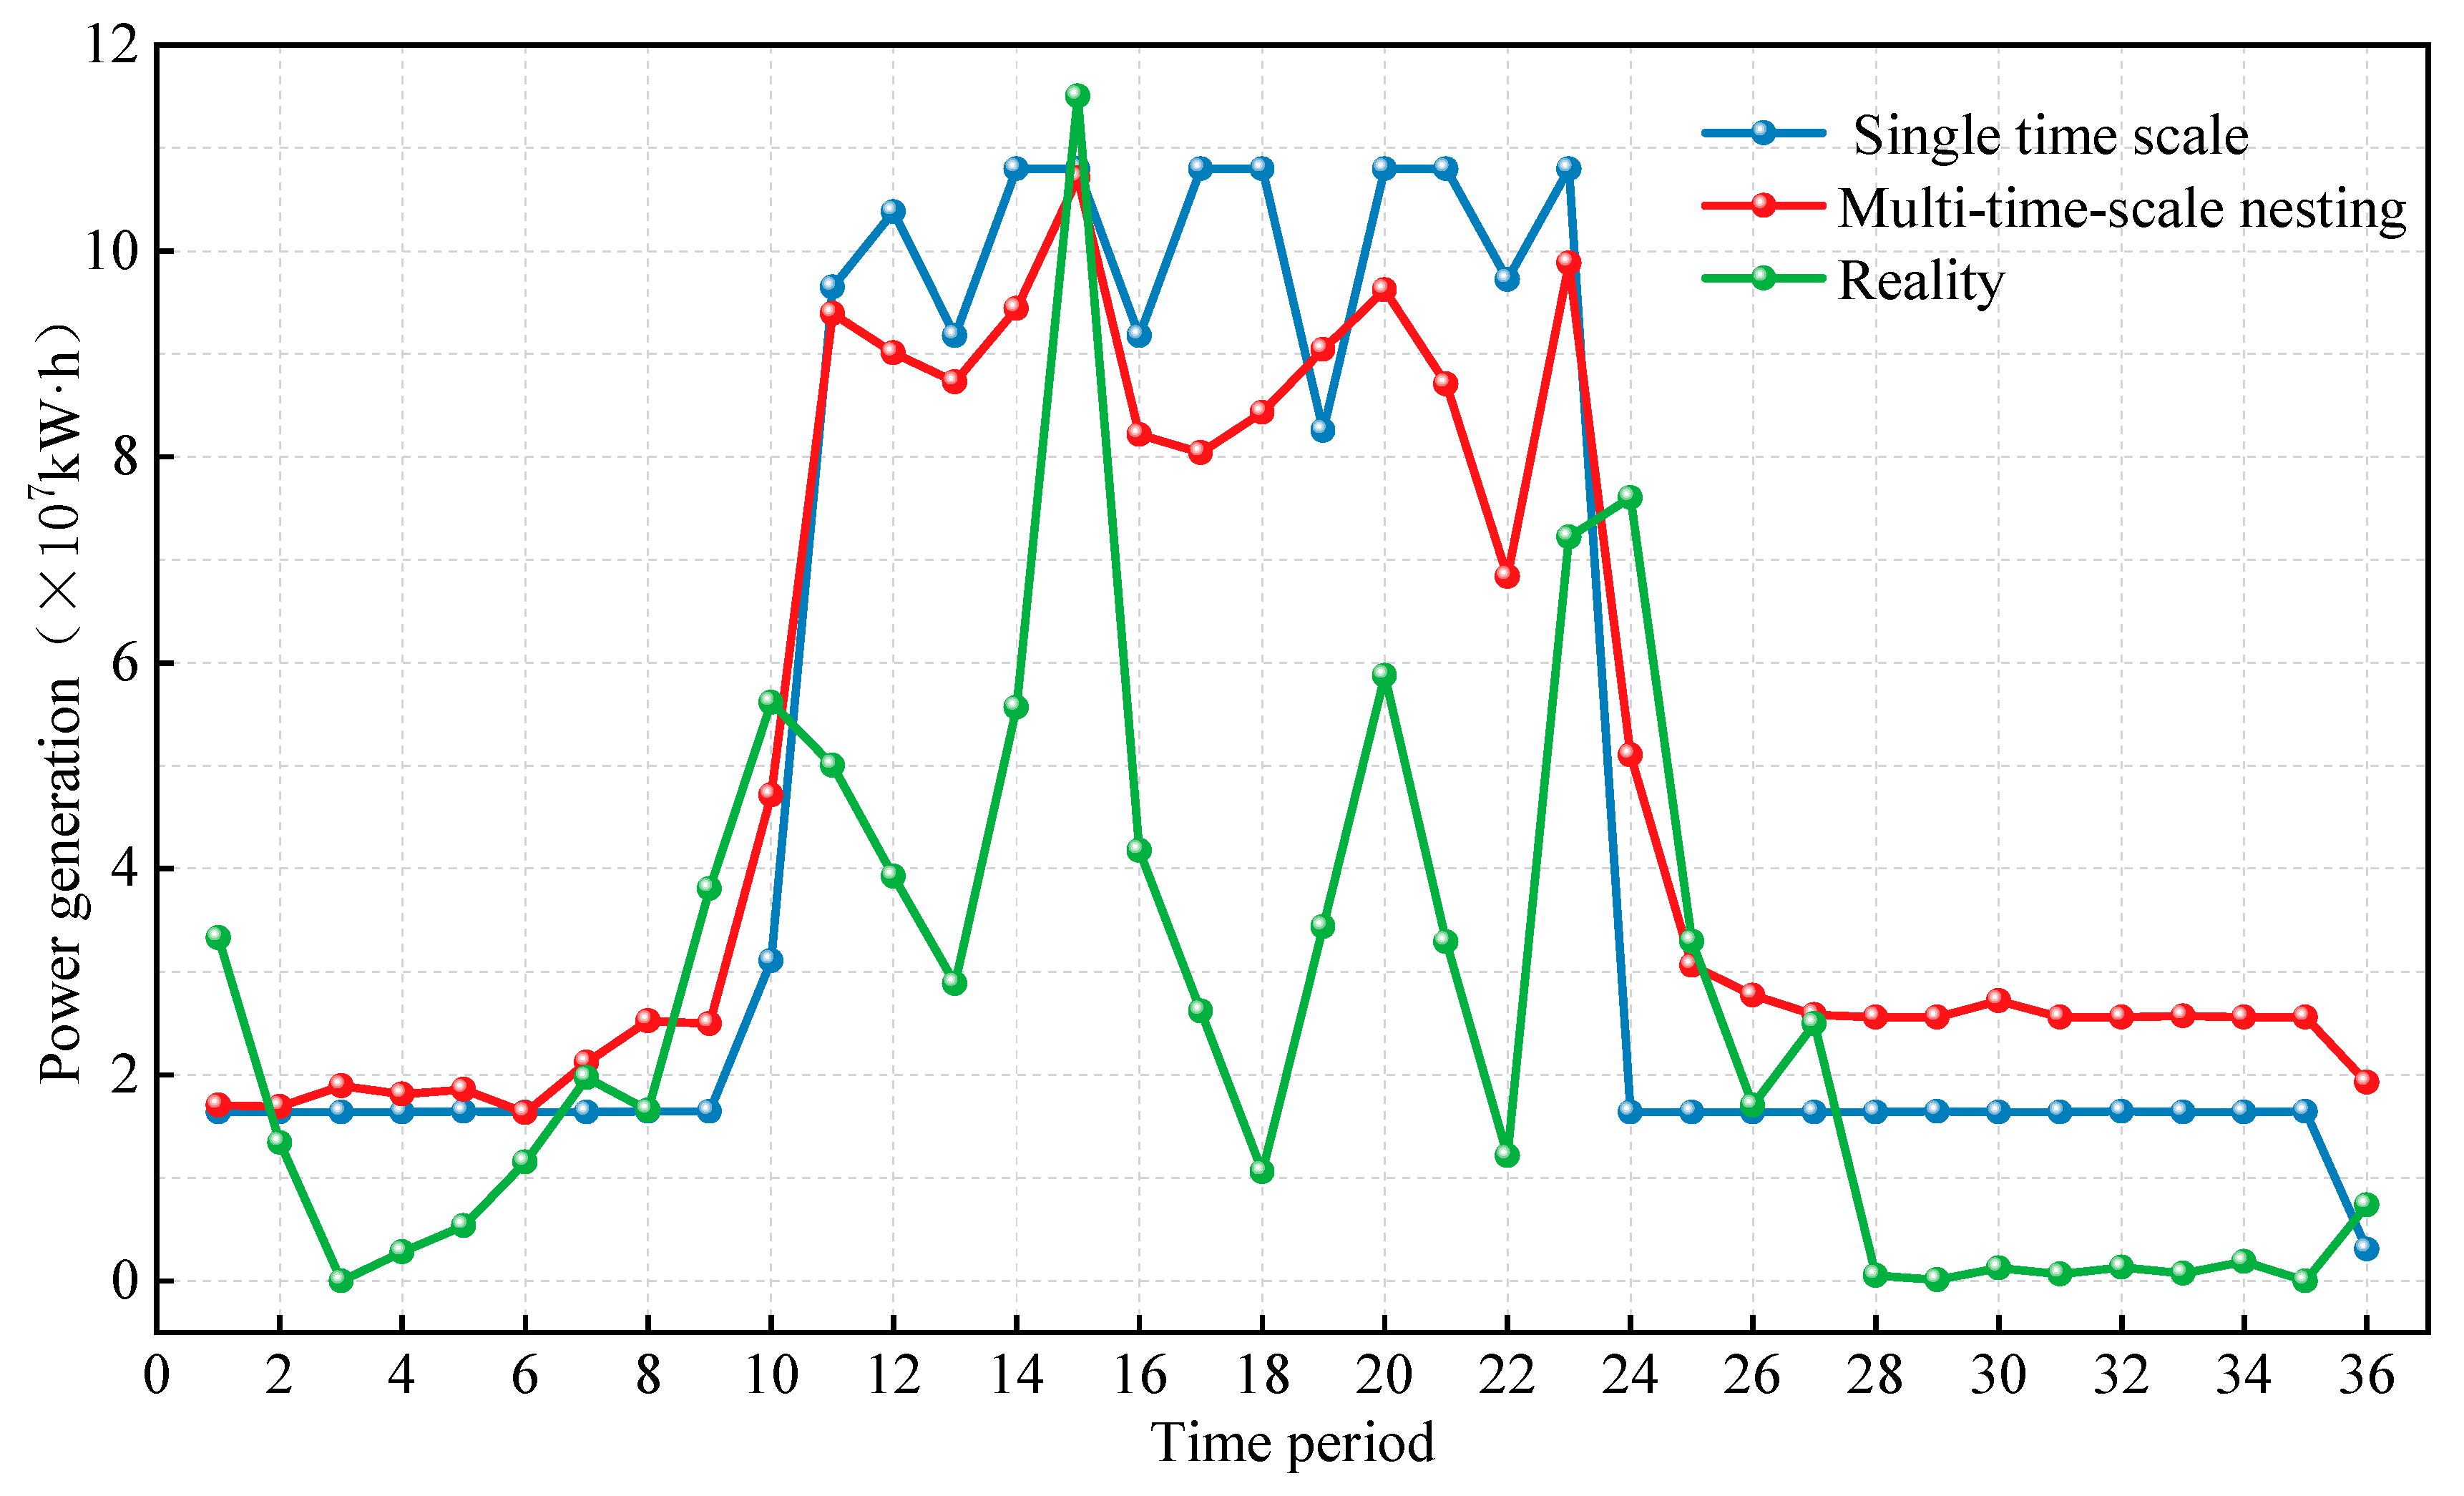
The proposed multi-timescale nested optimal scheduling model achieved significant improvements in achieving power generation targets compared to the single-timescale scheduling model. This model can more accurately reflect actual operational characteristics, mitigate the risks of over-exploitation of resources associated with the single-timescale model, and enhance the efficient use of water resources while fostering sustainable development. It offers a more comprehensive and sound foundation for optimizing hydropower station scheduling.
In conclusion, this study proposes an efficient solution algorithm and demonstrates the significant advantages of the multi-timescale nested optimal scheduling model in enhancing the power generation efficiency of hydropower plants, which provides an important theoretical basis and practical reference for water resources management and utilization. However, there are still some problems in the study that deserve further exploration. Firstly, the scheduling models at each level are designed without sufficiently considering the uncertainties in actual operation, such as extreme weather and equipment failure, which may lead to some deviations between the optimization results and the actual situation. Secondly, the current multi-timescale nested optimal scheduling model mainly focuses on power generation optimization, and there is a relative lack of research on multi-objective synergistic optimization, such as flood scheduling and ecological water security, which makes it difficult to balance the multi-dimensional scheduling requirements comprehensively.
Therefore, future research should deeply explore the influence of uncertainty factors in dispatch optimization on the accuracy of the results and improve the applicability and robustness of the model by introducing dynamic constraints and uncertainty modeling. Meanwhile, the multi-timescale nested scheduling model should be further improved, and a multi-objective optimization framework should be constructed to coordinate the needs of multiple objectives, such as power generation efficiency, flood scheduling, and ecological safeguard, in order to achieve the efficient use and sustainable management of water resources.

Author Contributions

Conceptualization, M.Z. and L.M.; methodology, M.Z.; validation, M.Z., G.Z. and B.L.; formal analysis, M.Z.; investigation, H.Y.; resources, D.H.; data curation, M.Z.; writing—original draft preparation, M.Z.; writing—review and editing, M.Z. and L.M.; visualization, G.Z.; supervision, B.L.; project administration, G.Z., B.L. and L.M.; funding acquisition, G.Z., B.L., H.Y., D.H. and L.M. All authors have read and agreed to the published version of the manuscript.

Funding

This research was funded by Multi-Objective Scheduling Technology for Large Inter-basin Water Transfer Reservoirs (SF-202302), Hubei Energy Group Zhise Hydropower Co., Ltd. for scientific research project (Contract No. ENLS-LS-FW-2024006), the National Natural Science Foundation of China (No. 52379011), and the National Key Research and Development Programme of China (2021YFC3200303).

Data Availability Statement

The data presented in this study are available on request from the corresponding author due to their storage by the hydrological station, which involves sensitive environmental information and potential privacy concerns. Additionally, access to the data must comply with relevant legal regulations and ethical requirements. To ensure lawful use and protect the rights of the data provider, access to the research data requires a formal application and approval process.

Conflicts of Interest

Author Guosheng Zhou, Dajun Huang, and Hao Yu were employed by Hubei Energy Group Loushui Hydropower Co., Ltd. And Bei Liu was employed by Changjiang Survey, Planning, Design and Research Co., Ltd. The remaining authors declare that the research was conducted in the absence of any commercial or financial relationships that could be construed as a potential conflict of interest.

Abbreviations

The following abbreviations are used in this manuscript:
MPWOAMigrating Particle Whale Optimization Algorithm
MWOAMigrating Whale Optimization Algorithm
MCWOAMigrating Chaotic Whale Optimization Algorithm
WOAWhale Optimization Algorithm
PSOParticle Swarm Algorithm

References

  1. Kosolapova, N.A.; Matveeva, L.G.; Nikitaeva, A.Y.; Molapisi, L. Modeling Resource Basis for Social and Economic Development Strategies: Water Resource Case. J. Hydrol. 2017, 553, 438–446. [Google Scholar] [CrossRef]
  2. Bilalova, S.; Newig, J.; Tremblay-Lévesque, L.-C.; Roux, J.; Herron, C.; Crane, S. Pathways to Water Sustainability? A Global Study Assessing the Benefits of Integrated Water Resources Management. J. Environ. Manag. 2023, 343, 118179. [Google Scholar] [CrossRef]
  3. Li, P.; Wu, J. Water Resources and Sustainable Development. Water 2024, 16, 134. [Google Scholar] [CrossRef]
  4. Niu, W.; Luo, T.; Yao, X.; Gong, J.; Huang, Q.; Gao, H.; Feng, Z. Artificial Intelligence-Based Response Surface Progressive Optimality Algorithm for Operation Optimization of Multiple Hydropower Reservoirs. Energy 2024, 291, 130449. [Google Scholar] [CrossRef]
  5. Wang, Z.; Tan, Q.; Wen, X.; Su, H.; Fang, G.; Wang, H. Capacity Optimization of Retrofitting Cascade Hydropower Plants with Pumping Stations for Renewable Energy Integration: A Case Study. Appl. Energy 2025, 377, 124429. [Google Scholar] [CrossRef]
  6. Liu, W.; Zhu, F.; Chen, J.; Wang, H.; Xu, B.; Song, P.; Zhong, P.; Lei, X.; Wang, C.; Yan, M.; et al. Multi-Objective Optimization Scheduling of Wind–Photovoltaic–Hydropower Systems Considering Riverine Ecosystem. Energy Convers. Manag. 2019, 196, 32–43. [Google Scholar] [CrossRef]
  7. He, J.; Tang, Y.; Guo, X.; Chen, H.; Guo, W. Research on Hybrid Reservoir Scheduling Optimization Based on Improved Walrus Optimization Algorithm with Coupling Adaptive ε Constraint and Multi-Strategy Optimization. Sci. Rep. 2024, 14, 11981. [Google Scholar] [CrossRef]
  8. Myateg, T.; Mitrofanov, S.; Xi, C.; Sekretarev, Y.; Safaraliev, M.; Volosatov, R.; Arestova, A.; Gulakhmadov, A. Long-Term Hydropower Plant Scheduling Considering Environmental and Economic Criteria. Sustainability 2024, 16, 10106. [Google Scholar] [CrossRef]
  9. Zhang, R.; Zhang, S.; Wen, X.; Yue, Z.; Zhou, Y. Optimization of Short-Term Hydropower Scheduling with Dynamic Reservoir Capacity Based on Improved Genetic Algorithm and Parallel Computing. J. Hydrol. 2024, 636, 131238. [Google Scholar] [CrossRef]
  10. Li, Z.; Wang, Y.; Chang, J.; Guo, A.; Wang, L.; Niu, C.; Hu, R.; He, B. Multi-Objective Double Layer Water Optimal Allocation and Scheduling Framework Combing the Integrated Surface Water—Groundwater Model. Water Res. 2024, 262, 122141. [Google Scholar] [CrossRef]
  11. Shang, L.; Li, X.; Shi, H.; Kong, F.; Wang, Y.; Shang, Y. Long-, Medium-, and Short-Term Nested Optimized-Scheduling Model for Cascade Hydropower Plants: Development and Practical Application. Water 2022, 14, 1586. [Google Scholar] [CrossRef]
  12. Subotić, I.; Groß, D.; Colombino, M.; Dörfler, F. A Lyapunov Framework for Nested Dynamical Systems on Multiple Time Scales With Application to Converter-Based Power Systems. IEEE Trans. Autom. Control. 2021, 66, 5909–5924. [Google Scholar] [CrossRef]
  13. Ben Alaya, A.; Souissi, A.; Tarhouni, J.; Ncib, K. Optimization of Nebhana Reservoir Water Allocation by Stochastic Dynamic Programming. Water Resour. Manag. 2003, 17, 259–272. [Google Scholar] [CrossRef]
  14. Jalali, M.R.; Afshar, A.; Mariño, M.A. Multi-Colony Ant Algorithm for Continuous Multi-Reservoir Operation Optimization Problem. Water Resour Manag. 2007, 21, 1429–1447. [Google Scholar] [CrossRef]
  15. Yi, M.; Mo, L.; Shen, Q. Study on Generation Scheduling of Cascade Hydropower Stations Based on SAPSO. J. Coast. Res. 2020, 104, 371–378. [Google Scholar] [CrossRef]
  16. Mirjalili, S.; Lewis, A. The Whale Optimization Algorithm. Adv. Eng. Softw. 2016, 95, 51–67. [Google Scholar] [CrossRef]
  17. Hu, Q.; Hu, H.; Lin, Z.; Chen, Z.; Zhang, Y. A Decision-Making Method for Reservoir Operation Schemes Based on Deep Learning and Whale Optimization Algorithm. Front. Plant Sci. 2023, 14, 1102855. [Google Scholar] [CrossRef]
  18. Yang, K.; Yang, K. Short-Term Hydro Generation Scheduling of the Three Gorges Hydropower Station Using Improver Binary-Coded Whale Optimization Algorithm. Water Resour. Manag. 2021, 35, 3771–3790. [Google Scholar] [CrossRef]
  19. Wang, W.; Wang, B.; Chau, K.; Zhao, Y.; Zang, H.; Xu, D. Monthly Runoff Prediction Using Gated Recurrent Unit Neural Network Based on Variational Modal Decomposition and Optimized by Whale Optimization Algorithm. Environ. Earth Sci. 2024, 83, 72. [Google Scholar] [CrossRef]
  20. Wang, J.; Wang, W.; Hu, X.; Qiu, L.; Zang, H. Black-Winged Kite Algorithm: A Nature-Inspired Meta-Heuristic for Solving Benchmark Functions and Engineering Problems. Artif. Intell. Rev. 2024, 57, 98. [Google Scholar] [CrossRef]
  21. Wang, D.; Tan, D.; Liu, L. Particle Swarm Optimization Algorithm: An Overview. Soft Comput. 2018, 22, 387–408. [Google Scholar] [CrossRef]
  22. Mo, C.; Zhao, S.; Ruan, Y.; Liu, S.; Lei, X.; Lai, S.; Sun, G.; Xing, Z. Research on Reservoir Optimal Operation Based on Long-Term and Mid-Long-Term Nested Models. Water 2022, 14, 608. [Google Scholar] [CrossRef]
Figure 1. A flowchart of the MPWOA algorithm.
Energies 18 01780 g001
Figure 2. The convergence process of different algorithms under ten sets of test functions.
Energies 18 01780 g002aEnergies 18 01780 g002b
Figure 3. The Jiangpinghe River basin control map.
Energies 18 01780 g003
Figure 4. Iterative process of power generation for upper- and lower-level optimization scheduling models.
Energies 18 01780 g004
Figure 5. Output results of the upper-level optimization scheduling model under different algorithms.
Energies 18 01780 g005
Figure 6. Output results of the lower-level optimization scheduling model under different algorithms.
Energies 18 01780 g006
Figure 7. The diagram of the power generation process for each model.
Energies 18 01780 g007
Figure 8. Water level output process for single-timescale scheduling model and multi-timescale nested scheduling model.
Energies 18 01780 g008
Figure 9. Water level output process for the lower optimal dispatch model.
Energies 18 01780 g009
Table 1. Ten groups of test functions.
FunctionsTest Function ExpressionFeasibility DomainOptimal Value
F1 f ( x ) = i = 1 n x i 2 [−100, 100]0
F2 f ( x ) = m a x x i , 1 i n [−100, 100]0
F3 f ( x ) = i = 1 n 1 100 ( x i + 1 x i 2 ) 2 + ( x i 1 ) 2 [−30, 30]0
F4 f ( x ) = i = 1 n i x i 4 + random   [ 0,1 ] [−1.28, 1.28]0
F5 f ( x ) = i = 1 n x i + 0.5 2 [−100, 100]0
F6 F s ( x ) = i = 1 n x i s i n ( | x i | ) [−500, 500]−12,569.487
F7 f ( x ) = i = 1 n x i 2 10 c o s ( 2 π x i ) + 10 [−5.12, 5.12]0
F8 f ( x ) = 1 + 1 4000 i = 1 n x i 2 i = 1 n c o s x i i [−600, 600]0
F9 f x = s i n 2 ( π w 1 ) + i = 1 n 1 ( w i 1 ) 2 1 + 10 sin 2 π w i + 1 + ( w n 1 ) 2 1 + s i n 2 ( 2 π w n )
Among them w i = 1 + x i 1 4
[−50, 50]0
F10 f ( x ) = 10 d + i = 1 d x i 2 10 cos ( 2 π x i ) [−5.12, 5.12]0
Table 2. Statistics of ten sets of test function results for each algorithm.
Test
Functions
Algorithmic Optimum
MPWOAMWOAMCWOAWOAPSO
F11.13 × 10−712.52 × 10−328.03 × 10−631.64 × 10−260.3239
F25.28 × 10−234.28 × 10−57.85 × 10−35.01 × 10−70.6244
F315.086416.174617.154816.96338.79 × 108
F45.99 × 10−51.28 × 10−30.11768.989 × 10−56.41 × 10⁸
F50.0001780.2519841.33 × 10−32.26 × 10−33809.7982
F6−1187.71−1114.33−1088.04−1095.59−1106.23
F70002.84 × 10−140
F800001.4588
F90.14280.27460.70130.9088820.1237
F10015.0585001625.7943
Table 3. Upper-layer optimization scheduling model: power generation indicators and computation time.
IndicatorMPWOAMWOAMCWOAWOAPSO
Average value (104 kW·h)168,051.21164,804.43164,347.42166,049.07166,685.63
Maximum value (104 kW·h)172,836.05172,702.91172,561.43171,719.24170,696.97
Minimum value (104 kW·h)162,994.47159,330.34157,867.30159,728.75160,727.26
Standard deviation2197.723112.213942.292836.562707.31
Computation time (seconds)7.197.717.238.077.67
Table 4. Lower-layer flood-season optimization scheduling model: power generation indicators and computation time.
IndicatorMPWOAMWOAMCWOAWOAPSO
Average value (104 kW·h)9192.6546793.0438355.8738045.0799047.433
Maximum value (104 kW·h)9193.1986799.3178401.5968152.2879132.499
Minimum value (104 kW·h)9176.9026768.3528260.7717851.5739044.499
Standard deviation2.9255.04261.241136.05915.796
Computation time (seconds)0.43220.61340.53560.52620.5531
Table 5. Lower-layer non-flood-season optimization scheduling model: power generation indicators and computation time.
IndicatorMPWOAMWOAMCWOAWOAPSO
Average value (104 kW·h)2071.4641194.6611691.2182069.0642069.145
Maximum value (104 kW·h)2071.4641194.6611691.2182069.1692069.184
Minimum value (104 kW·h)2071.4641194.6611691.2182069.1842069.064
Standard deviation1.818 × 10−139.094 × 10−139.094 × 10−130.0409510.056184
Computation time (seconds)0.830.951.020.960.85
Disclaimer/Publisher’s Note: The statements, opinions and data contained in all publications are solely those of the individual author(s) and contributor(s) and not of MDPI and/or the editor(s). MDPI and/or the editor(s) disclaim responsibility for any injury to people or property resulting from any ideas, methods, instructions or products referred to in the content.

