1. Introduction
Pulsed power technology has been extensively applied in nuclear fusion, particle accelerators, and high-power microwaves [
1,
2,
3]. In pulsed power systems, the pulse forming line (PFL) serves as a critical component that enables the rapid release of stored energy to generate high-power electrical pulses with a fast rise time. The key parameters in the PFL design include the operating voltage, peak power, and energy storage density [
4]. During operation, the PFL must satisfy the requirements for energy storage and high-power output, and ensure long-term stability and low maintenance. Consequently, optimizing the PFL design, particularly the selection of the energy storage medium, is essential for enhancing the system performance.
Liquid dielectrics are commonly used energy storage materials in PFL systems owing to their excellent insulating properties, strong self-recovery capabilities, and adaptability to diverse geometries [
5,
6,
7,
8,
9,
10]. Deionized (DI) water is the most commonly used energy storage medium in PFLs due to its high dielectric constant (
εr = 80), high breakdown strength, and excellent self-healing properties, making it highly suitable for low-impedance PFLs [
11,
12,
13]. Regarding the breakdown strength, Martin [
3] developed the widely recognized Martin empirical formula based on extensive experimental data. Subsequently, Smith and Champney [
14,
15,
16] expanded upon this formula through additional experiments, modifying its parameters, and found that the breakdown strength of DI water could reach 100–900 kV/cm for different electrode structures and pulse durations. They also found that DI water exhibited a polarity effect, with the breakdown strength under negative polarity being approximately twice that under positive polarity. Another critical property of DI water is its resistivity, typically ranging from 1 to 5 MΩ·cm and reaching up to 10 MΩ·cm after purification. However, maintaining a high resistivity requires purification equipment, which is unfavorable for the miniaturization and compactness of pulsed power systems. Furthermore, DI water cannot function below 0 °C, limiting its environmental adaptability.
Propylene carbonate (PC), an organic liquid with a high dielectric constant (
εr = 65), has attracted significant attention due to its high breakdown strength, high resistivity, and superior environmental adaptability. In 1988, Clark et al. [
17] measured the breakdown voltage of PC under pulses with an 800 ns rise time. The breakdown voltage increased from 298 to 555 kV as the electrode gap increased from 0.64 to 1.37 cm. In 2003 and 2006, Kolb et al. [
18] and Xiao et al. [
19] measured the breakdown strength of PC with a short gap of 0.02 cm under 200 ns square pulses and reported a value of approximately 2.2 MV/cm. In 2014, Xu et al. [
20] measured a breakdown strength of 398.5 kV/cm for PC with an electrode gap of 0.1 cm under pulses with a rise time of 2–10 μs. PC exhibits better temperature adaptability than DI water, with a freezing point of −49.2 °C, and retains high breakdown strength even at low temperatures [
21,
22,
23]. Under extreme non-uniform field conditions, PC has been found to exhibit polarity effects, with breakdown voltages under positive polarity exceeding those under negative polarity [
24,
25]. In 2021 and 2022, Zhang et al. [
26] and Zicheng et al. [
27] studied the breakdown characteristics of nanomodified PC under microsecond pulses. The results showed that nanomodification is beneficial for improving the breakdown voltage of PC to a certain extent. Moreover, a study reported that PC was used as an energy storage medium in pulse forming lines, satisfying the design requirement for a maximum field strength of 130 kV/cm [
28].
Most studies on the breakdown strength of PC have focused on tens of kV and microsecond pulse conditions. However, nanosecond pulse technology has demonstrated significant value in physical research fields such as Z-pinch and high-power microwaves, as well as in areas such as environmental protection and biomedical engineering. To meet the demands of high-power nanosecond pulse applications and to better simulate real operating conditions, this study investigates the breakdown strength of PC at electrode gaps ranging from 0.3 to 1.5 cm, with a maximum operating voltage of 700 kV and a pulse rise time of approximately 100 ns. The breakdown strength of DI water under nanosecond pulsed voltages is also examined for comparison. This study summarizes the variations in the breakdown strengths of the two liquid dielectrics with respect to the electrode gap and analyzes their distinct breakdown characteristics. These findings provide valuable experimental data supporting the application of PC as a novel energy storage medium for PFLs.
2. Experimental Setup
2.1. High-Voltage Insulation Experimental Platform
The high-voltage insulation experimental platform primarily comprised a Marx generator, load region, charging power supply, and trigger system, as shown in
Figure 1. The Marx generator adopted a 10-stage series structure and employed transformer oil as the dielectric. Each stage consisted of two 100 kV/50 nF capacitors (charged to positive and negative polarities, respectively) and a 200 kV gas switch connected in series. The output terminal of the Marx generator was connected to both a load resistor (90 Ω) and current-limiting resistor (36 Ω). The current-limiting resistor was designed to limit excessive currents during the breakdown of the liquid dielectrics in the test chamber. When the charging voltage reached approximately 65 kV, the Marx generator delivered a pulsed voltage of approximately 700 kV to the high-voltage electrode in the load region through the current-limiting resistor with a rise time of approximately 100 ns.
The operation process of the high-voltage insulation experimental platform was as follows. When the Marx and trigger generators were charged to the designated voltage, the delay synchronizer sent signals to the xenon lamp and Q-switch of the pulsed laser. The laser generated a 532 nm wavelength beam to trigger a gas switch in the trigger generator. It then output two high-voltage pulses (60 kV/30 ns) through two 10 m cables, each activating three gas switches in the first six stages of the Marx generator. Once all the switches were closed, the Marx generator delivered a pulsed high voltage to the load region through a current-limiting resistor.
The load region consisted of a cylindrical chamber with a diameter of 80 cm and length of 45 cm (
Figure 2). A 6 cm thick nylon insulation plate separated the load region from the Marx generator and its current-limiting resistor, while also sealing and isolating the transformer oil in the generator. A high-voltage electrode with a diameter of 5 cm was passed through the center of the nylon plate to introduce the output voltage of the Marx generator into the load region. The chamber wall and end cap were made of stainless steel and equipped with observation windows, pre-installed cable adapters for a Rogowski coil, a voltage divider, and gas inlet/outlet ports. To prevent flashover or breakdown during experiments, SF
6 gas was introduced into the load region.
2.2. Design of the Liquid Dielectrics Test Chamber
As shown in
Figure 3, the liquid dielectric test chamber comprised a cylinder made of MC nylon with a diameter of 24 cm and height of 25 cm, and an upper and lower electrode assembly made of stainless steel. A sphere-to-plate electrode configuration was used in the experiments. A hemispherical electrode with a diameter of 5 cm was positioned at the bottom of the upper electrode assembly and a plate electrode with a diameter of 9 cm was located at the top of the lower electrode assembly. The electrode gap was continuously adjusted between 0 and 1.5 cm using a precision adjustment mechanism integrated into the upper electrode assembly.
Finite element simulations were performed to analyze the electric field distribution in the gap between the upper and lower electrodes. The hemispherical electrode had a sphere radius
R of 2.5 cm, and the plate electrode had a diameter
D of 9 cm and thickness
h of 0.5 cm. The electrode material was stainless steel, and the dielectric surrounding the electrodes was PC (
εr = 65). The voltage of the hemispherical electrode was set to 700 kV, whereas the plate electrode was grounded, as shown in
Figure 4a.
The uniformity of the electric field was quantified using the field non-uniformity factor
f, where a value closer to 1 indicates a more uniform distribution. The field non-uniformity factor is defined as follows:
where
Emax is the maximum electric field strength and
Eavg is the average electric field strength. The electrostatic field distribution was obtained by solving the Poisson equation.
Figure 4b shows the spatial electric field distribution for an electrode gap of 1.5 cm, and
Figure 4c presents the electric field variation along the OA axis. The calculation results indicated that when the electrode gap increased from 0.3 to 1.5 cm, the field nonuniformity factor increased from 1.05 to 1.19. Therefore, the electric field distribution in the electrode gap was considered quasi-uniform.
2.3. Experimental Arrangement
Before the experiment, the breakdown voltage was estimated based on the electrode gap (ranging from 0.3 to 1.5 cm, with 2 mm intervals). The charging voltage of the Marx generator was determined using circuit simulations. In these simulations, the breakdown time, defined as the time interval from the application of a voltage to the occurrence of a breakdown, was approximately 100 ns.
Industrial-grade PC with a resistivity of approximately 50 MΩ·cm was used in the experiment. DI water with a resistivity of approximately 5 MΩ·cm was prepared using specialized purification equipment. Before installation, the electrodes were cleaned with anhydrous ethanol. The electrode gap was calibrated in each experiment using cylindrical PMMA specimens with a thickness tolerance of ±0.02 mm. Prior to liquid filling, the test chamber was evacuated to a negative pressure using a water pump. The valve was then opened to gradually fill the liquid while simultaneously venting air to minimize bubble formation. After filling, the chamber was left to stand for 30 min before being placed into the load region of the high-voltage insulation test platform. The circuit and measurement probes were connected, and the load region was sealed and pressurized with SF6 gas to ensure reliable insulation of the load region.
The high voltage applied to the chamber electrode was measured by using a resistive voltage divider with a division ratio of approximately 1400:1. The current was measured using a Rogowski coil. Both the voltage and current signals were recorded using an oscilloscope in a shielded room. The measurement system uncertainty was within 3%.
Experiments were conducted using positive and negative polarities to study the effect of the pulse voltage polarity on the breakdown characteristics of the two liquids. When the discharge process of the Marx generator was completed, the resulting voltage and current waveforms were recorded for data analysis. Each experiment was repeated five times to ensure data accuracy. For PC, the breakdown voltage or time decreased if the liquid was not replaced after the first breakdown. Thus, the liquid was replaced after each experiment to maintain consistent experimental conditions. In contrast, the breakdown voltage deviation for DI water was relatively small across repeated experiments without liquid replacement, making replacement unnecessary. In addition, four identical electrodes were prepared for this experiment. The electrodes were replaced after five shots, and the removed electrodes were polished for reuse. The average breakdown voltage of the liquid dielectrics was calculated based on the results of the repeated tests.
3. Experimental Results and Analysis
3.1. Breakdown Voltage Results
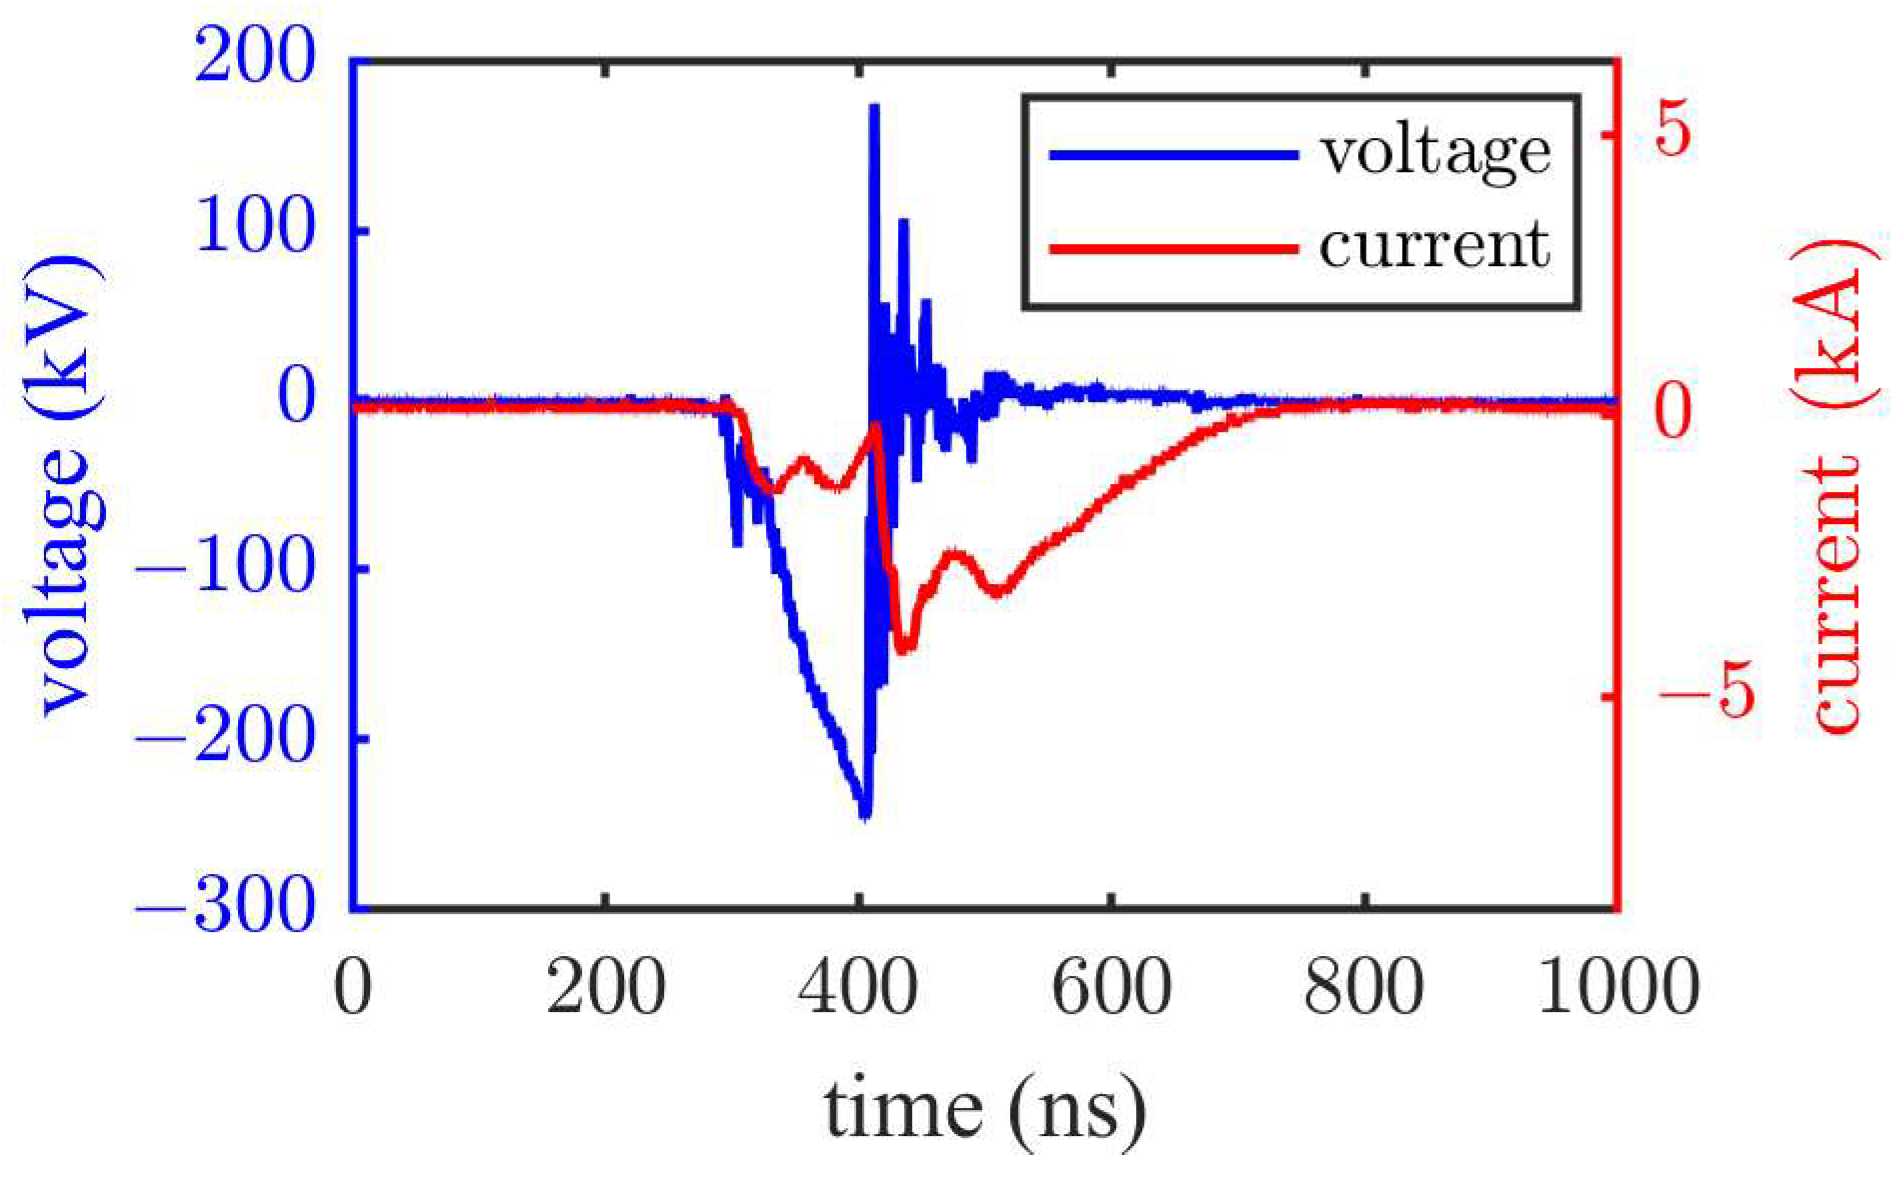
Typical breakdown voltage and current waveforms are shown in
Figure 5, corresponding to the results of the 0.5 cm electrode gap under a negative polarity pulse voltage in PC. The breakdown time of the electrode gap was approximately 100 ns. Following the breakdown the voltage dropped rapidly, accompanied by a sharp increase in the current. Note that the primary objective of this experiment was to study the breakdown characteristics under pulses of approximately 100 ns. Therefore, all tests were conducted with a voltage rise time of approximately 100 ns, whereas the voltage steepness increased with increasing voltage.
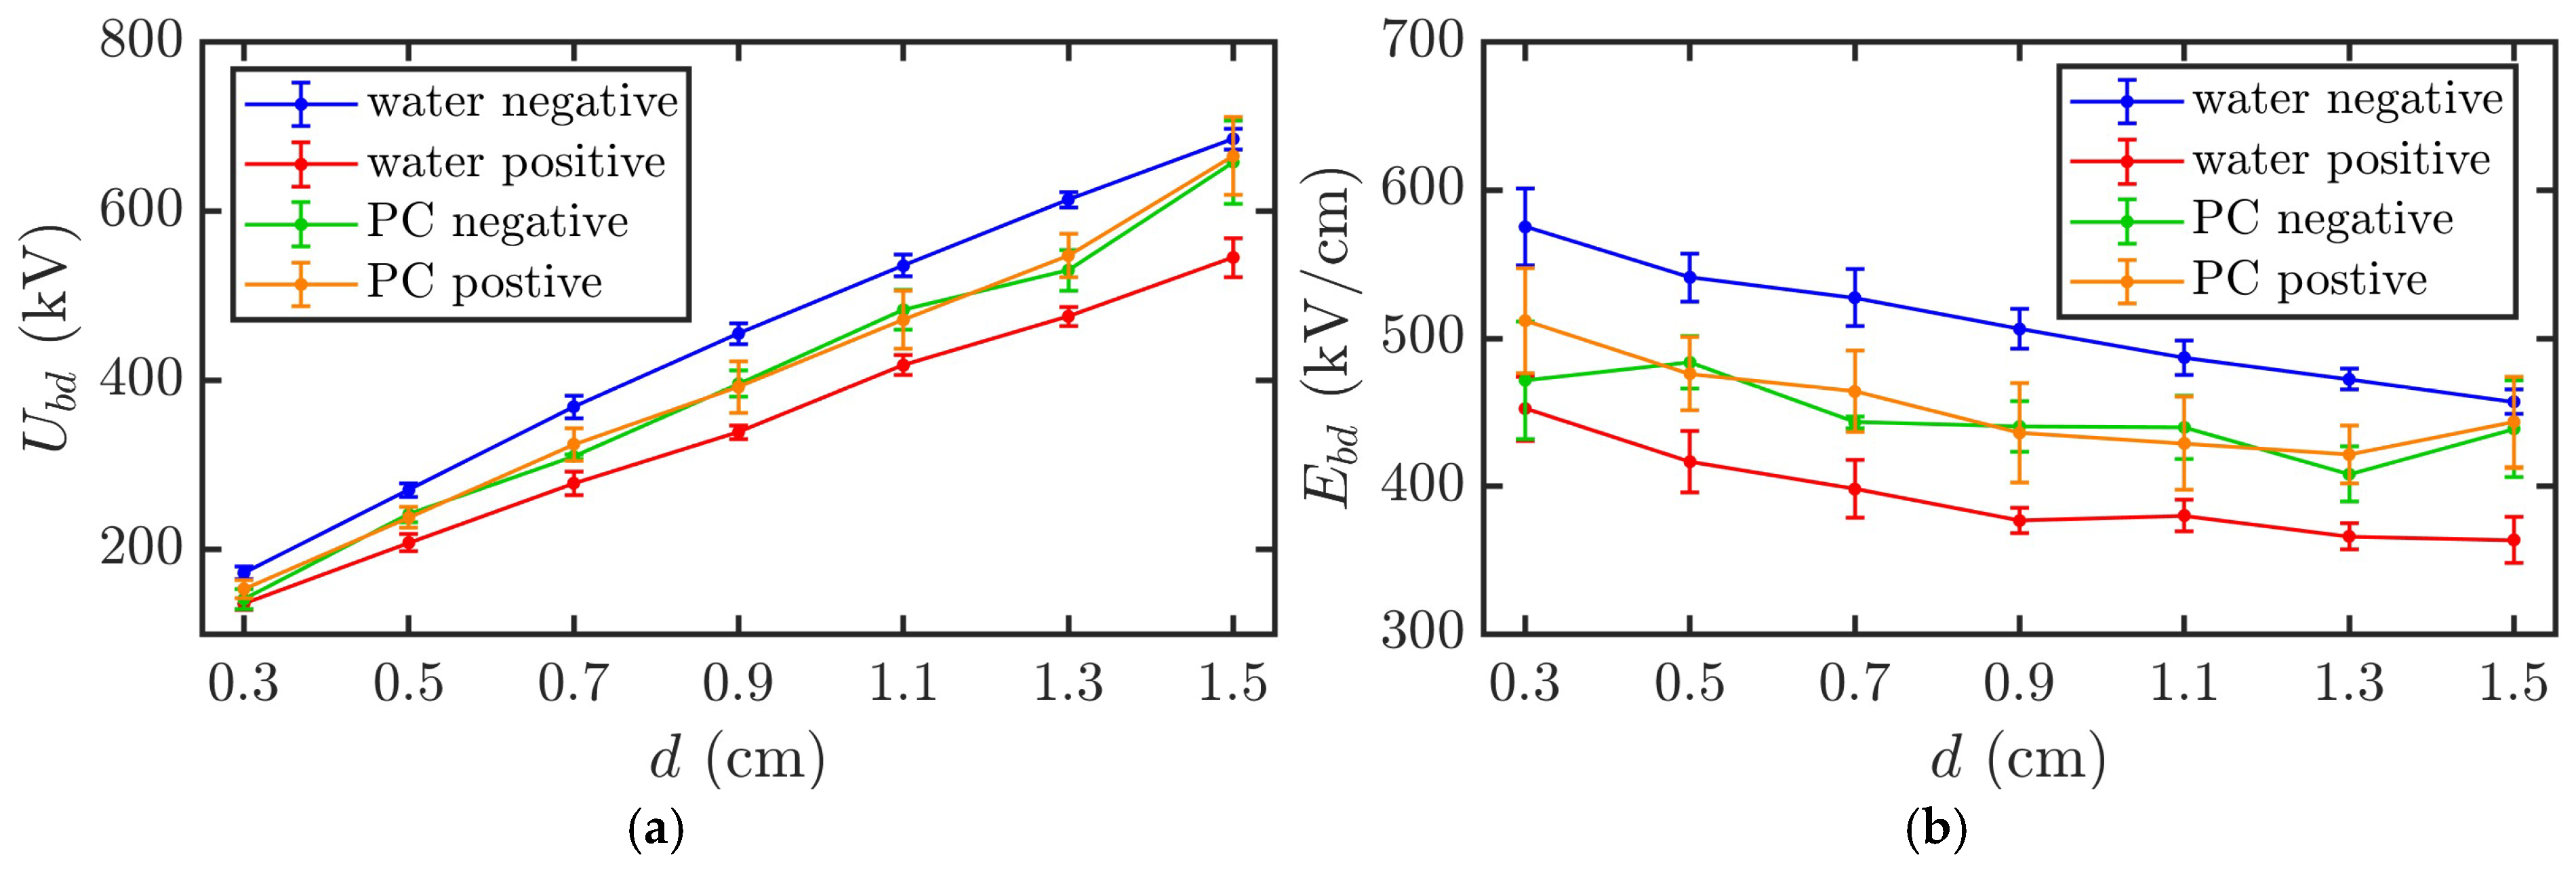
Figure 6 illustrates the variations in the breakdown voltage
Ubd and breakdown field strength
Ebd with the electrode gap
d for PC and DI water under positive and negative polarity pulses. Given a quasi-uniform electric field distribution between the electrodes, the breakdown field strength was approximated as
Ebd =
Ubd/
d. For DI water, the breakdown voltage represents the average value over five consecutive experiments without liquid replacement. For PC, the breakdown voltage refers to the average first breakdown voltage over five experiments with liquid replacement because the breakdown voltage does not recover to the original level after the first breakdown. It is important to note that, owing to the difficulty in precisely controlling the breakdown time to exactly 100 ns, the data in
Figure 6 correspond to breakdown times within the range of 95–105 ns.
As shown in
Figure 6, for the DI water, when the electrode gap increased from 0.3 to 1.5 cm, the average breakdown voltage under negative polarity pulses increased from 1.7 × 10
2 to 6.9 × 10
2 kV, with a maximum standard deviation of approximately 5.0%. Moreover, the average breakdown field strength decreased from 5.8 × 10
2 to 4.6 × 10
2 kV/cm. Under positive polarity pulses, the average breakdown voltage increased from 1.4 × 10
2 to 5.5 × 10
2 kV, with a maximum standard deviation of approximately 4.5%. The average breakdown field strength decreased from 4.5 × 10
2 to 3.6 × 10
2 kV/cm.
For the PC, when the electrode gap increased from 0.3 to 1.5 cm, the average breakdown voltage under negative polarity pulses increased from 1.4 × 10² to 6.6 × 10² kV, with a maximum standard deviation of approximately 7.7%. Moreover, the average breakdown field strength decreased from 4.7 × 10² to 4.4 × 10² kV/cm. Under positive polarity pulses, the average breakdown voltage increased from 1.5 × 10² to 6.6 × 10² kV, with a maximum standard deviation of approximately 8.4%. The average breakdown field strength decreased from 5.1 × 10² to 4.4 × 10² kV/cm.
The breakdown voltage of PC obtained in this experiment was generally consistent with the 298–555 kV value (electrode gap of 0.64–1.37 cm) reported by Clark et al. [
17]. The breakdown field strength of PC obtained was slightly higher than the value of 398.5 kV/cm (electrode gap of 0.1 cm) reported by Xu et al. [
20] but differed significantly from the value of 2.2 MV/cm (electrode gap of 0.02 cm) reported by Kolb et al. [
18] and Xiao et al. [
19]. This discrepancy is speculated to be caused by differences in the experimental conditions such as the electrode geometry, pulse duration, and liquid purity.
The breakdown voltages for both PC and DI water increased nearly linearly with the electrode gap, whereas the breakdown field strength gradually decreased. Furthermore, the positive polarity breakdown voltage and field strength were significantly lower for DI water than those under negative polarity. In contrast, the positive and negative polarity breakdown voltages and field strengths were nearly identical for PC. In addition, the standard deviation of the breakdown voltage of PC was slightly larger than that of DI water.
3.2. Fitting the Empirical Formula for Breakdown Field Strength
The empirical formula proposed by Martin [
3] indicates that the breakdown field strength
Ebd of DI water depends on the pulse duration (time taken to reach 63% of the peak voltage)
t and electrode area
A:
Here,
k+ and
k− are 0.3 and 0.6, respectively.
Ebd is expressed in kV/cm,
t in μs, and
A in cm
2. However, the Martin formula [
3] does not establish the relationship between
Ebd and the electrode gap
d.
This study focused more on the influence of insulation distance variation on breakdown characteristics. Therefore, the empirical formula for the gas breakdown field strength was used to derive the relationship between the breakdown field strength
Ebd and electrode gap
d [
3]:
where
p is expressed in atmospheres, and
d is expressed in cm. This formula indicates that
Ebd is proportional to the atmospheric pressure
p and inversely proportional to the electrode gap
d.
Based on the results in
Figure 6 and Equation (3), it is reasonable to assume that the breakdown field strength
Ebd of the liquid dielectrics is inversely proportional to the electrode gap
d, which is expressed as:
where
a is the exponential influence factor and
k is the linear influence factor. Taking the logarithm of both sides of Equation (4) yields:
Substituting the data points (
Ebdi,
di) (
i = 1, 2, 3…) into Equation (5) generates a system of linear equations:
expressed in matrix form as:
where:
The solution is given by [
29]:
Solving this system yields the fitted curve functions for the breakdown field strength
Ebd of DI water as a function of the electrode gap
d:
For PC, the fitted curve function is:
The breakdown characteristics of PC under positive and negative polarities are almost identical and can be treated as follows:
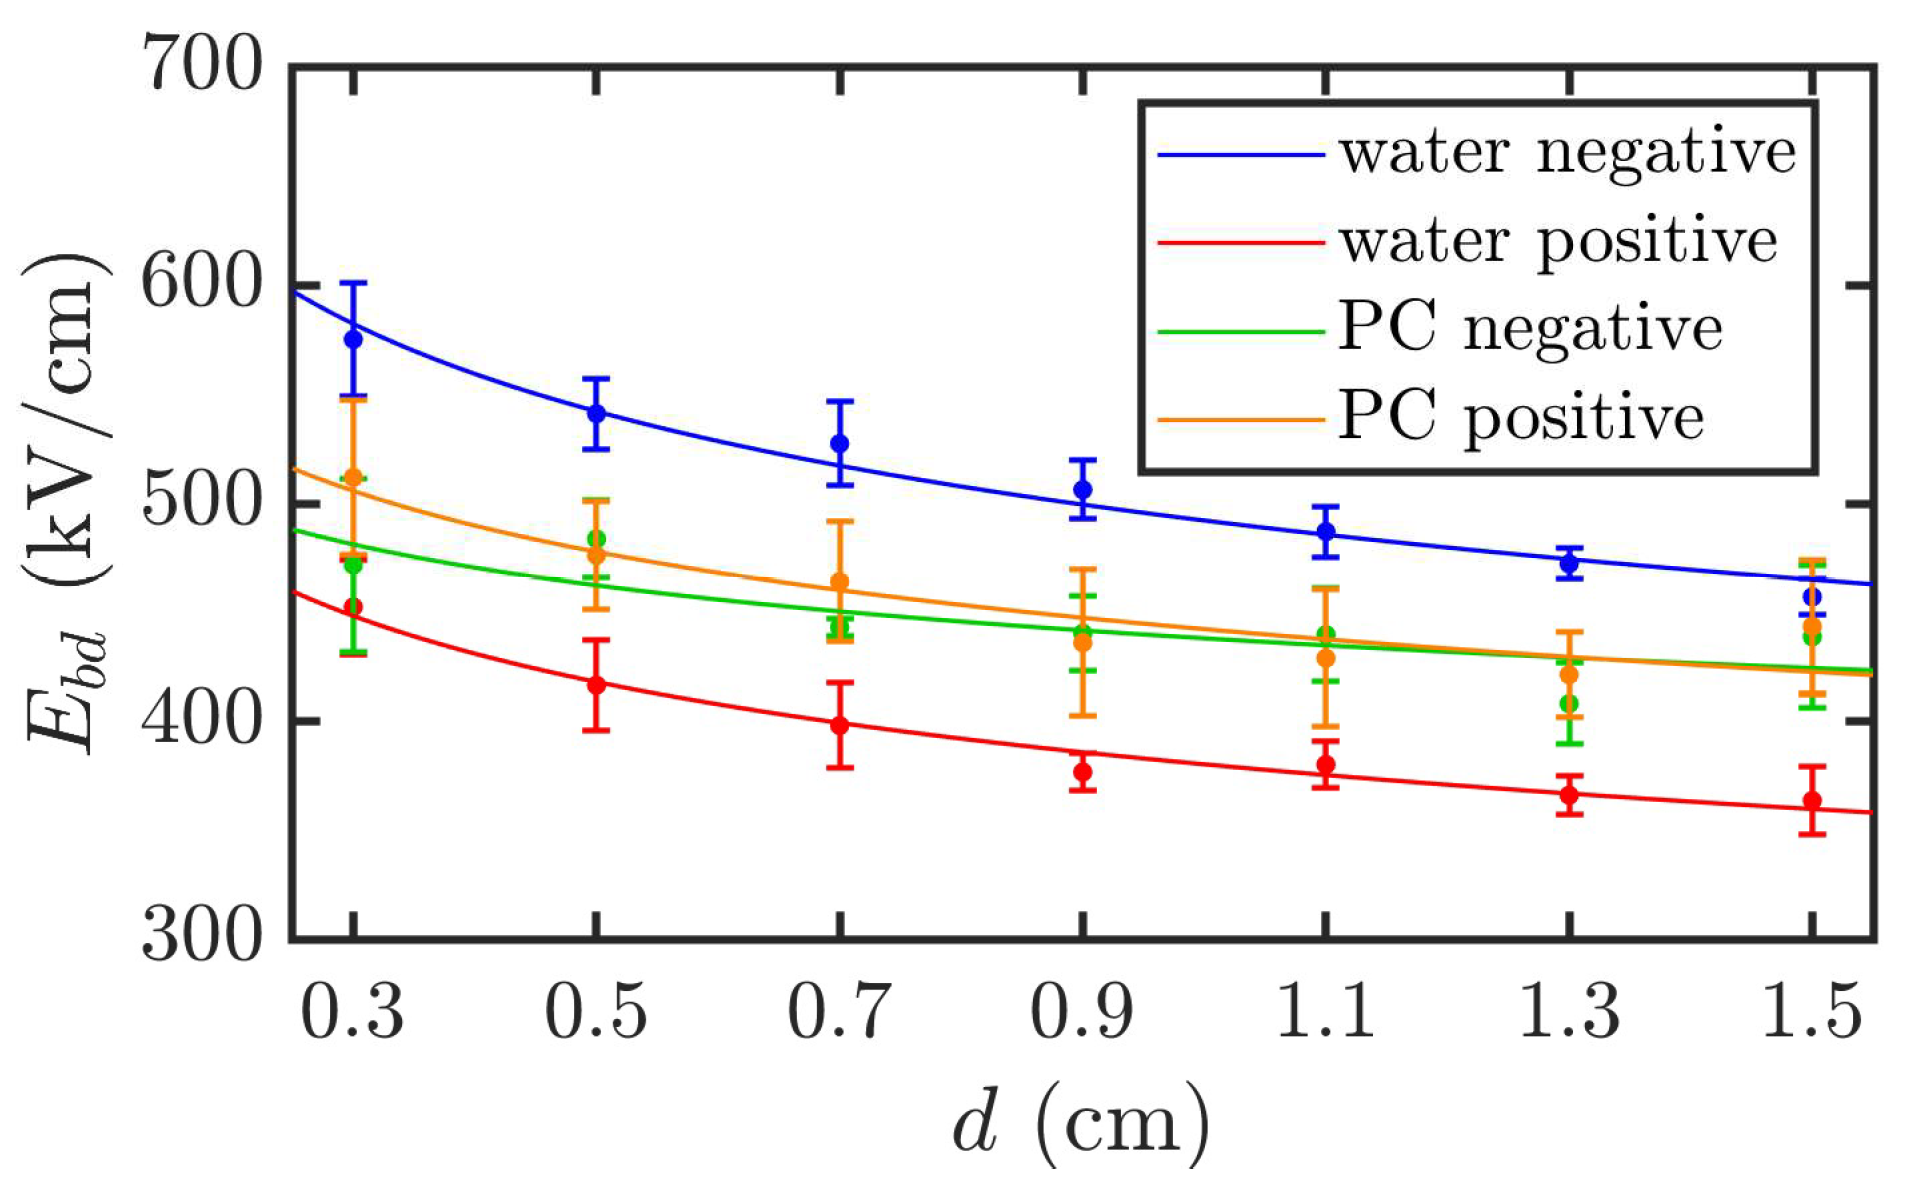
This indicates that the breakdown field strength decreases exponentially as the electrode gap increases. For DI water, the linear influence factor k is 492 under negative polarity and 380 under positive polarity, which is approximately 77% of the value for negative polarity. The linear influencing factor for PC is 442. The exponential influence factor a for DI water is 0.14 under both polarities, while that for PC is 0.09.
The fitted curves are shown in
Figure 7. The smaller exponential influence factor of PC compared to that of DI water indicates that its breakdown field strength is less sensitive to the electrode gap, exhibiting a more gradual decreasing trend.
3.3. Influence of Polarity on Breakdown Field Strength
Equation (10) indicates that the breakdown field strength of DI water under negative polarity is higher than that under positive polarity, which is consistent with the conclusion derived from Martin’s empirical formula expressed in Equation (2). However, in the experimental results of this study, the negative polarity breakdown field strength was approximately 1.29 times that of the positive polarity, which differs from Martin’s conclusion of 2 times [
3]. Equation (12) shows that the positive and negative polarity breakdown voltages and field strengths of PC are essentially the same, which contrasts with the conclusion reported in the literature [
24,
25] that the positive polarity breakdown field strength is higher than the negative polarity strength.
Note that the experiments conducted by Martin [
3] and those reported in the literature [
24,
25] were performed under nonuniform field conditions, whereas the experiments in this study were conducted under quasi-uniform field conditions. Therefore, this difference is speculated to be caused by differences in the electric field distribution. Based on previous studies on the polarity effect of liquid breakdown, the polarity effect may be qualitatively explained from two perspectives:
- (1)
Influence of electrode injection
Nitta and Aihara [
30] noted that free electrons injected from the electrode into the liquid are captured with a certain probability by neutral molecules to form negative ions. These negative ions accumulate near the cathode, forming negative polarity space charges, which weaken the electric field near the cathode. This mechanism explains why the breakdown voltage at the cathode is higher than that at the anode.
Through the detection of space charge and electric field distributions in water, Zahn and Takada [
31] found that when an electric field is applied, the space charge in water exhibits bipolar injection; that is, positive polarity space charges are injected from the anode, whereas negative polarity space charges are injected from the cathode, with both distributions being asymmetric. This indicates that electrode injection significantly affects the electric field distribution in water, indirectly supporting the contribution of electrode injection to the polarity effect.
- (2)
Difference in mobility between electrons and ions
Schmidt et al. [
32] and Woodworth et al. [
33] conducted studies on the mechanisms of liquid breakdown under pulse conditions of 0.9–1.5 μs and 100–200 ns, respectively.
The higher breakdown field strength under negative polarity in liquids is primarily attributed to the significant differences in the mobility of electrons and ions, which results in asymmetry in the space charge effects. According to Schmidt, under negative polarity (with needle-negative and needle-plate electrodes), the mobility of electrons is much higher than that of positive ions. Electrons rapidly diffuse into the liquid away from the needle electrode, making it difficult for negative space charges to accumulate near the needle. The rapid diffusion of electrons weakens the local field strength, which requires a higher electric field to achieve breakdown. Under positive polarity (needle-positive), electrons are extracted from the liquid into the anode, leaving behind positive ions with lower mobility near the anode. The accumulation of positive ions leads to the formation of positive space charges near the anode, which enhances the local field strength and reduces the breakdown field strength.
Through numerical simulations, Woodworth further elucidated the influence of the mobility differences between electrons and ions on the breakdown voltage and the role of microbubble effects. Their findings showed that field emissions and impact ionization within microbubbles were the primary breakdown mechanisms. Under negative polarity, the rapid diffusion of electrons significantly reduces the charge density near the microbubbles, thereby weakening the local electric field. In contrast, under positive polarity, the low mobility of positive ions causes charge accumulation, which enhances the local electric field near the microbubbles.
3.4. Insulation Recovery Capability of PC and DI Water
During the experiments, significant differences were observed in the insulation recovery capabilities of PC and DI water after the first breakdown. The breakdown strength of DI water remained nearly constant across five consecutive shots. In contrast, for PC, the first breakdown voltage was the highest, whereas the breakdown voltages for the subsequent four shots stabilized but exhibited a slight decline compared to the first shot.
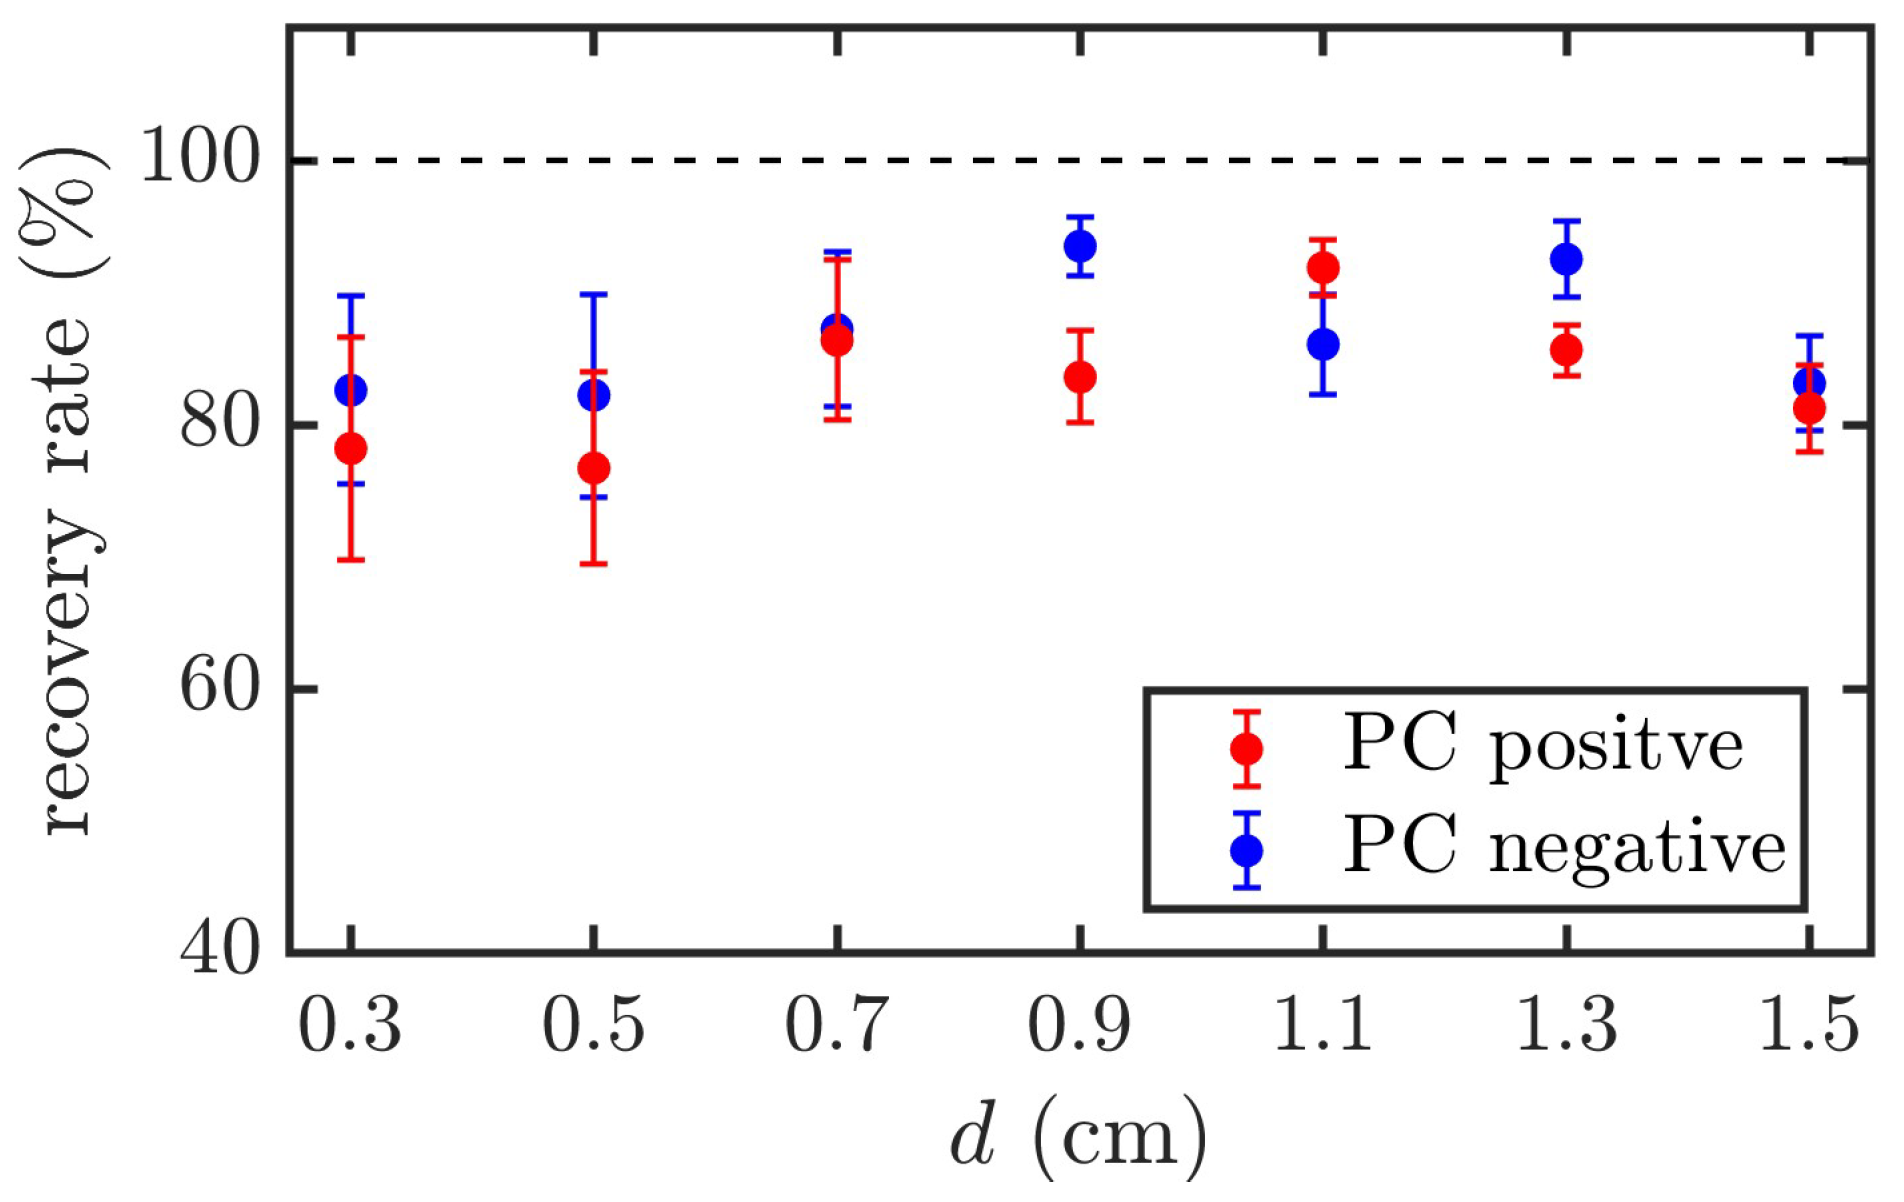
The recovery rate of PC is defined as follows: Recovery Rate = Avg (last four shots)/First shot. The recovery rates under both positive and negative polarity voltages for different electrode gaps are shown in
Figure 8. The results show that the average breakdown voltage of the last four shots decreased by approximately 10–20% compared with the first breakdown voltage, with a maximum standard deviation of approximately 8.4%.
Xiao [
19] attributed this phenomenon to the generation of by-products during the breakdown process, as identified through the spectral analysis of polypropylene carbonate. The presence of polymer particles in the liquid introduces a field-enhancement effect owing to the difference in dielectric constants between the polymer particles and surrounding liquid, reducing the breakdown field strength. This effect does not occur in DI water, in which the primary factor leading to a reduction in the breakdown field strength is the formation of bubbles. These bubbles typically dissipate within 1 ms of formation, allowing the breakdown strength to recover almost completely.

