Article

Research on Internal Flow Uniformity of U-Flow Pattern and Z-Flow Pattern SOFC Stacks Based on Numerical Analysis

1
Department of Mechanical Engineering, Hannam University, 70 Hannam-ro, Daedeok-gu, Daejeon 34430, Republic of Korea
2
Korea Institute of Energy Research (KIER), 152 Gajeong-ro, Yuseong-gu, Daejeon 34129, Republic of Korea
*
Authors to whom correspondence should be addressed.
Energies 2025, 18(7), 1682; https://doi.org/10.3390/en18071682
Submission received: 4 March 2025 / Revised: 20 March 2025 / Accepted: 25 March 2025 / Published: 27 March 2025

Abstract

:
This study analyzes flow uniformity in U-flow pattern and Z-flow pattern solid oxide fuel cell (SOFC) stacks, assessing their performance under different stack heights and rates of fuel/air usage. Both configurations achieved satisfactory flow distribution uniformity in the anode region at the 1 kWe scale, especially with the Z-flow design demonstrating enhanced stability. However, as stack height increased, particularly at 3 kWe, flow uniformity decreased significantly. In the cathode flow region, uniformity was highly sensitive to changes in air utilization rate, with lower air utilization causing more pronounced reductions in flow uniformity for both stack types. Increasing the height of the stack tends to reduce flow uniformity, whereas higher reactant utilization promotes more uniformity. Moreover, flow uniformity strongly correlates with the pressure drop ratio in the core area, where a higher ratio indicates better uniformity. At 75% fuel utilization, the anode flow region of the U-flow pattern 3 kWe stack exhibited excessively high local fuel utilization in the unit cell with the lowest mass flow rate, implying a risk of fuel depletion due to insufficient supply at that height. Overall, the Z-flow pattern stack showed better performance in the anode flow region, particularly at higher capacities, while the U-flow pattern stack performed slightly better in the cathode flow region under low air utilization conditions. These findings indicate that the Z-flow pattern stack is better suited for high-power applications.

1. Introduction

Solid oxide fuel cells (SOFCs) are devices capable of directly converting chemical energy into electrical energy [1]. SOFC-GT power generation systems are capable of achieving electrical efficiencies of 60% or higher [2,3], and they offer greater flexibility in fuel utilization and on-demand assembly compared to other fuel cell types. These advantages make SOFCs widely applicable in various fields, such as energy storage, distributed power generation, combined heat and power (CHP), and marine propulsion [4,5,6]. Among the different configurations, flat-plate SOFCs are particularly favored due to their ease of assembly and lower cost. Typically, flat-plate SOFC unit cells are stacked vertically in series to form an SOFC stack [7,8,9]. However, the number of unit cells in a stack, adjusted to meet power requirements, can affect the uniformity of gas flow within the stack. SOFC stacks operate within a temperature range of 600 °C to 1000 °C, and non-uniform temperature distribution, along with the resulting temperature gradients, are critical factors that can lead to electrode and electrolyte failure or fracture. Among the various factors contributing to these temperature gradients, the direction and uniformity of gas flow are particularly crucial [10,11,12,13,14,15].
Computational fluid dynamics (CFD) has been widely applied in various engineering fields, including wind turbine blade design, microfluidic chips, and advanced manufacturing processes [16,17]. Its powerful visualization capabilities enable the representation of intricate flow details that are often difficult to observe experimentally [18,19]. In the case of SOFC stacks, the internal structure of SOFC stacks is complex, making it difficult to assess internal flow conditions through experimental measurements, especially at high operating temperatures [20,21]. Consequently, most researchers in the field of SOFC structural optimization and flow analysis rely on numerical analysis and computational fluid dynamics to simulate and analyze stacks or unit cells, and this approach has been validated through numerous studies [22,23,24,25]. Lin et al. [26] conducted a simulation analysis on thermal uniformity in SOFCs and recommended maintaining an aspect ratio of 1 or greater for the gas channels in unit cells during cell design. Kim et al. [27] performed a numerical analysis of a three-dimensional model of an SOFC stack consisting of four anode-supported planar unit cells with external manifold configurations, investigating flow field uniformity, stack performance, and transport phenomena. Their results indicated that under varying flow rates and fuel utilization conditions, performance was slightly better at lower fuel utilization rates. Similarly, Dai et al. [28] developed three-dimensional computational fluid dynamics (CFD) models for two different flow configurations, namely U-type and Z-type. Each stack consisted of 25 unit cells, and the models were used to compare the flow and species distribution characteristics within the stacks. The results indicated that the U-type configuration is a more suitable choice for air-flow in PCFCs, as it achieves higher air and oxygen feeding qualities. However, the study did not analyze the fuel-flow characteristics. Ashraf et al. [29] designed two types of separators and performed a numerical analysis of a stack consisting of five unit cells. They found that the rectangular separators led to higher flow uniformity, while circular guiding vane separators resulted in more uniform temperature and current density distribution. Gong et al. [30] studied thermal and flow distribution in three different flow fields and proposed a multi-population genetic algorithm to achieve more uniform temperature distribution among unit cells. Although most CFD studies on SOFCs are based on simplified unit cell models or stacks with fewer unit cells, three-dimensional models can more accurately represent the internal flow dynamics influenced by structural design, making detailed high-fidelity models equally essential [31,32,33,34].
In our previous study [35], detailed CFD simulations were conducted to analyze the U-flow pattern stack. However, that study focused solely on a single model configuration, failing to comprehensively reveal the relative advantages and disadvantages of different flow designs. Therefore, this work extends the analytical scope by performing an in-depth comparison of two flow designs, including the U-flow pattern. Furthermore, to more accurately characterize the flow behavior, the present study employs an unsimplified model and systematically examines the flow uniformity within the stack under varying fuel/air utilization conditions.

2. Simulation and Analysis Methods

2.1. Models and Fluid Regions

Figure 1 and Figure 2 present the 3D models of the 1 kWe U-flow pattern (Figure 1a) and Z-flow pattern (Figure 2a) solid oxide fuel cell stacks, developed by the Korea Institute of Energy Research (KIER). Both models incorporate 40 serially connected unit cells. Figure 1a,b illustrate the inflow and outflow directions of air and fuel, as well as the internal flow paths within the U-flow pattern stack. Fuel enters the stack through the inlet pipe at the bottom and is distributed to the unit cells via the inlet manifold, which consists of the inlet channels of the cell group. Finally, the fuel flows through the unit cells, converges in the outlet manifold composed of the outlet channels of the cell group, and exits the stack. The airflow path is similar to that of the fuel, as detailed in Figure 1c. The fluid region within the stack is divided into three sections: inlet manifold, core region, and outlet manifold. Due to its flow path resembling an inverted “U” shape, this configuration is referred to as the U-flow pattern stack.
The flow path of the Z-flow pattern stack, shown in Figure 2, differs from that of the U-flow pattern stack. The most noticeable difference lies in the positioning of the air and fuel inlets and outlets: in the Z-flow pattern stack, the inlets and outlets are located on opposite sides of the stack, whereas in the U-flow pattern stack, both are situated at the bottom. Another significant difference is that in the Z-flow pattern stack, the air and fuel inlets are positioned at different vertical heights. Air enters the stack through the top inlet pipe, is distributed to the unit cells via the inlet manifold, participates in the reaction, and then converges at the outlet manifold and exits the stack through the outlet pipe. In contrast, fuel enters the stack from the inlet pipe at the bottom, is distributed to the unit cells for the reaction, and exits the stack through the fuel outlet pipe at the top. Figure 2c provides a detailed illustration of this flow path and the three distinct regions it encompasses. For the purposes of subsequent analysis and comparison, the unit cell located at the bottom of the cell group is designated as Cell 1, with cell numbers increasing sequentially from the bottom to the top.
The main objective of this study is to analyze the flow characteristics within U-flow and Z-flow pattern stacks and compare their flow uniformity. Consequently, solid regions are not considered in the analysis. Additionally, the flow uniformity within different flow patterns was compared under varying stack capacities and reactant utilization rates. For planar SOFCs, a common method to increase stack capacity is to add more unit cells. Stack capacities of 1–3 kWe, which are commonly used, were selected as comparison parameters. The 3D models used in this study are shown in Figure 3 and Figure 4. Figure 3a and Figure 4a depict the stack models for U-flow and Z-flow patterns, respectively, at different capacities, clearly showing the height differences among stacks. The 1 kWe stack consists of 40 unit cells, while the 2 kWe and 3 kWe stacks are composed of 80 and 120 unit cells, respectively. Table 1 lists the key parameters of the stacks and the variables used for comparative analysis. Figure 3b and Figure 4b illustrate the fluid region models of the stacks for the two different flow patterns. The height of the fluid region model varies with the number of unit cells in the stack. The differences in gas inlet and outlet positions and flow paths between the U-flow and Z-flow pattern stacks are clearly visible in Figure 3b and Figure 4b.

2.2. Grid Independence Verification and Boundary Conditions

Before simulation and analysis, meshing of the model is required. The mesh generation and CFD software used in this study was Star CCM+ 2302 (Siemens Digital Industries Software, Plano, TX, USA) [36]. The built-in mesh generation functionality of Star CCM+ was employed to create the mesh for the fluid region models of the SOFC stacks, and appropriate boundary layers were generated for all models. Details regarding the meshing process can be found in reference [35]. To minimize the influence of the mesh on the computational results, a mesh independence verification was performed. The total pressure drop in the cathode fluid region of the 1 kWe stack at an air utilization rate of 30% was selected as the validation criterion. CFD simulations were conducted using meshes of three different sizes, and the resulting differences were compared. The three mesh sizes were labeled as fine mesh (N1), base mesh (N2), and coarse mesh (N3). The formula used to quantify the differences in the final results is as follows:
G C I f i n e 21 = 1.25 e a 21 r 21 p 1 ,
where G C I f i n e 21 is the fine grid convergence index, e a 21 is the approximate relative error, and r 21 p is the grid refinement factor. The detailed method for GCI validation is described in reference [37]. The results of the mesh independence verification are listed in Table 2, and the comparison of total pressure drops used for the validation is shown in Figure 5a. It can be observed that the GCI values for both the U−flow and Z−flow pattern models are less than 5%, indicating that the base mesh (N2) has a negligible effect on the CFD results and that the results are reliable. Therefore, the N2 mesh was adopted as the standard for mesh generation in subsequent models. In the mesh settings for the 1 kWe cathode fluid region, the maximum mesh size is 5 mm, the first−layer boundary mesh thickness is 0.39 mm, the boundary layer growth rate is 1.2, and the boundary layer consists of 10 layers.
In both the mesh independence validation and subsequent simulation analyses, consistent boundary conditions were applied. The outlet surface of the stack fluid region model was set as a pressure outlet, while all wall boundaries were specified as no-slip wall conditions. The inlet was defined using a mass flow inlet boundary condition. Since the study includes analyses with varying reactant utilization rates as a variable, the mass flow rate at the inlet differed under different conditions. The formula for calculating the mass flow rate at the inlet is as follows [38]:
m ˙ a i r = N I M a i r 4 F U O 2 x ,
m ˙ H 2 = N I M H 2 2 F U H 2 .
where N represents the number of unit cells in the stack model. As previously mentioned, the 1 kWe stack contains 40 unit cells, while the 2 kWe and 3 kWe stacks contain 80 and 120 unit cells, respectively. M a i r and M H 2 denote the molar masses of air and hydrogen, respectively. x is the volume fraction of oxygen in air, and F is the Faraday constant. U H 2 and U O 2 refer to the utilization rates of hydrogen and oxygen, respectively. The reactant utilization rates used in this study are listed in Table 1.

2.3. Fluid Regions Computational Model Selection and Assumptions

Based on the mass flow Formulas (2) and (3), the inlet mass flow rates under different stack capacities and reactant utilization conditions can be calculated. Using these calculated values, the Reynolds numbers at the stack inlet can then be determined using the Reynolds number formula. The calculation results are presented in Table 3. As shown in Table 3, the Reynolds numbers at the inlet of the anode fluid model are all below 2300, while those calculated for the cathode fluid model are consistently higher than those of the anode fluid region. Previous studies have suggested that the cathode fluid region can be considered as turbulent flow, whereas the anode fluid region is treated as laminar flow [39,40,41]. Although the Reynolds numbers at the cathode fluid region inlet listed in Table 3 are below 2300 when the oxygen utilization rate is 50%, due to the complexity of the internal flow channel structure of the stack, it cannot be excluded that the air will generate a vortex at the corners; thus, it is reasonable to consider the cathode fluid region as the presence of turbulent flow in this study. In this study, the anode fluid region is modeled using a laminar flow model, while the cathode fluid region is modeled using the realizable k–ε turbulence model. The realizable k–ε model provides a more accurate representation of turbulence structure evolution and has been widely validated for its balance of computational accuracy and resource efficiency [33,42,43]. The laminar flow model is described by the Navier–Stokes equations (Equations (4) and (5)), while the realizable k–ε turbulence model is represented by Equations (6) and (7).
ρ t + · ρ u = 0 ,
( ρ u ) t + · ρ u u = · p + τ ̿ ,
( ρ k ) t + ( ρ k u j ) x i = x j [ ( μ + μ t σ k ) k x j ] + G k + ρ ε ,
( ρ ε ) t + ( ρ ε u i ) x i = x j [ ( μ + μ t σ ε ) ε x j ] + ρ C 1 E ε ρ C 2 ε 2 k + v ε .
Here, ρ is the density, is the gradient operator, u is the velocity vector, t is the time, τ ̿ is the stress tensor, and μ is the viscosity. Equation (4) represents the continuity equation, while Equation (5) describes the conservation of momentum. In the turbulence model, G k denotes the generation of turbulent kinetic energy due to the gradient of the mean velocity, C 1 and C 2 are turbulence model coefficients. The parameters σ k and σ ε are the turbulent Prandtl numbers for k and ε , respectively, where k represents the turbulent kinetic energy and ε is the turbulent dissipation rate [36].
Considering that the primary objective of this study is to comprehensively compare flow uniformity in the U-flow and Z-flow pattern designs, certain assumptions were made in the simulation analysis to highlight the key goals of this research while conserving computational resources. The assumptions are as follows: (1) The effects of electrochemical reactions and heat transfer are neglected in the simulation analysis; (2) the gas is assumed to be incompressible and with stable physical and chemical properties.

3. Results and Discussion

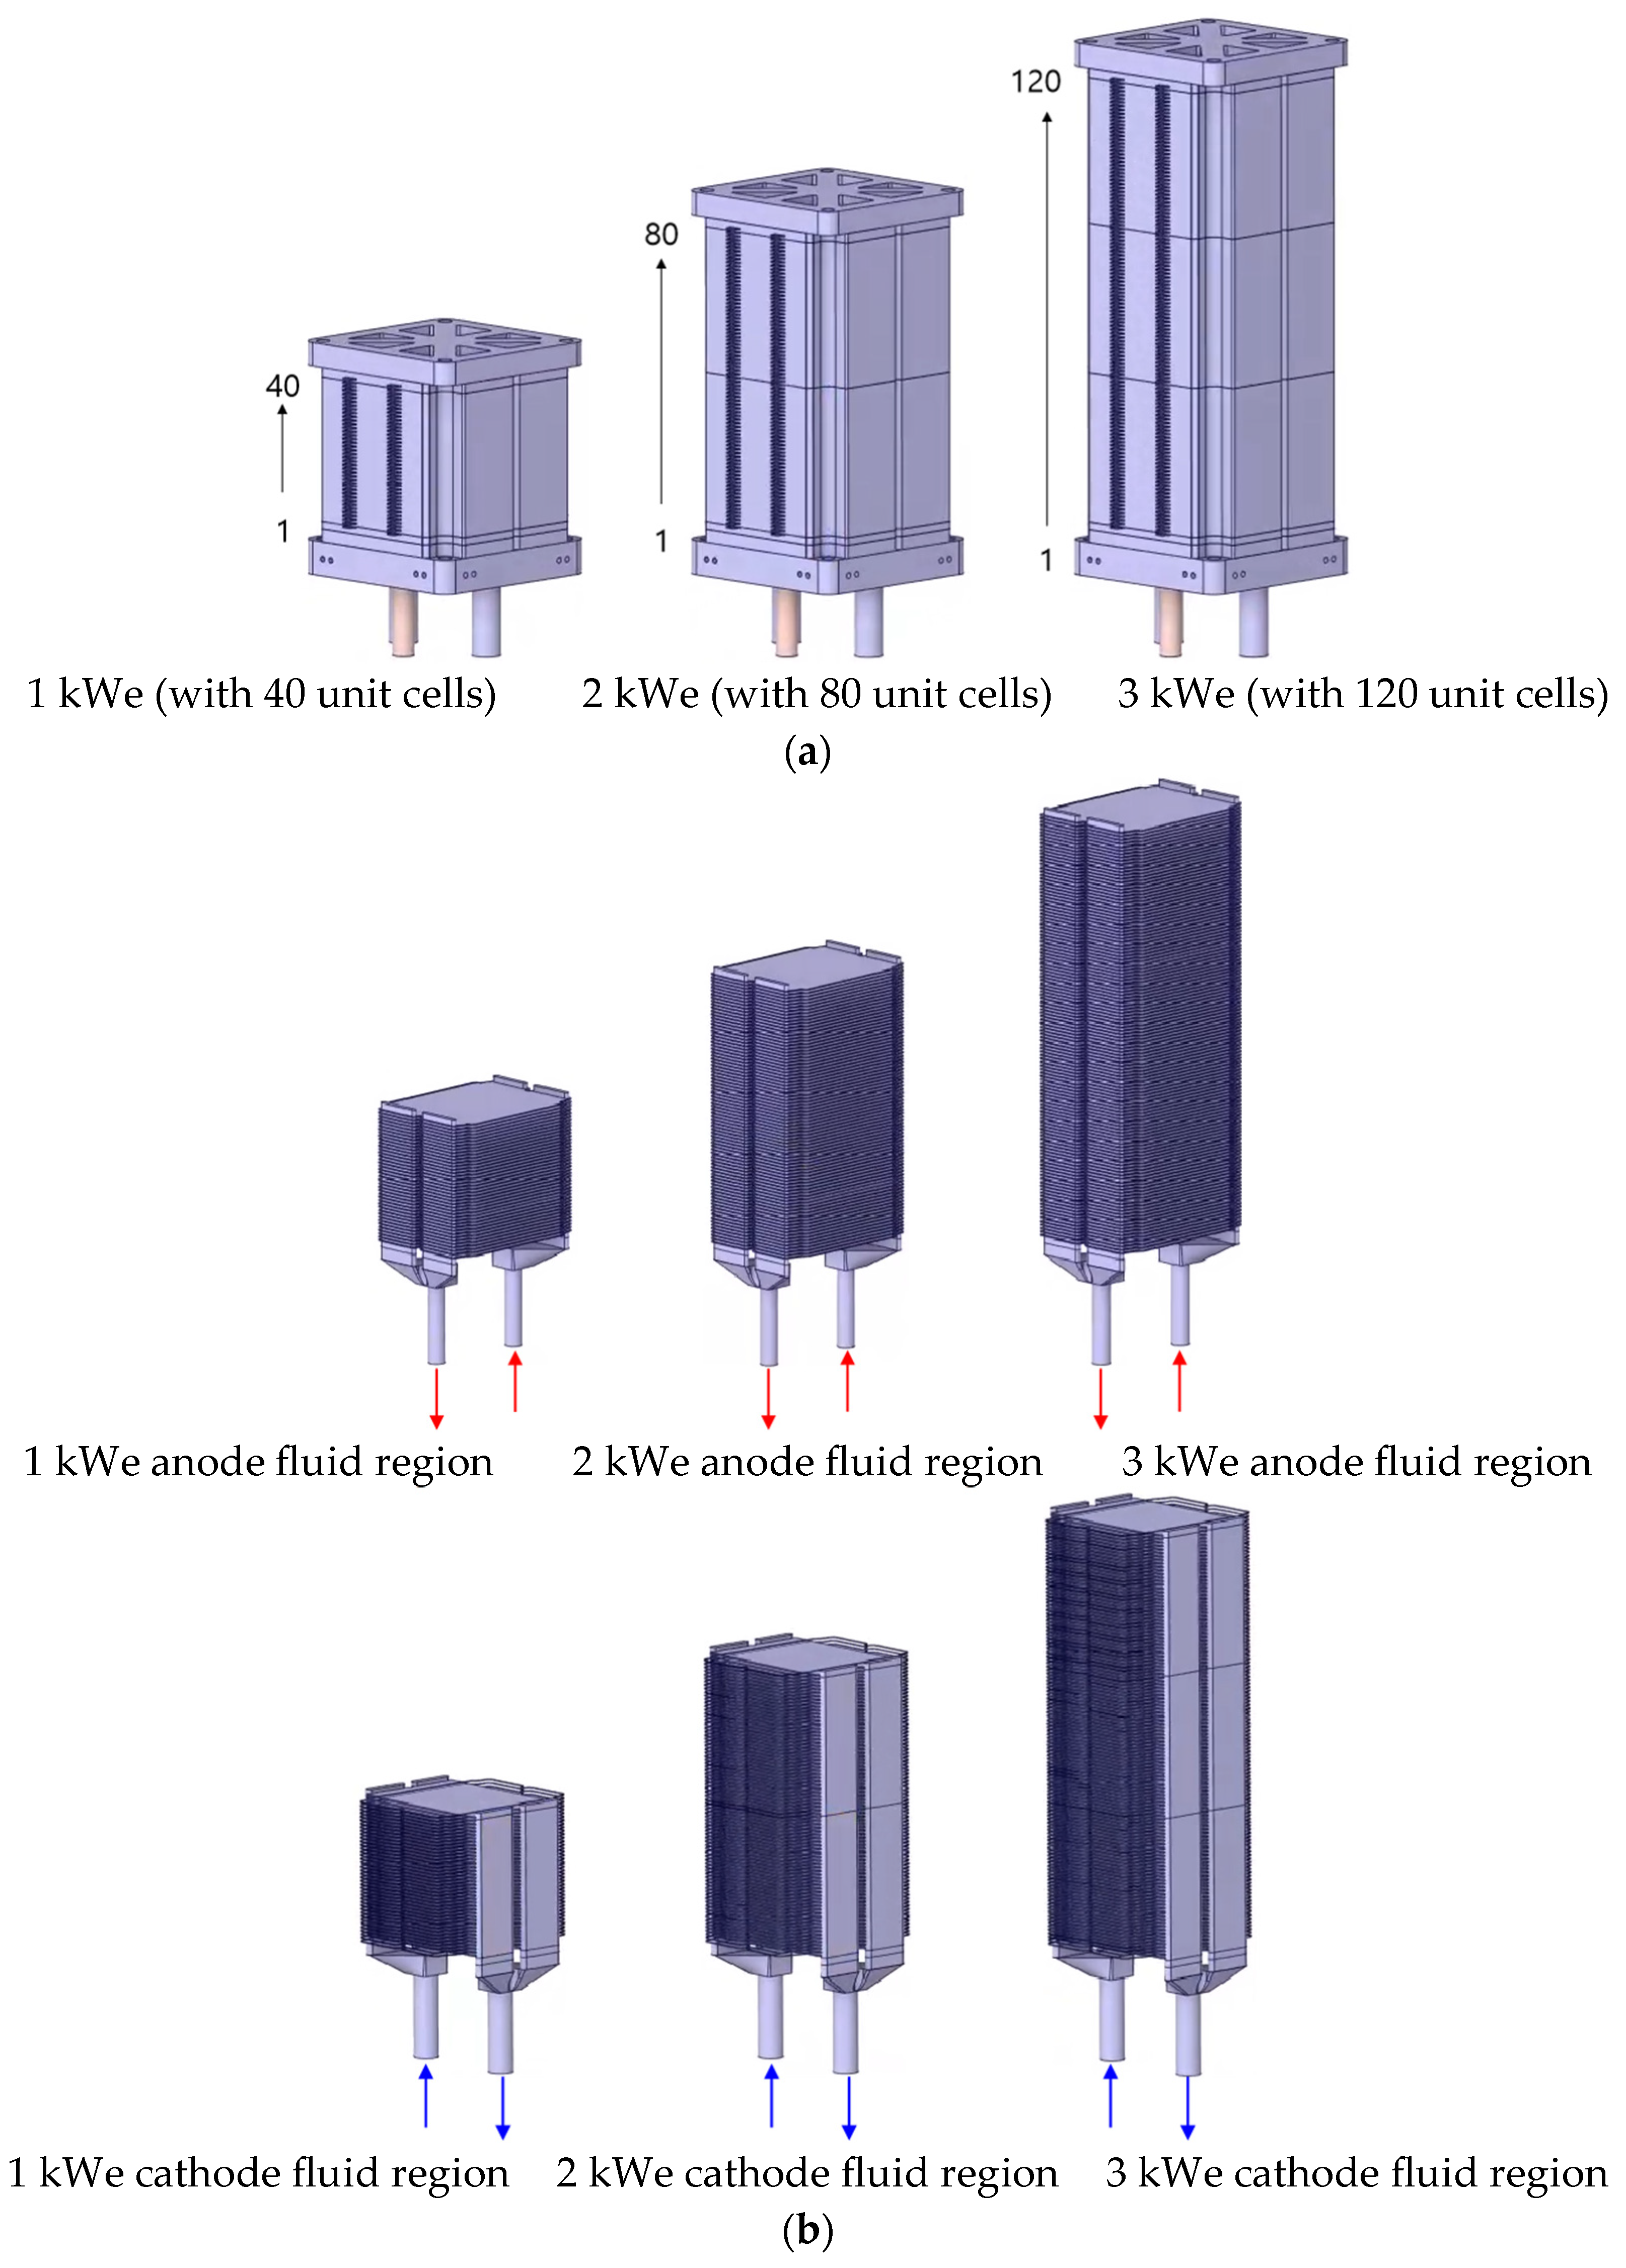
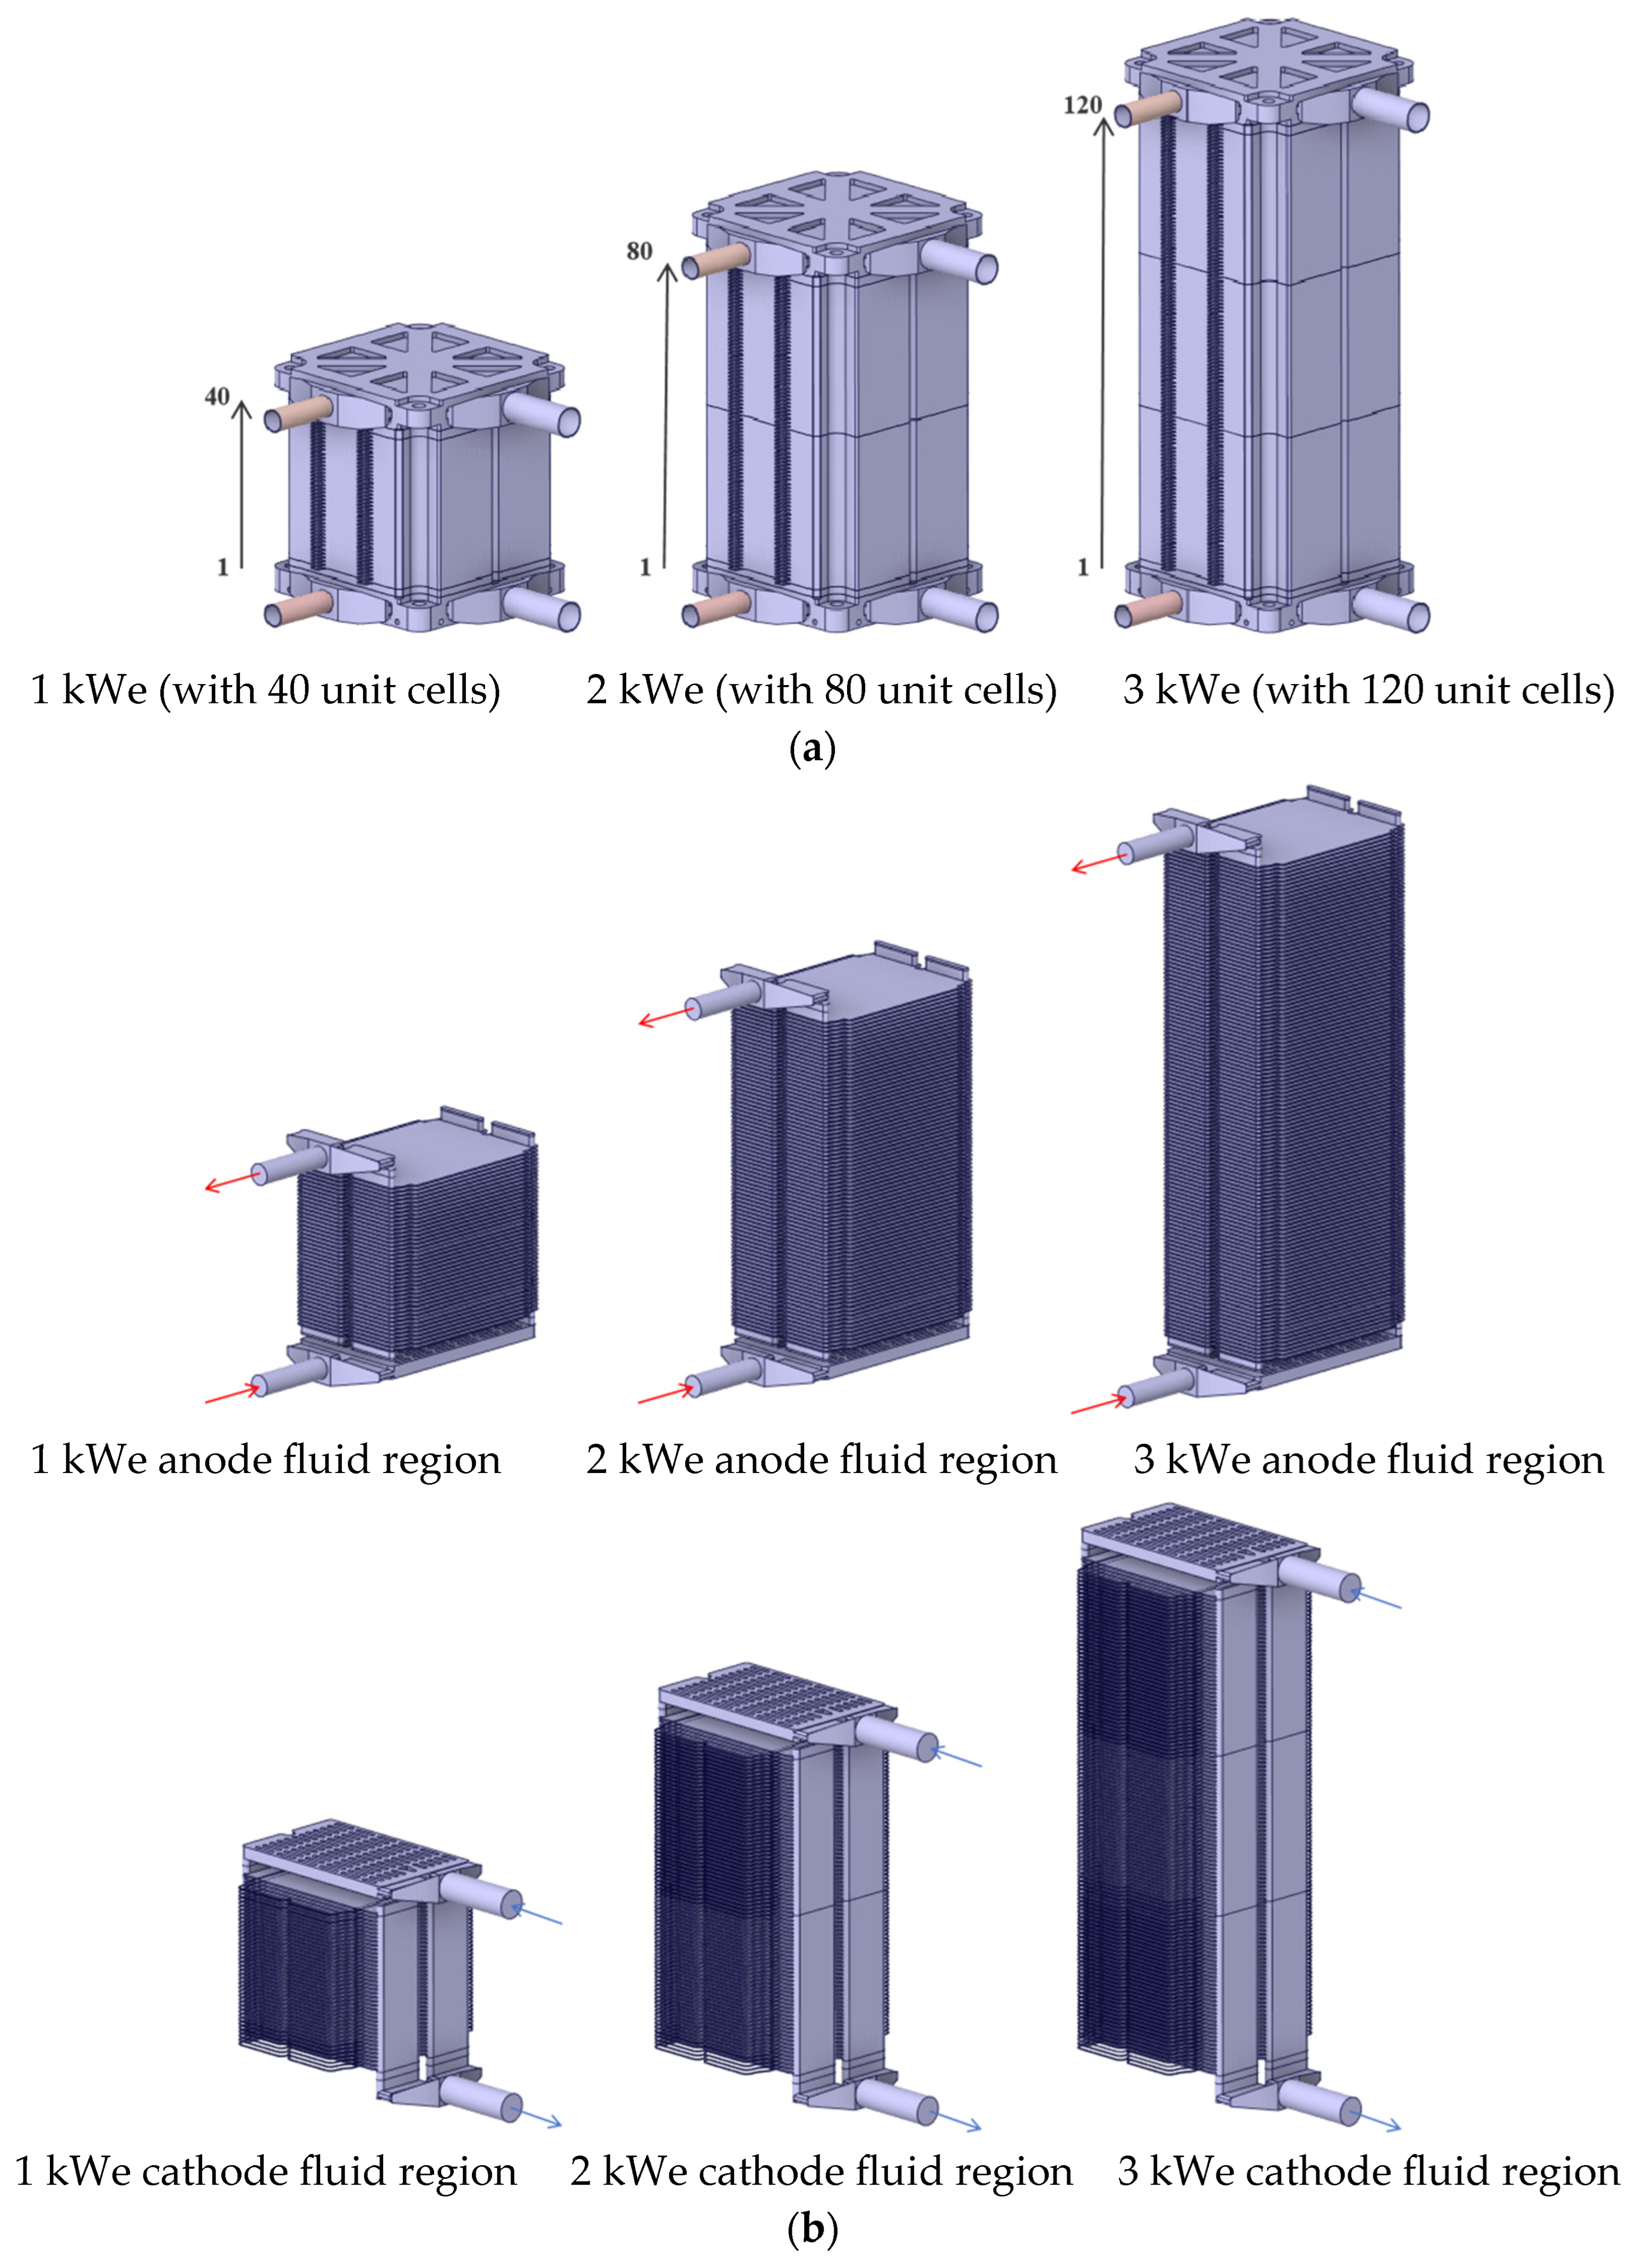
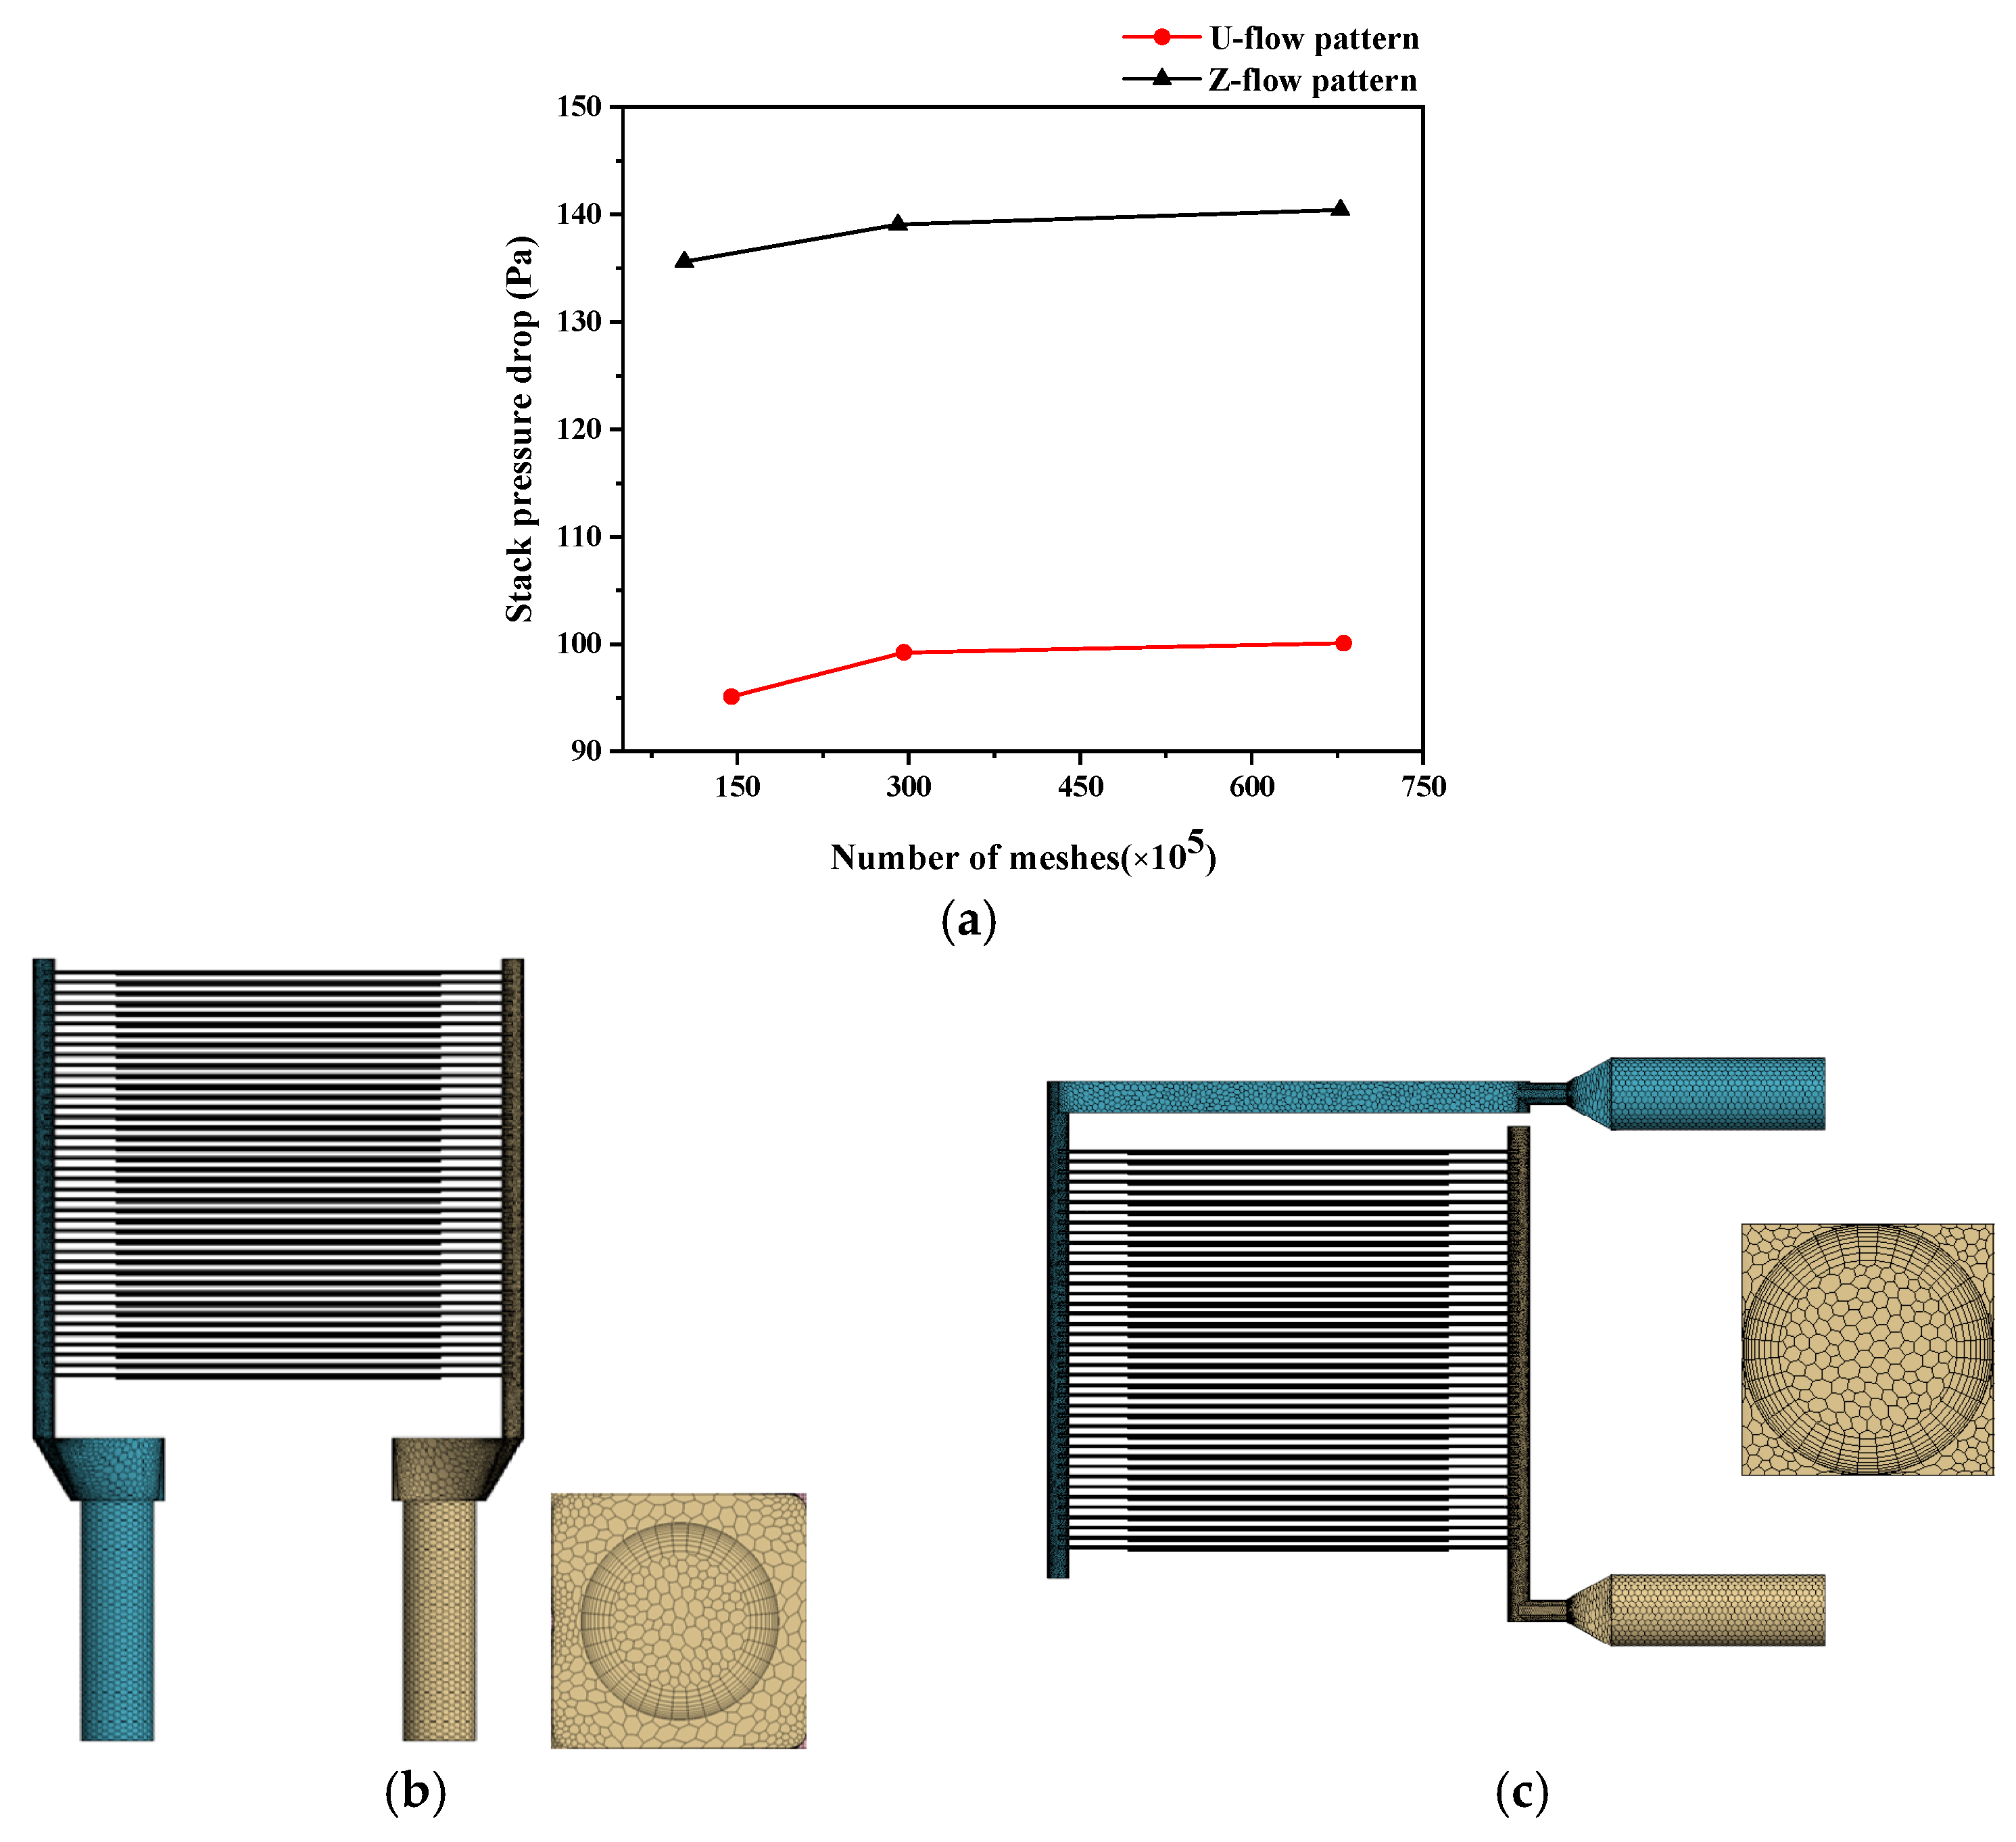
Based on the aforementioned three-dimensional models and selected flow calculation models, CFD simulations were conducted. This chapter provides a detailed discussion of the flow characteristics and differences between the U-flow and Z-flow pattern designs. Additionally, the flow uniformity of gases is compared under varying stack capacities and reactant utilization conditions. In all subsequent simulations, hydrogen and air are used as the working gases for the anode and cathode fluid regions, respectively.

3.1. Variation of Pressure Drop Within the Stack

It is well known that pressure drop is the driving force of fluid flow. Therefore, it is necessary to first perform a detailed comparison and analysis of the pressure distribution before analyzing the flow characteristics of the gases. 
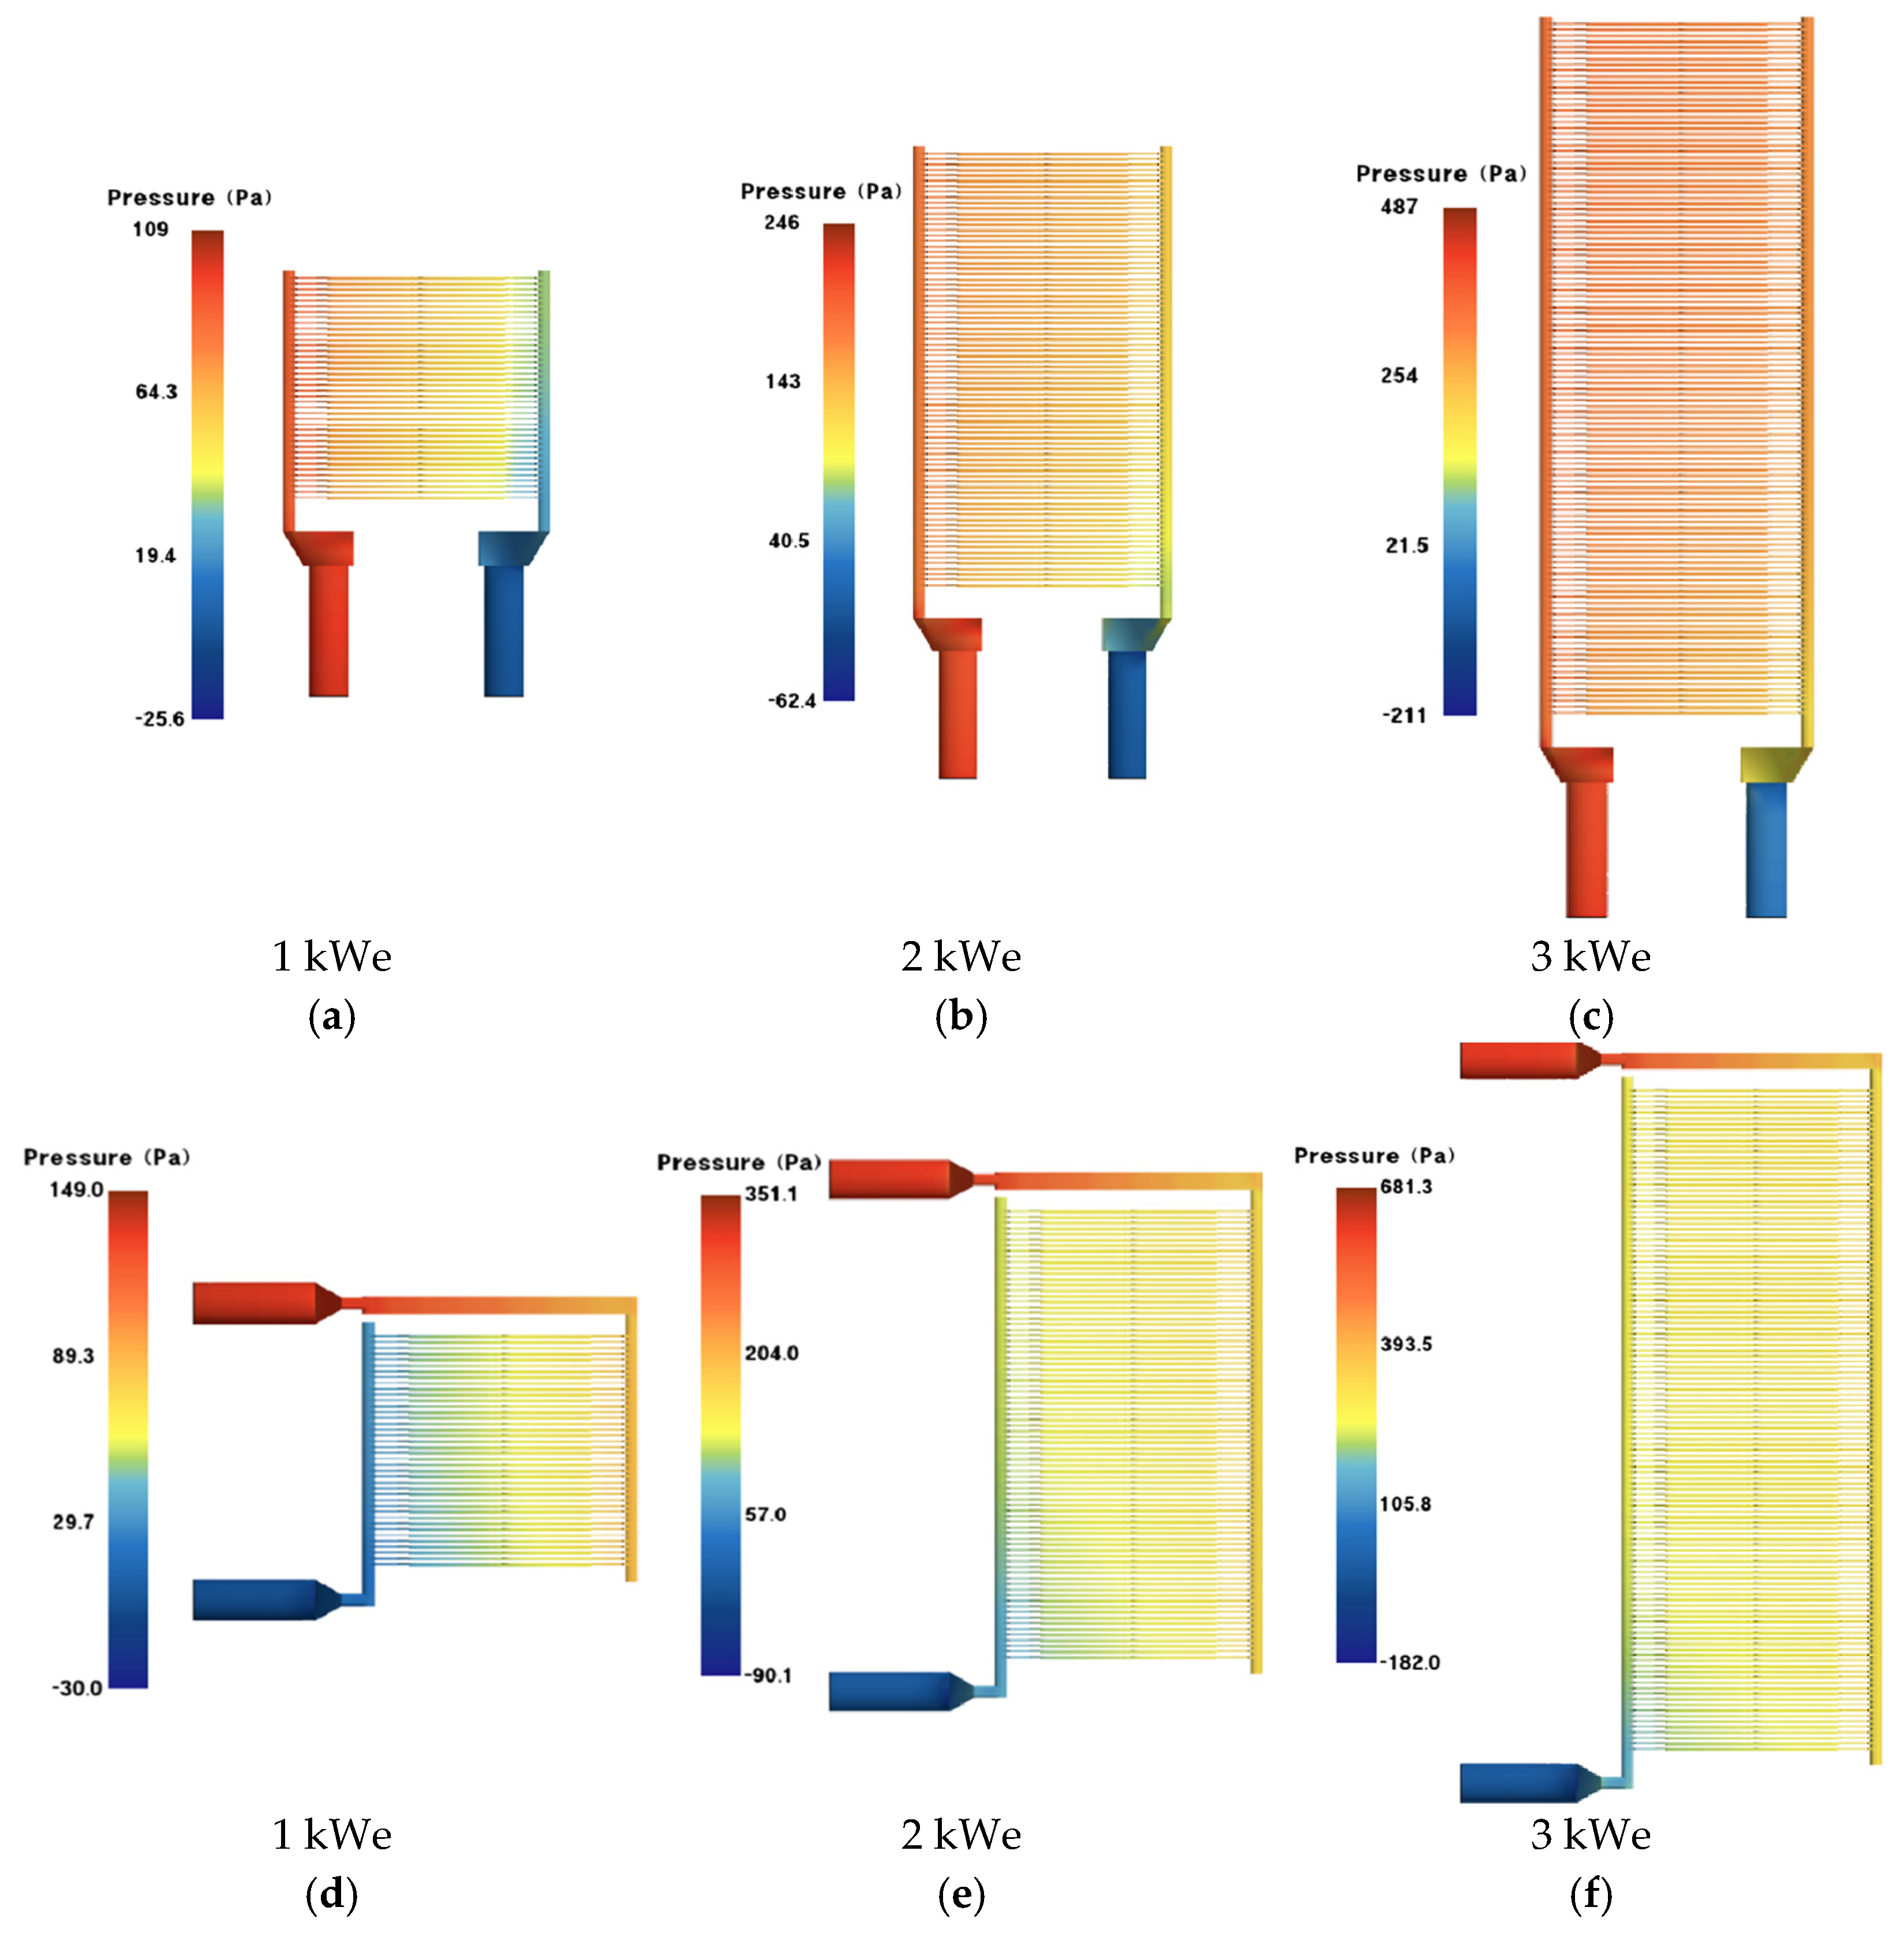
Figure 6 shows the pressure distribution of the U-flow and Z-flow patterns in the anode fluid region under hydrogen utilization of 75% and stack capacities of 1–3 kWe. It can be observed that the total pressure drop in the anode fluid region is relatively small, with the maximum pressure occurring at the hydrogen inlet and gradually decreasing along the flow path until reaching 0 Pa at the outlet. Figure 7 presents the pressure distribution in the cathode fluid region. Compared to the anode fluid region, the pressure drop in the cathode fluid region is significantly larger. The maximum pressure is also observed at the inlet, and the pressure decreases along the flow path. However, the minimum pressure values are negative. Since the outlet boundary condition is set to atmospheric pressure (0 Pa), the presence of negative pressure values indicates the occurrence of vortices in the outlet manifold. This further confirms that the flow state in the cathode fluid region is turbulent.
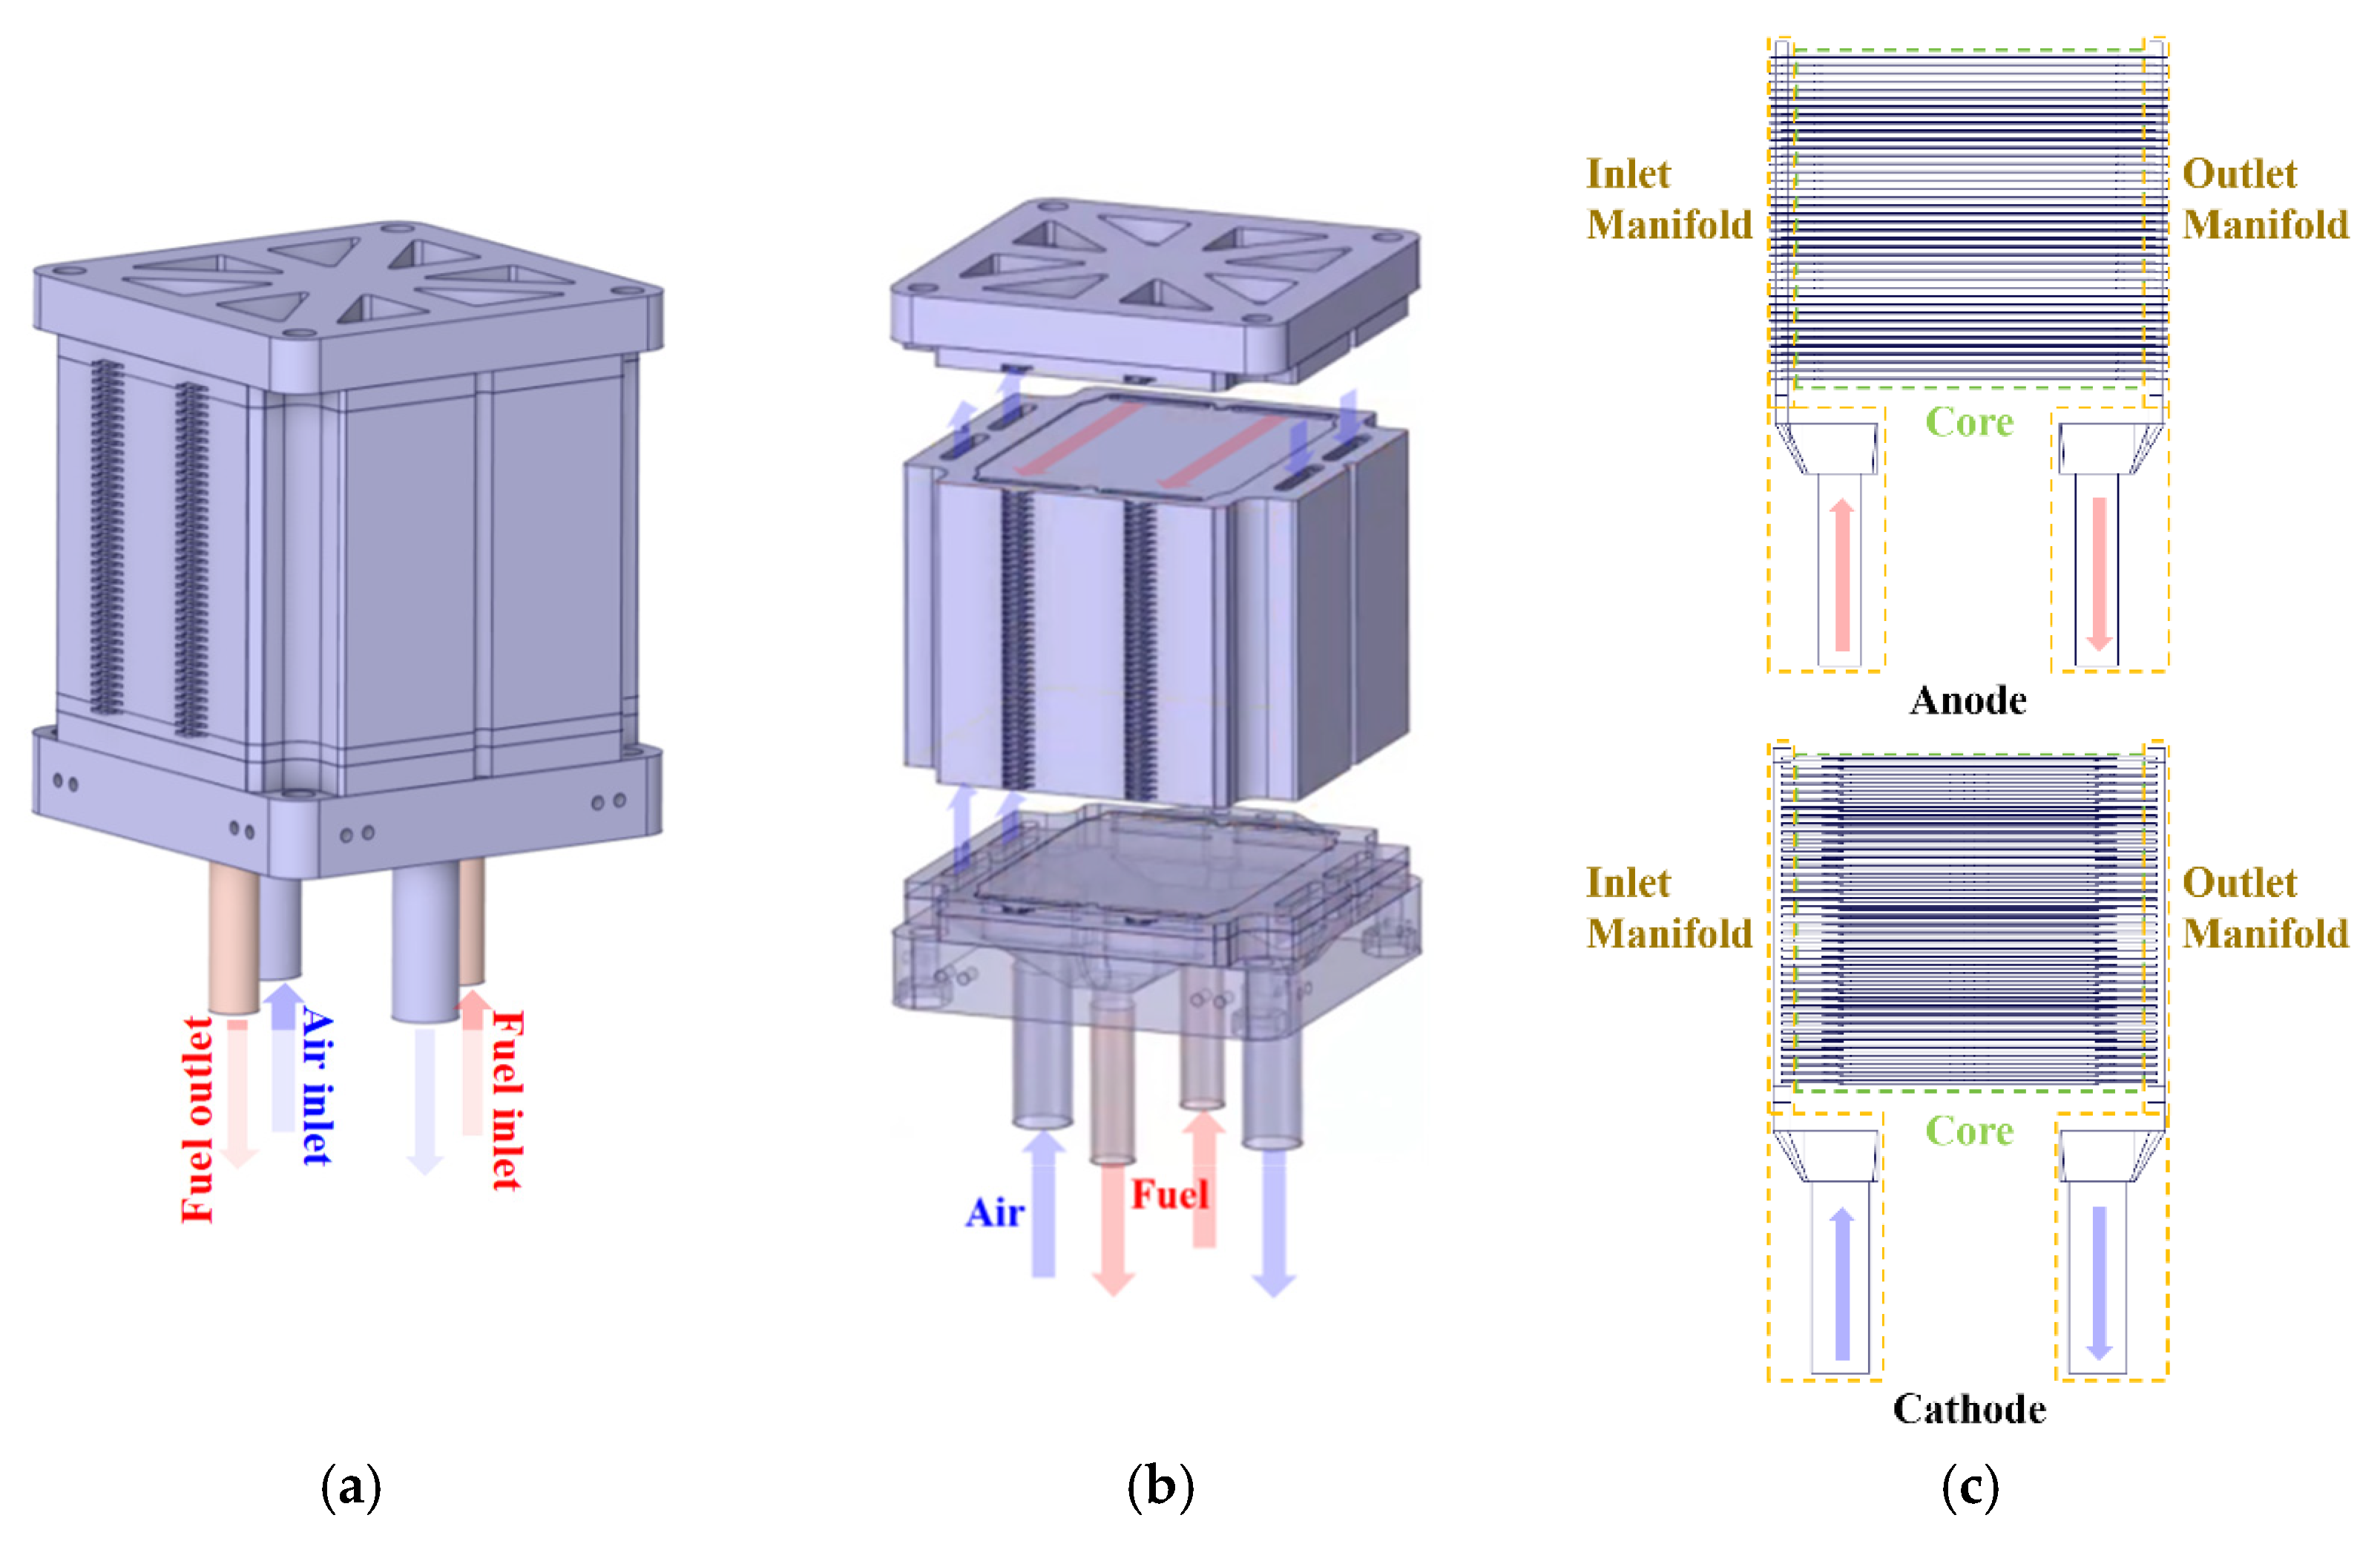
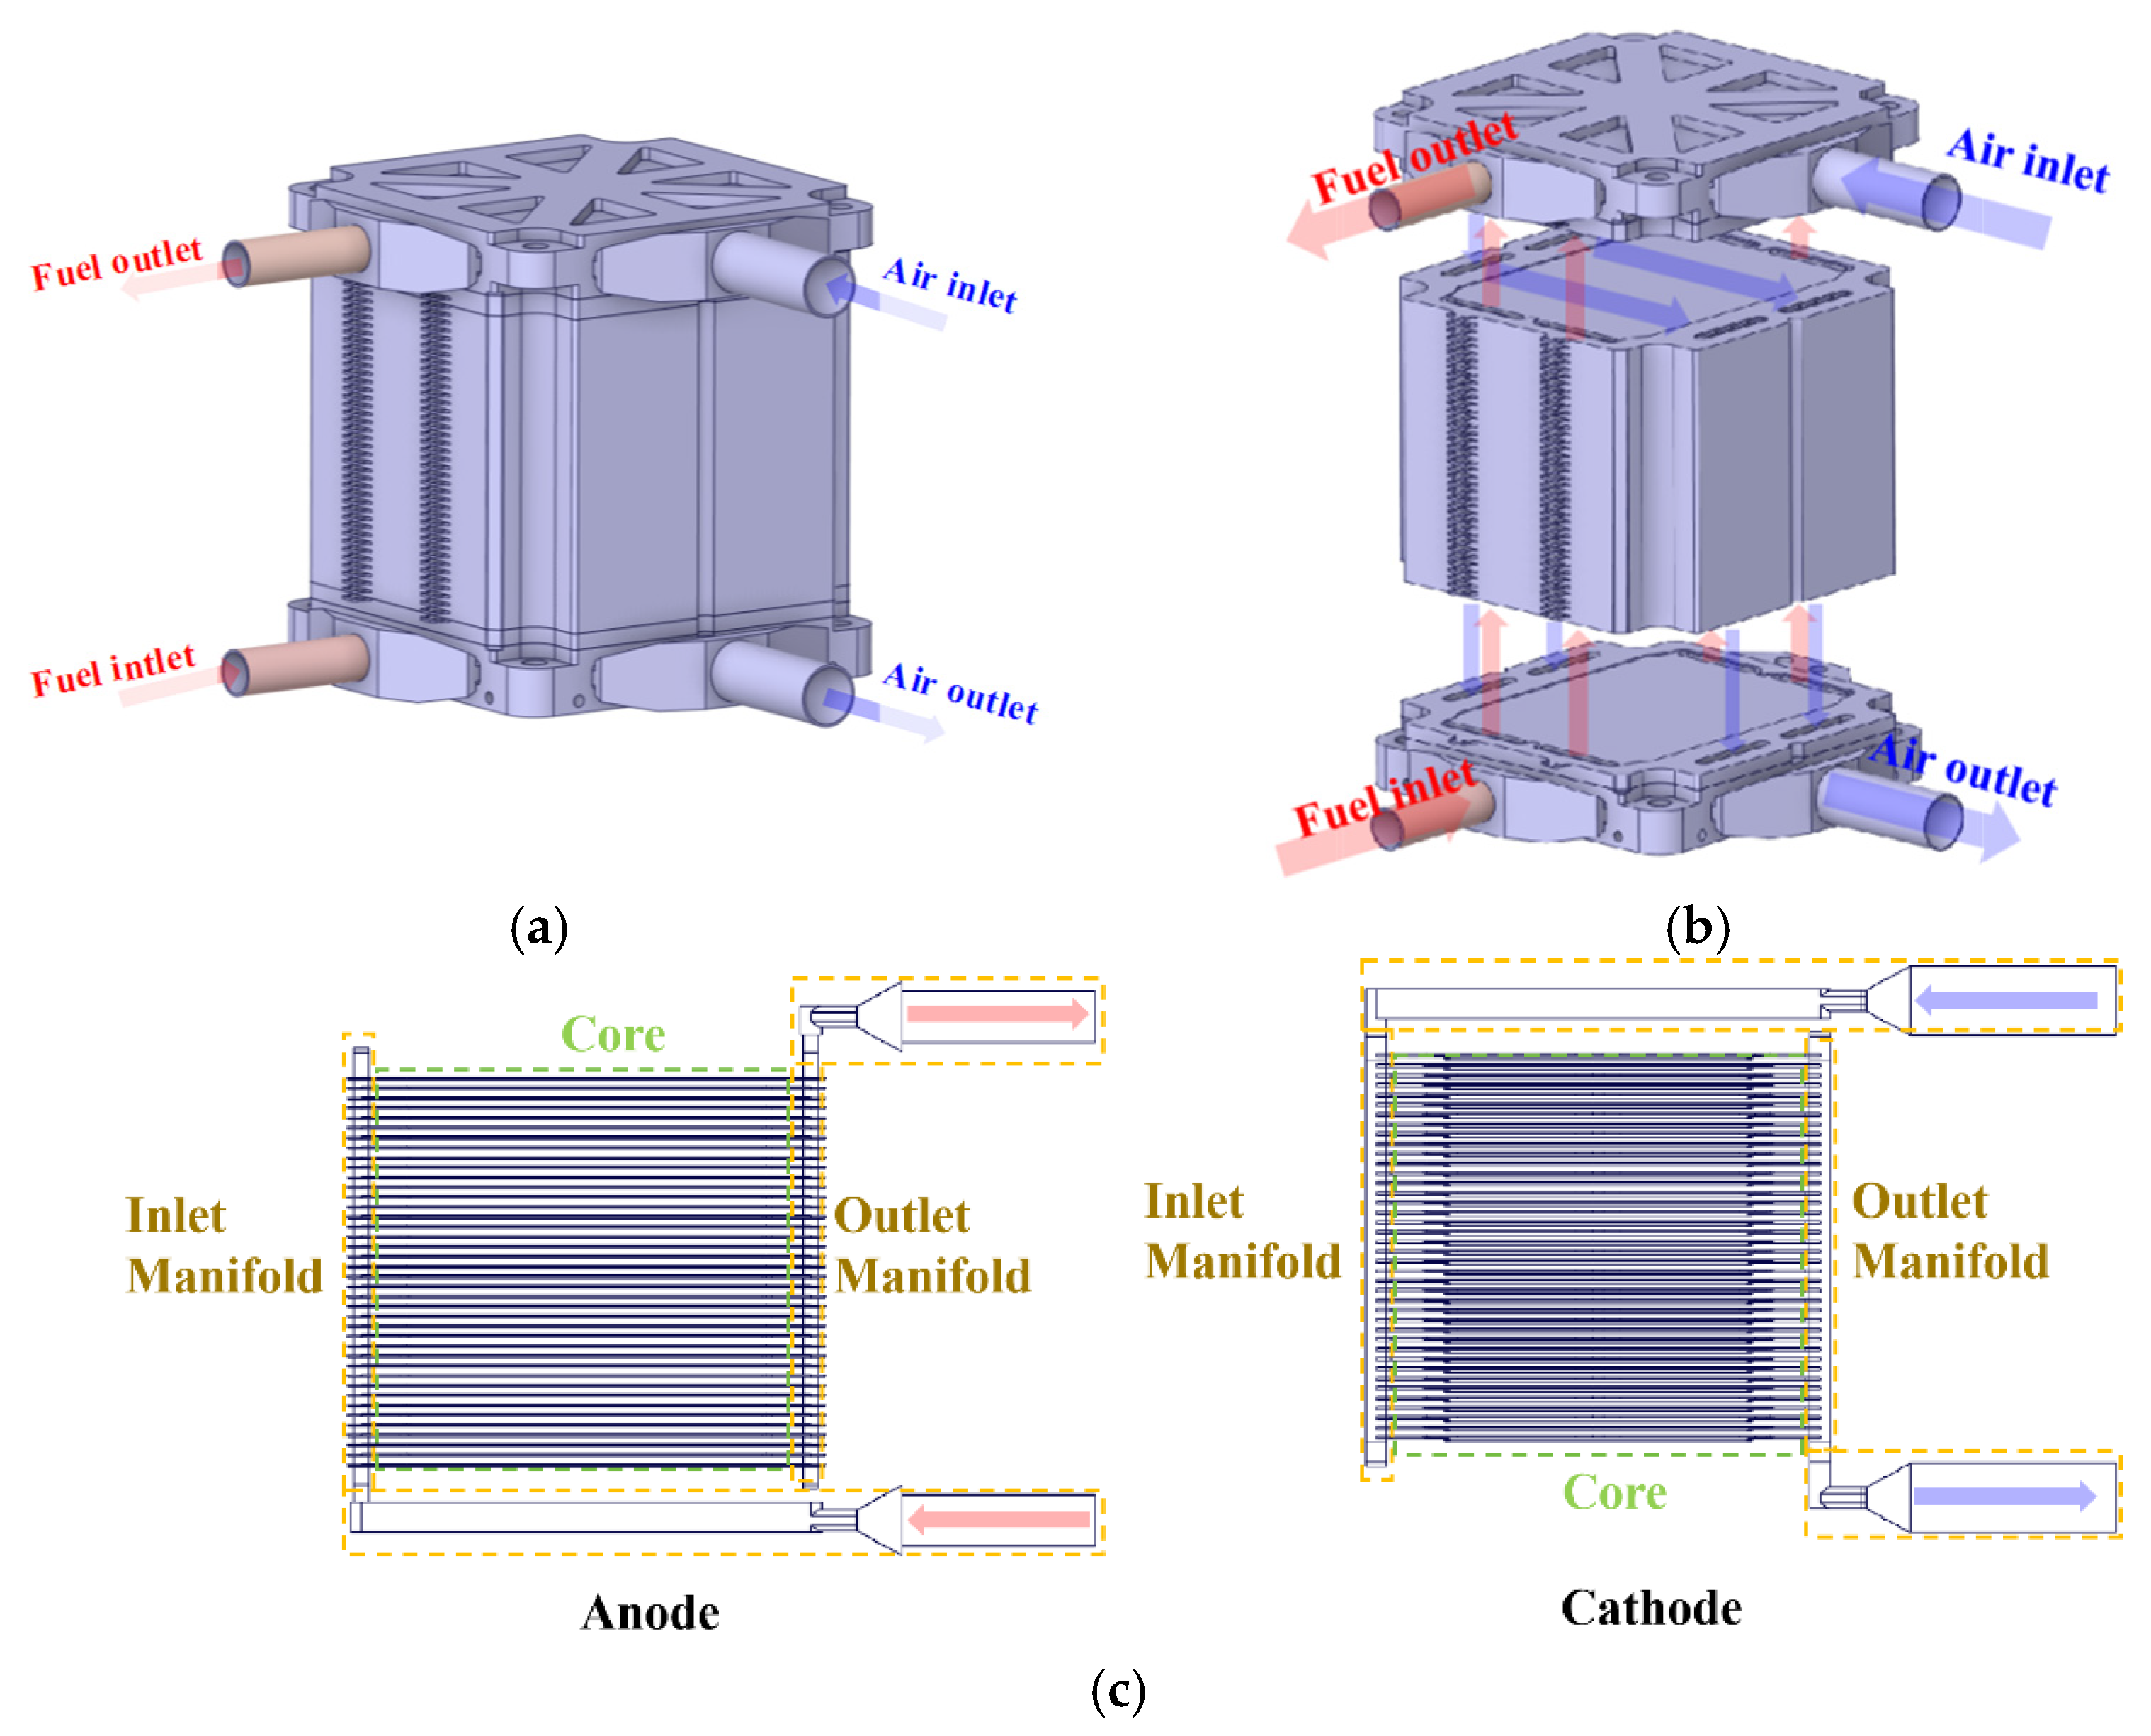
To further analyze the pressure drop in each component of the fluid region, the region was divided into three sections—the inlet manifold, core, and outlet manifold—as described in Section 2.1. The corresponding pressure drop values were calculated and are presented in Table 4 and Table 5, which show the results for the anode and cathode fluid regions, respectively. From the results, it can be observed that under the same number of unit cells and reaction gas utilization rates, the total pressure drop of the U-flow pattern is smaller than that of the Z-flow pattern. This phenomenon can be attributed to the Z-flow pattern’s channel structure, which includes more bends, leading to higher kinetic energy losses. According to Bernoulli’s principle, the kinetic energy lost by the fluid is converted into pressure potential energy, which explains why the total pressure drop in the Z-flow pattern is greater than that of the U-flow pattern. Examining the results of the U-flow pattern reveals that the pressure drops in the inlet and outlet manifolds are nearly identical due to their symmetrical design. However, in the Z-flow pattern, the pressure drop in the inlet manifold is approximately twice that of the outlet manifold. Focusing on the average pressure drop in the core of the anode and cathode fluid regions under the same reaction gas utilization rates, the values are found to be very similar (Note: The core pressure drop mentioned here refers to the anode and cathode fluid region core pressure drops, respectively). For example, in the anode fluid region, under a fuel utilization rate of 50%, the average core pressure drops for the U-flow pattern are 3.05 Pa (1 kWe), 3.15 Pa (2 kWe), and 3.44 Pa (3 kWe), while those for the Z-flow pattern are 3.04 Pa (1 kWe), 3.05 Pa (2 kWe), and 3.08 Pa (3 kWe). A similar trend is also observed in the cathode fluid region. To further explore the main factors affecting core pressure drop variation, 3D bar charts were created to illustrate the ratio of core pressure drop to total stack pressure drop under different stack capacities and reaction gas utilization rates. As shown in Figure 8, Figure 8a,b presents the core pressure drop ratios for the U-flow and Z-flow patterns in the anode fluid region under various conditions, while Figure 8c,d shows the corresponding ratios for the cathode fluid region. The overall trend indicates that increasing stack capacity significantly reduces the core pressure drop ratio. In the anode fluid region, the core pressure drop ratio shows a slight upward trend with increasing hydrogen utilization rates. In contrast, in the cathode fluid region, the core pressure drop ratio increases more significantly with rising air utilization rates. This suggests that the core pressure drop ratio in the cathode fluid region is more sensitive to changes in reactant utilization rates. In summary, the core pressure drop ratio in both the anode and cathode fluid regions decreases with increasing stack capacity but rises with increasing reactant utilization rates.

3.2. Analysis of Flow Characteristics Within a 1 kWe Stack

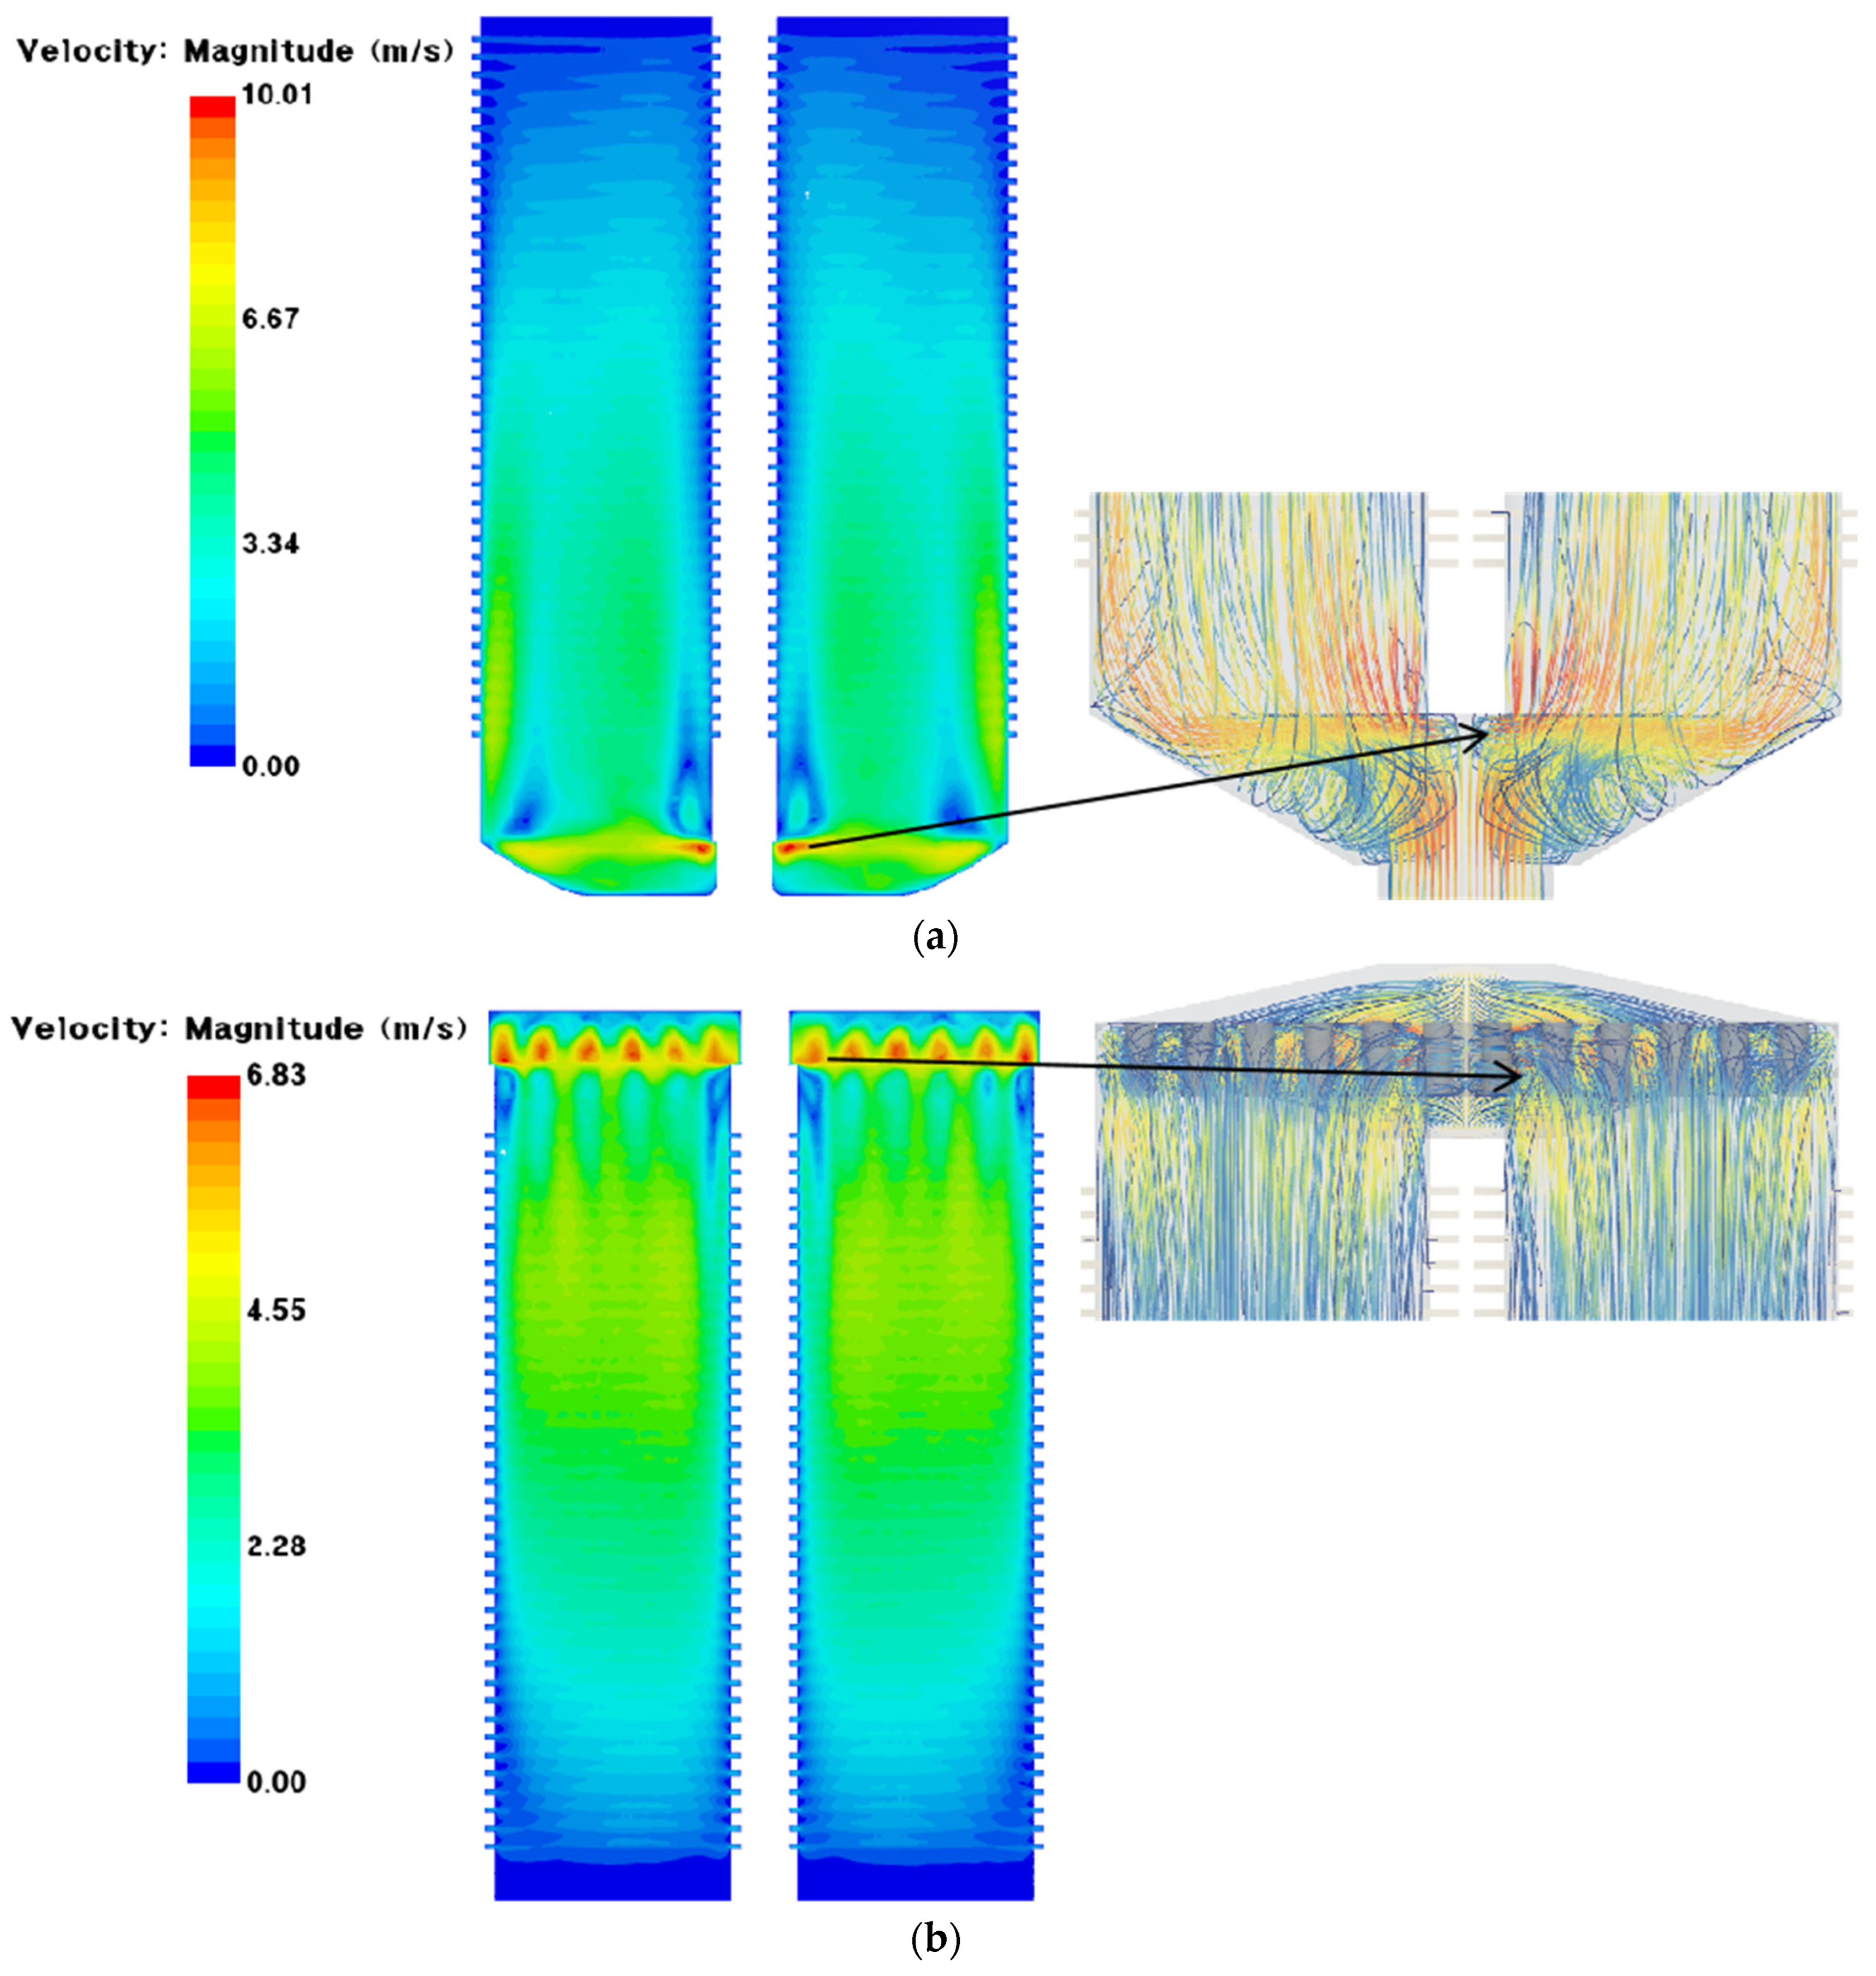
In the previous section, the pressure drop distribution across three local regions of the stack’s overall flow region was discussed, with a particular focus on the concept of the core pressure drop ratio and the factors influencing it. The formation of the core pressure drop cannot be separated from the influence of the inlet manifold, which is a critical component for supplying reactant gases to the unit cells. In this section, the cathode fluid region of a 1 kWe stack is taken as an example to analyze the velocity variation within the inlet manifold and the flow behavior in the unit cells in detail. First, a cross-section of the inlet manifold, located 1 mm upstream of the unit cell inlets, was selected, and the velocity distribution at this cross-section under an air utilization rate of 30% was plotted as a contour map (Figure 9). It is evident from Figure 9 that significant velocity gradients are present across the inlet manifold cross-section for both U-flow and Z-flow patterns. The maximum velocity is observed near the inlet of the manifold, and the velocity gradually decreases along the flow path. However, the velocity gradient near the region of maximum velocity is uneven. To investigate further, a streamline plot at this region was generated. The streamline plot reveals that turbulent streamlines occur near the unit cell inlets, indicating the presence of vortices in this region. This phenomenon arises because, after entering the inlet manifold, the airflow changes direction near the unit cell inlets, leading to significant variations in velocity due to the inherent geometry of the flow channel. Therefore, it can be judged that the presence of vortices in the inlet manifold creates velocity gradients along the flow path, with larger velocity fluctuations occurring near regions where the airflow direction changes.
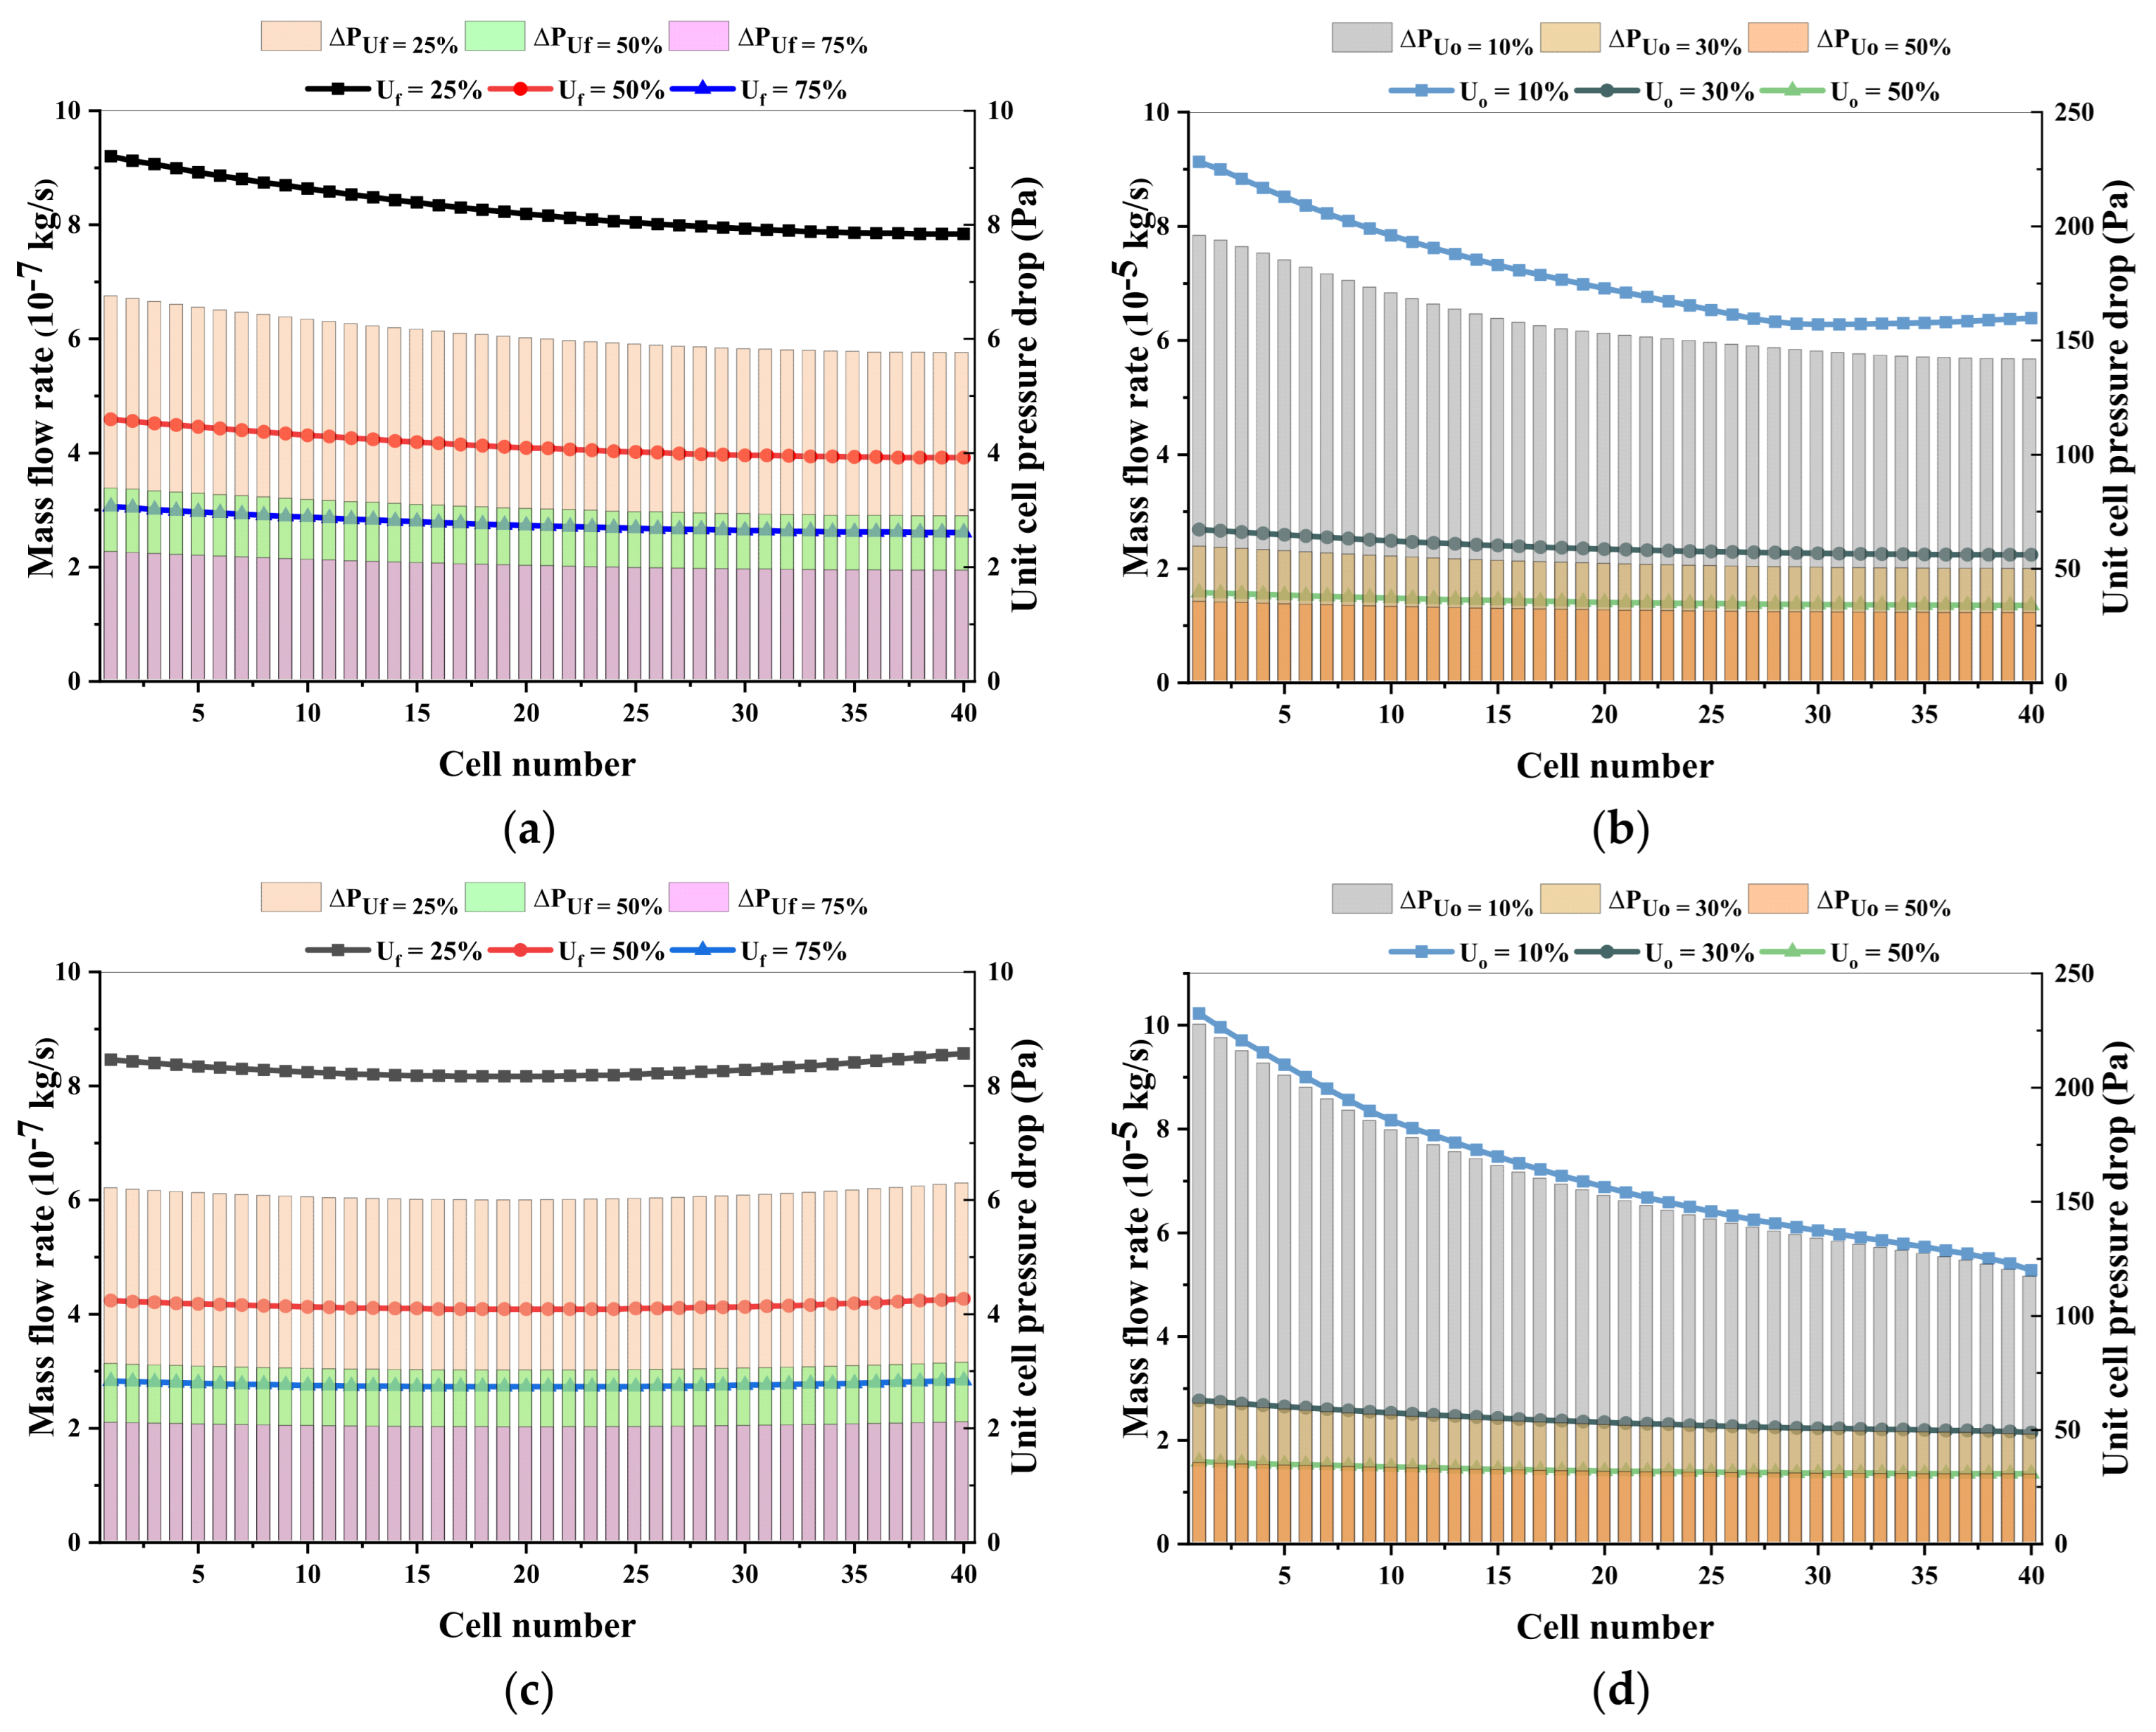
This phenomenon impacts the uniformity of gas distribution from the inlet manifold to each unit cell. To explore the mass flow rate supplied to each unit cell and the corresponding pressure drop trends, a plot of the mass flow rate and pressure drop at the unit cell inlets was generated, as shown in Figure 10. The bar chart illustrates the pressure drop trend, and the line plot shows the mass flow rate trend. The figure also includes results calculated under different reaction gas utilization conditions. From the trend plots, it can be observed that the pressure drop trend closely aligns with the mass flow rate trend. As the reaction gas utilization decreases, the mass flow rate and pressure drop for the corresponding unit cells increase. The variations in mass flow rate and pressure drop in the anode fluid region are significantly smaller compared to those in the cathode fluid region. Notably, under an air utilization rate of 10%, both the mass flow rate and pressure drop for the unit cells exhibit a steep decline along the stack height. This result further demonstrates that at lower air utilization rates, the flow situation in the cathode fluid region becomes more complex, and the flow uniformity deteriorates significantly.

3.3. Analysis of Flow Uniformity in Unit Cells

Based on the evaluation of the flow conditions within the 1 kWe stack, the mass flow rate distribution across the unit cells exhibits different trends under varying reaction gas utilization rates, with poorer flow distribution observed in the cathode fluid region. Therefore, this section provides a detailed discussion on the uniformity of mass flow rate distribution in unit cells under different reaction gas utilization rates and stack capacities. Firstly, a dimensionless mass flow rate equation is introduced to calculate and quantify the mass flow rate distribution trends under various conditions. The dimensionless mass flow rate equation is presented as follows:
m ~ = m n m ¯ ,
Here, m ~ represents the dimensionless mass flow rate, m n denotes the mass flow rate of the nth cell, and m ¯ refers to the average mass flow rate of the unit cell. The closer the calculated result of this equation is to “1”, the smaller the mass flow rate deviation among the unit cells, indicating a more uniform flow distribution. All calculated results are plotted as a 3D scatter plot in
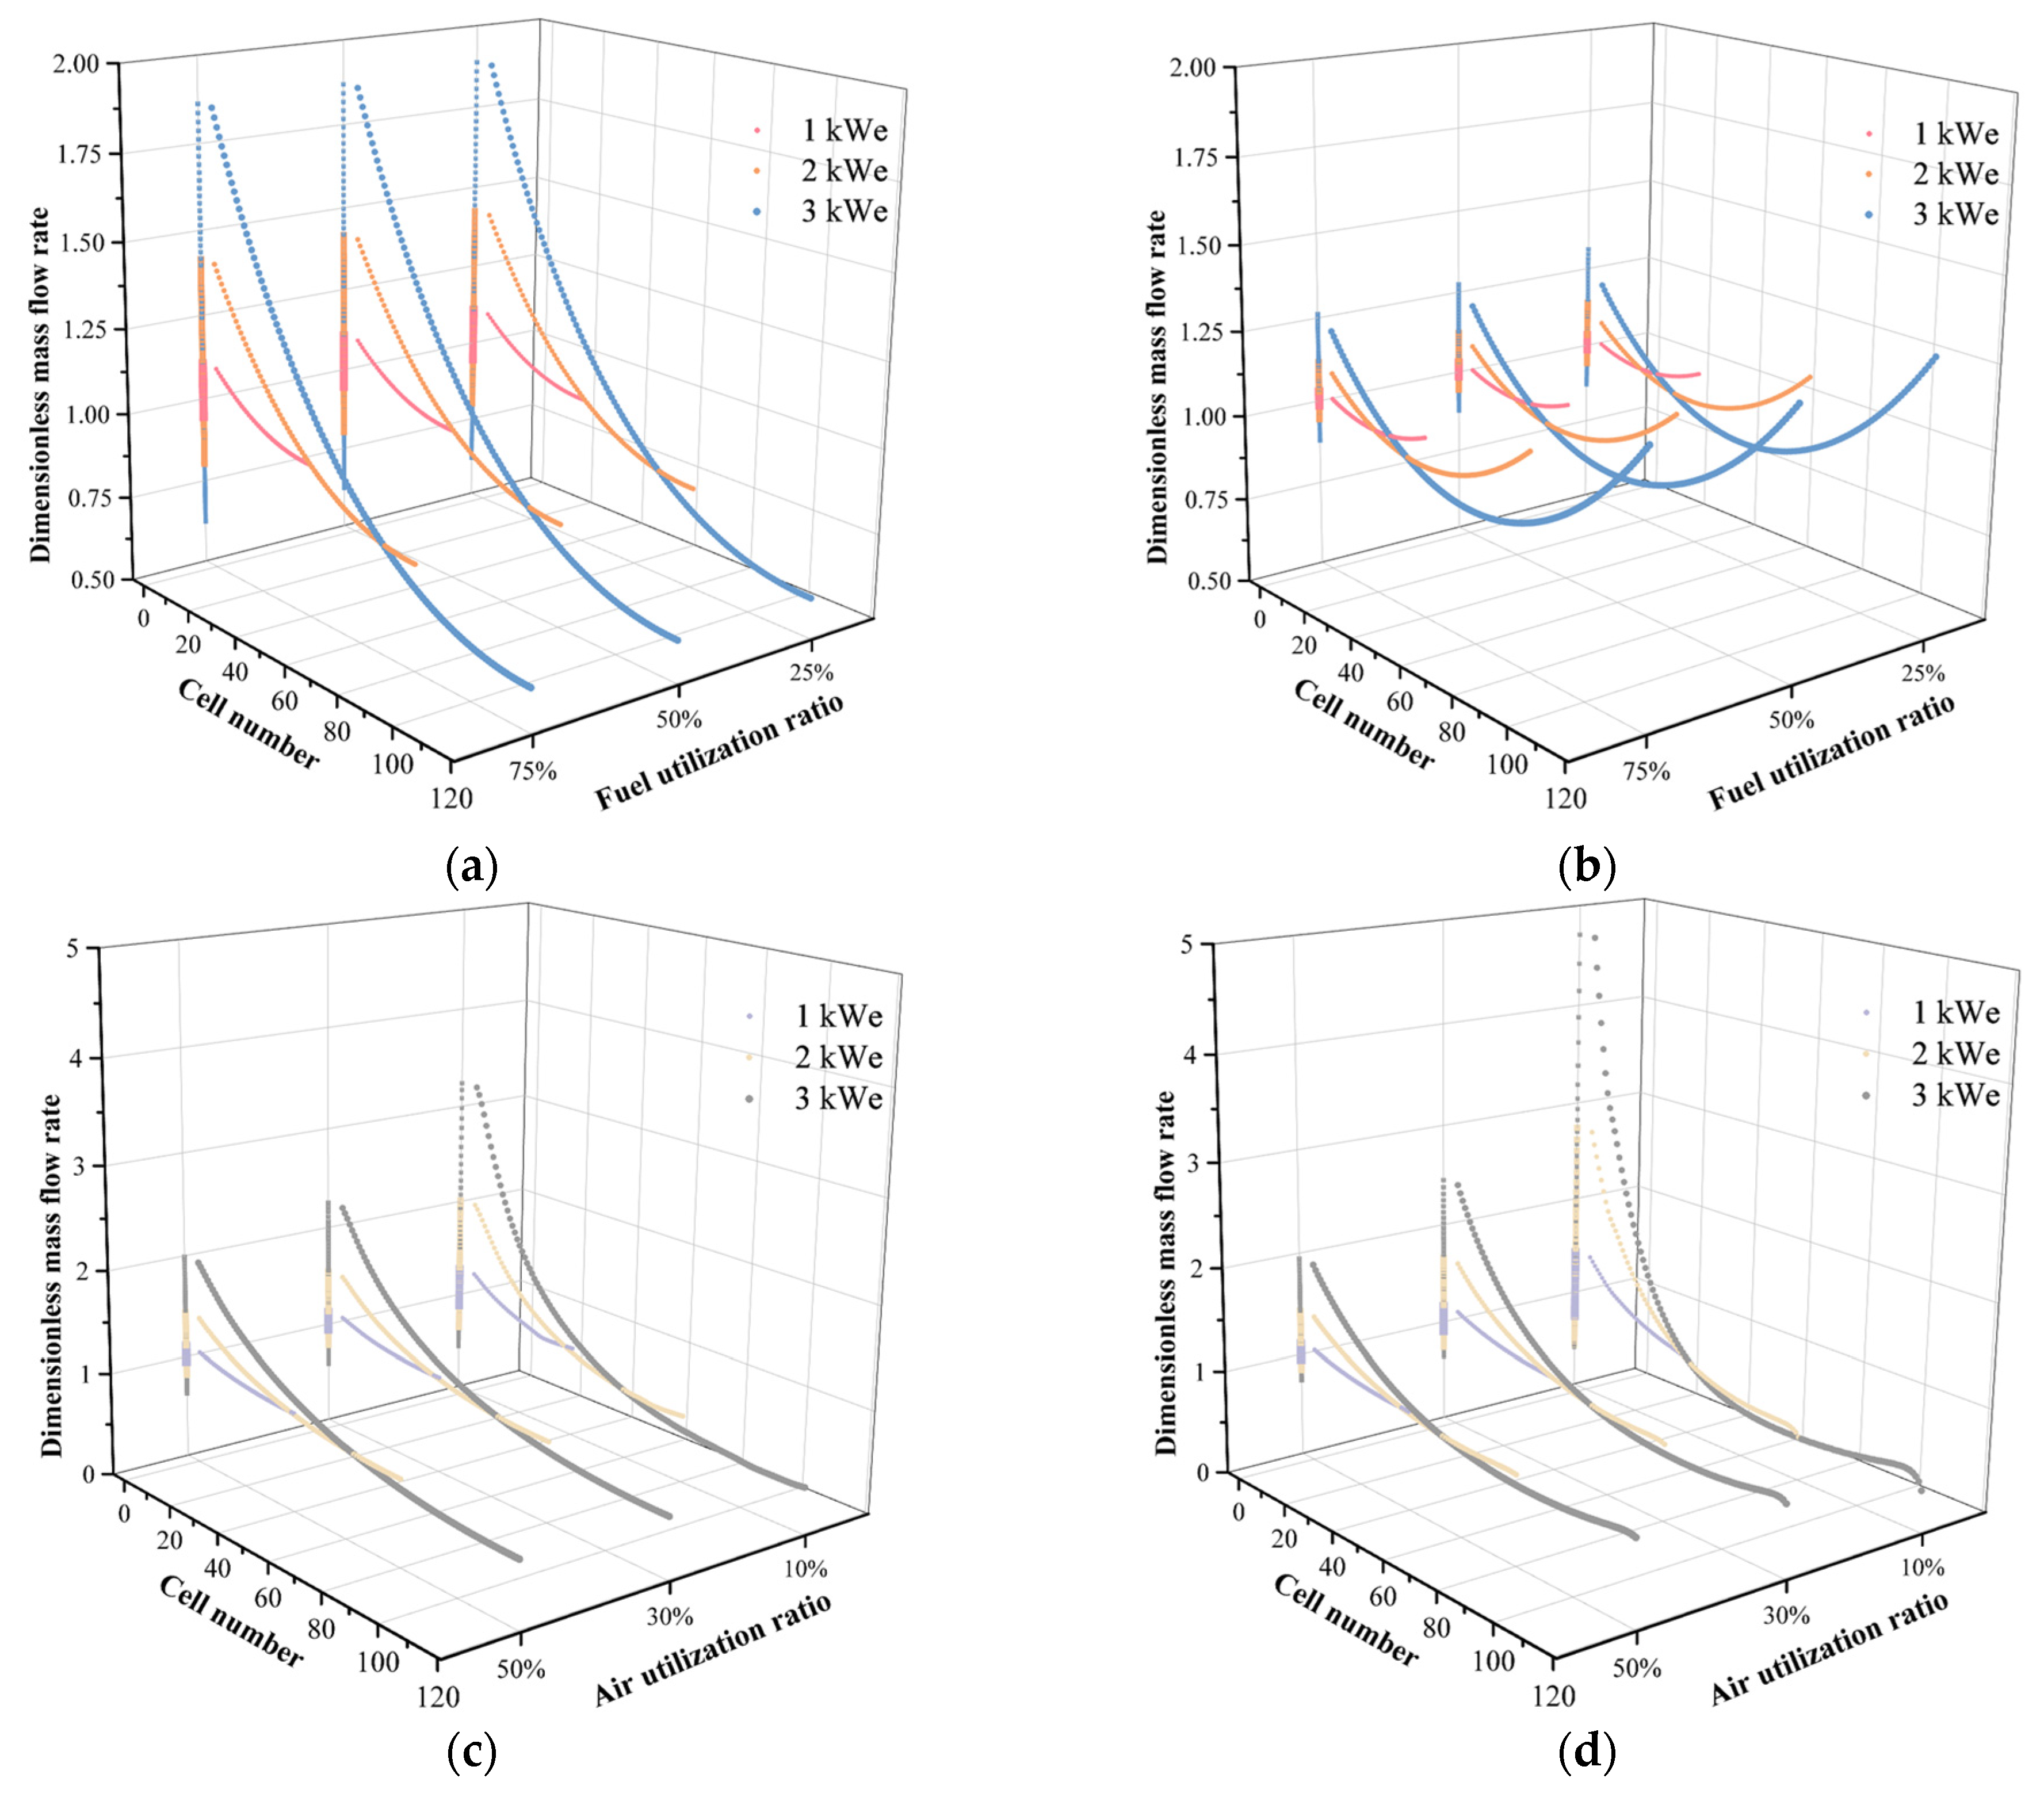
 Figure 11. Figure 11 effectively compares the deviation of the dimensionless mass flow rate under different stack capacities and reaction gas utilization rates for the two designs.
Figure 11a,b shows the dimensionless mass flow rate values calculated for each unit cell in the anode fluid region of the U-flow and Z-flow patterns under different conditions, respectively. For the anode fluid region of the U-flow pattern, the results indicate that the maximum dimensionless mass flow rate consistently appears in the first unit cell under all operating conditions and gradually decreases with an increasing number of unit cells. However, in the Z-flow pattern results shown in Figure 11b, the trend differs: the dimensionless mass flow rate first decreases and then increases with the number of unit cells, with the minimum value observed in unit cells located near the center of the stack. The deviation in the dimensionless mass flow rate is most pronounced under the 3 kWe condition for the anode fluid region. However, changes in fuel utilization have little effect on the magnitude of the deviation under the same stack capacity. Comparing the two designs, the Z-flow pattern exhibits smaller deviations in the dimensionless mass flow rate in the anode fluid region than the U-flow pattern.
In the cathode fluid region, the deviation in the dimensionless mass flow rate also increases with stack capacity. Under the same stack capacity, the deviation increases as air utilization decreases. Notably, when the air utilization is 10%, the Z-flow pattern exhibits significantly higher deviations in the dimensionless mass flow rate compared to other conditions.
In summary, the deviation in the dimensionless mass flow rate increases with stack capacity and decreases with higher reaction gas utilization rates. However, in the anode fluid region, the deviation is less influenced by changes in fuel utilization. To further quantify the deviation in dimensionless mass flow rate and facilitate comparisons of flow uniformity, a uniformity factor, α, is introduced to evaluate and compare the flow uniformity under different conditions. The equation for calculating the uniformity factor is as follows:
α = 1 1 N n = 1 N ( m n m ¯ m ¯ ) 2 1 / 2
Similar to the dimensionless mass flow rate, the closer the value of α is to 1, the better the flow uniformity under the given condition. Table 6 presents the calculated α values for each condition, where α1 and α2 represent the results for the U-flow pattern and Z-flow pattern, respectively.
From the overall results in the table, it appears that the outcomes for the anode fluid region of the 1 kWe stack are closer to “1”. The values of α1 and α2 decrease to varying degrees with increasing stack capacity and changes in reaction gas utilization rates. To visualize the results in 
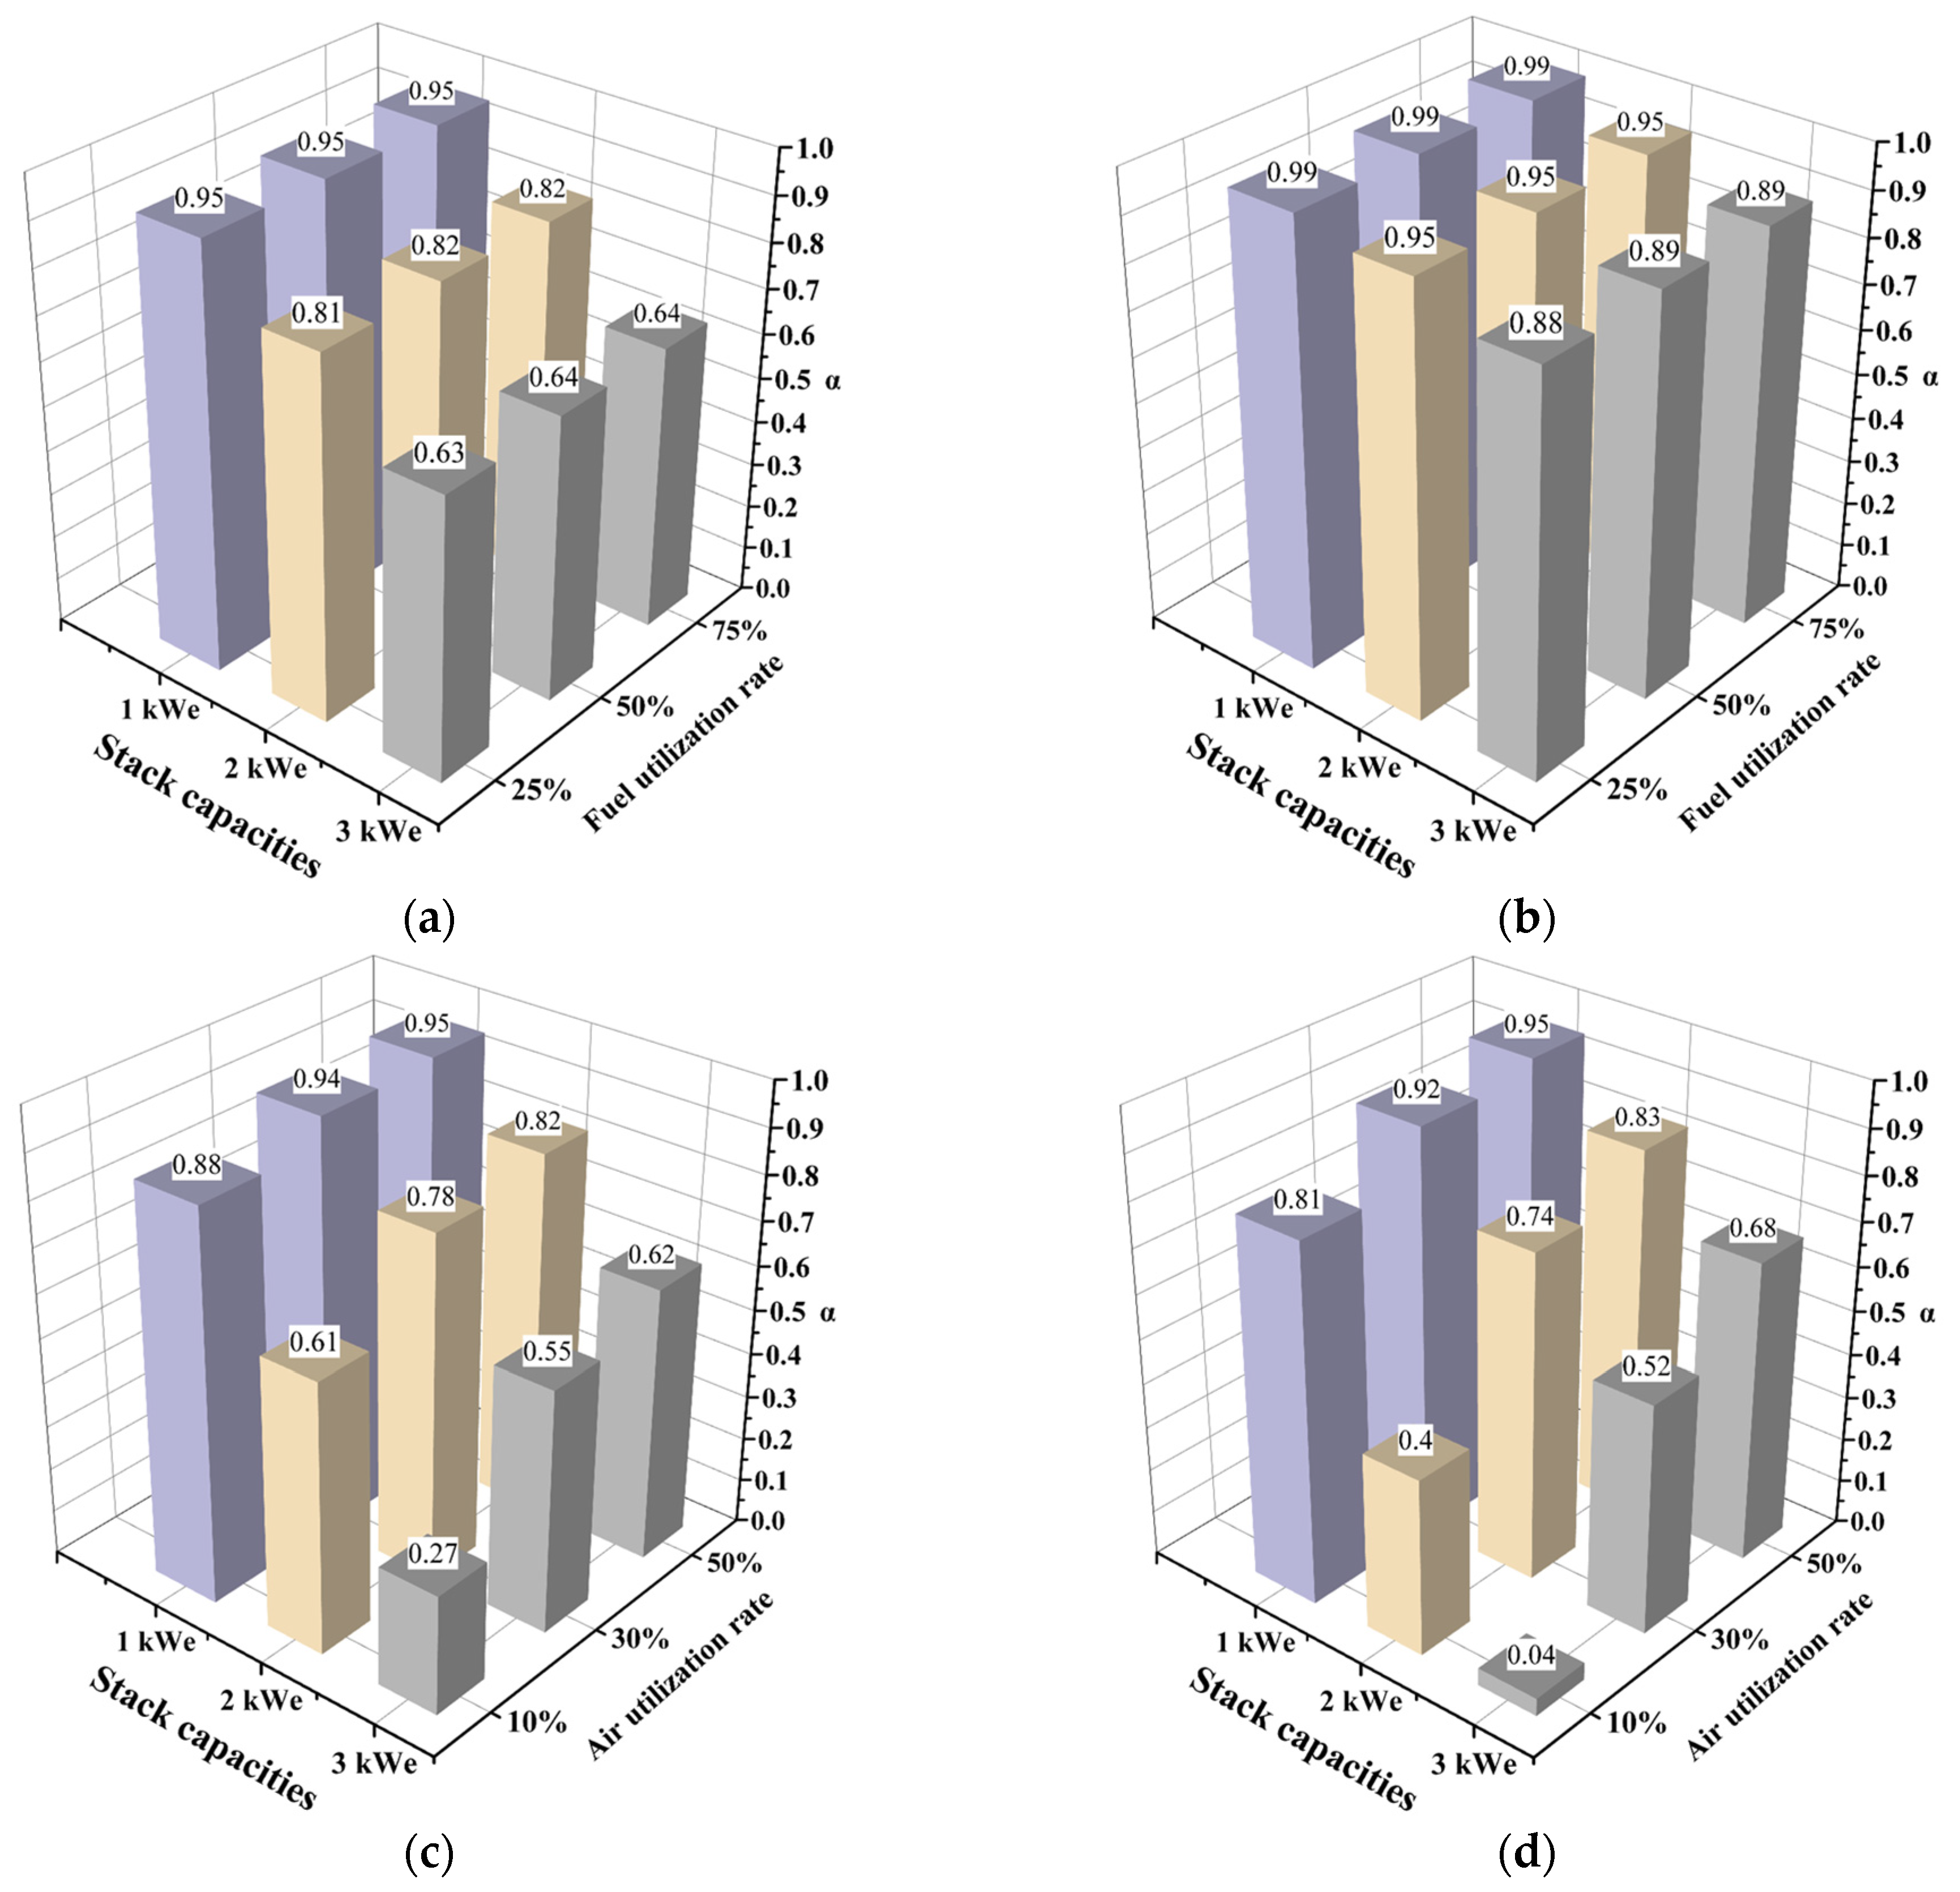
Table 6 and facilitate better comparisons, a 3D bar chart of the uniformity factor α was created, as shown in Figure 12. In Figure 12, it can be observed that the globally optimal uniformity is achieved in the anode fluid region of the 1 kWe Z-flow pattern, with an α value of 0.99. This is followed by the 2 kWe Z-flow pattern and the 1 kWe U-flow pattern in the anode fluid region, both with α values of 0.95. In the U-flow pattern, the minimum α value is 0.63, corresponding to the condition of 3 kWe and a fuel utilization rate of 25%. Under the same condition, the Z-flow pattern also exhibits the minimum α value, but at 0.88. These results indicate that in the anode fluid region, the Z-flow pattern exhibits better uniformity than the U-flow pattern. Additionally, under the same stack capacity, changes in fuel utilization have little effect on the calculated α values, which is consistent with the trends observed in Figure 11.
Comparing the results for the cathode fluid region, the maximum α values are consistently observed under the condition of 1 kWe with an air utilization rate of 50%. The minimum α values occur under the condition of 3 kWe with an air utilization rate of 10%. Notably, under this condition, the α value for the Z-flow pattern is only 0.04. Additionally, the uniformity of the cathode fluid region is particularly sensitive to changes in any condition. By comparing Figure 12 with 
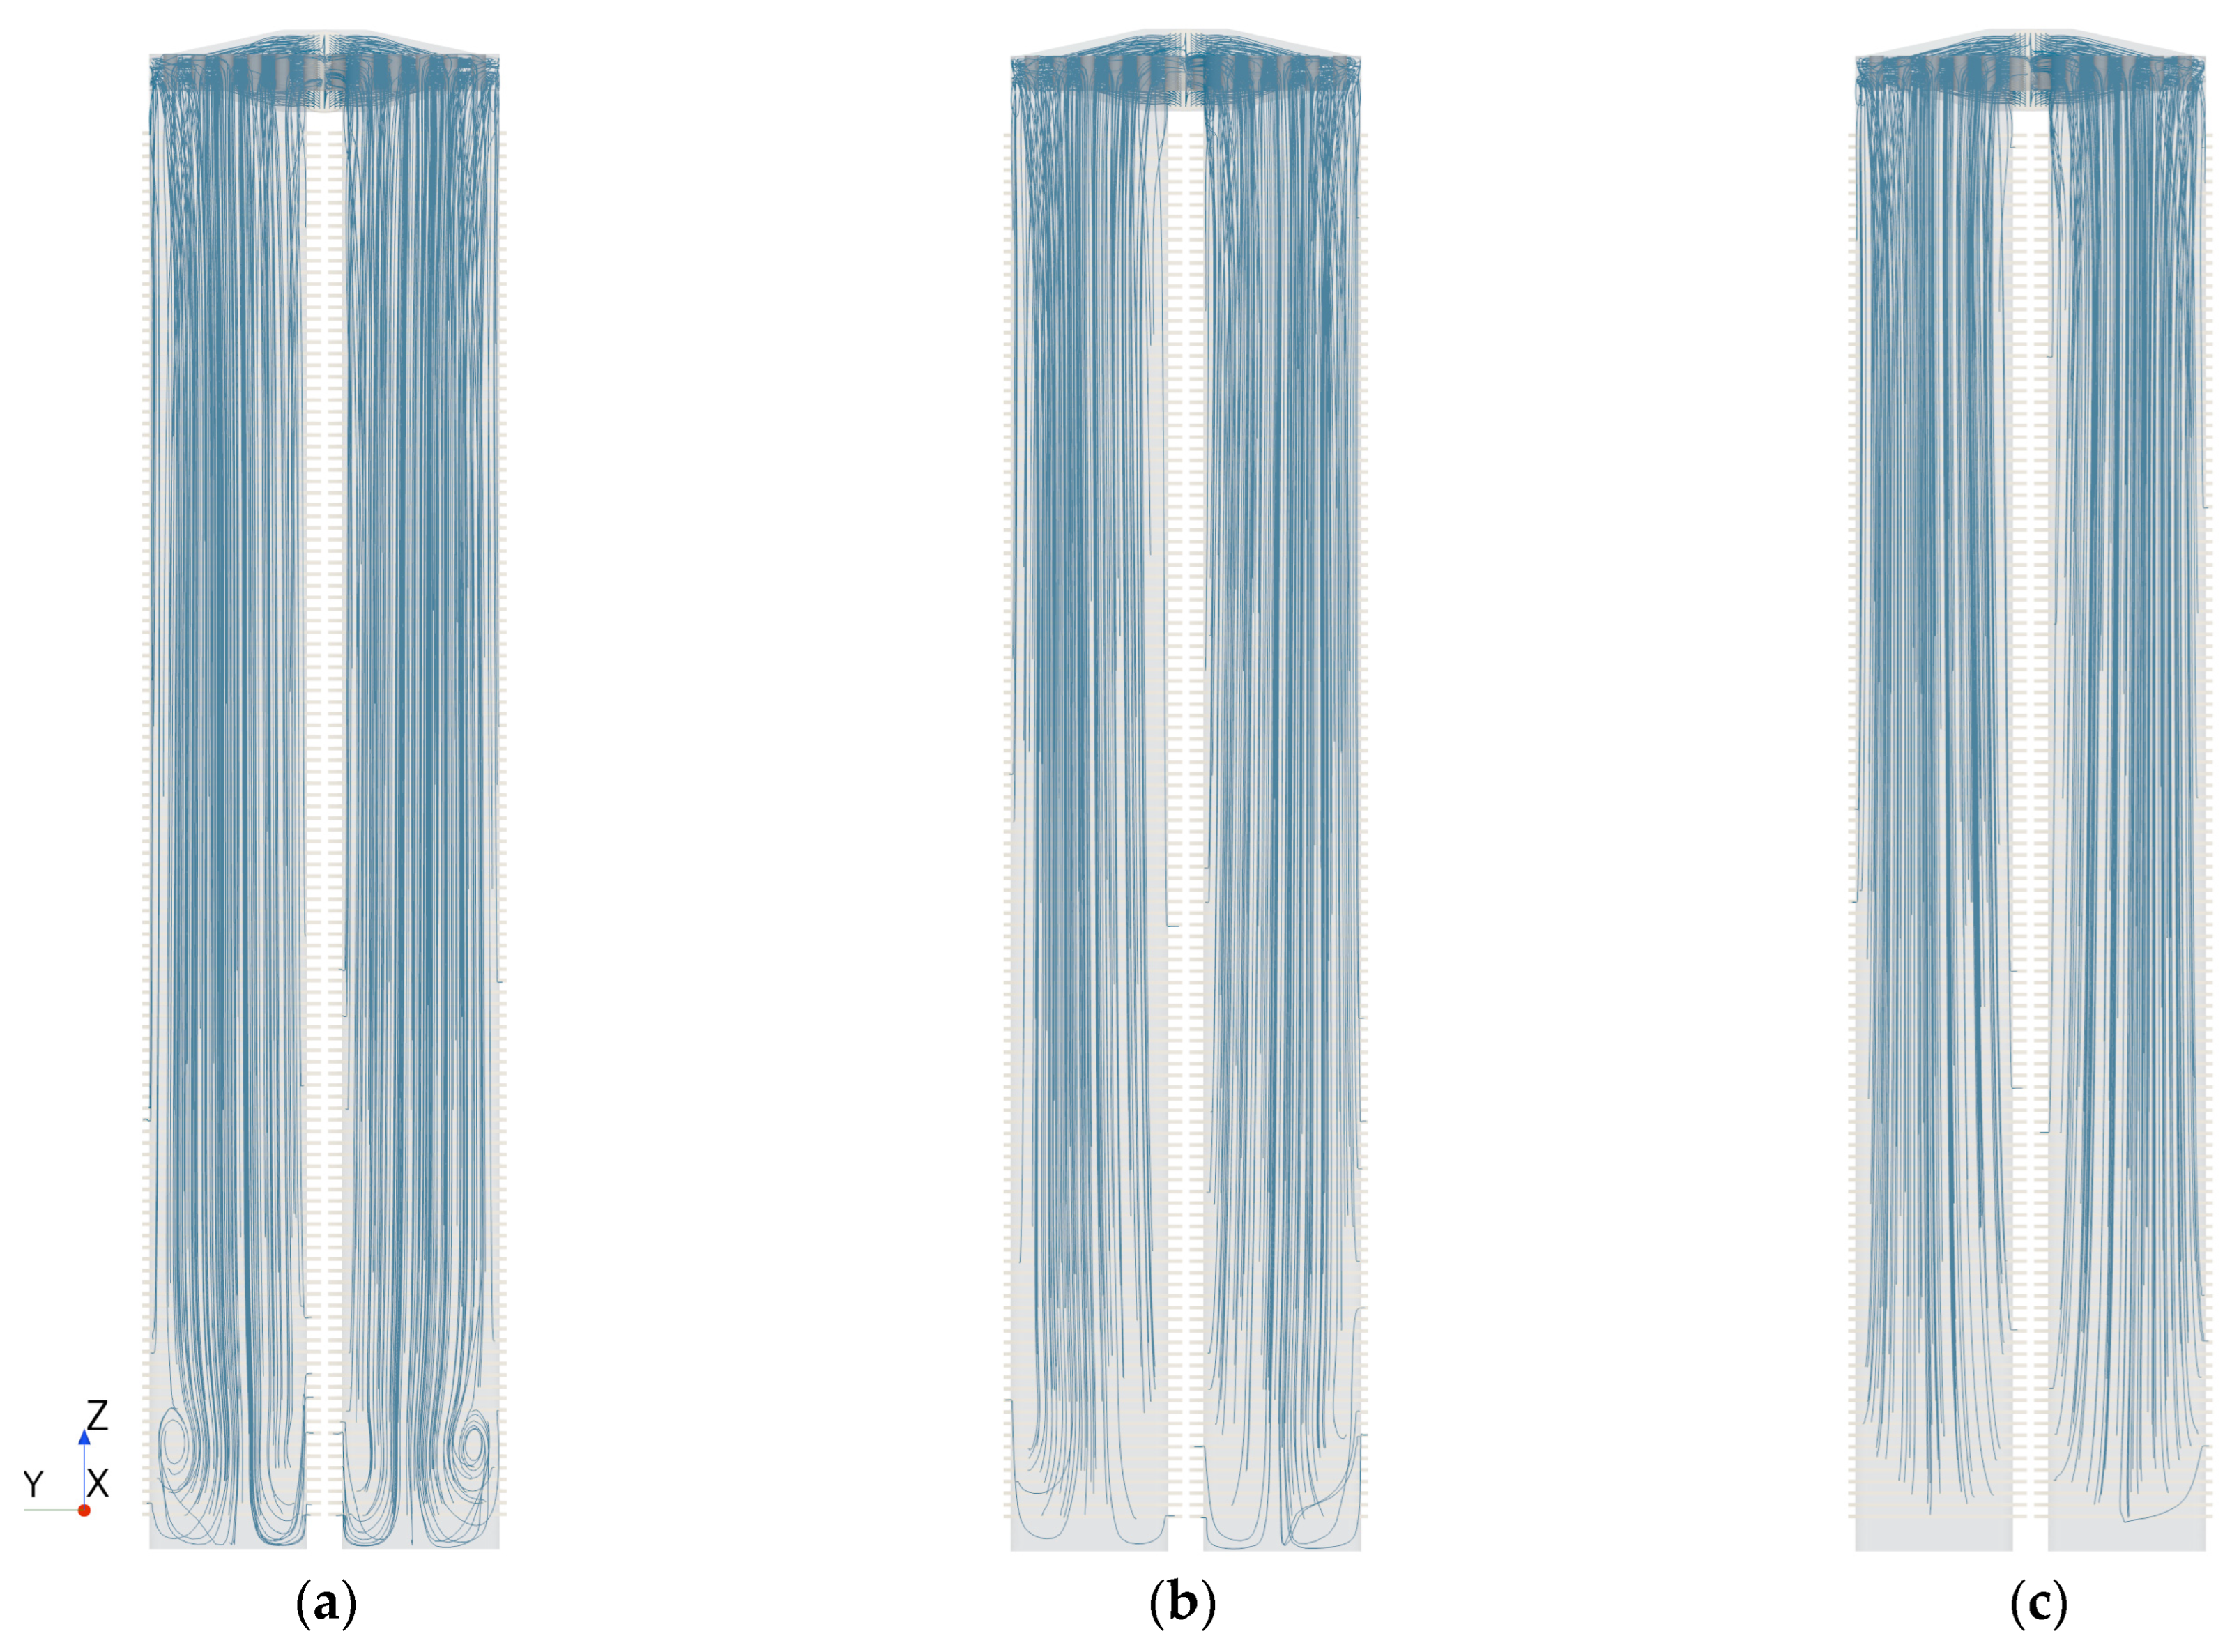
Figure 8, it can be observed that the distribution pattern of the uniformity factor α aligns closely with the distribution pattern of the core pressure drop ratio. Specifically, conditions with higher or lower core pressure drop ratios correspond to conditions with higher or lower α values. This indicates that a higher core pressure drop ratio significantly improves flow uniformity, whereas a lower core pressure drop ratio results in a marked decrease in flow uniformity. The key factor influencing the core pressure drop ratio lies in the pressure drop control within the manifolds. Therefore, optimizing the flow path design within the manifolds to make it smoother can effectively improve the flow uniformity of the stack, thereby enhancing its overall performance. To investigate the cause of the sudden deterioration in uniformity of the Z-flow pattern at 10% air utilization, we visualized the streamline plots in the air inlet manifold (Figure 13). The results clearly demonstrate that under 10% air utilization conditions, noticeable vortices form at the bottom of the manifold, resulting in disturbed flow characteristics in this region. These vortices induce uneven mass flow distribution among the bottom unit cells of the stack, consequently affecting the overall flow uniformity evaluation results (as shown in Figure 12). This phenomenon also reasonably explains the significant deviation in the dimensionless mass flow rate among unit cells in the 3 kWe stack at an air utilization rate of 10%, as illustrated in Figure 11d.
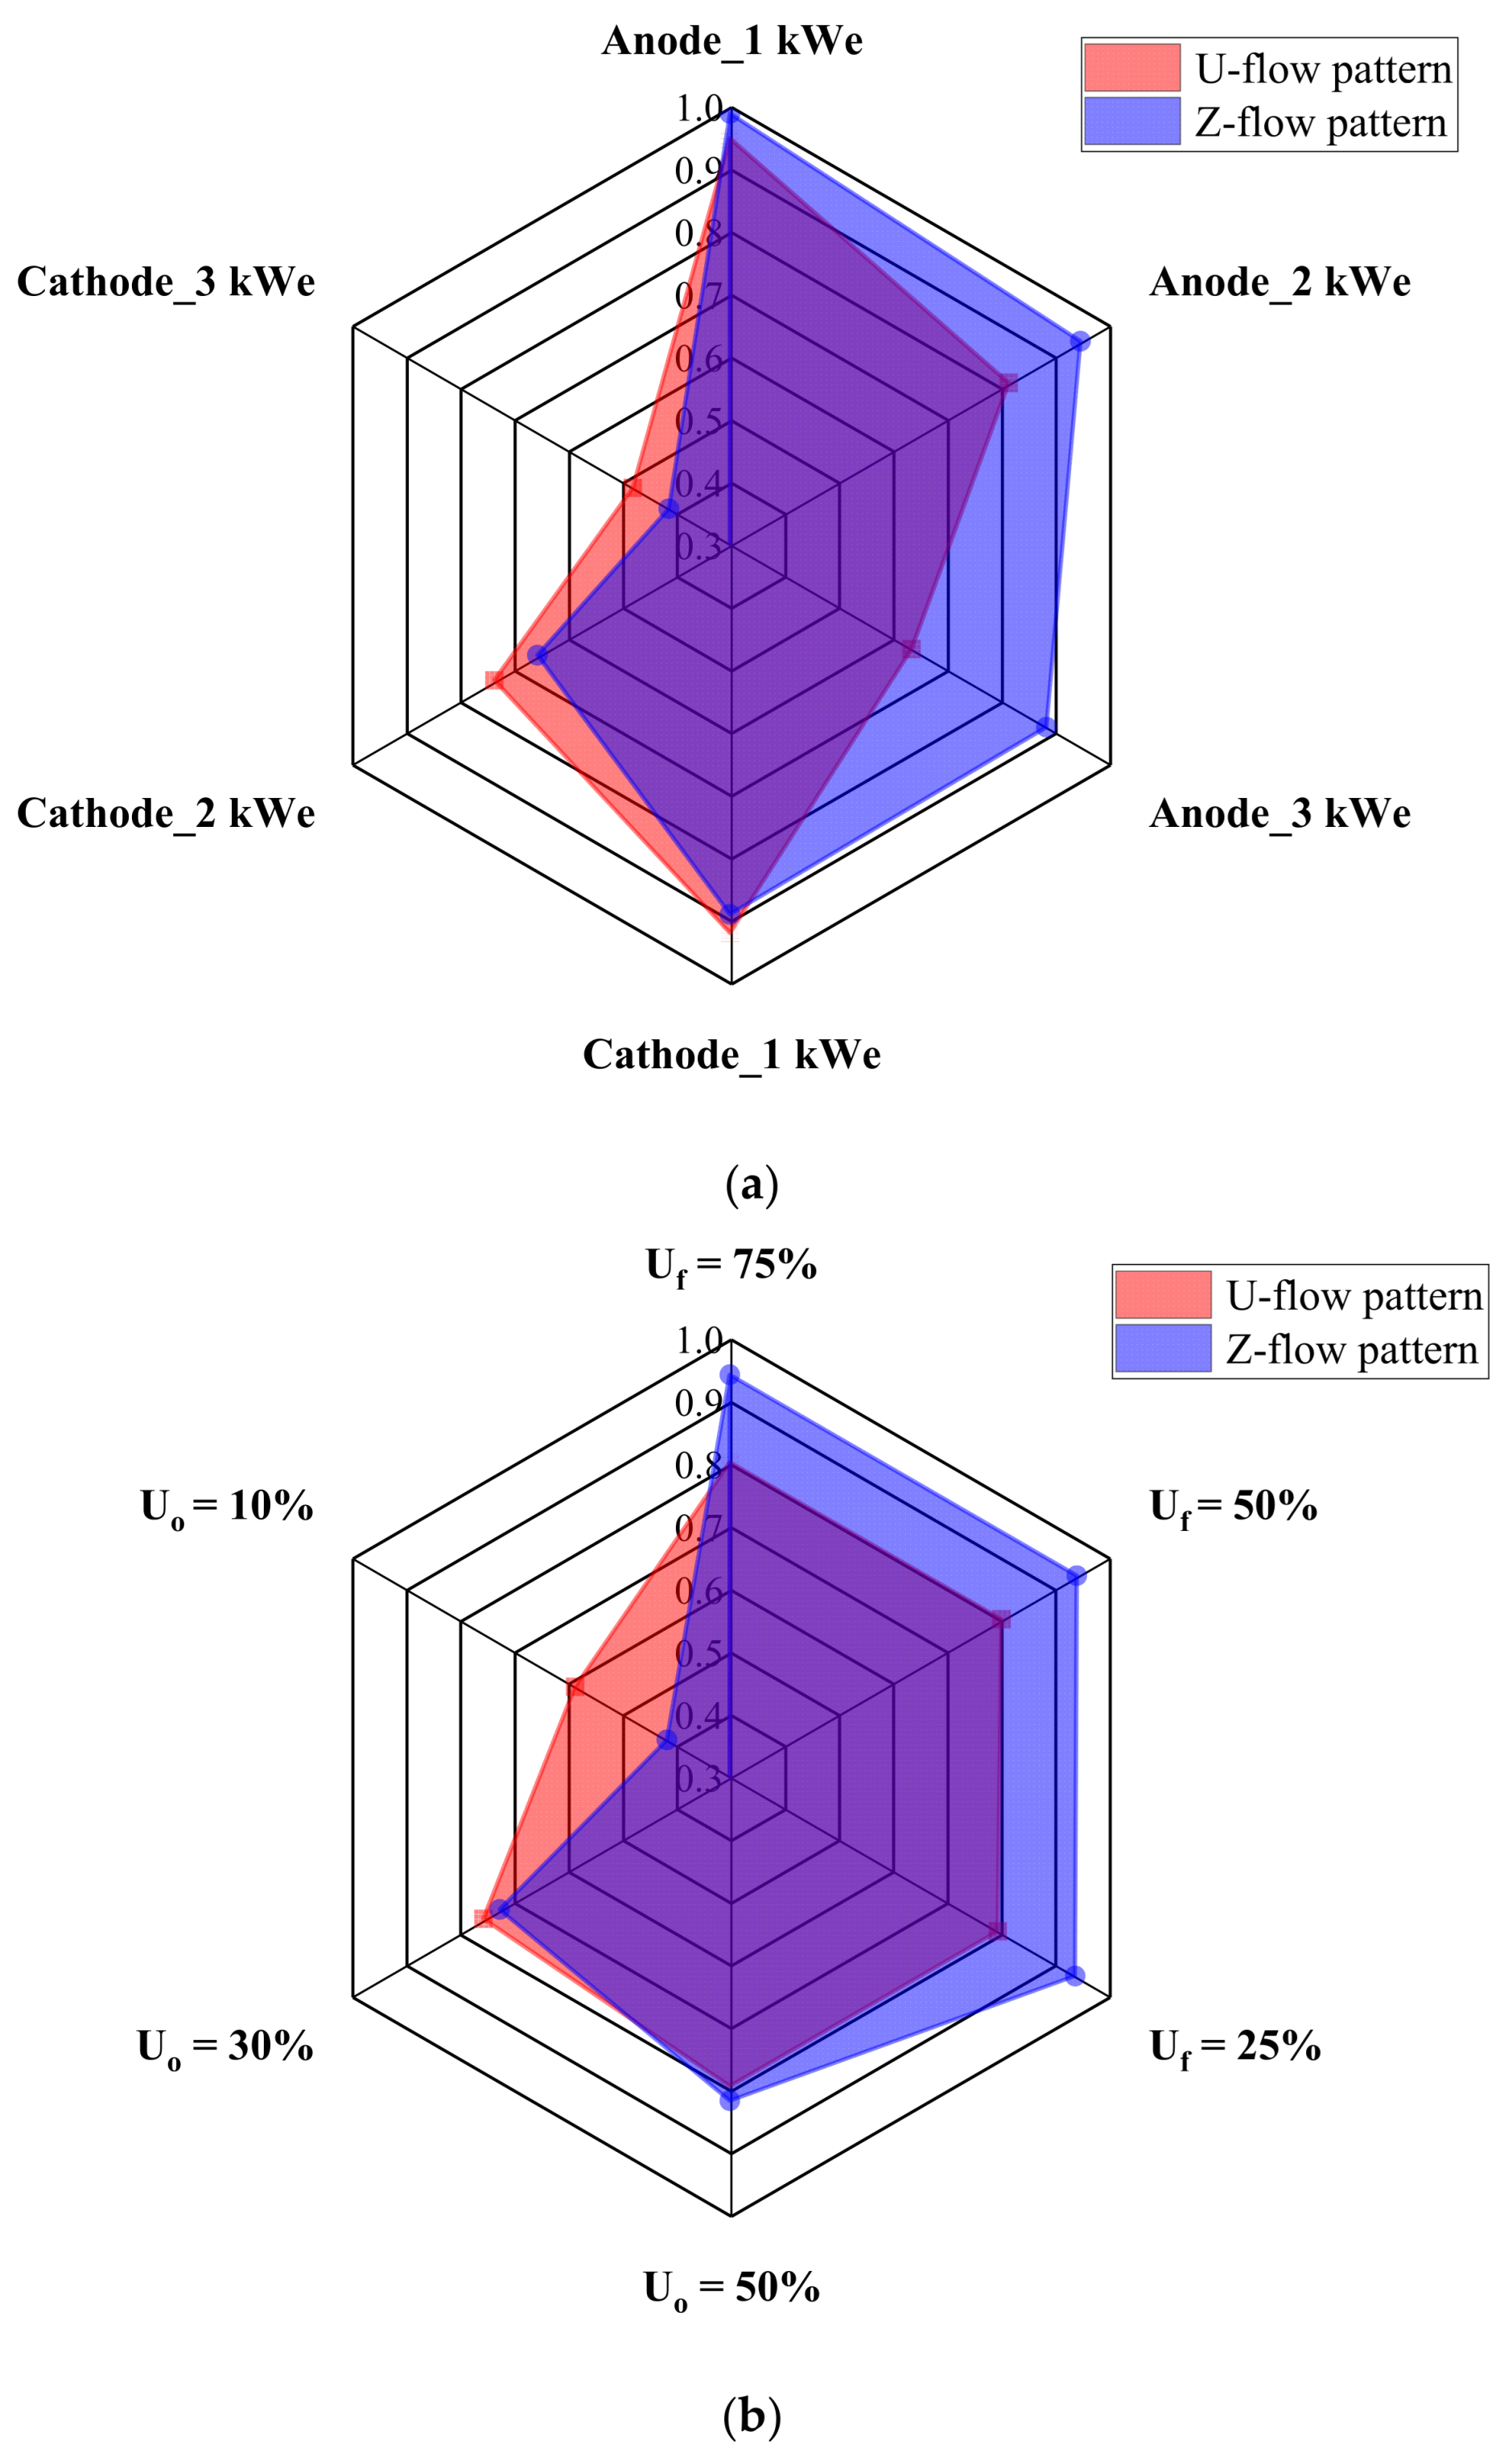
To better illustrate the differences in flow uniformity performance between the U-flow and Z-flow pattern designs, radar charts were created, as shown in Figure 14. These charts evaluate the flow uniformity of the U-flow and Z-flow patterns from two perspectives. First, the evaluation method used in Figure 14a involves comparing the average values of the three uniformity factors α calculated in Table 6 under the same stack capacity. For example, in the 1 kWe cathode fluid region of the U-flow pattern, the calculated α values under air utilization rates of 10%, 30%, and 50% are 0.88, 0.94, and 0.95, respectively. The average α value is thus 0.923. Similarly, the average α values for other conditions can be calculated. The evaluation method used in Figure 14b compares the average α values under the same reaction gas utilization rate but across different stack capacities. For instance, in the Z-flow pattern at an air utilization rate of 50%, the α values for 1 kWe, 2 kWe, and 3 kWe are 0.95, 0.83, and 0.68, respectively, resulting in an average α value of 0.82. The same approach is applied to calculate the average α values for other conditions. The radar charts created using these two evaluation methods effectively reveal the differences in flow uniformity performance between the two designs. In Figure 14a, it can be observed that for the anode fluid region, the Z-flow pattern outperforms the U-flow pattern across all capacities, particularly under the 3 kWe condition. For the cathode fluid region, the U-flow pattern has only a slight advantage over the Z-flow pattern. Under fixed fuel utilization conditions, the Z-flow pattern consistently outperforms the U-flow pattern. However, under an air utilization rate of 10%, the U-flow pattern surpasses the Z-flow pattern in performance. In summary, under various fuel utilization rates and stack capacities, the flow uniformity in the anode fluid region of the Z-flow pattern is superior to that of the U-flow pattern. Only when the air utilization rate is 10% does the performance of the Z-flow pattern lag significantly behind the U-flow pattern. Considering that the practical efficiency of fuel cells is the product of reversible thermodynamic efficiency, voltage efficiency, and fuel utilization efficiency, the performance of the anode fluid region is particularly critical. If a stack can achieve good flow uniformity under both high fuel utilization and large capacity conditions, it will significantly enhance the overall performance of the stack. The Z-flow pattern design is undoubtedly the better choice for stacks with large capacity requirements.
Equations (2) and (3) can be used to calculate the mass flow rate at the stack inlet based on the reaction gas utilization rates specified in the boundary conditions. From the simulations, it is observed that the mass flow rates distributed to individual unit cells within the stack are not uniform. Therefore, Equations (2) and (3) can also be used to calculate the corresponding reaction gas utilization rates for each unit cell. The minimum mass flow rate values under different conditions were selected, and the corresponding reaction gas utilization rates were calculated. The results are presented in Table 7. The results show that the reaction gas utilization rate corresponding to the minimum mass flow rate is higher than the reaction gas utilization rate specified in the boundary conditions, but the overall difference is small. However, it is noteworthy that in the anode fluid region of the U-flow pattern, when the stack capacity is 3 kWe and the fuel utilization rate is 75%, the fuel utilization rate corresponding to the minimum mass flow rate exceeds 100%. This unit cell is located at the top of the U-flow pattern stack. Although the fuel utilization rate of the unit cell calculated by the equation may differ from the fuel utilization rate of the unit cell derived from the actual operating condition of the stack, the result can also reflect the insufficient supply of fuel to the unit cell located at the top of the U-flow pattern stack and may be at risk of fuel starvation.

4. Conclusions

In this study, CFD simulations were conducted for two different flow path designs, the U-flow pattern and the Z-flow pattern. A detailed comparison and analysis of flow uniformity under various operating conditions were performed. The conclusions are as follows:
  • Under low stack capacity conditions, both designs exhibit good flow uniformity, but uniformity decreases as the stack height increases. A comparison between the pressure drop distribution in the core fluid region and the uniformity factor distribution reveals a strong correlation. This indicates that the core pressure drop ratio can influence the flow uniformity within the stack. Increasing the core pressure drop ratio or reducing the pressure drop ratio in the manifold fluid region can help improve flow uniformity within the stack.
  • A comprehensive comparison of the flow uniformity between the U-flow and Z-flow patterns shows that in the anode fluid region, the Z-flow pattern exhibits better flow uniformity than the U-flow pattern. In the cathode fluid region, the Z-flow pattern demonstrates a significant performance gap compared to the U-flow pattern only under an air utilization rate of 10%. However, since the actual efficiency of a fuel cell is highly correlated with fuel utilization, the flow uniformity in the anode fluid region is considered more critical. In the overall evaluation of this study, the Z-flow pattern demonstrates superior flow uniformity compared to the U-flow pattern.
  • Under the condition of a 3 kWe stack capacity and a fuel utilization rate of 75%, the unit cell at the top of the U-flow pattern stack exhibits a fuel utilization rate exceeding 100%. This indicates insufficient fuel supply to the top unit cell of the U-flow pattern under these conditions. In practical stack operation, when the stack height is too great, the U-flow pattern may result in insufficient fuel supply to the upper unit cells and excessive fuel supply to the lower unit cells. This imbalance not only affects the reaction rate of each unit cell but also reduces the overall stack efficiency. For large-capacity stacks, the Z-flow pattern is the better choice for flow path design.
Although the CFD simulations in this study ignored the effects of electrochemical reactions and heat transfer, the flow analysis and comparison methods for the two designs are reasonable. The results of this study can serve as a reference for improving flow path design and flow uniformity in stacks. Future work will include the effects of electrochemical reactions and heat transfer to evaluate the performance of large-capacity stacks and novel flow path designs.

Author Contributions

Conceptualization, H.-J.K. and K.-S.Y.; methodology, K.-W.Y.; software, H.Y.Y.; validation, K.-S.Y. and J.-H.Y.; formal analysis, Y.-J.K.; investigation, H.Y.Y.; resources, J.-H.Y.; data curation, K.-W.Y.; writing—original draft preparation, H.Y.Y.; writing—review and editing, Y.-J.K.; visualization, H.Y.Y.; supervision, J.-H.Y.; project administration, Y.-J.K.; funding acquisition, Y.-J.K. All authors have read and agreed to the published version of the manuscript.

Funding

This work was supported by the Korea Institute of Energy Technology Evaluation and Planning (KETEP) grant funded by the Korean government (MOTIE) under the development of a highly efficient 10 kW-scale SOFC [grant number 20213030030220].

Data Availability Statement

The original contributions presented in the study are included in the article, further inquiries can be directed to the corresponding author.

Conflicts of Interest

The authors declare that the research was conducted in the absence of any commercial or financial relationships that could be construed as a potential conflict of interest.

References

  1. Steele, B.C.H.; Heinzel, A. Materials for fuel-cell technologies. Nature 2001, 414, 345–352. [Google Scholar] [CrossRef] [PubMed]
  2. Chan, S.H.; Ho, H.K.; Tian, Y. Modelling of simple hybrid solid oxide fuel cell and gas turbine power plant. J. Power Sources 2002, 109, 111–120. [Google Scholar] [CrossRef]
  3. Liang, W.X.; Han, J.T.; Ge, Y.; Zhu, W.C.; Yang, J.W.; Lv, W.; Liu, C.H. Investigation on combining multi-effect distillation and double-effect absorption refrigeration cycle to recover exhaust heat of SOFC-GT system. Energy Conv. Manag. 2024, 301, 118054. [Google Scholar] [CrossRef]
  4. Kim, Y.S.; Lee, Y.D.; Ahn, K.Y. System integration and proof-of-concept test results of SOFC–engine hybrid power generation system. Appl. Energy 2020, 277, 115542. [Google Scholar] [CrossRef]
  5. Knosala, K.; Langenberg, L.; Pflugradt, N.; Stenzel, P.; Kotzur, L.; Stolten, D. The role of hydrogen in German residential buildings. Energ. Buildings 2022, 276, 112480. [Google Scholar] [CrossRef]
  6. Li, C.J.; Wang, Z.X.; Liu, H.; Guo, F.F.; Li, C.H. Exergetic and exergoeconomic evaluation of an SOFC-Engine-ORC hybrid power generation system with methanol for ship application. Fuel 2024, 357, 129944. [Google Scholar] [CrossRef]
  7. Fu, Q.; Li, Z.; Wei, W.; Liu, F.; Xu, X.; Liu, Z. Performance enhancement of a beam and slot interconnector for anode-supported SOFC stack. Energy Conv. Manag. 2021, 241, 114277. [Google Scholar] [CrossRef]
  8. Fu, Q.; Li, Z.; Wei, W.; Liu, F.; Xu, X.; Liu, Z. Performance enhancement of planar solid oxide fuel cell using a novel interconnector design. Int. J. Hydrogen Energy 2021, 46, 21634–21656. [Google Scholar] [CrossRef]
  9. Minh, N. Solid oxide fuel cell technology: Features and applications. Solid. State Ion. 2004, 174, 271–277. [Google Scholar] [CrossRef]
  10. Zhao, C.; Yang, J.; Zhang, T.; Yan, D.; Pu, J.; Chi, B.; Li, J. Numerical modeling of manifold design and flow uniformity analysis of an external manifold solid oxide fuel cell stack. Int. J. Hydrogen Energy 2020, 45, 14440–14451. [Google Scholar] [CrossRef]
  11. Zhang, W.; Kuang, X.; Zhang, W.; Yan, D.; Jia, L. Flow field optimization for performance enhancement of planar solid oxide fuel cells. Int. J. Hydrogen Energy 2024, 62, 1171–1182. [Google Scholar] [CrossRef]
  12. Gong, C.; Tu, Z.; Chan, S. A novel flow field design with flow re-distribution for advanced thermal management in Solid oxide fuel cell. Appl. Energy 2023, 331, 120364. [Google Scholar] [CrossRef]
  13. Miao, X.; Rizvandi, O.B.; Navasa, M.; Frandsen, H.L. Modelling of local mechanical failures in solid oxide cell stacks. Appl. Energy 2021, 293, 116901. [Google Scholar] [CrossRef]
  14. Xu, M.; Li, T.; Yang, M.; Andersson, M.; Fransson, I.; Larsson, T.; Sundén, B. Modeling of an anode supported solid oxide fuel cell focusing on thermal stresses. Int. J. Hydrogen Energy 2016, 41, 14927–14940. [Google Scholar] [CrossRef]
  15. Guk, E.; Venkatesan, V.; Babar, S.; Jackson, L.; Kim, J.S. Parameters and their impacts on the temperature distribution and thermal gradient of solid oxide fuel cell. Appl. Energy 2019, 241, 164–173. [Google Scholar] [CrossRef]
  16. Li, L.; Xu, P.; Li, Q.; Zheng, R.; Xu, X.; Wu, J.; He, B.; Bao, J.; Tan, D. A coupled LBM-LES-DEM particle flow modeling for microfluidic chip and ultrasonic-based particle aggregation control method. Appl. Math. Model. 2025, 143, 116025. [Google Scholar] [CrossRef]
  17. Tan, Y.; Ni, Y.; Xu, W.; Xie, Y.; Li, L.; Tan, D. Key technologies development trends of the soft abrasive flow finishing method. J. Zhejiang Univ. Sci. A 2023, 24, 1043–1064. [Google Scholar] [CrossRef]
  18. Chen, C.; Jonsson, L.T.I.; Tilliander, A.; Cheng, G.; Jönsson, P.G. A mathematical modeling study of the influence of small amounts of KCl solution tracers on mixing in water and residence time distribution of tracers in a continuous flow reactor-metallurgical tundish. Chem. Eng. Sci. 2015, 137, 914–937. [Google Scholar] [CrossRef]
  19. Song, J.; Luo, Y.; Li, Y.; Guo, Z.; Wang, T.; Geng, M.; Lin, W.; Fan, J.; Chen, C. Comparison of Fluid Flow and Tracer Dispersion in Four-Strand Tundish under Fewer Strand Casting and Sudden Blockage of Strand Conditions. Metals 2024, 14, 571. [Google Scholar] [CrossRef]
  20. Khaleel, M.A.; Lin, Z.; Singh, P.; Surdoval, W.; Collin, D. A finite element analysis modeling tool for solid oxide fuel cell development: Coupled electrochemistry, thermal and flow analysis in MARC®. J. Power Sources 2004, 130, 136–148. [Google Scholar] [CrossRef]
  21. Nishida, R.T.; Beale, S.B.; Pharoah, J.G.; de Haart, L.G.; Blum, L. Three-dimensional computational fluid dynamics modelling and experimental validation of the Jülich Mark-F solid oxide fuel cell stack. J. Power Sources 2018, 373, 203–210. [Google Scholar] [CrossRef]
  22. Kim, Y.J.; Lee, M.C. Numerical investigation of flow/heat transfer and structural stress in a planar solid oxide fuel cell. Int. J. Hydrogen Energy 2017, 42, 18504–18513. [Google Scholar] [CrossRef]
  23. Khazaee, I.; Rava, A. Numerical simulation of the performance of solid oxide fuel cell with different flow channel geometries. Energy 2017, 19, 235–244. [Google Scholar] [CrossRef]
  24. Kim, Y.J.; Lee, M.C. The influence of flow direction variation on the performance of a single cell for an anode-substrate flat-panel solid oxide fuel cell. Int. J. Hydrogen Energy 2020, 45, 20369–20381. [Google Scholar] [CrossRef]
  25. Li, Y.; Grimm, F.; Karl, J. Numerical and experimental analysis of the effects of tar components on single planar SOFC under high fuel utilization. Electrochim. Acta 2023, 449, 142234. [Google Scholar] [CrossRef]
  26. Lin, C.; Kerscher, F.; Herrmann, S.; Steinrücken, B.; Spliethoff, H. Analysis on temperature uniformity in methane-rich internal reforming solid oxide fuel cells (SOFCs). Int. J. Hydrogen Energy 2024, 57, 769–788. [Google Scholar] [CrossRef]
  27. Kim, Y.J.; Jung, W.N.; Yu, J.H.; Kim, H.J.; Yun, K.S.; Kang, D.G.; Lee, M.C. Design and analysis of SOFC stack with different types of external manifolds. Int. J. Hydrogen Energy 2020, 45, 29143–29154. [Google Scholar] [CrossRef]
  28. Dai, J.Q.; Yang, Z.M.; Wang, W.S.; Liu, J.P.; Akenteng, Y.D.; Chen, D.F. Study the flow and species distribution characteristics in a typical 25-cell proton ceramic fuel cell stack by 3D large-scale modeling. Ionics 2022, 28, 1863–1872. [Google Scholar] [CrossRef]
  29. Ashraf, M.A.; Rashid, K.; Rahimipetroudi, I.; Kim, H.J.; Dong, S.K. Analyzing different planar biogas-fueled SOFC stack designs and their effects on the flow uniformity. Energy 2020, 190, 116450. [Google Scholar] [CrossRef]
  30. Gong, C.; Luo, X.; Tu, Z.; Chan, S.H. A novel flow channel design to achieve high temperature homogenization in solid oxide fuel cell. Int. J. Hydrogen Energy 2024, 52, 442–453. [Google Scholar] [CrossRef]
  31. Bae, Y.; Lee, S.; Yoon, K.J.; Lee, J.H.; Hong, J. Three-dimensional dynamic modeling and transport analysis of solid oxide fuel cells under electrical load change. Energy Convers. Manag. 2018, 165, 405–418. [Google Scholar] [CrossRef]
  32. Li, A.; Song, C.; Lin, Z. A multiphysics fully coupled modeling tool for the design and operation analysis of planar solid oxide fuel cell stacks. Appl. Energy 2017, 190, 1234–1244. [Google Scholar] [CrossRef]
  33. Peksen, M. 3D transient multiphysics modelling of a complete high temperature fuel cell system using coupled CFD and FEM. Int. J. Hydrogen Energy 2014, 39, 5137–5147. [Google Scholar] [CrossRef]
  34. Pianko-Oprych, P.; Zinko, T.; Jaworski, Z. Modeling of thermal stresses in a microtubular solid oxide fuel cell stack. J. Power Sources 2015, 300, 10–23. [Google Scholar] [CrossRef]
  35. Yin, H.Y.; Yi, K.W.; Kim, Y.J.; Kim, H.J.; Yun, K.S.; Yu, J.H. Numerical Analysis of Flow in U-Type Solid Oxide Fuel Cell Stacks. Energies 2024, 17, 5764. [Google Scholar] [CrossRef]
  36. Siemens. “STARCCM+ User’s Guide 17.02”; Siemens: Munich, Germany, 2021; Available online: https://www.plm.automation.siemens.com (accessed on 13 November 2024).
  37. Celik, I.B.; Ghia, U.; Roache, P.J.; Freitas, C.J. Procedure for estimation and reporting of uncertainty due to discretization in CFD applications. ASME J. Fluids Eng. 2008, 130, 078001. [Google Scholar] [CrossRef]
  38. Chen, D.; Zeng, Q.; Su, S.; Bi, W.; Ren, Z. Geometric optimization of a 10-cell modular planar solid oxide fuel cell stack manifold. Appl. Energy 2013, 112, 1100–1107. [Google Scholar] [CrossRef]
  39. Bi, W.; Chen, D.; Lin, Z. A key geometric parameter for the flow uniformity in planar solid oxide fuel cell stacks. Int. J. Hydrogen Energy 2009, 34, 3873–3884. [Google Scholar] [CrossRef]
  40. Chen, A.; Sparrow, E.M. Turbulence modeling for flow in a distribution manifold. Int. J. Heat Mass Transf. 2009, 52, 1573–1581. [Google Scholar] [CrossRef]
  41. Yang, H.; Wang, Y.; Ren, M.; Yang, X. Effect of the rectangular exit-port geometry of a distribution manifold on the flow performance. Appl. Therm. Eng. 2017, 117, 481–486. [Google Scholar] [CrossRef]
  42. Peksen, M.; Meric, D.; Al-Masri, A.; Stolten, D. A 3D multiphysics model and its experimental validation for predicting the mixing and combustion characteristics of an afterburner. Int. J. Hydrogen Energy 2015, 40, 9462–9472. [Google Scholar] [CrossRef]
  43. Shih, T.-H.; Liou, W.W.; Shabbir, A.; Yang, Z.; Zhu, J. A new k-ϵ eddy viscosity model for high Reynolds number turbulent flows. Comput. Fluids 1995, 24, 227–238. [Google Scholar] [CrossRef]
Figure 1. Diagram of U-flow pattern SOFC stack: (a) 3D view of the U-flow pattern stack; (b) reaction gas flow directions; (c) internal flow path of the stack [35].
Energies 18 01682 g001
Figure 2. Diagram of Z-flow pattern SOFC stack: (a) 3D view of the Z-flow pattern stack; (b) reaction gas flow directions; (c) internal flow path of the stack.
Energies 18 01682 g002
Figure 3. Three-dimensional modeling of the U-flow pattern stacks: (a) solid domain; (b) fluid region [35].
Energies 18 01682 g003
Figure 4. Three-dimensional modeling of the Z-flow pattern stacks: (a) solid domain; (b) fluid region.
Energies 18 01682 g004
Figure 5. Meshes used for CFD simulation: (a) mesh independence verification; (b) cathode fluid region of the 1 kWe U-flow pattern; (c) cathode fluid region of the 1 kWe Z-flow pattern.
Energies 18 01682 g005
Figure 6. Anode flow region pressure distribution cloud of 1–3 kWe stack: (a) 1 kWe U-flow pattern stack; (b) 2 kWe U-flow pattern stack; (c) 3 kWe U-flow pattern stack [35]; (d) 1 kWe Z-flow pattern stack; (e) 2 kWe Z-flow pattern stack; (f) 3 kWe Z-flow pattern stack.
Energies 18 01682 g006
Figure 7. Cathode flow region pressure distribution cloud of 1–3 kWe stack: (a) 1 kWe U-flow pattern stack; (b) 2 kWe U-flow pattern stack; (c) 3 kWe U-flow pattern stack [35]; (d) 1 kWe Z-flow pattern stack; (e) 2 kWe Z-flow pattern stack; (f) 3 kWe Z-flow pattern stack.
Energies 18 01682 g007
Figure 8. 3D bar charts of the core pressure drop ratio: (a) U-flow pattern anode fluid regions; (b) Z-flow pattern anode fluid regions; (c) U-flow pattern cathode fluid regions; (d) Z-flow pattern cathode fluid regions.
Energies 18 01682 g008
Figure 9. Velocity distribution cloud and streamlines in the cathode fluid region of the 1 kWe inlet manifold: (a) U-flow pattern; (b) Z-flow pattern.
Energies 18 01682 g009
Figure 10. Mass flow rate distribution at the inlet of each cell in the 1 kWe stack (left axis) and the corresponding cell pressure drop distribution (right axis): (a) U-flow pattern stack anode fluid region; (b) U-flow pattern stack cathode fluid region; (c) Z-flow pattern stack anode fluid region; (d) Z-flow pattern stack cathode fluid region.
Energies 18 01682 g010
Figure 11. Dimensionless mass flow distribution of unit cells: (a) 1–3 kWe U-flow pattern anode fluid regions; (b) 1–3 kWe Z-flow pattern anode fluid regions; (c) 1–3 kWe U-flow pattern cathode fluid regions; (d) 1–3 kWe Z-flow pattern cathode fluid regions.
Energies 18 01682 g011
Figure 12. Visualization of uniformity factors distribution: (a) U-flow pattern anode fluid regions; (b) Z-flow pattern anode fluid regions; (c) U-flow pattern cathode fluid regions; (d) Z-flow pattern cathode fluid regions.
Energies 18 01682 g012
Figure 13. Streamline plots of the 3 kWe Z-flow pattern cathode manifold at different air utilization rates: (a) Uo = 10%; (b) Uo = 30%; (c) Uo = 50%.
Energies 18 01682 g013
Figure 14. Overall flow performance assessment of U-flow pattern and Z-flow pattern stacks: (a) based on stack capacities; (b) based on fuel and air utilization rates.
Energies 18 01682 g014
Table 1. Parameters of the SOFC stack used for the simulations.
ParametersValue
Active area100 × 100 mm2
Gas channel height (anode)0.75 mm
Gas channel height (cathode)1.06 mm
Operational temperature750 °C
Outlet pressure1 atm
UtilizationUf25%, 50%, 75%
Uo10%, 30%, 50%
Inlet pipe diameterAnode17.05 mm
Cathode23.40 mm
DensityFuel0.137 kg/m3
Air0.3455 kg/m3
ViscosityFuel3.01 × 10−5 Pa·s
Air4.31 × 10−5 Pa·s
Table 2. Sample discretization computational error.
φ = Stack Pressure Drop of U-Flow Patternφ = Stack Pressure Drop of Z-Flow Pattern
N1, N2, N368,064,082; 29,578,794; 14,497,55367,766,821; 29,060,575; 10,374,839
r211.3431.350
r321.2941.439
φ1100.25140.43
φ299.22139.06
φ395.11135.60
P5.5872.185
φext21100.50141.90
ea211.0%1.0%
eext210.2%1.0%
GCIfine210.31%1.31%
Table 3. Calculation of model inlet conditions.
Stack Power1 kWe2 kWe3 kWe
Unit cell numbers4080120
Stack core height144.16 mm276.56 mm408.96 mm
Mass flow rateAnode (H2)25%3.32 × 10⁻⁵ kg/s6.63 × 10−5 kg/s9.95 × 10−5 kg/s
50%1.66 × 10⁻⁵ kg/s3.32 × 10−5 kg/s4.97 × 10−5 kg/s
75%1.11 × 10⁻⁵ kg/s2.21 × 10−5 kg/s3.32 × 10−5 kg/s
Cathode (Air)10%2.86 × 10⁻³ kg/s5.76 × 10−3 kg/s8.59 × 10−3 kg/s
30%9.54 × 10⁻⁴ kg/s1.91 × 10−3 kg/s2.86 × 10−3 kg/s
50%5.73 × 10⁻⁴ kg/s1.15 × 10−3 kg/s1.72 × 10−3 kg/s
Average velocityAnode (H2)25%1.06 m/s2.12 m/s3.18 m/s
50%0.53 m/s1.06 m/s1.59 m/s
75%0.35 m/s0.71 m/s1.06 m/s
Cathode (Air)10%19.27 m/s38.53 m/s57.80 m/s
30%6.42 m/s12.84 m/s19.27 m/s
50%3.85 m/s7.71 m/s11.56 m/s
Reynolds numberAnode (H2)25%82.28164.57246.85
50%41.1482.28123.42
75%27.4354.8682.28
Cathode (Air)10%3613.817227.6310,841.44
30%1204.602409.213613.81
50%722.761445.532168.29
Table 4. Pressure drop in each region of the anode fluid region of the stack.
Fluid Region Stack TypeElectrical CapacityUtilization RateOverall Stack Pressure Drop (Pa)Inlet Manifold Pressure Drop (Pa)Outlet Manifold Pressure Drop (Pa)Average Unit Cell Pressure Drop (Pa)
AnodeU-flow pattern [35]1 kWe25%8.471.241.136.10
50%4.140.560.533.05
75%2.740.360.352.03
2 kWe25%12.533.292.946.30
50%5.911.431.333.15
75%3.850.900.852.10
3 kWe25%18.165.965.296.91
50%8.292.532.323.44
75%5.341.571.472.29
Z-flow pattern1 kWe25%9.922.731.106.09
50%4.851.290.523.04
75%3.210.840.342.03
2 kWe25%15.716.603.016.11
50%7.453.021.383.05
75%4.871.940.892.03
3 kWe25%23.7411.725.856.18
50%10.985.252.653.08
75%7.103.351.702.05
Table 5. Pressure drop in each region of the cathode fluid region of the stack.
Fluid Region Stack TypeElectrical CapacityUtilization RateOverall Stack Pressure Drop (Pa)Inlet Manifold Pressure Drop (Pa)Outlet Manifold Pressure Drop (Pa)Average Unit Cell Pressure Drop (Pa)
CathodeU-flow pattern [35]1 kWe10%480.85154.57164.98161.31
30%99.2222.9823.5052.73
50%52.2410.2510.3331.66
2 kWe10%1392.36570.45637.71184.20
30%210.8177.5878.0555.18
50%97.2231.9732.7732.53
3 kWe10%2941.451247.681449.82243.95
30%410.55162.99183.9163.65
50%173.0265.7671.2436.03
Z-flow pattern1 kWe10%673.41351.42157.12164.88
30%139.0662.0224.2052.84
50%72.8131.509.6831.63
2 kWe10%2028.301223.90587.33217.07
30%317.99185.8176.0656.12
50%149.8685.5631.8732.44
3 kWe10%4254.722637.571302.59314.55
30%606.87379.03163.2864.56
50%265.30164.4966.0634.76
Table 6. Uniformity factors for the 1 kWe, 2 kWe, and 3 kWe stack models.
Electrical CapacityFluid RegionUtilization RateUniformity Factor (α1) [35]Uniformity Factor (α2)
1 kWeAnodeUf = 75%0.950.99
Uf = 50%0.950.99
Uf = 25%0.950.99
CathodeUo = 50%0.950.95
Uo = 30%0.940.92
Uo = 10%0.880.81
2 kWeAnodeUf = 75%0.820.95
Uf = 50%0.820.95
Uf = 25%0.810.95
CathodeUo = 50%0.820.83
Uo = 30%0.780.74
Uo = 10%0.610.40
3 kWeAnodeUf = 75%0.640.89
Uf = 50%0.640.89
Uf = 25%0.630.88
CathodeUo = 50%0.620.68
Uo = 30%0.550.52
Uo = 10%0.270.04
Table 7. Utilization of minimum flow rate for the 1 kWe, 2 kWe, and 3 kWe stack models.
Electrical CapacityFluid RegionUtilization RateMinimum Flow Rate of U-Flow Pattern [kg/s]Minimum Flow Rate of Z-Flow Pattern [kg/s]Utilization of U-Flow Pattern [35]Utilization of Z-Flow Pattern
1 kWeAnodeUf = 75%2.61 × 10−72.73 × 10−779.3276.04
Uf = 50%3.92 × 10−74.08 × 10−752.9050.73
Uf = 25%7.84 × 10−78.17 × 10−726.4525.37
CathodeUo = 50%1.36 × 10−51.36 × 10−552.5952.78
Uo = 30%2.25 × 10−52.16 × 10−531.8633.17
Uo = 10%6.39 × 10−55.28 × 10−511.3913.55
2 kWeAnodeUf = 75%2.22 × 10−72.61 × 10−793.3179.42
Uf = 50%3.32 × 10−73.91 × 10−762.3452.98
Uf = 25%6.63 × 10−77.80 × 10−731.2426.57
CathodeUo = 50%1.17 × 10−51.21 × 10−560.9459.18
Uo = 30%1.86 × 10−51.76 × 10−538.3840.63
Uo = 10%4.60 × 10−53.48 × 10−515.5620.56
3 kWeAnodeUf = 75%1.72 × 10−72.43 × 10−7120.3785.28
Uf = 50%2.58 × 10−73.64 × 10−780.4157.00
Uf = 25%5.13 × 10−77.22 × 10−740.4428.72
CathodeUo = 50%0.90 × 10−51.06 × 10−579.2667.25
Uo = 30%1.40 × 10−51.52 × 10−551.2046.93
Uo = 10%3.11 × 10−52.87 × 10−523.0024.91
Disclaimer/Publisher’s Note: The statements, opinions and data contained in all publications are solely those of the individual author(s) and contributor(s) and not of MDPI and/or the editor(s). MDPI and/or the editor(s) disclaim responsibility for any injury to people or property resulting from any ideas, methods, instructions or products referred to in the content.

