Article

Green System Effects on Energy Environmental Sustainability of Urban Built-Up Areas

by
Carla Balocco
*,
Giacomo Pierucci
and
Cristina Piselli
Department of Architecture (DIDA), University of Florence, 50121 Florence, Italy
*
Author to whom correspondence should be addressed.
Energies 2025, 18(7), 1640; https://doi.org/10.3390/en18071640
Submission received: 21 February 2025 / Revised: 17 March 2025 / Accepted: 23 March 2025 / Published: 25 March 2025
(This article belongs to the Section G: Energy and Buildings)

Abstract

:
This work presents a methodological approach for the assessment of the combined effects of air enthalpy variations due to the presence of green systems and building thermodynamics. It serves as a valuable tool for energy sustainability improvement of urban areas and for defining scenarios of integrated energy strategies with low environmental impact from the perspective of green energy transition and environmental sustainability. The proposed approach is based on two energy environmental methods, i.e., top-down and bottom-up. Using environmental thermodynamics, they allow for the evaluation of energy sustainability of green ecosystem services in urban areas and their areal distribution in different built-up zones. The proposed methodological approach is an effective operational tool for urban energy and environmental sustainability evaluations, focusing not only on the reduction of anthropogenic impacts, mitigation of urban heat islands, and climate change adaptation but also on promoting energy-efficient microclimate changes.

1. Introduction

The growing urgency to address environmental challenges, particularly climate change, has led to an increasing focus on sustainability, energy, and environmental policies. One of the most impactful areas for sustainable transition is the building sector [1]. Building–plant systems are responsible for significant energy consumption and greenhouse gas emissions. Indeed, the building sector, involving construction, end-of-life, building–plant system working conditions, and anthropogenic weight in urban areas, i.e., the global Life Cycle and Life Cycle Energy Cost Assessment, accounts for an important portion of the overall energy environmental impact [2]. Therefore, these fundamental issues imply the need for the implementation of urban energy policies that support strategies to reduce the environmental impact and tackle climate change [3]. In this context, researchers have been studying different active and passive strategies to promote the energy environmental sustainability of buildings [4]. Using bio-materials and upcycled construction materials, promoting the transition to renewable energy sources, and enhancing resource efficiency and circular economy are some of the key actions implemented [5]. Among them, in recent decades, one strategy for improving urban environmental sustainability and addressing climate change mitigation has been bringing back nature into cities. In detail, there has been a paradigm shift toward integrating nature-based solutions (NbS) and green systems in urban planning and building design through urban forestry policies against global warming. Indeed, nature-based solutions harness the potential of newly added or preserved ecosystems to provide services and improve environmental conditions [6]. Therefore, they have gained prominence as a means to enhance energy efficiency, reduce energy consumption, and mitigate the effects of climate-change-related phenomena in the built environment, such as the urban heat island (UHI) [7]. These solutions not only encompass a wide range of strategies, including not only building-integrated green infrastructure, e.g., green roofs [8], green walls [9], and passive design approaches that leverage natural energy flows such as solar radiation (i.e., its thermal and lighting effects), and wind [10], but also urban forests and different urban green spaces designed at the urban scale [11]. In particular, studies have demonstrated the crucial importance of urban green spaces in supporting environmental health by preserving biodiversity, improving air quality, regulating temperature, and boosting overall well-being [12].
With regard to their role in mitigating outdoor microclimate conditions, integrating greenery and NbS into the built environment allows for a significant reduction in energy needs and the consumption of building–plant systems, as well as their environmental impact, while improving indoor environmental quality from a twofold perspective. On the one hand, green systems have a passive role; they mitigate the outdoor microclimate, thereby influencing the boundary conditions that impact building energy demand [13]. On the other hand, they directly affect the efficiency of the heating, ventilation and air conditioning (HVAC) system—which controls heating, cooling, and indoor air quality (IAQ)—by providing less-severe working boundary conditions, thus influencing the final building energy consumption [14]. Nevertheless, the integration of green systems and specific typical vegetation in buildings and urban areas must be approached through a rigorous, thermodynamically based framework to achieve tangible results in terms of energy consumption reduction [15,16]. In particular, it has been highlighted that the energy saving obtained by the reduced thermal loads of the HVAC systems, due to the presence of green systems, must be compared with the costs of energy saved with green systems installation and maintenance [17]. Furthermore, recent studies have shown that any intervention choice based on green-washing fails to produce significant energy consumption and reduces the built-up areas [18]. The existing literature lacks simple tools that can support decision-makers in adopting effective programming of interventions [19].
Greenery integration into buildings and urban environments has been widely studied, with literature presenting both positive and negative effects on energy consumption, urban microclimate, and human well-being [20,21,22]. Numerous studies highlight the potential of vegetation to enhance environmental performance [23]. For example, Jamei et al. [24] show that the incorporation of green roofs can significantly reduce energy demand for cooling and heating by modifying local microclimates, mitigating the UHI effect, and improving building thermal insulation, with up to a 50% cooling energy reduction in temperate climates. However, their effectiveness in cooling energy saving is much lower in hot-humid and hot-dry climate zones. Instead, Sodoudi et al. [25] and Puchol-Salort et al. [26], among others, explore how urban green spaces provide thermal comfort, improve air quality, and contribute to sustainability by directly reducing energy usage in nearby buildings by regulating temperature fluctuations [27]. These findings emphasize the positive impact of vegetation on reducing building energy consumption and improving environmental sustainability when properly designed by taking into account the local climate and microclimate [28]. Moreover, the presence of greenery may influence the livability and accessibility of urban areas for people [29], especially under hot climate conditions [30]. Sarkar et al. [31] highlight the importance of optimally integrating green space design with urban morphology, land use, street network topology, and social dynamics to promote active living and inform targeted interventions in urban planning policies. On the contrary, other studies have pointed out potential drawbacks when vegetation is improperly integrated or insufficiently maintained. Gunawardena et al. [32] further explain that the drawback of the evapotranspiration–cooling effect achievable through vegetation is the increase in humidity. This added atmospheric water vapor can inhibit human thermoregulation by reducing sweat evaporation rates and can alter the emissivity of the surrounding air, leading to the trapping of heat at the pedestrian level. This can be due to both green and blue spaces [33]. Existing studies also stress the negative impact of choosing the wrong plant species [34] or insufficient irrigation [35], which can lead to higher energy costs due to ineffective thermal regulation or even increased humidity, which may strain HVAC systems. In some instances, studies report that the thermal benefits of greenery may be offset by the additional energy required for maintenance and water supply [36], particularly in arid climates [37]. Huang et al. [38] illustrate how the presence of greenery can sometimes result in unintended consequences, such as excess shading or reduced solar access to buildings, potentially affecting energy efficiency in colder months. These studies underscore the need for further developing a careful, context-specific approach to vegetation integration in built environments, ensuring that the energy savings outweigh the associated costs and that the full potential of green solutions is realized.
The existing literature thus presents a complex picture, where the benefits of green infrastructure are clear but contingent upon appropriate planning, plant selection, and maintenance practices [39,40]. However, despite the growing popularity of these strategies, there remains a limited understanding of the specific impacts these solutions have on the energy consumption dynamics of buildings. Bartesaghi Koc et al. [41] propose a methodological framework to accurately assess the thermal performance of green infrastructures by combining airborne remote sensing, field measurements, and numerical modeling, thus providing a standardized protocol for urban planners to quantify, compare, and report microclimate study results. Similarly, Obriejetan and Krexner [42] recently defined a method to model evapotranspiration in urban green spaces using high-resolution climate data and satellite imagery, adapting crop coefficients for urban environments and highlighting the influence of vegetation type, seasonal changes, and water availability, thereby offering a valuable framework for sustainable water management and urban planning. On the contrary, Jia et al. [43] suggested a novel framework for evaluating urban green spaces based on accessibility and usability to support multi-objective designs, helping to prioritize installation sites that enhance human well-being while promoting sustainable urban development. Most of the literature shows how vegetation can improve microclimatic conditions in urban areas by mitigating the mutual radiative heat exchanges between buildings. Furthermore, the ability of trees to provide shading limits the accumulation of heat on paved surfaces and buildings, thus reducing the demand for cooling in buildings and improving the performance of air conditioning systems. According to studies conducted by the European Environment Agency (EEA), green areas can lower local urban temperatures by up to 2–4 °C, significantly contributing to thermal well-being and reduction in energy consumption [44]. The Green Deal promoted by Europe [45], in synergy with initiatives such as the “Renovation Wave” [46] and the EU Biodiversity Strategy to 2030 [47], encourages the integration of green solutions to address these issues. On the one hand, these strategies contribute to reducing CO2 emissions; on the other hand, they support adaptation to climate change and biodiversity protection.
Given this framework, our research study explores how greenery and nature-based strategies influence building energy performance, with a particular focus on the building–plant system thermodynamics. Starting from the above-mentioned impressive environmental and energy studies, which also highlight a great practical–operational activity aimed at urban green plans, our purpose is to define and implement a simplified method for the evaluation of external air enthalpy–energy variations due to different typologies and dimensions of green systems. The proposed method can provide useful indications for the green system choice and their integration at the building and urban area scales, taking into account their efficacy for under-sizing, reversibility, and adaptivity of the building–plant systems from the perspective of sustainability and green energy transition. Therefore, this method strongly supports ecological interventions and environmental planning policies, ensuring that they are effective and produce measurable benefits. Any intervention in the extension of greenery and urban forestry can be studied and explored in-depth through the application of thermodynamics and thermo-physics/biology on the dynamic interaction between the building–plant system and the green system. Indeed, our method provides two approaches, a top-down approach and a bottom-up approach, taking into account the evapotranspiration effects of greenery, by treating leaves and foliage as homogeneous, isotropic, and extensive surfaces. Our investigation allows for an understanding of the key mechanisms through which nature-based solutions and greenery can enhance building energy efficiency and resilience when properly implemented in urban environments. Therefore, the proposed method can also provide a systemic decision-making tool for municipalities to integrate urban built-up areas and building design with energy environmental needs.

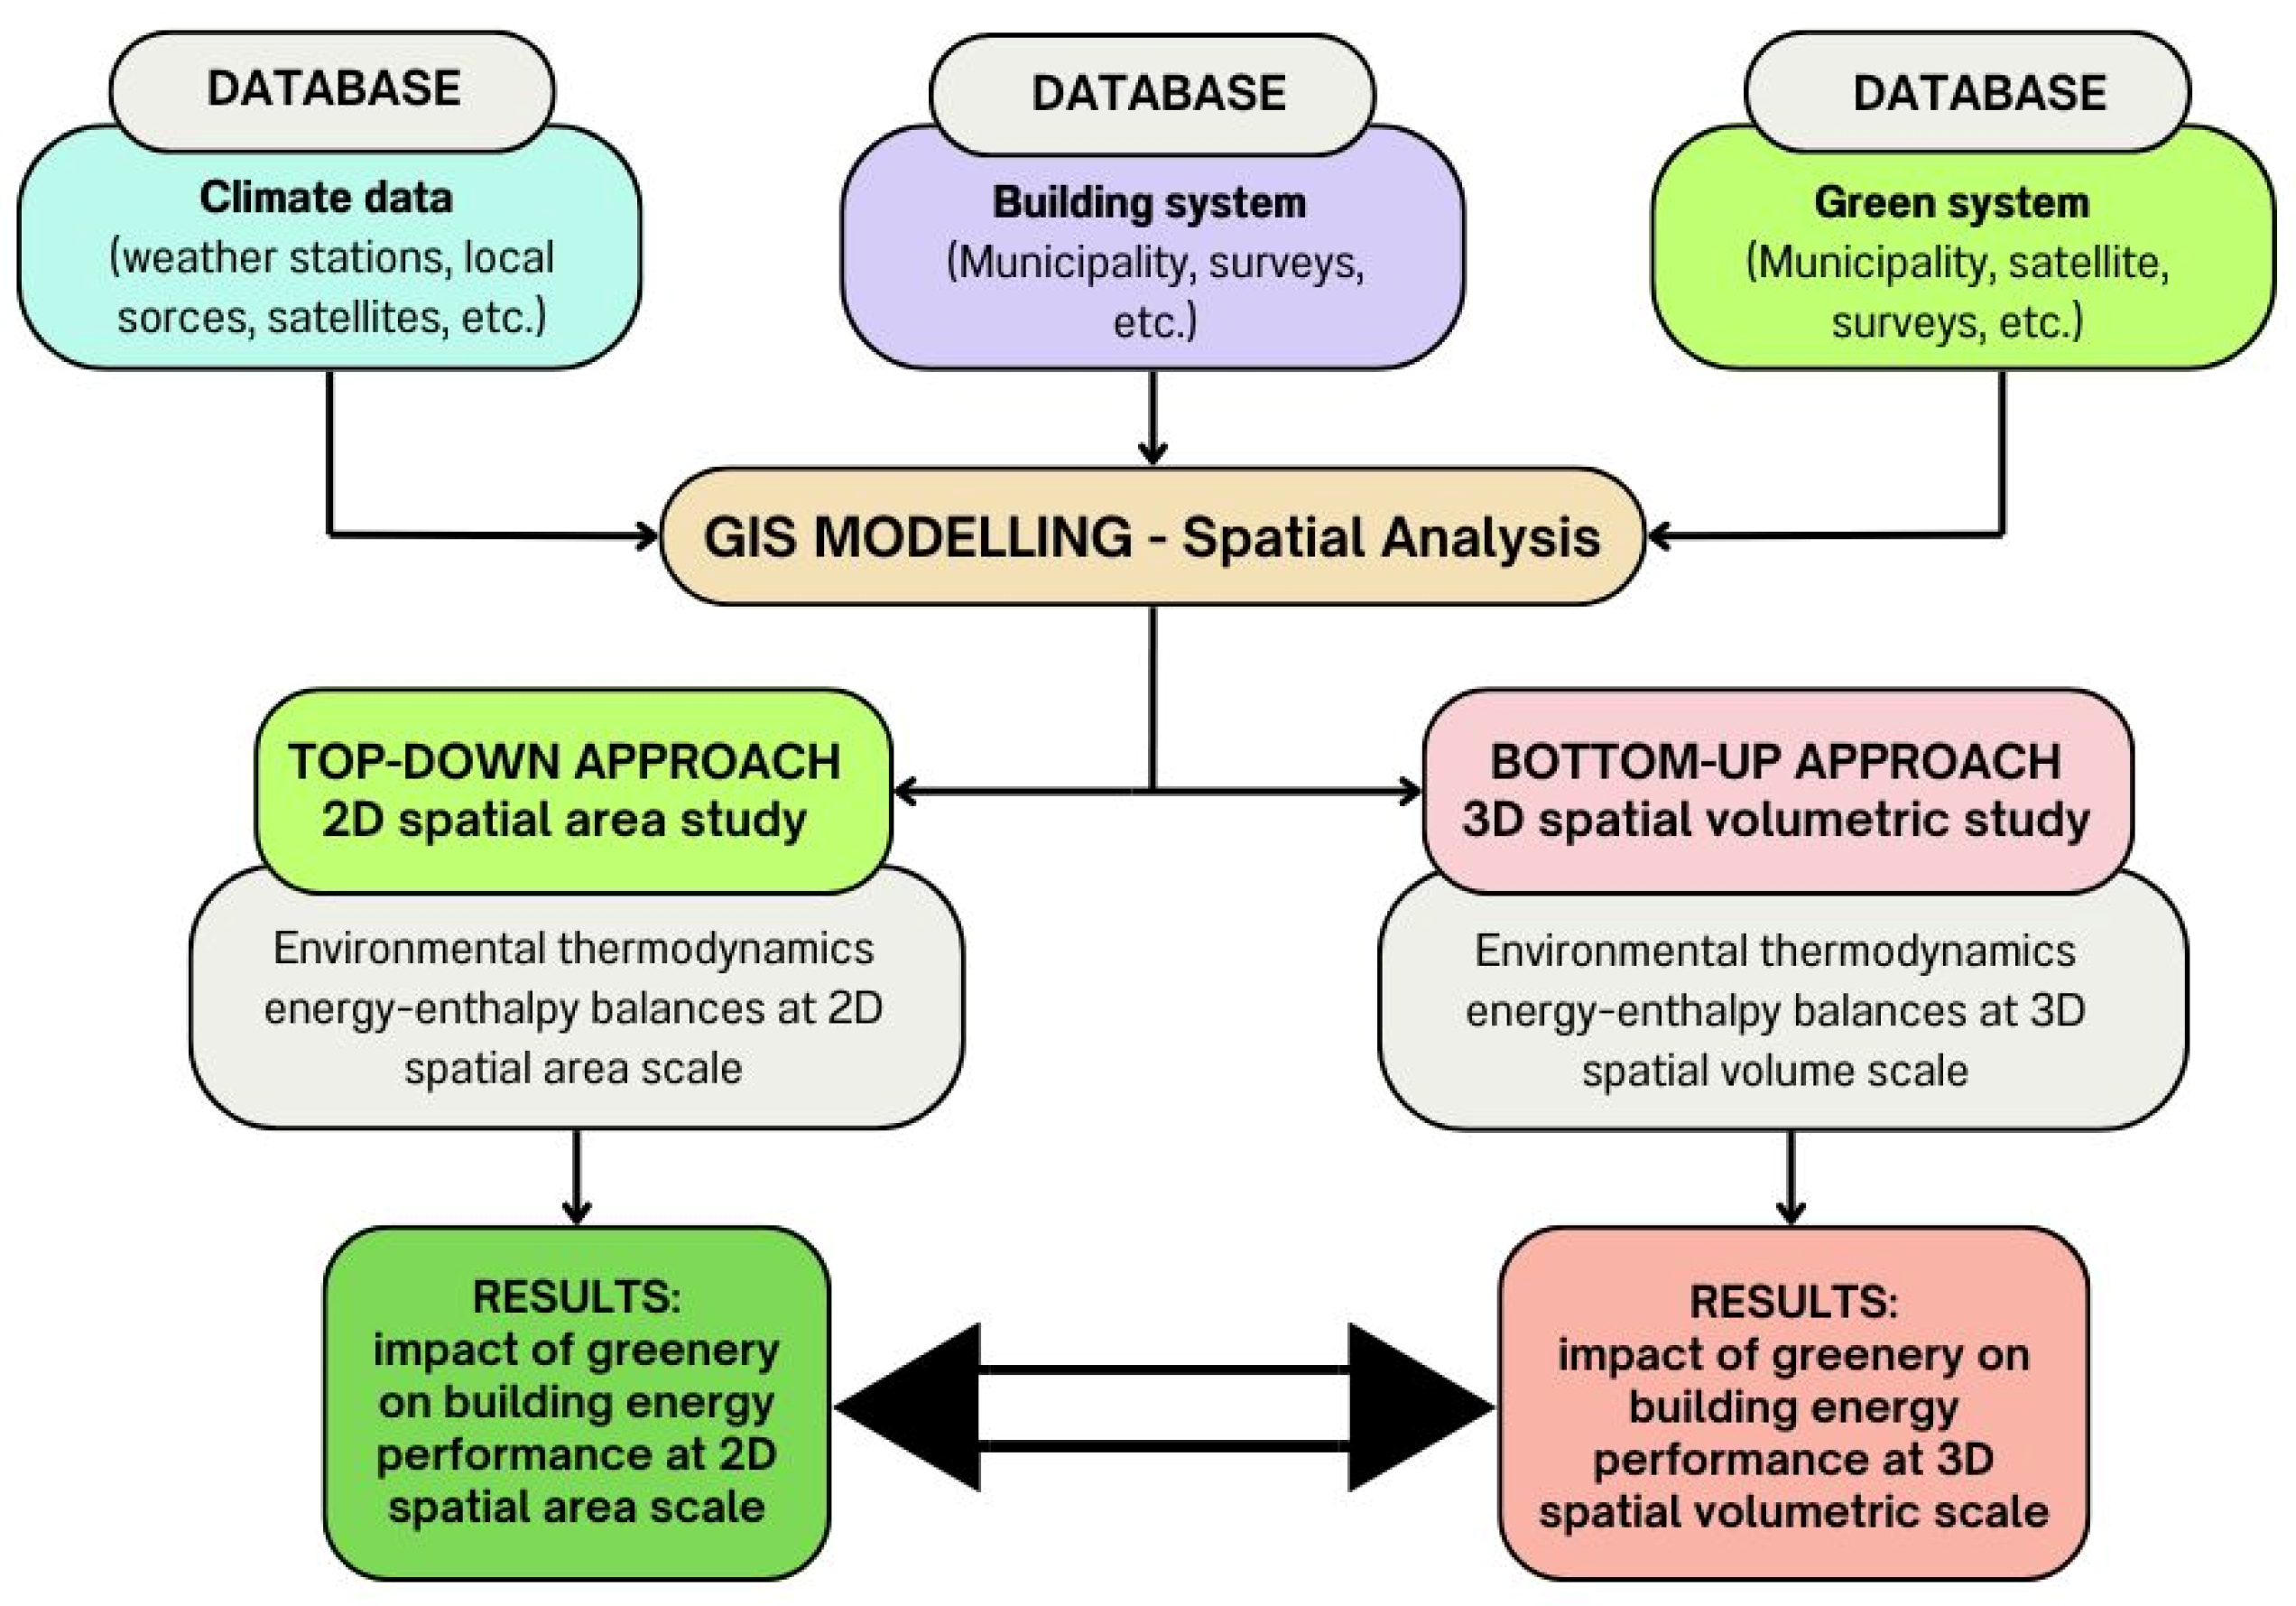
2. Materials and Methods

The proposed approach is based on the consideration that all natural living systems and structured-built systems—the latter as a manifestation of the anthropogenic burden on the environment—continue to respond to climate change in ways that are difficult to predict. Considering thermodynamic processes, systems can shift their distributions and energy flows in opposite directions from what is expected. This highlights the need to translate our physical metrics and define methodological approaches to study climate change, starting from the forms of the natural system and how organisms and built urban systems relate to the environment. The differences and changes that can be deduced constitute the fundamentals for thermal stress models, which are predictive in nature and focus on energy environmental sustainability.
The methodological approach used provides a simple and useful tool to study thermal and vapor energy exchanges due to the presence of a green system in the urban canopy, taking into account dedicated applications and results from previous specific studies [48,49]. The fundamental focus is on the evaluation of the thermal exchanges between the green system and the building–plant system, based on the energy balances related to the first law of thermodynamics, which led to the assessment of the enthalpy variation of the air. This allows for the determination of the reduction in cooling loads connected to the cooling plant system. The overall process is shown in the flowchart summarizing the key points of the proposed methodological approach (Figure 1).
The analysis and implementation of the method are carried out in sequential and connected phases, starting from the collection of data and/or digital information on the studied urban fabric, e.g., standard meteorological data/files or real measurements acquired from the local meteorological stations closest to the investigated areas, the characteristics of the buildings such as the surface area in plan, height, volume, prevalent intended use, as well as green areas for specific plant species. The next phase is georeferencing and modeling with the use of Geographical Information Systems (GIS). Depending on the useful, available, and traceable information, two different but equivalent methods of applying environmental thermodynamics are then implemented:
  • The “top-down” method considers the urban context as a 2D footprint of greenery and buildings, or at a two-dimensional areal scale. It is of immediate application and is applied to evaluate the enthalpy variations on a large scale in the summer period, even when the information on buildings is not complete or scarce.
  • The “bottom-up” method considers the urban context and the volumetric morphology with details on the buildings, i.e., it is at a 3D volumetric areal scale. It requires a more in-depth analysis at the district level to evaluate the variation of air enthalpy connected to the air exchange volumes for the summer cooling of each building.
In both approaches, the first fundamental energy balance is applied to the green cover under the hypothesis of considering leaf surfaces as continuous, uniform, and homogeneous-isotropic. The balance involves only the ’urban forest’ type as a green surface system, as it is the only configuration capable of having a real impact on the energy issue in the urban context, thus excluding low shrubs, hedges, and grass. The balance therefore allows for the determination of the surface temperature of the greenery in a simplified way, determining how a leaf surface exchanges thermal energy (i.e., latent heat and sensible heat) with the environment, disregarding the morphology, the set of physiological and water processes of the plant itself and interaction of its leaves with the soil and atmosphere. The second resulting energy balance is applied to the building–plant system, to assess the HVAC–plant energy consumption due to the thermo-hygrometric treatment of the air, and the consequent environmental impact linked to the external air enthalpy variation due to the green system.
To study the thermo-hygrometric effects of any green system in different built urban areas, the set of governing equations expressing the above two balances at semi-steady-state conditions is implemented, applying it to the green surface and, in a subsequent phase, to the building–plant system.
All the basic governing equations are solved by a finite element code using an iterative procedure. With reference to the method suggested in [50], the balance equation on the leaf surface becomes Equation (1):
Q i r r ˙ · α = ε · σ · T l + 273 4 + k 1 · v w D l 0.5 · T l T a + L l · ρ v l R H a · ρ v a r l + k 2 · D l 0.3 W l 0.2 v w 0.2
  • Q i r r ˙ is the incident solar radiation on a specific site and at a specific hour of the day;
  • α is the absorption coefficient of solar radiation (0.80 as suggested [50]);
  • ε is the emissivity coefficient in the infrared (0.96 [50]);
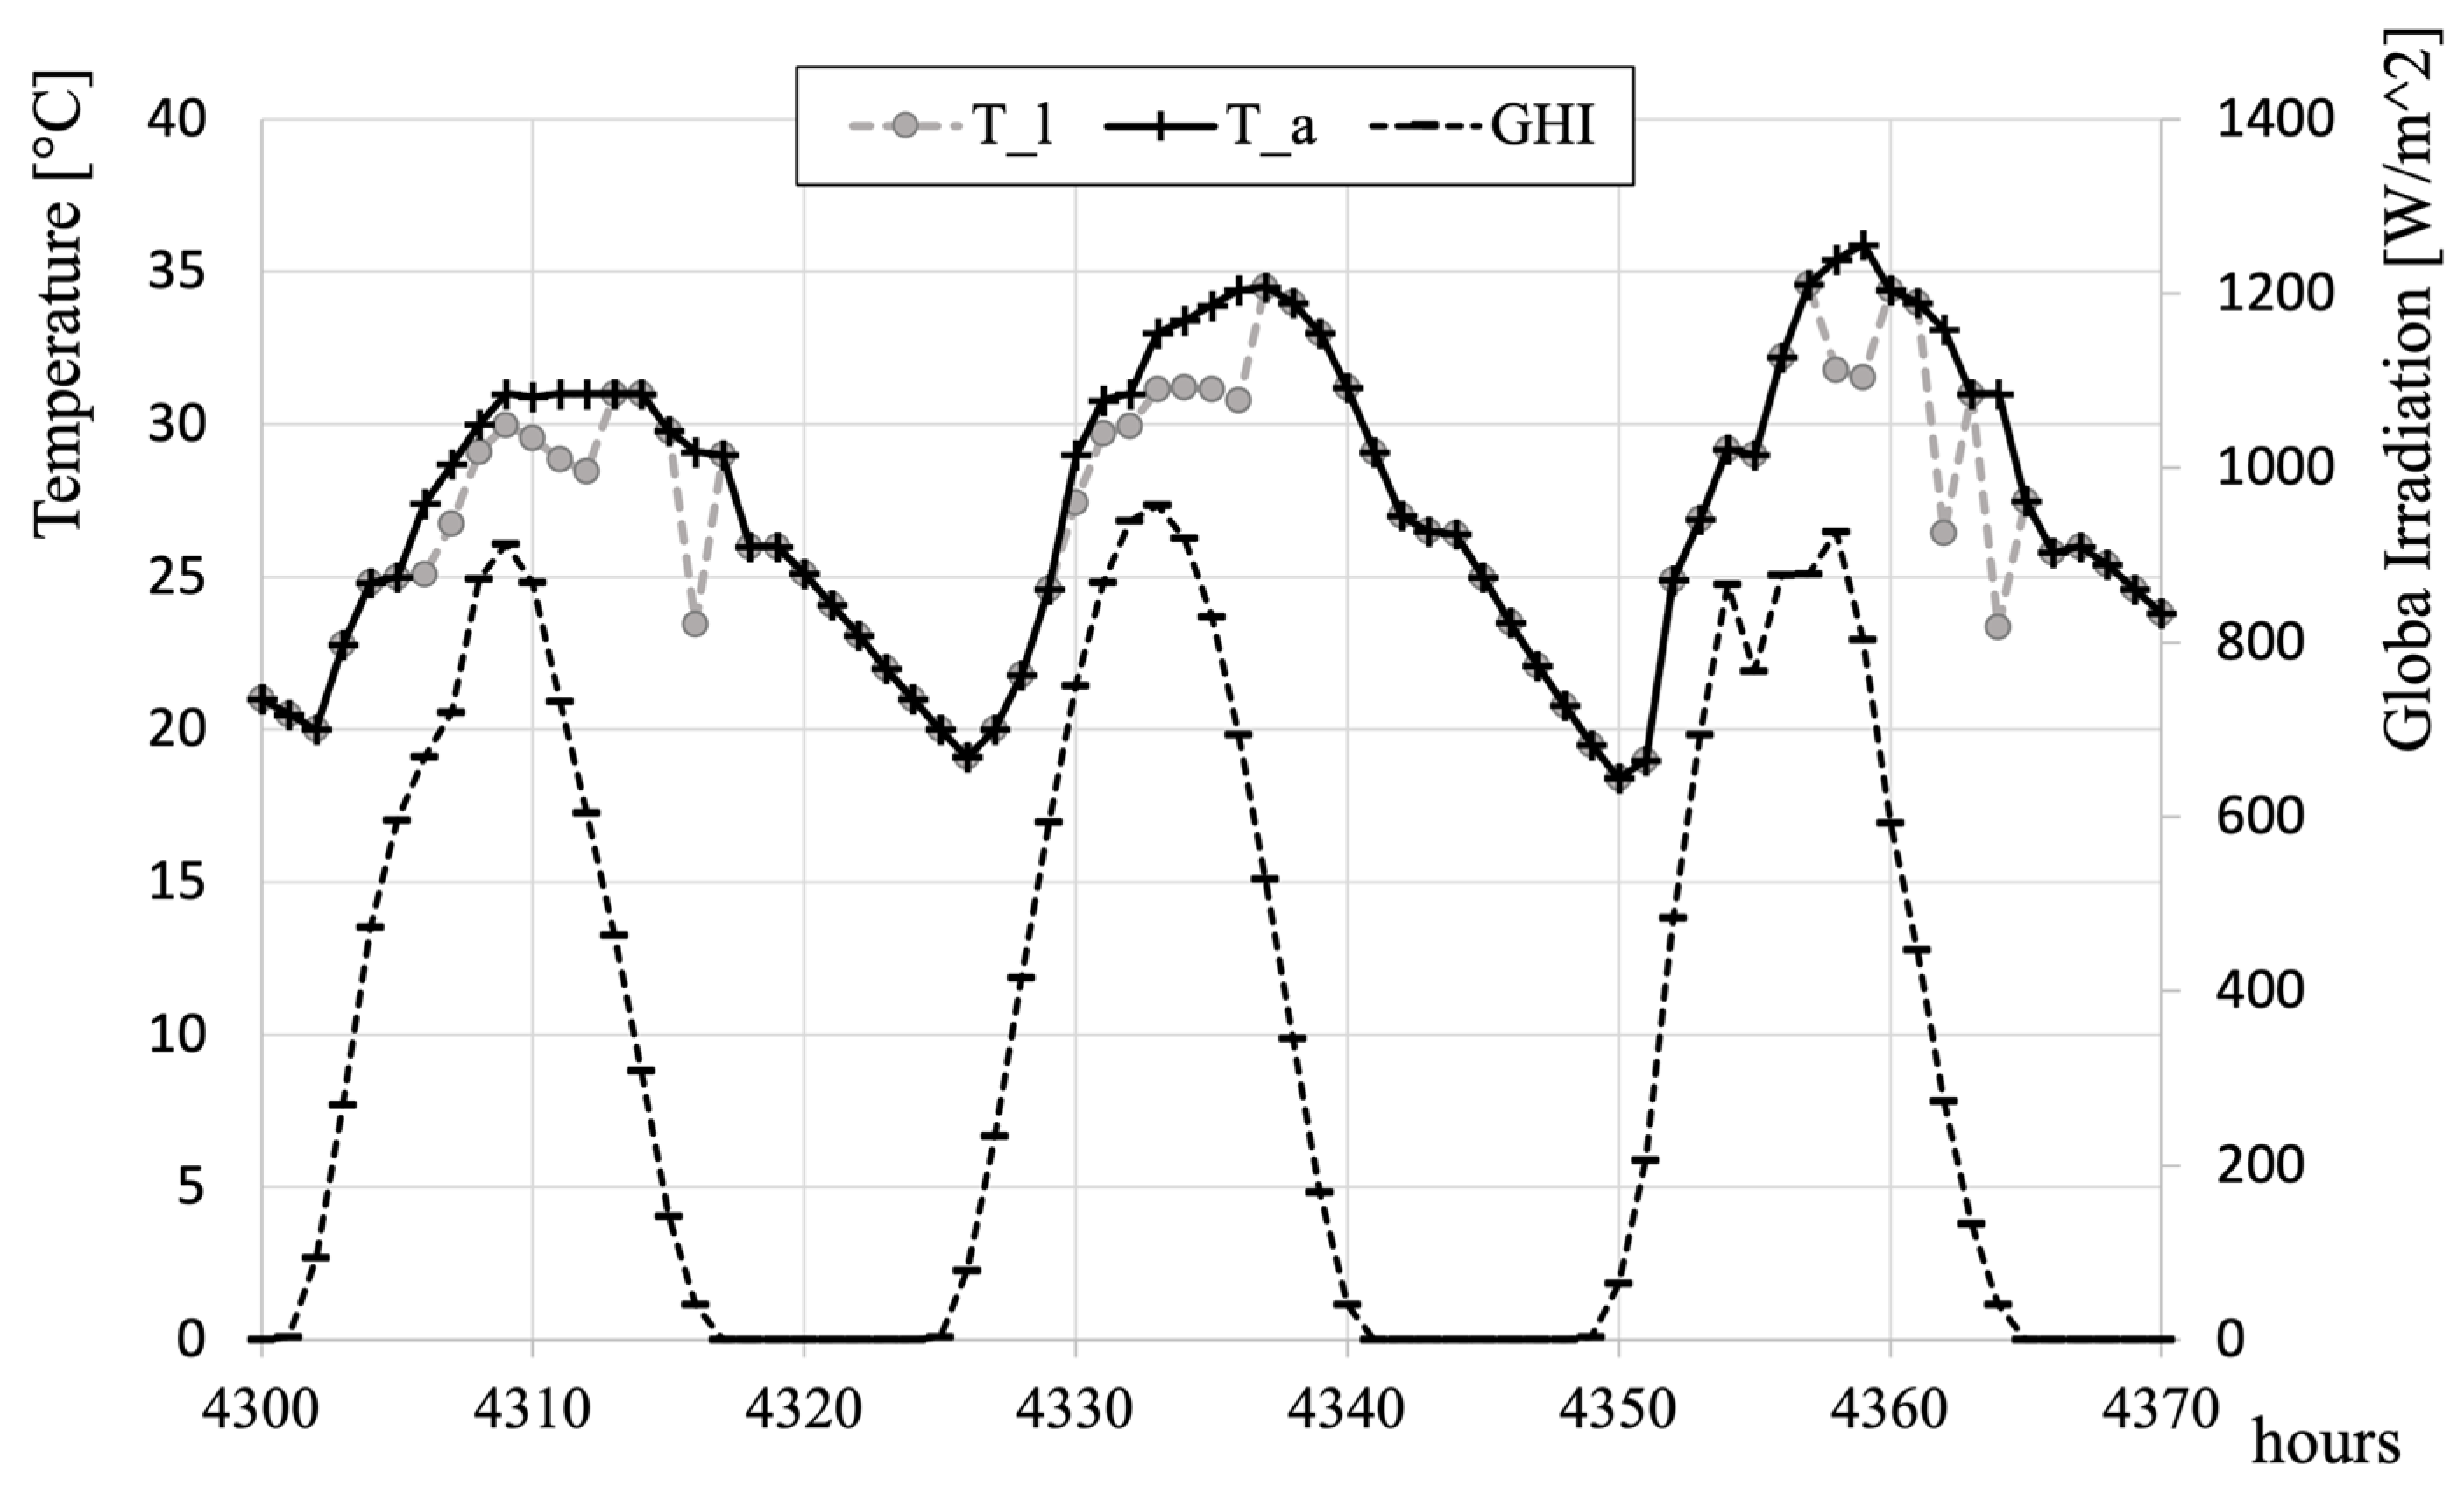
  • Tl is the surface temperature of the leaves (°C);
  • k1 equal to 9.14 Jm−2s−1/2–11 °C−1 and k2 equal to 200 s1/2−1m−1 are empirical coefficients as suggested in [50];
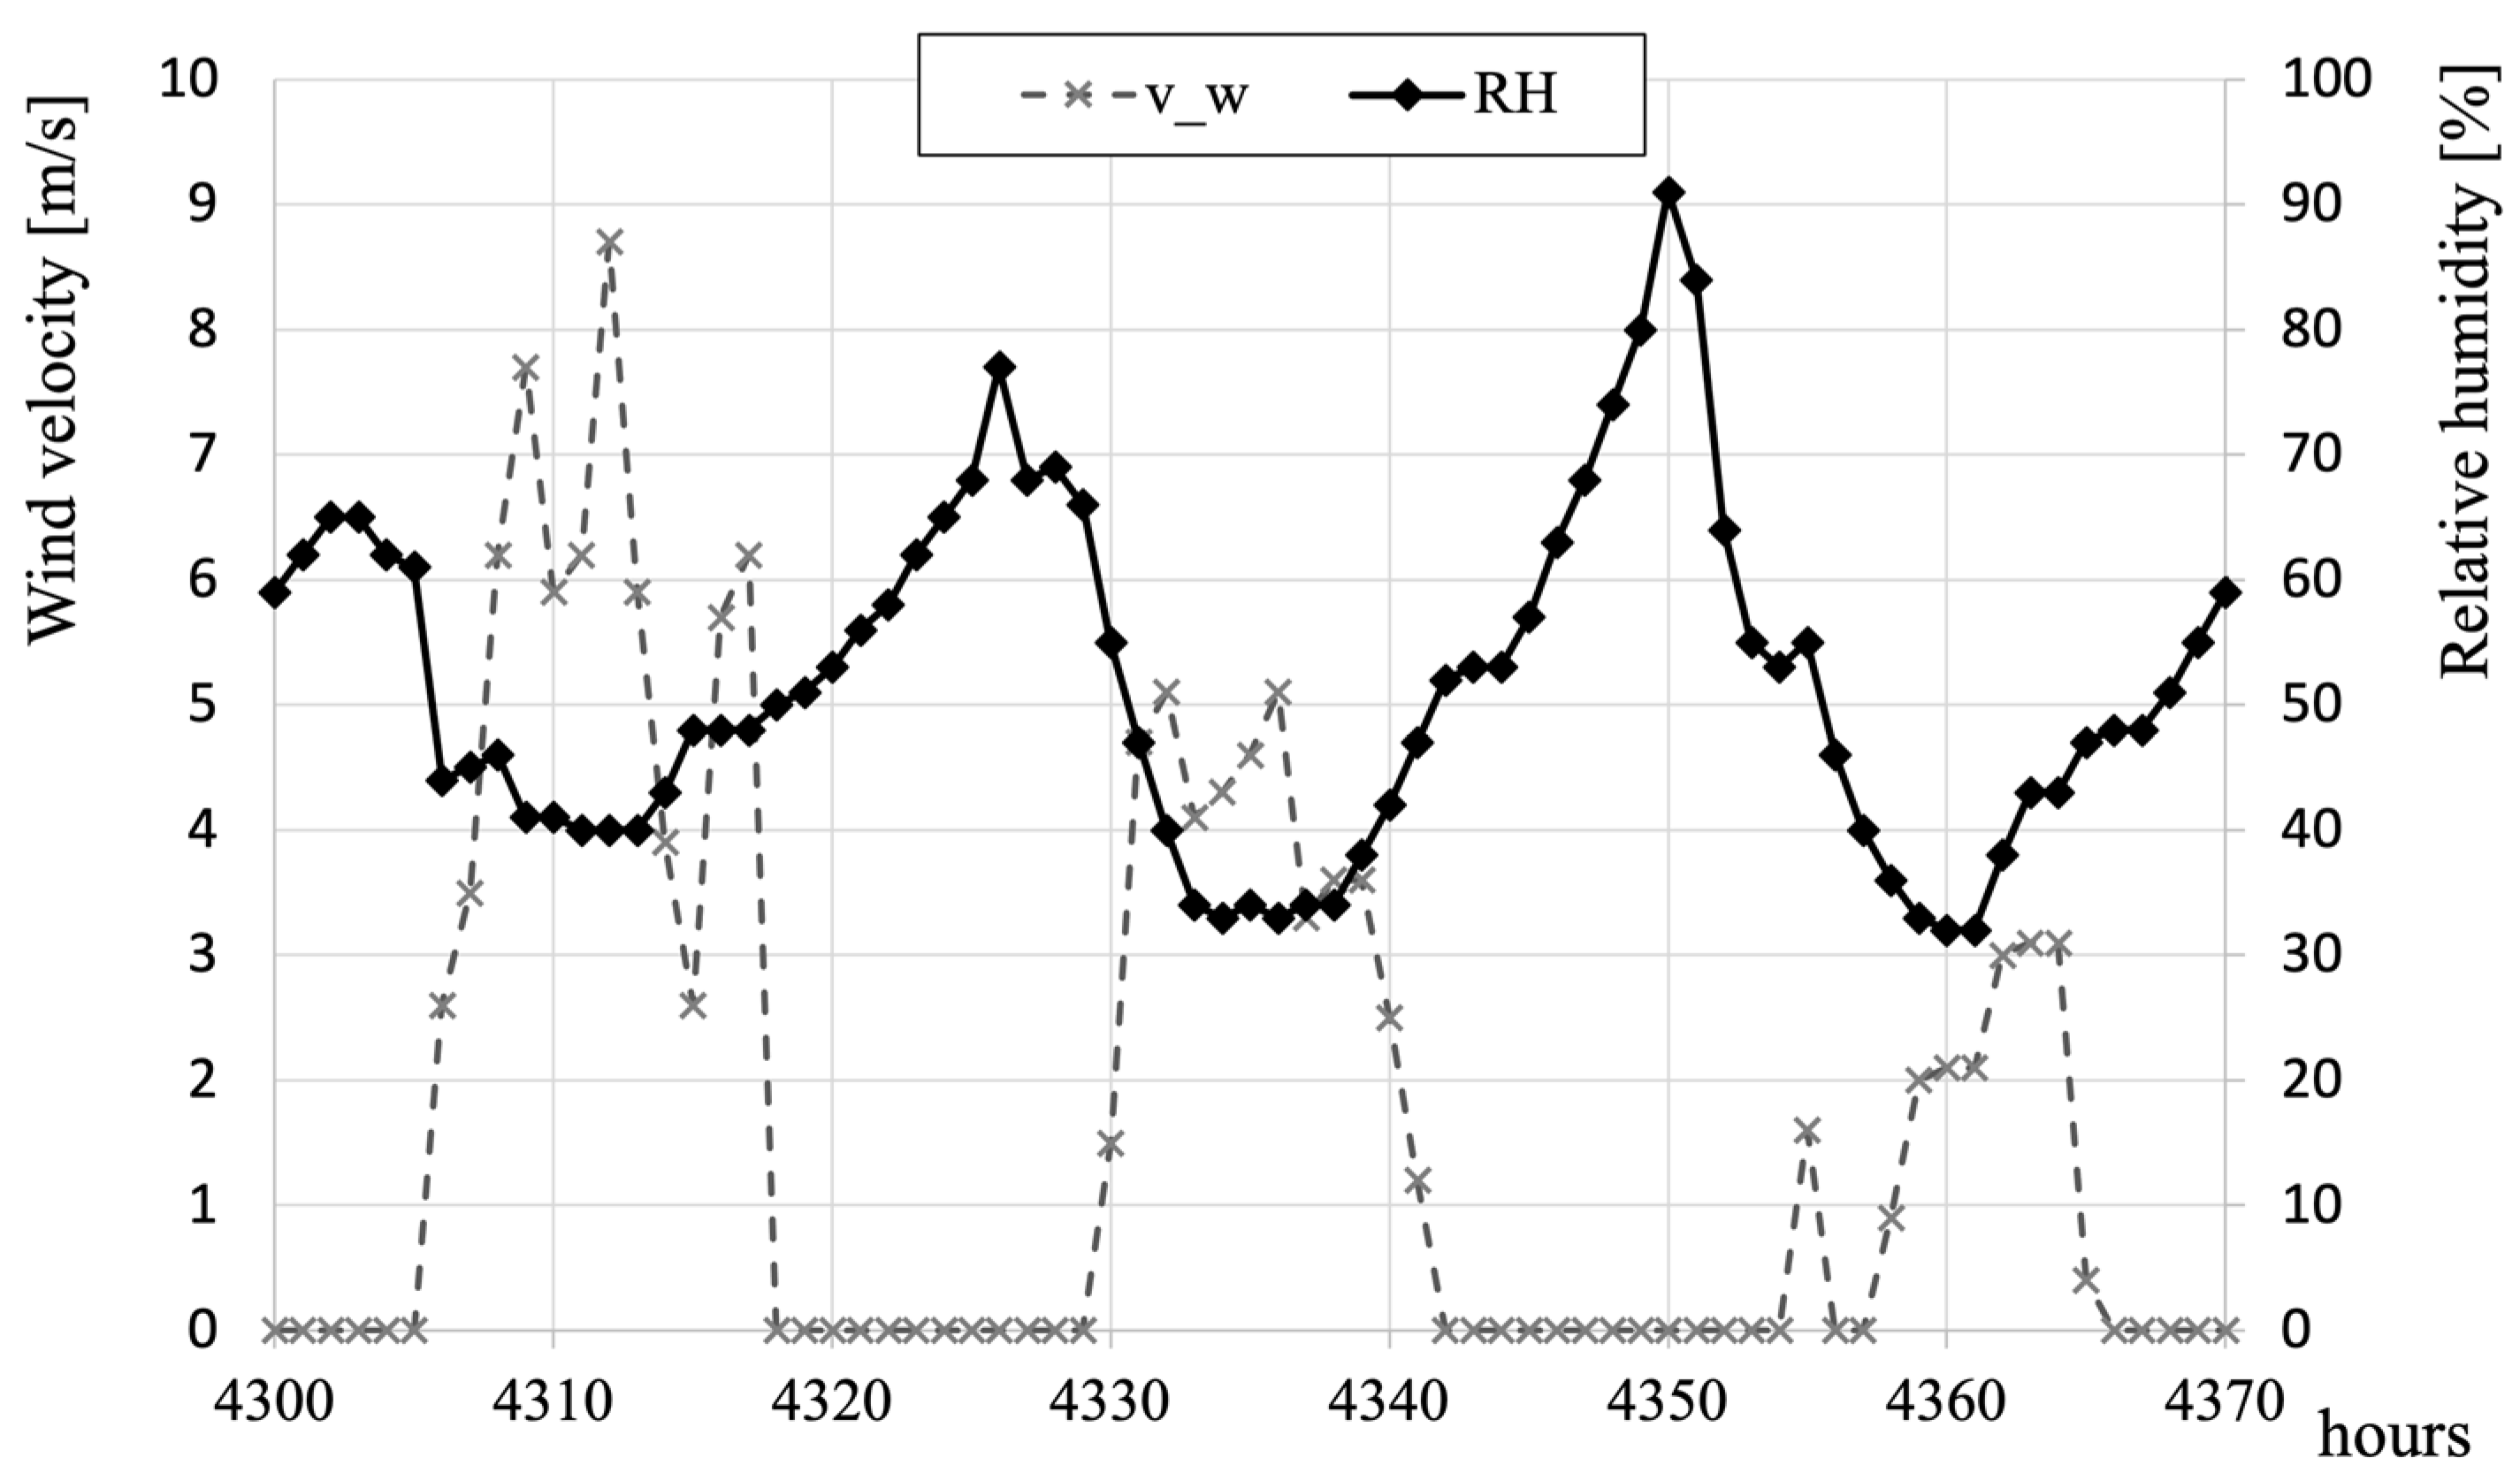
  • vw is the wind speed (m/s);
  • Dl is the characteristic dimension of the leaves in the wind direction (0.05 m);
  • Ta is the ambient temperature (°C);
  • Ll is the latent heat of vaporization at the surface temperature of the leaves (J/kg);
  • ρ vl is the vapor density at the surface temperature of the leaves (kg/m3);
  • RHa is the relative humidity of the air (%);
  • ρ va is the vapor density at the ambient temperature (kg/m3);
  • rl is the evaporation resistance of the leaves (ranging from 200 to 2000 s/m as suggested in [50]);
  • Wl is the characteristic dimension of the leaves in the direction transverse to the wind (0.05 m).
The term on the left of Equation (1) represents the thermal energy absorbed by the leaves from solar radiation and the ones on the right describe the contributions of thermal loss towards the environment (infrared radiation, natural convection due to the local wind, and evapotranspiration of water). The reported values are typical examples and ranges for the phenomenon of interest, while environmental parameters such as Ta, RHa, vw, Q i r r ˙ can be derived from the standard weather datasets for different locations and times.
Depending on these inherent and boundaries conditions, the temperature of the leaves could be determined through an iterative process: in some periods of summer days, it is expected to be lower than that of the surrounding environment, and by extending this concept, it can be assumed that the enthalpy content of the surrounding air is consequently reduced.
At this phase of the implemented method, the external air enthalpy variation is calculated taking into account the sensible and latent thermal contributions of the leaf surface on the external thermo-hygrometric conditions.
Therefore, with reference to [51,52,53], the sensible heat and the latent heat are determined with Equations (2) to (8):
Q s ˙ = h c o n v · A l c p a · h l h a
h l = c p a · T l + L l + c p v · T l · x l
x l = 0.622 · P s l · R H s a t l 101325 P s l · R H s a t l
h a = c p a · T a + L a + c p v · T a · x a
x a = 0.622 · P s a · R H a 101325 P s a · R H a
Q l a t ˙ = ρ a · v w · A l · x l x a · L l
P t h ˙ = Q s ˙ + Q l a t ˙
It must be noted that the product ρ a · v w · A l constitutes the air flow rate over the leaf surface (kg/s). The convective heat transfer coefficient hconv, due to the very low Reynold’s values, is calculated as a function of the following correlation [53] that provides the Nusselt number (Equation (9)):
N u = 0.825 + 0.87 · R a 1 6 1 + 0.492 P r 9 16 8 27 2
For the sake of clarity, the dimensionless numbers Nusselt, Rayleigh, and Grashof are provided by Equations (10) to (12), respectively. The dimensionless Prandtl number is generally derived from the tables of thermodynamic properties of fluids (i.e., air) and is directly computed by the software [54] as a function of air temperature. Within the range of interest, i.e., for an air temperature from −10 °C to +50 °C, at an atmospheric pressure of 101,325 Pa, it can be considered constant (e.g., 0.73 at 25 °C).
N u = h c o n v ·   D l λ a
R a = G r · P r
G r = 9.81 · D l 3 · ρ a · β · T a T l μ a
This methodological process follows a top-down approach and enables the sustainability energy analysis both at a large scale, i.e., a single city, providing the chance to compare several cities at different latitudes and climatic conditions, and at a small scale, i.e., a single building, a group of buildings, and/or an urban block-quarter.
At the large scale, as a first approximation, the surface area of the leaves, Al, can be considered at least as large as the ground coverage of the trees.
Therefore, starting from the extension of the greenery that is connected to the adjacent buildings, the overall thermal power that is saved from their HVAC systems, may be directly derived, obtaining the energy during the cross the summer period when plants provide more significant effects.
For the assessment at the small scale, the energy balance is then referred to different buildings, taking into account their volume and/or as a function of their energy form (i.e., through the shape factor expressed by the ratio between the total dispersive surface and the overall volume, and the number of air changes imposed by the standards for its intended use). The method preserves its comprehensive and rigorous approach from a thermodynamic and thermo-hygrometric point of view, although it is simplified.
Even for a more detailed investigation (i.e., at a small scale), the same Equation (1) can be used in a different approach (bottom-up). In this case, it is assumed that arboreal vegetation uniformly covers specific areas of the urban environment, maintaining a consistent local air temperature beneath its canopy. This results in the formation of a distinct microclimate, differing significantly from the context observed in the absence of greenery, which subsequently interacts with buildings and their associated services.
The drop in air temperature, leading to lower energy content, is assessed by the simple definition of specific enthalpy, h, for the equation about moist air:
h a = h d + x · h v evaluated at T a
h l = h d + x · h v evaluated at T l
where hd is the specific enthalpy of the dry air, x is the humidity ratio, and hv is the specific enthalpy of the contained vapor. The humidity ratio is a function of the relative humidity (provided by Equation (6)) which is the reference value for the operative conditions of plants and is considered invariant for both configurations.
Therefore, two different values for the specific air enthalpy are calculated, i.e., based on the external air temperatures obtained, respectively, with and without the presence of greenery.
Knowing the building geometry and intended use in a selected urban area, it is possible to estimate the hourly energy need and the total avoided demand by integrating over the entire season (with summer being more significant). The thermal power reduction within the hour ( P t h ˙ ) expressed in (W) (and then convertible to kWh) is given by the following:
P t h ˙ = ρ a · V · n · Δ h
  • ρ a is air density (kg/m3);
  • V is the volume of the individual building (m3);
  • n is the number of air exchanges per hour (volumes/h), expressed in 1/s;
  • Δh is the specific air enthalpy variation between the standard weather condition and the one obtained through the leaf temperature (ha − hl) expressed in J/kg.

3. Application and Results

The studied area is a portion of the city of Florence. Referring to the database of the Municipal Environmental Energy Plan (PEAC), using QGIS software (version 3.40.1-Bratislava) and interfacing with data from the GEOscope Observatory [55] of the Tuscany Region, the useful data on the buildings were extrapolated.
Within the PEAC, each building is identified by street number, georeferenced, and characterized by topological and spatial information, including geometry and dimensions, age class of construction, and intended use.
For the green areas, the position of trees is mapped and the covered ground area is determined. The climatic data used are supplied by the standard weather file from the Typical Meteorological Year for the city of Florence (.epw file format), which is taken as a reference for hourly values of the key physical–microclimatic parameters (air temperature, relative humidity, wind velocity and direction, and total solar radiation on the horizontal plane).
By applying the energy balance from Equation (1) and using the input parameters in Table 1—where the leaf resistance to evaporation is an average between the edges—the leaf temperature obtained is 27.6 °C. The data presented in Table 1 are just given as an example, as the values change over time.
Consequently, the inputs are parametrically set using a commercial software [54] with the summer hourly values of the weather file, obtaining key findings for the leaf temperature at the same time step. Results analysis and comparison provide the following crucial considerations:
  • The leaf surface temperature tends to be always lower than the external air temperature, except in some particular conditions, i.e., when the relative air humidity is very high (RHa > 0.8);
  • Without solar radiation, the whole leaf coverage reaches the equilibrium condition with the surrounding environment;
  • An increase in wind speed leads to an increase in thermal exchange between the leaf surface and the air, reducing the achievable temperature difference (e.g., with Ta equal to 28 °C and all the other parameters constant, if wind speed varies from 1 to 10 m/s, Tl changes from 27.4 °C to 27.7 °C);
  • If the wind speed is zero, one term of the balance becomes meaningless;
  • The GHI (Global Horizontal Irradiation, expressed in W/m2) data must be used because it is not possible to accurately determine the average solar radiation striking leaves oriented in different directions; accordingly, for greenery analysis through the GEOscope Observatory platform [55], the leaf surface is considered as a ground area, i.e., green coverage.
Therefore, the trends of the temperatures of the external air and leaf surface, air relative humidity, global horizontal solar radiation, and wind velocity are provided in Figure 2 and Figure 3 for three selected and representative summer days (29–30 June and 1 July).
In particular, for completeness, a preliminary sensitivity analysis was conducted by varying leaf parameters (surface, solar absorbance, emissivity, and vapor resistance), resulting in variations in leaf surface temperature on the order of one-tenth of a degree, as determined by applying Equation (1).
The two methodological approaches, i.e., the top-down method and the bottom-up method, are applied to two important areas of the city of Florence. The first area is a neighborhood structured around the tree-lined park of Vittoria Square (Figure 4), and the second area is the avenue, also tree-lined, extending from Libertà Square to Beccaria Square (Figure 5). These two areas are representative of widespread morphologies typical of urban greenery in the city, as intended in the proposed method. In Vittoria Square, it is assumed that the treetops completely cover the space below the park (as they did originally and as they will most likely be in the years to come, when the new trees have fully taken root in the ground, developed in height and volume of root and leaf systems; in essence, they will have achieved a “mature age”) and that it is configured as a “concentrated context” in which to implement the simplified approach that starts from the buildings overlooking the square itself.
However, in the case of the avenues, a more linear development of the greenery is considered, and as a consequence, the trees form a kind of natural tunnel that helps regulate air temperature through an adiabatic saturation process of the air, depending on variable climatic and environmental conditions.
Then, the buildings of interest in the area are identified and based on their intended use, the following mean air changes for indoor air quality and correct ventilation conditions are attributed [56]: 1 volume/h for residential intended use; 3 volumes/h for offices and accommodation facilities; 4 volumes/h for schools, considering the priority of classrooms; 6 volumes/h for commercial activities.
Starting from the evaluation of the modified external air temperature of the green areas due to the evapotranspiration of the leaves’ coverage, the governing equations, Equations (2)–(12), are implemented with an hourly calculation (using the top-down method): the overall surface covered by the canopy trees is substituted into Al, and it is equal to 5628 m2 for Vittoria Square and 34,560 m2 for the second case study.
For those scenarios, a significant reduction in thermal power is obtained, which, when hourly integrated during the summer season, provides 415 MWh and 2675 MWh, respectively.
When applying the bottom-up method, considering the main characteristics of the buildings, i.e., ground area, height, volume, and intended use, Equations (13) and (14) are implemented.
Then, referring to recent studies [48,49,57] and with a view to the energy transition, in accordance with the provisions of the current regulations for air quality, hygiene and health in confined environments, as foreseen after the COVID-19 pandemic by WHO, RHEVA, ASHRAE, AICARR, and ISS, it was assumed that the buildings are equipped with air conditioning systems of the type Variable Air Volume-Controlled Mechanical Ventilation (VAV-CMV) without an air recirculation condition. Therefore, it was possible to evaluate the reduction in energy consumption of the system for the existing different types of buildings, referring to their energy form, whole geometry, and mean air changes for their different intended uses.
By comparing the enthalpy in the absence of greenery with that obtained from the balance on the leaf surface, its variation is calculated, and the resulting energy saving obtainable for each kilogram per second of air treated by the HVAC system and introduced into the confined spaces can be quantified.
Based on the methodological hypotheses, and using the climate data of the city of Florence, the external air temperature reduction, connected to the presence of the leaves’ coverage, leads to an external air enthalpy reduction of 1965 kJ/kg. This last value is obtained considering the plant system operation for all the summer daytime hours in which the external air temperature is higher than 26 °C. This temperature value is set by the Italian Decree Law [58] as the standard average set-point for the indoor temperature of the considered buildings.
Applying Equation (13), the heat power reduction can be calculated and integrated for the whole summer period to obtain the energy saved in MWh.
For the area of Vittoria Square, 35 building blocks with different intended uses are identified, which affect the amount of air-change volumes. They are mainly residential (26%) and include some commercial businesses (10%), accommodation facilities and offices (17%), schools and institutes (43%), and for a single case, a small private hospital (4%). In this case, the energy consumption reduction is 504 MWh.
For the avenues from Libertà Square to Beccaria Square, 114 buildings are selected. In this area, the percentage of air-change volumes for residential is 12% and for professional offices and accommodation facilities is 41%, while commercial activities account for 17% and schools/institutes account for 30%: for the whole summer season, the obtained energy consumption reduction is 2350 MWh.

4. Discussion

The present research provides two methods, bottom-up and top-down, which are comprehensive and simple to implement. These methods are consistent with models proposed in existing literature studies [59,60]. They are based on different assumptions and settings, but their implementation uses a simplified modeling of green biological systems through which the surface temperature of green leaves and/or green cover is calculated. Results obtained for the leaves’ surface temperature and its variation are consistent with those reported in most of the literature on this issue.
The two methods are completely equivalent and consistent since their obtained results are comparable. The small differences are completely within the expected accuracy range for the simplified biophysical and thermodynamic modeling used: for the area of Vittoria Square, the difference between the energy saved (MWh) is 18%, while, for the avenues from Libertà Square to Beccaria Square, this difference is 12%.
Results show that urban green spaces play a crucial role in the conservation of biodiversity, favoring ecological balance and promoting a more sustainable urban environment, in line with most of the literature on the subject [18,20,21,59,60]. Indeed, the results demonstrate that urban green spaces play a fundamental role in regulating temperature, counteracting the phenomenon of urban heat islands, and contributing to the well-being of residents. Our findings also highlight that the integration of greenery within buildings through the extensive development of NbS applications would address a series of engineering and energy challenges. Indeed, refurbishment and retrofitting interventions necessary for existing buildings to meet the current energy requirements of Zero Energy Buildings with low environmental impact would be effective in building urban resilience and implementing environmental and energy sustainability practices, ensuring the health of the environment and people. On the other hand, the integration of NbS in urban areas would be beneficial to this goal only when wisely designed based on thermodynamic assessment evidence.
The approach and the two methods provided in this work are based on the thermodynamic analysis of the system that takes into account the biophysical and thermos-hygrometric processes due to the presence of vegetation. They highlight the importance of extensive vegetation surfaces in cities as they promote the cooling of the air as well as the surfaces through shading and evapotranspiration processes. Moreover, both methods proposed allow for extensive and simple implementation of the energy balance between the green system and the buildings system, avoiding the need for very expensive and demanding climate–environmental monitoring campaigns.
Moreover, the proposed method at the two scales of analysis and application (i.e., bottom-up and top-down) could also be an effective tool for the economic planning of interventions. Indeed, it provides quantitative fundamentals to find out the necessary compromise between the construction of ecological systems and the benefits in terms of energy saving and environmental sustainability and the associated economic feasibility. In particular, its application to the city of Florence was chosen because the proposed method could constitute useful support for the Municipality (specifically, the Environment Directorate) in developing the urban forestry plan currently in progress, in favor of the ecological transition that the Green Deal [45] has already identified as a European priority. The operability of the proposed strategy is all the more effective when more closely connected to a truly sustainable smart city from a systemic perspective of energy transition and the green economy—achieved through the integration of ecosystem services, widespread and large-scale NbS, and advanced technologies for the maximum use and enhancement of renewable energy sources [19]. This should be carried out while taking into account climate variations and energy environmental dynamics/changes over the years, in parallel with the time necessary for the complete development/growth of plants.

5. Conclusions

The thermo-physics and thermodynamics-based approach presented in this research provides a method of easy and simple implementation that allows for the identification of the most important and suitable environmental interventions for energy sustainability and urban heat island mitigation.
In particular, the two methods proposed (top-down and bottom-up) provide an effective quantitative tool for urban energy planning. As a matter of fact, they enable the identification of urban areas with building–plant systems that need energy efficiency and refurbishment/retrofitting solutions from the perspective of the electric energy and sustainability transition.
These two methods can also be useful in identifying the periods and/or seasons during which the energy systems could work only for the controlled mechanical ventilation of building environments, and, under identified conditions of the external air enthalpy, for dehumidification and free-cooling only. In the green energy perspective and sustainability transition, the findings highlight the fundamental concept of plant downsizing, i.e., the optimal dimensioning to minimize partial loads and transient regimes, as well as the flexibility of their use over time, and adaptability, which leads to an effective response to the dynamics of climate change in the medium term.
Furthermore, by quantitatively analyzing the interaction between greenery and the building–plant system, this study seeks to contribute valuable insights into the integration of NbS and how they can support the optimization of the environmental energy of urban areas, aligning with broader sustainability goals.
The proposed methodological approach is a useful operational tool for the environmental energy policies aimed at achieving energy-efficient building–plant systems and climate-responsive buildings, consolidating the existing urban area to make the best use of resources for well-being and sustainability. It could be applied in all those contexts where climatic data and information on the urban built-up areas, and especially on buildings, are available. The formulated energy balances do not impose specific constraints on boundary conditions, making the proposed approach highly adaptable and applicable to various urban settings. However, the most significant reductions in air enthalpy are expected with a substantial increase in green surfaces. In this scenario, vegetation/greenery works as a natural thermal regulator (i.e., a buffer system), effectively mitigating the heat fluxes amplified within cities due to global warming and significant mutual radiative heat exchanges. This effect is particularly significant in regions where summer temperatures remain high for prolonged periods, pushing urban heat stress. From this perspective, urban forestation emerges as one of the suitable solutions capable of significantly reducing the energy demand associated with air cooling in buildings. The findings of this study highlight the necessity of integrating urban forestry interventions, extensive green infrastructure, and NbS into urban planning strategies to enhance thermal comfort and energy efficiency. However, the successful implementation of such measures relies on strong institutional/municipal support. Municipalities must actively promote and support urban greening initiatives, recognizing the need for a paradigm shift in public perception of urban spaces and their role in well-being and sustainability. This transition requires addressing critical issues such as mobility planning and long-term maintenance, ensuring that green ecosystem services become a fundamental element of sustainable urban development.
Future research should analyze in detail the different actions and effects associated with the use of different green systems, in relation to different thermophysical and mechanical properties of building cladding materials, streets, squares, etc. Furthermore, building upon the application of the proposed methods, it would be possible to examine the important impact of the size and shape of open spaces and surrounding buildings on overheating and the UHI phenomenon, especially during night hours.

Author Contributions

Conceptualization, C.B. and G.P.; methodology, C.B.; software, G.P.; validation, C.B., G.P. and C.P.; formal analysis, C.B. and G.P.; investigation, C.B., G.P. and C.P.; resources, C.B., G.P. and C.P.; data curation, C.B. and G.P.; writing—original draft preparation, C.B., G.P. and C.P.; writing—review and editing, C.B., G.P. and C.P.; visualization, C.B., G.P. and C.P.; supervision, C.B.; project administration, C.B. All authors have read and agreed to the published version of the manuscript.

Funding

This research received no external funding.

Data Availability Statement

The original contributions presented in this study are included in the article. Further inquiries can be directed to the corresponding author.

Conflicts of Interest

The authors declare no conflicts of interest.

Nomenclature

AlLeaf surface (m2)
cpaSpecific heat of air at constant pressure (kJ/kg K)
cpvSpecific heat of vapor at constant pressure (kJ/kg K)
DCharacteristic dimension of the system (m)
DlCharacteristic dimension of the leaf surface in the direction of the wind (m)
GrGrashof, dimensionless number (-)
hconvConvective heat transfer coefficient (W/m2 K)
hSpecific enthalpy (kJ/kg)
haSpecific air enthalpy at external air temperature (kJ/kg)
hlSpecific air enthalpy at leaf surface temperature (kJ/kg)
hdSpecific enthalpy of the dry air (kJ/kg)
hvSpecific enthalpy of the vapor contained in the air (kJ/kg)
k1, k2Empirical coefficients provided by [50], respectively, equal to 9.14 Jm−2 s−1/2–11 °C−1 and 200 s1/2−1m−1
LaLatent heat of vaporization at external air temperature (kJ/kg)
LlLatent heat of vaporization at leaf surface temperature (kJ/kg)
nNumber of air changes per hour (volume/h) expressed in (1/s)
NuNusselt, dimensionless number (-)
PrPrandtl, dimensionless number (-)
PsaSaturation pressure at the external air temperature (Pa)
PslSaturation pressure at the leaves’ surface temperature (Pa)
P t h ˙ Thermal power reduction within an hour (W)
QTotal heat released to the air, i.e., air enthalpy variation (kJ/kg)
Q a ˙ Radiation absorbed by leaves across the entire spectrum (i.e., the product of the mean hemispherical absorption coefficient and the incident solar radiation expressed in W/m2)
Q i r r ˙ Total solar radiation on the horizontal plane (W/m2)
Q l a t ˙ Latent heat (W)
Q s ˙ Sensible heat (W)
RaRayleigh, dimensionless number (Gr · Pr) (-)
RHaRelative humidity of the external air (%)
RHsat-lRelative humidity at the saturation temperature value of the leave surface (%)
rlResistance to evapotranspiration of leaves (s/m)
TIndoor air temperature (°C)
TaExternal air temperature (°C)
TlSurface temperature of leaves (°C)
vwWind velocity (m/s)
VBuilding total volume (m3)
WCharacteristic dimension of the leaf surface in the transverse direction to the wind (m)
xaAir specific humidity at the external air temperature (kgvapour/kgdry-air)
xlAir specific humidity at the surface temperature of the leaves (kgvapour/kgdry-air)
βCoefficient of thermal expansion (1/K)
ΔDifference
εInfrared emissivity coefficient (-)
λaThermal conductivity of the external air (W/m K)
μaDynamic viscosity (kg/m s)
ρ a External air density (kg/m3)
ρ v a Vapor density at the external air temperature (kg/m3)
ρ v l Vapor density at leaf surface temperature (kg/m3)
σStefan–Boltzmann constant (W/m2 K4)

References

  1. Global Alliance for Buildings and Construction (GlobalABC). Beyond Foundations—Mainstreaming Sustainable Solutions to Cut Emissions from the Buildings Sector; Global Alliance for Buildings and Construction (GlobalABC): Paris, France, 2024. [Google Scholar]
  2. Xi, C.; Ren, C.; Zhang, R.; Wang, J.; Feng, Z.; Haghighat, F.; Cao, S.-J. Nature-based solution for urban traffic heat mitigation facing carbon neutrality: Sustainable design of roadside green belts. Appl. Energy 2023, 343, 121197. [Google Scholar] [CrossRef]
  3. Rezazadeh, A.A.; Avami, A. An integrated policy approach for sustainable decarbonization pathways of energy system in a city under climate change scenarios. Energy Policy 2024, 195, 114394. [Google Scholar] [CrossRef]
  4. Parvin, K.; Hossain, M.J.; Arsad, A.Z.; Ker, P.J.; Hannan, M.A. Building energy technologies towards achieving net-zero pathway: A comprehensive review, challenges and future directions. J. Build. Eng. 2025, 100, 111795. [Google Scholar] [CrossRef]
  5. D’Amato, D.; Droste, N.; Allen, B.; Kettunen, M.; Lähtinen, K.; Korhonen, J.; Leskinen, P.; Matthies, B.D.; Toppinen, A. Green, circular, bio economy: A comparative analysis of sustainability avenues. J. Clean. Prod. 2017, 168, 716–734. [Google Scholar] [CrossRef]
  6. Marando, F.; Salvatori, E.; Sebastiani, A.; Fusaro, L.; Manes, F. Regulating Ecosystem Services and Green Infrastructure: Assessment of Urban Heat Island effect mitigation in the municipality of Rome, Italy. Ecol. Modell. 2019, 392, 92–102. [Google Scholar] [CrossRef]
  7. Azmeer, A.; Tahir, F.; Al-Ghamdi, S.G. Progress on green infrastructure for urban cooling: Evaluating techniques, design strategies, and benefits. Urban Clim. 2024, 56, 102077. [Google Scholar] [CrossRef]
  8. Aleksejeva, J.; Voulgaris, G.; Gasparatos, A. Systematic review of the climatic and non-climatic benefits of green roofs in urban areas. Urban Clim. 2024, 58, 102133. [Google Scholar] [CrossRef]
  9. Oquendo-Di Cosola, V.; Olivieri, F.; Ruiz-García, L. A systematic review of the impact of green walls on urban comfort: Temperature reduction and noise attenuation. Renew. Sustain. Energy Rev. 2022, 162, 112463. [Google Scholar] [CrossRef]
  10. Villarreal-Guerrero, F.; Kacira, M.; Fitz-Rodríguez, E.; Linker, R.; Giacomelli, G.A.; Arbel, A.; Kubota, C. Implementation of a greenhouse cooling strategy with natural ventilation and variable fogging rates. Trans. ASABE 2013, 56, 295–304. [Google Scholar] [CrossRef]
  11. Hami, A.; Abdi, B.; Zarehaghi, D.; Maulan, S. Bin Assessing the thermal comfort effects of green spaces: A systematic review of methods, parameters, and plants’ attributes. Sustain. Cities Soc. 2019, 49, 101634. [Google Scholar] [CrossRef]
  12. Edeigba, B.A.; Ashinze, U.K.; Umoh, A.A.; Biu, P.W.; Daraojimba, A.I. Urban green spaces and their impact on environmental health: A Global Review. World J. Adv. Res. Rev. 2024, 21, 917–927. [Google Scholar] [CrossRef]
  13. Cardinali, M.; Pisello, A.L.; Piselli, C.; Pigliautile, I.; Cotana, F. Microclimate mitigation for enhancing energy and environmental performance of Near Zero Energy Settlements in Italy. Sustain. Cities Soc. 2020, 53, 101964. [Google Scholar] [CrossRef]
  14. Piselli, C.; Di Grazia, M.; Pisello, A.L. Combined effect of outdoor microclimate boundary conditions on air conditioning system’s efficiency and building energy demand in net zero energy settlements. Sustainability 2020, 12, 6056. [Google Scholar] [CrossRef]
  15. Rahman, M.S.; MacPherson, S.; Lefsrud, M. A study on evaporative cooling capacity of a novel green wall to control ventilating air temperature. J. Build. Eng. 2023, 77, 107466. [Google Scholar] [CrossRef]
  16. Wu, Y.; Patuano, A.; Mashhoodi, B.; Lenzholzer, S.; Acred, A.; Narvaez Zertuche, L. How small green spaces cool urban neighbourhoods: Optimising distribution, size and shape. Landsc. Urban Plan. 2025, 253, 105224. [Google Scholar] [CrossRef]
  17. Balocco, C.; Colaianni, A. Assessment of energy sustainable operations on a historical building. The Dante Alighieri high school in Florence. Sustainability 2018, 10, 2054. [Google Scholar] [CrossRef]
  18. Ciacci, C.; Banti, N.; Di Naso, V.; Bazzocchi, F. Green strategies for improving urban microclimate and air quality: A case study of an Italian industrial district and facility. Build. Environ. 2023, 244, 110762. [Google Scholar] [CrossRef]
  19. D’Amato, D.; Korhonen, J. Integrating the green economy, circular economy and bioeconomy in a strategic sustainability framework. Ecol. Econ. 2021, 188, 107143. [Google Scholar] [CrossRef]
  20. Barradas, V.L. Air temperature and humidity and human comfort index of some city parks of Mexico City. Int. J. Biometeorol. 1991, 35, 24–28. [Google Scholar]
  21. Bartesaghi Koc, C.; Osmond, P.; Peters, A. Evaluating the cooling effects of green infrastructure: A systematic review of methods, indicators and data sources. Sol. Energy 2018, 166, 486–508. [Google Scholar] [CrossRef]
  22. Yuan, Y.; Guo, W.; Tang, S.; Zhang, J. Effects of patterns of urban green-blue landscape on carbon sequestration using XGBoost-SHAP model. J. Clean. Prod. 2024, 476, 143640. [Google Scholar] [CrossRef]
  23. Ling, T.Y.; Chiang, Y.C. Well-being, health and urban coherence-advancing vertical greening approach toward resilience: A design practice consideration. J. Clean. Prod. 2018, 182, 187–197. [Google Scholar] [CrossRef]
  24. Jamei, E.; Chau, H.W.; Seyedmahmoudian, M.; Mekhilef, S.S.; Sami, F.A. Green roof and energy–role of climate and design elements in hot and temperate climates. Heliyon 2023, 9, e15917. [Google Scholar] [CrossRef]
  25. Sodoudi, S.; Zhang, H.; Chi, X.; Müller, F.; Li, H. The influence of spatial configuration of green areas on microclimate and thermal comfort. Urban For. Urban Green. 2018, 34, 85–96. [Google Scholar] [CrossRef]
  26. Puchol-Salort, P.; O’Keeffe, J.; van Reeuwijk, M.; Mijic, A. An urban planning sustainability framework: Systems approach to blue green urban design. Sustain. Cities Soc. 2021, 66, 102677. [Google Scholar] [CrossRef]
  27. Bilgili, B.C.; Şahin, Ş.; Yilmaz, O.; Gürbüz, F.; Arici, Y.K. Temperature distribution and the cooling effects on three urban parks in Ankara, Turkey. Int. J. Glob. Warm. 2013, 5, 296–310. [Google Scholar] [CrossRef]
  28. Arzberger, S.; Egerer, M.; Suda, M.; Annighöfer, P. Thermal regulation potential of urban green spaces in a changing climate: Winter insights. Urban For. Urban Green. 2024, 100, 128488. [Google Scholar] [CrossRef]
  29. Shan, L.; He, S. The role of peri-urban parks in enhancing urban green spaces accessibility in high-density contexts: An environmental justice perspective. Landsc. Urban Plan. 2025, 254, 105244. [Google Scholar] [CrossRef]
  30. Vasconcelos, L.; Langemeyer, J.; Cole, H.V.S.; Baró, F. Nature-based climate shelters? Exploring urban green spaces as cooling solutions for older adults in a warming city. Urban For. Urban Green. 2024, 98, 12840. [Google Scholar] [CrossRef]
  31. Sarkar, C.; Webster, C.; Pryor, M.; Tang, D.; Melbourne, S.; Zhang, X.; Jianzheng, L. Exploring associations between urban green, street design and walking: Results from the Greater London boroughs. Landsc. Urban Plan. 2015, 143, 112–125. [Google Scholar] [CrossRef]
  32. Gunawardena, K.R.; Wells, M.J.; Kershaw, T. Utilising green and bluespace to mitigate urban heat island intensity. Sci. Total Environ. 2017, 584–585, 1040–1055. [Google Scholar] [CrossRef]
  33. Yang, F.; Yousefpour, R.; Hu, Y.; Zhang, Y.; Li, J.; Wang, H. Assessing the efficiency of urban blue-green space in carbon-saving: Take a high-density urban area in a cold region as an example. J. Clean. Prod. 2024, 479, 144017. [Google Scholar] [CrossRef]
  34. Vidal, D.G.; Teixeira, C.P.; Fernandes, C.O.; Olszewska-guizzo, A.; Dias, R.C.; Vilaça, H.; Barros, N.; Maia, R.L. Patterns of human behaviour in public urban green spaces: On the influence of users’ profiles, surrounding environment, and space design. Urban For. Urban Green. 2022, 74, 127668. [Google Scholar] [CrossRef]
  35. Yungstein, Y.; Helman, D. Cooling, CO2 reduction, and energy-saving benefits of a green-living wall in an actual workplace. Build. Environ. 2023, 236, 110220. [Google Scholar] [CrossRef]
  36. Sun, L.; Xie, C.; Qin, Y.; Zhou, R.; Wu, H.; Che, S. Study on temperature regulation function of green spaces at community scale in high-density urban areas and planning design strategies. Urban For. Urban Green. 2024, 101, 128511. [Google Scholar] [CrossRef]
  37. Abu Qadourah, J. Energy efficiency evaluation of green roofs as a passive strategy in the mediterranean climate. Results Eng. 2024, 23, 102519. [Google Scholar] [CrossRef]
  38. Huang, J.; Kong, F.; Yin, H.; Middel, A.; Liu, H.; Meadows, M.E. Green roof effects on urban building surface processes and energy budgets. Energy Convers. Manag. 2023, 287, 117100. [Google Scholar] [CrossRef]
  39. Li, Y.; Fan, S.; Li, K.; Zhang, Y.; Dong, L. Microclimate in an urban park and its influencing factors: A case study of Tiantan Park in Beijing, China. Urban Ecosyst. 2021, 24, 767–778. [Google Scholar] [CrossRef]
  40. Wu, Z.; Zhou, Y.; Ren, Y. Green space-building integration for Urban Heat Island mitigation: Insights from Beijing’s fifth ring road district. Sustain. Cities Soc. 2024, 116, 105917. [Google Scholar] [CrossRef]
  41. Bartesaghi Koc, C.; Osmond, P.; Peters, A.; Irger, M. A Methodological Framework to Assess the Thermal Performance of Green Infrastructure Through Airborne Remote Sensing. Procedia Eng. 2017, 180, 1306–1315. [Google Scholar]
  42. Obriejetan, M.; Krexner, T. Remote sensing-based evapotranspiration modeling for urban green spaces: A case study in Vienna. Urban Clim. 2024, 58, 102192. [Google Scholar] [CrossRef]
  43. Jia, J.; Zlatanova, S.; Liu, H.; Aleksandrov, M.; Zhang, K. A design-support framework to assess urban green spaces for human wellbeing. Sustain. Cities Soc. 2023, 98, 104779. [Google Scholar] [CrossRef]
  44. European Environmental Agency (EEA). Urban Adaptation to Climate Change in Europe 2016: Transforming Cities in a Changing Climate. Available online: https://www.eea.europa.eu/publications/urban-adaptation-2016 (accessed on 17 December 2024).
  45. European Commission. The European Green Deal. Available online: https://commission.europa.eu/strategy-and-policy/priorities-2019-2024/european-green-deal_en (accessed on 17 December 2024).
  46. European Commission. Renovation Wave Strategy. Available online: https://energy.ec.europa.eu/topics/energy-efficiency/energy-efficient-buildings/renovation-wave_en (accessed on 17 December 2024).
  47. European Commission. Biodiversity Strategies for 2030. Available online: https://environment.ec.europa.eu/strategy/biodiversity-strategy-2030_en (accessed on 17 December 2024).
  48. Balocco, C.; Petrone, G. Efficiency of Different Basic Modelling Approaches to Simulate Moisture Buffering in Building Materials. Open Constr. Build. Technol. J. 2016, 10, 561–574. [Google Scholar] [CrossRef]
  49. Balocco, C.; Petrone, G. Heat and moisture transfer investigation of surface building materials. Math. Model. Eng. Probl. 2018, 5, 146–152. [Google Scholar] [CrossRef]
  50. Gates, D. Physical Processes in Ecosystems; University of Washington, Center for Quantitative Science: Washington, WA, USA, 2020. [Google Scholar]
  51. ASHRAE. Handbook Fundamentals; SI&IP Editions: Atlanta, GA, USA, 2021. [Google Scholar]
  52. ASHRAE. Handbook—HVAC Systems and Equipment; SI&IP Editions: Atlanta, GA, USA, 2024. [Google Scholar]
  53. Holman, J.P. Heat Transfer, 10th ed.; McGraw-Hill: New York, NY, USA, 2010. [Google Scholar]
  54. F-Chart Software. EES—Engineering Equation Solver. Available online: https://fchartsoftware.com/ees/index.php (accessed on 13 March 2025).
  55. Regione Toscana. GEOscope Observatory. Available online: https://www.regione.toscana.it/-/geoscopio (accessed on 13 March 2025).
  56. EN 16798-1:2019; Energy Performance of Buildings—Ventilation for Buildings—Part 1: Indoor Environmental Input Parameters for Design and Assessment of Energy Performance of Buildings Addressing Indoor Air Quality, Thermal Environment, Lighting and Acoustics—M1-6 2019. Slovenian Institute for Standardization: Ljubljana, Slovenia, 2019.
  57. Balocco, C.; Leoncini, L. The green system: Solutions for environmental protection and CO2 emissions reduction. The example of an existing school building. Ital. J. For. Mt. Environ. 2023, 78, 99–114. [Google Scholar] [CrossRef]
  58. Decree of the President of the Italian Republic 16 April 2013, n. 74. Regulation Defining the General Criteria for Operation, Operation, Control, Maintenance and Inspection of Thermal Systems for Winter and Summer Air Conditioning of Buildings and for the Preparation of Hot Water for Sanitary Purposes; Decree of the President of the Italian Republic: Rome, Italy, 2013; (13G00114).
  59. Costa-Filho, E.; Chávez, J.L.; Zhang, H.; Andales, A.A. An optimized surface aerodynamic temperature approach to estimate maize sensible heat flux and evapotranspiration. Agric. For. Meteorol. 2021, 311, 108683. [Google Scholar] [CrossRef]
  60. Baraldi, R.; Neri, L.; Costa, F.; Facini, O.; Rapparini, F.; Carriero, G. Ecophysiological and micromorphological characterization of green roof vegetation for urban mitigation. Urban For. Urban Green. 2019, 37, 24–32. [Google Scholar] [CrossRef]
Figure 1. Flowchart summarizing the overall proposed methodological approach.
Energies 18 01640 g001
Figure 2. Plot of air temperature, global solar irradiation, and the leaf surface temperature trends for three summer days (29–30 June and 1 July).
Energies 18 01640 g002
Figure 3. Plot of wind velocity and air relative humidity trends for three summer days (29–30 June and 1 July).
Energies 18 01640 g003
Figure 4. The buildings and greenery map for the blocks around the park of Vittoria Square. In the background the city map, in pink the urban built, in violet the buildings interested by the calculation and in green the trees position are shown.
Energies 18 01640 g004
Figure 5. Map for avenue, greenery, and building blocks from Libertà Square to Beccaria Square. In the background the city map, in pink the urban built, in violet the buildings interested by the calculation and in green the trees position are shown.
Energies 18 01640 g005
Table 1. Basic parameters used for the example energy balance by applying Equation (1).
Q i r r ˙ TavwRHarl
W/m2°Cm/s-s/m
8002850.61100
Disclaimer/Publisher’s Note: The statements, opinions and data contained in all publications are solely those of the individual author(s) and contributor(s) and not of MDPI and/or the editor(s). MDPI and/or the editor(s) disclaim responsibility for any injury to people or property resulting from any ideas, methods, instructions or products referred to in the content.

