
Assessing the Sustainability of Electric and Hybrid Buses: A Life Cycle Assessment Approach to Energy Consumption in Usage


Abstract
1. Introduction
2. Literature Review
3. Research Methods
3.1. Life Cycle Assessment Methods
3.1.1. Process-Based LCA
3.1.2. Hybrid LCA
3.1.3. Streamlined LCA
3.1.4. Selected Method
3.2. Worldwide Harmonized Light Vehicles Test Procedure (WLTP)
- The WLTP incorporates elevated rates of acceleration, more authentic velocities, and reduced durations of stops, so offering a more accurate portrayal of contemporary driving circumstances.
- The concept of driving phases encompasses four distinct segments characterized by varying average speeds: low, medium, high, and extra-high. Each component comprises a diverse range of driving stages, encompassing halts, acceleration, and deceleration.
- Diverse range of conditions: The cycle is specifically designed to encompass a broad spectrum of driving circumstances in order to assure its global applicability. This encompasses several environments, including urban, suburban, and motorway driving.
- Class 1: For vehicles with extremely low power-to-mass ratios, which are less than or equal to 22 W/kg.
- Class 2: For vehicles with relatively low to moderate power-to-mass ratios, which are greater than 22 W/kg and up to 34 W/kg.
- Class 3a: For vehicles that have a significant power-to-mass ratio, ranging from moderate to high, which are greater than 34 W/kg. During the test the speed of the vehicle does not exceed 120 km/h.
- Class 3b: Has the same power-to-mass ratio as Class 3a, but the speed can exceed 120 km/h in the WLTP.
- Low—emulates urban driving conditions characterized by slow velocities and frequent instances of commencing and ceasing movement.
- Medium—emulates the experience of driving in a suburban area, with a moderate speed and a reduced number of stops.
- High—emulates the experience of driving on a highway, with fast speeds and uninterrupted driving.
- Extra high—emulates the experience of driving at extremely high speeds, specifically designed for high-performance vehicles.
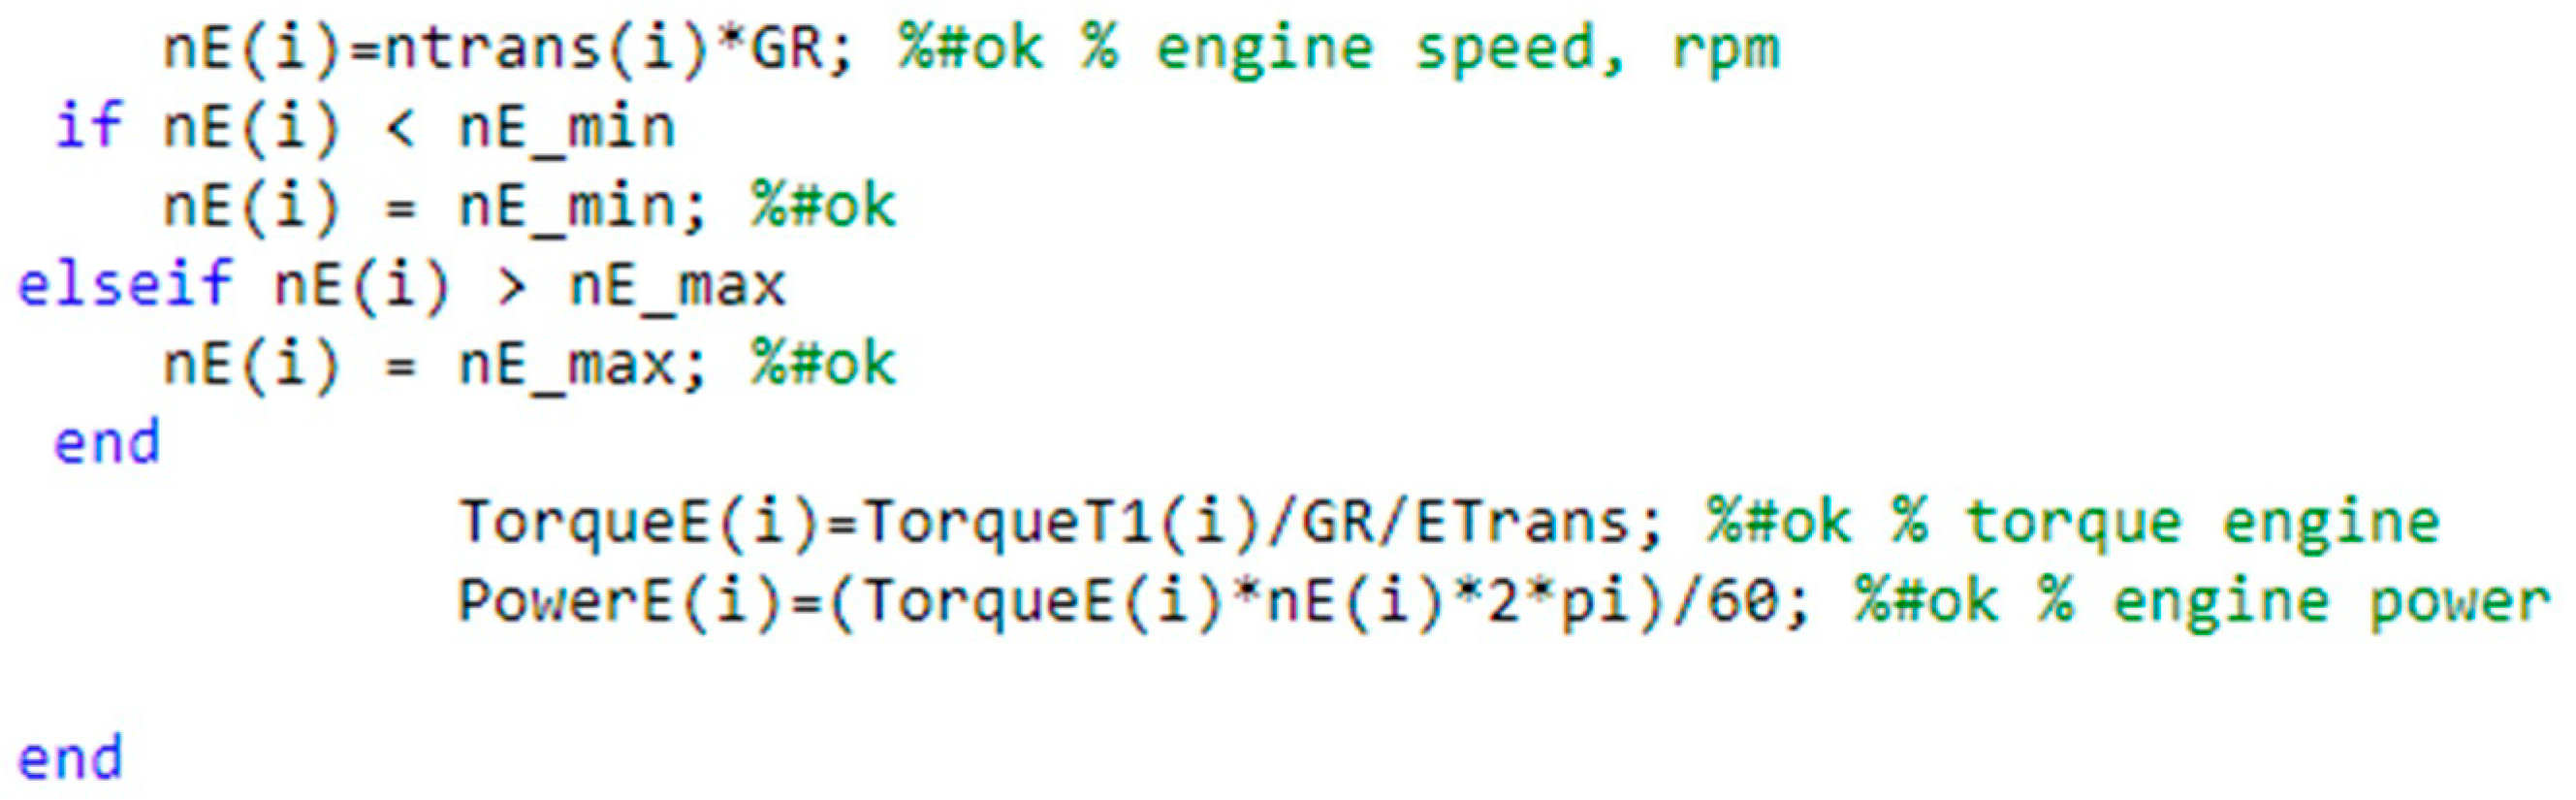
3.3. Parameter Definition and Calculation
- Vehicle mass: 17,000 kg
- Vehicle front area: 5.1 m2
- Rolling resistance: miu = 0.006
- Slope of the road: alpha = 0
- Gravity value: g = 9.8 m/s2
- Air density: phi = 1.29 kg/m3
- Atmospheric drag coefficient: Cd = 0.35
- Differential efficiency: EDiff = 0.95
- Differential ratio: Gear Ratio = 23
- Wheel radius: R = 0.957/2 m, 275/70 R22.5
- Transmission ratio: GR = 1
- Transmission efficiency: ETrans = 0.96
- Battery energy: EnergyMax = 604 × 232.5 × 12 × 3600 J
- Battery parameter: Voltage = 151 v, content = 232.5 × 12 Ah, l = 800 A, unit = 4, 250 v–400 v, battery voltage = 360 v
- Initial state of charge at the beginning: EnergyEM(1) = 0.8 × EnergyMax
- Gravity force:
- Drag force:
- Acceleration force:
- Resistance force:
- Vehicle mass: 16,000 kg
- Differential ratio: Gear Ratio = 4
- Transmission ratio: GR = 18
- First gear: Gear = 1
- Engine speed min: nE_min = 800 rpm
- Engine speed max: nE_max = 1800 rpm
- Battery energy: EnergyMax = 151 × 232.5 × 12 × 3600 J
- Battery parameter: Voltage = 151 v, content = 232.5 × 12 Ah, l = 800 A, unit = 1, 250 v–400 v, battery voltage = 360 v
4. Results Analysis
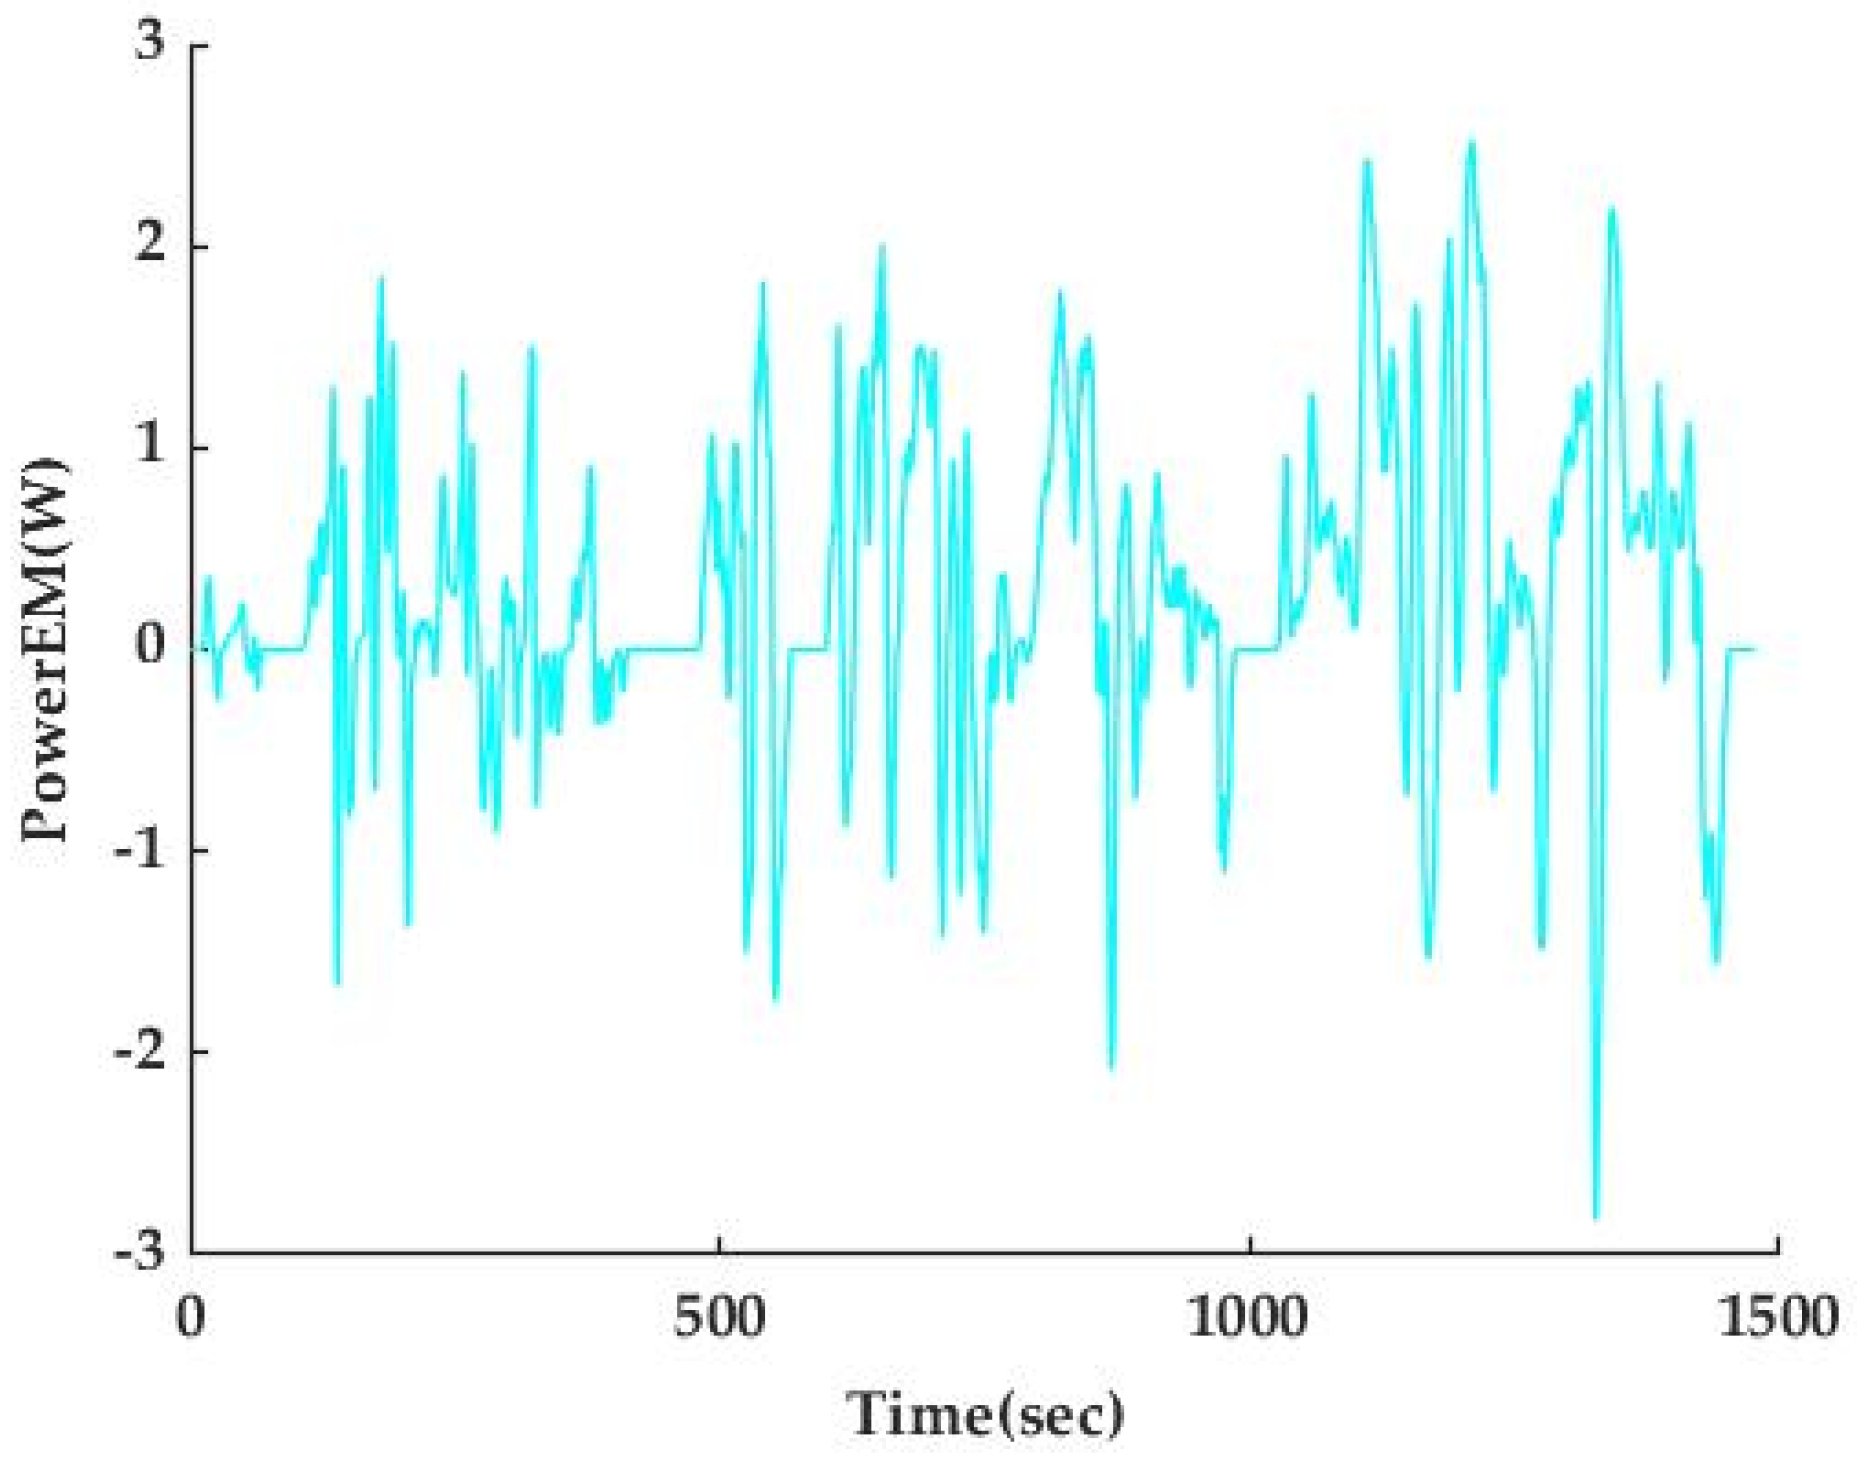
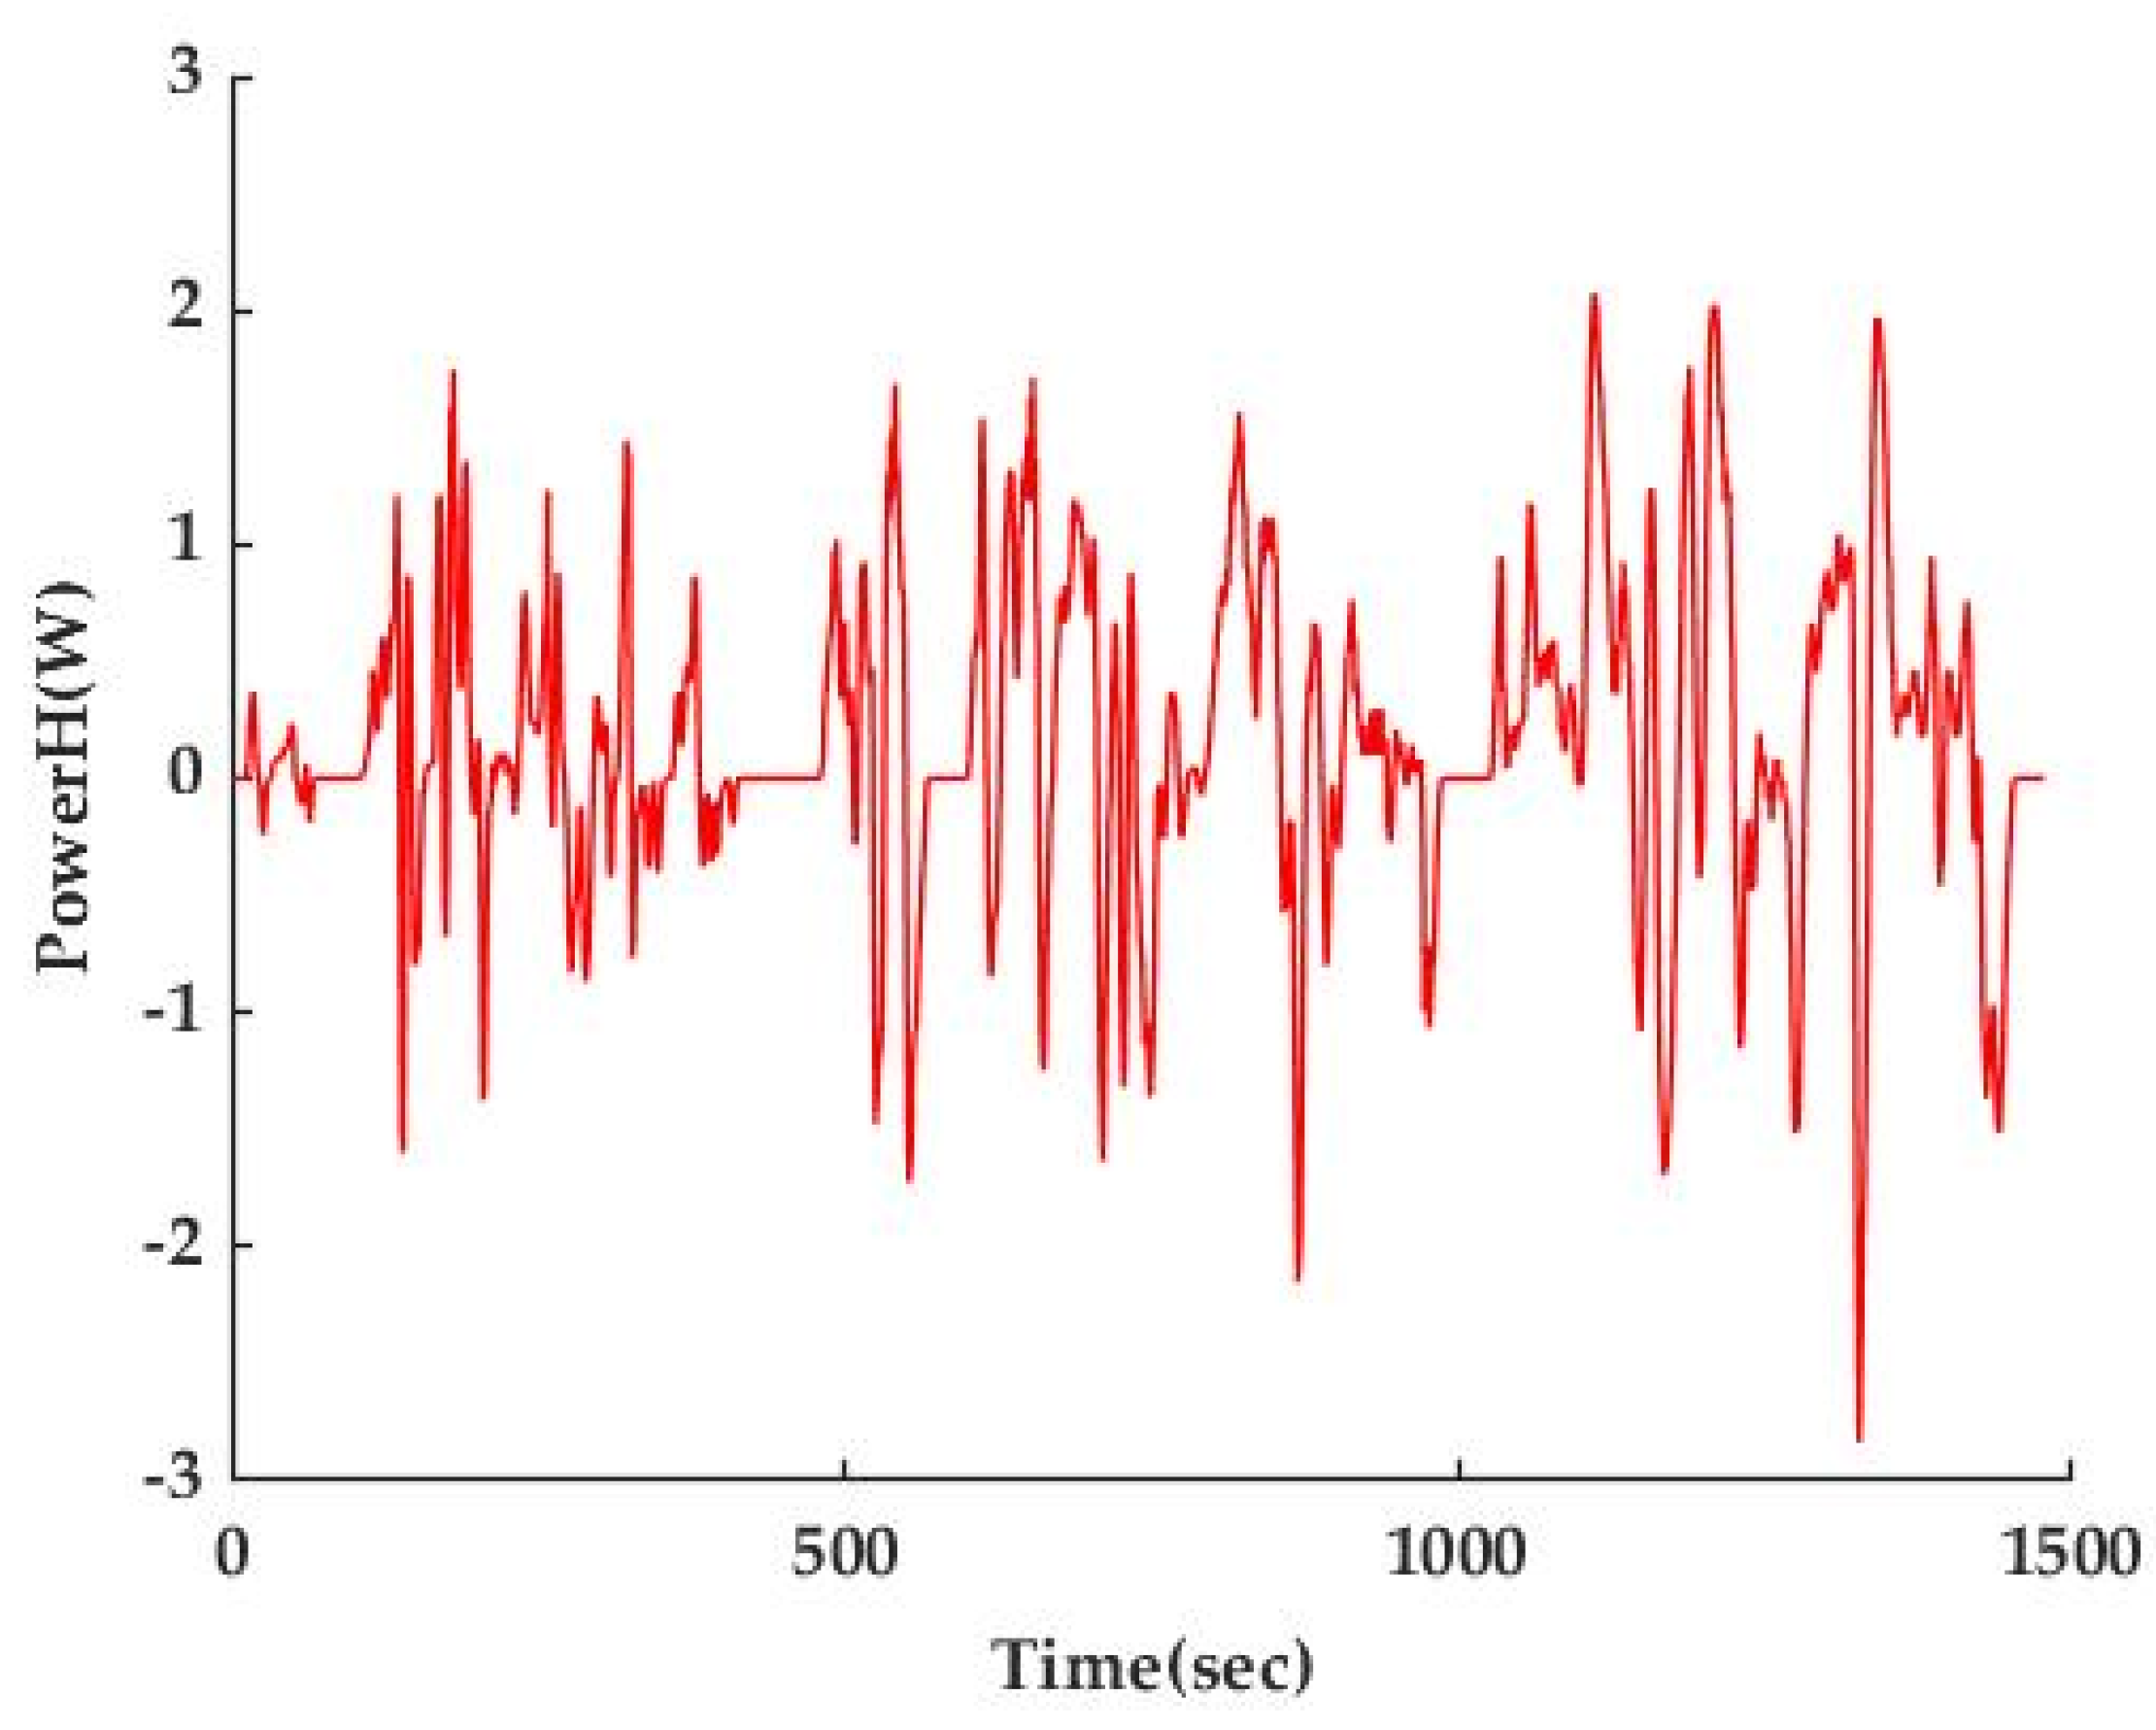
4.1. Energy Consumption Analysis
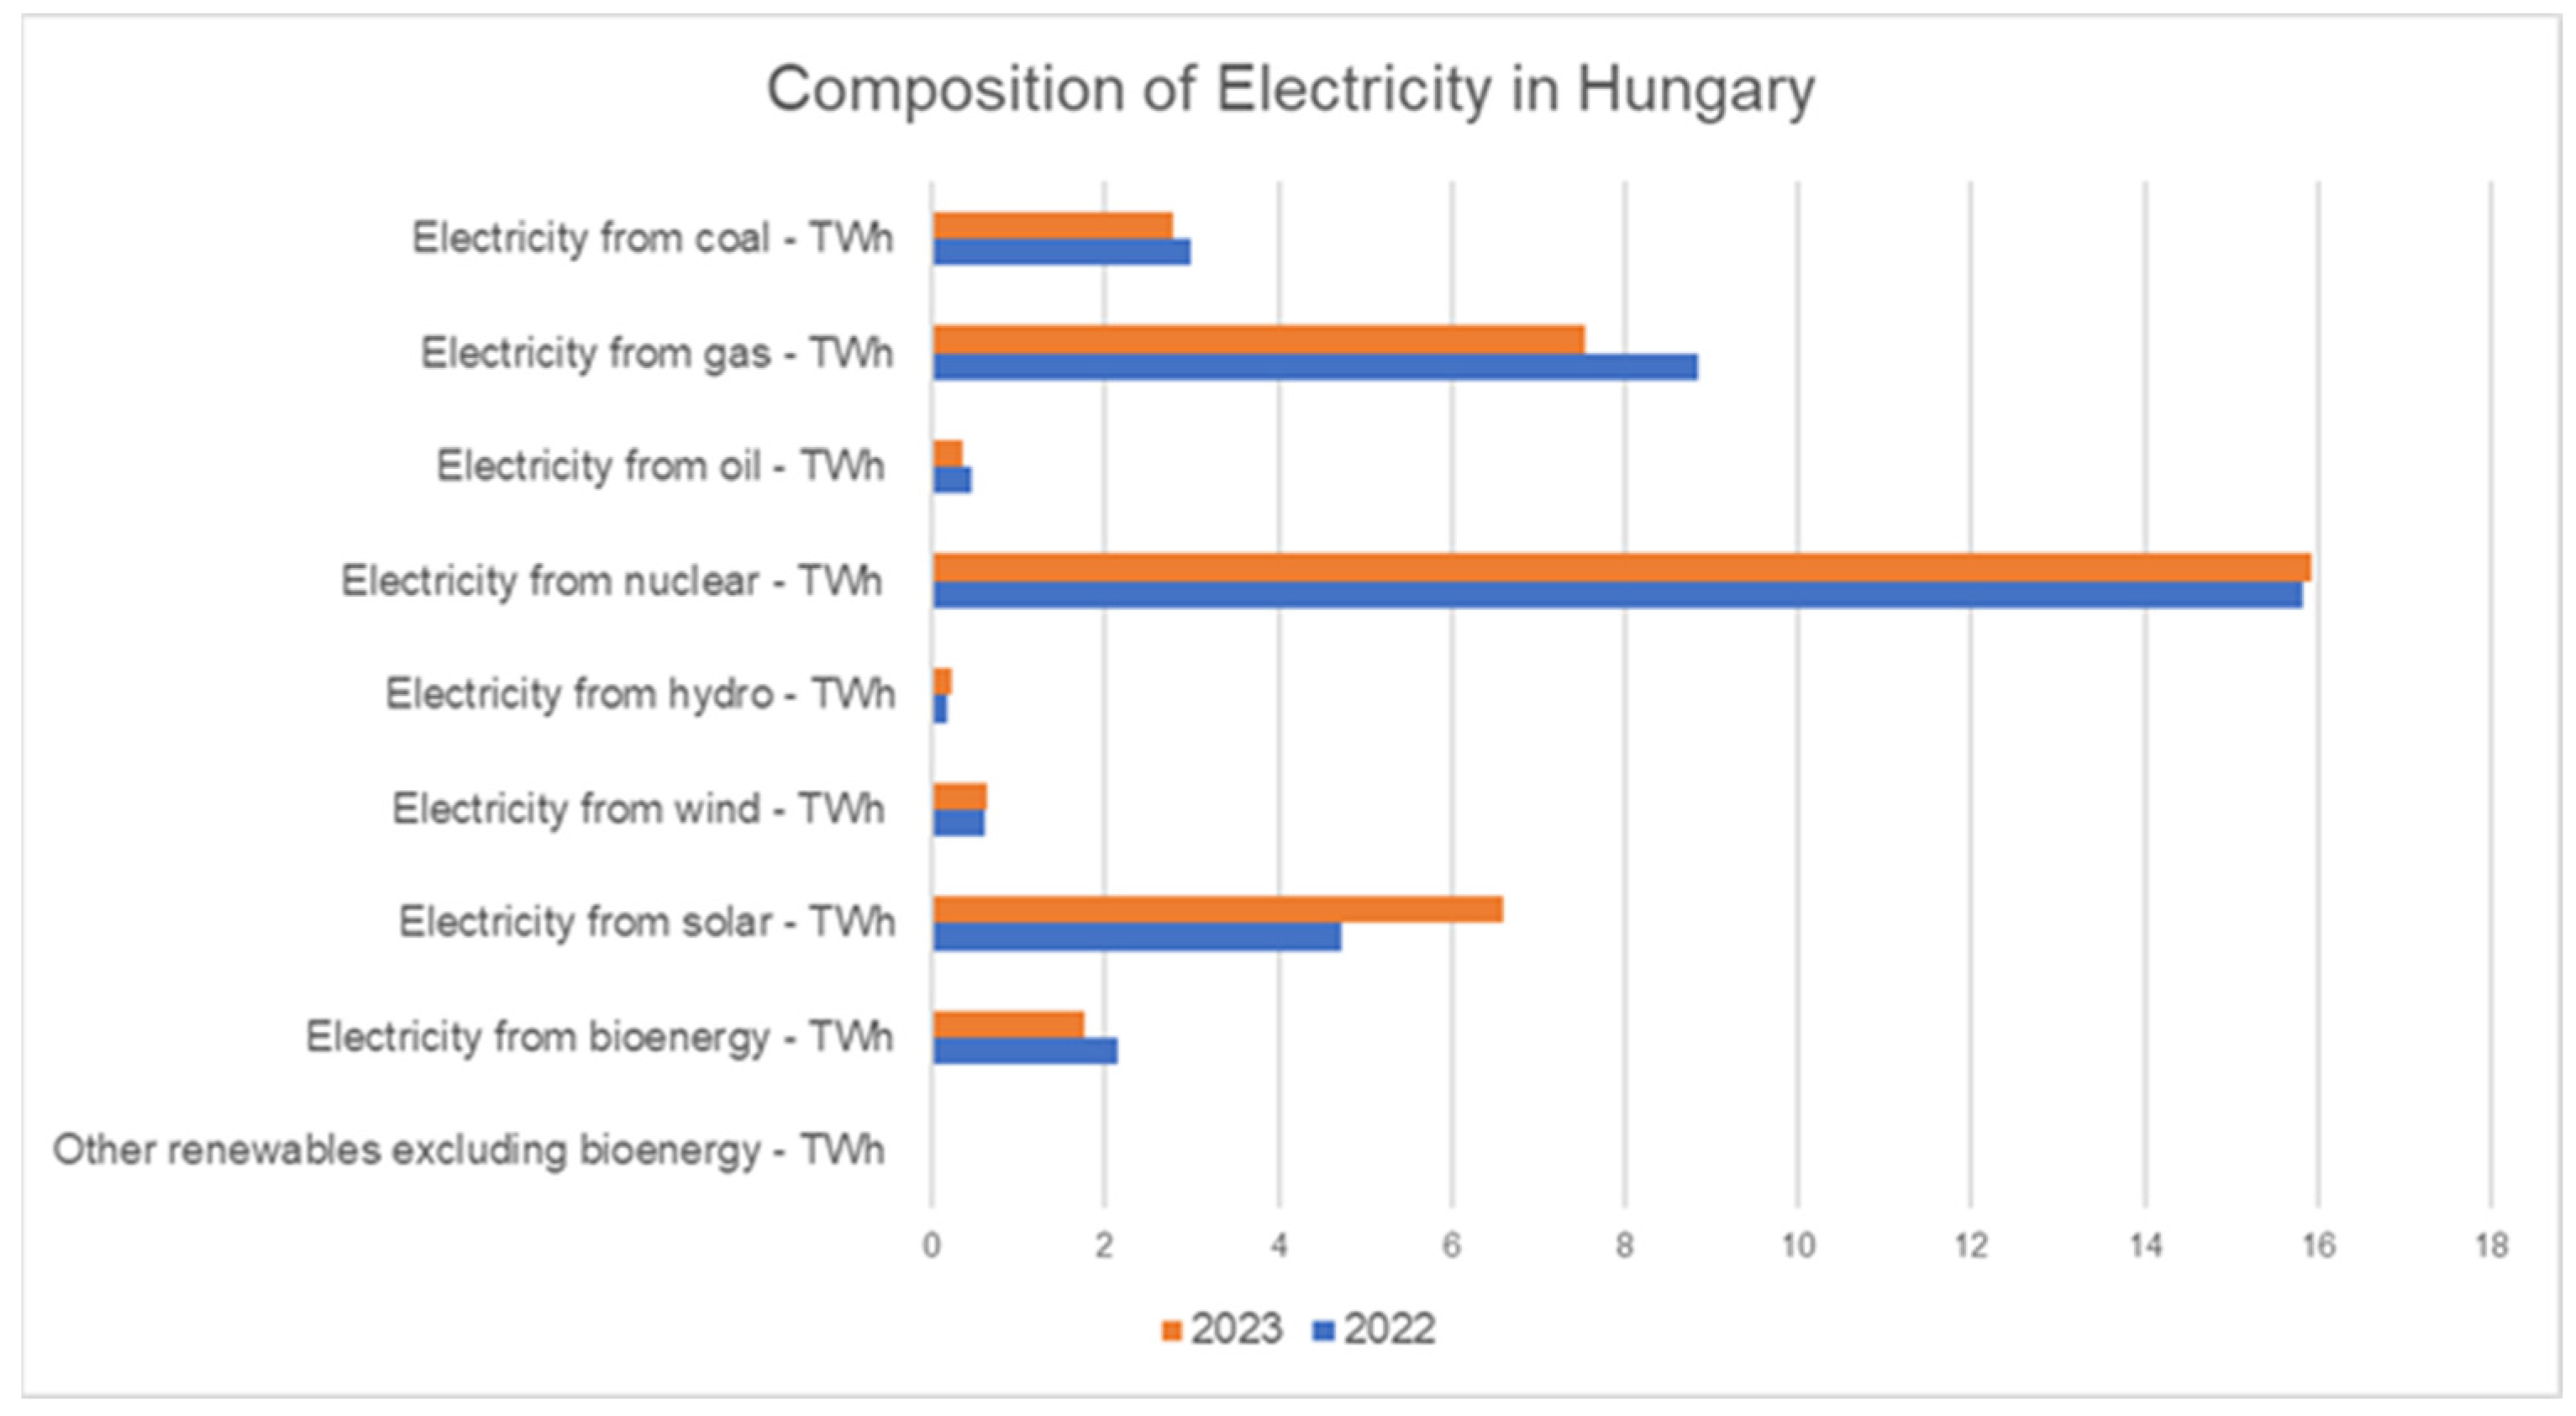
4.2. Electricity vs. Fossil Fuels
- Hungary ranks third in terms of the proportion of nuclear power among member countries of the International Energy Agency (IEA), following France and Slovakia. The extension of the service life of the current units at the Paks nuclear power plant by 20 years (2032–2037) allows nuclear power to continue playing a significant role in the energy mix. There is a possibility that the scheduled building of two further units at the Paks facility, which is being funded by Russian investment, may experience substantial delays.
- Approximately 26.5% of the electrical mix is attributed to natural gas, making it a substantial source. The clear evidence of Hungary’s substantial reliance on fossil fuels to fulfil a significant amount of its energy needs is apparent.
- Coal remains a prominent source of energy, contributing approximately 15.5% to the overall energy generation. However, there are plans to progressively phase out the effective use of coal by 2030.
- Alternative energy sources: Renewable energy sources, such as biomass, wind, and solar power, make up around 13.4% of the total energy contribution. Currently, biomass is the predominant source of renewable energy, with wind and solar power in close pursuit. Both wind and solar electricity have been consistently increasing in terms of their capacity and output.
- Additional sources: A tiny fraction is derived from alternative sources, such as hydroelectric electricity, which remains relatively insignificant in Hungary due to its geographical and climatic characteristics that are not conducive to extensive hydropower generation.
5. Conclusions
Author Contributions
Funding
Data Availability Statement
Conflicts of Interest
References
- Éltető, A. Aspects of electric vehicle battery production in Hungary. IWE Work. Pap. 2023. Available online: https://ideas.repec.org//p/iwe/workpr/271.html (accessed on 29 July 2006).
- Faria, R.; Marques, P.; Moura, P.; Freire, F.; Delgado, J.; de Almeida, A.T. Impact of the electricity mix and use profile in the life-cycle assessment of electric vehicles. Renew. Sustain. Energy Rev. 2013, 24, 271–287. [Google Scholar]
- Bjerkan, K.Y.; Nørbech, T.E.; Nordtømme, M.E. Incentives for promoting Battery Electric Vehicle (BEV) adoption in Norway. Transp. Res. Part Transp. Environ. 2016, 43, 169–180. [Google Scholar]
- Ajanovic, A.; Haas, R. Economic and Environmental Prospects for Battery Electric- and Fuel Cell Vehicles: A Review. Fuel Cells 2019, 19, 515–529. [Google Scholar]
- Lebeau, K.; Van Mierlo, J.; Lebeau, P.; Mairesse, O.; Macharis, C. Consumer attitudes towards battery electric vehicles: A large-scale survey. Int. J. Electr. Hybrid Veh. 2013, 5, 28–41. [Google Scholar]
- Sirojiddinova, I.M.; Aminboyev, A.S. Advantages and Disadvantages of Electric Vehicles and Hybrid Electric Vehicles. Am. J. Eng. Mech. Archit. 2023, 1, 130–136. [Google Scholar]
- Helmers, E.; Marx, P. Electric cars: Technical characteristics and environmental impacts. Environ. Sci. Eur. 2012, 24, 14. [Google Scholar] [CrossRef]
- Lockrey, S.; Verghese, K.; Langley, S.; Brennan, L. Coke and the environment. In Decoding Coca-Cola; Routledge: Oxford, UK, 2020. [Google Scholar]
- Guinée, J.B.; Heijungs, R.; Huppes, G.; Zamagni, A.; Masoni, P.; Buonamici, R.; Ekvall, T.; Rydberg, T. Life Cycle Assessment: Past, Present, and Future. Environ. Sci. Technol. 2011, 45, 90–96. [Google Scholar]
- Tukker, A. Life cycle assessment as a tool in environmental impact assessment. Environ. Impact Assess. Rev. 2000, 20, 435–456. [Google Scholar]
- Curran, M.A. Life Cycle Assessment: A review of the methodology and its application to sustainability. Curr. Opin. Chem. Eng. 2013, 2, 273–277. [Google Scholar]
- Eriksson, E.; Blinge, M.; Lövgren, G. Life cycle assessment of the road transport sector. Sci. Total Environ. 1996, 189–190, 69–76. [Google Scholar]
- Messagie, M.; Boureima, F.-S.; Coosemans, T.; Macharis, C.; Mierlo, J.V. A Range-Based Vehicle Life Cycle Assessment Incorporating Variability in the Environmental Assessment of Different Vehicle Technologies and Fuels. Energies 2014, 7, 1467–1482. [Google Scholar] [CrossRef]
- Zheng, G.; Peng, Z. Life Cycle Assessment (LCA) of BEV’s environmental benefits for meeting the challenge of ICExit (Internal Combustion Engine Exit). Energy Rep. 2021, 7, 1203–1216. [Google Scholar]
- Syré, A.M.; Shyposha, P.; Freisem, L.; Pollak, A.; Göhlich, D. Comparative Life Cycle Assessment of Battery and Fuel Cell Electric Cars, Trucks, and Buses. World Electr. Veh. J. 2024, 15, 114. [Google Scholar] [CrossRef]
- Verma, S.; Dwivedi, G.; Verma, P. Life cycle assessment of electric vehicles in comparison to combustion engine vehicles: A review. Mater. Today Proc. 2022, 49, 217–222. [Google Scholar]
- Tropschuh, P.F.; Biendl, M. Audi: Raw Materials, Road, Recycling—How Life Cycle Analysis Influences Product Development. In Sustainable Value Chain Management: Delivering Sustainability Through the Core Business; D’heur, M., Ed.; Springer International Publishing: Cham, Switzerland, 2015; pp. 167–183. [Google Scholar] [CrossRef]
- Hunt, R.G.; Franklin, W.E.; Hunt, R.G. LCA—How it came about. Int. J. Life Cycle Assess. 1996, 1, 4–7. [Google Scholar]
- ISO 14040:2006; Environmental Management—Life Cycle Assessment—Principles and Framework. ISO: Geneva, Switzerland, 2006. Available online: https://www.iso.org/obp/ui/#iso:std:iso:14040:ed-2:v1:en (accessed on 29 July 2006).
- ISO 14041:1998; Environmental Management—Life Cycle Assessment—Goal and Scope Definition and Inventory Analysis. ISO: Geneva, Switzerland, 1998. Available online: https://www.iso.org/standard/23152.html (accessed on 9 February 2025).
- ISO 14042:2000; Environmental Management—Life Cycle Assessment—Life Cycle Impact Assessment. ISO: Geneva, Switzerland, 2000. Available online: https://www.iso.org/standard/23153.html (accessed on 9 February 2025).
- ISO 14043:2000; Environmental Management—Life Cycle Assessment—Life Cycle Interpretation. ISO: Geneva, Switzerland, 2000. Available online: https://www.iso.org/standard/23154.html (accessed on 9 February 2025).
- ISO 14044:2006; Environmental Management—Life Cycle Assessment—Requirements and Guidelines. ISO: Geneva, Switzerland, 2006. Available online: https://www.iso.org/obp/ui/#iso:std:iso:14044:ed-1:v1:en (accessed on 29 July 2006).
- Finkbeiner, M.; Inaba, A.; Tan, R.; Christiansen, K.; Klüppel, H.-J. The New International Standards for Life Cycle Assessment: ISO 14040 and ISO 14044. Int. J. Life Cycle Assess. 2006, 11, 80–85. [Google Scholar]
- Yang, Y.; Heijungs, R.; Brandão, M. Hybrid life cycle assessment (LCA) does not necessarily yield more accurate results than process-based LCA. J. Clean. Prod. 2017, 150, 237–242. [Google Scholar]
- Pryshlakivsky, J.; Searcy, C. Fifteen years of ISO 14040: A review. J. Clean. Prod. 2013, 57, 115–123. [Google Scholar]
- Arena, M.; Azzone, G.; Conte, A. A streamlined LCA framework to support early decision making in vehicle development. J. Clean. Prod. 2013, 41, 105–113. [Google Scholar]
- Nakamura, S.; Nansai, K. Input–Output and Hybrid LCA; Springer: Berlin/Heidelberg, Germany, 2016; Available online: https://link.springer.com/chapter/10.1007/978-94-017-7610-3_6 (accessed on 28 July 2016).
- Marotta, A.; Pavlovic, J.; Ciuffo, B.; Serra, S.; Fontaras, G. Gaseous Emissions from Light-Duty Vehicles: Moving from NEDC to the New WLTP Test Procedure. Environ. Sci. Technol. 2015, 49, 8315–8322. [Google Scholar] [CrossRef] [PubMed]
- Pavlovic, J.; Marotta, A.; Ciuffo, B. CO2 emissions and energy demands of vehicles tested under the NEDC and the new WLTP type approval test procedures. Appl. Energy 2016, 177, 661–670. [Google Scholar] [CrossRef]
- EUR-Lex. Worldwide harmonised Light-Duty Vehicles Test Procedure (WLTP) and Real Driving Emissions (RDE). Available online: https://eur-lex.europa.eu/EN/legal-content/summary/worldwide-harmonised-light-duty-vehicles-test-procedure-wltp-and-real-driving-emissions-rde.html (accessed on 27 July 2017).
- Al-Ogaili, A.S.; Al-Shetwi, A.Q.; Al-Masri, H.M.K.; Babu, T.S.; Hoon, Y.; Alzaareer, K.; Babu, N.V.P. Review of the Estimation Methods of Energy Consumption for Battery Electric Buses. Energies 2021, 14, 7578. [Google Scholar] [CrossRef]
- Abdelaty, H.; Mohamed, M. A Prediction Model for Battery Electric Bus Energy Consumption in Transit. Energies 2021, 14, 2824. [Google Scholar] [CrossRef]
- Sun, R.; Chen, Y.; Dubey, A.; Pugliese, P. Hybrid electric buses fuel consumption prediction based on real-world driving data. Transp. Res. Part Transp. Environ. 2021, 91, 102637. [Google Scholar] [CrossRef]
- Rokicki, T.; Koszela, G.; Ochnio, L.; Wojtczuk, K.; Ratajczak, M.; Szczepaniuk, H.; Michalski, K.; Bórawski, P.; Bełdycka-Bórawska, A. Diversity and Changes in Energy Consumption by Transport in EU Countries. Energies 2021, 14, 5414. [Google Scholar] [CrossRef]
- Baláž, P.; Zábojník, S.; Hričovský, M. EU fossil fuel imports and changes after Ukrainian crisis. SHS Web Conf. 2020, 74, 05005. [Google Scholar] [CrossRef]
- Bozbas, K. Biodiesel as an alternative motor fuel: Production and policies in the European Union. Renew. Sustain. Energy Rev. 2008, 12, 542–552. [Google Scholar] [CrossRef]
- Kretschmer, B.; Narita, D.; Peterson, S. The economic effects of the EU biofuel target. Energy Econ. 2009, 31, S285–S294. [Google Scholar] [CrossRef]
- Rahman, M.; Canter, C.; Kumar, A. Well-to-wheel life cycle assessment of transportation fuels derived from different North American conventional crudes. Appl. Energy 2015, 156, 159–173. [Google Scholar] [CrossRef]
- Sobrino, F.H.; Monroy, C.R.; Pérez, J.L.H. Biofuels and fossil fuels: Life Cycle Analysis (LCA) optimisation through productive resources maximisation. Renew. Sustain. Energy Rev. 2011, 15, 2621–2628. [Google Scholar] [CrossRef]
- Cooney, G.; Hawkins, T.R.; Marriott, J. Life Cycle Assessment of Diesel and Electric Public Transportation Buses. J. Ind. Ecol. 2013, 17, 689–699. [Google Scholar] [CrossRef]
- Kåberger, T. Progress of renewable electricity replacing fossil fuels. Glob. Energy Interconnect. 2018, 1, 48–52. [Google Scholar]
- Carpejani, P.; de Jesus, É.T.; Bonfim Catapan, B.L.S.; Gouvea da Costa, S.E.; Pinheiro de Lima, E.; Tortato, U.; Machado, C.G.; Richter, B.K. Affordable and Clean Energy: A Study on the Advantages and Disadvantages of the Main Modalities. In International Business, Trade and Institutional Sustainability; Leal Filho, W., Borges de Brito, P.R., Frankenberger, F., Eds.; Springer International Publishing: Cham, Switzerland, 2020; pp. 615–627. [Google Scholar] [CrossRef]
- York, R. Do alternative energy sources displace fossil fuels? Nat. Clim. Chang. 2012, 2, 441–443. [Google Scholar] [CrossRef]
- Ritchie, H.; Roser, M.; Rosado, P. Hungary: Energy Country Profile. Our World Data 2022. Available online: https://ourworldindata.org/energy/country/hungary (accessed on 27 July 2017).
- Energy. Hungarian Central Statistical Office. Available online: https://www.ksh.hu/energy (accessed on 15 November 2024).
- Liddle, B.; Sadorsky, P. How much does increasing non-fossil fuels in electricity generation reduce carbon dioxide emissions? Appl. Energy 2017, 197, 212–221. [Google Scholar] [CrossRef]
- Abas, N.; Kalair, A.; Khan, N. Review of fossil fuels and future energy technologies. Futures 2015, 69, 31–49. [Google Scholar] [CrossRef]
- Eurostat. Key figures on European transport 2023. Available online: https://ec.europa.eu/eurostat/web/products-key-figures/w/ks-he-23-001 (accessed on 26 January 2024).
- Enerdata. Hungary Energy Information. 2024. Available online: https://www.enerdata.net/estore/energy-market/hungary/ (accessed on 15 August 2024).
- IEA. Transport Biofuels—Renewables 2023—Analysis. Available online: https://www.iea.org/reports/renewables-2023/transport-biofuels (accessed on 15 January 2024).
- OECD; Food and Agriculture Organization of the United Nations. OECD-FAO Agricultural Outlook 2023-2032. (OECD, 2023). Available online: https://www.oecd.org/en/publications/oecd-fao-agricultural-outlook-2023-2032_08801ab7-en.html (accessed on 6 July 2023).
- IEA. Biofuel and Fossil-Based Transport Fuel Production Cost Comparison, 2017—Charts—Data & Statistics. Available online: https://www.iea.org/data-and-statistics/charts/biofuel-and-fossil-based-transport-fuel-production-cost-comparison-2017 (accessed on 8 October 2018).
- IEA. Electricity Market Report 2023—Analysis. 2023. Available online: https://www.iea.org/reports/electricity-market-report-2023 (accessed on 15 February 2023).
- Electricity Law and Regulation in Hungary. Available online: https://cms.law/en/int/expert-guides/cms-expert-guide-to-electricity/hungary (accessed on 1 January 2015).


| WLTP | NEDC | |
|---|---|---|
| Driving Conditions, this refers to the various factors that affect vehicle performance and emissions, such as speed, traffic congestion, road incline, weather, and driving habits. | Realistic speeds, increased acceleration, minimized idling. | Lower acceleration, longer idle times, less realistic speeds. |
| CO2 Emissions, a greenhouse gas produced primarily from burning fossil fuels in vehicle engines. | More accurate measurement—the disparity grows once WLTP is fully deployed. | When compared to legal norms, the estimate was 9% higher. |
| NOx Emissions, a group of gases (mainly NO and NO₂) produced during combustion, especially at high temperature. | The effect on petrol automobiles is negligible, but diesel vehicles see a large increase. | Lower for diesel vehicles. |
| CO Emissions, A colorless, odorless, and toxic gas produced by incomplete combustion of fuel. | Diesel vehicles are unaffected, but low-power gasoline vehicles see a large rise. | Lower for low-power petrol vehicles. |
| Electric Motor Efficiency | |||||||
|---|---|---|---|---|---|---|---|
| Speed (RPM) | 2000 | 4000 | 6000 | 8000 | 10,000 | 12,000 | |
| Torque (Nm) | 0 | 0.55 | 0.56 | 0.57 | 0.58 | 0.59 | 0.6 |
| 50 | 0.9 | 0.947 | 0.95 | 0.95 | 0.952 | 0.945 | |
| 100 | 0.91 | 0.94 | 0.948 | 0.957 | 0.952 | 0.94 | |
| 150 | 0.9 | 0.935 | 0.947 | 0.95 | 0.93 | 0.91 | |
| 200 | 0.88 | 0.925 | 0.942 | 0.945 | 0.9 | 0.89 | |
| 250 | 0.85 | 0.92 | 0.935 | 0.93 | 0.91 | 0.89 | |
| 300 | 0.82 | 0.91 | 0.925 | 0.9 | 0.88 | 0.82 | |
| 350 | 0.85 | 0.89 | 0.915 | 0.9 | 0.85 | 0.78 | |
| 100 | 0.75 | 0.88 | 0.9 | 0.85 | 0.8 | 0.75 | |
| Duration | Stop Duration | Distance | P_stop | V_max | V_ave Without Stops | V_ave with Stops | A_min | A_max | |
|---|---|---|---|---|---|---|---|---|---|
| Unit | s | s | m | km/h | km/h | km/h | m/s2 | m/s2 | |
| Low | 589 | 155 | 3132 | 26.3% | 51.4 | 26.0 | 19.1 | −1.07 | 0.92 |
| Medium | 433 | 48 | 4712 | 11.1% | 74.7 | 44.1 | 39.2 | −0.99 | 0.96 |
| High | 455 | 30 | 6820 | 6.6% | 85.2 | 57.8 | 54.0 | −1.11 | 0.85 |
| 1477 | 233 | 14,664 |
| BSFC g/kW⋅h | |||||||
|---|---|---|---|---|---|---|---|
| Speed (RPM) | 800 | 1000 | 1200 | 1400 | 1600 | 1800 | |
| Torque (Nm) | 0 | 300 | 305 | 308 | 310 | 311 | 310 |
| 100 | 250 | 256 | 264 | 275 | 288 | 296 | |
| 200 | 222 | 228 | 232 | 236 | 242 | 247 | |
| 400 | 209 | 204 | 202 | 206 | 214 | 221 | |
| 600 | 192 | 192 | 194 | 196 | 199 | 205 | |
| 800 | 204 | 191 | 186 | 187 | 192 | 200 | |
| 1000 | 200 | 190 | 186 | 188 | 190 | 198 | |
| 1200 | 201 | 191 | 184 | 186 | 189 | 196 | |
| 1400 | 254 | 234 | 240 | 237 | 242 | 243 | |
| 1600 | 192 | 182 | 186 | 189 | 195 | ||
| 1800 | 184 | 185 | 191 | 194 | |||
Disclaimer/Publisher’s Note: The statements, opinions and data contained in all publications are solely those of the individual author(s) and contributor(s) and not of MDPI and/or the editor(s). MDPI and/or the editor(s) disclaim responsibility for any injury to people or property resulting from any ideas, methods, instructions or products referred to in the content. |
© 2025 by the authors. Licensee MDPI, Basel, Switzerland. This article is an open access article distributed under the terms and conditions of the Creative Commons Attribution (CC BY) license (https://creativecommons.org/licenses/by/4.0/).
Share and Cite
Li, X.; Horváth, B.; Winkler, Á. Assessing the Sustainability of Electric and Hybrid Buses: A Life Cycle Assessment Approach to Energy Consumption in Usage. Energies 2025, 18, 1545. https://doi.org/10.3390/en18061545
Li X, Horváth B, Winkler Á. Assessing the Sustainability of Electric and Hybrid Buses: A Life Cycle Assessment Approach to Energy Consumption in Usage. Energies. 2025; 18(6):1545. https://doi.org/10.3390/en18061545
Chicago/Turabian StyleLi, Xiao, Balázs Horváth, and Ágoston Winkler. 2025. "Assessing the Sustainability of Electric and Hybrid Buses: A Life Cycle Assessment Approach to Energy Consumption in Usage" Energies 18, no. 6: 1545. https://doi.org/10.3390/en18061545
APA StyleLi, X., Horváth, B., & Winkler, Á. (2025). Assessing the Sustainability of Electric and Hybrid Buses: A Life Cycle Assessment Approach to Energy Consumption in Usage. Energies, 18(6), 1545. https://doi.org/10.3390/en18061545