Article

Usage of a Binary CO2/C3H8 (85/15 vol%) Mixture for Hydrate Production: The Role of the Memory Effect and Phase Boundary Conditions of the System

by
Alberto Maria Gambelli
1,*,
Federico Rossi
2 and
Giovanni Gigliotti
1
1
Civil and Environmental Engineering Department, University of Perugia, Via G. Duranti 93, 06125 Perugia, Italy
2
Engineering Department, University of Perugia, Via G. Duranti 93, 06125 Perugia, Italy
*
Author to whom correspondence should be addressed.
Energies 2025, 18(6), 1522; https://doi.org/10.3390/en18061522
Submission received: 19 February 2025 / Revised: 11 March 2025 / Accepted: 18 March 2025 / Published: 19 March 2025
(This article belongs to the Section B2: Clean Energy)

Abstract

:
Since it was proposed, the replacement process, in natural gas hydrate reservoirs, has been considered as one of the most promising options to obtain an alternative and potentially carbon-neutral energy source. However, such a process shows high complexity, and its maximum efficiency cannot exceed 75% if carried out with pure carbon dioxide. The addition of minor quantities of other guest species in mixture with carbon dioxide allows higher efficiencies to be reached. This study deepens the production of hydrates with a binary mixture containing carbon dioxide and propane, with corresponding concentrations equal to 85/15 vol%. Several experiments were carried out consecutively and with the same gas–water mixture in order to ensure the system retains memory of previous formations. The results were then discussed in terms of the quantity of hydrates produced and the evolution of the formation process as a function of time. The data collected during the dissociation of hydrates were finally used to define the phase boundary of the system.

1. Introduction

Gas hydrates are non-stoichiometric and ice-like clathrate structures, consisting of a crystalline structure entirely made with water molecules, and capable of hosting gaseous molecules of different sizes and shapes [1]. These latter molecules are referred as hosts and their properties determine the typology of crystalline cavities formed and, consequently, the overall structure of the hydrate lattice [2]. In presence of host compounds, water molecules have the possibility to produce a more ordered configuration, or to complete the transition from the liquid to the solid state, even if the local thermodynamic conditions do not allow the formation of ice [3]. The main common property of host molecules is the hydrophobicity, even if some relevant exceptions exist, such as carbon dioxide.
Clathrate hydrates were discovered accidentally during laboratory experiments and started being studied mainly as a scientific curiosity. The exploration of these compounds was systematically carried out only in the past century, during which hydrates were firstly considered a hindrance for the natural gas industry due to their tendency to spontaneously grow into pipelines, thus causing gas blockage. During the second half of that century, natural reservoirs of hydrates containing natural gas were discovered worldwide and the opportunity to obtain a new alternative energy source propelled the scientific research in this field [4,5,6].
Sites suitable to host natural gas hydrate reservoirs must possess the following properties: (i) relatively high pressures and low temperatures; (ii) availability of guest molecules; (iii) abundance of water; and (iv) conditions suitable for fluid transport and aggregation [7]. The contemporary occurrence of those conditions is possible mainly in offshore sites and in permafrost regions. In particular, approximately 97% of discovered natural gas hydrates reservoirs were found in deep oceans and continental margins, while the remaining 3% were found in permafrost regions [8,9,10]. According to the last estimations, these reservoirs contain at least 2 × 10¹⁶ m3 of natural gas, or a quantity huge enough to produce twice the energy still achievable by exploiting all the conventional energy sources currently known and available [9].
The recovery of natural gas from hydrate reservoirs can be carried out with different techniques; among them, the most effective and widespread are depressurization [11,12], thermal stimulation [13] and chemical inhibitor injection [14]. Depressurization is the most applied strategy because it is the easiest to carry out in field facilities; it consists of lowering the local pressure while keeping the temperature constant, thus favouring the dissociation of water cages. However, the local pressure drops often cause a decrease in temperature, which hinders the dissociation of hydrates and reduces the amount of natural gas recovered. For that reason, external heating is often required to achieve suitable efficiencies. Thermal stimulation works in the opposite way but leads to the same result: the local temperature is increased while the pressure remains constant, with the consequent dissociation of hydrates. This technique theoretically allows higher efficiencies to be reached, but its application is more complex and expensive. The heat required to increase the local temperature is provided mainly via water injection, steam injection, microwave radiation and electrical heating [15,16,17]. Depressurization and thermal stimulation can also be coupled and applied together in order to improve the overall process efficiency [18].
The use of chemical inhibitors allows for the creation of instability within the reservoirs, thus causing the dissociation of water cages, without modifying the local pressure and temperature. Such a procedure has enormous potentialities but its application is limited due to related problems such as high costs of the raw materials, availability, toxicity for humans and for the environment and so on [19,20,21].
Finally, the recovery of natural gas can be advantageously coupled with the contemporary injection of carbon dioxide, in the same site, in order to improve the recovery efficiency and, at the same time, store carbon dioxide in a solid and permanent form [22]. The so-called replacement process has been widely studied during recent decades [23]; beyond the two advantages previously mentioned, the injection of a second and more effective guest species allows the hydrate lattice to be preserved, thus favouring the morphological preservation of the hosting sediments [24,25].
The replacement process is feasible thanks to the capability of carbon dioxide molecules to form hydrates at milder thermodynamic conditions than those required from methane molecules. Therefore, under the same conditions, CO2 is preferentially enclathrated. Such a difference defines a relatively narrow thermodynamic region, where only the formation of CO2 hydrates is possible, while CH4 hydrates cannot grow and, if already existing, go through dissociation. In practical applications, the system must be brought within this region and carbon dioxide must be appropriately pumped within the reservoirs in order to achieve the maximum diffusion possible. The first target can be performed by using the same techniques previously discussed for the sole recovery of natural gas [26,27,28,29].
The formation of carbon dioxide hydrates shows a lower enthalpy of formation than the process related to methane hydrates: −57.98 kJ/mol against −54.49 kJ/mol [30].
Unfortunately, the overall low efficiency of the process and the consequent high energy spent/energy produced ratio limit the replacement process to few field applications. The main causes as such a low efficiency can be summarised: (i) low heat and mass transfer rate; (ii) maximum ideal efficiency lower than one; (iii) high variability with the concentrations of both the replacing and the replaces species; and (iv) narrowness of the thermodynamic region available for replacement.
Regarding the second and the fourth causes of inefficiency, it has been widely recognized that the use of CO2-based gaseous mixtures, instead of pure carbon dioxide, allows the suitable thermodynamic region to be extended and also the maximum ideal efficiency to be increased [31].
The hydrate lattice in natural reservoirs mainly consists of sI cubic structures, which contain two different cage typologies: the smaller pentagonal dodecahedron (512) and the larger tetrakaidecahedron (51262) [3]. The occupancy of those cages depends on the size and geometry of the guest species. Methane can easily occupy both the cavities, while carbon dioxide molecules preferentially fit the larger cages, due to their greater size. As a consequence of this, the efficiency of replacement, if carried out with pure carbon dioxide, cannot exceed 75% [32]. Conversely, the injection of CO2-based mixtures, containing species with smaller diameters, also allows for the recovery of the molecules of methane contained in the small 512 cages [31] and the efficiency can theoretically reach 100%. However, the introduction of molecules with a smaller size than carbon dioxide, such as nitrogen, leads to higher pressures required for capturing the replacing mixture into the hydrate lattice. For instance, the addition of nitrogen to carbon dioxide should not exceed a certain concentration in order to keep the corresponding phase equilibrium curve below the one describing the equilibrium of methane hydrates [33,34,35,36].
The opposite trend can be obtained by mixing carbon dioxide with molecules with a greater size and still capable of being enclathrated at milder conditions, such as propane, ethane and butane. At temperatures close to but higher than 0 °C, these molecules can form hydrates at pressures extremely close to the environmental value [37,38,39]. In mixture with carbon dioxide, these species enable the system to form hydrates in advance and allow for the enlargement of the thermodynamic region available for replacement. However, the contemporary capture of CO2 and these species requires the production of sII cages and, as a consequence of this, the replacement process inevitably requires the initial dissociation of sI cages containing methane and the following production of sII cages hosting the replacement mixture.
Previously studies were carried out to establish the role of propane, added in mixture with carbon dioxide, during methane replacement [40]. The results proved that the addition of propane improved the CO2 capture efficiency and also had a slightly positive effect on the recovery efficiency of methane. At the same time, the quantity of propane captured, referred to as a percentage, was lower than the amount of carbon dioxide involved, proving that propane promoted the process but was less directly involved in the process [40].
The present study deals with hydrate formation with a binary CO2/C3H8 85/15 Vol% gaseous mixture. Hydrates were formed and dissociated several times consecutively by using the same gas–water mixtures, and the role of propane, mainly during the formation phase, was described in detail. While the use of CO2, mixed with molecules of smaller diameters, has been extensively studied for replacement, the possibility of using molecules with larger diameters needs to be further explored.

2. Materials and Methods

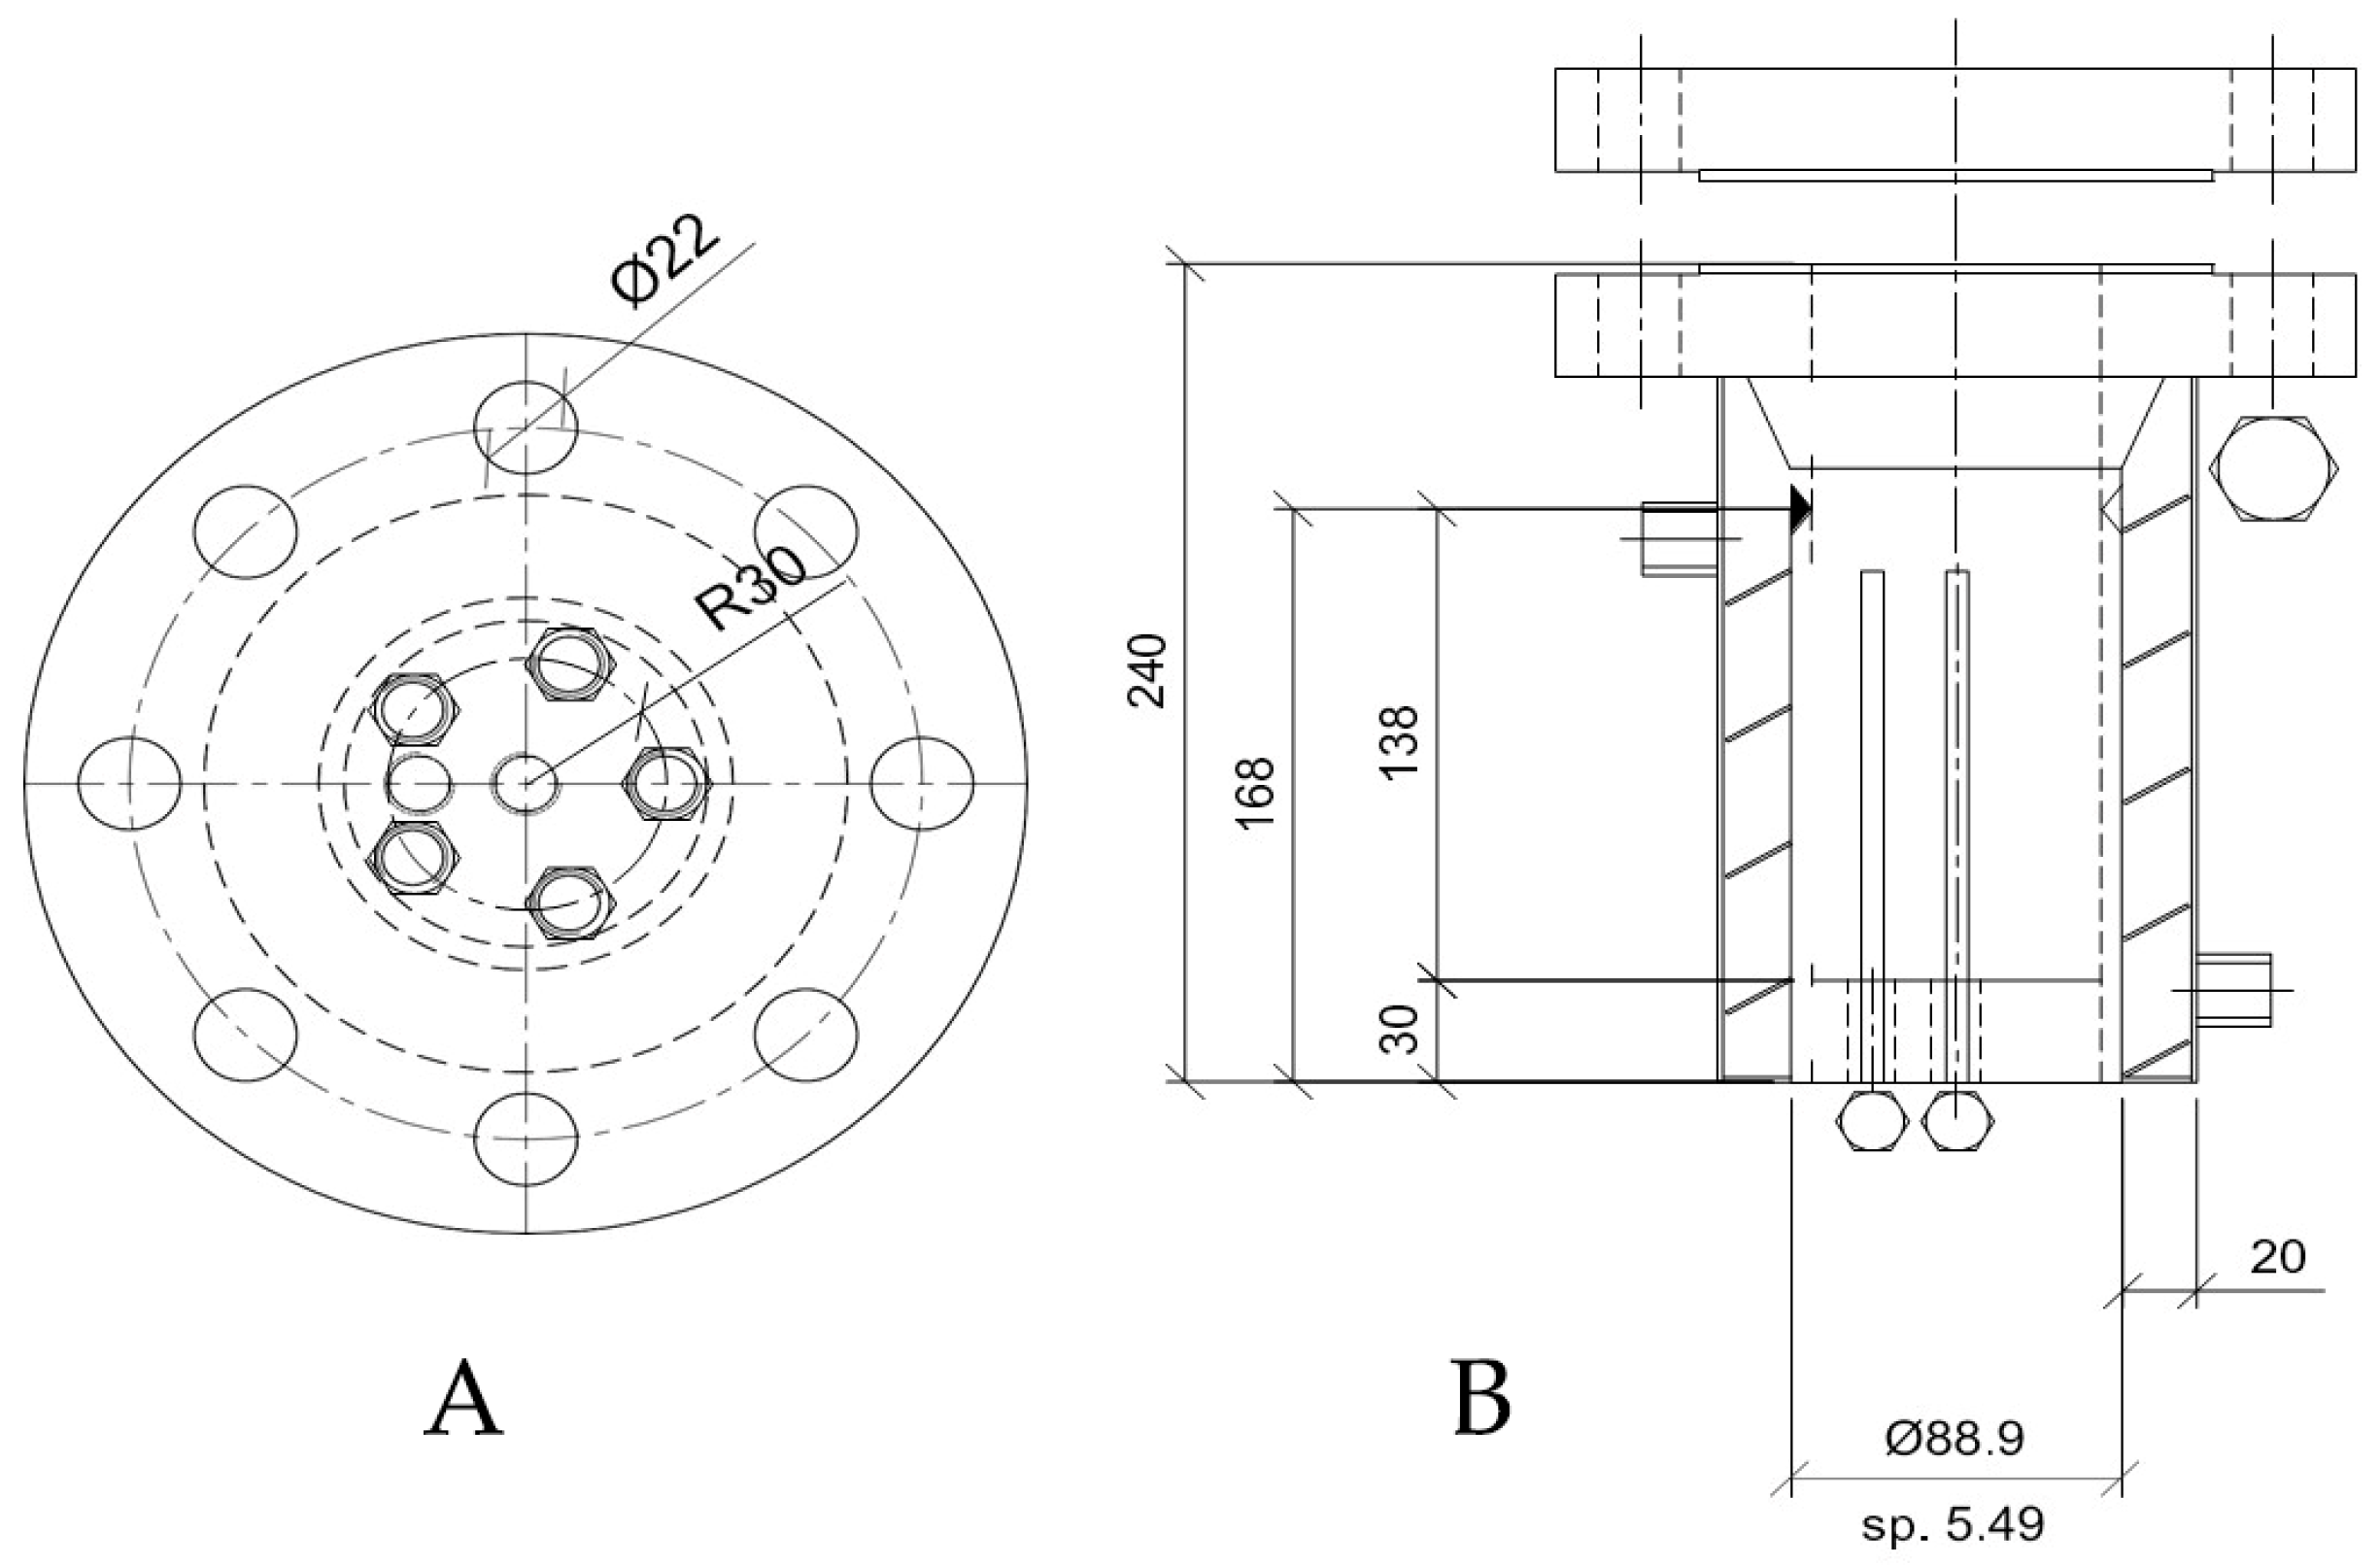
2.1. Experimental Apparatus and Materials

A lab-scale apparatus was used for the experiments. The core consists of a 316SS reactor, with an internal volume equal to 1 L, equipped with the required sensors and channels and inserted within a cooling room to easily control temperature. A scheme of the experimental apparatus, together with a picture of it, are presented in Figure 1.
As visible in Figure 1, the reactor can be easily opened for the recovery of hydrate samples. Between the two plates of the flange, a spiro-metallic gasket, model DN8U PN 10/40 316-FG C8 OR, is inserted to ensure the overall tightness of the system. The injection of gases is performed from the bottom, where two channels were installed for the injection phase, in order to make the reactor suitable for replacement processes. In this latter kind of experiment, one channel is used to insert the replaced species (methane), while the second is used for the replacing gas (carbon dioxide or a gas mixture containing it). In this study, only the second channel was used for the injection of the CO2/C3H8 binary mixture. Also, gas cylinders were inserted within the cooling room in order to avoid gradients of temperature within the reactor during the injection of gas. Sensors were installed in corresponding locations in the flange. The internal temperature was monitored with three Type K thermocouples, named T05, T10 and T15, and with a class accuracy of 1 and positioned at different depths (at 5, 10 and 15 cm, respectively, from the upper flange). A digital manometer, model MAN-SD, with an accuracy equal to ±0.5% of full scale, was used for pressure. The flange was also equipped with a safety valve (model E10 LS/150) and a channel for gas ejection. All the sensors were finally connected to a data acquisition system (by National Instrument, Austin, TX, USA) and managed in LabView (2024 Q3).
More details about the reactor used to produce hydrates are visible in Figure 2.
The present experimental apparatus has already been tested in previous studies; therefore, further details about it are available elsewhere in the literature [41,42].
Regarding the materials used for the experiments, the reactor was initially filled with porous (744 cm3) sand and demineralised water (236 cm3). The respective quantities were selected in order to ensure the presence of enough space for the injection of gas and to work in excess of water. The sand consists of pure quartz spherical grains, with diameters within the range of 0.09–0.15 mm. The mean porosity is 34% and was measured with a porosimeter, model Thermo Scientific Pascal 140. The porous medium was used to favour the formation of hydrates along the whole reactor and not exclusively in correspondence with the gas–liquid interface, as it could happen in the absence of a stirring device.
Ultra-high-purity (UHP) gases were used for the experiments. The binary mixture contained 15 Vol% propane and 85% Vol% carbon dioxide.

2.2. Experimental Procedure
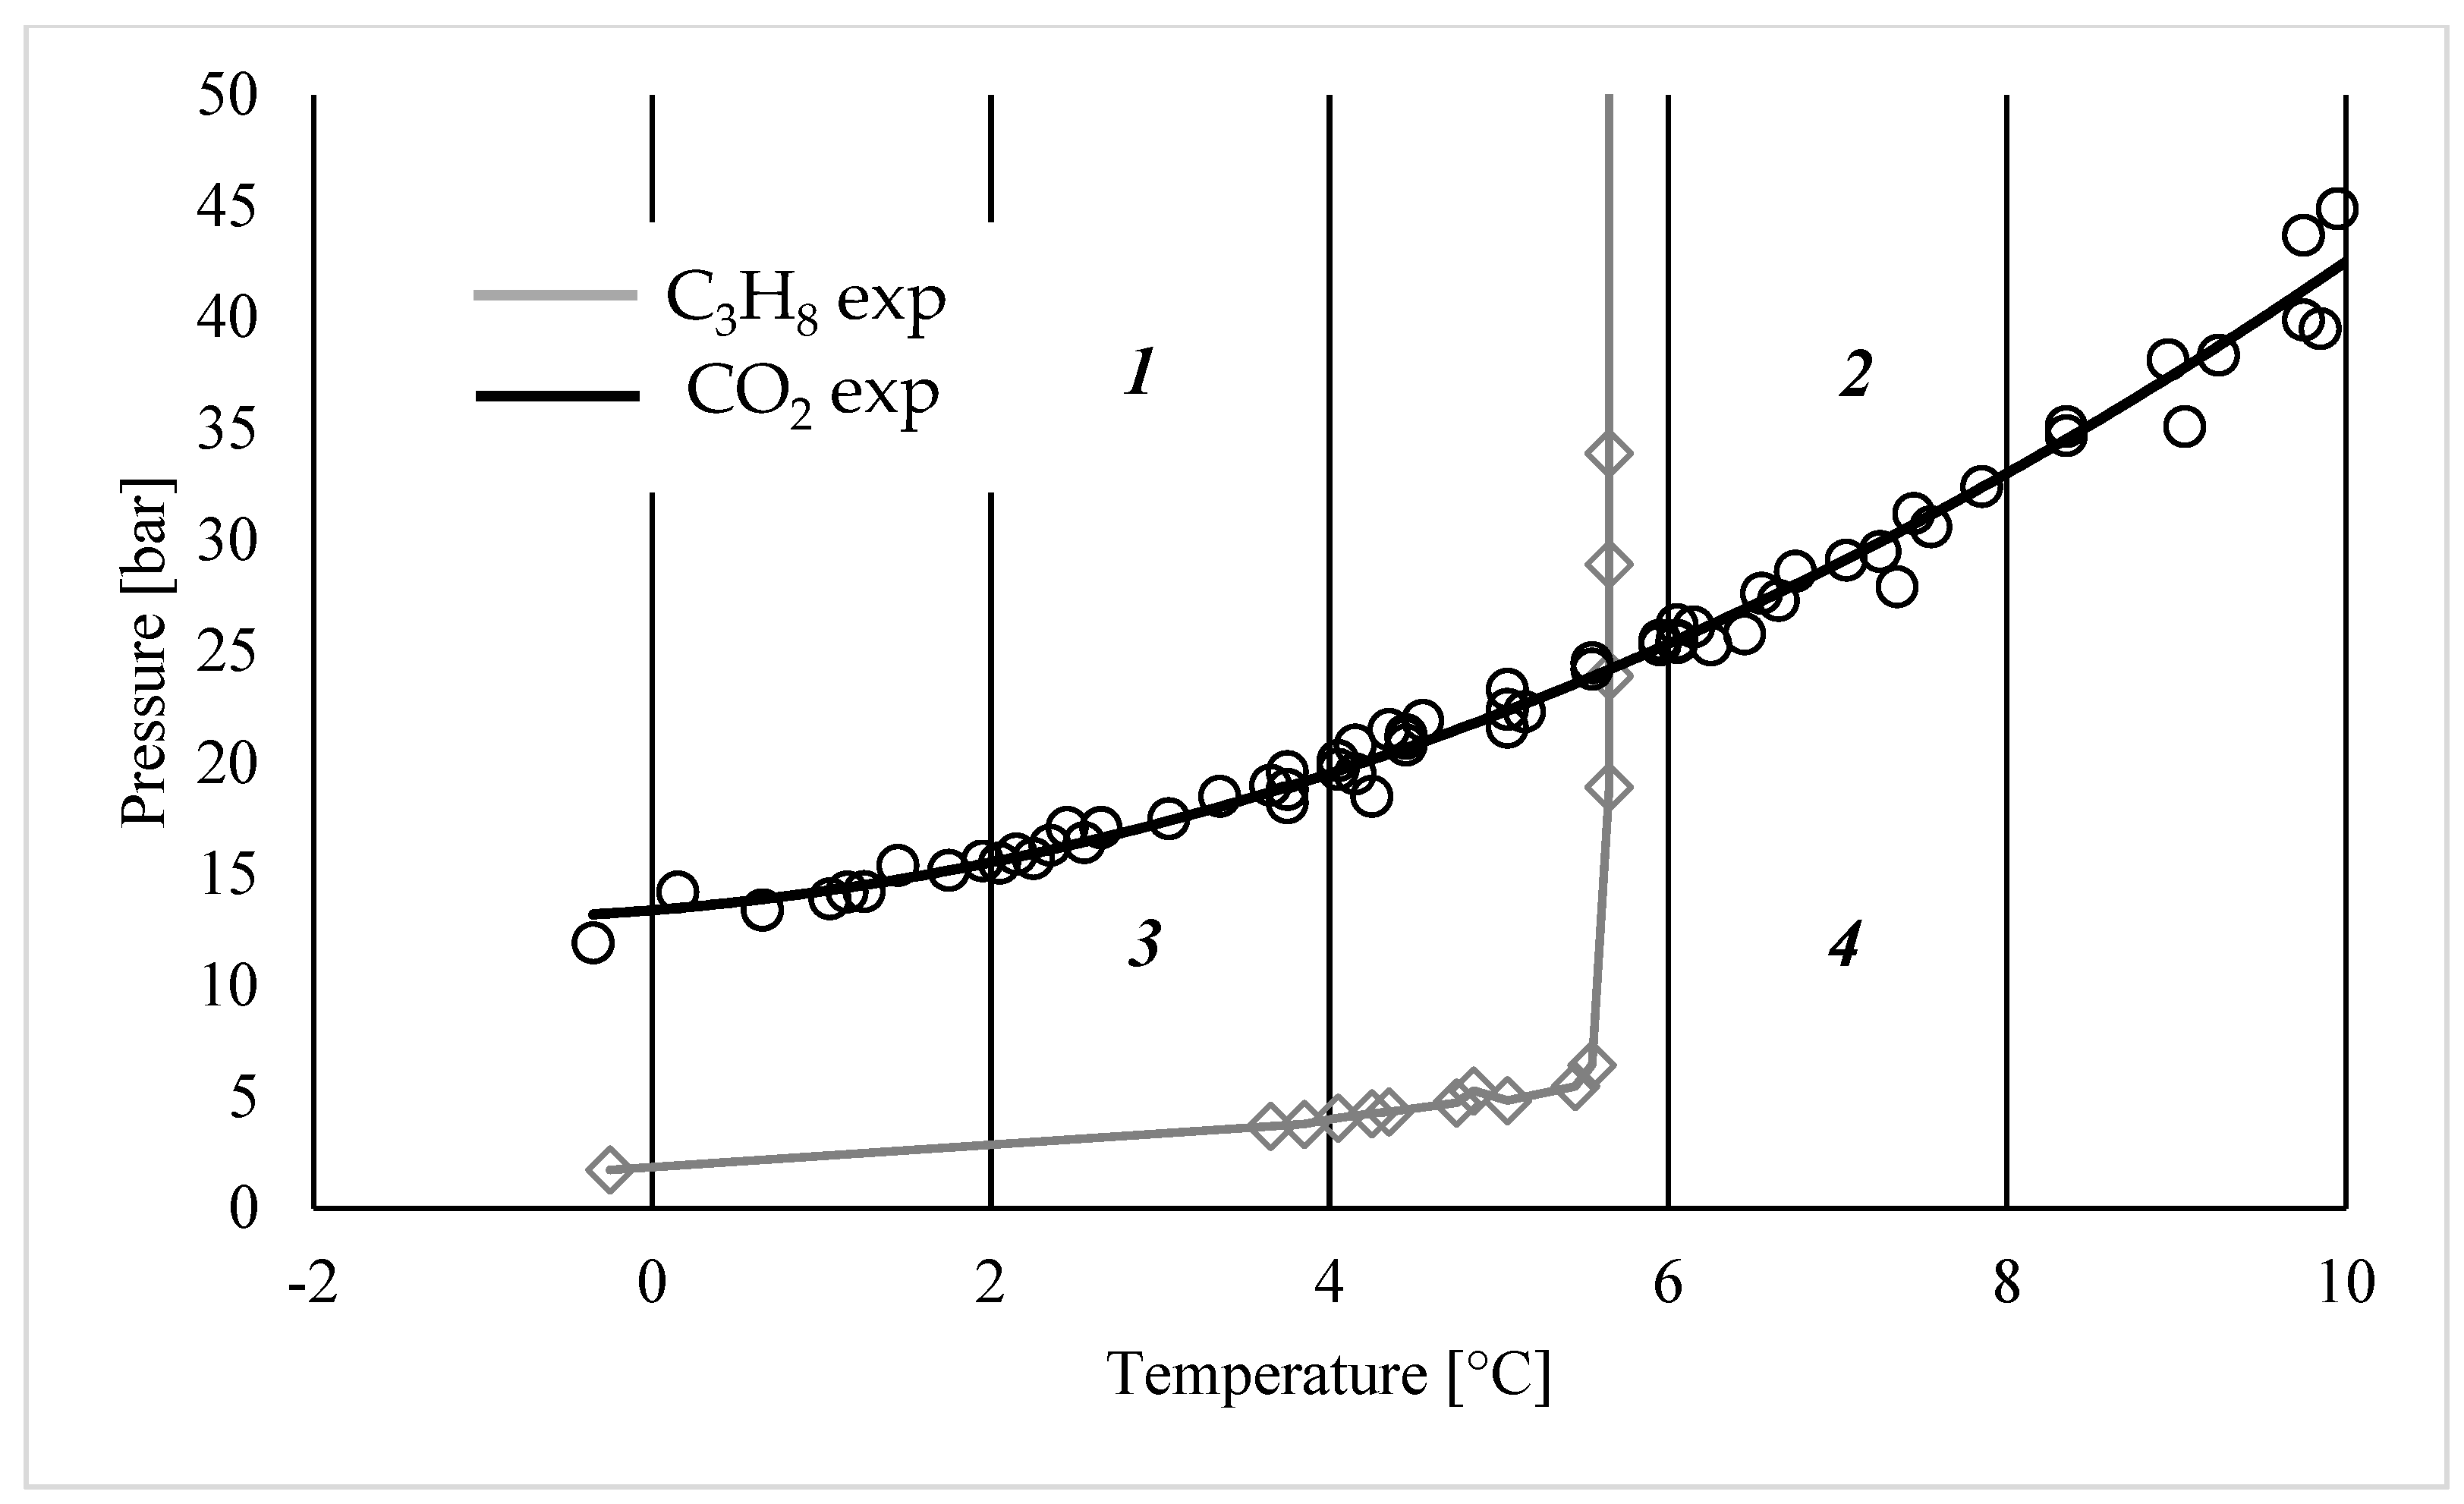
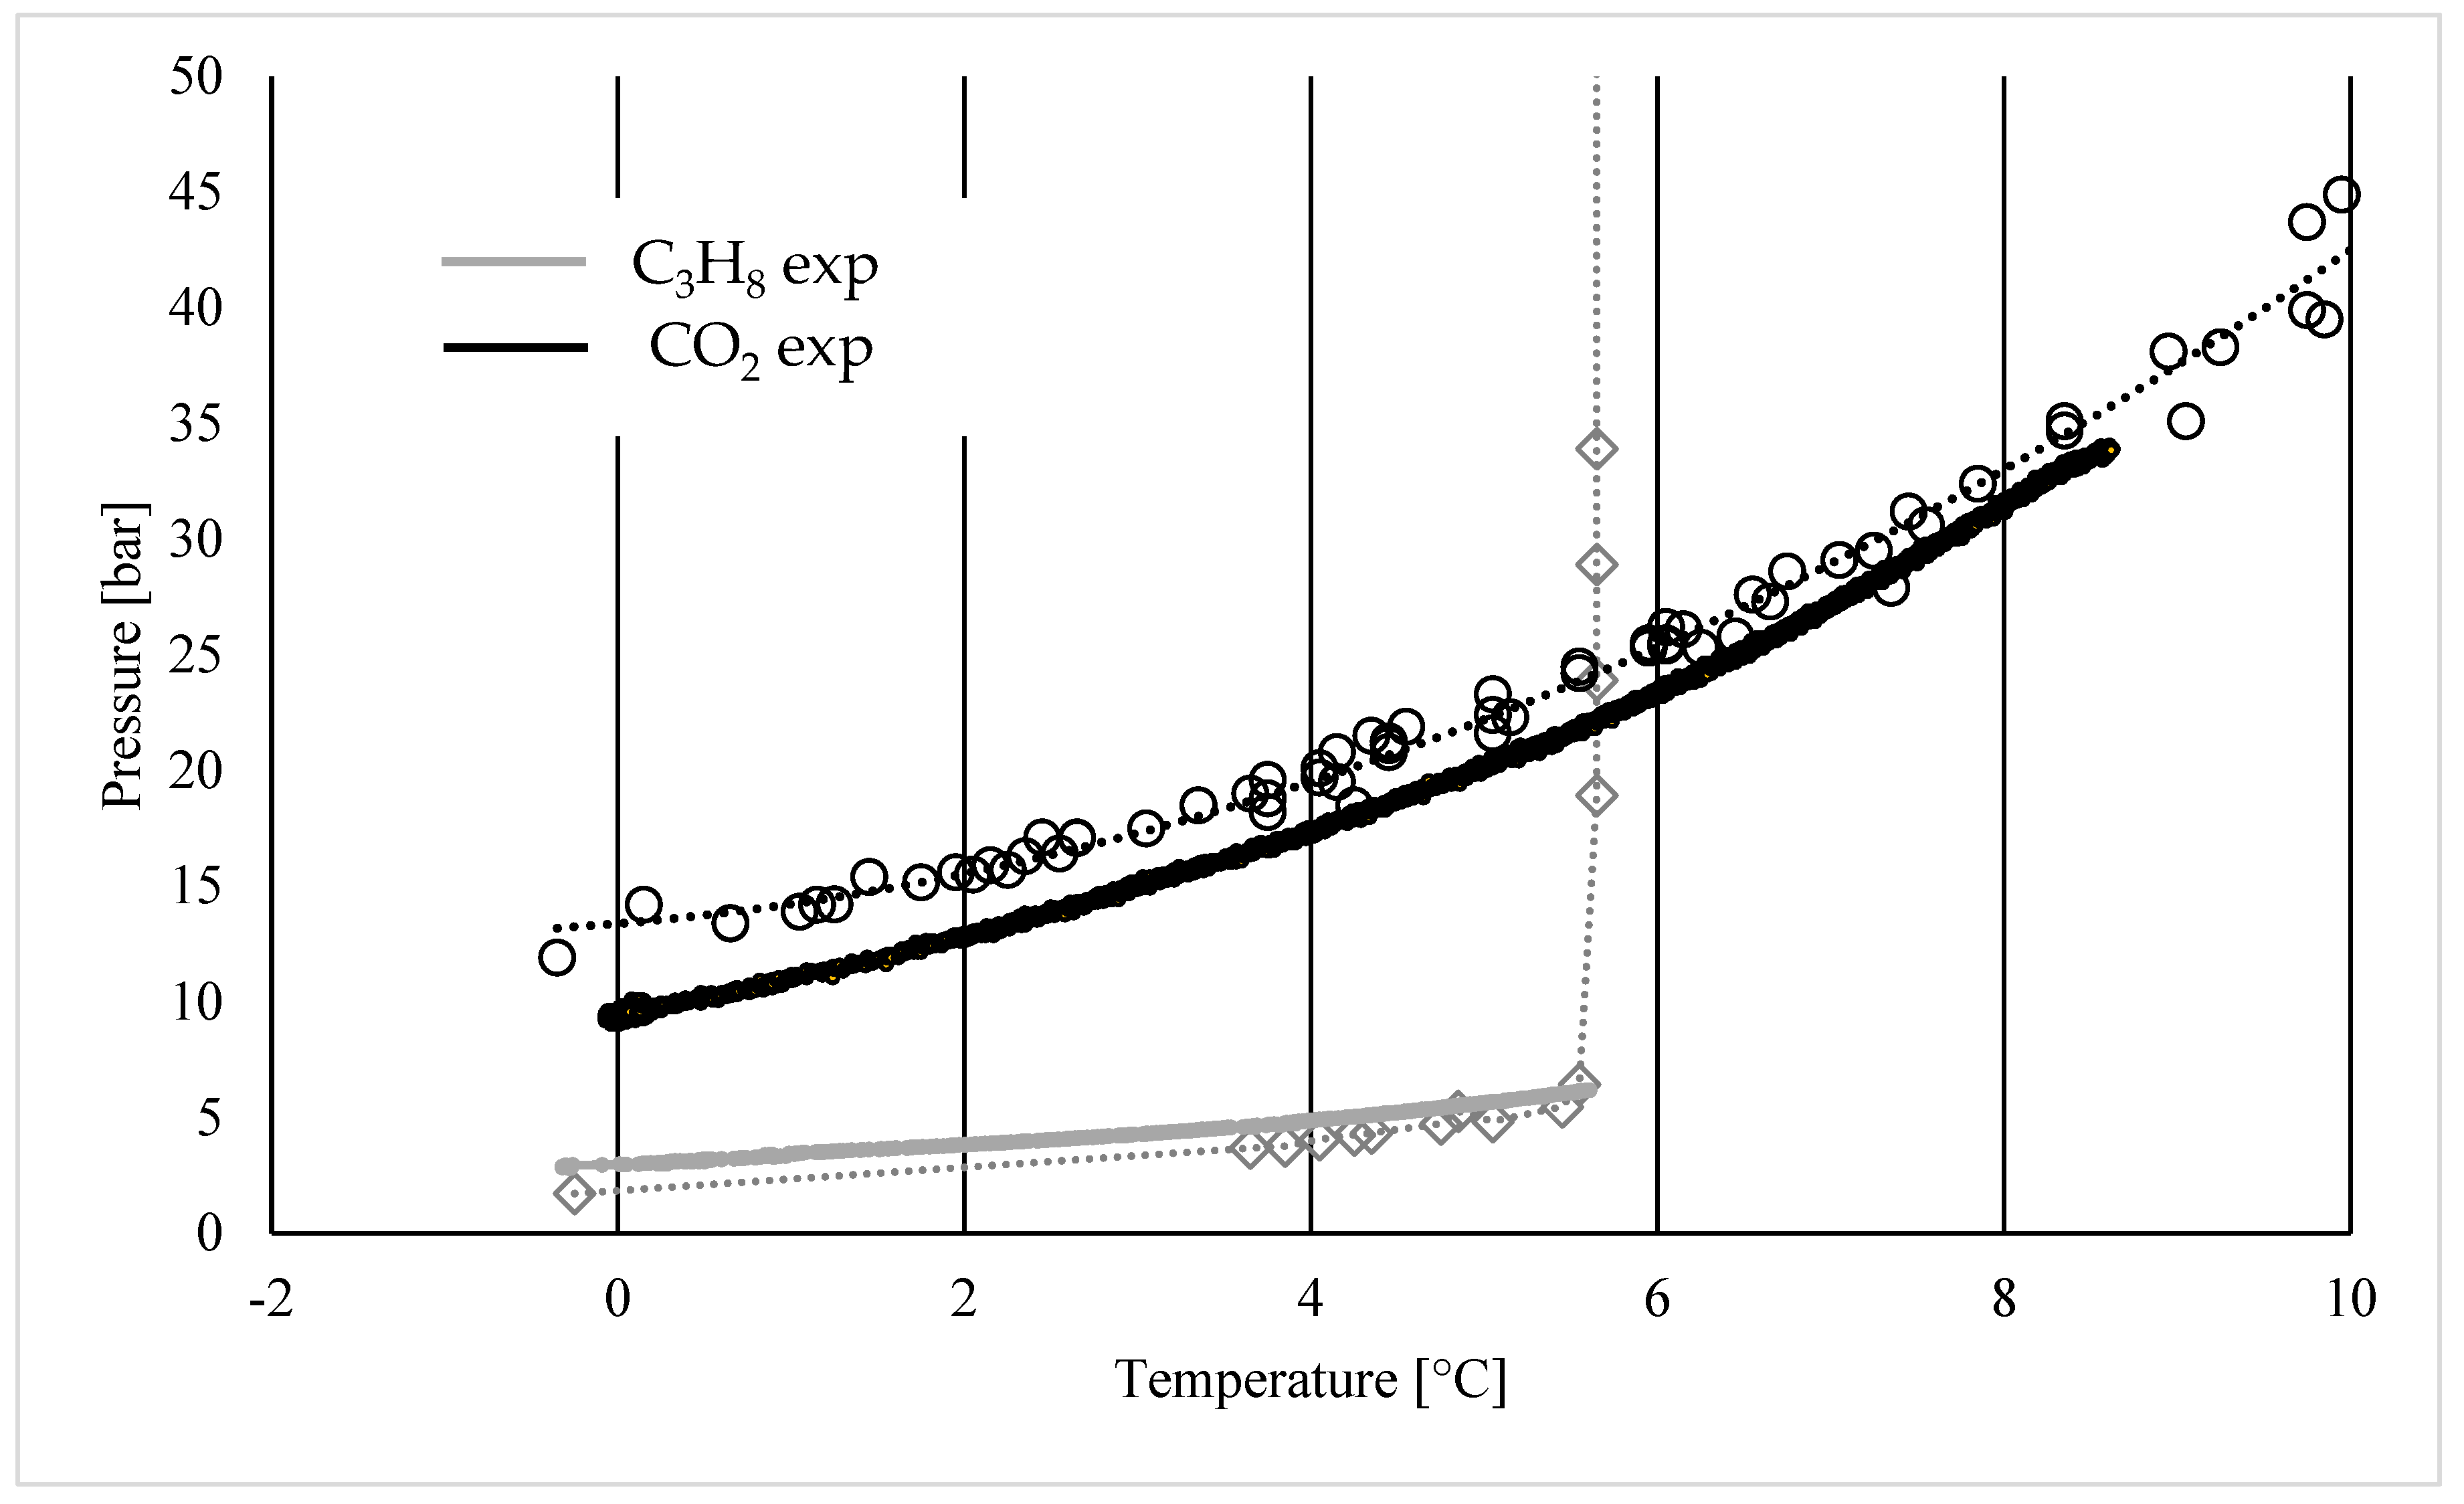
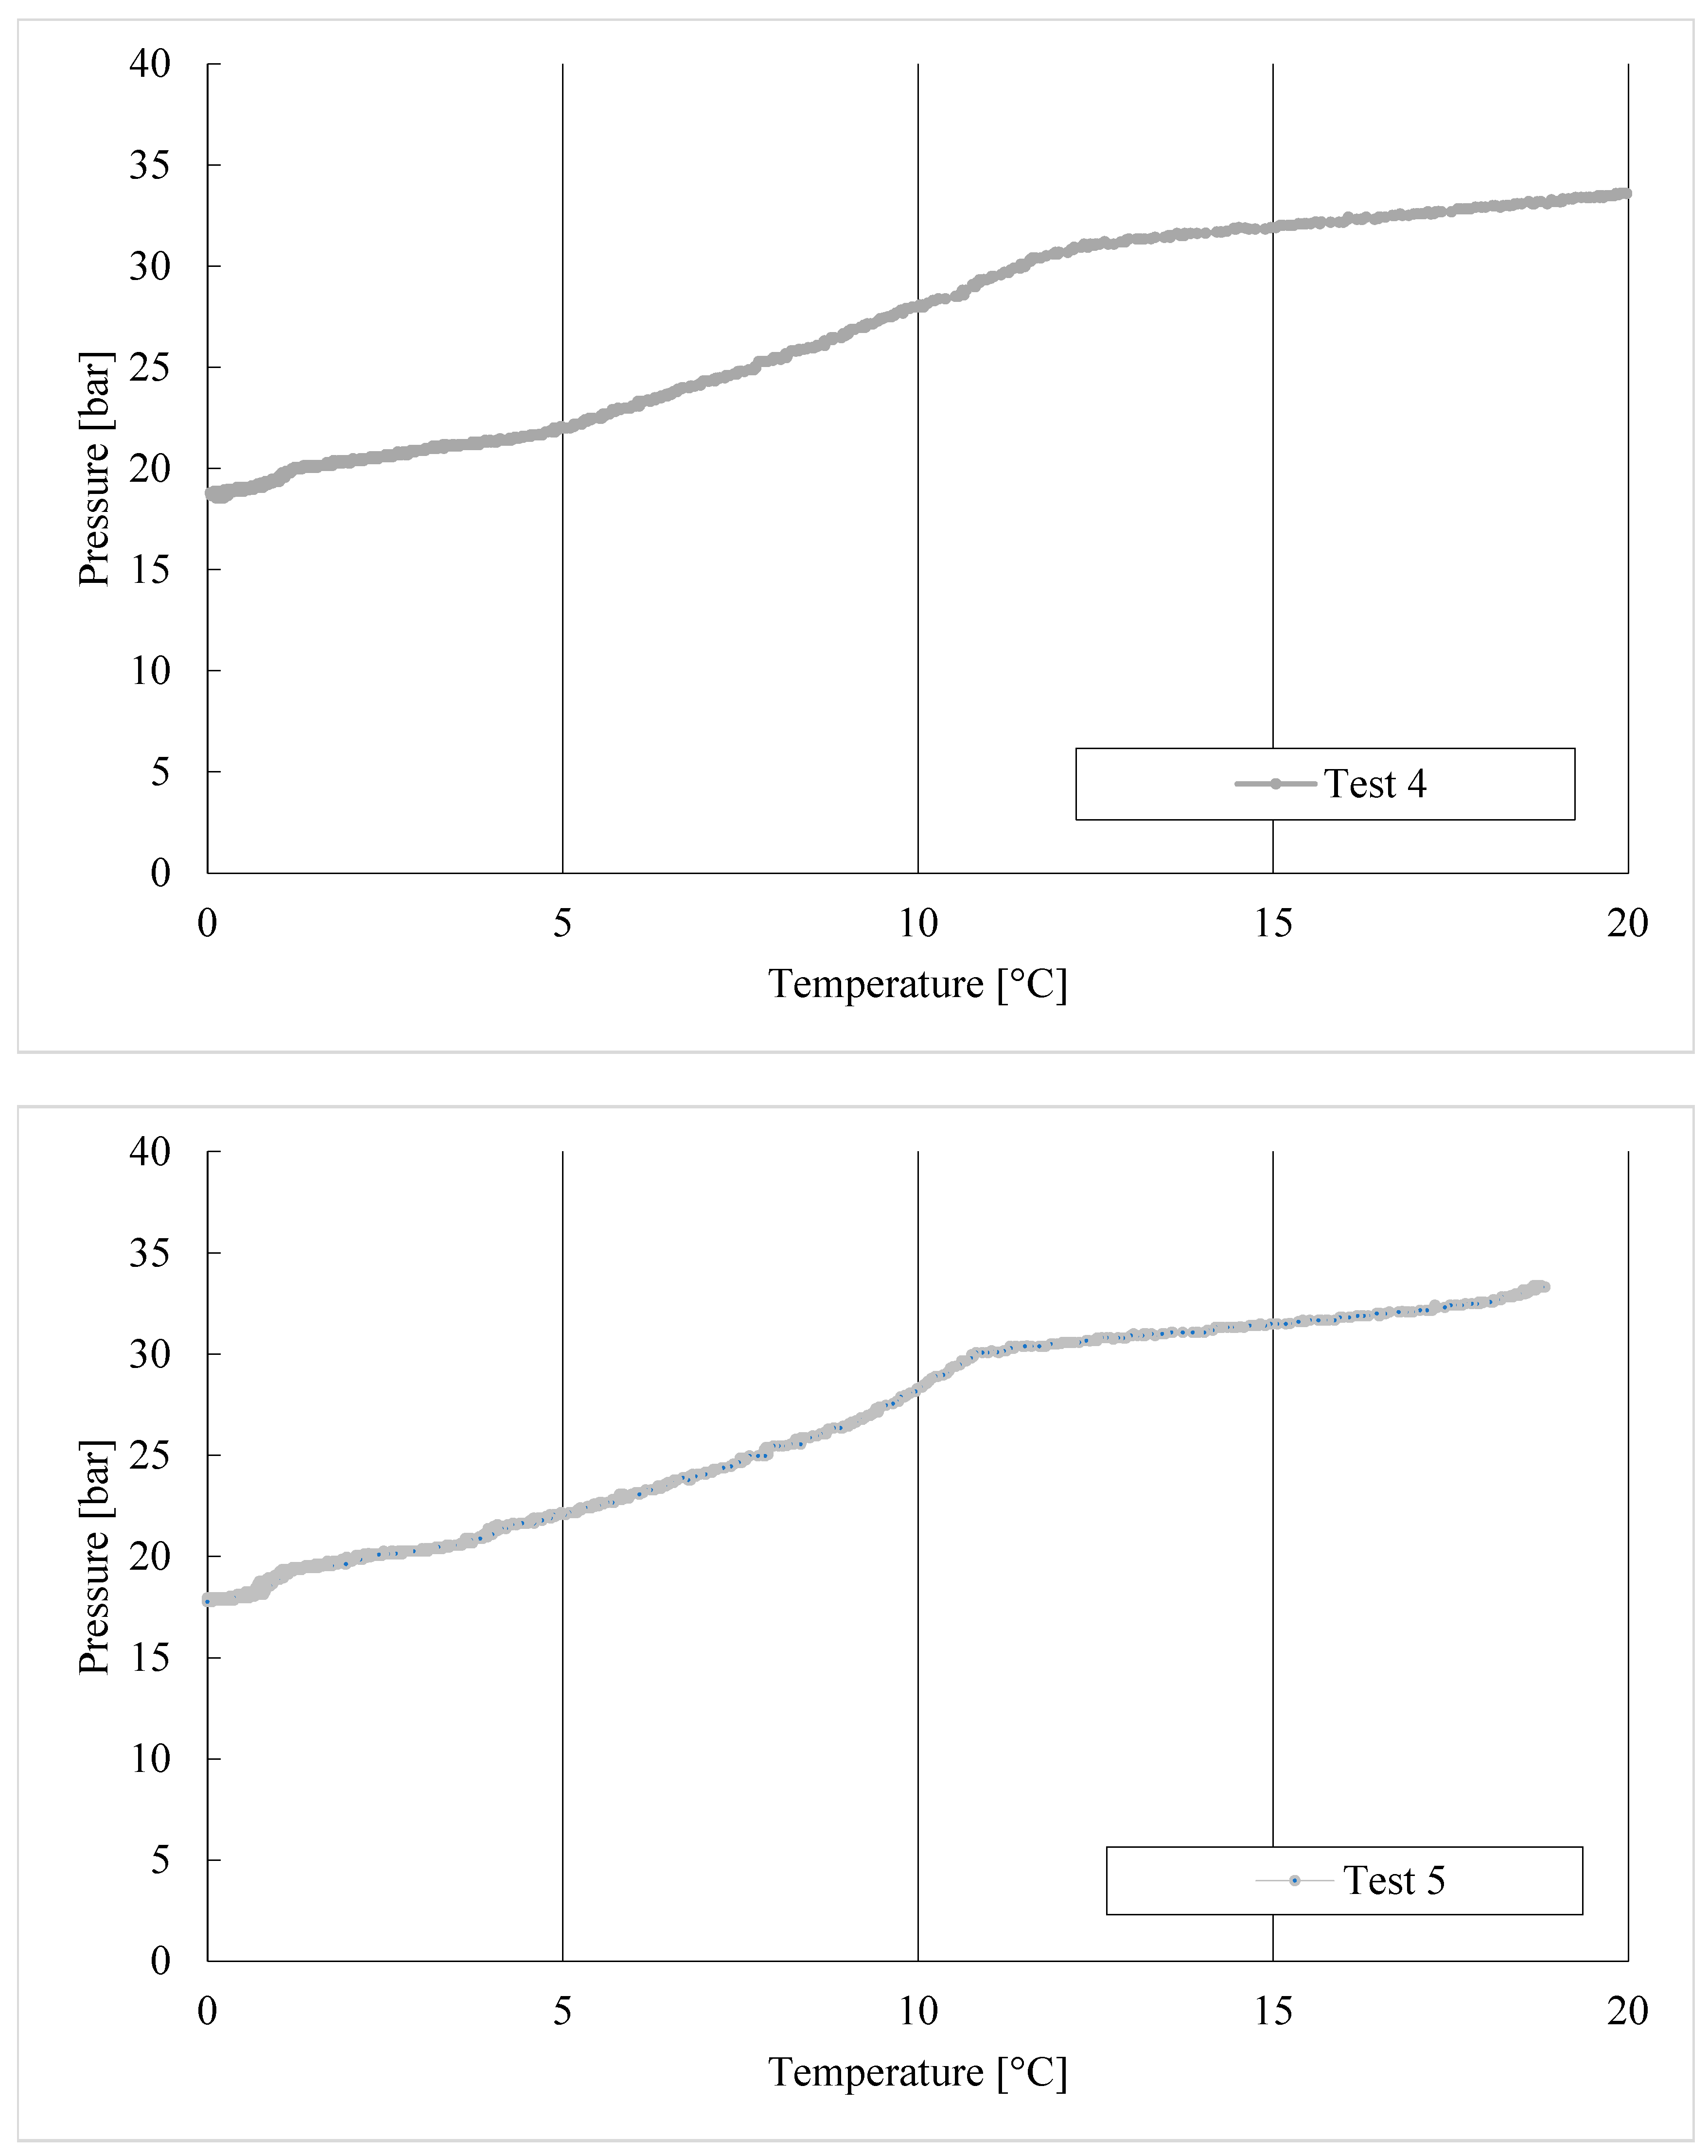
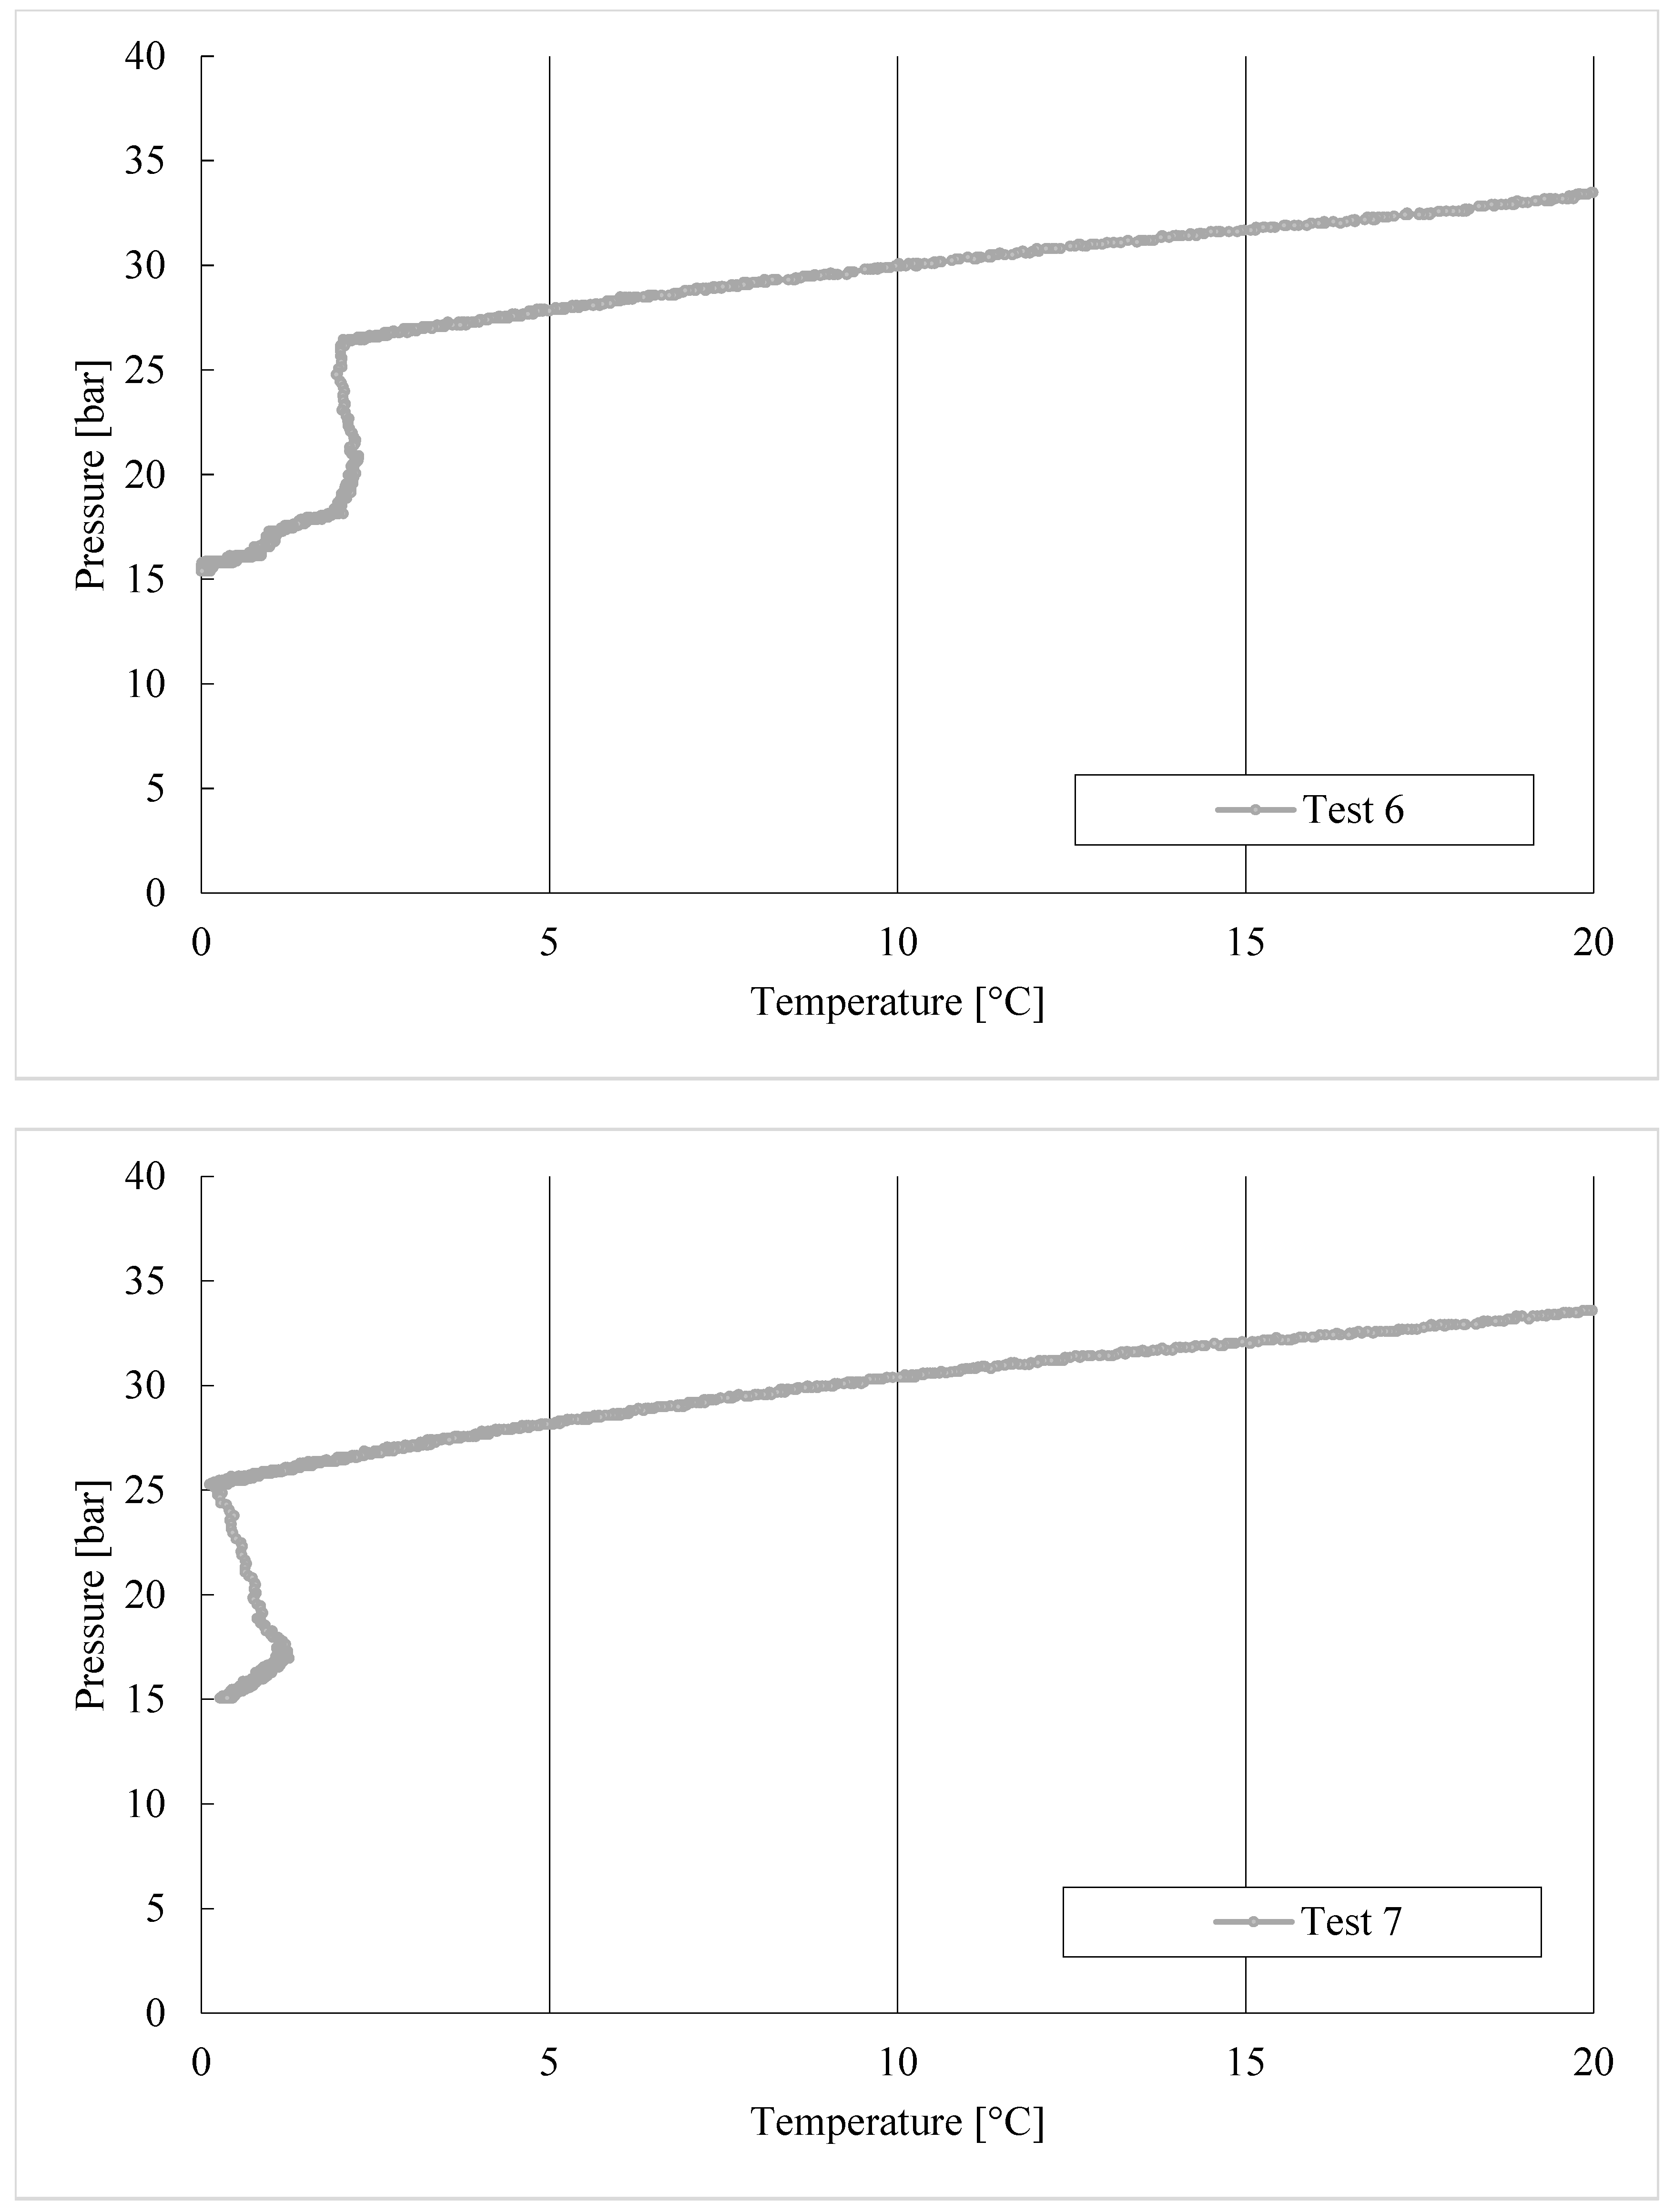
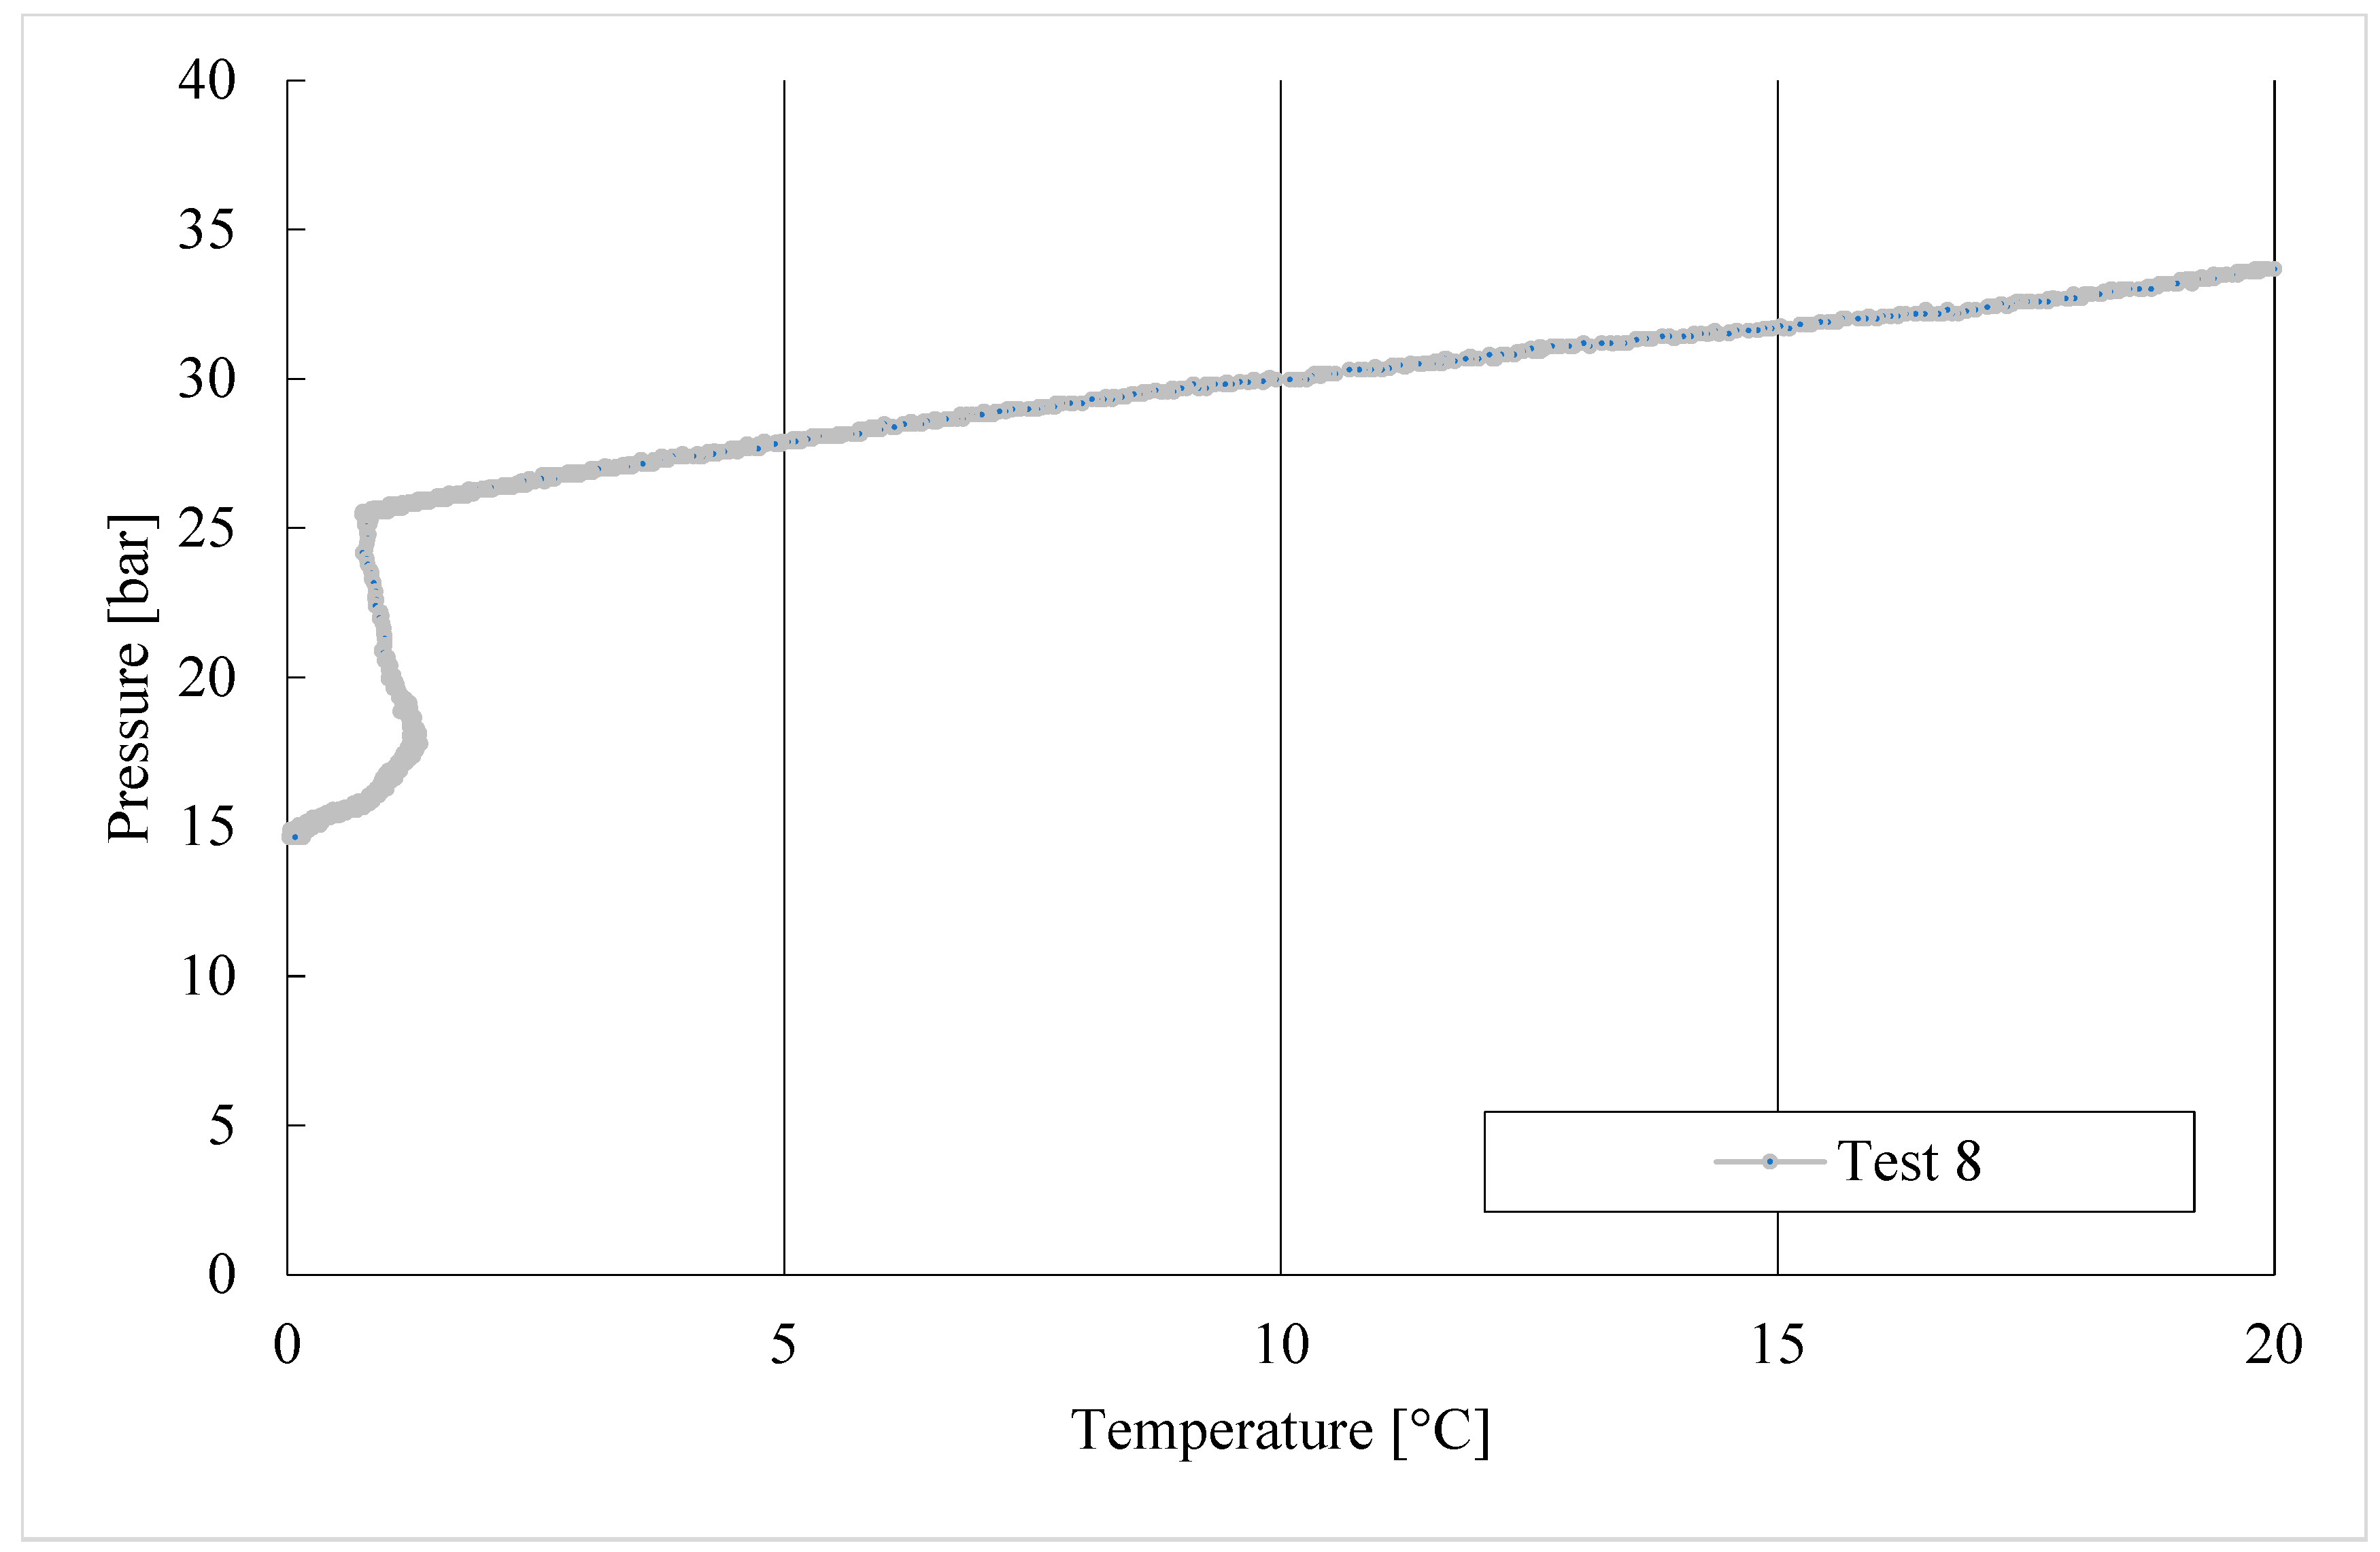
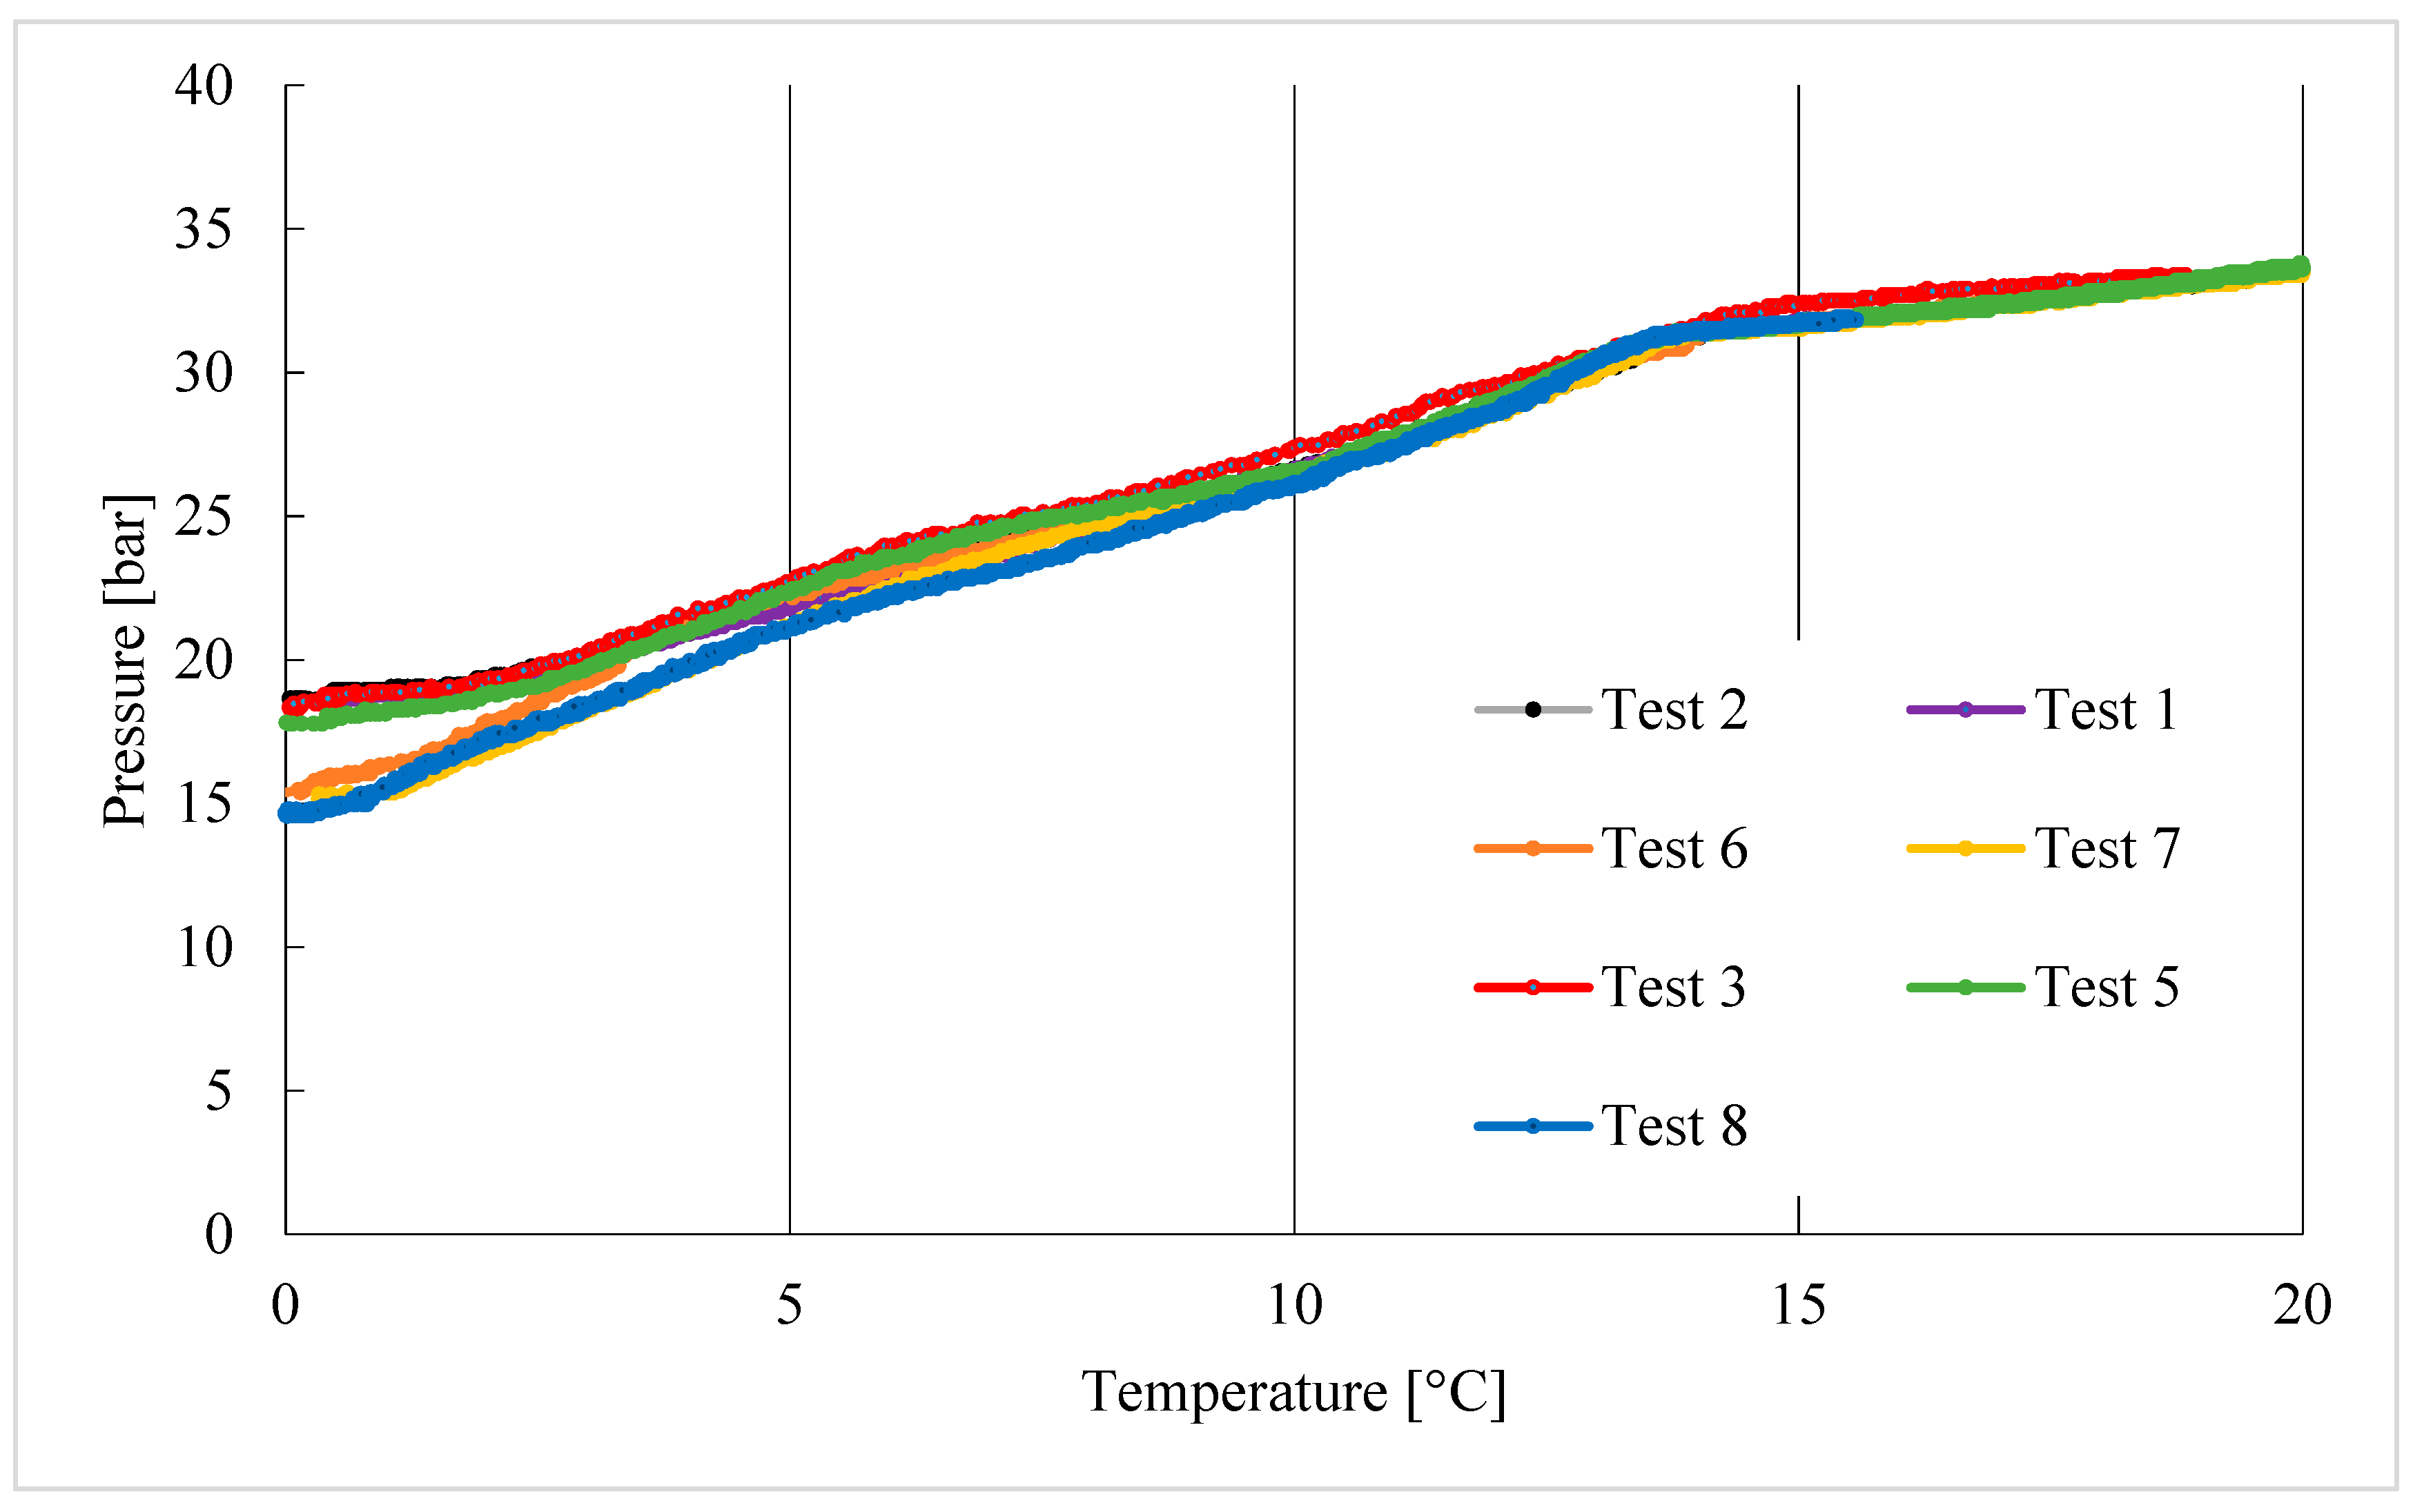
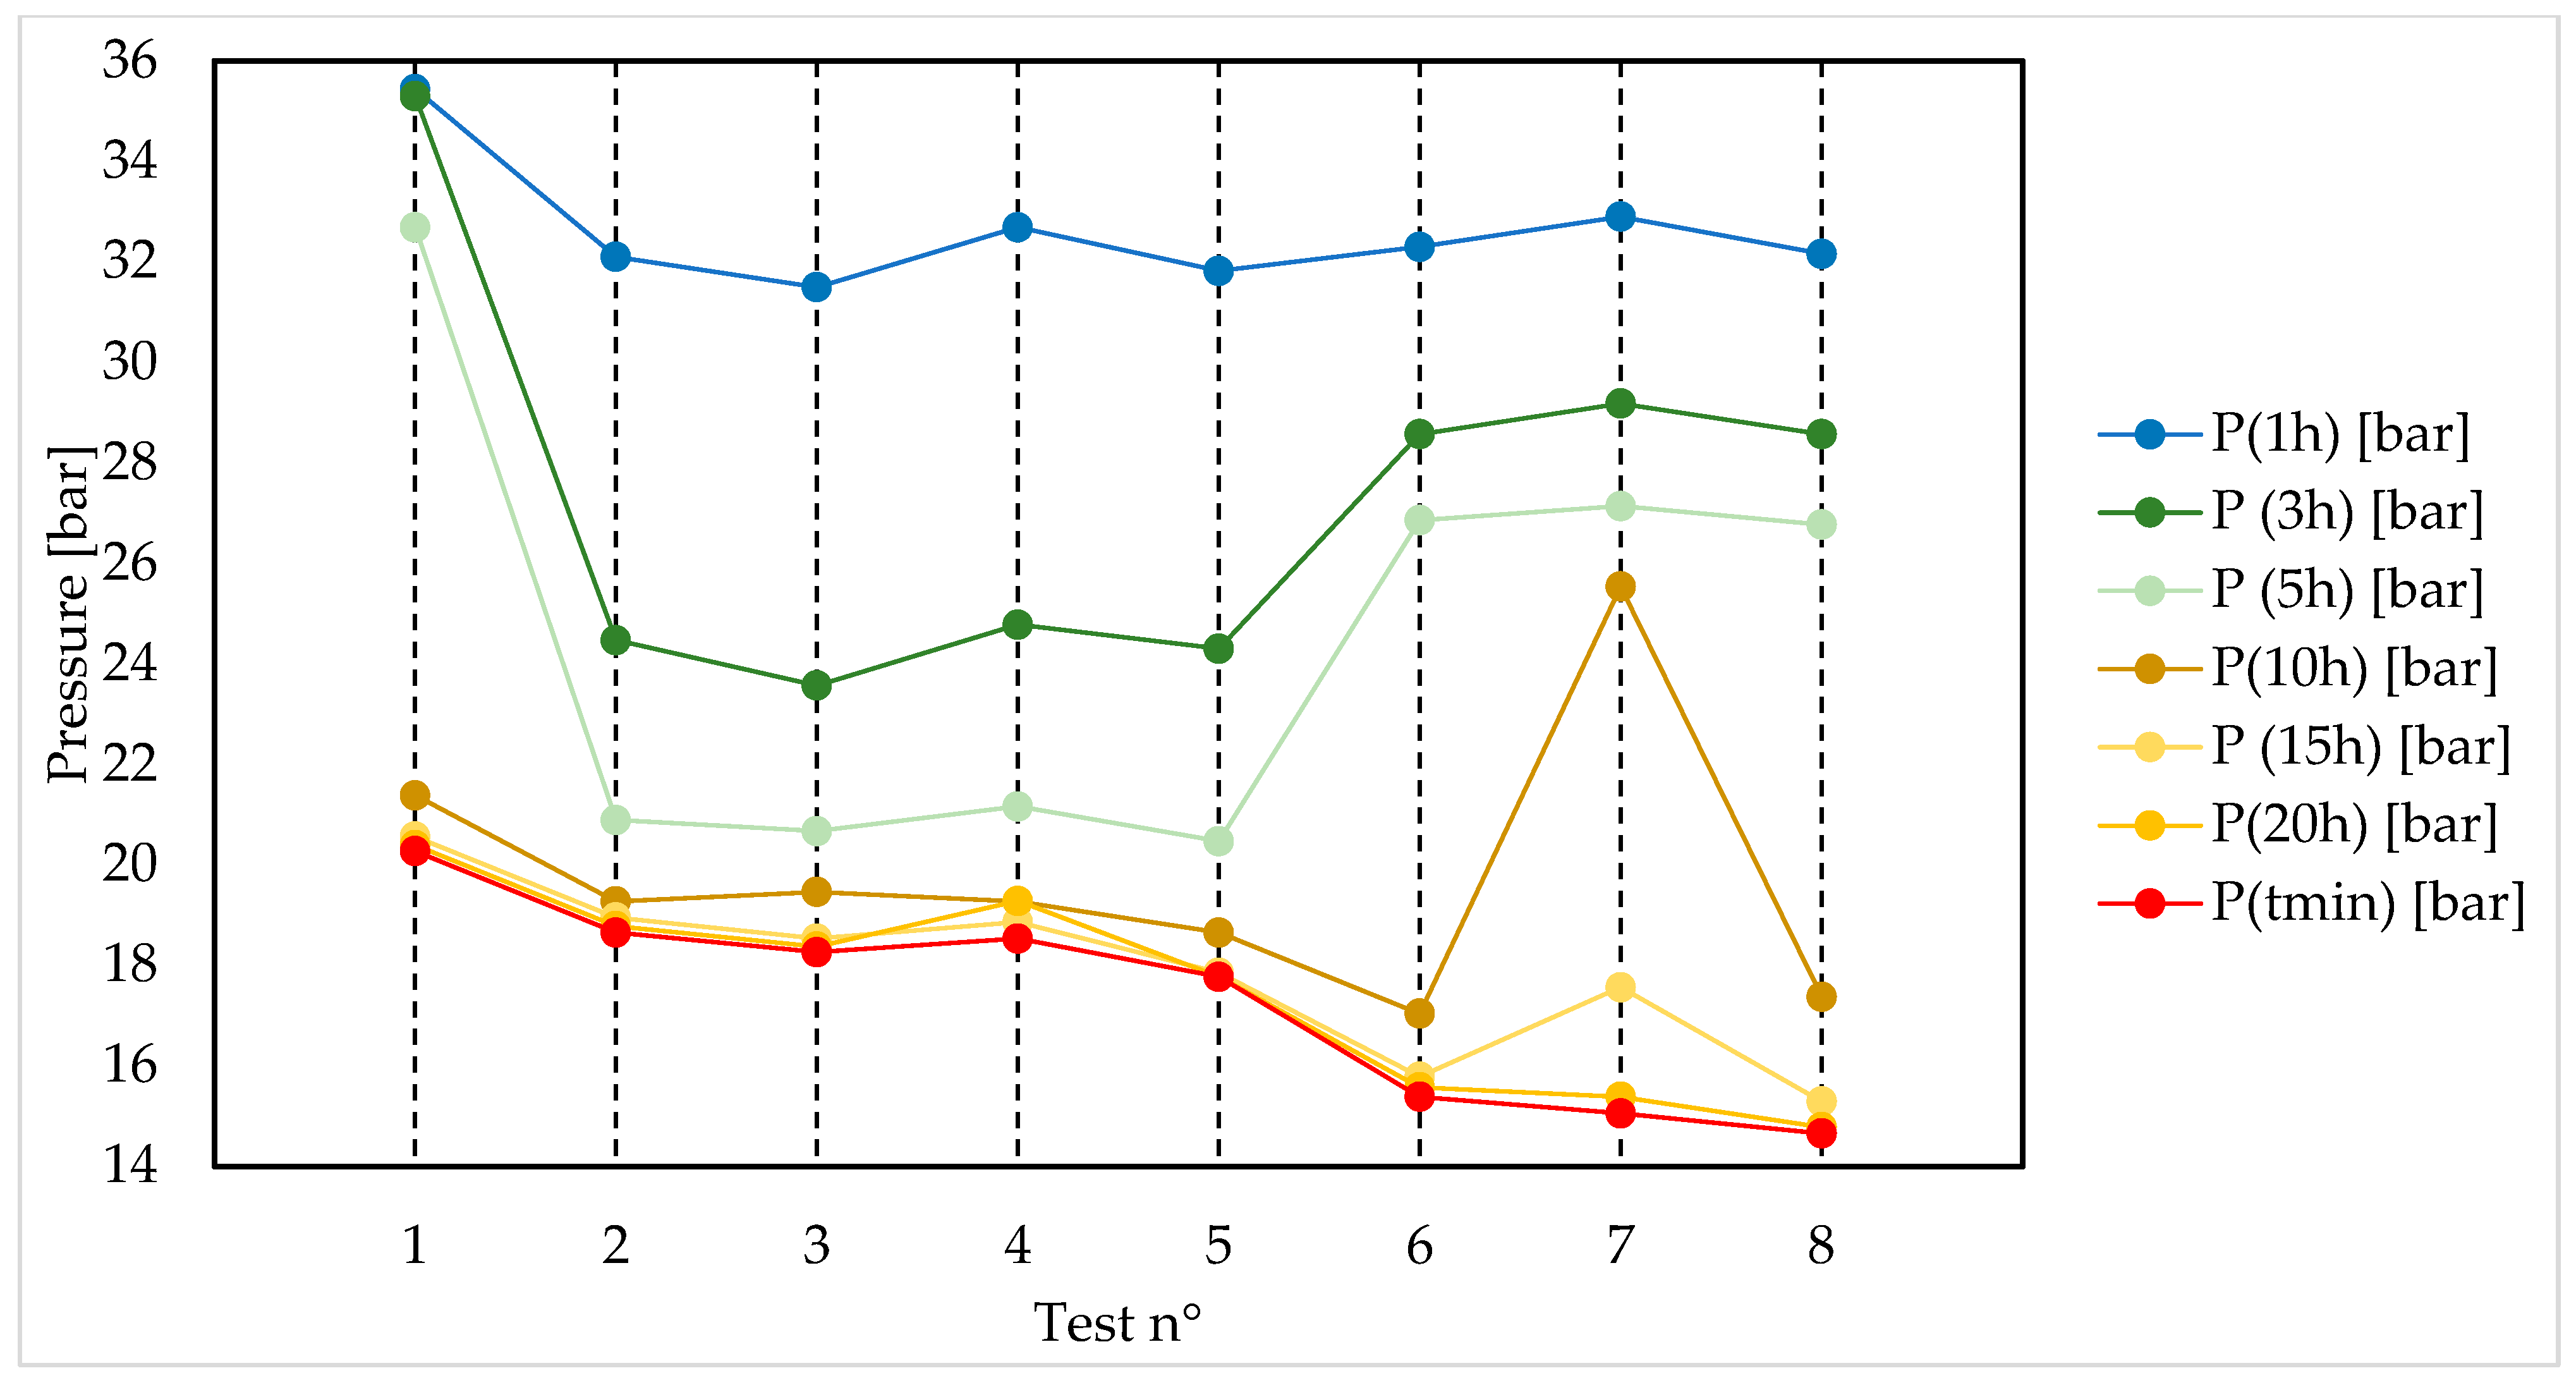
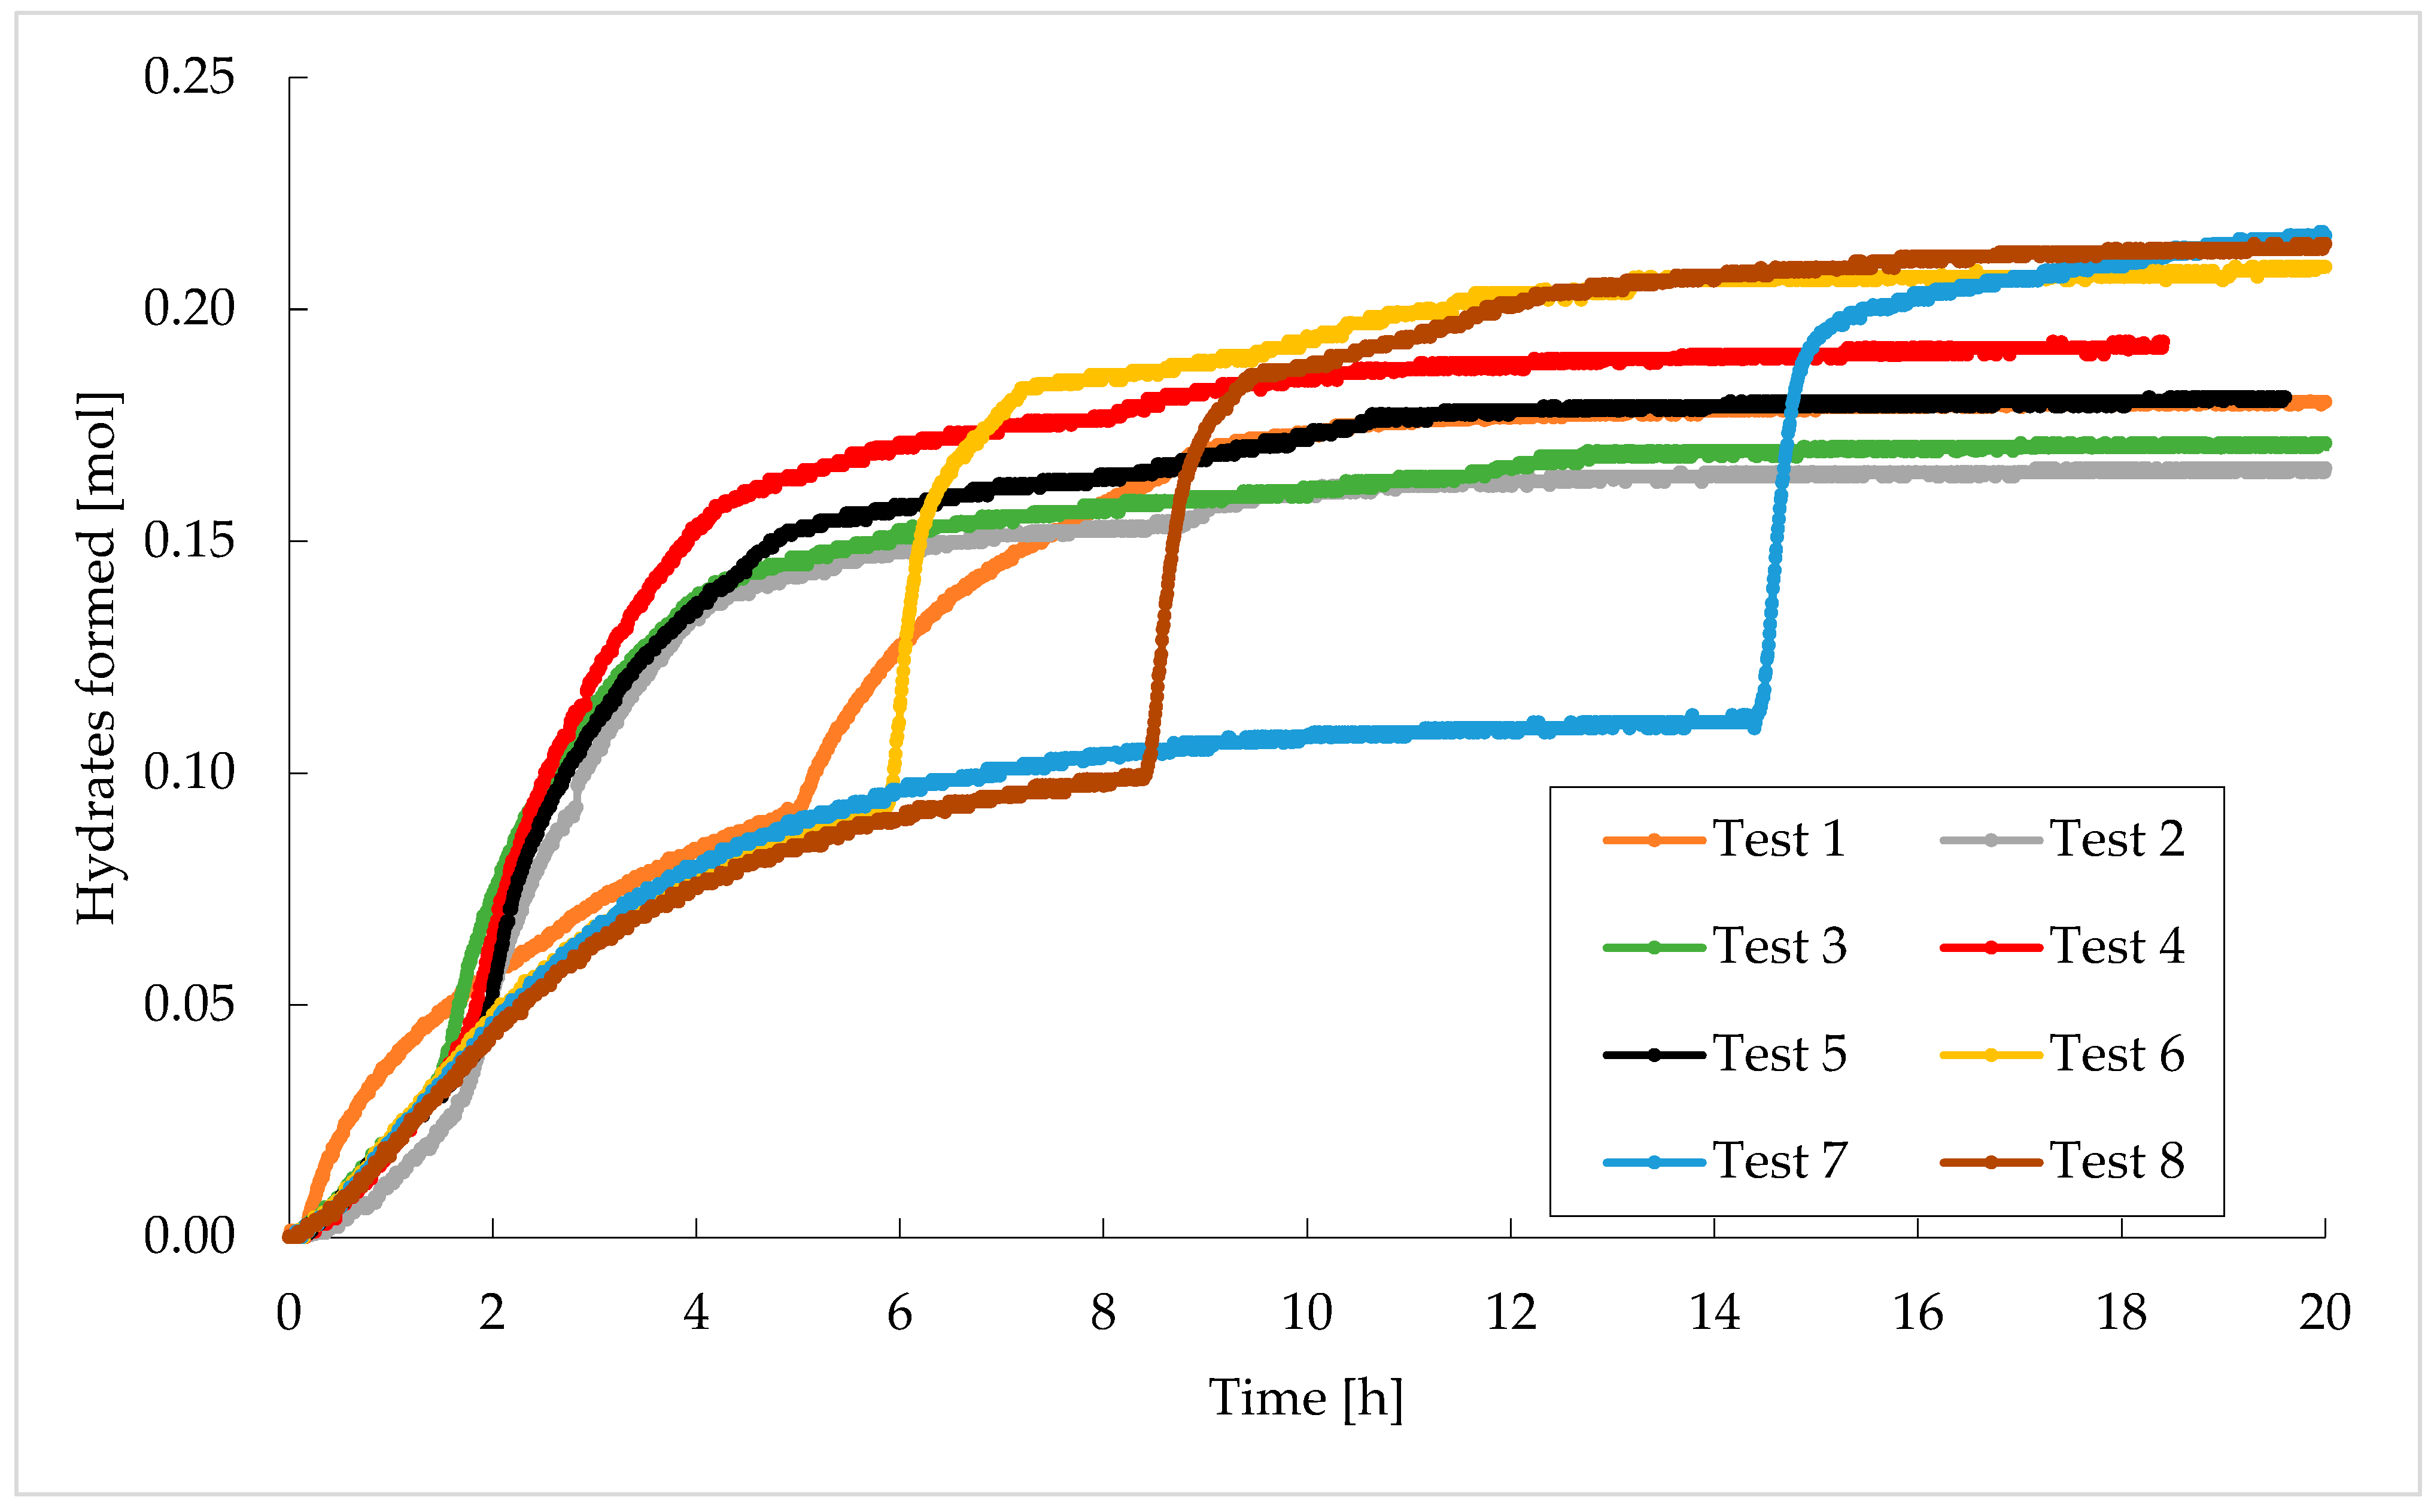
The gas injection phase was initially carried out at temperatures that were sufficiently elevated to prevent the production of hydrates for its whole duration. Then, the injection channel was closed and the cooling room was switched on. The decrease in temperature was performed gradually over time and its gradient can be estimated from Figure 3.
The lowering of temperature lead to a consequent decrease in pressure, both for the relation between these two thermodynamic parameters and for the internal production of hydrates, which caused the encaging of gaseous molecules into solid cavities, thus quantitatively reducing the amount of gaseous phase contributing to the internal pressure. Therefore, the moles of hydrates formed were calculated according to this latter observation. Equation (1) was used for this:
m o l H Y D = V P O R E P i Z f P f Z i Z f R T P f ρ H Y D
In the equation, the volume available for the process was indicated as VPORE and is equal to 252.9 cm3. It consists of the sum of the free space within the porous sediment and the region above the gas–liquid interface, where sand is not present. Letters “R” and “Z” refer to the gas constant and the compressibility factor, which was calculated with the Peng–Robinson Equation. Pressure and temperature are indicated, respectively, with the letters “P” and “T”, while subscripts “i” and “f” define the time lapse during which the quantity of hydrates formed was calculated. Finally, the parameter “ρHYD” describes the ideal molar density of hydrates, equal to 0.91 g/cm3 [43,44].
The process continued until the internal pressure stabilized. Once the formation ended, the cooling room was switched off and the temperature gradually increased until reaching its initial values. The increase in temperature was monitored in order to keep it below 0.15–0.2 °C/h, according to the literature.
The experiments were constantly monitored, and measurements taken every 30 s were saved in order to plot the evolution of each test with high accuracy.

3. Results

In this section, eight tests are shown and described. Each experiment comprises the formation and following dissociation of hydrates and was carried out with a binary gaseous mixture containing carbon dioxide and propane, whose concentration is indicated in Section 2.1.
The diagram shown in Figure 4 describes the phase boundary equilibrium for pure carbon dioxide and pure propane hydrates. It was realized with experimental data collected from the literature [37,38,45,46,47,48] and aims to define the thermodynamic region that the results of the present research are expected to fall within.
The phase equilibrium conditions of the two species are extremely different from each other. With the increase in temperature, both the species require gradually increasing pressures; however, the link between pressure and temperature varies significantly. At temperatures lower than, approximately, 6 °C, propane hydrates are more stable require milder pressure to grow. When the system approaches 6 °C, the equilibrium curve of propane hydrates changes drastically and the pressure required for the process immediately increases by orders of magnitude. Therefore, the two curves depict four separated regions:
(1)
Both the gaseous species can form hydrates;
(2)
Only carbon dioxide can form hydrates;
(3)
Only propane can form hydrates;
(4)
The conditions are not suitable for the production of hydrates.
The phase equilibrium conditions, for a specific species, may vary as a function of the properties of the system (geometry of the reactor, its gas–liquid interface and surface/volume ratio, stirring or not, presence of a porous sediment and its properties, and so on). For that reason, the two curves shown in Figure 4 were re-defined experimentally, with the same system and the same procedure used/followed for the production of CO2/C3H8 hydrates. In regard to propane, the curve was defined only at temperatures lower than 6 °C, since the study was carried out within a thermodynamic range suitable for replacement processes in natural gas reservoirs.
The results achieved are shown in Figure 5.
In the diagram, the experimental results are compared with the phase boundary conditions collected from the literature and previously shown in Figure 4. The dissociation conditions are similar, even if with some differences. The porous medium improved the heat transfer rate of the system and also provided suitable nucleation sites; therefore, it promoted the formation of hydrates, as clearly visible for carbon dioxide hydrates, whose experimental curve appeared below the theoretical curve. Conversely, the experimental curve of propane hydrates occurred slightly above the theoretical one, despite the presence of porous sand. The reason can be found in the different molecular sizes between carbon dioxide and propane. Carbon dioxide forms sI hydrates. This structure contains two different cavities, the small 512 and the relatively large 51262 cage. The molecules of carbon dioxide easily occupy the larger cavity but can also fit the smaller one, since the ratio between the molecular diameter and the cavity diameter is equal to one. Conversely, propane cannot fit any of these cavities and, by itself, leads to the formation of sII hydrates. However, in this kind of structure, the molecule of propane can exclusively enter the large 51264 cages, while it is excessively large for the smaller cavities. Therefore, the whole hydrate lattice is ultimately less stable. This justifies the slightly higher pressures obtained experimentally.
The thermodynamic evolutions of hydrate formation in tests 1–8, carried out with the CO2/C3H8 mixture, are shown in Figure 6.
The formation of hydrates has a strongly stochastic behaviour, mainly due to the initial nucleation phase, where the number of hydrate nuclei is highly variable, together with the time needed for their formation and initial growth. For that reason, one diagram for each test was used. Conversely, the dissociation phase is more deterministic, since it is mainly governed by the heat transfer rate of the system. Thus, it was possible to group all the tests in a single diagram, which is shown in Figure 7.
During the formation process, the internal pressure decreased with temperature but, in each test, two different steps can be distinguished: the first, during which pressure decreased exclusively as a consequence of its proportionality with temperature; then the drop in pressure accelerated due to the capture of gas molecules into water cages. This trend is highlighted in the diagram referring to Test 1, visible in Figure 6.
In Test 1, the production of hydrates started at approximately 8.6 °C. In the following experiments, carried out with the same gas–water mixture, the process manifested itself at higher temperatures: 11.3 °C in Test 2, 11.8 °C in Test 3, and so on. It means that the process started at progressively more severe thermodynamic conditions, proving the manifestation of a certain “memory effect” within the system.
If hydrates are produced two times consecutively with the same gas–water mixture, the process occurs earlier and requires less time to reach completion [49]. Therefore, hydrate-dissociated solutions are more suitable than fresh ones [50]. The memory effect is associated with the capability of the system to retain memory of previous formations of clathrates and persists only if the melting of hydrates occurs at relatively moderate temperatures. When hydrates are produced with pure carbon dioxide, the memory effect persists only if the melting temperature does not exceed 25 °C [51]. Similar temperature limits have also been discovered for other guest species [52]. Also, the time plays a role in this sense. Duchateau and colleagues studied the formation of methane/propane (98/2 vol%) [53]. They observed that the memory effect reduces its intensity when hydrates are melted at superheating temperatures, about 2–4 °C above the phase equilibrium, for at least two hours.
Previous studies revealed that the memory effect acts as an inhibitor for the replacement process: the release of methane from water cages is strongly hindered and the replacement efficiency drops from 70 to 75%, representing the maximum efficiency that can be reached when replacement is carried out with pure carbon dioxide, to 26% [54]. Conversely, a less intense action was observed on the capture of carbon dioxide. If the system works in excess of water, such effect can be directly neglected, while if the capture of this species is only related to the replacement process, the storage of carbon dioxide is inhibited.
In the last experiments shown in Figure 6, the production of hydrates took place at gradually lower temperatures. This can be read as a delay of formation, which needed more severe thermodynamic conditions to occur, and thus as an inhibition process. However, it should be considered that the diagrams shown in Figure 6 do not take into consideration the time dependency, and the promotion/inhibition related to the memory effect cannot be deduced from them. In this regard, the lowest pressure reached from the system can also be considered as an evaluating parameter.
For instance, Figure 8 compares the pressure evolution over time of Test 5, where the process began at relatively high temperatures, and Test 6, where it needed lower temperatures to manifest itself.
As is visible in the diagram, the internal pressure stabilized approximately at the same time in both the experiments, proving the absence of any inhibition. Moreover, in Test 6, the system reached a lower final pressure value than Test 5, proving a more abundant production of hydrates.
In terms of hydrate dissociation, all the experiments are described in a single diagram (see Figure 7). The dissociation phase is more deterministic and mainly governed by the heat transfer properties of the system, which remained the same for all the tests. As a consequence of this, the related curves show the same trend and are partially or completely overlapping each other.
Therefore, it is possible to define the phase boundary of the system, which is reported in detail in Table 1.
To conclude this section, the data that emerged during the formation of hydrates clearly denote that the system retained a certain memory of previous formations. However, the sole observation of the thermodynamic parameters does not allow to well describe such effect. Therefore, in the next section, the internal pressure, whose variation is strictly related to the production of hydrates, was analyzed as a function of time. The lowering of pressure was measured at fixed time intervals and at the completion of the formation process.

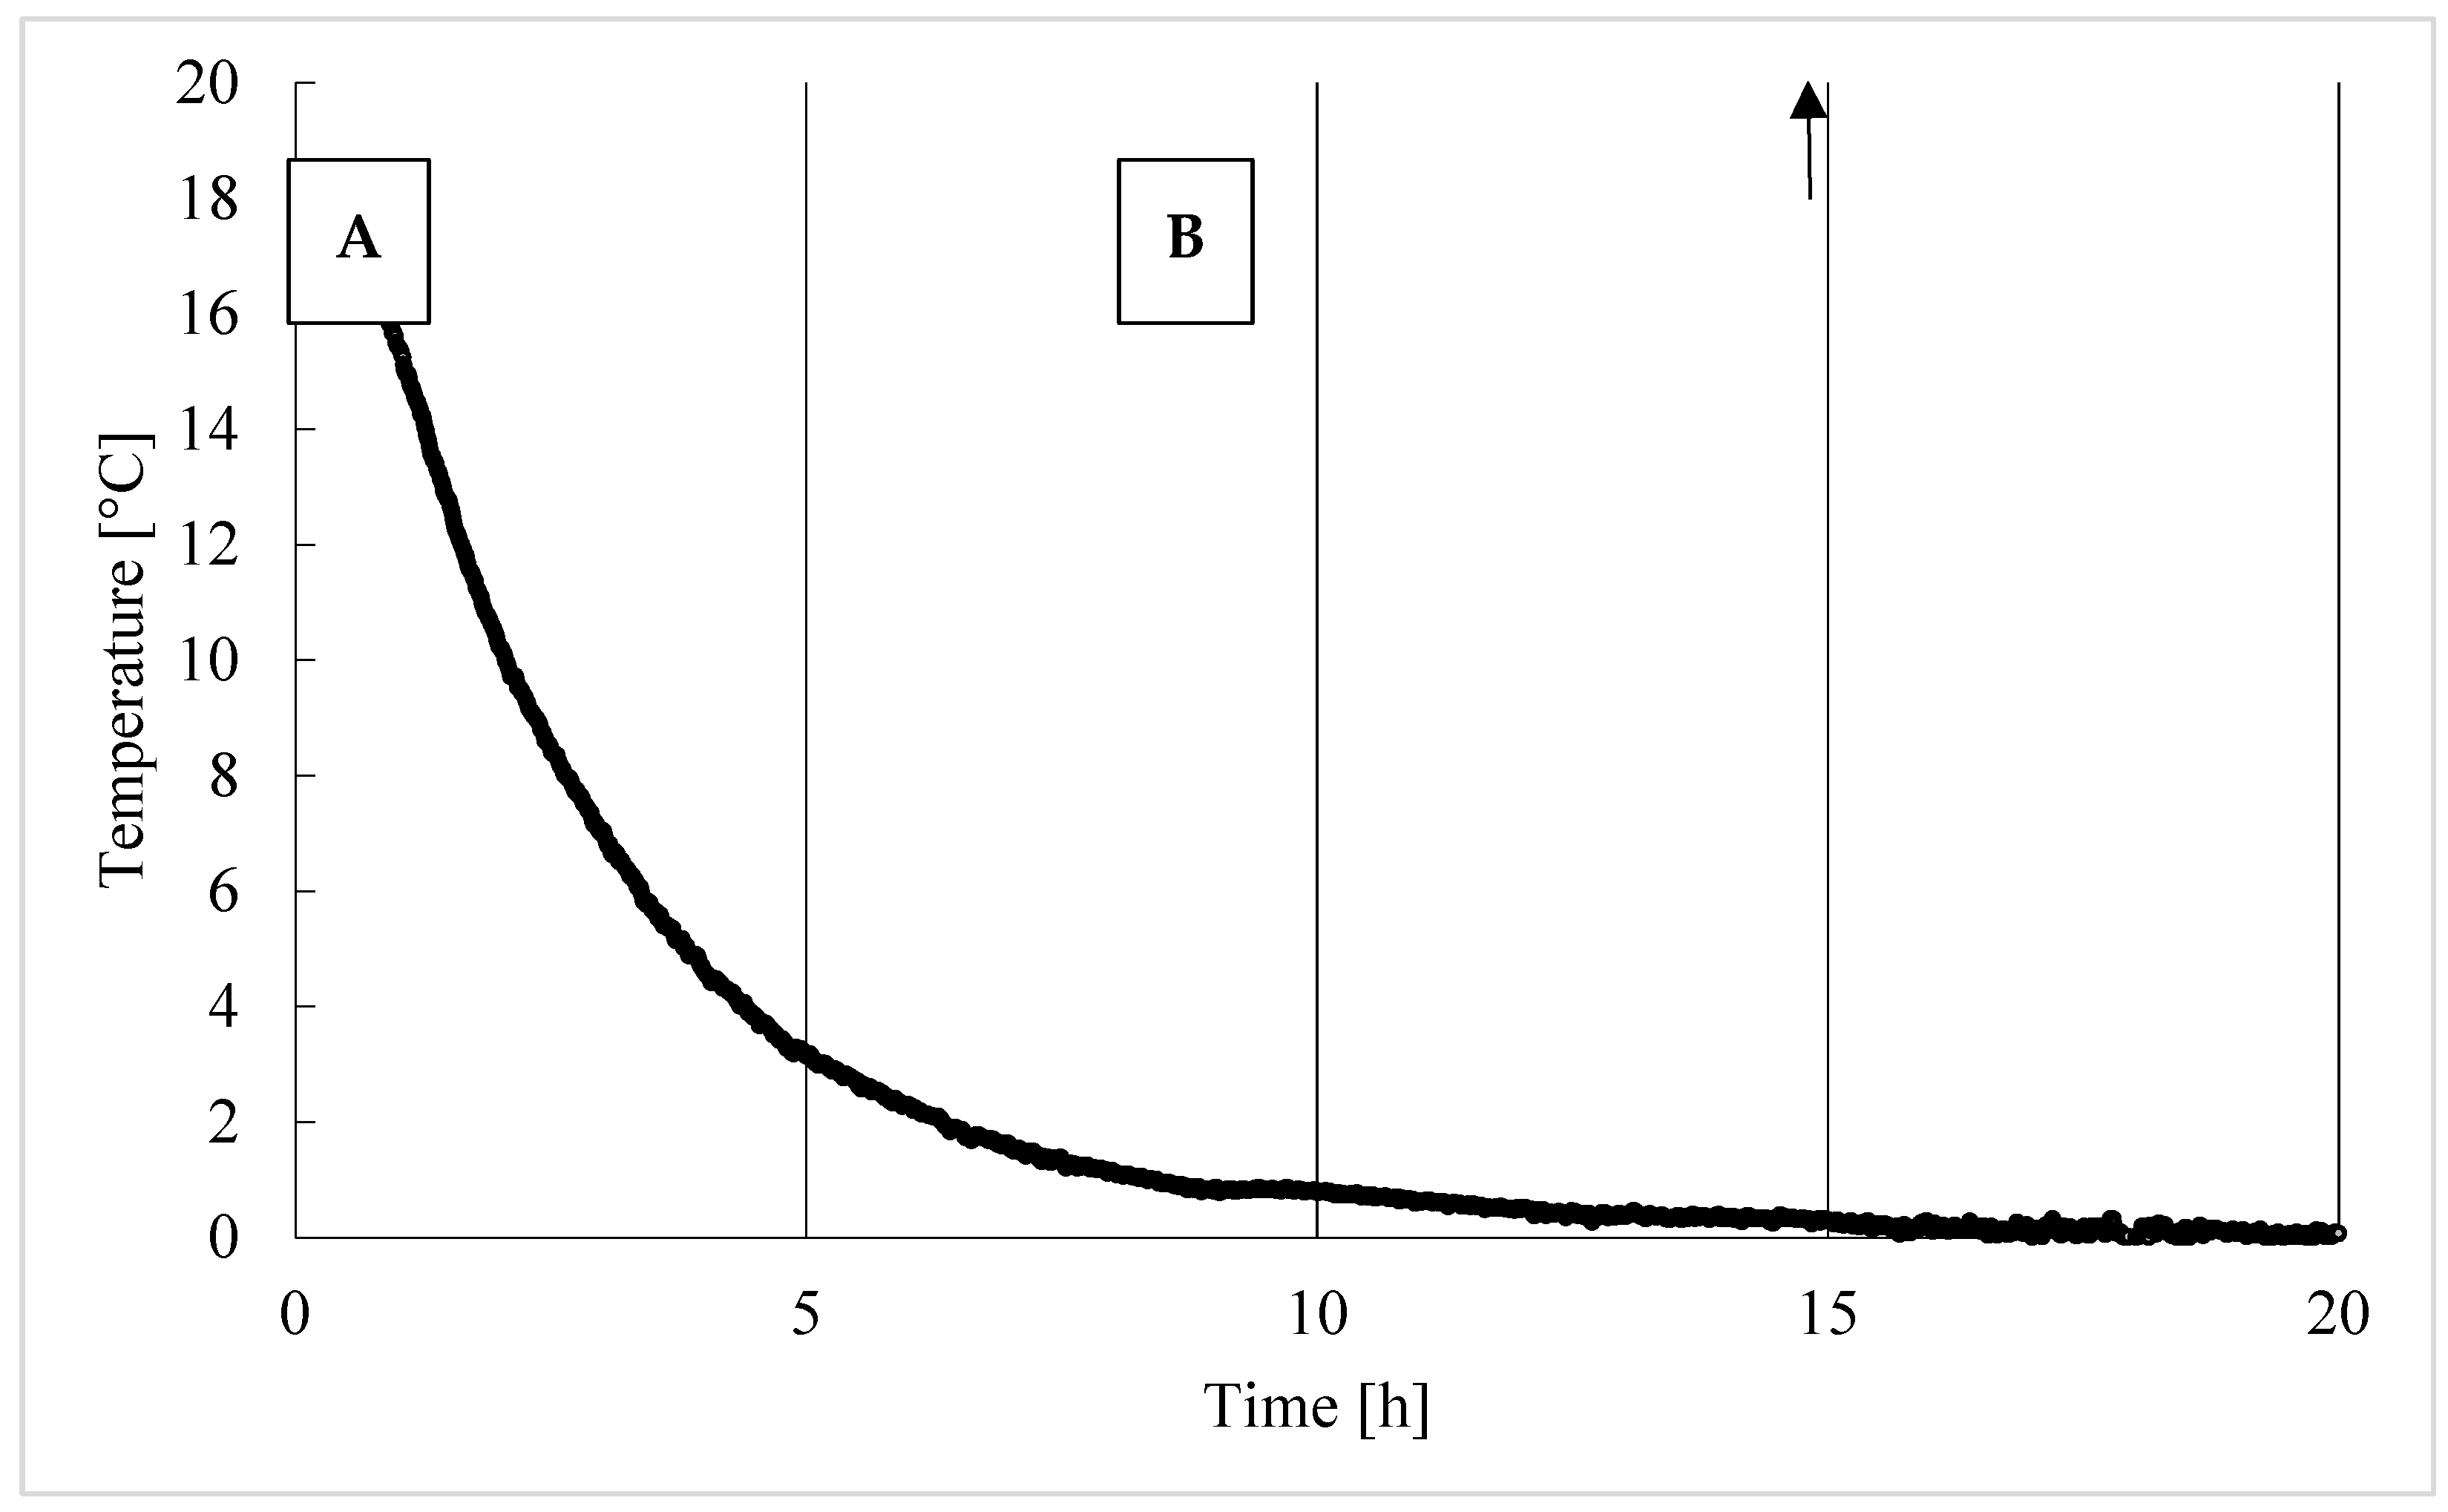
Trend of Hydrates Formation over Time

In this section, the variation in pressure over time is discussed. For each test, the internal pressure after 1, 3, 5, 10, 15 and 20 h is shown. Also, the lowest pressure reached was reported, together with the time value needed to reach that value.
All these data are shown in Table 2; moreover, the evolution over time of each test was plotted in a single diagram (see Figure 9) in order to compare the tests among each other.
As previously asserted, the tests were carried out consecutively and with the same gas–water mixture. Considering the experimental procedure followed and the melting temperatures, it can be concluded that the memory effect occurred. In fact, its positive contribution during the formation of hydrates was clear: during the experiments, the minimum pressure reached from the system gradually decreased. The retained memory of previous formations ensured the permanence of part of nucleation sites previously formed. In addition, new sites spontaneously grew during each test. The presence of a continuously increasing number of nucleation sites led to a gradually more massive production of hydrates. Regarding the time needed to reach completion of the process, corresponding to the lowest pressure achieved during the formation phase, the sole variation in relevance was observed between Test 1 and the other experiments. In Test 1, 50.95 h was needed for the scope while, in the other tests, 18.27–24.53 h was enough.
In Test 1, most of the hydrate production happened between 5 and 10 hours from the beginning of the process: the internal pressure passed from 32.69 to 21.38 bar during this time lapse. In the following tests, the process was faster: in tests 2 to 5, most of the pressure drop was observed between 1 and 3 h. Therefore, it can be concluded that, in this first group of tests (from 1 to 5), the formation gradually accelerated, providing further confirmation of the presence of the memory effect within the system.
In the last experiments, the trend seemed to reverse itself: in Test 6 and Test 8, the most relevant pressure variation happened between 5 and 10 h, while in Test 7, the same occurred between 10 and 15 h.
Such different behaviours can also be deduced from the P-T trend associated with these tests, described in Figure 6. The process started with intensity only after the system had already reached the minimum temperature. In addition to this, these experiments also obtained the lowest pressures reached during the whole series of experiments, and corresponded to the tests with the most abundant production of hydrates.
The moles of hydrate formed, shown in Figure 10, were calculated according to Equation (1). The diagrams confirmed again that the massive production of hydrates did not start immediately and marked differences were observed between the various experiments. Such different time dependences cannot be associated with the memory effect: in tests 1 to 5, the reaction time gradually diminished, while in the remaining tests it became longer and reversed the trend previously showed.
However, this diagram highlights a meaningful property of the system, i.e., the direct proportionality between the induction time (referring to the time period that passed before a detectable quantity of hydrates was formed [55,56]) and the overall quantity of hydrates produced during the formation process. While the time required to reach completion of the process is already shown in Table 2 (referred to as tmin), the total moles of hydrates produced during each test are indicated in Table 3.
Considering the same time interval for different tests, the one where the production of hydrates started with higher delay achieved a much greater production of hydrates.

4. Conclusions

This study deals with hydrate formation with a binary CO2/C3H8 (85/15 vol%) gaseous mixture. Previous studies proved that during replacement tests, the presence of a minor quantity of propane allows the quantity of methane to be increased and favours the capture of carbon dioxide, thus increasing the overall efficiency of the process. Eight tests were carried out with the same procedure and the same gas–water mixture in order to allow the system to retain memory of previous formations, thus considering the contribution of the memory effect.
The following results were achieved and discussed in the text:
(i)
As the experiments proceeded, the formation of hydrates began at gradually higher temperatures, proving that hydrates had the capability to occur at more severe thermodynamic conditions.
(ii)
The advantageous contribution of the memory effect is clearly visible: gradually lower minimum pressures were reached, denoting a higher production of hydrates. This can be attributed to the (partial) permanence of nucleation sites that occurred during the previous formations.
(iii)
Regarding the time required to reach completion of the process, the sole relevant difference was observed between Test 1 and the other experiments.
(iv)
Finally, it was observed that the longer the time required to detect a significant production of hydrates, the more abundant the production of hydrates.
In future studies, methane replacement will be performed with the same mixtures studied here and with the presence of the memory effect in order to experimentally define the process efficiency that can be reached with the replacement mixture.

Author Contributions

Conceptualization, A.M.G.; methodology, G.G.; validation, G.G. and F.R.; formal analysis, F.R.; investigation, A.M.G.; resources, F.R.; data curation, A.M.G.; writing—original draft preparation, A.M.G.; supervision, G.G.; project administration, F.R.; funding acquisition, F.R. All authors have read and agreed to the published version of the manuscript.

Funding

The authors gratefully acknowledge financial support derived from the PNRR project entitled: “High Efficiency Hydrogen Storage (HEHS)”, ID: RSH2B_000052 (to Giovanni Gigliotti and Federico Rossi).

Data Availability Statement

Data are already included within the manuscript. Further information will be available on request.

Acknowledgments

The authors also acknowledge the technical and material contribution of AiZoOn Technology Consulting and Nippon Gases Industrial SRL.

Conflicts of Interest

The authors declare no conflicts of interest.

References

  1. Oyama, A.; Masutani, S.M. A review of methane hydrate program in Japan. Energies 2017, 10, 1447. [Google Scholar] [CrossRef]
  2. Shaibu, R.; Sambo, C.; Guo, B.; Dudun, A. An assessment of methane gas production from natural gas hydrates: Challenges, technology and market outlook. Adv. Geoenergy Res. 2021, 5, 318–332. [Google Scholar] [CrossRef]
  3. Sloan, E.D. Fundamental principles and applications of natural gas hydrates. Nature 2003, 426, 353–359. [Google Scholar] [CrossRef] [PubMed]
  4. Kondori, J.; Zendehboudi, S.; Hossain, M.E. A review on simulation of methane production from gas hydrate reservoirs: Molecular dynamics prospective. J. Petrol. Sci. Eng. 2017, 159, 754–772. [Google Scholar] [CrossRef]
  5. Zhao, Y.; Hu, G.; Liu, L.; Liu, C.; Wan, Y.; Bu, Q.; Ji, Y.; Zhang, Z.; Kong, L. Mechanical properties of gas hydrate-bearing sediments: Research progress, challenges and perspectives. Earth Sci. Rev. 2025, 262, 105058. [Google Scholar] [CrossRef]
  6. Wei, N.; Pei, J.; Li, H.; Zhou, S.; Zhao, J.; Kvamme, B.; Coffin, R.B.; Zhang, L.; Zhang, Y.; Xue, J. Classification of natural gas hydrate resources: Review, application and prospect. Gas Sci. Eng. 2024, 124, 205269. [Google Scholar] [CrossRef]
  7. Zhang, X.; Zhang, S.; Yin, S.; He, G.; Li, J.; Wu, Q. Research progress of the kinetics on natural gas hydrate replacement by CO2-containing mixed gas: A review. J. Nat. Gas Sci. Eng. 2022, 108, 104837. [Google Scholar] [CrossRef]
  8. Collett, T.S. Energy resource potential of natural gas hydrates. AAPG Bull. 2002, 86, 1971–1992. [Google Scholar]
  9. Makogon, Y.F. Hydrates of Natural Gas; PennWell: Tulsa, OK, USA, 1981. [Google Scholar]
  10. Li, X.S.; Xu, C.G.; Zhang, Y.; Ruan, X.K.; Li, G.; Wang, Y. Investigation into gas production from natural gas hydrate: A review. Appl. Energy 2016, 172, 286–322. [Google Scholar] [CrossRef]
  11. Deng, S.; Wang, H.; Wang, C.; Ma, M.; Wei, Y.; Liu, Y. Research on dynamic movement of temperature and pressure during hydrate depressurization mining. J. Energy Resour. Technol. 2022, 144, 103001. [Google Scholar] [CrossRef]
  12. Gambelli, A.M.; Rossi, F. Optimization of the pressure drop produced during CO2 replacement in hydrate reservoirs: Balance between gas removal and preservation of structures. J. Petrol. Sci. Eng. 2022, 217, 110936. [Google Scholar] [CrossRef]
  13. Wan, Q.C.; Si, H.; Li, B.; Yin, Z.H.; Gao, Q.; Liu, S.; Han, X.; Chen, L.L. Energy recovery enhancement from gas hydrate based on the optimization of thermal stimulation modes and depressurization. Appl. Energy 2020, 278, 115612. [Google Scholar] [CrossRef]
  14. Pandey, J.S.; Karantonidis, C.; Karcz, A.P.; von Solms, N. Enhanced CH4-CO2 hydrate swapping in the presence of low dosage methanol. Energies 2020, 13, 5238. [Google Scholar] [CrossRef]
  15. Feng, J.C.; Li, G.; Li, X.S.; Li, B.; Chen, Z.Y. Evolution of hydrate dissociation by warm brine stimulation combined with depressurization in the South China Sea. Energies 2013, 6, 5402–5425. [Google Scholar] [CrossRef]
  16. Feng, J.C.; Li, X.S.; Li, G.; Li, B.; Chen, Z.Y.; Wang, Y. Numerical investigation of hydrate dissociation performance in the South China Sea with different horizontal well configurations. Energies 2014, 7, 4813–4834. [Google Scholar] [CrossRef]
  17. Li, B.; Li, G.; Li, X.S.; Chen, Z.Y.; Zhang, Y. The use of heat-assisted antigravity drainage method in the two horizontal wells in gas production from the Qillian Mountain permafrost hydrate deposits. J. Petrol. Sci. Eng. 2014, 120, 141–153. [Google Scholar] [CrossRef]
  18. Xu, C.G.; Li, X.S. Research progress on methane production from natural gas hydrates. RCS Adv. 2015, 5, 54672–54699. [Google Scholar] [CrossRef]
  19. Mohammadi, A.H.; Laurens, S.; Richon, D. Experimental study of methane hydrate phase equilibrium in the presence of polyethylene glycol-400 aqueous solution. J. Chem. Eng. Data 2009, 54, 3118–3120. [Google Scholar] [CrossRef]
  20. Li, Y.; Gambelli, A.M.; Rossi, F. Experimental study on the effect of SDS and micron copper particles mixture on carbon dioxide hydrates formation. Energies 2022, 15, 6540. [Google Scholar] [CrossRef]
  21. Mohammadi, A.H.; Richon, D. Gas hydrate phase equilibrium in the presence of ethylene glycol or methanol aqueous solution. Ind. Eng. Chem. Res. 2010, 49, 8865–8869. [Google Scholar] [CrossRef]
  22. Ndlovu, P.; Babaee, S.; Naidoo, P. Review on CH4-CO2 replacement for CO2 sequestration and CH4/CO2 hydrate formation in porous media. Fuel 2022, 320, 123795. [Google Scholar] [CrossRef]
  23. Ohgaki, K.; Takano, K.; Sangawa, H.; Matsubara, T.; Nakano, S. Methane exploitation by carbon dioxide from gas hydrates–phase equilibrium for CO2–CH4 mixed hydrate systems. J. Chem. Eng. Jpn. 1996, 29, 478–483. [Google Scholar] [CrossRef]
  24. McConnell, D.R.; Zhang, Z.; Boswell, R. Review progress in evaluating gas hydrate drilling hazards. Mar. Pet. Geol. 2012, 34, 209–223. [Google Scholar] [CrossRef]
  25. Liu, Y.; Chen, B.; Chen, Y.; Zhang, S.; Guo, W.; Cai, Y.; Tan, B.; Wang, W. Methane storage in a hydrate form as promoted by leucines for possible application to natural gas transportation and storage. Energy Technol. 2015, 3, 815–819. [Google Scholar] [CrossRef]
  26. Wang, T.; Sun, L.; Fan, Z.; Wei, R.; Li, Q.; Yao, H.; Dong, H.; Zhang, L.; Yang, L.; Zhao, J.; et al. Promoting CH4/CO2 replacement from hydrate with warm brine injection for synergistic energy harvest and carbon sequestration. Chem. Eng. J. 2023, 457, 141129. [Google Scholar] [CrossRef]
  27. Ndlovu, P.; Babaee, S.; Naidoo, P. Experimental study of CH4-CO2 replacement in gas hydrates in the presence of nitrogen and graphene nenoplatelets. J. Mol. Liq. 2023, 371, 121109. [Google Scholar] [CrossRef]
  28. Lee, J.; Mok, J.; Choi, W.; Seo, Y. Influence of structural transformation on guest exchange behavior in the sII hydrate-(CO2+N2) replacement for energy recovery and CO2 sequestration. Chem. Eng. J. 2023, 472, 144680. [Google Scholar] [CrossRef]
  29. Rossi, F.; Li, Y.; Gambelli, A.M. Thermodynamic and kinetic description of the main effects related to the memory effect during carbon dioxide hydrates formation in a confined environment. Sustainability 2021, 13, 13797. [Google Scholar] [CrossRef]
  30. Wang, T.; Zhang, L.; Sun, L.; Zhou, R.; Dong, B.; Yang, L.; Li, Y.; Zhao, J.; Song, Y. Methane recovery and carbon dioxide storage from gas hydrate in fine marine sediments by using CH4/CO2 replacement. Chem. Eng. J. 2021, 425, 131562. [Google Scholar] [CrossRef]
  31. Gambelli, A.M.; Presciutti, A.; Rossi, F. Review on the characteristics and advantages related to the use of flue-gas as CO2/N2 mixture for gas hydrate production. Fluid Phase Equilibr. 2021, 541, 113077. [Google Scholar] [CrossRef]
  32. Gambelli, A.M.; Rossi, F. Review on the usage of small-chain hydrocarbons (C2-C4) as aid gases for improving the efficiency of hydrate-based technologies. Energies 2023, 16, 3576. [Google Scholar] [CrossRef]
  33. Belandria, V.; Mohammadi, A.H.; Eslamimanesh, A.; Richon, D.; Sànchez-Mora, M.F.; Galicia-Luna, L.A. Phase equilibrium measurements for semi-clathrate hydrates of the (CO2+N2+tetra-n-butylammonium bromide) aqueous solution systems: Part 2. Fluid Phase Equilibr. 2012, 322–323, 102–112. [Google Scholar] [CrossRef]
  34. Kim, S.M.; Lee, J.D.; Lee, H.J.; Lee, E.K.; Kim, Y. Gas hydrate formation method to capture the carbon dioxide for pre-combustion process in IGCC plant. Int. J. Hydrogen Energy 2011, 36, 1115–1121. [Google Scholar] [CrossRef]
  35. Sun, S.C.; Liu, C.L.; Meng, Q.G. Hydrate phase equilibrium of binary guest-mixtures containing CO2 and N2 in various systems. J. Chem. Thermodyn. 2015, 84, 1–6. [Google Scholar] [CrossRef]
  36. Sfaxi, I.B.A.; Durand, I.; Lugo, R.; Mohammadi, A.H.; Richon, D. Hydrate phase equilibria of CO2+N2+aqueous solution of THF, TBAB or TBAF system. Int. J. Greenh. Gas Control 2014, 26, 185–192. [Google Scholar] [CrossRef]
  37. Sundramoorthy, J.D.; Hammonds, P.; Lal, B.; Philips, G. Gas hydrate equilibrium measurement and observation of gas hydrate dissociation with/without a KHI. Procedia Eng. 2016, 148, 870–877. [Google Scholar] [CrossRef]
  38. Moojer-van den Heuvel, M.M.; Peters, C.J.; de Swaan Arons, J. Gas hydrate phase equilibria for propane in the presence of additive components. Fluid Phase Equilibr. 2002, 193, 245–249. [Google Scholar] [CrossRef]
  39. Buleiko, V.M.; Grigoriev, B.A.; Mendoza, J. Calorimetric investigation of hydrates of pure isobutane and iso- and normal- butane mixtures. Fluid Phase Equilibr. 2018, 462, 14–24. [Google Scholar] [CrossRef]
  40. Gambelli, A.M.; Rossi, F.; Gigliotti, G. Methane replacement by using CO2/C3H8 mixtures for carbon storage and enhanced methane recovery in gas hydrates. Gas Sci. Eng. 2023, 115, 205028. [Google Scholar] [CrossRef]
  41. Gambelli, A.M.; Rossi, F. Re-definition of the region suitable for CO2/CH4 replacement into hydrates as a function of the thermodynamic difference between CO2 hydrate formation and dissociation. Process Saf. Environ. Prot. 2023, 169, 132–141. [Google Scholar] [CrossRef]
  42. Gambelli, A.M.; Rossi, F. Experimental characterization of the difference in induction period between CH4 and CO2 hydrates: Motivations and possible consequences on the replacement process. J. Nat. Gas Sci. Eng. 2022, 108, 104848. [Google Scholar] [CrossRef]
  43. Takeya, S.; Kida, M.; Minami, H.; Sakagami, H.; Hachikubo, A.; Takahashi, N.; Shoji, H.; Soloviev, V.; Wallmann, K.; Biebow, N.; et al. Structure and thermal expansion of natural gas clathrate hydrates. Chem. Eng. Sci. 2006, 61, 2670–2674. [Google Scholar] [CrossRef]
  44. Aregba, A.G. Gas Hydrate—Properties, Formation and Benefits. Open J. Yangtze Gas Oil 2017, 2, 27–44. [Google Scholar] [CrossRef]
  45. Yu, S.H.; Zhou, S.D.; Li, X.S.; Wang, S.L. Effect of graphite nanoparticles on CO2 hydrate phase equilibrium. Fluid Phase Equilibr. 2016, 414, 23–28. [Google Scholar] [CrossRef]
  46. Jarrahian, A.; Nakaee, A. Hydrate-liquid-vapor equilibrium condition for N2+CO2+H2O system: Measurement and modelling. Fuel 2019, 237, 769–774. [Google Scholar] [CrossRef]
  47. Kyung, D.; Lee, K.; Kim, H.; Lee, W. Effect of marine environmental factors on the phase equilibrium of CO2 hydrate. Int. J. Greenh. Gas Control 2014, 20, 285–292. [Google Scholar] [CrossRef]
  48. Seo, Y.T.; Lee, H. Multiple-phase hydrate equilibria of the ternary carbon dioxide, methane, and water mixtures. J. Phys. Chem. B 2001, 105, 10084–10090. [Google Scholar] [CrossRef]
  49. Ripmeester, J.A.; Alavi, S. Some current challenges in clathrate hydrate science: Nucleation, decomposition and the memory effect. Curr. Opin. Solid State Mater. Sci. 2016, 20, 344–351. [Google Scholar] [CrossRef]
  50. Takeya, S.; Hori, A.; Hondoh, T.; Uchida, T. Freezing-memory effect of water on nucleation of CO2 hydrate crystals. J. Phys. Chem. B 2000, 104, 4164–4168. [Google Scholar] [CrossRef]
  51. Li, Y.; Wu, N.; Ning, F.; Gao, D.; Hao, X.; Chen, Q.; Liu, C.; Sun, J. Hydrate-induced clogging of sand-control screen and its implication on hydrate production operation. Energy 2020, 206, 118030. [Google Scholar] [CrossRef]
  52. Wu, Q.; Zhang, B. Memory effect on the pressure-temperature condition and induction time of gas hydrate nucleation. J. Nat. Gas Chem. 2010, 19, 446–451. [Google Scholar] [CrossRef]
  53. Duchateau, C.; Glènant, P.; Pou, T.E.; Hidalgo, M.; Dicharry, C. Hydrate precursor test method for the laboratory evaluation of kinetic hydrate inhibitors. Energy Fuels 2010, 24, 616–623. [Google Scholar] [CrossRef]
  54. Gambelli, A.M. Variations in terms of CO2 capture and CH4 recovery during replacement process in gas hydrate reservoirs, associated to the “memory effect”. J. Clean. Prod. 2022, 360, 132154. [Google Scholar] [CrossRef]
  55. Kashchiev, D.; Verdoes, D.; van Rosmalen, G.M. Induction time and metastability limit in new phase formation. J. Cryst. Growth 1991, 110, 373–380. [Google Scholar] [CrossRef]
  56. Wang, S.R.; Yang, M.J.; Liu, W.G.; Zhao, J.F.; Song, Y.C. Investigation on the induction time of methane hydrate formation in porous media under quiescent conditions. J. Pet. Sci. Eng. 2016, 145, 565–572. [Google Scholar] [CrossRef]
Figure 1. Schematization and pictures of the experimental apparatus.
Energies 18 01522 g001
Figure 2. Technical details about the lab-scale reactor used for the production of gas hydrates: (A) flange hosting sensors and (B) vessel containing the gas–water mixture. The black arrows show the channels used for gas injection.
Energies 18 01522 g002
Figure 3. Temperature change over time at the stage of hydrate formation.
Energies 18 01522 g003
Figure 4. Phase boundary equilibrium for pure carbon dioxide (in black) and pure propane (in grey) hydrates [37,38,45,46,47,48].
Energies 18 01522 g004
Figure 5. Dissociation curve of pure carbon dioxide and pure propane hydrates, produced with the apparatus and experimental procedure described in Section 2. P-T values collected were plotted with black circles for CO2 and grey squares for C3H8; these values were then interpolated to produce the corresponding dotted lines, then compared with the experimental continuous curves.
Energies 18 01522 g005
Figure 6. CO2/C3H8 hydrate formation in tests 1 to 8.
Energies 18 01522 g006aEnergies 18 01522 g006bEnergies 18 01522 g006cEnergies 18 01522 g006dEnergies 18 01522 g006e
Figure 7. CO2/C3H8 hydrate dissociation in tests 1 to 8.
Energies 18 01522 g007
Figure 8. Pressure evolution over time during hydrate formation: comparison between Test 5 and Test 6.
Energies 18 01522 g008
Figure 9. Pressure drop over time, measured during the hydrate formation process in tests 1 to 8.
Energies 18 01522 g009
Figure 10. Moles of hydrates formed vs. time in tests 1–8.
Energies 18 01522 g010
Table 1. Mean dissociation pressures and temperatures measured in tests 1-8, with the corresponding tolerance that emerged from experiments.
Temperature [°C]Pressure [bar]Tolerance Measured [bar]
0.116.521.86
0.416.721.94
0.716.881.91
1.017.161.70
1.317.501.45
1.617.751.21
1.918.151.13
2.218.411.04
2.518.810.96
2.819.041.00
3.119.460.93
3.419.830.97
3.720.281.01
4.020.670.90
4.320.970.92
4.621.430.88
4.921.720.75
5.222.190.89
5.522.510.86
5.822.840.80
6.123.190.87
6.423.430.95
6.723.630.82
7.023.930.85
7.324.200.86
7.624.350.78
7.924.680.70
8.224.910.74
8.525.170.70
8.825.510.64
9.125.850.71
9.426.120.65
9.726.470.59
10.026.770.62
Table 2. Decrease in pressure, due to the production of hydrates, as a function of time, in tests 1–8.
P (Time) [bar]P (1 h)P (3 h)P (5 h)P (10 h)P (15 h)P (20 h)tmin [h]P (tmin)
Test 135.4435.3032.6921.3820.5620.3950.9520.27
Test 232.1024.4720.8919.2718.9518.7823.5418.65
Test 331.5023.5720.6719.4618.5318.3723.4118.26
Test 432.6924.7821.1619.2718.8619.2818.4118.53
Test 531.8224.3020.4718.6517.8517.7718.2717.77
Test 632.3028.5726.8617.0415.7815.5724.5315.38
Test 732.9029.1827.1425.5417.5615.3822.1515.05
Test 832.1628.5726.7717.3715.2914.7823.4514.65
Table 3. Moles of hydrates, in relation to tmin, or at the end of the formation process, in tests 1–8.
Moles of Hydrates Formed [mol]
Test 10.181
Test 20.171
Test 30.175
Test 40.190
Test 50.182
Test 60.208
Test 70.216
Test 80.215
Disclaimer/Publisher’s Note: The statements, opinions and data contained in all publications are solely those of the individual author(s) and contributor(s) and not of MDPI and/or the editor(s). MDPI and/or the editor(s) disclaim responsibility for any injury to people or property resulting from any ideas, methods, instructions or products referred to in the content.

