Article

The Impact of Uranium Resource Constraints on China’s Nuclear Power Development

by
Tianpeng Wang
1,*,
Ziqi Wu
1,
Wei Xiong
2,
Xunzhang Pan
3,
Xuan Ye
2 and
Xiaoguang Liu
4
1
Institute of Energy, Environment, and Economy, Tsinghua University, Beijing 100084, China
2
Institute of Nuclear and New Energy Technology, Tsinghua University, Beijing 100084, China
3
School of Ecology & Environment, Renmin University of China, Beijing 100872, China
4
China National Nuclear Corporation, Beijing 100822, China
*
Author to whom correspondence should be addressed.
Energies 2025, 18(6), 1507; https://doi.org/10.3390/en18061507
Submission received: 19 February 2025 / Revised: 13 March 2025 / Accepted: 14 March 2025 / Published: 18 March 2025
(This article belongs to the Section B4: Nuclear Energy)

Abstract

:
As a low-carbon and efficient energy source, nuclear power plays an indispensable role in China’s pursuit of carbon neutrality. However, existing studies on China’s nuclear energy development often overlook the constraints posed by uranium resources, limiting a comprehensive assessment of the pathways to carbon neutrality. This study incorporates uranium resource constraints into the China Global Energy Model (C-GEM) to analyze in detail the impact of uranium scarcity on China’s nuclear power development, electricity costs, and carbon emissions. Under a scenario of severe uranium resource constraints, the results indicate that nuclear power generation in 2060 is projected to be 35–50% lower than in a high-resource scenario, with nuclear power costs increasing by over 12% and carbon prices rising by approximately 2%. Without robust management of the uranium supply, the development of nuclear power may be constrained, hindering China’s ability to achieve its carbon neutrality targets. Therefore, this study suggests that China’s nuclear energy policies should focus on strengthening uranium resource security through enhanced domestic and international exploration, investing in advanced fuel recycling and high-efficiency reactor technologies, and integrating these measures into the broader low-carbon energy framework to ensure the sustainable development of nuclear power.

1. Introduction

Governments worldwide have set ambitious targets for achieving net-zero emissions [1]. At the 28th Conference of the Parties (COP 28) to the United Nations Framework Convention on Climate Change (UNFCCC), over 200 signatories committed to transitioning energy systems away from fossil fuels, aligning major global players towards cleaner and low-carbon energy development goals [2,3]. As a clean, low-carbon, efficient, and stable energy source, nuclear power is widely regarded as a technology for driving energy transitions and achieving carbon neutrality [4,5]. Nuclear power boasts the lowest life-cycle carbon emissions per unit of electricity—ranging from 5.1 to 6.4 g, with emissions only occurring during uranium mining, refining, and reactor fuel fabrication [6,7]. Over the past fifty years, nuclear power plants have prevented approximately 66 Gt of CO2 emissions, and they are expected to continue reducing more than 1 Gt of emissions annually [8]. Furthermore, compared with renewable sources such as wind and solar power, nuclear energy provides a stable, weather-independent baseload power supply.
China’s aggressive goal of becoming carbon neutral by 2060 has accelerated the development of nuclear power. Expanding nuclear power not only lowers carbon emissions [9] but also improves the energy mix, decreases reliance on fossil fuels, guarantees a steady supply of electricity, and avoids climate change-induced loss and damage [10,11,12,13,14]. From a global perspective, the current pace of nuclear construction only offsets the permanent shutdown of nuclear reactors [13], but China’s nuclear construction pace is accelerating. The operating nuclear power capacity in China is projected to reach 65 GW by the end of 2025. The national nuclear development plan, supported by strong safety measures and effective mitigation policies, is expected to drive a notable expansion in nuclear capacity. Under the carbon neutrality scenario, nuclear generation might climb beyond 2000 TWh by 2060, possibly reaching over 4000 TWh, constituting 10% to 20% of total primary energy supply (Supplementary Figure S1) [15]. This is compared to modest growth in annual electricity generation reaching 800–1500 TWh by 2060 without mitigation efforts in the future [16,17,18].
The security of the uranium supply has a direct impact on the long-term viability of nuclear energy [19]. Uranium resources are particularly unevenly distributed, resulting in uranium shortages in many countries and a reliance on international markets to meet demand [20]. The procurement of uranium resources has become more challenging in recent years. Continuing declines in global spending on exploration and mine development have resulted in global uranium production declining by approximately one-third between 2016 and 2020. Concurrently, the global demand for uranium resources continues to trend upwards. In particular, the most ambitious nuclear expansion scenarios may result in global reactor-related uranium demand exceeding 100,000 tons per year [21]. Uranium availability is affected by a combination of factors, including regulatory frameworks, geopolitical stability in major producing countries, technological advancements in extraction and processing, and market dynamics. Increased regulatory scrutiny over the environmental impact of uranium mining has affected the pace and cost of mine development [22]. Geopolitical stability in major uranium-producing countries is critical, since political instability or changes in export policies can disrupt supply chains [23]. Technological advancements in extraction and processing can enhance efficiency and yield, thereby reducing the effective extraction cost; recent studies highlight the potential of improved technologies for production efficiency [24,25]. Finally, market dynamics, including price volatility and global demand, drive investment decisions and influence the overall supply [26].
There is a substantial gap between the supply and demand of uranium in China. On the supply side, China’s uranium production expanded gradually, with an average annual growth rate of roughly 5.8%, from 769 tonnes of uranium (tU) in 2008 to 1700 tU in 2022, limited by mineral resources and extraction efficiency. Concurrently, China’s nuclear electricity generation surged sixfold, and domestic uranium demand increased from 1396 tU to 9563 tU at an average annual growth rate of 14.7%, causing its reliance on imported uranium to rise dramatically from 44.9% to 82.2% [21]. On the demand side, Mirkhusanov et al. indicated that under high nuclear energy development scenarios, rapid uranium demand expansion could lead to the depletion of global low-cost uranium resources before mid-century [27]. Chen et al. projected that China’s cumulative uranium demand by 2050 would range from at least 700,000 tons to 1,500,000 tons, a variability that primarily reflects uncertainties in the future pace of nuclear power development [28]. Moreover, Xing et al. estimated that China’s uranium demand by 2030 would reach over 20,000 tU, and China’s reliance on foreign uranium could reach as high as 90% [29]. The sources of China’s uranium imports are highly concentrated, primarily from Kazakhstan, Namibia, and Uzbekistan. Any disruptions in uranium production in these countries could impact the development of China’s nuclear power [30,31,32]. With the rapid increase in China’s nuclear power installed capacity, the existing uranium supply gap is expected to widen further.
Previous studies mostly concentrated on comprehensive low-carbon transition pathways under carbon neutrality [16,17,33]. These analyses evaluate a broad range of energy generation and carbon reduction technologies, but tend to simplify discussions on the sector-specific dynamics and potential of nuclear power. For the few studies that have specifically assessed the development of nuclear power in China, they mainly concentrated on operational and economic factors, such as cost-efficiency, public acceptance, and technological advancements. Xiao et al. investigated logistical and social constraints on nuclear power expansion but stop short of considering how fluctuating uranium availability could affect these dynamics [34]. Yu et al. [35] and Zhang et al. [36] assessed the deployment of nuclear power generation technologies under different policy contexts with varying considerations of technological advancement and price subsidies, which also neglected the uncertainties tied to uranium resources. Therefore, there is a pressing need to plan and analyze China’s nuclear power development considering uranium resource constraints.
This study introduces uranium resource constraints into the China-in-Global energy model (C-GEM), a dynamic computable general equilibrium (CGE) model [37], to offer a novel perspective for sustainable planning of China’s nuclear power and supporting robust and reliable low-carbon energy strategies. The C-GEM model captures the interconnections among various sectors within the economic system. By incorporating uranium resource constraints in simulating the carbon neutrality policy scenario, the model evaluates not only the direct impacts, such as changes in nuclear power capacity, but also the indirect effects on carbon pricing, electricity prices, and overall economic outputs. This study can inform strategic decisions to ensure energy security and environmental sustainability in the face of uranium resource limitations.

2. Data and Methodology

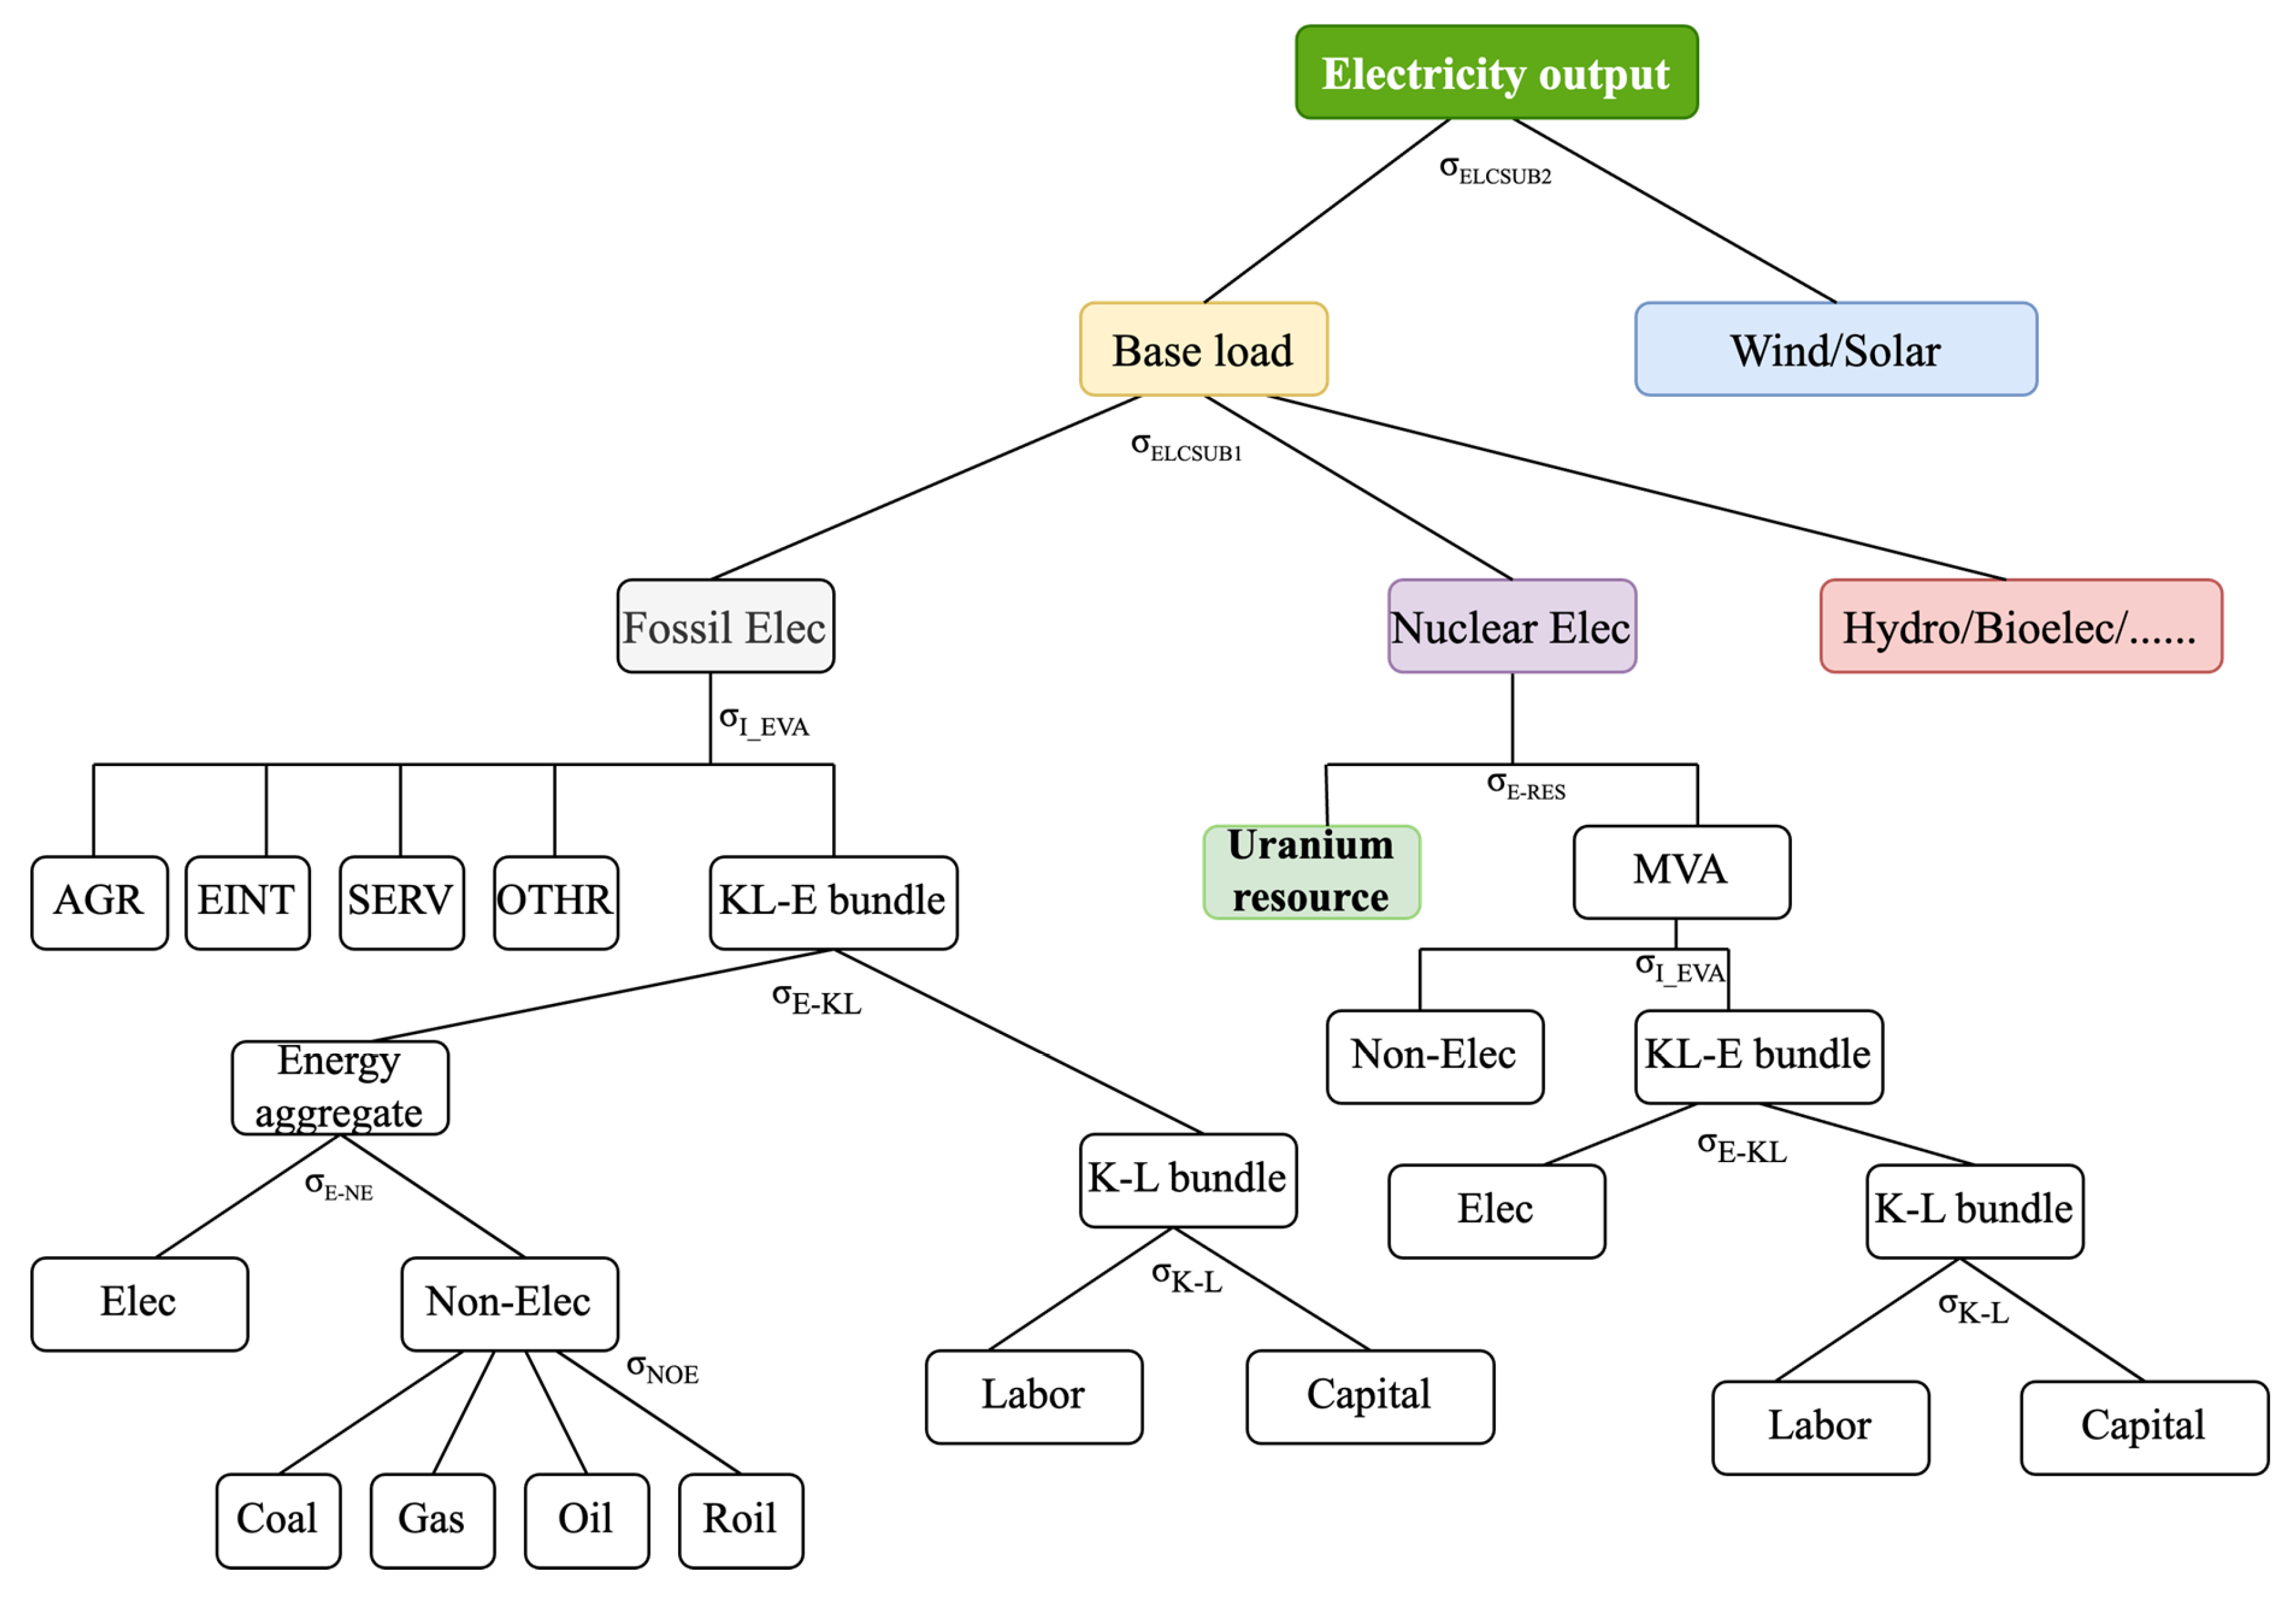
2.1. Overview of the C-GEM Model

To examine the impact of uranium resource constraints on the development of nuclear power in China under carbon neutrality goals, this study utilizes the C-GEM model as the core analytical tool [38,39]. The C-GEM model, a recursive dynamic global computable general equilibrium (CGE) model developed on the GAMS platform using the MPSGE language, aims to provide numerical support for policy analysis by simulating and forecasting the interactions between economic and energy systems (Supplementary Figure S2). Based on the latest Global Trade Analysis Project (GTAP) database [40] and China’s official statistical data, the benchmark year of the C-GEM model is updated to 2020, with simulations conducted in five-year intervals extending to 2060. This approach allows for a comprehensive assessment of the complex interactions between long-term economic activities and policy changes, making it suitable for modeling the potential impacts of uranium resource constraints on nuclear power development over an extended timeframe.
The C-GEM model divides the world into 17 regions, with a particular focus on economic interactions between China and its major economic partners, such as the United States, the European Union, Japan, and South Korea, ensuring accurate simulation of the global major economies and their interactions with China (Supplementary Table S1). Economic activities within the model are categorized into several sectors, including agriculture, industry, and services, with detailed modeling of energy-intensive industries and the power sector. Specifically, for the power sector, C-GEM encompasses traditional power generation technologies such as coal, oil, gas, and nuclear power, as well as low-carbon advanced technologies like wind, solar photovoltaics, and biomass. This detailed classification enables the model to effectively evaluate the contributions of different technologies to the future energy mix.
The C-GEM model consists of static and dynamic modules. Key model equations and parameter settings are detailed in the Supplementary Discussions. The static module uses a nested constant elasticity of substitution (CES) production function to simulate the economic state at a single point in time, establishing complex relationships between production factors such as labor, capital, and energy, and both intermediate and final products. This allows these factors to substitute for each other with specific elasticities at different production stages. The dynamic module predicts long-term economic development paths and policy effects by linking consecutive static evaluations. It incorporates factors such as population growth, technological progress, capital accumulation, and improvements in energy efficiency, illustrating the long-term impacts of policies like carbon taxes or uranium resource constraints on economic structure and energy consumption.

2.2. Power System Simulation and Uranium Resource Constraint Modeling in the C-GEM Model

In the C-GEM model, the modeling of the power sector is intricate and comprehensive, capturing the interactions among different electricity generation technologies and their interplay with other economic sectors. The model simulates the power sector using nested CES production functions, with the top-level nesting allowing for substitution between different types of generation technologies—a flexibility crucial under policy guidance, as shown in Figure 1. For example, as the costs of clean technologies decline and policy support strengthens, the model can automatically transition from high-carbon-emission coal-fired technologies to low-carbon or zero-carbon alternatives such as wind, solar, and nuclear power. In this manner, the C-GEM model not only captures the economic dynamics of technological substitution but also predicts the long-term impacts of policy changes such as renewable energy subsidies on the structure of the electricity market.
For traditional technologies like thermal power generation, their CES production function structure includes Leontief combinations of non-energy intermediate inputs and bundles of energy–capital–labor, reflecting the fixed combinations of resources in thermal power production and their economic relationships with other variable inputs. For resource-intensive technologies like nuclear and hydro power, the C-GEM model identifies fuel resources (such as nuclear fuel and water resources), capital, labor, and equipment as critical production inputs. The distinguishing feature of nuclear and hydro power is the Leontief function relationship between their production inputs, particularly resources, and other inputs, highlighting the dependence of these technologies on resource availability. The output of nuclear power is primarily determined by the availability of their resources. Furthermore, the C-GEM model places special emphasis on simulating emission reduction strategies, particularly the role of carbon pricing mechanisms. Detailed carbon pricing modules within the model simulate the impacts of carbon taxes or carbon trading systems on the power sector, assessing changes in electricity production costs and the pace of technological transition under different carbon pricing levels.
In the C-GEM model, modeling the impact of uranium resource constraints on nuclear power capacity is accomplished by integrating the Hotelling rule [41,42]. According to this rule, natural resources like uranium are considered scarce, with extraction costs rising gradually as resources are depleted. Within the C-GEM model, this principle is used to characterize the economic value and extraction costs of fuel resources, reflecting the influence of resource depletion on energy production. Uranium resources in nuclear power production are positioned as the highest-level input in the CES production function. A Leontief production function is employed, with an elasticity of substitution set at 0 between uranium and other inputs such as capital, labor, and other intermediate inputs. Utilizing Leontief production functions ensures that the distinctiveness of uranium resources is accurately portrayed in the model. Under this model configuration, any shortage of uranium directly constrains the output capacity of nuclear power, as these resources cannot be compensated for by increasing other inputs like capital or labor. To model uranium resource inputs for nuclear power, this study integrates domestic resource development expenditure data [21], with uranium import data from The Observatory of Economic Complexity (OEC) [43]. Based on data from 2015–2019, the model determines an annual average uranium resource input of USD 164 million (Supplementary Table S2), thereby providing the economic input parameters for the CES production function for the benchmark year.
The resource depletion module calculates the remaining uranium resources based on the amount of fuel consumed, and this calculation is periodically updated at set intervals. In the C-GEM model, the time interval is set to five years, and the uranium resource quantity Re,r,t at each time point is calculated by subtracting the uranium consumption Ue,r,t−1 during the previous period from the resource quantity Re,r,t−1 of the previous period, as shown in Equation (1). Here, Ti represents the time interval, which is set to 5 years in this model. This mechanism reflects the direct link between the depletion rate of uranium resources and nuclear power production activities. Over time, if the rate of uranium consumption accelerates, the corresponding remaining resource quantity will decrease significantly. This will not only drive up the future market price of uranium but also increase the operating costs of nuclear power, affecting its economic viability and sustainability.
R e , r , t   =   R e , r , t 1     ( T i   ×   U e , r , t 1 )
This approach enables the model to precisely depict and anticipate the response of nuclear power in the face of uranium resource constraints. For example, if the availability of uranium resources will substantially diminish in a future time frame, the model can aid policymakers in assessing necessary adaptive measures. These measures might involve augmenting investments in alternative energy sources, refining nuclear energy technologies to enhance fuel efficiency, or reassessing energy supply structures and security strategies. By integrating this resource depletion module, the C-GEM model can offer profound insights into how Uranium resource scarcity impacts nuclear power capacity, costs, and its enduring effects on the electricity market.

3. Scenario Construction

This study has devised nine detailed scenarios aimed at analyzing the effects of diverse uranium resource quantities and utilization rates on the trajectory of nuclear power development in China. These scenarios integrate three distinct resource quantity levels (high, medium, low) with three utilization rates (high, medium, low), with each combination being meticulously examined to construct a comprehensive framework for future energy modeling.

3.1. Establishing Resource Quantity Scenarios

According to the joint report by the Nuclear Energy Agency (NEA) and the International Atomic Energy Agency (IAEA) [21], globally known uranium resources with extraction costs below USD 40/kg are estimated at approximately 775,900 tons (including both reasonably assured and inferred resources), while those with costs below USD 260/kg amount to approximately 7,917,500 tons. Given China’s dependence on imported uranium resources and the considerable uncertainty surrounding the exact quantity of domestic uranium resources from various sources, this study does not differentiate between imported and domestic uranium resources. Current uranium market cost is notably higher than the extraction cost alone. This market premium largely results from additional factors such as transportation, regulatory compliance, and market demand uncertainties that are not fully captured in our model. Further analysis is needed to incorporate these dynamics more accurately.
Based on global uranium resource statistics, three resource quantity scenarios have been delineated in this paper:
  • High Resource Quantity Scenario (HR): Assumes that China has access to 90% of the global uranium reserves reported in the document, reflecting an exceedingly optimistic resource scenario.
  • Medium Resource Quantity Scenario (MR): Assumes that 50% of the global uranium resources are accessible for China’s nuclear power development, embodying a moderately optimistic outlook.
  • Low Resource Quantity Scenario (LR): Assumes that only 20% of the global uranium resources are accessible for China’s nuclear power development, portraying a relatively pessimistic scenario of resource scarcity.

3.2. Setting of Uranium Resource Utilization Rate Scenarios

The setting of resource utilization rates is grounded in both current and potential future levels of technological advancement. For instance, from 2019 to 2023, the uranium resource consumption per TWh of electricity generation is estimated to be approximately 26.5 tons (Supplementary Table S3). At present, the uranium resource utilization rate stands at a mere 0.6%. Through the implementation of second-generation reprocessing technologies, such as extracting uranium and plutonium for reuse in pressurized water reactors (PWRs), this rate could surge to nearly 1%. As fast reactor and accelerator-driven system technologies mature, uranium utilization efficiency could reach 60% through third-generation reprocessing and multiple recycling cycles.
Due to the uncertainties surrounding the future development of fast reactor technology, this study outlines three scenarios for uranium resource utilization rates:
  • High Uranium Resource Utilization Scenario (HU): Envisages a swift progression in fast reactor and reprocessing technologies, resulting in a 3% annual increase in uranium resource utilization efficiency after 2030.
  • Medium Uranium Resource Utilization Scenario (MU): Foresees a gradual reduction in the quantity of uranium resources consumed per TWh of nuclear power generation post-2030, with an annual decline of 1% from the current average level. This reflects ongoing technological enhancements and the bolstering of uranium utilization efficiency.
  • Low Uranium Resource Utilization Scenario (LU): Presumes that the uranium resource utilization efficiency remains stagnant at current levels until 2060.
Combining different scenarios of resource quantity and utilization rates, this study has devised nine comprehensive scenarios (HR-HU, HR-MU, HR-LU, MR-HU, MR-MU, MR-LU, LR-HU, LR-MU, and LR-LU) to thoroughly assess their impact on China’s nuclear power development. Each scenario encapsulates a potential future trajectory characterized by specific uranium resources and technological applications. These scenario formulations aim to furnish a multidimensional analytical framework for scrutinizing the role of nuclear power in future energy landscapes, particularly in the context of striving towards carbon neutrality objectives.

4. Result

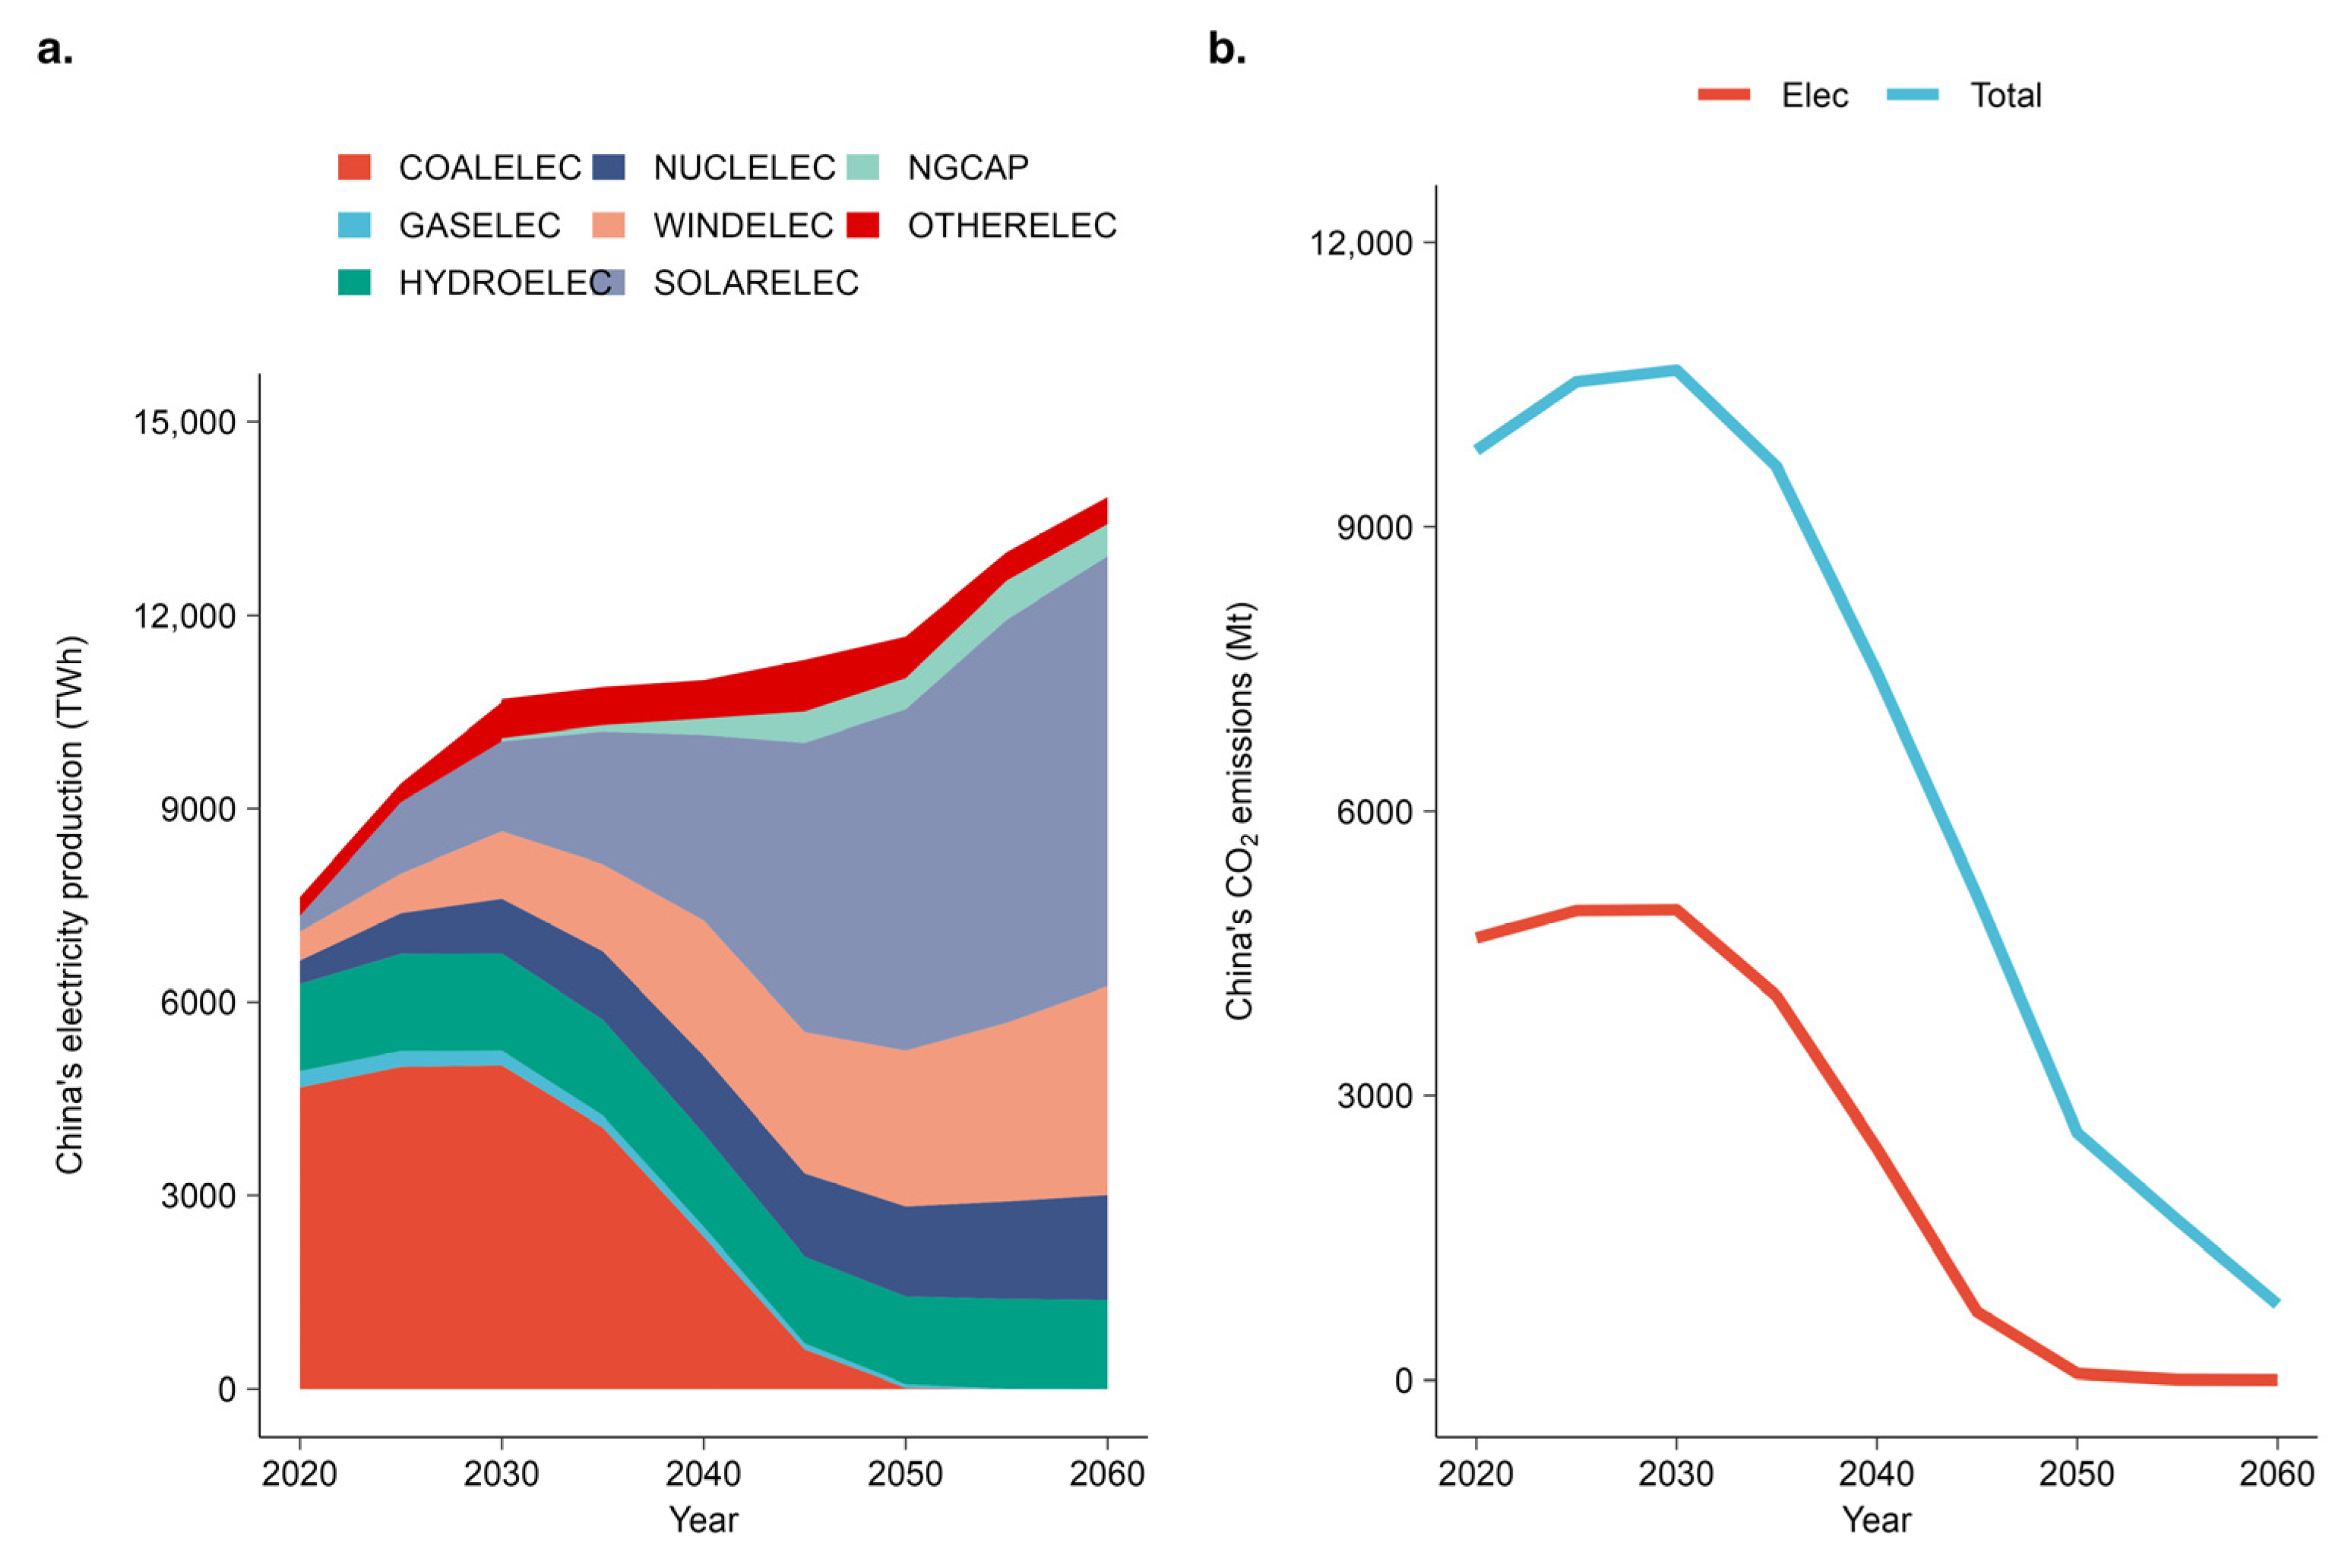
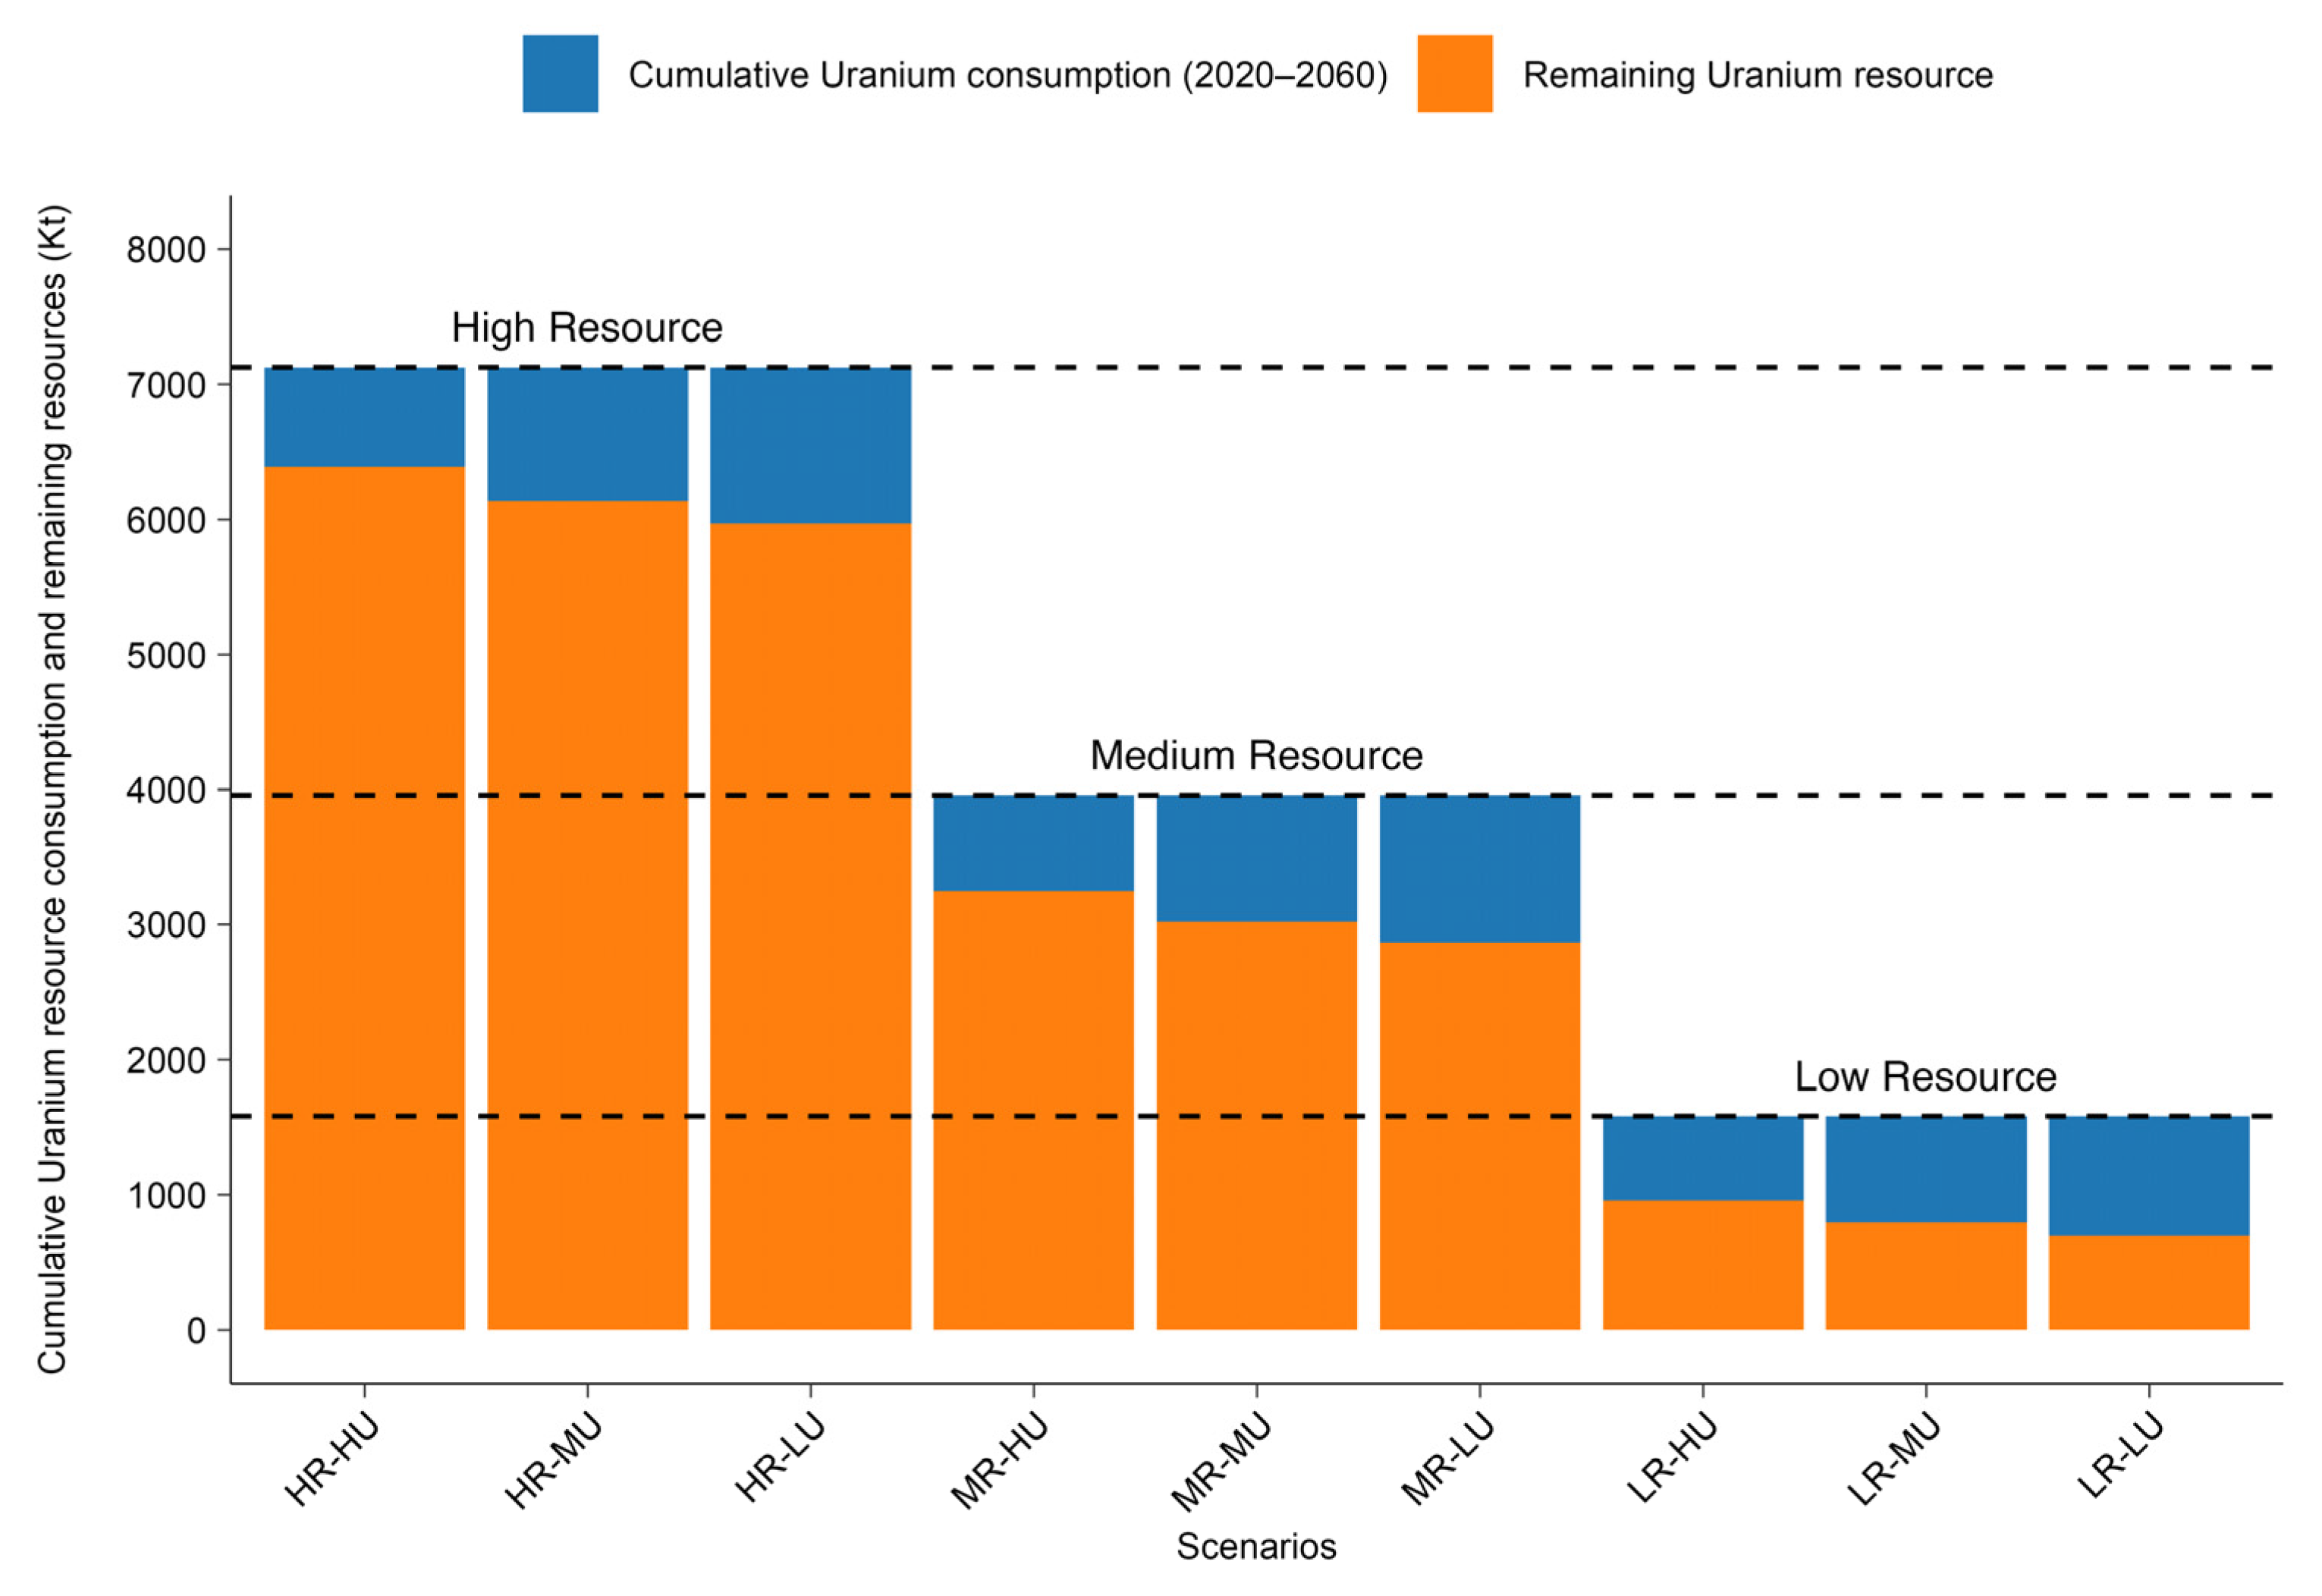
4.1. Under Uranium Resource Constraints: Power Production Structure and Uranium Consumption

In examining the role of uranium resources in contributing to China’s carbon neutrality target, this study takes the MR-MU (medium resource quantity, medium resource utilization rate) scenario as a representative example, reflecting a moderate assumption regarding uranium resource availability. By integrating uranium constraints associated with carbon neutrality targets into the model, the C-GEM model simulated the contributions of nuclear power and other clean energy sources to achieving long-term carbon reduction targets. Figure 2 illustrates the shifts in power production structure under the MR-MU scenario, with a notable decrease in coal-powered generation from 4672 TWh in 2020 to nearly zero by 2060. This reflects the systematic phase-out of high-carbon energy sources and responses to clean energy policies. In contrast, wind and solar power increases remarkably, with wind power rising from 447 TWh in 2020 to 3239 TWh by 2060, and solar power rising from 248 TWh in 2020 to 6670 TWh by 2060, demonstrating the expanding role of renewable energy sources within the energy landscape.
As a low-carbon energy source, nuclear power demonstrates a consistent upward trend throughout the simulation period, with its production increasing from 366 TWh in 2020 to 1626 TWh by 2060. This expansion not only mitigates China’s dependence on fossil fuels but also improves energy security and sustainability. Concerning carbon emissions, both those from the power sector and the overall emissions exhibit a downward trend (Figure 2b). Specifically, emissions from the power sector decrease from 4.7 Gt CO2 in 2020 to near-zero by 2050, and total carbon emissions linked to fossil fuel consumption decrease from 9.8 Gt CO2 in 2020 to a mere 0.8 Gt CO2 by 2060, with the remaining emissions offset by carbon sinks. Hence, by increasing the share of nuclear power and other clean energy sources, the power generation mix can be improved, carbon emissions reduced, and progress toward carbon neutrality supported.
The role of nuclear power in shaping the future power production structure is influenced by both uranium resource quantity and utilization rates (Figure 3 and Supplementary Figure S3). In the high-resource (HR) scenario, including HR-HU, HR-MU, and HR-LU, nuclear power shows varying degrees of growth in both electricity generation and its contribution to the total electricity output. Under the HR-HU scenario, nuclear power generation grows the fastest, reaching 1927 TWh by 2060, and its share of total electricity generation increases from 4.5% to 13.3%. In the HR-MU and HR-LU scenarios, nuclear power also grows substantially but does not reach the same levels as in HR-HU due to lower resource utilization rates. This finding highlights the critical role of resource utilization in driving nuclear power development. In the medium-resource (MR) scenario, which includes MR-HU, MR-MU, and MR-LU, nuclear power shows a gradual upward trend with slower growth compared to high-resource scenarios because of more limited resource availability.
In the low-resource (LR) scenarios, including LR-HU, LR-MU, and LR-LU, although nuclear power generation initially shows growth, it begins to decline in the late 2050s. This trend is particularly pronounced in scenarios with lower resource utilization (LR-LU scenario), where the proportion of nuclear power peaks in 2035 and then declines, reaching only 6.4% of total electricity generation by 2060. This decline shows the unsustainability of nuclear growth under the dual pressures of limited resources and inadequate progress in resource utilization technologies. Overall, the availability of uranium resources has greater impacts on nuclear power development than the effective utilization rate of Uranium. While technological optimizations can enhance utilization rates, the potential for development remains severely constrained without sufficient uranium resources to support it.
Cumulative uranium consumption and remaining reserves under various uranium resource scenarios from 2020 to 2060 are shown in Figure 4. In the high uranium resource scenarios (HR-HU, HR-MU, HR-LU), the initial total resource amount is over 7.0 million tons. In the HR-HU scenario, nearly 90% of uranium resources are still preserved by 2060, reflecting a conservative utilization approach (Supplementary Figure S4). Conversely, the HR-LU scenario demonstrates a more aggressive resource utilization strategy, with an annual consumption exceeding 40,000 tons by 2060, totaling 1.2 million tons consumed, leaving 84% of uranium resources. For the medium uranium resource scenarios (MR-HU, MR-MU, MR-LU), the initial resources total nearly 4.0 million tons. By 2060, these scenarios exhibit more apparent resource depletion, with MR-LU consuming the most, totaling 1.1 million tons, leaving about 73% of uranium resources. MR-HU retains the most resources, with 82% remaining. In the low uranium resource scenarios (LR-HU, LR-MU, LR-LU), the initial resources total only 1.6 million tons. By 2060, these scenarios have the least remaining resources, especially the LR-LU scenario, showing the most aggressive resource consumption pattern, with a cumulative consumption of 0.9 million tons, leaving only 44% of uranium resources. In contrast, the LR-HU scenario exhibits a more conservative consumption pattern, with a cumulative consumption of 0.6 million tons, leaving 60% of uranium resources. Overall, higher initial resources combined with more conservative utilization strategies better preserve resources, while lower initial resources or more aggressive utilization strategies substantially deplete available resources.

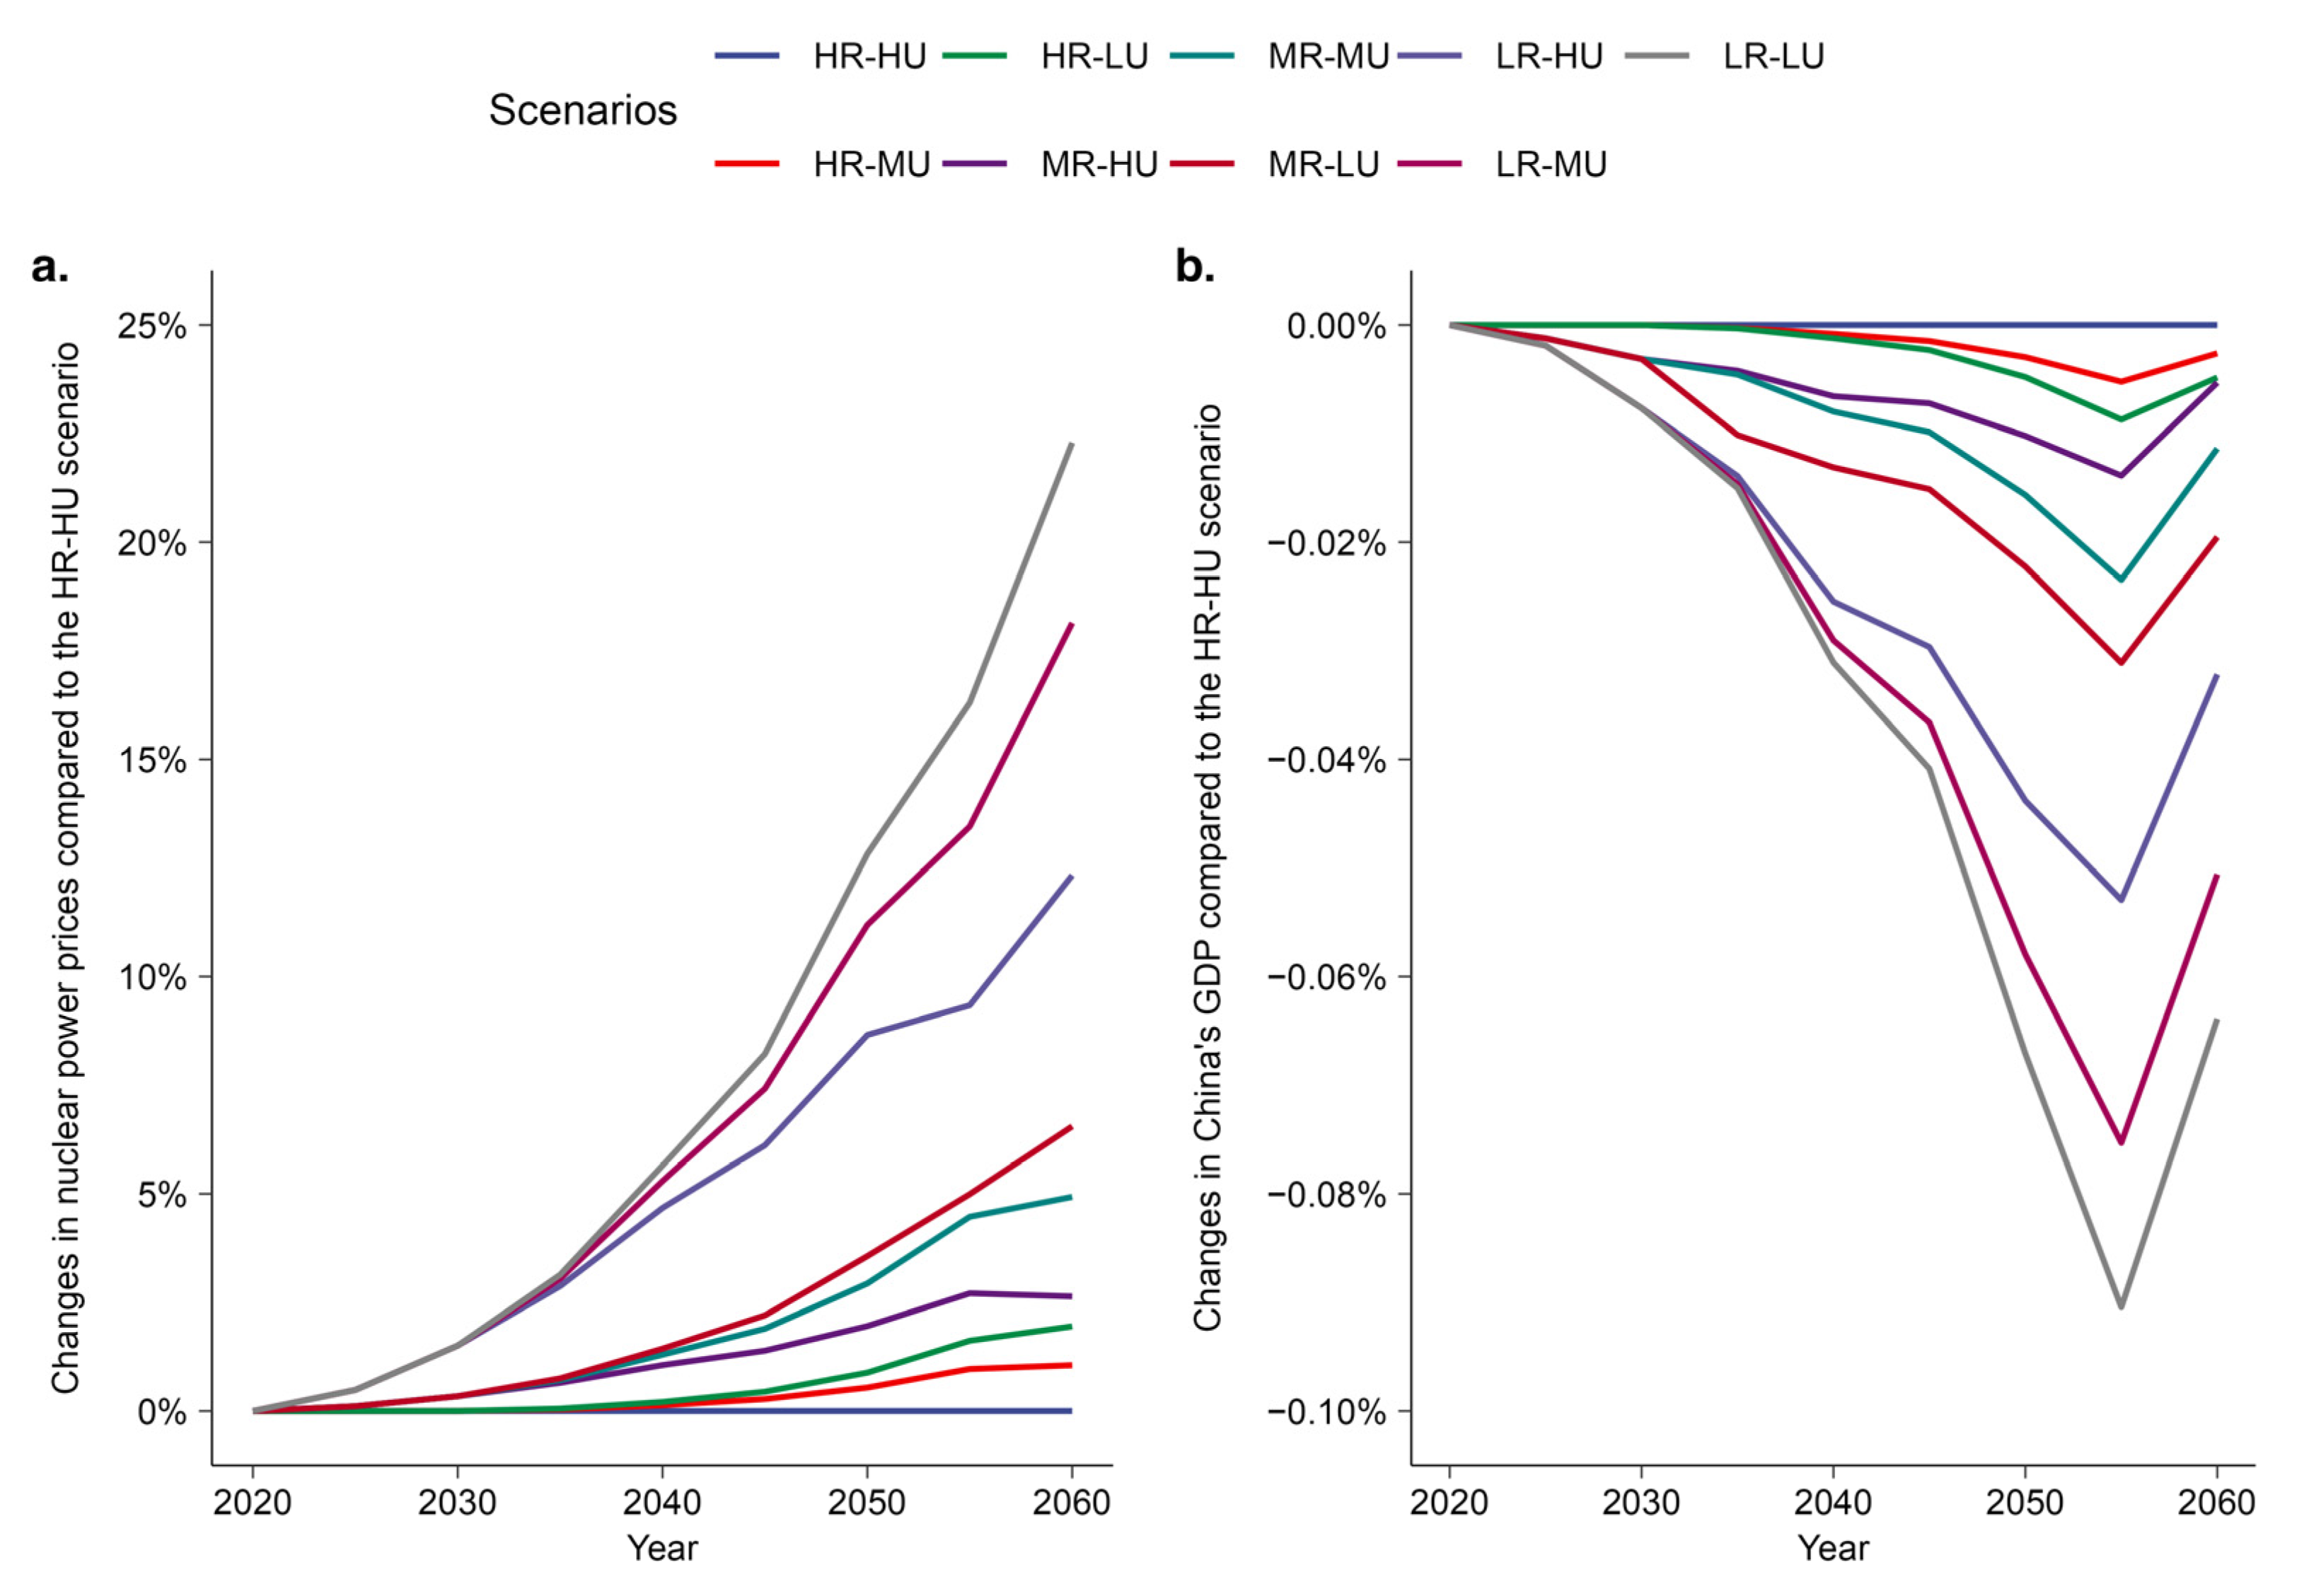
4.2. Economic Impacts of Uranium Resource Constraints

Within the C-GEM framework, carbon pricing is generated by setting a predefined cap on carbon emissions and simulating the marginal cost required for the economy to reach equilibrium under this constraint. This process reflects the cost pressures faced by the economy in achieving government-set carbon reduction targets, resulting in the price paid per unit of carbon emission reduction. Carbon pricing serves not only as a direct indicator of mitigation costs but also as a crucial economic parameter for evaluating mitigation policy effectiveness. This study demonstrates that variations in uranium resource availability drive dynamic changes in carbon prices by influencing energy production costs, thereby affecting the overall economic cost (Figure 5).
In the high-resource (HR) scenarios where resources are abundant, regardless of the efficiency of resource utilization, carbon prices remain relatively close. Carbon prices in HR-HU, HR-MU, and HR-LU scenarios range from USD 487 to 498 per ton of CO₂, reflecting ample uranium resources sustaining lower marginal abatement costs over an extended period (Figure 5 and Supplementary Figure S5). Furthermore, the upward trend in carbon prices reflects increasing marginal costs of carbon abatement over time and with policy tightening, even under abundant resource conditions. Carbon prices rise in scenarios with more constrained uranium resources, particularly under low resource utilization (LU) scenarios, where carbon prices exceed those of other scenarios, reaching USD 501 per ton of CO₂ in the LR-LU scenario, about USD 14 per ton of CO₂ higher than the HR-HU scenario. This indicates an increase in the economic cost required to achieve the same emission reduction targets under resource constraints, with resource scarcity being a primary driver of carbon price escalation.
Uranium resource availability is a major factor in determining nuclear power prices because it affects plants’ operation (Figure 6a). In the HR-HU scenario, nuclear power prices serve as a baseline due to favorable supply conditions and advanced technology. In comparison, less favorable scenarios result in higher prices, with increases of 1.1% and 2% in the HR-MU and HR-LU scenarios, respectively, by 2060. In medium-resource scenarios, the MR-LU case shows a 6.6% increase relative to HR-HU, and in low-resource scenarios, price increases reach up to 22.3%. The increase in nuclear power price indicates that limited resource availability substantially raises the marginal operating costs of nuclear power plants.
Changes in nuclear power prices primarily affect economic development. Higher electricity prices reduce business profit margins, limiting funds available for expansion and innovation, and they also decrease consumer spending as households devote a larger share of their income to energy costs. Relative to the gross domestic product (GDP) in the HR-HU scenario, other scenarios show varying degrees of decline in GDP. In MR and LR scenarios, resource constraints resulting in high energy costs significantly dampen economic activity. Particularly in the LR-LU scenario, GDP in 2060 relative to HR-HU declines by 0.064%, approximately USD 38 billion (Figure 6b). In our model, the stronger immediate impact of nuclear power price increases on GDP in 2050—as compared to 2060—is attributed to the rapid emission reduction requirements post-2035, which initially exert significant cost pressures on the economy. By 2060, these pressures are alleviated through technological progress, energy mix adjustments, and adaptive economic responses.

4.3. Sensitivity Analysis

This study conducted a sensitivity analysis on key parameters within the C-GEM model, revealing the significant impact of the substitutability between uranium resources and other inputs, as well as the markup cost for nuclear power, on nuclear power output (Nuc. Gen.), nuclear electricity price (Nuc. Elec. price), and carbon price (CO2 price) in 2060 (Table 1). When the substitutability between uranium resources and other inputs increased from 0 to 0.1, it substantially boosted nuclear power output, ranging from 5.0% to 13.3% across all scenarios. This change indicates that enhancing the substitutability of uranium resources effectively enhances nuclear power production capacity, especially in high-resource (HR) scenarios, where the impact is most pronounced, reflecting the significant role of greater uranium supply elasticity in driving nuclear power capacity expansion. Additionally, nuclear electricity prices generally decreased by 1.2% to 3.5%, and carbon prices also decreased by 0.2% to 0.6%, indicating that the reduction in nuclear power costs contributes to alleviating overall mitigation costs under the carbon neutrality target.
In the CGE model, the markup cost parameter of nuclear electricity influences nuclear power’s competitiveness by adjusting its production cost, thereby determining its market share and expansion rate in the power system. When the markup cost parameter decreases by 10%, nuclear power output generally exhibits an increasing trend. Especially in high-resource (HR) scenarios, the increase in nuclear power output ranges from 9.4% to 10.2%, higher than in moderate-resource (MR) and low-resource (LR) scenarios. This suggests that under conditions of abundant resources, the reduction in nuclear power costs can more effectively stimulate an increase in nuclear power output. Meanwhile, nuclear electricity prices experience a slight decrease (approximately 0.0% to 0.3%), and carbon prices also decrease synchronously (from 0.2% to 2.5%). Conversely, when the markup cost parameter increases by 10%, nuclear power output shows a declining trend in all scenarios, with the most significant decrease observed in high-resource scenarios, ranging from 8.2% to 8.8%. In low-resource (LR) scenarios, the sensitivity of nuclear power output to cost changes is relatively low. This could be because under conditions of limited resources, even with cost fluctuations, the availability of uranium resources has become the primary bottleneck restricting nuclear power growth, thus limiting the direct impact of cost changes on nuclear power output.

5. Conclusions and Discussions

For China’s nuclear power development, uranium resource availability and efficient utilization are critical, yet previous research has largely overlooked this aspect. Through an examination of nuclear power development under various uranium resource scenarios and their economic implications, this study highlights the significance of resource management strategies in realizing long-term sustainable development objectives. The expansion of nuclear power depends on both abundant uranium supplies and improved utilization efficiency, which extend the lifespan of uranium reserves and support the sustained growth of nuclear energy within low-carbon systems. Effective management of uranium resources can reduce energy supply uncertainties, and it provides essential support for achieving carbon neutrality.
Uranium resource constraints lead to different nuclear power growth patterns. Under high-resource conditions (e.g., HR-HU), nuclear power expands significantly, increasing its share of electricity generation from 4.5% in 2020 to 13.3% by 2060, which enhances both environmental performance and energy security. In contrast, when uranium is scarce (e.g., LR-LU), nuclear expansion peaks around 2035 and then declines, reflecting the limits imposed by resource shortages. These constraints also drive higher carbon prices, as shown in the C-GEM model, indicating increased economic costs for carbon abatement when resources are limited. Effective uranium resource management and improvements in utilization efficiency are crucial to support sustainable nuclear expansion and facilitate a cost-effective transition to a low-carbon economy. To secure a resilient nuclear energy sector that underpins China’s low-carbon future, targeted policy measures are needed to guarantee a stable uranium supply and to drive innovation in nuclear fuel management.
This study has some limitations. The economic and policy environments assumed by the current model may change in the future, affecting uranium resource demand and the development trajectory of nuclear power. Meanwhile, although our CGE-based analysis reflects the interactions among policy, market, and economic systems, it does not provide a detailed depiction of nuclear technology processes. Future work may consider integrating CGE and capacity expansion models (CEMs) to comprehensively characterize the nuclear fuel cycle and provide a more complete investigation of China’s nuclear energy development. Additionally, our current model treats uranium as a strictly necessary and non-substitutable resource—a limitation that may overestimate its strategic importance and overlook potential technological innovations. Alternative strategies, such as high-efficiency reactor designs, fuel recycling, breeder reactors, and extracting uranium from sources like seawater, could substantially improve nuclear energy production efficiency and reduce costs. Recent advances in nuclear reactor technology further illustrate this potential [44,45,46,47]. For example, fast breeder reactors can convert fertile U-238 into fissile plutonium [48], thereby extending the effective fuel supply, while accelerator-driven systems enable the transmutation of long-lived actinides [46]. In addition, thorium-fueled reactors provide alternative fuel cycles (e.g., Pu-Th mixtures) that could help mitigate uranium scarcity [45], although economic challenges persist. Uranium extraction from seawater is also in the demonstration and pilot scale phase [47]. If the technology matures and becomes economically viable in the future, it could provide a nearly inexhaustible supply of uranium, thereby dramatically altering uranium availability in China and shifting the strategic dynamics of nuclear power development. While these innovations are not incorporated into the present study, they represent important directions for future research. Despite these limitations, our findings offer valuable insights for nuclear energy policy planning. To achieve carbon neutrality by 2060, policymakers should prioritize expanding domestic and international uranium exploration to secure a stable, long-term supply, and advance nuclear technologies—particularly those that enhance uranium recycling and reprocessing. Regular assessments of uranium availability and utilization efficiency should be integrated into national energy strategies, and optimizing the energy mix by combining nuclear power with renewables such as wind and solar can further strengthen energy security and reduce carbon emissions.

Supplementary Materials

The following supporting information can be downloaded at: https://www.mdpi.com/article/10.3390/en18061507/s1, Figure S1: Projections made by different studies and models for nuclear power development in China from 2020 to 2060. Figure S2: The basic model structure of the C-GEM model. Figure S3: China’s electricity production structures under different scenarios for carbon neutrality target. Figure S4: China’s annual uranium resource consumption from nuclear power generation under different scenarios for carbon neutrality target. Figure S5: China’s carbon price under different scenarios for carbon neutrality target. Table S1: Classifications of regions and sectors in the C-GEM model. Table S2: Consumption of uranium resources for nuclear power development in China from year 2015 to year 2019 (billions of USD). Table S3: Uranium resource utilization efficiency for nuclear power generation in China. References [49,50,51] are cited in the supplementary materials.

Author Contributions

Conceptualization, T.W.; Methodology, T.W., Z.W., W.X., X.P., X.Y. and X.L.; Software, T.W.; Validation, T.W.; Formal analysis, T.W.; Investigation, T.W. and W.X.; Resources, T.W.; Data curation, T.W.; Writing—original draft, T.W., Z.W., W.X. and X.L.; Writing—review & editing, T.W., X.P. and X.Y.; Visualization, T.W.; Supervision, T.W.; Project administration, T.W.; Funding acquisition, T.W. All authors have read and agreed to the published version of the manuscript.

Funding

This work is supported by National Key Research and Development Program of China (No. 2022YFB1903100), Project (No. 72304167) of the National Natural Science Foundation of China, and China’s Long-term Emission Pathways Model Software and Data project supported by the Chinese Academy of Engineering.

Data Availability Statement

The original contributions presented in this study are included in the article/supplementary material. Further inquiries can be directed to the corresponding author.

Conflicts of Interest

Author Xiaoguang Liu was employed by China National Nuclear Corporation. The remaining authors declare that the research was conducted in the absence of any commercial or financial relationships that could be construed as a potential conflict of interest.

References

  1. Meinshausen, M.; Lewis, J.; McGlade, C.; Gütschow, J.; Nicholls, Z.; Burdon, R.; Cozzi, L.; Hackmann, B. Realization of Paris Agreement pledges may limit warming just below 2  °C. Nature 2022, 604, 304–309. [Google Scholar] [CrossRef] [PubMed]
  2. Yu, H.; Wen, B.; Zahidi, I.; Chow, M.F.; Liang, D.; Madsen, D.Ø. The critical role of energy transition in addressing climate change at COP28. Results Eng. 2024, 22, 102324. [Google Scholar] [CrossRef]
  3. UNFCCC. 1/CMA.5 Outcome of the First Global Stocktake; United Nations Framework Convention on Climate Change: Bonn, Germany, 2024; Available online: https://unfccc.int/documents/637073 (accessed on 13 March 2025).
  4. Liu, L.; Guo, H.; Dai, L.; Liu, M.; Xiao, Y.; Cong, T.; Gu, H. The role of nuclear energy in the carbon neutrality goal. Prog. Nucl. Energy 2023, 162, 104772. [Google Scholar] [CrossRef]
  5. Wang, Q.; Guo, J.; Li, R.; Jiang, X.-t. Exploring the role of nuclear energy in the energy transition: A comparative perspective of the effects of coal, oil, natural gas, renewable energy, and nuclear power on economic growth and carbon emissions. Environ. Res. 2023, 221, 115290. [Google Scholar] [CrossRef]
  6. IAEA. The Potential Role of Nuclear Energy in National Climate Change Mitigation Strategies; International Atomic Energy Agency: Vienna, Austria, 2021; Available online: https://www.iaea.org/publications/15001/the-potential-role-of-nuclear-energy-in-national-climate-change-mitigation-strategies (accessed on 13 March 2025).
  7. UNECE. Carbon Neutrality in the UNECE Region: Integrated Life-Cycle Assessment of Electricity Sources; United Nations Economic Commission for Europe: Batumi, Georgia, 2022; Available online: https://www.un-ilibrary.org/content/books/9789210014854 (accessed on 13 March 2025).
  8. IEA. Nuclear Power and Secure Energy Transitions; International Energy Agency: Paris, France, 2022; Available online: https://www.iea.org/reports/nuclear-power-and-secure-energy-transitions (accessed on 13 March 2025).
  9. Azam, A.; Rafiq, M.; Shafique, M.; Yuan, J. Does nuclear or renewable energy consumption help to control environmental pollution? New evidence from China. Renew. Energy Focus 2021, 39, 139–147. [Google Scholar] [CrossRef]
  10. Zhou, Y. Why is China going nuclear? Energy Policy 2010, 38, 3755–3762. [Google Scholar] [CrossRef]
  11. Zhou, Y. China’s spent nuclear fuel management: Current practices and future strategies. Energy Policy 2011, 39, 4360–4369. [Google Scholar] [CrossRef]
  12. Wang, T.; Teng, F. Damage function uncertainty increases the social cost of methane and nitrous oxide. Nat. Clim. Change 2023, 13, 1258–1265. [Google Scholar] [CrossRef]
  13. Alonso, G. Economic Competitiveness of Small Modular Reactors in a Net Zero Policy. Energies 2025, 18, 922. [Google Scholar] [CrossRef]
  14. Yang, H.; Huang, X.; Hu, J.; Thompson, J.R.; Flower, R.J. Achievements, challenges and global implications of China’s carbon neutral pledge. Front. Environ. Sci. Eng. 2022, 16, 111. [Google Scholar] [CrossRef]
  15. Yu, S.; Fu, S.; Behrendt, J.; Chai, Q.; Chen, L.; Chen, W.; Cheng, X.; Clarke, L.; Du, X.; Guo, F. Synthesis Report 2022 on China’s Carbon Neutrality: Electrification in China’s Carbon Neutrality Pathways; Energy Foundation China: Beijing, China, 2022; Available online: https://www.efchina.org/Reports-en/report-snp-20221104-en (accessed on 13 March 2025).
  16. Luo, S.; Hu, W.; Liu, W.; Zhang, Z.; Bai, C.; Huang, Q.; Chen, Z. Study on the decarbonization in China’s power sector under the background of carbon neutrality by 2060. Renew. Sustain. Energy Rev. 2022, 166, 112618. [Google Scholar] [CrossRef]
  17. Jiang, H.-D.; Pradhan, B.K.; Dong, K.; Yu, Y.-Y.; Liang, Q.-M. An economy-wide impacts of multiple mitigation pathways toward carbon neutrality in China: A CGE-based analysis. Energy Econ. 2024, 129, 107220. [Google Scholar] [CrossRef]
  18. Liu, S.; Jiang, Y.; Yu, S.; Tan, W.; Zhang, T.; Lin, Z. Electric power supply structure transformation model of China for peaking carbon dioxide emissions and achieving carbon neutrality. Energy Rep. 2022, 8, 541–548. [Google Scholar] [CrossRef]
  19. Gabriel, S.; Baschwitz, A.; Mathonnière, G.; Eleouet, T.; Fizaine, F. A critical assessment of global uranium resources, including uranium in phosphate rocks, and the possible impact of uranium shortages on nuclear power fleets. Ann. Nucl. Energy 2013, 58, 213–220. [Google Scholar] [CrossRef]
  20. Cuney, M. Evolution of uranium fractionation processes through time: Driving the secular variation of uranium deposit types. Econ. Geol. 2010, 105, 553–569. [Google Scholar] [CrossRef]
  21. NEA/IAEA. Uranium 2022: Resources, Production and Demand; Nuclear Energy Agency and International Atomic Energy Agency: Vienna, Austria, 2023. [Google Scholar] [CrossRef]
  22. DIIS. Governing Uranium in Canada: The world’s largest all-time uranium producer; Danish Institute for International Studies: København, Denmark, 2016; Available online: https://www.diis.dk/en/research/governing-uranium-in-canada-the-worlds-largest-all-time-uranium-producer (accessed on 13 March 2025).
  23. Islam, M.M.; Shahbaz, M.; Samargandi, N. The nexus between Russian uranium exports and US nuclear-energy consumption: Do the spillover effects of geopolitical risks matter? Energy 2024, 293, 130481. [Google Scholar] [CrossRef]
  24. Wang, T.; Tao, B.; Zuo, B.; Yan, G.; Liu, S.; Wang, R.; Zhao, Z.; Chu, F.; Li, Z.; Yamauchi, Y. Challenges and Opportunities of Uranium Extraction From Seawater: A Systematic Roadmap From Laboratory to Industry. Small Methods 2024, 2401598. [Google Scholar] [CrossRef]
  25. Zhu, W.; Li, X.; Wang, D.; Fu, F.; Liang, Y. Advanced Photocatalytic Uranium Extraction Strategies: Progress, Challenges, and Prospects. Nanomaterials 2023, 13, 2005. [Google Scholar] [CrossRef]
  26. Shannak, S.d.; Cochrane, L.; Bobarykina, D. Global uranium market dynamics: Analysis and future implications. Int. J. Sustain. Energy 2025, 44, 2457376. [Google Scholar] [CrossRef]
  27. Mirkhusanov, U.T.; Semenova, D.Y.; Kharitonov, V.V. Forecasting the cost and volume of uranium mining for different world nuclear energy development scenarios. Nucl. Energy Technol. 2024, 10, 131–137. [Google Scholar] [CrossRef]
  28. Chen, Y.; Martin, G.; Chabert, C.; Eschbach, R.; He, H.; Ye, G.-a. Prospects in China for nuclear development up to 2050. Prog. Nucl. Energy 2018, 103, 81–90. [Google Scholar] [CrossRef]
  29. Xing, W.; Wang, A.; Yan, Q.; Chen, S. A study of China’s uranium resources security issues: Based on analysis of China’s nuclear power development trend. Ann. Nucl. Energy 2017, 110, 1156–1164. [Google Scholar] [CrossRef]
  30. Zhang, J.-p.; Liu, Z.-r.; Wang, L. Uranium demand and economic analysis of different nuclear fuel cycles in China. Energy Strategy Rev. 2016, 9, 50–61. [Google Scholar] [CrossRef]
  31. Guang, Y.; Wenjie, H. The status quo of China’s nuclear power and the uranium gap solution. Energy Policy 2010, 38, 966–975. [Google Scholar] [CrossRef]
  32. Fiori, F.; Zhou, Z. Sustainability of the Chinese nuclear expansion: Natural uranium resources availability, Pu cycle, fuel utilization efficiency and spent fuel management. Ann. Nucl. Energy 2015, 83, 246–257. [Google Scholar] [CrossRef]
  33. Wang, T.; Lu, Y.; Teng, F.; Zhang, X.; Zhang, X.; Wei, M.; Wu, T.; Wang, D.; Sun, J.; Zhong, J. Coupling natural-social models can better quantify the interactions in achieving carbon neutrality in China. Environ. Res. Lett. 2025, 20, 024026. [Google Scholar] [CrossRef]
  34. Xiao, X.-J.; Jiang, K.-J. China’s nuclear power under the global 1.5 °C target: Preliminary feasibility study and prospects. Adv. Clim. Change Res. 2018, 9, 138–143. [Google Scholar] [CrossRef]
  35. Yu, S.; Yarlagadda, B.; Siegel, J.E.; Zhou, S.; Kim, S. The role of nuclear in China’s energy future: Insights from integrated assessment. Energy Policy 2020, 139, 111344. [Google Scholar] [CrossRef]
  36. Zhang, T.; Ma, Y.; Li, A. Scenario analysis and assessment of China’s nuclear power policy based on the Paris Agreement: A dynamic CGE model. Energy 2021, 228, 120541. [Google Scholar] [CrossRef]
  37. Huang, X.; Chang, S.; Zheng, D.; Zhang, X. The role of BECCS in deep decarbonization of China’s economy: A computable general equilibrium analysis. Energy Econ. 2020, 92, 104968. [Google Scholar] [CrossRef]
  38. Qi, T.; Winchester, N.; Karplus, V.J.; Zhang, D.; Zhang, X. An analysis of China’s climate policy using the China-in-Global Energy Model. Econ. Model. 2016, 52, 650–660. [Google Scholar] [CrossRef]
  39. Wang, T.; Teng, F.; Zhang, X. Assessing global and national economic losses from climate change: A study based on CGEM-IAM in China. Clim. Change Econ. 2020, 11, 2041003. [Google Scholar] [CrossRef]
  40. Aguiar, A.; Chepeliev, M.; Corong, E.; van der Mensbrugghe, D. The Global Trade Analysis Project (GTAP) Data Base: Version 11. J. Glob. Econ. Anal. 2023, 7, 1–37. [Google Scholar] [CrossRef]
  41. Hotelling, H. The Economics of Exhaustible Resources. J. Pol. Econ. 1931, 39, 137–175. [Google Scholar] [CrossRef]
  42. Livernois, J. On the Empirical Significance of the Hotelling Rule. Rev. Environ. Econ. Policy 2009, 3, 22–41. [Google Scholar] [CrossRef]
  43. Simoes, A.J.G.; Hidalgo, C.A. The Economic Complexity Observatory: An Analytical Tool for Understanding the Dynamics of Economic Development. Scalable Integr. Anal. Vis. 2011, 11, 1–4. [Google Scholar]
  44. Stanisz, P.; Oettingen, M.; Cetnar, J. Monte Carlo modeling of Lead-Cooled Fast Reactor in adiabatic equilibrium state. Nucl. Eng. Des. 2016, 301, 341–352. [Google Scholar] [CrossRef]
  45. Oettingen, M. Modelling of the reactor cycle cost for thorium-fuelled PWR and environmental aspects of a nuclear fuel cycle. Geol. Geophys. Environ. 2019, 45, 207. [Google Scholar] [CrossRef]
  46. Abderrahim, H.A.; Giot, M. The Accelerator Driven Systems, a 21st Century Option for Closing Nuclear Fuel Cycles and Transmuting Minor Actinides. Sustainability 2021, 13, 12643. [Google Scholar] [CrossRef]
  47. Xie, Y.; Liu, Z.; Geng, Y.; Li, H.; Wang, N.; Song, Y.; Wang, X.; Chen, J.; Wang, J.; Ma, S. Uranium extraction from seawater: Material design, emerging technologies and marine engineering. Chem. Soc. Rev. 2023, 52, 97–162. [Google Scholar] [CrossRef]
  48. Wakabayashi, T. Concept of a fast breeder reactor to transmute MAs and LLFPs. Sci. Rep. 2021, 11, 22443. [Google Scholar] [CrossRef] [PubMed]
  49. NBS. China Statistical Yearbook. National Bureau of Statistics of China. 2023. Available online: https://www.stats.gov.cn/sj/ndsj/2023/indexeh.htm (accessed on 13 March 2025).
  50. NBS. China Energy Statistical Yearbook. National Bureau of Statistics. 2023. Available online: https://www.chinayearbooks.com/tags/china-energy-statistical-yearbook (accessed on 13 March 2025).
  51. WNA. The Nuclear Fuel Report: Global Scenarios for Demand and Supply Availability 2023–2040. World Nuclear Association. 2024. Available online: https://world-nuclear.org/shop/products/the-nuclear-fuel-report-global-scenarios-for (accessed on 13 March 2025).
Figure 1. Structure of the production function for the power sector in the C-GEM model.
Energies 18 01507 g001
Figure 2. Changes in China’s power production structure and carbon emissions under the MR-MU scenario (2020–2060). (a) Electricity production volumes from various sources in China from 2020 to 2060 under the MR-MU scenario. (b) Changes in CO₂ emissions from the power generation sector (in red) and all fossil fuel consumption-related emissions (in blue) in China from 2020 to 2060.
Energies 18 01507 g002
Figure 3. Nuclear power generation and its share in total electricity generation in different scenarios from 2020 to 2060. (a) Variation of nuclear power generation in China under different scenarios. (b) Changes in the proportion of nuclear power in China’s total electricity generation.
Energies 18 01507 g003
Figure 4. Cumulative uranium consumption and reserves under different uranium resource and utilization rate scenarios from 2020 to 2060.
Energies 18 01507 g004
Figure 5. Forecasted carbon prices under different uranium resource and utilization scenarios in 2060.
Energies 18 01507 g005
Figure 6. Relative trends in nuclear power prices and gross domestic product (GDP) across different scenarios (2020–2060). (a) Percentage change in nuclear power prices relative to HR-HU (high-resource and high-utilization rate) scenario from 2020 to 2060. (b) Percentage change in China’s GDP relative to HR-HU scenario across different scenarios.
Energies 18 01507 g006
Table 1. Sensitivity analysis of critical parameters in C-GEM modeling.
Substitution Elasticity Between Uranium Resources and Other InputsMarkup Cost of Nuclear Electricity
Change from 0 to 0.1Increase by 10%Decrease by 10%
Nuc. Gen.Nuc. Elec. PriceCO2 PriceNuc. Gen. Nuc. Elec. PriceCO2 PriceNuc. Gen.Nuc. Elec. PriceCO2 Price
HR-HU12.9%−2.6%−0.3%−8.8%0.3%2.6%10.2%−0.1%−2.1%
HR-MU12.9%−2.8%−0.4%−8.5%0.3%2.7%9.7%−0.1%−2.2%
HR-LU12.9%−3.0%−0.4%−8.2%0.3%2.6%9.4%−0.2%−2.3%
MR-HU13.3%−3.2%−0.5%−8.2%0.3%2.5%9.3%−0.3%−2.5%
MR-MU13.1%−3.5%−0.6%−7.5%0.2%2.3%8.3%−0.2%−2.3%
MR-LU12.9%−3.4%−0.6%−7.0%0.2%2.1%7.6%−0.2%−2.1%
LR-HU12.2%−3.1%−0.5%−5.8%0.1%1.6%5.4%−0.1%−1.4%
LR-MU8.5%−2.0%−0.3%−3.9%0.1%1.0%2.8%0.0%−0.7%
LR-LU5.0%−1.2%−0.2%−2.5%0.0%0.6%0.9%0.0%−0.2%
Disclaimer/Publisher’s Note: The statements, opinions and data contained in all publications are solely those of the individual author(s) and contributor(s) and not of MDPI and/or the editor(s). MDPI and/or the editor(s) disclaim responsibility for any injury to people or property resulting from any ideas, methods, instructions or products referred to in the content.

