Abstract
Injecting liquid into the formation has an impact on the microstructure of the reservoir and formation fluids, and negative effects often lead to the failure of oil well stimulation measures to achieve the expected results. It is crucial to clarify the reasons for the decrease in the injection capability of low-permeability reservoirs in China and the mechanisms of the impact of on-site injection water quality. This study first conducted injection experiments with different water qualities. To study the micro factors that cause damage, clay mineral X-ray diffraction (XRD) analysis, high-pressure mercury injection experiments before and after damage, nuclear magnetic resonance (NMR) during the damage process, scanning electron microscopy (SEM) after damage, and energy dispersive spectroscopy elemental spectrum analysis (EDS) of incompatible sediment were carried out on the experimental core. In injection experiments with different water qualities, the permeability decreased by up to 65.35% when the injection volume reached 60 PV. The main causes of the decrease in injection capability are poor reservoir porosity and permeability and formation particle blockage. The particles mainly come from suspended particles, emulsified oil, migration of formation particles, and sediment formed by the injected water. This paper also proposes a reference for water quality index optimization in similar reservoirs. The new water quality index reduced permeability damage by at least 3.22%.
1. Introduction
Waterflooding is a common development method for low-permeability reservoirs, which can supplement formation energy and sustain a certain formation pressure. Waterflooding is an important technical measure for ensuring long-term high and stable production of oil wells. However, in field cases, there are often situations of high pressure and insufficient injection into the water injection well, which reduces the water absorption capacity of the reservoir and significantly reduces water injection benefits. Figure 1 shows the increase in the injection pressure of a problem well in an actual reservoir in China. The injection pressure of the well for produced water is higher than that of the injection well for clean water. Figure 2 shows the situation in which a decrease in injection capability occurs after a period of time in the produced water injection well. The injection volume of the produced water injection well decreases in the later stage.
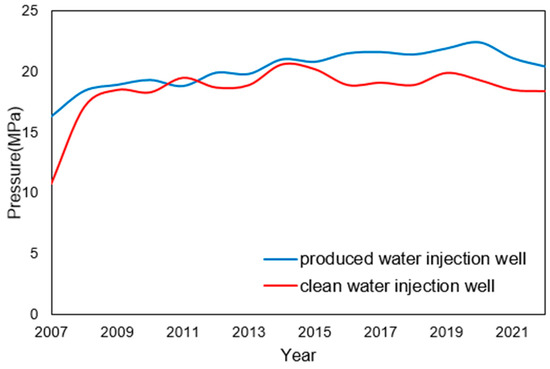
Figure 1.
Water injection pressure of different injection media.
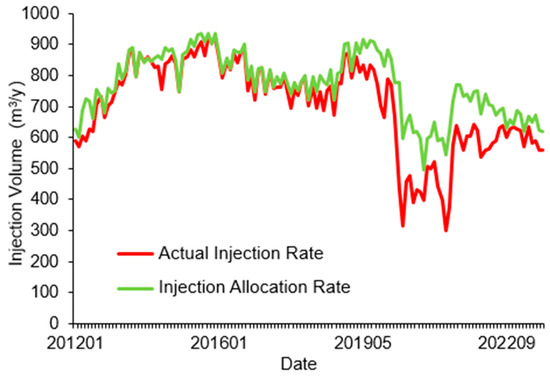
Figure 2.
Injection volume variation curve of a water injection well.
In recent years, more and more low-permeability petroleum resources have been found, and efficiently developing low-permeability reservoirs is particularly crucial in China. Waterflooding is a commonly used method for developing low-permeability reservoirs worldwide. During the process of waterflooding, the substandard quality of the injected water can cause certain damage to the formation, especially reservoirs with small pore throats, low permeability, strong heterogeneity, high clay mineral content, and strong sensitivity. The reaction between injected water and rock also seriously affects waterflooding.
Research on the mechanism of reservoir damage in waterflooding began early worldwide, with a large number of scholars conducting research based on water injection damage theory, experiments, and actual on-site conditions [1,2,3,4,5,6]. Drilling fluid filtration causes formation damage during the drilling process, and led to the derivation of the famous “1/3 to 1/7” filtration law [7]. Li et al. elaborated on a technical approach for evaluating water quality indicators based on the mechanism of formation damage and proposed a decision-making method for ensuring the compatibility of injection water quality standards [8]. Qin, in his analysis of the mechanism of formation damage caused by solid particles, found differences in the degree of solid particle invasion into rocks and the type of rock damage [9]. Jiang et al. conducted extensive indoor experiments to study the influence of solid particles. Their study pointed out that the decrease in permeability is the result of the combined effect of solid particle content and particle size [10]. Wang et al. conducted indoor experimental research and found that the invasion process of emulsified oil is different from that of particles. During the invasion process of emulsified oil, the main factors affecting blockage are core permeability and emulsified oil droplet concentration, while the influence of emulsified oil droplet particle size is not significant [11]. Oluyemi conducted indoor artificial fractured core flow experiments to study the mechanism of bottom-layer damage caused by reduced reservoir pressure during the production of fractured reservoirs [12]. The longer the water injection pipeline works, the more serious the corrosion and scaling problems become. The corrosive substances and scale layers formed on the pipe wall are washed off, polluting the injection water [13]. Aminzadeh et al. evaluated recovery mechanisms using phase behavior testing, contact angle measurement, and wetting index measurement and studied the effect of using low-salinity and divalent altered brines on oil recovery [14]. Cardenas et al. reviewed historical data, characterized injected water, assessed encrusting tendencies, and analyzed the impact of high injection rates. And physicochemical and infrared spectroscopy were used to identify clayey solids and iron oxides in the injection water that caused damage [15]. Al-Shabibi et al. conducted water analysis, scale modeling, formation damage simulation, and core flooding experiments to identify the root causes behind injectivity decline in a sandstone reservoir in Oman. XRD analysis was used in this article, and the analysis of the reservoir core samples revealed that fines and expansive clays are the main components. The formation damage simulator showed that fine migration and clay swelling are the two main possible formation damage mechanisms [16]. Using SEM, Al Moagil et al. analyzed the precipitation generated during the injection process of produced water and proposed that the degree of reservoir damage is a function of oil/solid content, solid particle size, and scaling/precipitation potential [17].
Based on experiments, many scholars have conducted research by combining simulation models [18,19,20,21,22,23,24,25,26,27,28,29,30,31,32,33,34,35,36]. Rege and Fogler conducted a simulation study on the influence of suspended particles on formation parameters [28]. Gruesbeek and Collins considered clay swelling and external particle invasion, established a permeability damage model for particle generation, migration, and retention, and analyzed the problem of reservoir blockage [29]. Civan established a reservoir damage model that described the reaction process between rocks and fluids, including particle transport, and the physicochemical and geochemical reactions between invading fluids and rocks [30]. Ju et al. conducted a study on clay swelling and particle transport in elastic porous media using mathematical simulation methods [31]. By analyzing the model established by their predecessors and using a curve fitting method, Mojarad and Settari combined the deep filtration model with a velocity-based damage model to obtain the degree of reservoir damage, thereby improving the operability of the model [32]. Wu et al. combined the water quality adaptation coefficient with the calculation method of development indicators for water injection reservoirs and quantitatively analyzed the impact of different water qualities on the waterflooding effect [33]. Moghadasi adopted overall mass balance, considered heterogeneity to develop a model for particle intrusion and permeability changes, and used ANSYS software to simulate the changes in core pores during water injection at the same time [34]. Borazjani et al. established a two-phase axisymmetric flow semi-analytical model for the damage caused by injected water salinity and suspended particles to reservoir permeability. This semi-analytical model can predict the value of skin factor during water injection, as well as the impact of injection rate, crude oil viscosity, relative permeability, and kaolin content in clay minerals on water absorption capacity [35]. Liu et al. obtained a quantitative evaluation method for the formation damage caused by particle retention based on the axisymmetric suspended flow model of Langmuir blockage [36]. They studied the effects of the total amount of suspended solids in injected water, injection velocity, initial filtration coefficient, and maximum formation retention capacity on the radius and duration of the damage zone. The conclusions of these studies provide the root and guidance for the analysis of damage mechanisms in this article.
Some scholars have also studied and evaluated the reservoir damage caused by the injection process by analyzing and deriving equations [37,38,39,40]. Waterflooding, as the main development method, often causes varying degrees of reservoir damage, reducing reservoir permeability, followed by insufficient injection, which affects the production of the reservoir. Previous studies on water injection damage have mostly focused on macroscopic manifestations of waterflooding development, such as the effects of water flooding and enhanced oil recovery. There has been relatively little research on the intuitive damage changes of formation cores from a microscopic perspective. This article selects ultra-low-permeability cores that are representative of reservoirs and compares them before and after damage to the same core. Through microscopic experiments, the damage caused by water injection process is analyzed, providing a basis for studying the optimization of water quality in ultra-low-permeability reservoirs. Currently, there is no unified standard for the water quality of reservoir injection in different regions and countries. Some scholars have developed appropriate water quality standards based on their own reservoirs to adapt to local conditions [18]. The article concludes by providing a convenient method for obtaining on-site water quality indices based on short core experiments.
2. Experimental Method
In this study, the experimental core was divided into two parts, one for different water quality displacement experiments and the other for undamaged samples. Micro-analysis experiments were conducted on damaged and undamaged samples, including XRD analysis of clay minerals, high-pressure mercury injection experiments before and after damage, NMR analysis during the damage process, SEM analysis after damage, and EDS analysis of incompatible sediments. The key factors of insufficient injection were fundamentally analyzed, and water quality indices suitable for low-permeability reservoir water injection were proposed through comprehensive univariate damage experiments.
2.1. Water Quality Displacement Damage Experiments
The experiment cut the initial core extracted from the field case into two parts, A and B. To study the degree of damage caused by different water qualities to the corresponding reservoirs, different water quality injection damage experiments were carried out on the A part. These experiments were conducted based on geological conditions, with a temperature of 55.3 °C, injection pressure of 8 MPa, and confining pressure of 15 MPa. The experimental equipment mainly includes a constant flow pump, intermediate container, pressure gauge, short core holder, etc. The experimental core was taken from field cases. The different water qualities used in the experiment included clear water (from local wells), IP water (from integrated processors), and PS water (from three-phase separators). The displacement experimental equipment and schematic diagram are shown in Figure 3 and Figure 4. The cores below the core holder in Figure 4 show the formation core before and after the displacement experiment. The specific parameters of the core and the specific parameters of the injected water are shown in Table 1, Table 2 and Table 3.
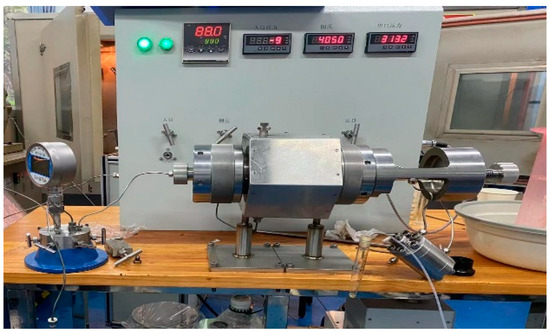
Figure 3.
Short core displacement experimental device.
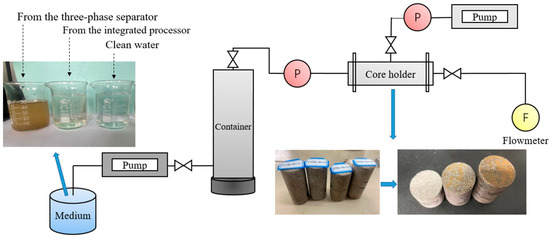
Figure 4.
Process of displacement experiment.

Table 1.
Basic parameters of cores.
Table 2.
Water quality of different displacement liquids.
Table 3.
Ion content of different displacement liquids.
2.2. Microstructure Comparison Experiments
A series of microstructure comparison experiments were carried out on the damaged core (A part) and the undamaged core (B part). Firstly, the clay mineral X-ray diffraction was conducted to analyze the clay mineral composition of the target block core. High-pressure mercury injection and NMR were performed on the cores before and after injury to analyze the changes in the pore throat of the cores under different water quality displacements. Subsequently, SEM and EDS were used to observe the factors causing blockage in the throat and to determine the composition of the blockage material. The main controlling factors causing core blockage were comprehensively analyzed.
Finally, single-factor injection damage experiments were conducted on artificial cores with different permeability levels to determine the relationship between permeability, injection medium, and extent of damage and to make injection water quality selection charts for different permeability levels. Figure 5 illustrates the experimental approach and methodology of the entire study.
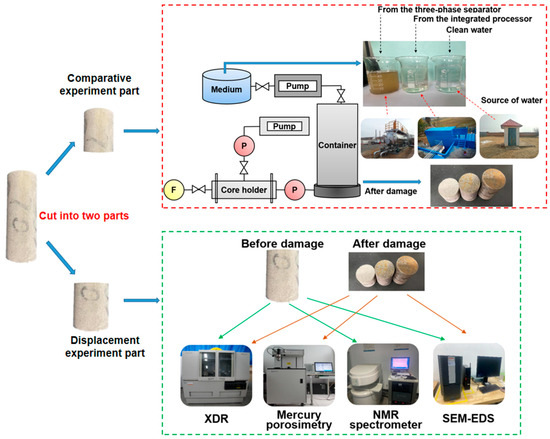
Figure 5.
Schematic diagram of the experimental method and process.
3. Results and Discussion
3.1. Analysis of Damage Caused by Different Media
The damage curves of the different water qualities are shown in Figure 6. The article defines the ratio of the decrease in permeability to the initial value as the permeability damage degree. In the core displacement experiment, the three types of injected water had similar damage rates in the initial stage of injection, but as the injection ratio increased, the permeability decreased to varying degrees. After the injection of clean water, the permeability of the core decreases slowly, and the accumulated damage degree reaches 20.11% after the injection of 60 PV. In field cases, it is often believed that damage occurs when the permeability decreases by more than 20%, so the damage caused by clean water can be considered relatively low. In addition, the damage caused by the IP water injection process also accumulates relatively slowly. After the injection of 60 PV, the permeability damage reached 35.48%, which is 15.37% higher than the damage caused by clean water. The damage speed of the first 20 PV, caused by the PS water, is almost similar to that of the first two types of water, and even lower than that of the IP water. After exceeding 10 PV, the damage rate accelerates, and the degree of damage increases rapidly. After the injection of 60 PV, it gradually stabilizes and remains at around 65.35%, which is far higher than the damage level of clean water and IP water.
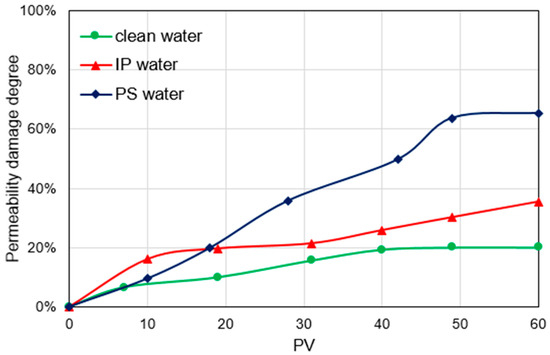
Figure 6.
Permeability damage curve of injected water.
3.2. XRD
According to the XRD results (Table 4), the experimental core contains some clay minerals, mainly including illite, kaolinite, and chlorite. Among them, the core is injected with clean water and the IP water contains more chlorite, ranging from 40% to 50%. The core injected with the PS water contains more kaolinite, reaching 59%. When the pH value of the injected water is low or acid extraction is adopted, Fe2+, Fe3+, and Al3+ in chlorite are released and mixed in the formation water. Under oxidation conditions, Fe2+ is oxidized to Fe3+. As chlorite and other minerals are dissolved by acid, the H+ concentration decreases. When the pH value is greater than 2.2, Fe3+ and Al3+ undergo reactions to generate precipitates such as Fe(OH)3 and Al(OH)3, which block the pore throat and cause a decrease in permeability.
Table 4.
Experimental core clay mineral and mixed-layer content.
Kaolinite mainly leads to the generation of velocity sensitivity [16], and the presence of both limits the extraction methods of high injection pressure and acidification, but there is almost no montmorillonite and mixed layer, so water sensitivity could be ignored.
3.3. High-Pressure Mercury Intrusion Test
A high-pressure mercury intrusion test was conducted on each core before and after damage, and under the displacement of injected water with different water qualities, the micro-pore structure of the core showed varying degrees of damage. The results of the partial mercury intrusion experiment are shown in Figure 7, Figure 8 and Figure 9 and Table 5. The proportion of the peak of the pore throat distribution and permeability distribution both decrease, and as the water quality worsens, the degree of peak reduction increases. After clean water damage, the peak values of the core pore throat (PCPT) and that of permeability distribution (PPD) decreased. The PCPT and PPD decreased by 19.58% and 10.21%, respectively, due to clean water damage. The PCPT and PPD decreased by 32.89% and 21.95%, respectively, due to IP water damage, indicating blockage in the pore throat. And the PCPT and PPD decreased by 9.72% and 10.35%, respectively, due to PS water damage. Through research, it can be found that large-sized suspended solids cannot enter the pore throat, which makes the blockage of the throat caused by PS water with poorer water quality even smaller [7]. The increase in sorting coefficient and the change in homogeneity coefficient before and after core damage indicate a decrease in the uniformity of core particle size, blockage of internal particle accumulation, and changes in the distribution of pores, which affect the original pore structure of the core [12]. At the same time, the average radius decreases because of the blockage, and large pores are occupied and divided, which results in an increase in the proportion of fluid flow in small pores. This also explains the increased contribution of permeability from small pores in some cores before and after water quality damage.
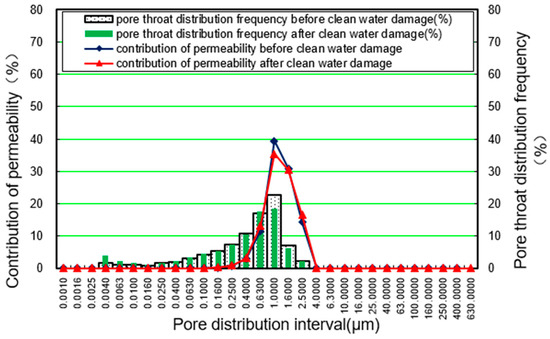
Figure 7.
Analysis curve of mercury intrusion test before and after clean water damage.
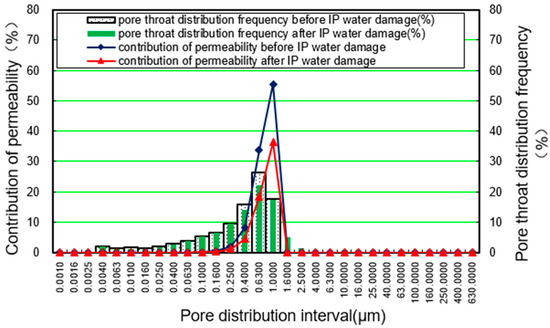
Figure 8.
Analysis curve of mercury intrusion test before and after IP water damage.
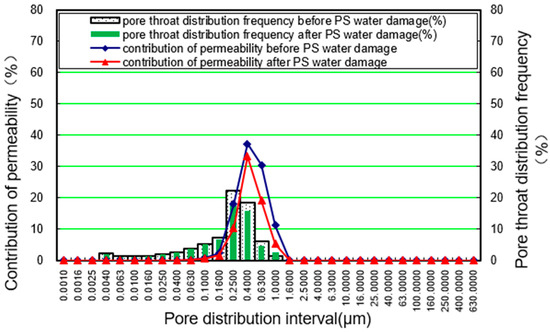
Figure 9.
Analysis curve of mercury intrusion test before and after PS water damage.
Table 5.
Mercury intrusion data before and after the displacement experiment.
3.4. Nuclear Magnetic Resonance Experiment
The NMR results are shown in Figure 10, Figure 11 and Figure 12. The NMR T2 spectrums show that the decrease in water flow rate is due to blockage of different pore throats, and the signal amplitude of the H element reaction in the T2 spectrum is reduced, indicating that the damage to the core is caused by the blockage of the micro-pore throat during the displacement process.
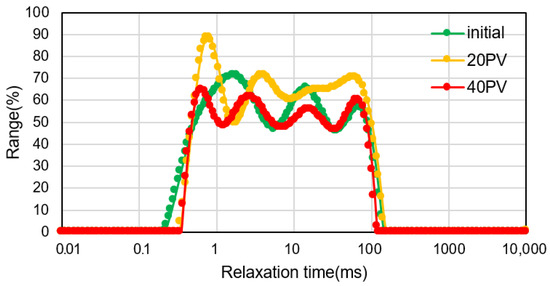
Figure 10.
NMR T2 spectrum of the clean water displacement.
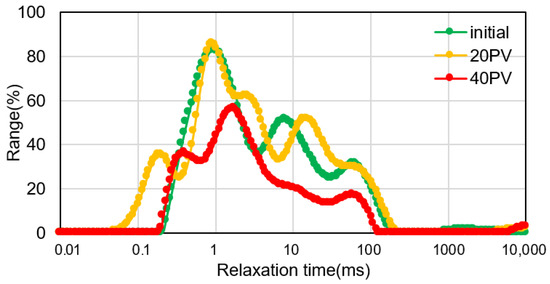
Figure 11.
NMR T2 spectrum of the IP water displacement.
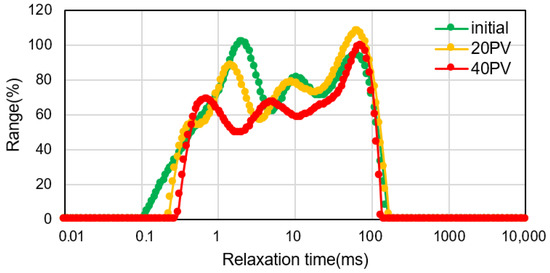
Figure 12.
NMR T2 spectrum of the PS water displacement.
In summary, it is obvious that the main reason for the damage is the blockage of the pore throat at the microscopic scale. At the same time, the sensitivity damage caused by the small amount of clay minerals in the rock can be ignored. This damage occurs during the continuous water injection displacement process and is irreversible. The extent of damage increases with the displacement and gradually stabilizes at higher levels of damage. This is also the main damage mechanism in the near-wellbore zone.
3.5. SEM and EDS
In order to clarify the main components causing blockages, the author conducted SEM on the injection port cross-sections of the cores and EDS on the sediment after mixing the original formation water and different injection water.
The injection of clean water causes little damage, so we focus on the SEM analysis of the core after the damage of the IP water and the PS water (Figure 13). It can be seen that suspended particles accumulate on and block the surface of the rock, and the pore throat gaps are continuously compressed, dividing large pores into smaller pores (Figure 13a,d). This kind of damage is limited and only occurs when the suspended particle size is close to or larger than the roar throat. Large-sized suspended particles, mainly occurring at the injection port (i.e., near the wellbore area), cannot enter the core and the throat. And when smaller suspended particles penetrate deep into the core or formation, they block the main throat (Figure 13c). From the results, it can be observed that a portion of the suspended matter comes from injected water and the other comes from the rock itself. After extensive erosion of injected water, the water will drive and destroy the rock from the original throat surface, resulting in suspended debris. Therefore, the true concentration of suspended matter that causes damage to the core should be higher than the concentration of suspended matter measured in the injected water.
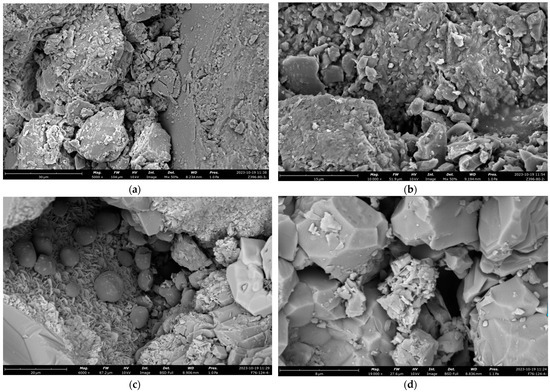
Figure 13.
SEM image of injection end after core damage. (a,b) Core face after IP water flooding replacement. (c,d) Core face after PS water flooding replacement.
On the surface of the core, some secondary structures similar to cementation can be seen (Figure 13b). EDS results show that the main component of these substances is carbon, which is basically emulsified oil residue. Emulsified oil from the injected water can easily lead to adsorption and the Jamin effect in core pores [17]. Under a certain injection pressure, it is difficult for oil droplets to enter small pores. Due to the high viscosity of oil and the low viscosity of water, oil droplets are more likely to stay on the surface of the throat during the displacement process. The SEM images show that a large number of oil droplets gather and carry small-sized rock debris or suspended particles, exhibiting a mechanism similar to the damage caused by suspended particles.
In field cases, the incompatibility between formation water and injected water often leads to sedimentation underground, which becomes suspended solids and causes reservoir damage. The authors prepared simulated formation water with the same ion content and salinity based on on-site formation water data. The simulated formation water was mixed with three types of injection water and left for 72 h. The sediment that produced obvious precipitation was filtered and dried. EDS was conducted to analyze the elemental composition of the sediment after various ion combinations. The EDS analysis area and element composition are shown in Figure 14. The height of the red section indicates the element content of the selected area in the blue box.
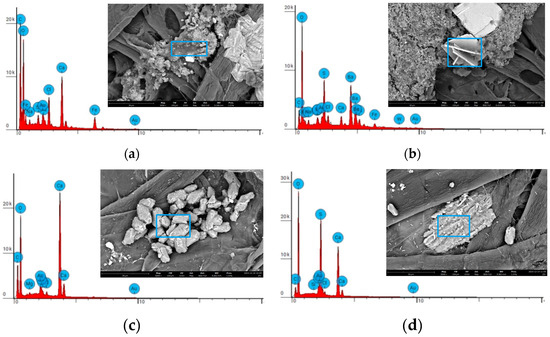
Figure 14.
SEM/EDS images of different precipitates. (a,b) Sediments generated by formation water and IP water. (c,d) Sediments generated by formation water and PS water.
The sediment mixed with the simulated formation water and the integrated outlet water of Z is mainly composed of CaCO3 and BaCO3 (Figure 14a,b), with a larger particle size of about 15 μm on average. The sediments contain a small amount of clay minerals, mainly elements such as Si and Fe. When the PS water is mixed with simulated formation water, the sediment contains a large amount of CaCO3 and CaSO4 (Figure 14c,d). Similarly, the sediment size is relatively large, and some of the sediments have complex components and are bound to organic matter.
3.6. Damage Factors
It can be seen that the main micro-controlling factor causing reservoir damage and a decrease in injection capability is formation blockage, which is directly caused by external or internal particles, rather than pore size reduction, which is caused by the sensitivity of core clay minerals. The substances that cause blockages mainly include suspended solids carried by injected water, emulsified oil, internal particle migration in rocks, and precipitation caused by a chemical reaction between injected water and formation water. The main controlling factors causing formation damage are shown in Figure 15. At the same time, it can be seen that the content and particle size of suspended solids are adjustable indicators for on-site development.
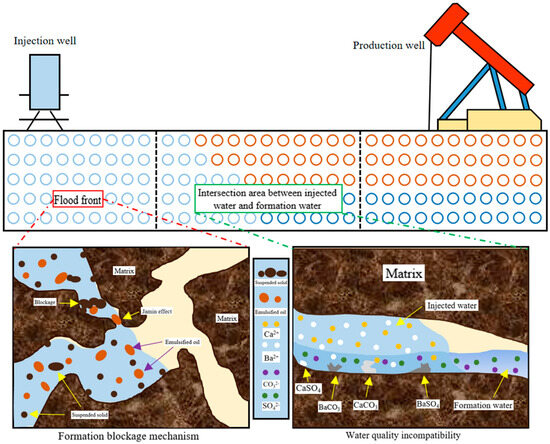
Figure 15.
Main controlling factors causing formation damage.
4. Optimization of Water Injection Index
Based on the results and mechanisms of different water quality injection damage experiments, a single-factor damage experiment was carried out. The main controlled variables were the concentration of suspended solids, median particle size, and oil content. The relationship between the degrees of damage of different factors under different permeability conditions was obtained after injecting 60 PV, as shown in Figure 16, Figure 17 and Figure 18. In field cases, damage below 30% is often deemed acceptable.
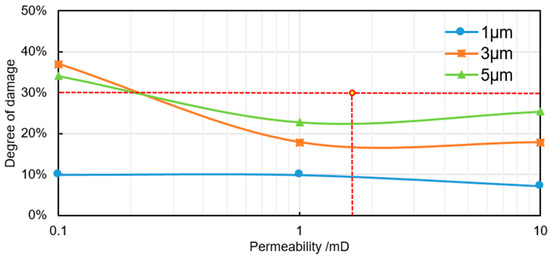
Figure 16.
The degree of permeability damage caused by different median particle sizes.
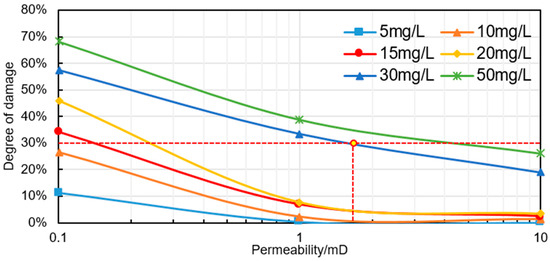
Figure 17.
The degree of permeability damage caused by different suspended solid concentrations.
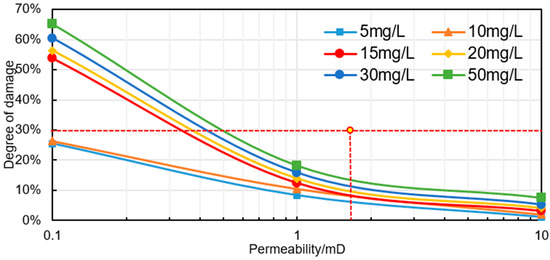
Figure 18.
The degree of permeability damage caused by varying oil content.
The intersection point of the horizontal and vertical axis extension lines can be used to determine the water quality standards under a certain permeability and degree of damage. Based on causing less than 30% damage, the optimized water quality standards for a 0.1 mD core are a median particle size below 1 μm, suspended solids concentration below 10 mg/L, and oil content below 10 mg/L. The optimized water quality index for a 1 mD core is a median particle size less than 3 μm, suspended solids concentration less than 30 mg/L, and oil content less than 50 mg/L. The optimized water quality index for a 10 mD core is a median particle size less than 5 μm, suspended solids concentration than 50 mg/L, and oil content less than 50 mg/L. The average permeability of the target reservoir studied in this article is 1.65 mD, and the optimized water quality index is a median particle size less than 5 μm, suspended solids concentration less than 30 mg/L, and oil content less than 50 mg/L.
To verify the reliability of the optimized water quality, the author prepared injection water based on this index, and core injection damage experiments were conducted to analyze the degree of damage. The optimized index for the experiments and core basic parameters are shown in Table 6 and Table 7.
Table 6.
Optimized water quality index.
Table 7.
Optimized index simulation injection experimental core basic parameters.
Compared with the results of three types of water injection damage experiments above (Figure 19 and Figure 20), the optimized water injection damage degree is similar to that of clean water damage. After injecting 10 PV, the damage is slightly higher than that of clean water. The suspended solids and emulsified oil contained in the optimized water have had an impact, but these effects are relatively limited. The damage is stable during the subsequent injection process, and the effect after injecting 60 PV is slightly better than that of clean water. This water quality index can effectively reduce the damage of injected water to the formation, meet the demand for injection volume under a certain injection pressure, and reduce the occurrence of a decrease in the injection capability phenomenon.
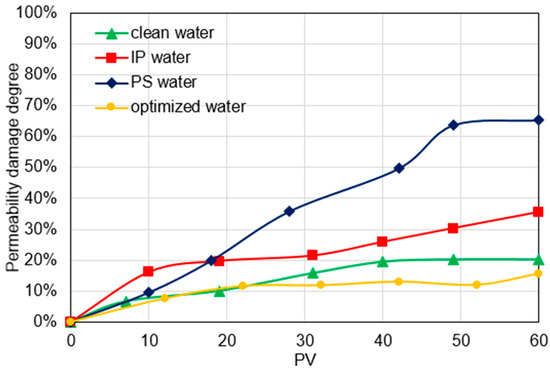
Figure 19.
Optimized water quality permeability damage degree comparison curve.
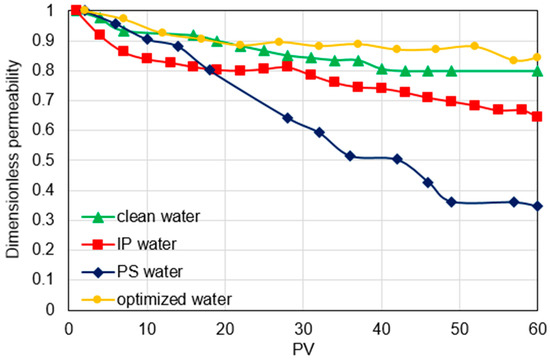
Figure 20.
Comparison curve of optimized water quality and dimensionless permeability decrease.
5. Conclusions
The main development blocks in low-permeability reservoirs have long experienced high water injection pressures and a decrease in injection capability, which has constrained the effectiveness of waterflooding:
(1) Through different water quality displacement experiments, the extent of damage to the cores caused by different water qualities was determined. As the water quality worsens, the degree of damage to the permeability of the core increases. The damage caused by clean water is the lowest, at only 29.31%. The damage caused by the outlet water of PS water is the highest, reaching 81.39%. The damage caused by the outlet water of IP water is intermediate, at 40.67%.
(2) The microstructure changes in the cores before and after the displacement experiment were analyzed and compared. Poor reservoir properties are one of the main reasons for formation blockage. There are few sensitive minerals in the reservoir rock, so the impact of sensitivity on the core is relatively small. During the displacement process, large pore throats are blocked, the contribution rate of the main pore throats decreases, and the sorting coefficient increases. Small pore throats are prone to blockage due to the migration of suspended particles, emulsified oil, damaged particles in injected water, and chemical precipitates caused by the incompatibility between injected water and formation water.
(3) A suitable water injection quality index for low-permeability reservoirs was proposed based on single-factor experimental analysis. Users can select the appropriate water quality index from the chart based on different levels of pore permeability.
Author Contributions
Conceptualization, Y.T.; methodology, Y.T.; software, M.L.; validation, T.M.; formal analysis, R.P., Y.X., T.M. and M.L.; investigation, R.P.; writing—original draft preparation, T.M.; writing—review and editing, J.Q. All authors have read and agreed to the published version of the manuscript.
Funding
This research was funded by the National Natural Science Foundation of China, grant number No. 51974268.
Data Availability Statement
The raw data supporting the conclusions of this article will be made available by the authors on request.
Conflicts of Interest
The funders had no role in the design of the study; in the collection, analyses, or interpretation of data; in the writing of the manuscript; or in the decision to publish the results.
Abbreviations
The following abbreviations are used in this manuscript:
| NMR | nuclear magnetic resonance |
| SEM | scanning electron microscopy |
| EDS | energy-dispersive spectroscopy elemental spectrum analysis experiments |
| PCPT | peak value of core pore throat |
| PPD | peak value of permeability distribution |
| PS | three-phase separator |
| IP | integrated processor |
References
- Bennion, D.B. An Overview of Formation Damage Mechanisms Causing a Reduction in the Productivity and Injectivity of Oil and Gas Producing Formations. J. Can. Pet. Technol. 2002, 41, PETSOC-02-11-DAS. [Google Scholar]
- Casey, H.; Smith, S.M. Application of flow injection analysis to water pollution studies. Trends Anal. Chem. 1985, 4, 256–258. [Google Scholar] [CrossRef]
- Di Giorgi, P. A Systematic Determination of Formation Damage Causes. In Proceedings of the SPE Latin America Petroleum Engineering Conference, Rio de Janeiro, Brazil, 14–19 October 1990. [Google Scholar]
- Gruesbeck, C.; Collins, R.E. Entrainment and Deposition of Fine Particles in Porous Media. SPE J. 1982, 22, 847–856. [Google Scholar] [CrossRef]
- Mollakhorshidi, A.; Moghadasi, J.; Arabjamaloei, R. An Experimental Study of the Effects of Salt Solutions on Formation Damage in a Water Injection Operation in Petroleum Reservoirs. Pet. Sci. Technol. 2012, 30, 2169–2184. [Google Scholar] [CrossRef]
- Qu, Z.; He, L.; Zhan, Y.; Huang, D.; Wang, B.; Li, X. Damage Judgment of Injected Water Reservoir and Unplugging Experiment in Shangsan Region. Fault-Block Oil Gas Field 2014, 210, 232–235. (In Chinese) [Google Scholar]
- Barkman, J.H.; Davidson, D.H. Measuring Water Quality and Predicting Well Impairment. J. Pet Technol. 1972, 24, 865–873. [Google Scholar] [CrossRef]
- Li, H.; Li, H.; Zhao, M. A Study on the Compatibility of Water Injection Quality Schemes for Sandstone Reservoirs. J. Southwest Pet. Inst. 1997, 03, 45–52. (In Chinese) [Google Scholar]
- Qin, J.; Peng, S. Mechanism Analysis of Formation Damage Caused by Solid Particles in Injected Water. Pet. Explor. Dev. 2001, 01, 87–88. (In Chinese) [Google Scholar]
- Jiang, J.; Wang, Y.; Li, H.; Wu, Y. Research on Water Quality Optimization Methods for Reservoir Water Injection Development. J. Southwest Pet. Inst. 2003, 03, 26–29+85. (In Chinese) [Google Scholar]
- Wang, Y.; Li, H.; Jiang, J. Research on Decision-making Methods for Water Quality Control of Oilfield Injection Water. J. Pet. 2003, 03, 68–73. (In Chinese) [Google Scholar]
- Oluyemi, G. Investigation of Depletion Induced Formation Damage Mechanisms in Fractured Reservoirs. In Proceedings of the SPE European Formation Damage Conference, Noordwijk, The Netherlands, 7–10 June 2011. [Google Scholar]
- Shan, L. Improvement of Determination Method for Suspended Matter Content in Oilfield Injection Water. Contemp. Chem. Ind. 2017, 46, 182–183. (In Chinese) [Google Scholar]
- Aminzadeh, B.; Chandrasekhar, S.; Srivastava, M.; Tang, T.; Inouye, A.; Villegas, M.; Valjak, M.; Dwarakanath, V. Impact of Brine Chemistry on Waterflood Oil Recovery: Experimental Evaluation and Recovery Mechanisms. In Proceedings of the SPE Improved Oil Recovery Conference, Virtual, 25 April 2022. [Google Scholar] [CrossRef]
- Cardenas, J.C.; Escobar, M.A.; Prada, A.; Jaimes, M.; Conde, O.R.; Galvis, H. Advancements in Evaluating Formation Damage in Water Injector Wells: A Comprehensive Methodological Approach. In Proceedings of the SPE International Conference and Exhibition on Formation Damage Control, Lafayette, LA, USA, 21–23 February 2024. [Google Scholar] [CrossRef]
- Al-Shabibi, I.; Naser, J.; Al-Maamari, R.S.; Karimi, M.; Al-Salmi, A.; Al-Qassabi, H. Water Injectivity Decline in an Omani Oil Field: Possible Causes and Mitigation. In Proceedings of the SPE Conference at Oman Petroleum & Energy Show, Muscat, Oman, 21–23 March 2022. [Google Scholar] [CrossRef]
- Al Moajil, A.; Almubarak, T.; Alotaibi, F.; Alhamad, L. Re-Injection of Produced Water: The Effect of Oil Micro-Emulsion Suspensions. In Proceedings of the Middle East Oil, Gas and Geosciences Show, Manama, Bahrain, 19–21 February 2023. [Google Scholar] [CrossRef]
- Khilar, K.C.; Fogler, H.S. Colloidally Induced Fines Migration in Porous Media. Rev. Chem. Eng. 1987, 4, 108–141. [Google Scholar] [CrossRef]
- Ohen, H.A.; Civan, F. Predicting Skin Effects Due to Formation Damage by Fines Migration. In Proceedings of the SPE Production Operations Symposium, Oklahoma City, Oklahoma, 7–9 April 1991. [Google Scholar]
- Ohen, H.A.; Civan, F. Simulation of Formation Damage in Petroleum Reservoirs. SPE Adv. Technol. Ser. 1993, 1, 27–35. [Google Scholar] [CrossRef]
- Wood, J.M.; Spark, I.S. Microbially Induced Formation Damage in Oilfield Reservoirs. In Proceedings of the SPE International Symposium on Formation Damage Control, Lafayette, Louisiana, 23–24 February 2000. [Google Scholar]
- Civan, F. Temperature Effect on Power for Particle Detachment from Pore Wall Described by an Arrhenius-Type Equation. Transp. Porous Med. 2007, 67, 329–334. [Google Scholar] [CrossRef]
- Li, Z.; Wong, R.C.K. Estimation of Suspended Particle Retention Rate and Permeability Damage in Sandstone from Back Analysis of Laboratory Injection Tests. In Proceedings of the Canadian International Petroleum Conference, Calgary, AB, Canada, 17–19 June 2008. [Google Scholar]
- Rege, S.D.; Fogler, H.S. Competition among Flow, Dissolution, and Precipitation in Porous Media. AIChE J. 1989, 35, 1177–1185. [Google Scholar] [CrossRef]
- Kalantari-Dahaghi, A.; Moghadasi, J.; Gholami, V. A New Model to Describe Particle Movement and Deposition in Porous Media. In Proceedings of the International Oil Conference and Exhibition in Mexico, Cancun, Mexico, 31 August–2 September 2006. [Google Scholar]
- Lu, J.; Wojtanowicz, A.K. Development of Injectivity Damage Due to Oily Waste Water in Linear Flow. In Proceedings of the SPE International Symposium and Exhibition on Formation Damage Control, Lafayette, LA, USA, 26–28 February 2014. [Google Scholar]
- You, Z.; Kalantariasl, A.; Schulze, K.; Storz, J.; Burmester, C.; Künckeler, S.; Bedrikovetsky, P. Injectivity Impairment During Produced Water Disposal into Low-Permeability Völkersen Aquifer (Compressibility and Reservoir Boundary Effects). In Proceedings of the SPE International Conference and Exhibition on Formation Damage Control, Lafayette, LA, USA, 26–28 February 2016. [Google Scholar]
- Rege, S.D.; Fogler, H. Network model for straining dominated particle entrapment in porous media. Chem. Eng. Sci. 1987, 42, 1553–1564. [Google Scholar] [CrossRef]
- Gruesbeck, C.; Collins, R.E. Particle Transport Through Perforations. SPE J. 1982, 22, 857–865. [Google Scholar] [CrossRef]
- Civan, F. Evaluation and Comparison of the Formation Damage Models. In Proceedings of the SPE Formation Damage Control Symposium, Lafayette, LA, USA, 26–27 February 1992. [Google Scholar]
- Ju, B.; Ma, M.; Qiu, X. Mathematical Simulation Method for Clay Swelling and Particle Transport in Elastic Porous Media. Hydrodyn. Res. Prog. (Part A) 2003, 01, 8–15. (In Chinese) [Google Scholar]
- Mojarad, R.S.; Settari, A. Multidimensional velocity-based model of formation permeability damage. J. Pet. Technol. 2005, 58, 68–69. [Google Scholar]
- Wu, F.; Li, X.; Liao, W.; Yang, Y. Study on the Influence of Water Injection Quality on the Development Indicators of Low-Permeability Reservoirs. Spec. Oil Gas Reserv. 2007, 04, 68–71+108. (In Chinese) [Google Scholar]
- Moghadasi, J. Modeling of Permeability Impairment by Invasion of Solid Suspension During Waterflooding in Heterogeneous Porous Media. In Proceedings of the SPE International Symposium and Exhibition on Formation Damage Control, Lafayette, LA, USA, 13–15 February 2008. [Google Scholar]
- Borazjani, S.; Chequer, L.; Russell, T.; Bedrikovetsky, P. Injectivity Decline During Waterflooding and PWRI due to Fines Migration. In Proceedings of the SPE International Conference and Exhibition on Formation Damage Control, Lafayette, LA, USA, 7–9 February 2018. [Google Scholar]
- Liu, H.; Xu, N.; Yuan, Z.; Chen, Z. Prediction of Formation Damage Caused by Suspend Solids from Injected Water and a Guideline for TSS Control. In Proceedings of the SPE Water Lifecycle Management Conference and Exhibition, Abu Dhabi, United Arab Emirates, 5–7 March 2024. [Google Scholar] [CrossRef]
- Wojtanowicz, A.K.; Krilov, Z.; Langlinais, J.P. Study on the Effect of Pore Blocking Mechanisms on Formation Damage. In Proceedings of the SPE Production Operations Symposium, Oklahoma City, Oklahoma, 8–10 March 1987. [Google Scholar]
- Wojtanowicz, A.K.; Krilov, Z.; Langlinais, J.P. Experimental Determination of Formation Damage Pore Blocking Mechanisms. ASME J. Energy Resour. Technol. March 1988, 110, 34–42. [Google Scholar] [CrossRef]
- Liu, X.; Civan, F. Formation Damage by Fines Migration Including Effects of Filter Cake, Pore Compressibility, and Non-Darcy Flow—A Modeling Approach to Scaling From Core to Field. In Proceedings of the SPE International Symposium on Oilfield Chemistry, San Antonio, TX, USA, 14–17 February 1995. [Google Scholar]
- Yang, X.; Wu, X.; Li, J. A Mathematical Model Study on the Damage of Solid Particles to Water Injection Wells. J. Southwest Pet. Inst. 2006, 03, 13–16. (In Chinese) [Google Scholar]
Disclaimer/Publisher’s Note: The statements, opinions and data contained in all publications are solely those of the individual author(s) and contributor(s) and not of MDPI and/or the editor(s). MDPI and/or the editor(s) disclaim responsibility for any injury to people or property resulting from any ideas, methods, instructions or products referred to in the content. |
© 2025 by the authors. Licensee MDPI, Basel, Switzerland. This article is an open access article distributed under the terms and conditions of the Creative Commons Attribution (CC BY) license (https://creativecommons.org/licenses/by/4.0/).