Article

An Improved Multimodal Framework-Based Fault Classification Method for Distribution Systems Using LSTM Fusion and Cross-Attention

1
State Grid Beijing Electric Power Research Institute, Beijing 100075, China
2
Beijing Dingcheng Hong’an Technology Development Co., Ltd., Beijing 100075, China
3
State Key Laboratory of Reliability and Intelligence of Electrical Equipment, Hebei University of Technology, Tianjin 300401, China
*
Author to whom correspondence should be addressed.
Energies 2025, 18(6), 1442; https://doi.org/10.3390/en18061442
Submission received: 7 February 2025 / Revised: 25 February 2025 / Accepted: 27 February 2025 / Published: 14 March 2025
(This article belongs to the Special Issue Studies of Microgrids for Electrified Transportation)

Abstract

:
Accurate and rapid diagnosis of fault causes is crucial for ensuring the stability and safety of power distribution systems, which are frequently subjected to a variety of fault-inducing events. This study proposes a novel multimodal data fusion approach that effectively integrates external environmental information with internal electrical signals associated with faults. Initially, the TabTransformer and embedding techniques are employed to construct a unified representation of categorical fault information across multiple dimensions. Subsequently, an LSTM-based fusion module is introduced to aggregate continuous signals from multiple dimensions. Furthermore, a cross-attention module is designed to integrate both continuous and categorical fault information, thereby enhancing the model’s capability to capture complex relationships among data from diverse sources. Additionally, to address challenges such as a limited data scale, class imbalance, and potential mislabeling, this study introduces a loss function that combines soft label loss with focal loss. Experimental results demonstrate that the proposed multimodal data fusion algorithm significantly outperforms existing methods in terms of fault identification accuracy, thereby highlighting its potential for rapid and precise fault classification in real-world power grids.

1. Introduction

Ensuring the reliability of power distribution systems is essential for the stability of the power industry [1]. Power distribution systems are often impacted by a variety of events, such as equipment failures and lightning strikes. The overlapping spectral characteristics of transient faults result in ambiguous feature representations. Therefore, power companies may require several hours to identify the root cause of a fault, leading to delays in the timeliness and accuracy of power restoration [2]. Consequently, there is an urgent need for rapid and accurate fault cause identification methods to narrow the search area for faults and expedite the restoration process, ultimately enhancing system reliability.
To address this challenge, various methods have been conducted for fault cause diagnosis. Ref. [3] uses artificial neural networks to identify fault causes by analyzing features such as fault duration, weather conditions, fault phases, and protective device actions. Ref. [4] presents a fuzzy logic-based method for determining fault types in load-imbalanced distribution networks, beginning with the decomposition of three-phase fault currents into positive, negative, and zero-sequence components. Ref. [5] applies wavelet transform and artificial neural networks to classify faults based on voltage and current waveform patterns in the time domain. Ref. [6] introduces signal processing techniques based on the s-transform to enhance fault feature differentiation, thereby improving the classification performance of fault identification models. However, these traditional algorithms depend on manual feature dimensionality reduction engineering, which can limit their effectiveness in capturing complex data patterns in power systems.
In recent years, artificial intelligence technologies, particularly deep learning, have led to the development of various methods for fault identification in power grids, including Deep Belief Networks (DBNs) [7], Convolutional Neural Networks (CNNs) [8,9], Long Short-Term Memory (LSTM) networks [10], Transformers [11], Chirplet Transform-based Networks (CTNets) [12], and Multi-Perception Graph Convolutional Tree-Embedded Networks (MPGCTNs) [13]. These advanced approaches have decreased reliance on manual feature reduction, leading to their increased application in fault classification. For instance, ref. [9] develops a CNN-based intelligent fault identification system for three-phase current signals, while [8] introduces a method for automatically identifying fault causes in transmission lines by extracting features from recorded data, focusing on time-domain characteristics such as voltage sag and swell. CTNet [12] extracts time-frequency features by employing an encoder–decoder architecture to process the time-frequency representation. Additionally, MPGCTN [13] captures temporal features by constructing dual-channel feature graphs, effectively extracting both specialized and shared information. However, power distribution faults are often influenced by external factors, such as the month of occurrence [14]. The methods mentioned above rely solely on electrical fault records, which may lead to misidentification of faults. Therefore, there is a need to develop a multimodal data fusion identification model that can effectively integrate both external feature information and electrical measurements.
Considering the existing research gap, this paper presents a novel fault cause identification approach through multimodal data fusion. By integrating external fault information, such as incident time and month, with internal electrical signals, including current and electric field data, the proposed method effectively leverages multi-source information for rapid and accurate fault classification. Furthermore, the Manta Ray Foraging Optimization (MRFO) algorithm is employed to adaptively search for optimal hyperparameters [15]. The contributions of this paper are as follows:
  • To tackle the challenges associated with small-scale data, class imbalance, and the risk of mislabeling in fault cause identification, this paper proposes a loss function that merges soft label loss with focal loss.
  • Table Transformer and embedding techniques are designed to integrate categorical features, enabling the fusion of discrete information across different dimensions, thereby establishing connections with continuous fault information.
  • This paper develops an LSTM-based fusion module to combine continuous information from diverse dimensions, enhancing the model’s capacity to capture dynamic changes in electrical signals.
  • A cross-attention module is proposed to integrate both continuous and categorical fault information, improving the model’s diagnostic accuracy by emphasizing critical information from distinct data sources.

2. Methodology

2.1. The Motivation of a Multimodal Data Fusion Model

To enhance the accuracy of the fault cause identification model, this paper extracts various modal data, including external information and internal grid signals, as input for the model. This section analyzes the reasons and necessity for adopting multimodal signals from a physical perspective, rather than relying solely on recorded electrical data to analyze fault causes.
Taking foreign object contact with wooden materials as an example, as shown in Figure 1, when a fault occurs due to wooden materials making contact with power lines, the current waveform characteristics exhibit one or two sharp pulse spikes, accompanied by significant changes in the differential current. This phenomenon arises when wooden foreign objects come into contact with areas of weak insulation on the line, causing conductor discharges to the wooden object and generating an arc that erodes the material, ultimately leading to a breakdown in contact. Once the arc subsides, the insulation is restored, allowing the line to return to normal operation.
Furthermore, the likelihood of such contacts is closely related to the month and timing of the fault occurrence. Faults caused by fallen trees, a typical reason for wooden material contact, are particularly common in the second quarter due to frequent rainy and windy conditions. Moreover, strong winds during the night can lead to fallen trees and subsequent faults in the distribution network [14]. Therefore, time and month are termed external features because they describe environmental conditions rather than direct electrical measurements. These temporal and seasonal patterns highlight the critical influence of environmental factors on fault distribution in power distribution systems.
Therefore, it is essential to develop a model that integrates external information regarding the timing and month of the fault. Additionally, the rapid changes in electrical signals over short periods, characterized by significant differential values, are also linked to fault causes. Consequently, both the raw electrical data and their corresponding differential values should be included in the model input.

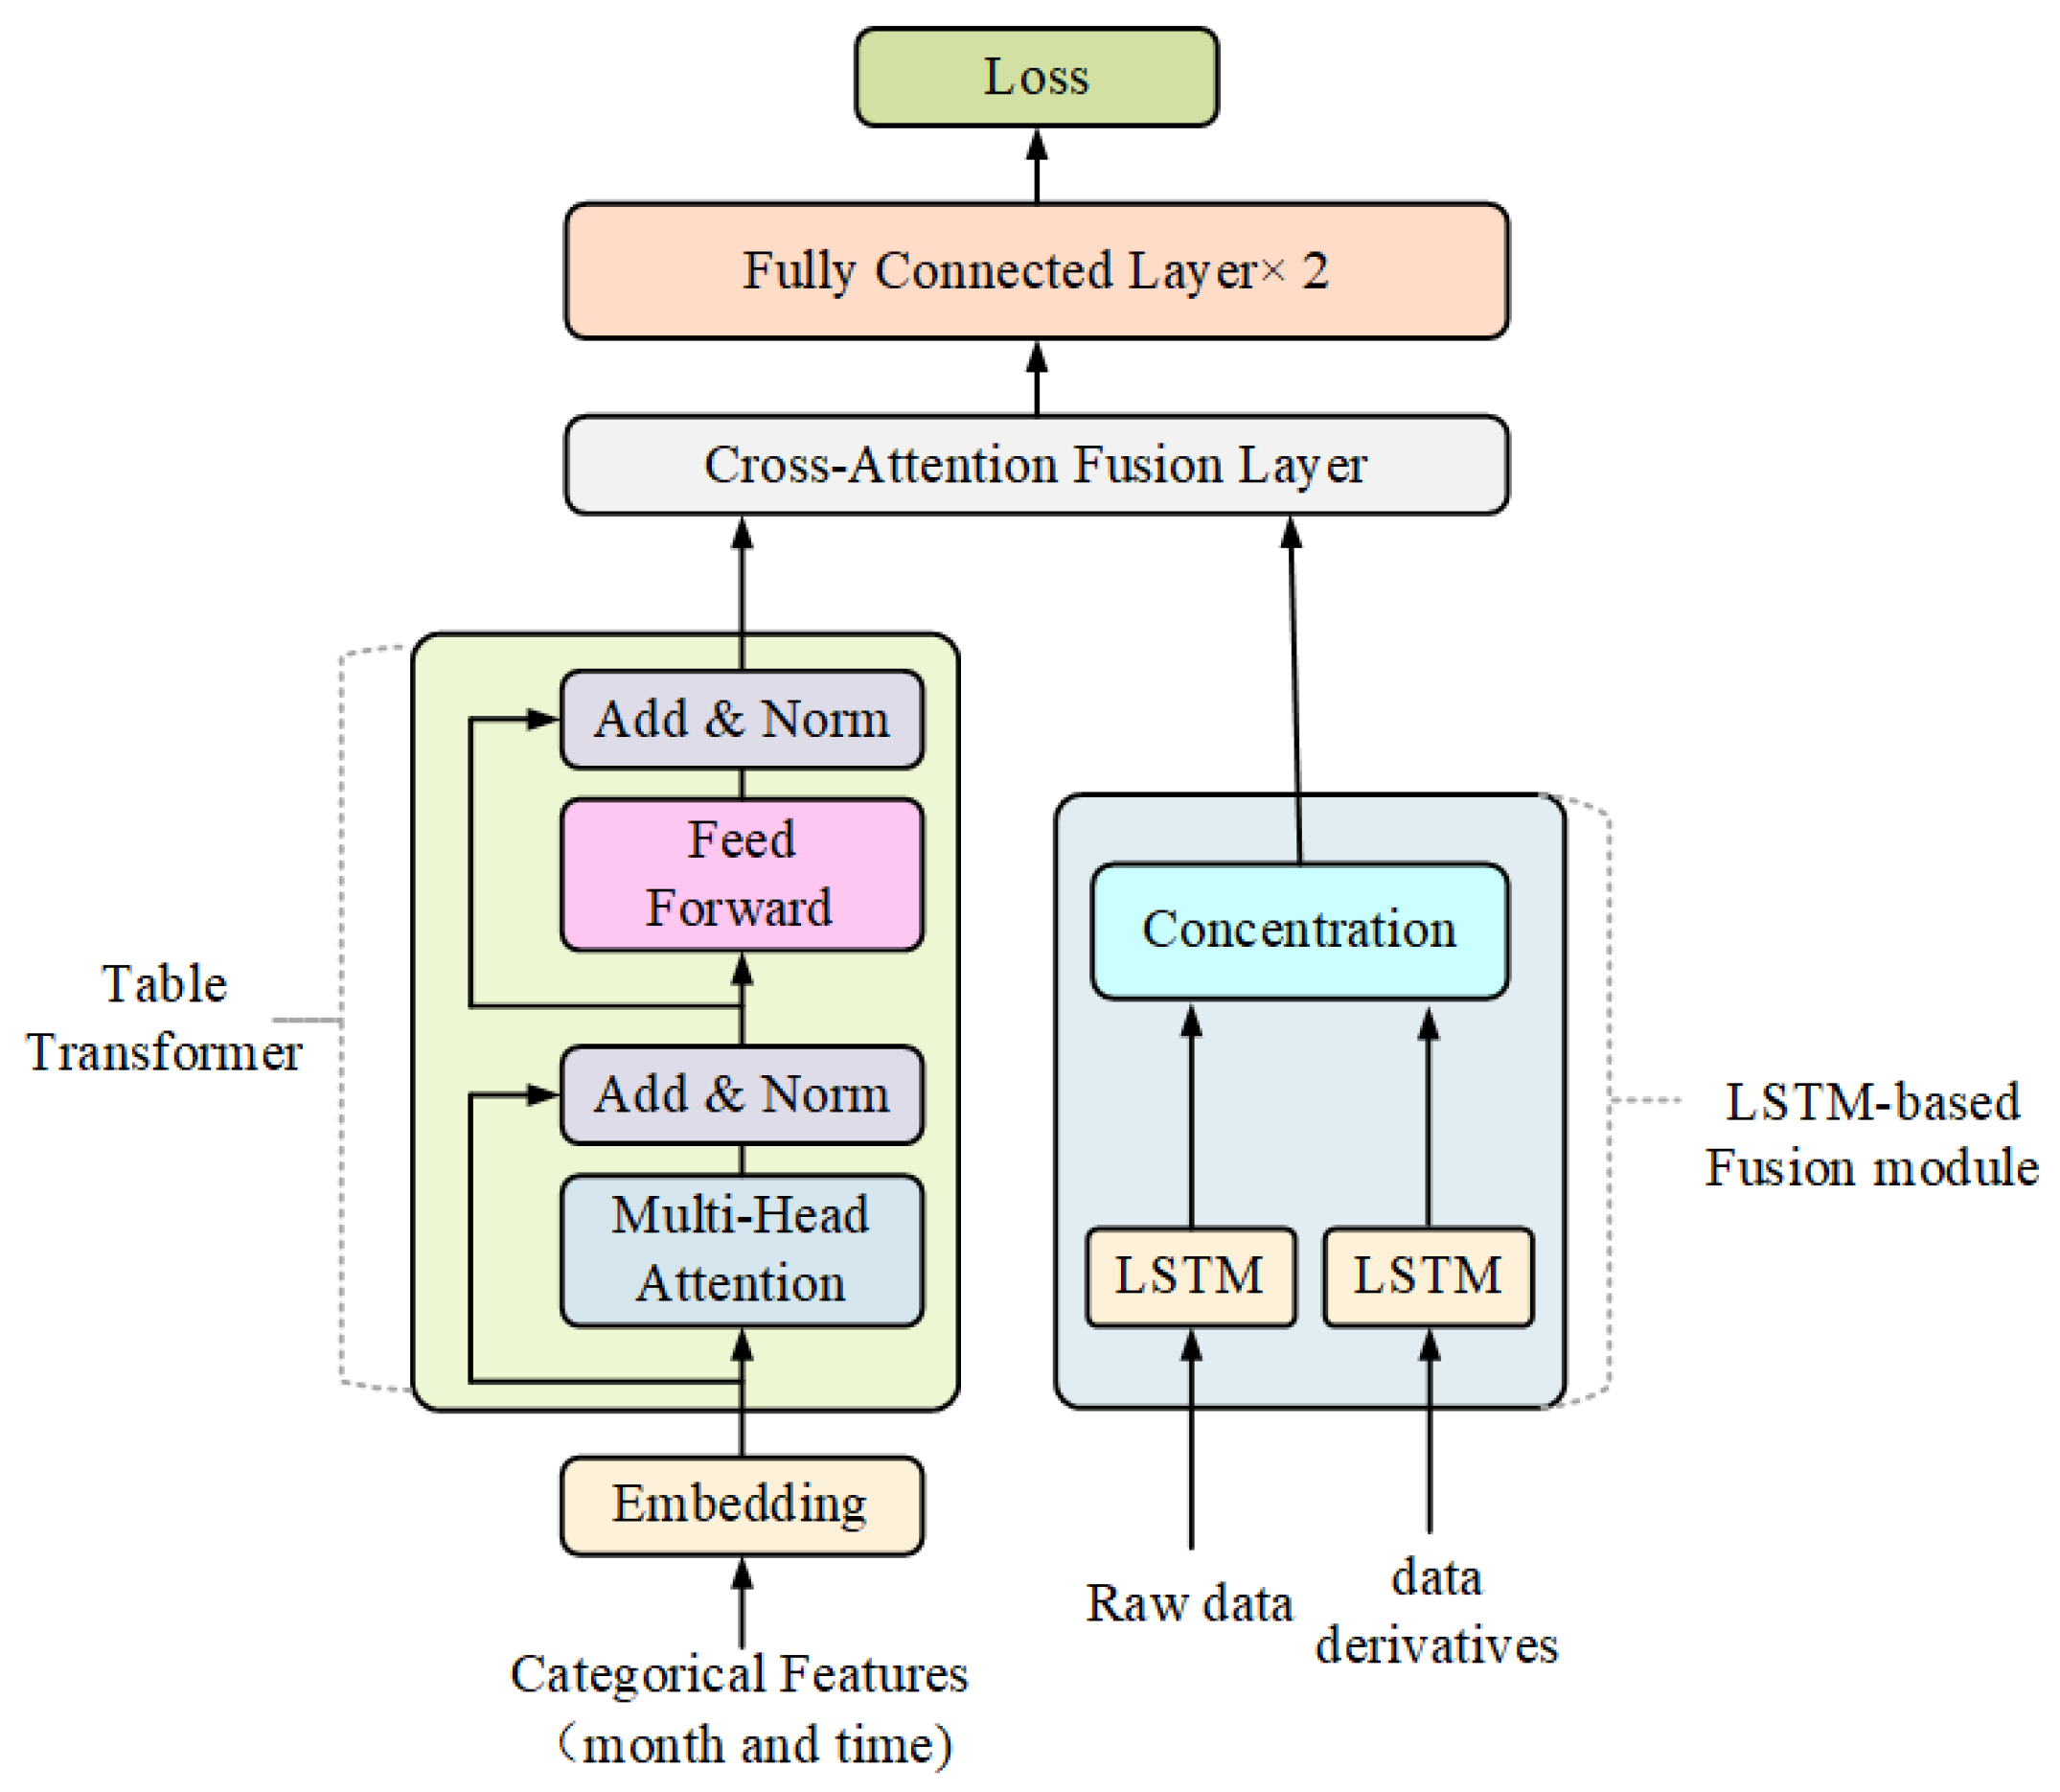
2.2. Proposed Model Structure
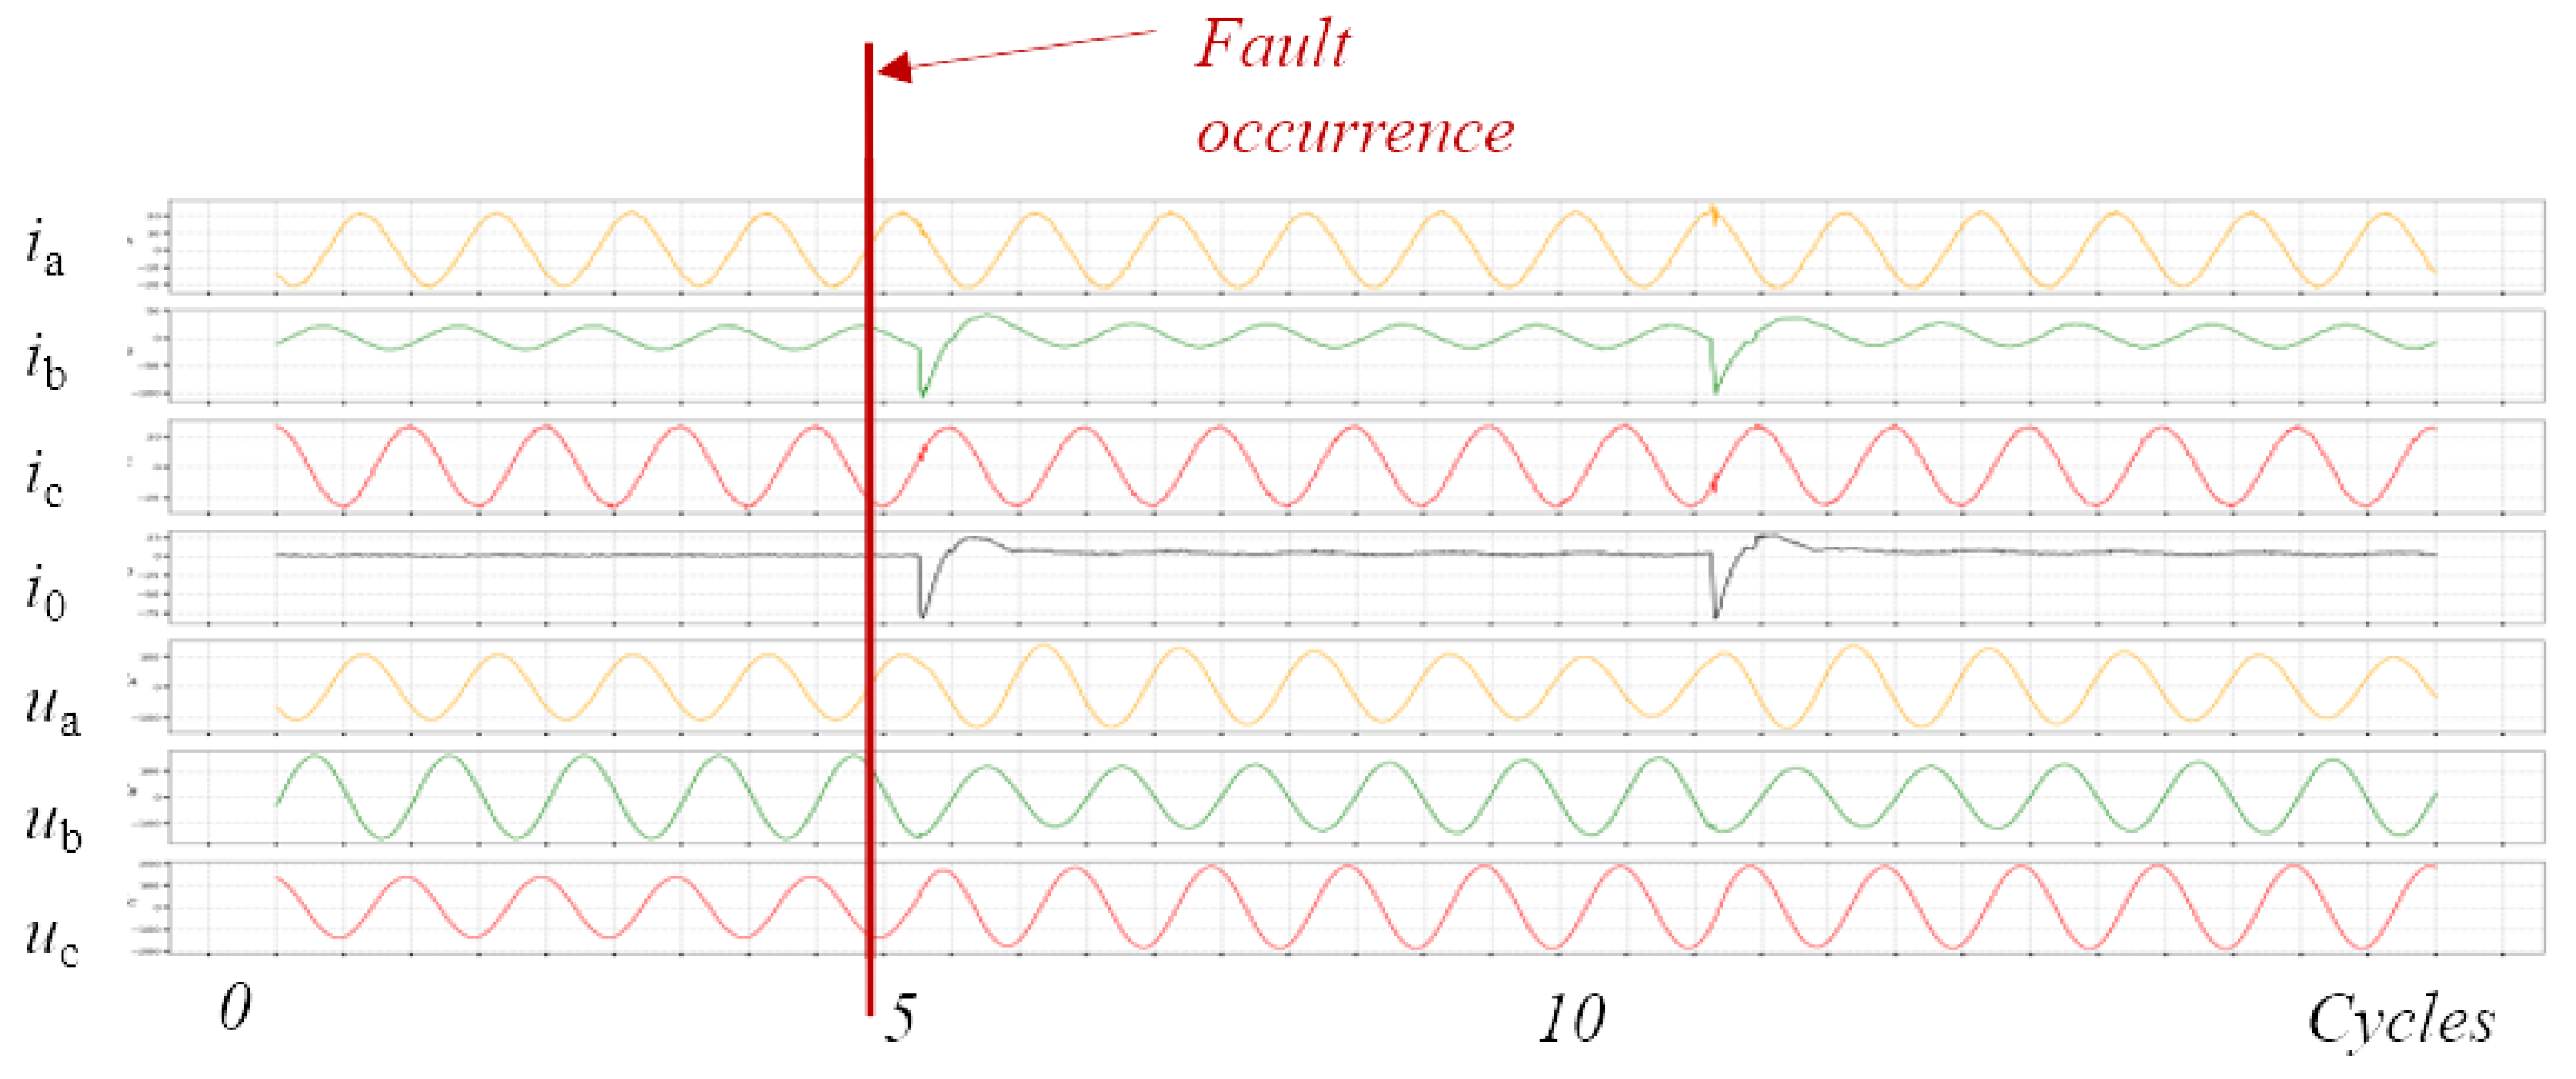
Due to the multimodal data used in this study, which encompass various characteristics and dimensions, we propose a novel multimodal data fusion model. This model integrates three modules—TabTransformer, an LSTM-based fusion module, and a cross-attention fusion layer—to achieve effective data fusion, ensuring high performance in identifying fault causes. The proposed model is structured to effectively diagnose faults in power distribution systems by leveraging both temporal and categorical data, as illustrated in Figure 2.

2.2.1. Input Layer

The input layer of the proposed model accommodates four distinct types of inputs: the time of fault occurrence, the month of fault occurrence, electrical data, and the derivative of electrical data along the time dimension. Therefore, the inputs are represented in two modalities: categorical (time and month) and continuous (electrical data and its derivative).
The inputs are represented as follows:
T R 24 , M R 12 , E R 6 × 400 , d E d t R 6 × 399 ,
where T represents the discrete time of fault occurrence, with possible values ranging from 1 to 24; M denotes the discrete month of fault occurrence, with values from 1 to 12; E signifies the electrical signals captured in the three-phase currents and electric fields over 400 sequential time steps; and d E d t indicates the derivatives of electrical data over time, resulting in a reduction to 399 time steps.

2.2.2. Embedding Layer

In the embedding layer, the categorical features (time and month) are transformed into dense vector representations to facilitate their integration into the neural network framework.
The embedding for the time of fault occurrence, T, is represented as
E time = Embedding time ( T ) R d time
where Embedding time is a learnable matrix W time R 24 × d time , mapping each of the 24 possible values of T to a d time -dimensional vector. The embedding is computed as
E time = W time [ T ]
The embedding for the month of fault occurrence, M, is represented as
E month = Embedding month ( M ) R d month
where Embedding month is a learnable matrix W month R 12 × d month , mapping each of the 12 possible values of M to a d month -dimensional vector. The embedding is computed as
E month = W month [ M ]
In these formulas, the input indices T and M are used to select the corresponding rows from the embedding matrices. Using embeddings for categorical features offers several advantages over traditional numerical representations. The embedding method can effectively accommodate different cardinalities of categorical variables, such as the time of fault with 24 possible values and the month with 12 possible values. This flexibility provides a scalable solution that can be easily adapted without requiring major changes to the model architecture. Additionally, this approach allows for the seamless integration of continuous vectors with varying dimensions in subsequent tasks

2.2.3. Table Transformer Module

The Table Transformer (TabTransformer) processes the embedded features to generate high-dimensional representations that capture the relationships between different categorical inputs [16]. Unlike the original Transformer designed for sequential data (e.g., text), the TabTransformer is specifically adapted for tabular data with categorical features. Key differences include input embedding, where TabTransformer uses learnable embeddings for categorical variables (e.g., time/month) instead of tokenized sequences; attention scope, which operates across categorical features rather than sequential tokens to capture interdependencies; and the omission of positional encoding due to the lack of inherent order in categorical features.
The input to this layer is defined as
E input = [ E time , E month ] R d time + d month
where E time represents the embedded vector for the time of fault occurrence, with a dimensionality of d time , and E month denotes the embedded vector for the month of fault occurrence, with a dimensionality of d month .
The self-attention mechanism computes the query, key, and value matrices as follows:
Q = E input W Q , K = E input W K , V = E input W V ,
where W Q , W K , W V R ( d time + d month ) × d k , and d k is the dimensionality of the key vectors.
The scaled dot-product attention is then calculated by
Attention ( Q , K , V ) = softmax Q K T d k V .
This mechanism allows the model to weigh the importance of each feature in the input sequence, facilitating the learning of intricate dependencies among categorical features.
Following the attention mechanism, a feed-forward network processes the output as follows:
Z = ReLU ( X W 1 + b 1 ) W 2 + b 2 ,
where W 1 R d model × d f f and W 2 R d f f × d model . Here, d model is the model’s output dimension, and d f f is the dimension of the feed-forward layer.
Overall, the TabTransformer effectively learns the dependencies between categorical features, such as the time and month of fault occurrences, which are strongly correlated with fault causes. By integrating this high-dimensional representation with continuous variables, such as electrical measurements, the model leverages comprehensive information from various modalities.

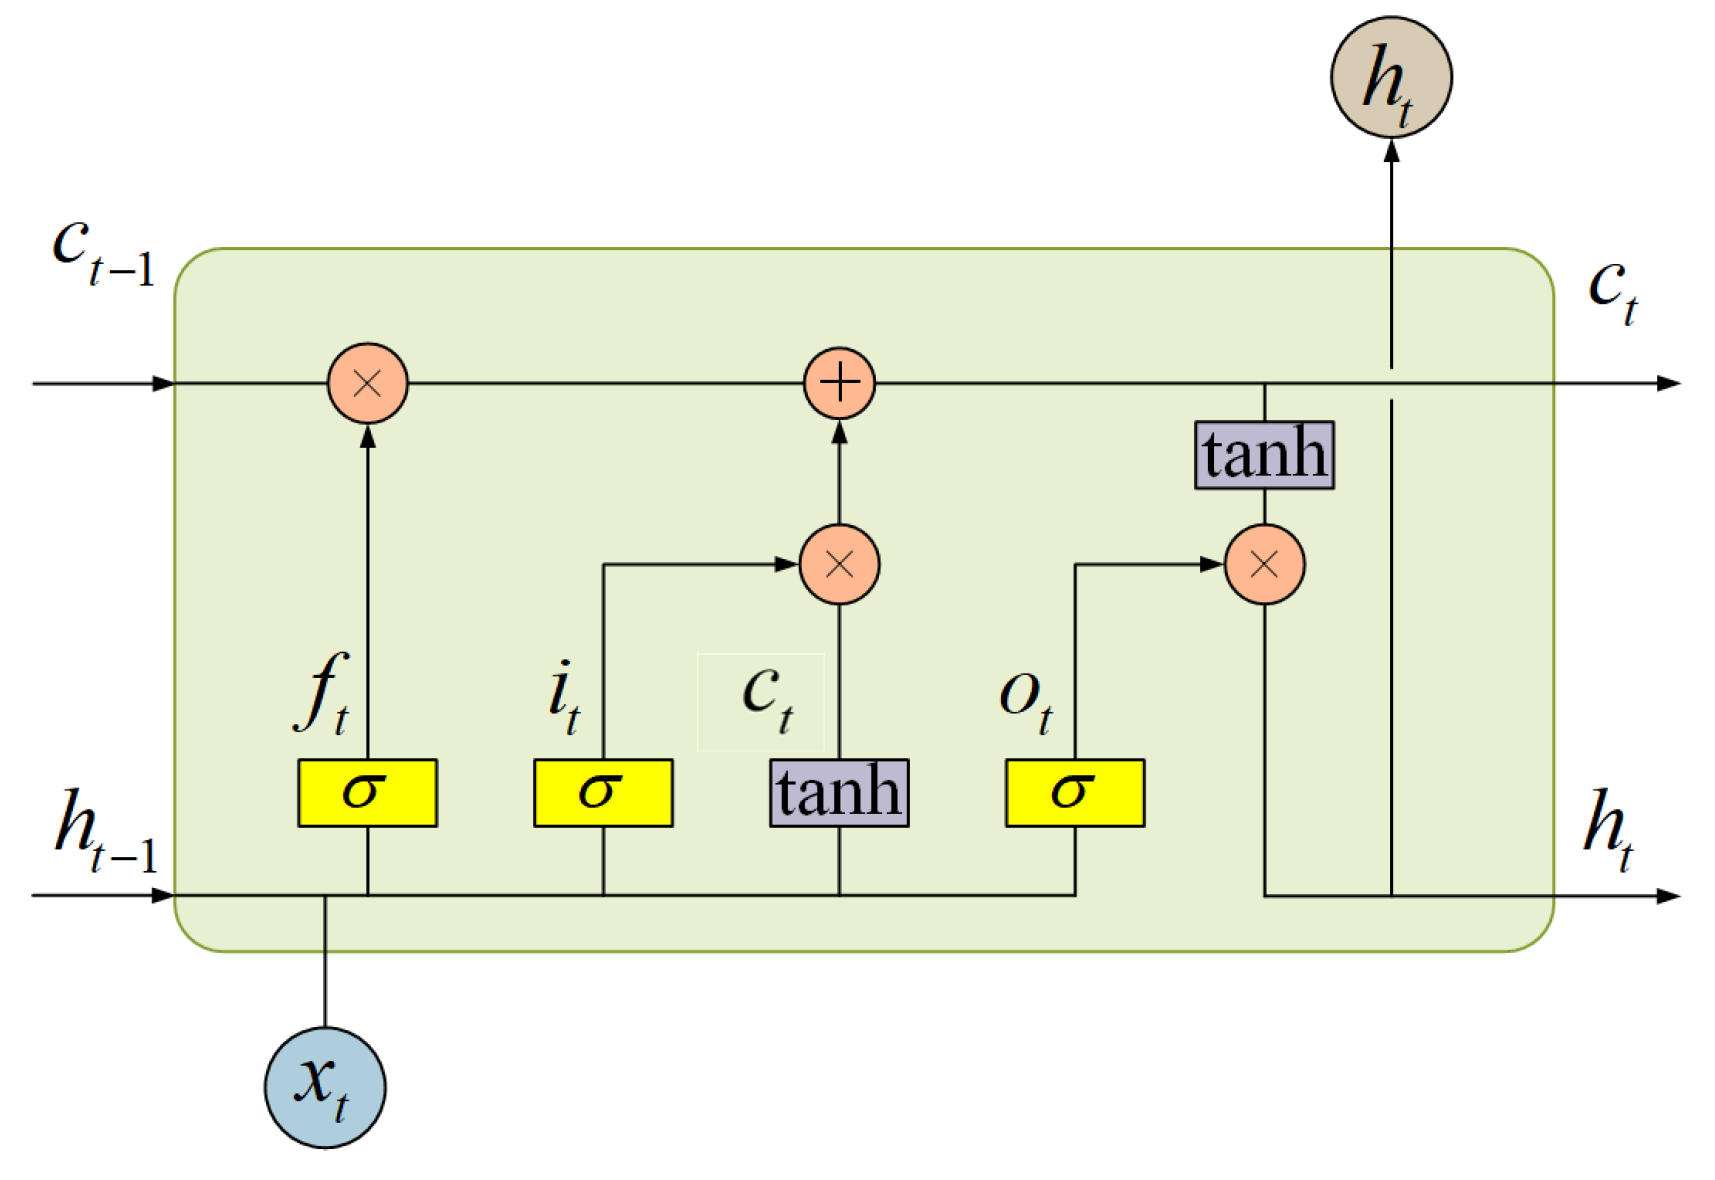
2.2.4. LSTM-Based Multimodal Temporal Data Fusion Module

The electrical data E R 6 × 400 and their derivative d E d t R 6 × 399 are fused through an LSTM-based fusion module to extract the electrical characteristics for fault cause diagnosis, as shown in Figure 2.
The process of LSTM networks is illustrated in Figure 3. For a given input sequence X R 6 × T , the LSTM generates hidden states H according to the following equations:
i t = σ ( W i · [ h t 1 , x t ] + b i )
f t = σ ( W f · [ h t 1 , x t ] + b f )
o t = σ ( W o · [ h t 1 , x t ] + b o )
C ˜ t = tanh ( W c · [ h t 1 , x t ] + b c )
C t = f t · C t 1 + i t · C ˜ t
h t = o t · tanh ( C t )
Here, i t , f t , and o t are the input, forget, and output gates, respectively; C t is the cell state; and h t is the hidden state at time t. The weights W and biases b are learnable parameters.
After processing, the outputs of the LSTM for the electrical data and their derivative are represented as
H LSTM = LSTM ( E ) R 6 × d LSTM
H diff = LSTM d E d t R 6 × d LSTM
By performing a concatenation operation, the two feature matrices are combined into a single feature matrix as follows:
V LSTM = [ H LSTM ; H diff ] R 6 × ( 2 d LSTM )
where H LSTM is the output of the electrical data processed by the LSTM network, H diff is the output of the electrical derivative processed by the LSTM network, and d LSTM is the dimensionality of the LSTM hidden states, defining the size of the output vector from each LSTM unit.
The proposed LSTM-based fusion module facilitates the integration of electrical time-series information with different dimensions. By utilizing LSTM to extract temporal features from both the electrical data and their derivative, the model effectively captures dynamic changes in the electrical signals over time. The integration of these two types of information enhances the model’s sensitivity to fault patterns and improves its ability to identify complex fault scenarios, ultimately leading to increased diagnostic accuracy.

2.2.5. Cross-Attention Layer for Categorical and Continuous Data Fusion

This paper introduces a cross-attention-based module that integrates discrete and continuous information. The feature fusion layer combines the outputs from the TabTransformer and the LSTM-fused electrical data using cross-modal attention to enhance feature representation. The cross-attention mechanism is defined as
O cross = softmax Q LSTM · K Tab T d k V Tab
where Q LSTM is generated by projecting the LSTM’s hidden states, which capture time-dependent electrical patterns. In contrast, K Tab , V Tab matrices are produced by the TabTransformer, mapping categorical metadata into latent embeddings. This design allows the model to dynamically align electrical signatures with contextual factors—for instance, associating sudden current surges at night with animal electrocution risks rather than equipment failures.
This attention mechanism allows the model to emphasize the most relevant features from both the continuous (LSTM-extracted) and categorical (TabTransformer) inputs, enhancing the model’s ability to make informed fault classification decisions. Subsequently, the output from the cross-attention layer is processed through two fully connected layers, as follows:
Z 1 = O cross W 1 + b 1 ,
Z 2 = ReLU ( Z 1 ) ,
Y = softmax ( Z 2 W 2 + b 2 ) ,
where O cross is the output from the cross-attention mechanism, W 1 and W 2 are the weight matrices for the first and second fully connected layers, respectively; and b 1 and b 2 are their corresponding bias terms. Here, Z 1 is the output from the first fully connected layer, Z 2 is the output after applying the ReLU activation function, and Y is the final classification output, representing the probabilities for each class after applying the softmax function. This process integrates all learned representations from the cross-modal attention mechanism and produces the final classification output.
Table 1 presents the details of the proposed multimodal data fusion method, which employs a comprehensive architecture that integrates various data types and processing techniques. The proposed model’s total complexity is dominated by three sequential components: the TabTransformer module applies self-attention to time/month embeddings (with input dimension n = 2 , embedding dimension d = 64 ) with O ( n 2 · d ) ; the dual LSTM layers process T = 400 sequential steps with hidden states d = 128 , contributing 2 · O ( T · d 2 ) operations; and the cross-attention fusion aligns temporal ( T = 400 ) and categorical ( n = 2 ) features via O ( T · n · d ) .
The TabTransformer module and embedding layer capture interdependencies among categorical features utilizing self-attention mechanisms. In parallel, the LSTM-based fusion component is specifically designed to handle the electrical data sequences, effectively capturing temporal dependencies and dynamics within the electrical measurements.
Furthermore, the cross-attention fusion layer integrates information from both the LSTM and TabTransformer, allowing the model to draw connections between the temporal electrical data and the categorical embeddings. This fusion of external fault information and internal grid data enhances fault classification accuracy.
Overall, by integrating these advanced techniques within a unified framework to extract fault information across various features and dimensions, the proposed model significantly enhances fault classification performance in power distribution systems.

2.3. Proposed Loss Function

This paper proposes a loss function that integrates soft label loss and focal loss, defined as follows:
L = 1 N i = 1 N c = 1 C ( 1 y ^ i , c ) γ ( 1 ϵ ) y i , c log ( y ^ i , c ) + ϵ 1 y i , c C 1 log ( 1 y ^ i , c )
where L is the total loss, N is the number of samples, y i is the true label for sample i, y ^ i is the predicted probability for sample i, C is the number of classes, and the focal loss parameter γ prioritizes rare faults (e.g., lightning strikes comprise only 5% of the dataset), while label smoothing ϵ mitigates human annotation errors observed in field records.
The construction of the proposed fused loss function is driven by several critical considerations related to the dataset and the fault cause identification task. First, the small scale of the unbalanced dataset necessitates robust regularization techniques to prevent overfitting. Second, given that the task involves multi-class classification with five fault types, it is vital to enhance the model’s ability to differentiate among closely related classes. The integration of focal loss achieves this by focusing on harder-to-classify examples, improving the model’s sensitivity to minority classes.
Finally, since the labels in the datasets are provided by field staff following inspections, there exists a risk of mislabeling. By incorporating label smoothing, the model becomes more flexible and less overconfident in its predictions, which helps mitigate the adverse effects of potential labeling errors. Therefore, the proposed fused loss function is designed to address the unique challenges in this task.

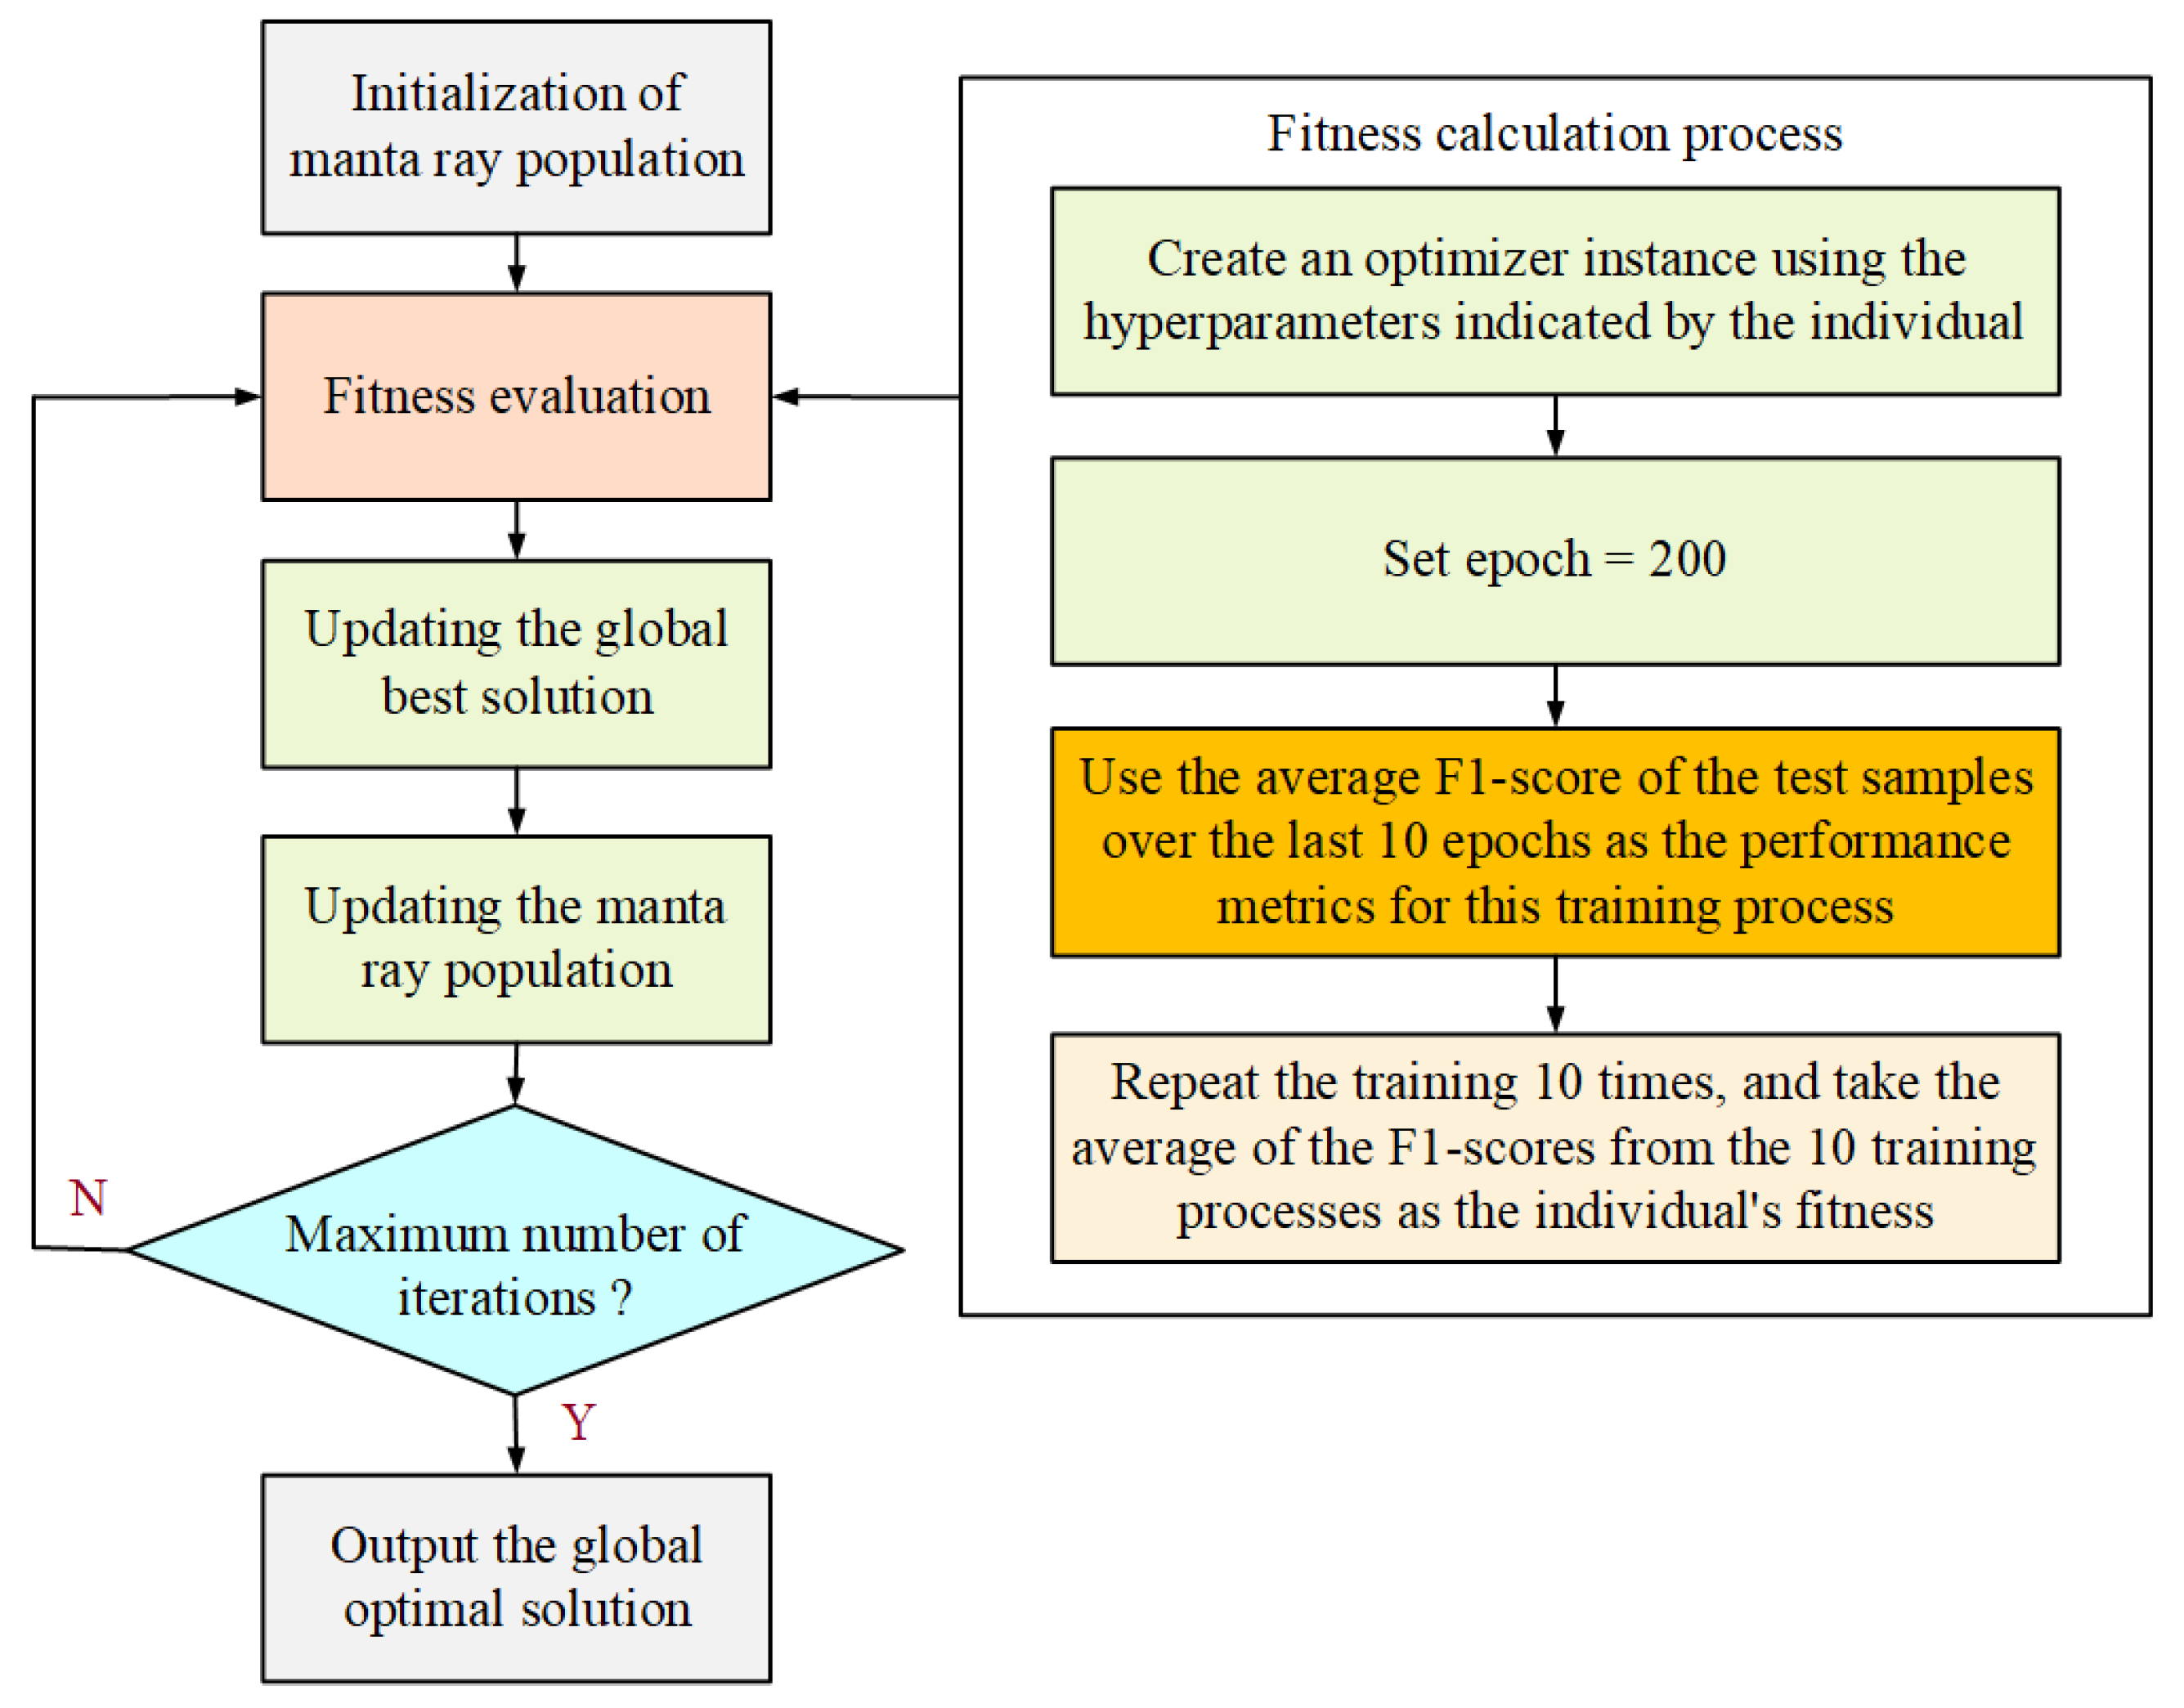
2.4. Hyperparameter Decision Using Manta Ray Foraging Optimization

To enhance the optimization of hyperparameters within the model, the MRFO algorithm is employed to adaptively search for optimal values for the following parameters: γ (focal loss focusing parameter), ϵ (label smoothing parameter), d LSTM (LSTM output dimension), and the dimension of the embedding layer. These parameters are critical for the model’s sensitivity to minority classes, its generalization against mislabeled data, its ability to capture temporal features in sequences, and its expression of categorical relationships.
As demonstrated in Figure 4, the optimization process begins with the initialization of a population, where each individual represents a candidate solution for the hyperparameters. Following initialization, the fitness of each individual is evaluated based on the model’s performance on a test set. The global best solution is updated according to individual fitness values, ensuring that the optimal combination of hyperparameters is retained throughout the iterations. Individuals in the population are then updated by simulating the foraging behavior of manta rays, allowing for the exploration of better regions within the hyperparameter space.
The specific optimization equations are as follows:
P = { p 1 , p 2 , , p N }
F ( p i ) = evaluate ( p i ) , i = 1 , 2 , , N
p best = arg max F ( p i )
X i t + 1 = X i t + α · X b e s t t X i t + β · X j t X i t
where X i t represents the hyperparameter of the i-th individual at iteration t, X b e s t t is the current best solution in the population, α and β are adjustment parameters, and X j t is a randomly selected individual from the population. This iterative process effectively optimizes the configuration of hyperparameters, ensuring that the model performs optimally for fault classification in power distribution systems.

3. Case Study

3.1. Database Construction

The sampling data used in this study are collected from on-site sensors in a power distribution power company in China; the sampling frequency for fault information is 4096 Hz. A total of 1000 samples are categorized into five classes: 450 wooden-related foreign objects, 100 metal-related foreign objects, 100 animal electrocution cases, 300 equipment insulation deterioration cases, and 50 lightning strike cases. The feature map is described in Section 2.2.1. The dataset is split into training and testing sets at a 8:2 ratio. The field-collected dataset includes detailed grid operation records, which ensures practical relevance in real-world scenarios.
As shown in Table 2, animal electrocution cases predominantly occur at night and during summer months. In contrast, lightning strike-related faults exhibit concentrated frequency during rainy seasons. These temporal and seasonal patterns highlight the critical influence of environmental factors on fault distribution in power distribution systems.

3.2. Evaluation Metrics

Considering the class imbalance in fault data, the F1 score is a key metric for evaluating classification models [17]. The F1 score combines precision (the accuracy of positive predictions) and recall (the ability to identify all positive instances), providing a balanced measure that considers both false positives and false negatives.
The F1 score is defined as
F 1 = 2 · Precision · Recall Precision + Recall
where
Precision = T P T P + F P
and
Recall = T P T P + F N
Here, T P represents true positives, F P stands for false positives, and F N denotes false negatives.

3.3. Comparison of Different Feature Map Construction Methods

To validate the necessity of the proposed multimodal data feature set, this section tests the evaluation accuracy using different feature configurations. It is noted that removing specific features from the model input impacts the corresponding components of the proposed model. For example, excluding the derivatives of the electrical data leads to the removal of the concentration layer in the LSTM-based fusion module.
Table 3 shows that the performance in identifying fault causes improves significantly when a comprehensive set of features is used. The highest accuracy and F1 score are achieved with all features included, underscoring the importance of integrating various data types. Seasonal factors, such as the occurrence of bird nests and fallen trees, are particularly relevant as they correspond to specific times of the year.
Additionally, the derivatives of the electrical parameters capture the dynamic changes in power systems, which are strongly correlated to fault cause identification performance. As illustrated in Figure 1, notable variations in electrical current, indicated by its derivatives, can signify abrupt spikes or pulses that are closely linked to the materials involved in foreign object interactions. Therefore, the inclusion of derivatives in fault signals is crucial for the model’s overall performance. The findings in Table 3 support the discussion in Section 2.1, confirming that the proposed model inputs effectively enhance the accuracy of fault cause identification.

3.4. Comparison of Different Model Structures

This study introduces a method that incorporates multiple multimodal data fusion modules to integrate discrete and continuous data across different dimensions. To validate the necessity of these fusion modules, we assessed the accuracy of various model architectures by selectively removing specific components, as summarized in Table 4. When the fusion modules were omitted, the cross-attention fusion and TabTransformer modules were replaced with basic concatenation operations, while the LSTM-based fusion was replaced with zero-padding concatenation of the raw data and their derivatives. These modifications highlight the important role of the proposed multimodal fusion modules in improving information integration, demonstrating their effectiveness in enhancing model performance for fault cause identification. The model uses focal loss parameters γ = 2.0 and ϵ = 0.1 and batch size = 64 and was trained on an NVIDIA RTX 3090 GPU with 32 GB RAM. The equipment is manufactured by NVIDIA Corporation, Santa Clara, CA, USA. The convergence of MRFO is visualized in Figure 5.
Table 4 underscores the significant roles of different fusion components in the proposed model for fault cause identification. The Tab-Transformer effectively captures relationships among categorical features, enhancing classification accuracy. Additionally, the LSTM-based fusion module integrates dual representations of electrical signals, enriching the feature space related to fault dynamics in power systems. This integration is crucial for accurate fault classification, as it utilizes both the original electrical data and its rate of change, thereby improving classification performance.
Moreover, the cross-attention fusion enhances the model’s capabilities by facilitating interactions between the categorical data from the Tab-Transformer and the sequential data from the LSTM. This mechanism allows the model to dynamically assess the contributions of both external and internal features, improving its ability to identify relevant information and enhance classification performances.
Furthermore, the ablation study in Table 5 demonstrates the impact of architectural choices on model performance. While increasing LSTM layers slightly improves accuracy, the marginal gain does not justify the added computational complexity. Conversely, reducing the TabTransformer dimension to 64 significantly degrades performance, indicating insufficient feature representation capacity. The proposed method achieves an optimal balance by integrating both components with appropriate dimensionality, yielding the highest F1 score while maintaining practical efficiency.
In summary, the proposed model employs various fusion components to address the complexities of fault cause identification. Their combined functionality not only enhances the integration of multimodal data but also enhances accuracy in classifying fault types, improving the effectiveness of the proposed approach.

3.5. Comparison of Different Loss Functions

This section evaluates the effectiveness of the proposed loss function (2). To further assess its performance, we consider three benchmark loss functions: focal loss [18], label smoothing loss [19], and cross-entropy loss [20].
Focal loss is defined as
L focal = 1 N i = 1 N c = 1 C ( 1 y ^ i , c ) γ y i , c log ( y ^ i , c )
Label smoothing loss is given by
L LS = 1 N i = 1 N c = 1 C ( 1 ϵ ) y i , c log ( y ^ i , c ) + ϵ 1 y i , c C 1 log ( y ^ i , c )
Cross-entropy loss function is given by
L CE = 1 N i = 1 N c = 1 C y i , c log ( y ^ i , c )
The comparison of different loss functions, as presented in Table 6, demonstrates the effectiveness of the proposed loss function in multi-class classification, particularly in handling imbalanced data and potential mislabeling, as discussed in Section 2.3. As shown in Table 6, traditional cross-entropy loss does not account for class imbalance and is more sensitive to mislabeling. Similarly, using focal loss and label smoothing separately does not fully leverage the strengths of both approaches.
Specifically, the focal loss component is introduced to emphasize learning from harder-to-classify samples, which is essential when certain fault types are under-represented, thereby reducing the risk of overfitting to majority classes. Furthermore, the proposed loss function incorporates label smoothing to mitigate the impact of inaccuracies in labels provided by field personnel, who may misidentify fault causes due to observational errors. By softening the target distribution, the proposed loss function enhances the generalization of the model and reduces overconfidence in potentially incorrect labels.
In general, the results highlight the challenges in the sample data and emphasize the importance of proposed loss functions in effectively addressing the complexities of fault-cause identification tasks.

3.6. Comparative Analysis with Existing Methods

This section compares the proposed method with existing approaches, including a deep belief network (DBN), CNN, LSTM, Bidirectional LSTM (BiLSTM), and GRU (Gated Recurrent Unit). Due to the structure of these comparison models, they utilize only the temporal information of the fault occurrence and its derivatives as input, without incorporating categorical information.
Table 7 compares the performance of various methods for the identification of faults. Traditional approaches typically rely on single data types, which limits their ability to capture complex relationships between external and internal factors. For example, while CNNs excel at processing spatial information, they may not adequately account for the temporal dynamics present in sequential data. Additionally, GRU performs slightly worse than LSTM due to its simpler architecture, which reduces the model’s ability to capture complex temporal dependencies, although it remains more efficient computationally. BiLSTM, by processing the input sequence in both forward and backward directions, captures both past and future context, leading to an improvement over LSTM in terms of overall accuracy. Despite these improvements, they do not incorporate categorical external features that are crucial for understanding the environmental factors influencing faults.
The proposed method, by using LSTM-based fusion for both electrical quantities and their derivatives, along with cross-attention mechanisms to integrate categorical and sequential data, demonstrates superior performance. The effectiveness of the proposed method comes from its multimodal data fusion strategy, which enables more comprehensive feature extraction for fault identification. This approach improves sensitivity to fault conditions and generalization in different scenarios, leading to higher accuracy and F1 scores in fault identification tasks.
Figure 6 shows the confusion matrix of the proposed method. Although lightning strikes account for only 5% of the dataset, they are fully correctly identified without misclassification, indicating that lightning strikes exhibit the most distinct electrical characteristics compared to other faults. Most misclassifications occur between metal and wooden faults, suggesting similarities in their electrical signatures.

4. Conclusions

In this paper, we propose a novel multimodal data fusion method for fault cause identification in power distribution systems. Our approach employs a TabTransformer to effectively integrate categorical features, while an LSTM-based fusion module merges continuous information across different dimensions. In addition, we introduce a cross-attention module to synthesize both continuous and categorical fault information. Furthermore, we develop a loss function that combines soft-label loss with focal loss to address challenges related to small-scale data, class imbalance, and the risk of mislabeling. This comprehensive methodology significantly outperforms traditional fault identification techniques, demonstrating its potential for rapid and accurate fault classification in real-world power grids.
References yes

Author Contributions

Conceptualization, Y.L. and H.M.; methodology, Y.L. and C.G.; software, C.G.; validation, Y.L., H.M. and J.S.; formal analysis, H.M.; investigation, Y.G. and J.S.; resources, Y.L.; data curation, C.G.; writing—original draft preparation, B.Y. and H.M.; writing—review and editing, B.Y., Y.L. and Q.Z.; visualization, Q.Z.; supervision, Y.L.; project administration, J.G. All authors have read and agreed to the published version of the manuscript.

Funding

This research was funded by the Science and Technology Project of State Grid Beijing Electric Power Company, grant No. DCHA-KJ-24120306, in part by the State Key Laboratory of Reliability and Intelligence of Electrical Equipment (No. EERI_OY2023005), and Hebei University of Technology.

Data Availability Statement

The original contributions presented in this study are included in the article. Further inquiries can be directed to the corresponding author.

Acknowledgments

We would like to extend our sincere gratitude to Chongke Intelligent Technology Zhejiang Co., Ltd. It is hereby declared that Yuhang Guo (Y.G.) and Bin Yang (B.Y.) are also affiliated with this company. Their involvement as consultants greatly enhanced the depth and breadth of this research.

Conflicts of Interest

Authors Yifei Li, Hao Ma, Cheng Gong, Jing Shen and Jun Gu were employed by the company Beijing Dingcheng Hong’an Technology Development Co., Ltd. Authors Yuhang Guo and Bin Yang were employed by the company Chongke Intelligent Technology Zhejiang Co., Ltd. The remaining authors declare that the research was conducted in the absence of any commercial or financial relationships that could be construed as a potential conflict of interest.

References

  1. Shuvra, M.A.; Rosso, A.D. Root Cause Identification of Power System Faults using Waveform Analytics. In Proceedings of the 2018 Clemson University Power Systems Conference (PSC), Charleston, SC, USA, 4–7 September 2018; pp. 1–8. [Google Scholar]
  2. Xu, L.; Chow, M.; Timmis, J. Power distribution outage cause identification with imbalanced data using artificial immune recognition system (AIRS) algorithm. IEEE Trans. Power Syst. 2007, 22, 198–204. [Google Scholar] [CrossRef]
  3. Xu, L.; Chow, M. A classification approach for power distribution systems fault cause identification. IEEE Trans. Power Syst. 2006, 21, 53–60. [Google Scholar] [CrossRef]
  4. Das, B. Fuzzy logic-based fault-type identification in unbalanced radial power distribution system. IEEE Trans. Power Deliv. 2006, 21, 278–285. [Google Scholar] [CrossRef]
  5. Silva, K.M.; Souza, B.A.; Brito, N.S.D. Fault detection and classification in transmission lines based on wavelet transform and ANN. IEEE Trans. Power Deliv. 2006, 21, 2058–2063. [Google Scholar] [CrossRef]
  6. Peng, N.; Ye, K.; Liang, R. Single-phase-to-earth faulty feeder detection in power distribution network based on amplitude ratio of zero-mode transients. IEEE Trans. Power Deliv. 2020, 21, 2058–2063. [Google Scholar] [CrossRef]
  7. Liu, W.; Hao, D.; Zhang, S.; Zhang, Y. Power System Transient Stability Assessment Based on PSO-DBN. In Proceedings of the 2021 6th International Conference on Power and Renewable Energy (ICPRE), Shanghai, China, 17–20 September 2021; pp. 333–337. [Google Scholar]
  8. Yang, H.; Meng, C.; Wang, C. Data-Driven Feature Extraction for Analog Circuit Fault Diagnosis Using 1-D Convolutional Neural Network. IEEE Access 2020, 8, 18305–18315. [Google Scholar] [CrossRef]
  9. Bukhari, S.B.A.; Kim, C.H.; Mehmood, K.K. Convolutional neural network-based intelligent protection strategy for microgrids. IET Gener. Transm. Distrib. 2020, 14, 1177–1185. [Google Scholar] [CrossRef]
  10. Veerasamy, V.; Wahab, N.I.A.; Othman, M.L.; Padmanaban, S.; Sekar, K.; Ramachandran, R.; Hizam, H.; Vinayagam, A.; Islam, M.Z. LSTM Recurrent Neural Network Classifier for High Impedance Fault Detection in Solar PV Integrated Power System. IEEE Access 2021, 9, 32672–32687. [Google Scholar] [CrossRef]
  11. Fang, J.; Liu, C.; Zheng, L.; Su, C. A data-driven method for online transient stability monitoring with vision-transformer networks. Int. J. Electr. Power Energy Syst. 2023, 146, 108669. [Google Scholar] [CrossRef]
  12. Zhao, D.; Shao, D.; Cui, L. CTNet: A data-driven time-frequency technique for wind turbines fault diagnosis under time-varying speeds. ISA Trans. 2024, 154, 335–351. [Google Scholar] [CrossRef] [PubMed]
  13. Zhao, D.; Cai, W.; Cui, L. Multi-perception graph convolutional tree-embedded network for aero-engine bearing health monitoring with unbalanced data. Reliab. Eng. Syst. Saf. 2025, 257, 110888. [Google Scholar] [CrossRef]
  14. Li, Y.; Song, X.; Zhao, S.; Gao, F. A line fault cause analysis method for distribution network based on decision-making tree and machine learning. In Proceedings of the Fifth Asia Conference on Power and Electrical Engineering (ACPEE), Chengdu, China, 4–7 June 2020. [Google Scholar]
  15. Zhao, W.; Zhang, Z.; Wang, L. Manta ray foraging optimization: An effective bio-inspired optimizer for engineering applications. Eng. Appl. Artif. Intell. 2020, 87, 103300. [Google Scholar] [CrossRef]
  16. Smock, B.; Pesala, R.; Abraham, R. PubTables-1M: Towards comprehensive table extraction from unstructured documents. In Proceedings of the IEEE/CVF Conference on Computer Vision and Pattern Recognition (CVPR), New Orleans, LA, USA, 18–24 June 2022; pp. 4634–4642. [Google Scholar]
  17. Cortes, C.; Mohri, M. AUC Optimization vs. Error Rate Minimization. In Advances in Neural Information Processing Systems 16 (NIPS 2003); The MIT Press: Cambridge, MA, USA, 2004. [Google Scholar]
  18. Lin, T.Y.; Goyal, P.; Girshick, R.; He, K.; Dollár, P. Focal Loss for Dense Object Detection. In Proceedings of the 2017 IEEE International Conference on Computer Vision (ICCV), Venice, Italy, 22–29 October 2017; pp. 2999–3007. [Google Scholar] [CrossRef]
  19. Müller, R.; Kornblith, S.; Hinton, G.E. When Does Label Smoothing Help? arXiv 2019, arXiv:1906.02629. [Google Scholar]
  20. Mao, A.; Mohri, M.; Zhong, Y. Cross-Entropy Loss Functions: Theoretical Analysis and Applications. arXiv 2023, arXiv:2304.07288. [Google Scholar]
Figure 1. The electrical data of a wooden foreign object contact-induced fault.
Energies 18 01442 g001
Figure 2. The proposed multimodal fusion model.
Energies 18 01442 g002
Figure 3. The process in LSTM networks.
Energies 18 01442 g003
Figure 4. The Manta Ray Foraging Optimization.
Energies 18 01442 g004
Figure 5. The Manta Ray Foraging Optimization.
Energies 18 01442 g005
Figure 6. The confusion matrix of the proposed method.
Energies 18 01442 g006
Table 1. The proposed multimodal fusion model structure.
Layer TypeDetailsParameters
Embedding LayerTime EmbeddingInput Dim: 24; Output Dim: 64
Month EmbeddingInput Dim: 12; Output Dim: 64
TabTransformer ModuleSelf-Attention LayerOutput Dim: 128
Residual ConnectionOutput Dim: 128
Feed-Forward LayerOutput Dim: 128
Residual ConnectionOutput Dim: 128
LSTM-Based FusionLSTM for EOutput Dim: 128 (Input: 6 × 400 )
LSTM for d E / d t Output Dim: 128 (Input: 6 × 399 )
Concatenation LayerQ from LSTM, K/V from TabTransformer
Cross-Attention FusionCross-Attention LayerOutput Dim: 256
Classification LayerFully ConnectedOutput Dim: 32
Fully ConnectedOutput Dim: 5 (softmax)
Table 2. Monthly and time-of-day fault distribution.
MonthDaytime (6:00 AM–6:00 PM)Nighttime (6:00 PM–6:00 AM)
April–September437218
July–December180165
Table 3. Performance comparison under different model inputs.
Raw Record DataElectrical Data DerivativesMonthTime of DayAccuracy (%)F1 Score (%)
68.5267.21
72.2170.99
86.9885.84
88.5487.61
92.2191.98
Table 4. Performance with different multimodal fusion components.
Tab-TransformerLSTM-Based FusionCross-Attention FusionAccuracy (%)F1 Score (%)
85.2184.99
80.2979.87
83.8582.22
92.2191.98
Table 5. Ablation study results under different model architectures.
ConfigurationAccuracy (%)F1 Score (%)
2 LSTM Layers92.3591.15
TabTransformer (dim = 64)90.2788.15
Proposed Method92.2191.98
Table 6. Performance comparison of different losses.
LossAccuracy (%)F1 Score (%)
The proposed loss92.2191.98
L focal 90.0289.87
L LS 88.9387.75
L CE 88.9887.05
Table 7. Comprehensive performance comparison.
MethodAccuracy (%)F1 Score (%)Test Time (ms)
CNN84.7783.7022
LSTM81.9280.1228
BiLSTM82.9881.7031
GRU82.4280.6926
DBN76.5674.8128
Proposed92.2191.9841
Disclaimer/Publisher’s Note: The statements, opinions and data contained in all publications are solely those of the individual author(s) and contributor(s) and not of MDPI and/or the editor(s). MDPI and/or the editor(s) disclaim responsibility for any injury to people or property resulting from any ideas, methods, instructions or products referred to in the content.

