
Research on Alternating Current Resistance of High-Voltage Cable Conductors: Optimization of Test Method and Discussion of Test Results

 and
and 
Abstract
1. Introduction
2. Theory of the Optimized Method
2.1. Error Analysis of AC Resistance Test Results for Cable Conductors
2.2. Optimized Method of AC Resistance Test Based on Active Power
3. Design and Verification of AC Resistance Testing System
3.1. The Design of the AC Resistance Testing System
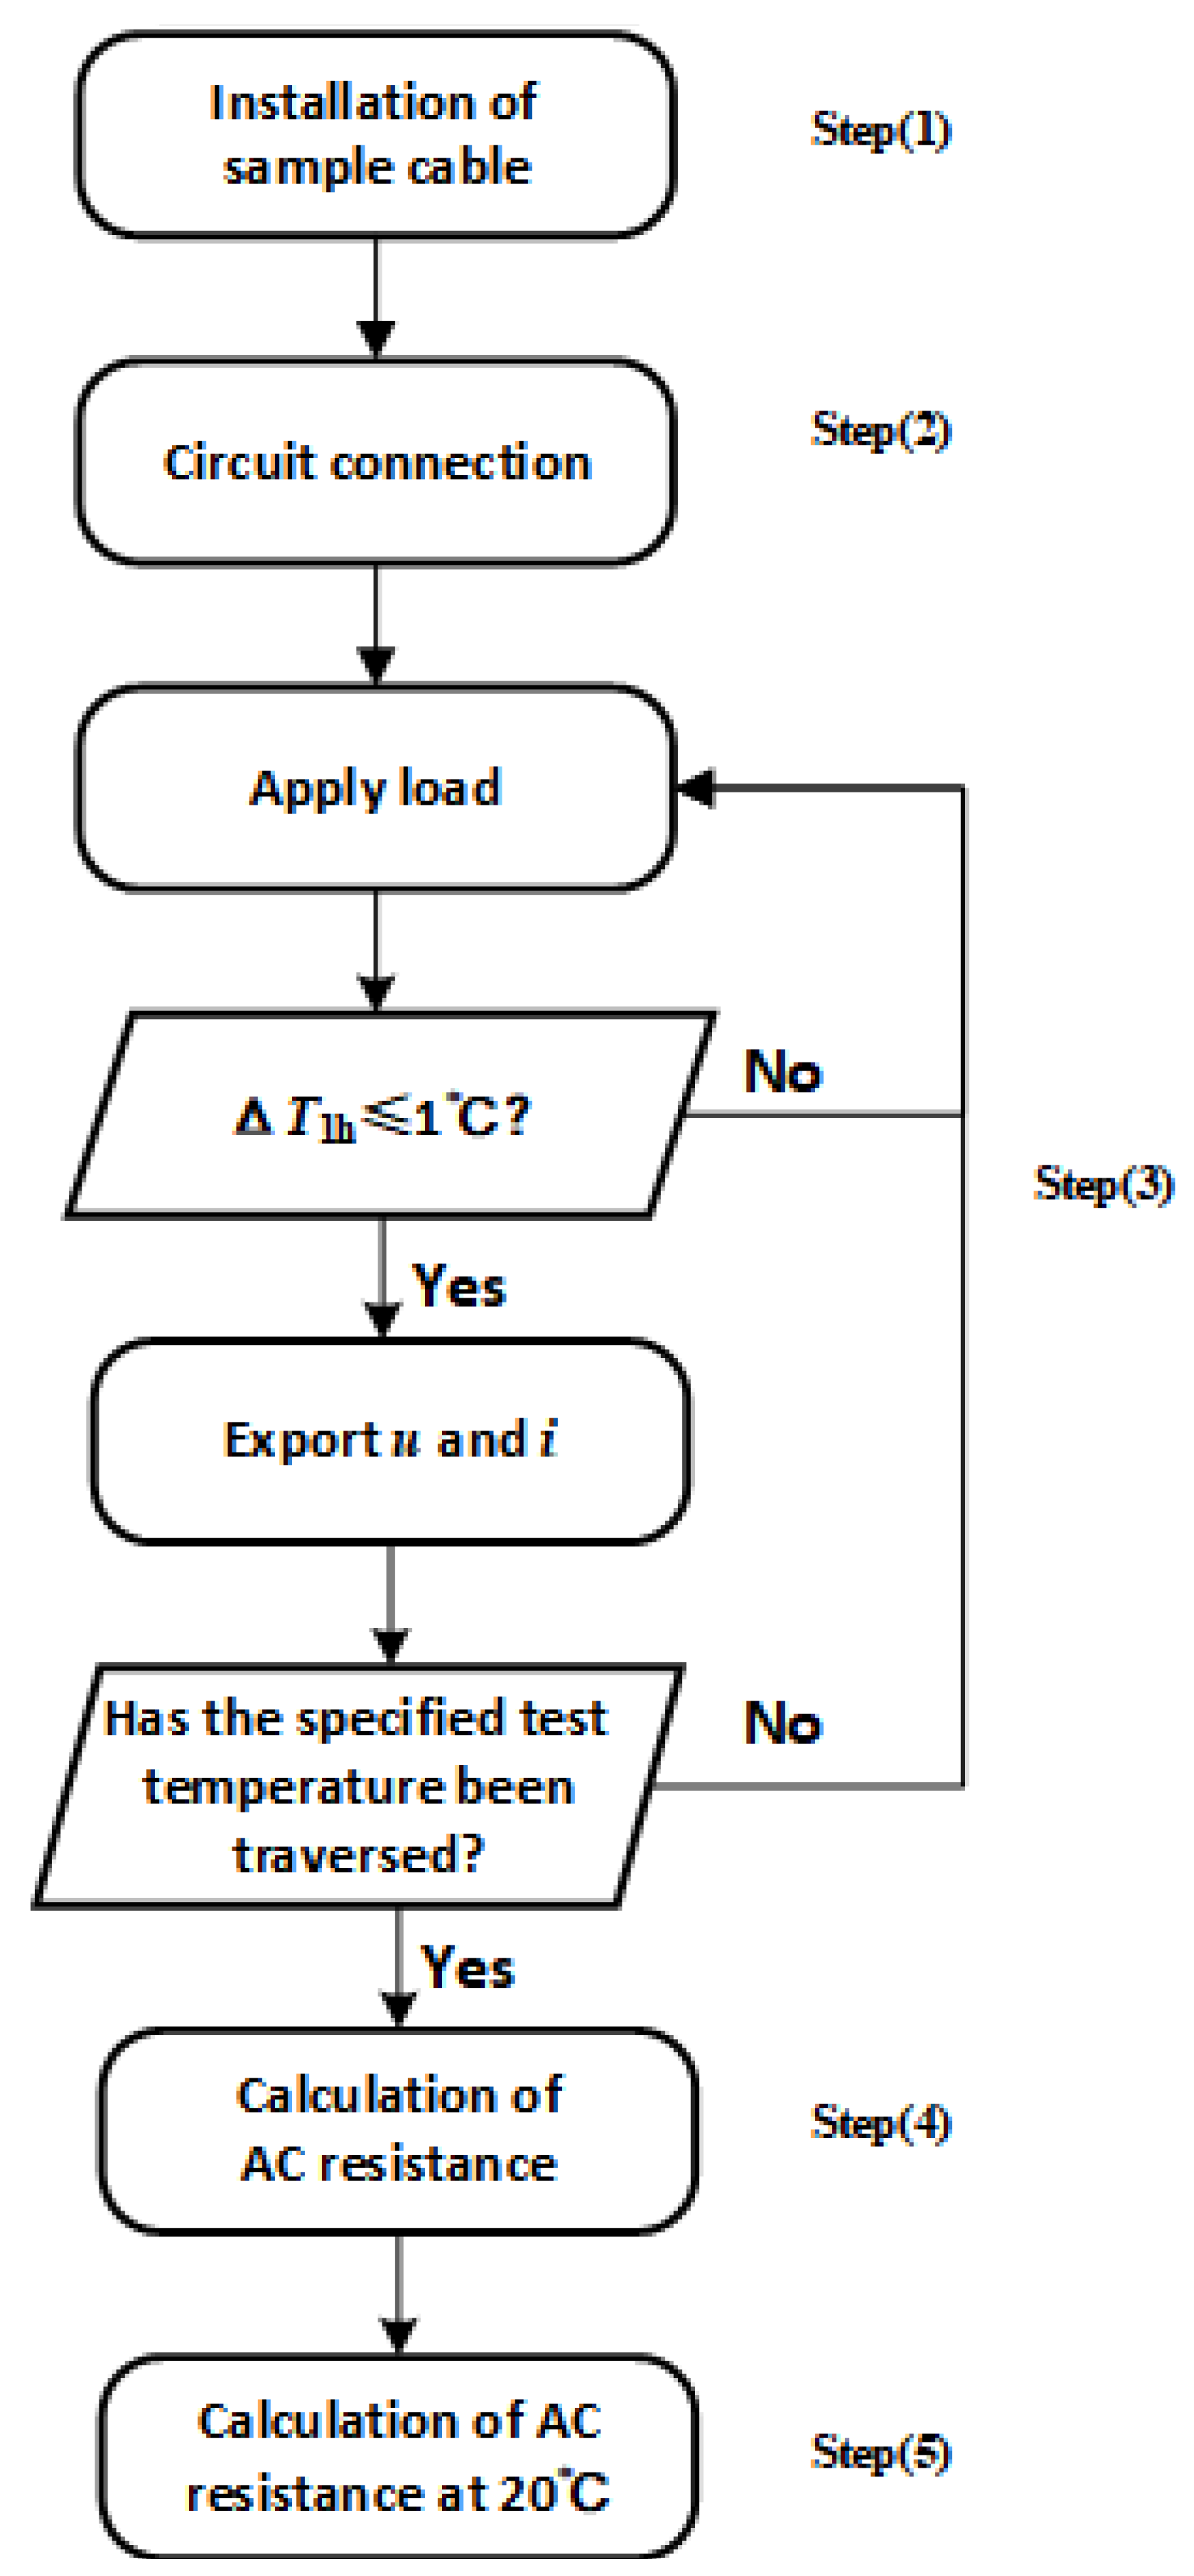
3.2. Steps of AC Resistance Test
- (1)
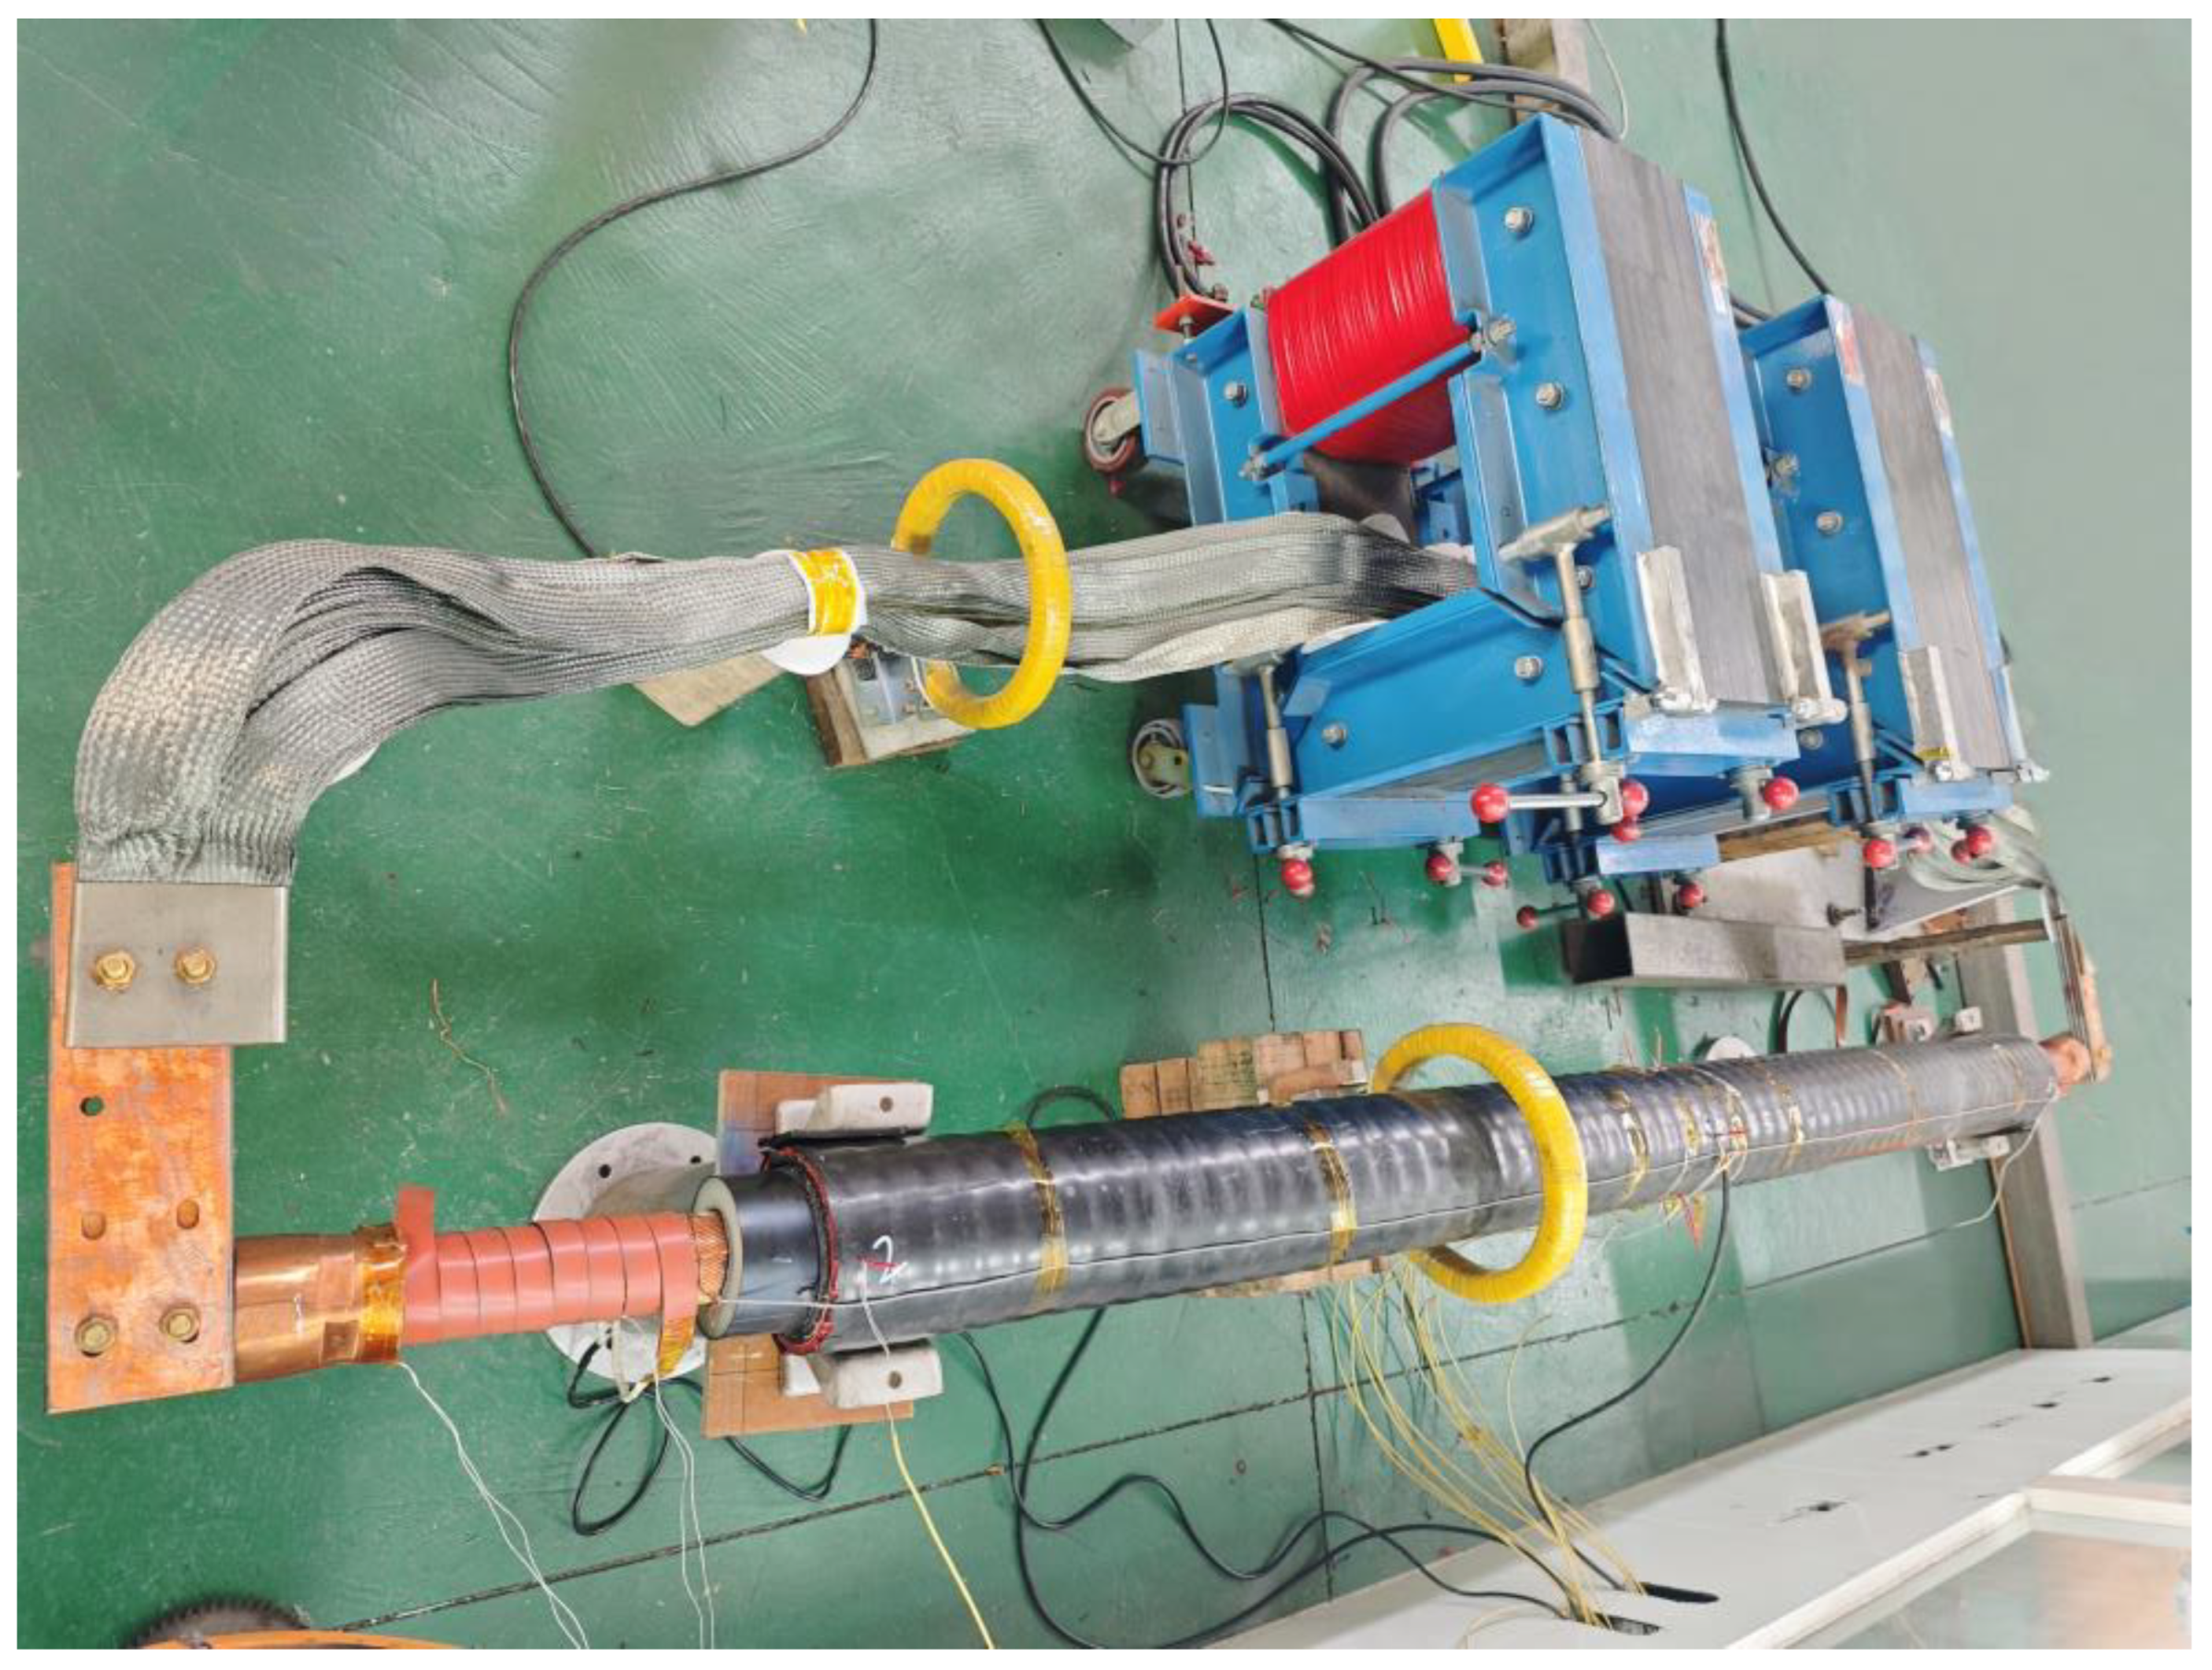
- Installing the Sample Cable: Choose clamps to match the cross-sectional area of the sample cable conductor. Then, connect and fasten the sample cable to the clamps. Meanwhile, install thermal signal monitors on the sample cable.
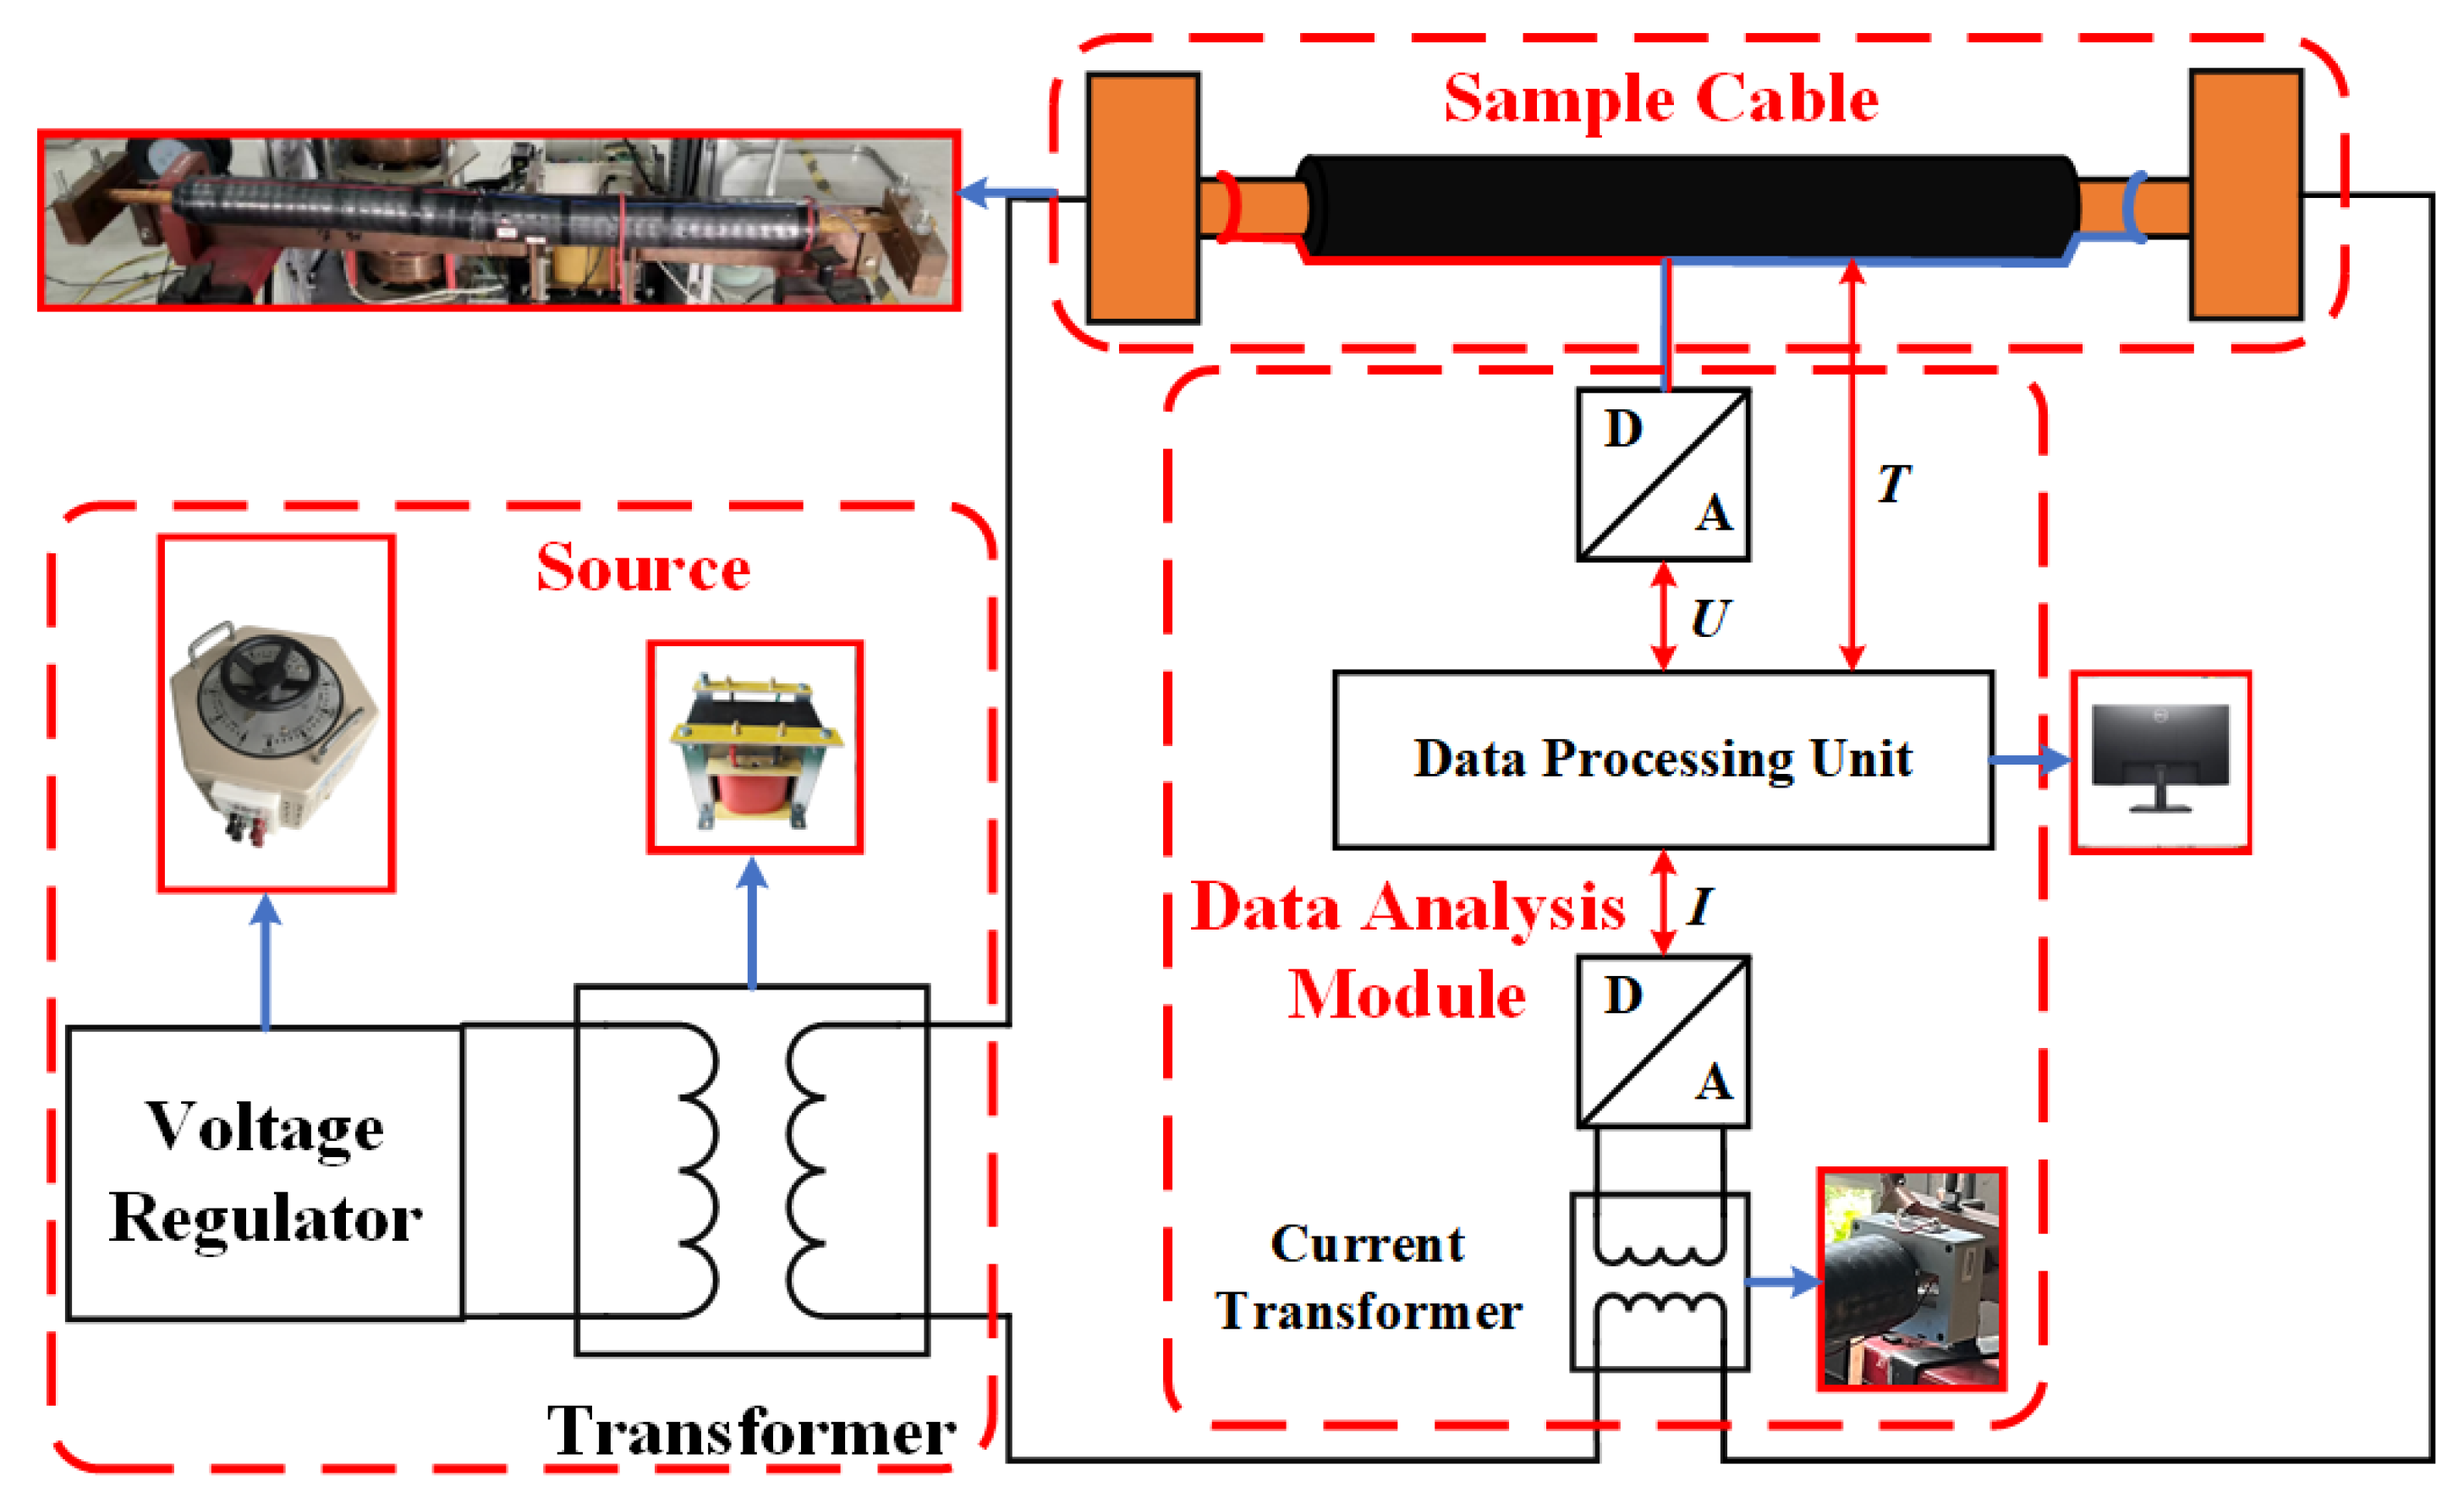
- (2)
- Connecting the Testing Circuit: Connect the source, the testing circuit, the sample cable, and the data processing unit, as shown in Figure 4.
- (3)
- Conducting the Test: Applying the specified current to the sample cable causes the cable to heat up. If the temperature variation ΔT1h of the cable conductor remains within ±1 °C for one hour near the target temperature, the cable conductor’s temperature is considered to be stable. After this, multiple sets of voltage and current data should be recorded. Repeat the test by varying the current through the cable conductor and set the conductor temperature to the recommended temperatures of 40 °C, 50 °C, 60 °C, 70 °C, and 80 °C. Ensure that the temperature points of these settings are all traversed.
- (4)
- Deriving AC Resistance at Different Temperatures: Export the measured voltage and current data of the sample cable. Then, for each temperature of the sample cable, calculate the AC resistance of the conductor using Equations (10)–(13). Then, calculate the average value as the AC resistance of the cable conductor for each temperature to obtain a set of AC resistance data at different temperatures.
- (5)
- Deriving AC Resistance at 20 °C: Perform linear fit of the AC resistance–temperature curve R(T) by using the AC resistance–temperature data obtained in step (4). Then, obtain the AC resistance of the sample cable conductor at 20 °C based on R(T).
3.3. Accuracy Verification of the Optimized Method
3.4. An Error Analysis of the AC Resistance Testing System
4. Preparation of Test Samples
5. Results and Discussion
6. Conclusions
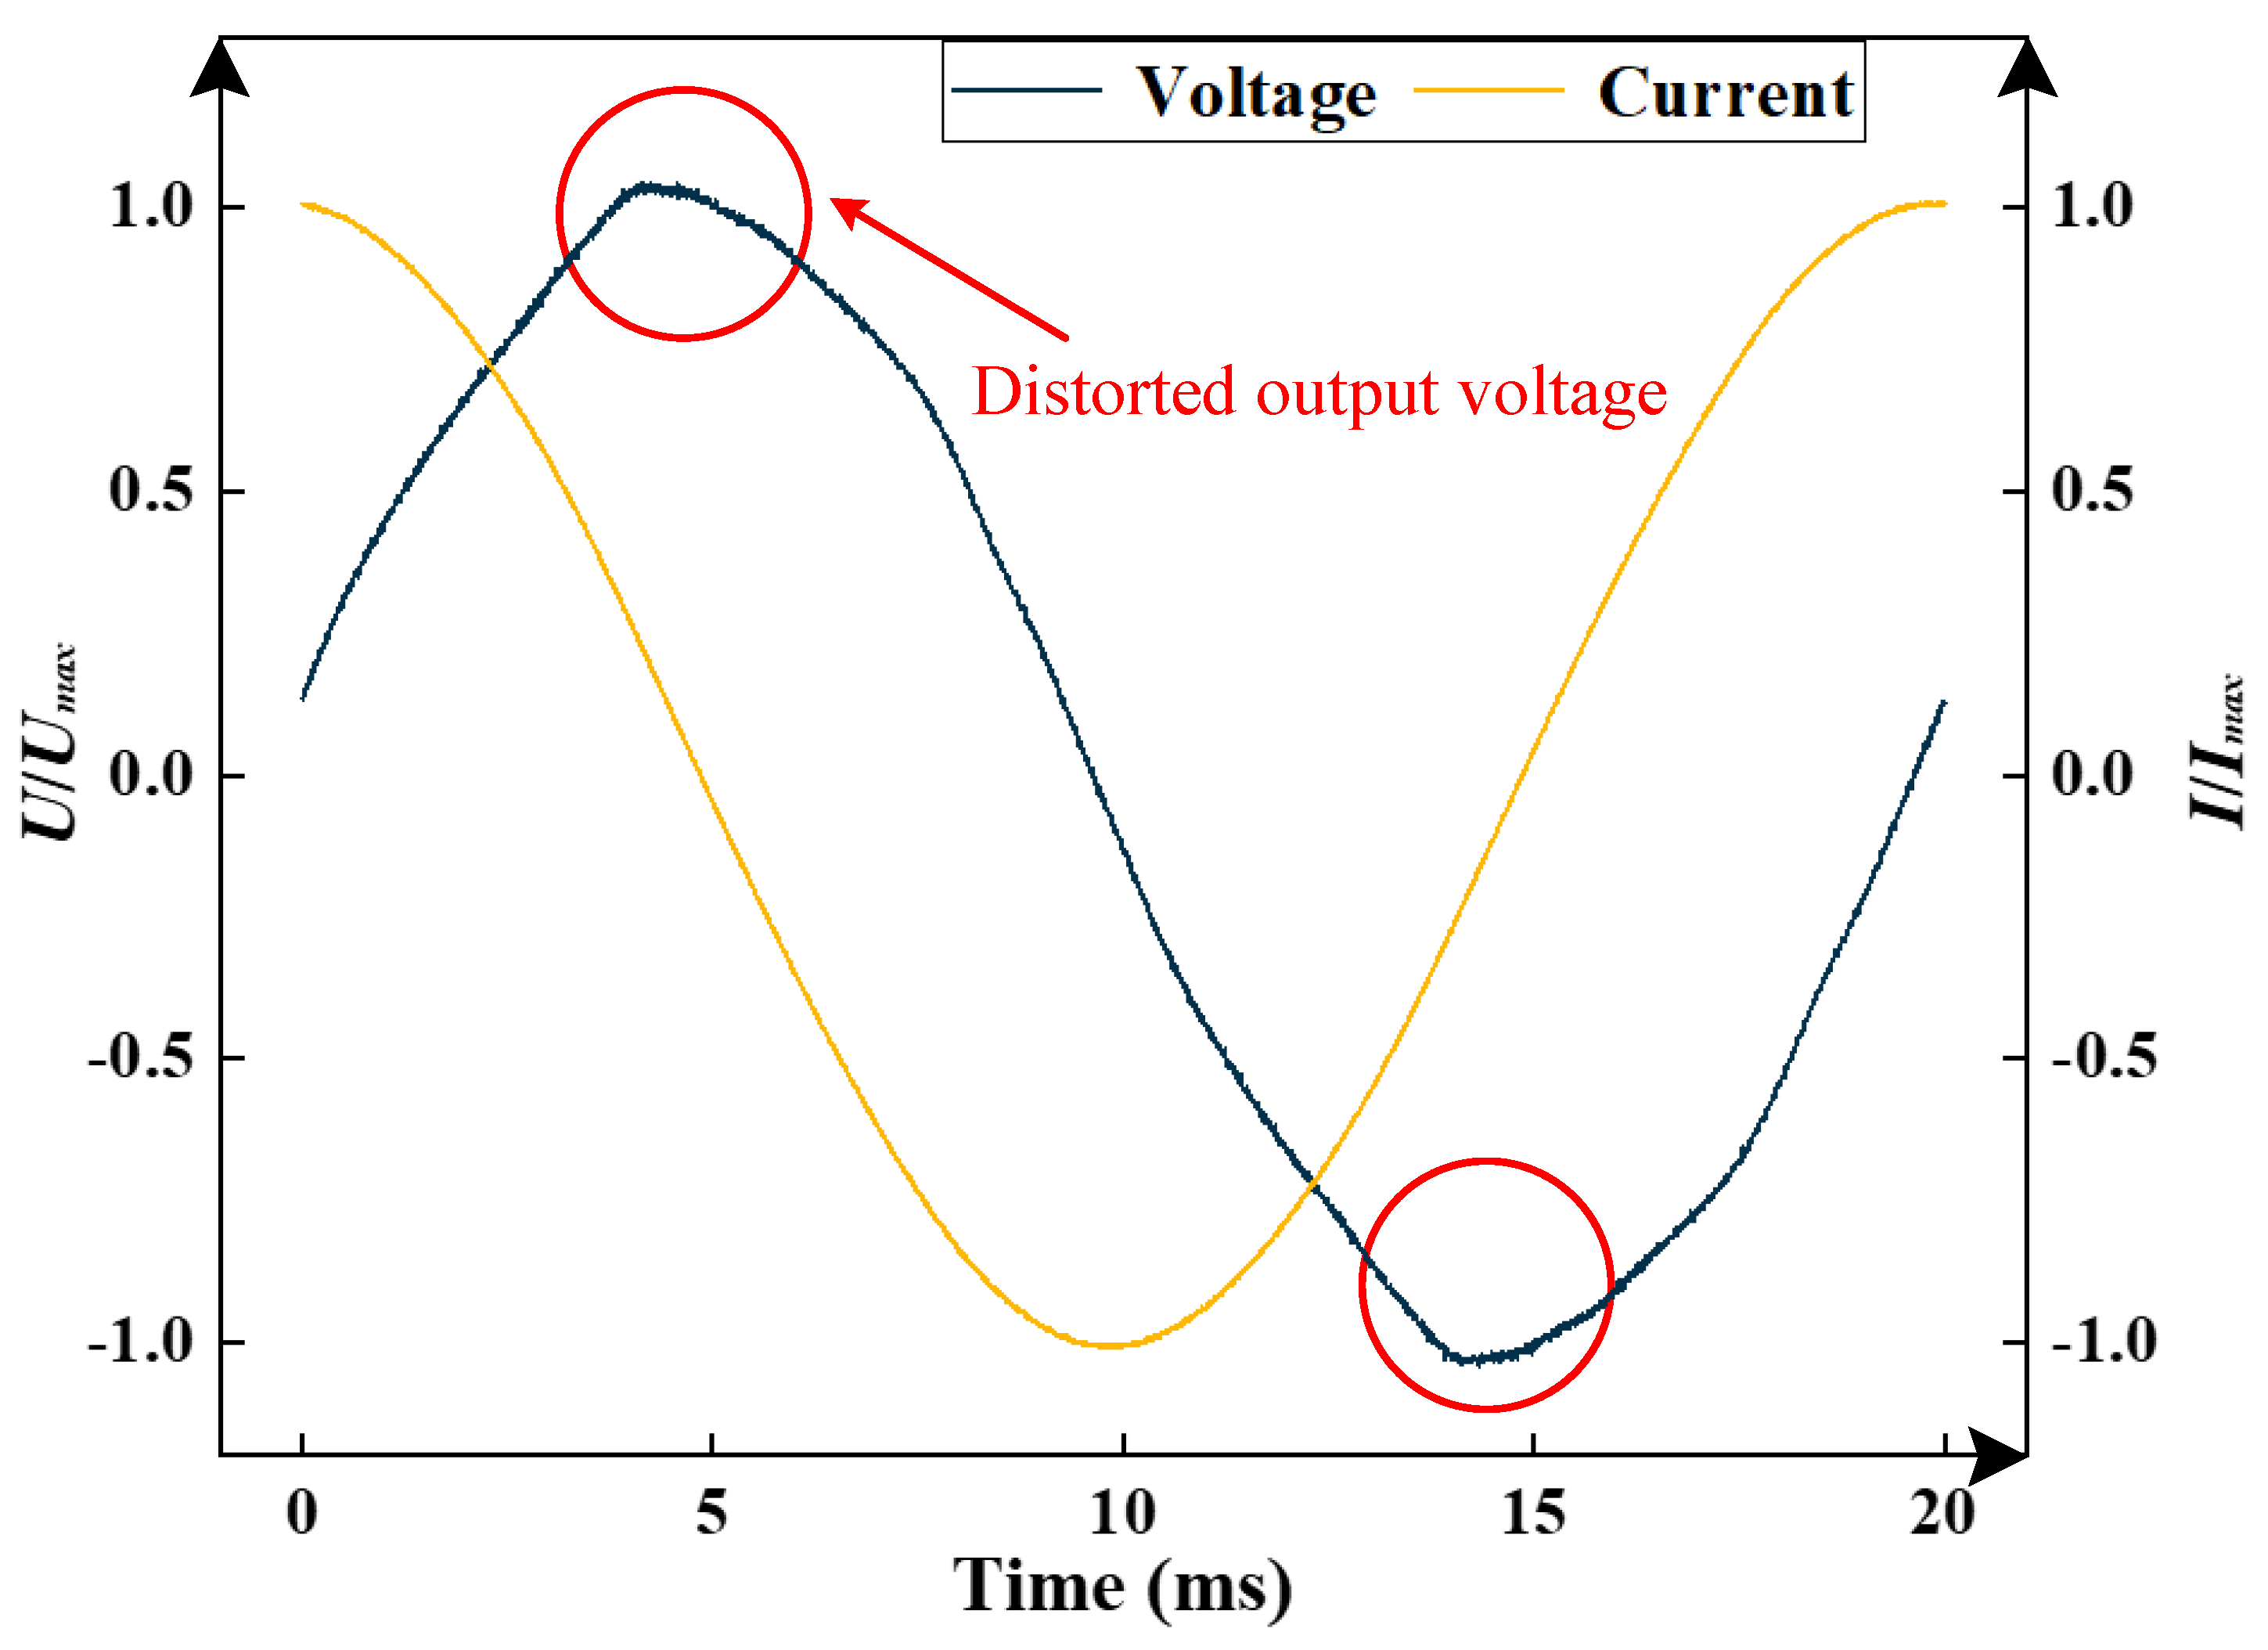
- (1)
- Waveform distortion is a common issue in the existing AC resistance test, which leads to an error between the test value and the actual value of AC resistance when using the testing method recommended by CIGRE TB 894.
- (2)
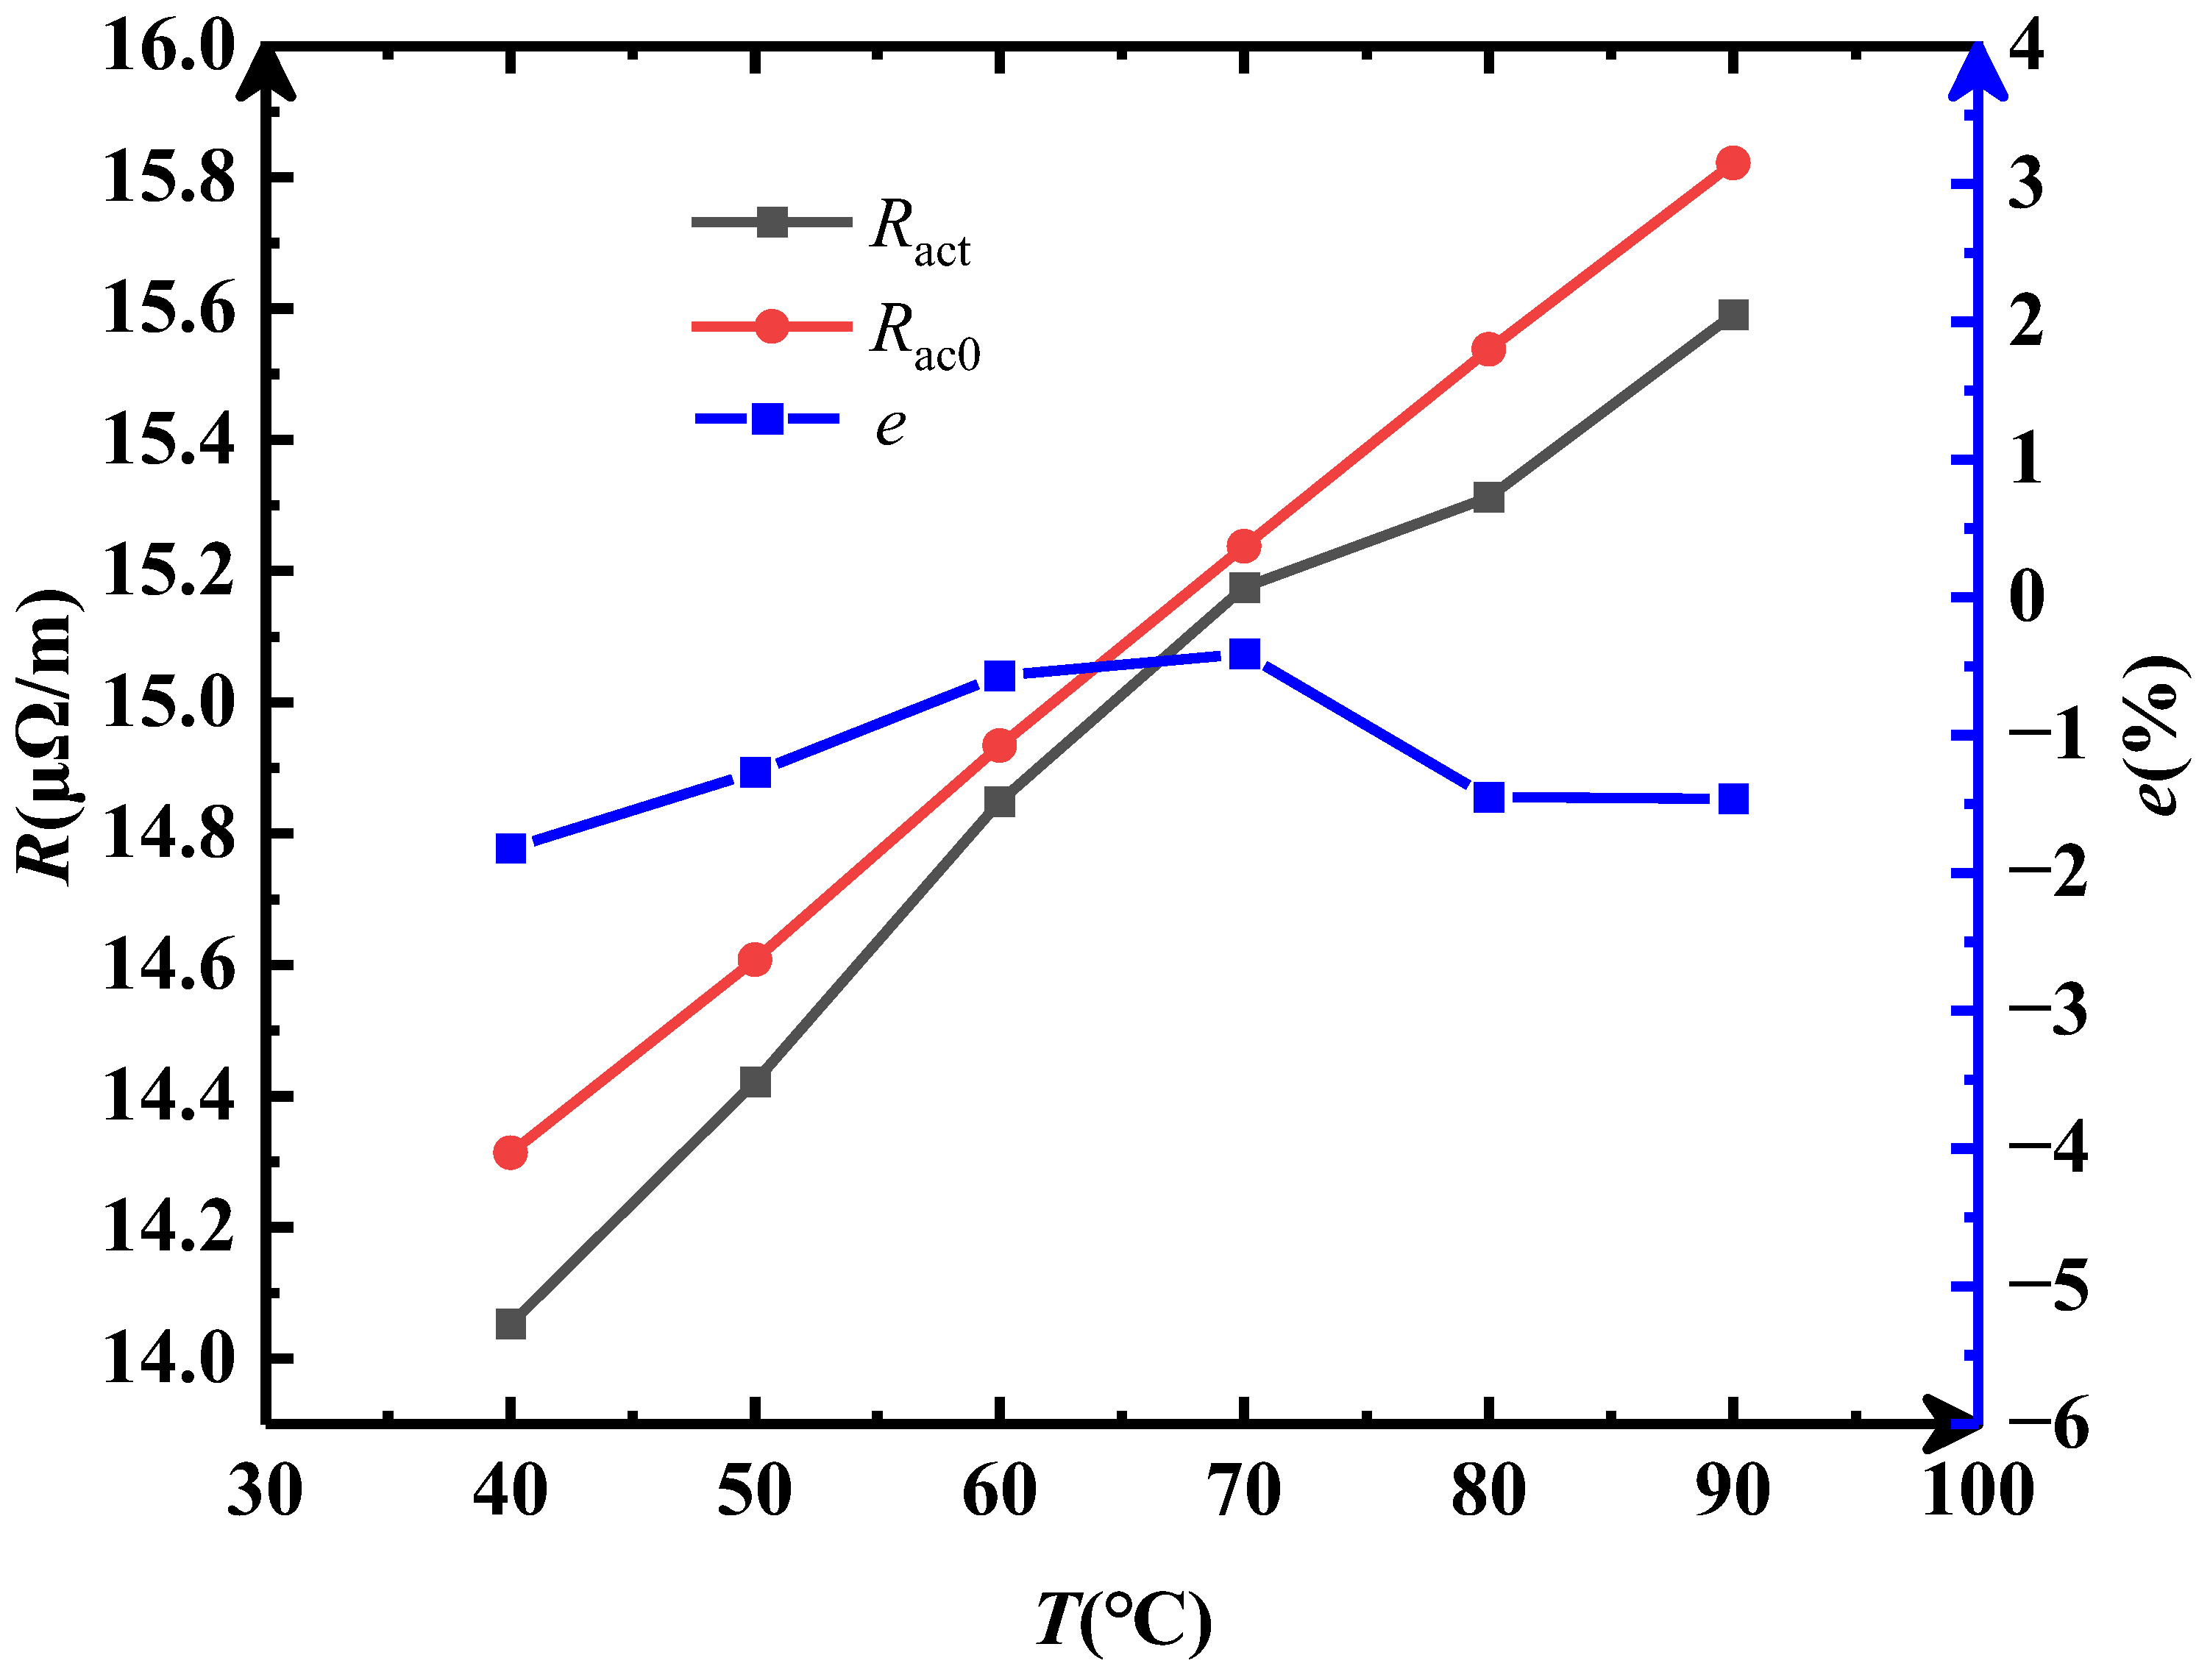
- An optimized AC resistance testing method based on active power is proposed. The results of the accuracy verification test of the testing method show that the AC resistance measuring error of the testing method does not exceed 2%.
- (3)
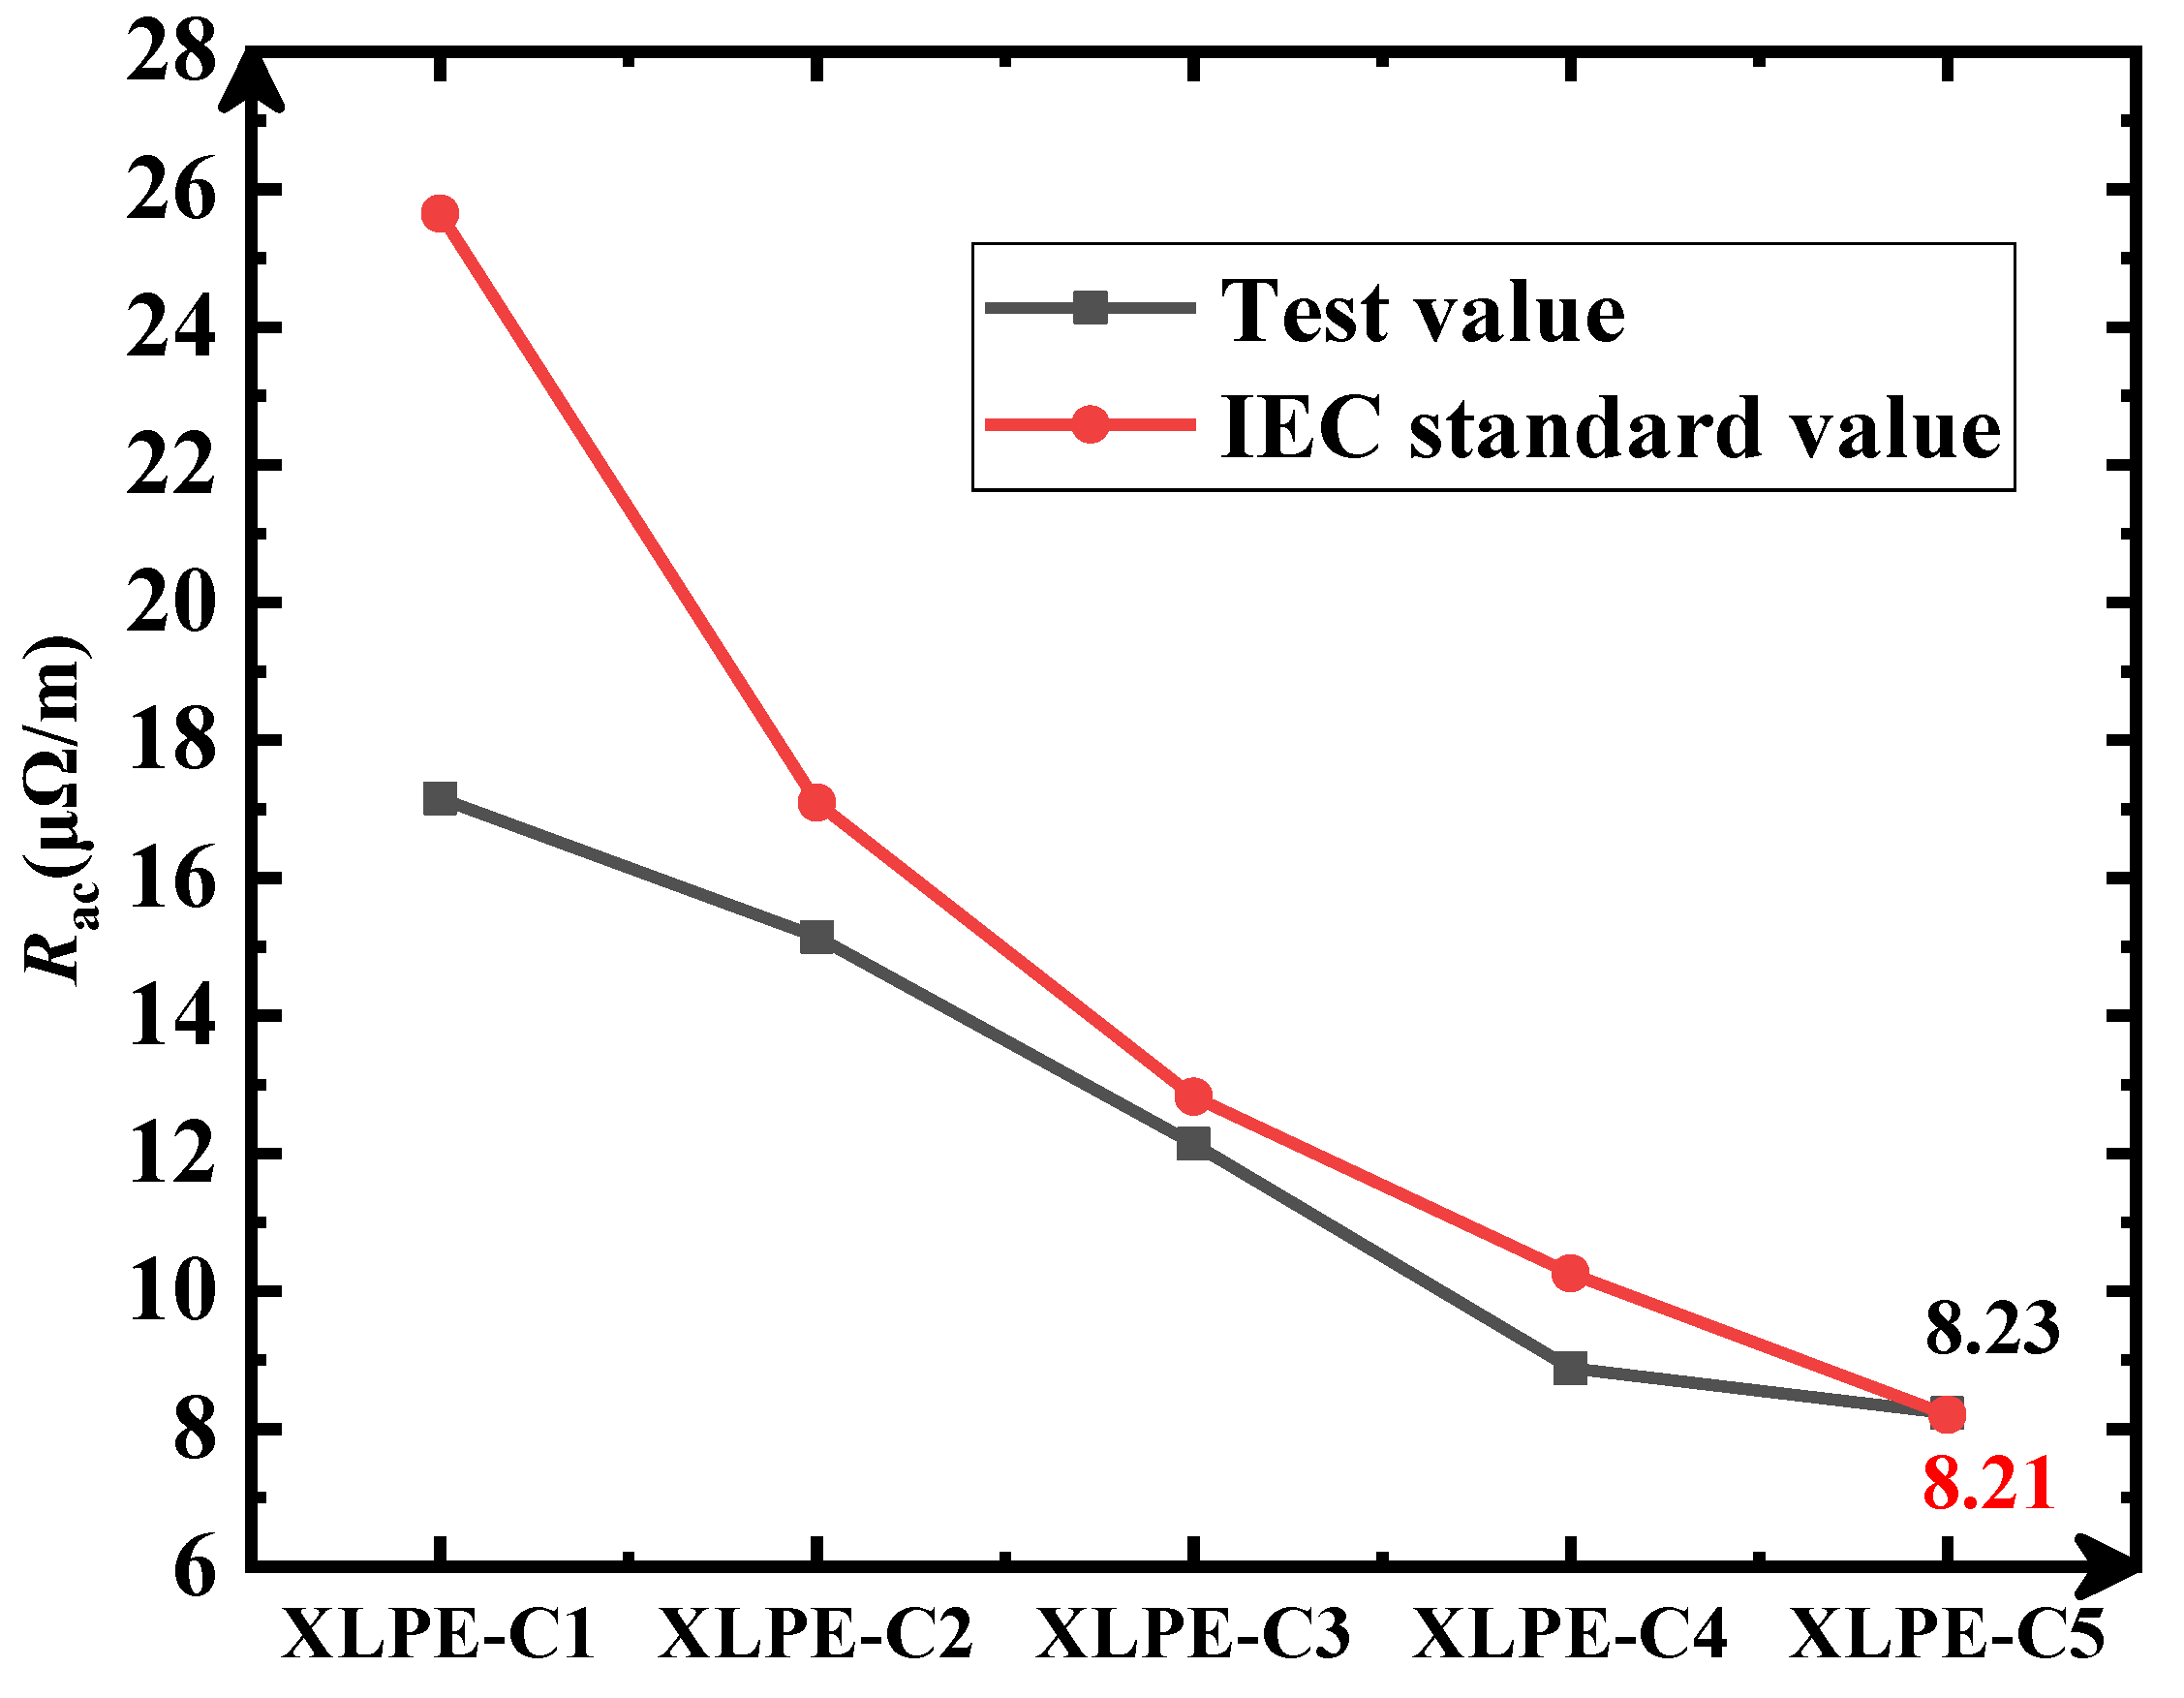
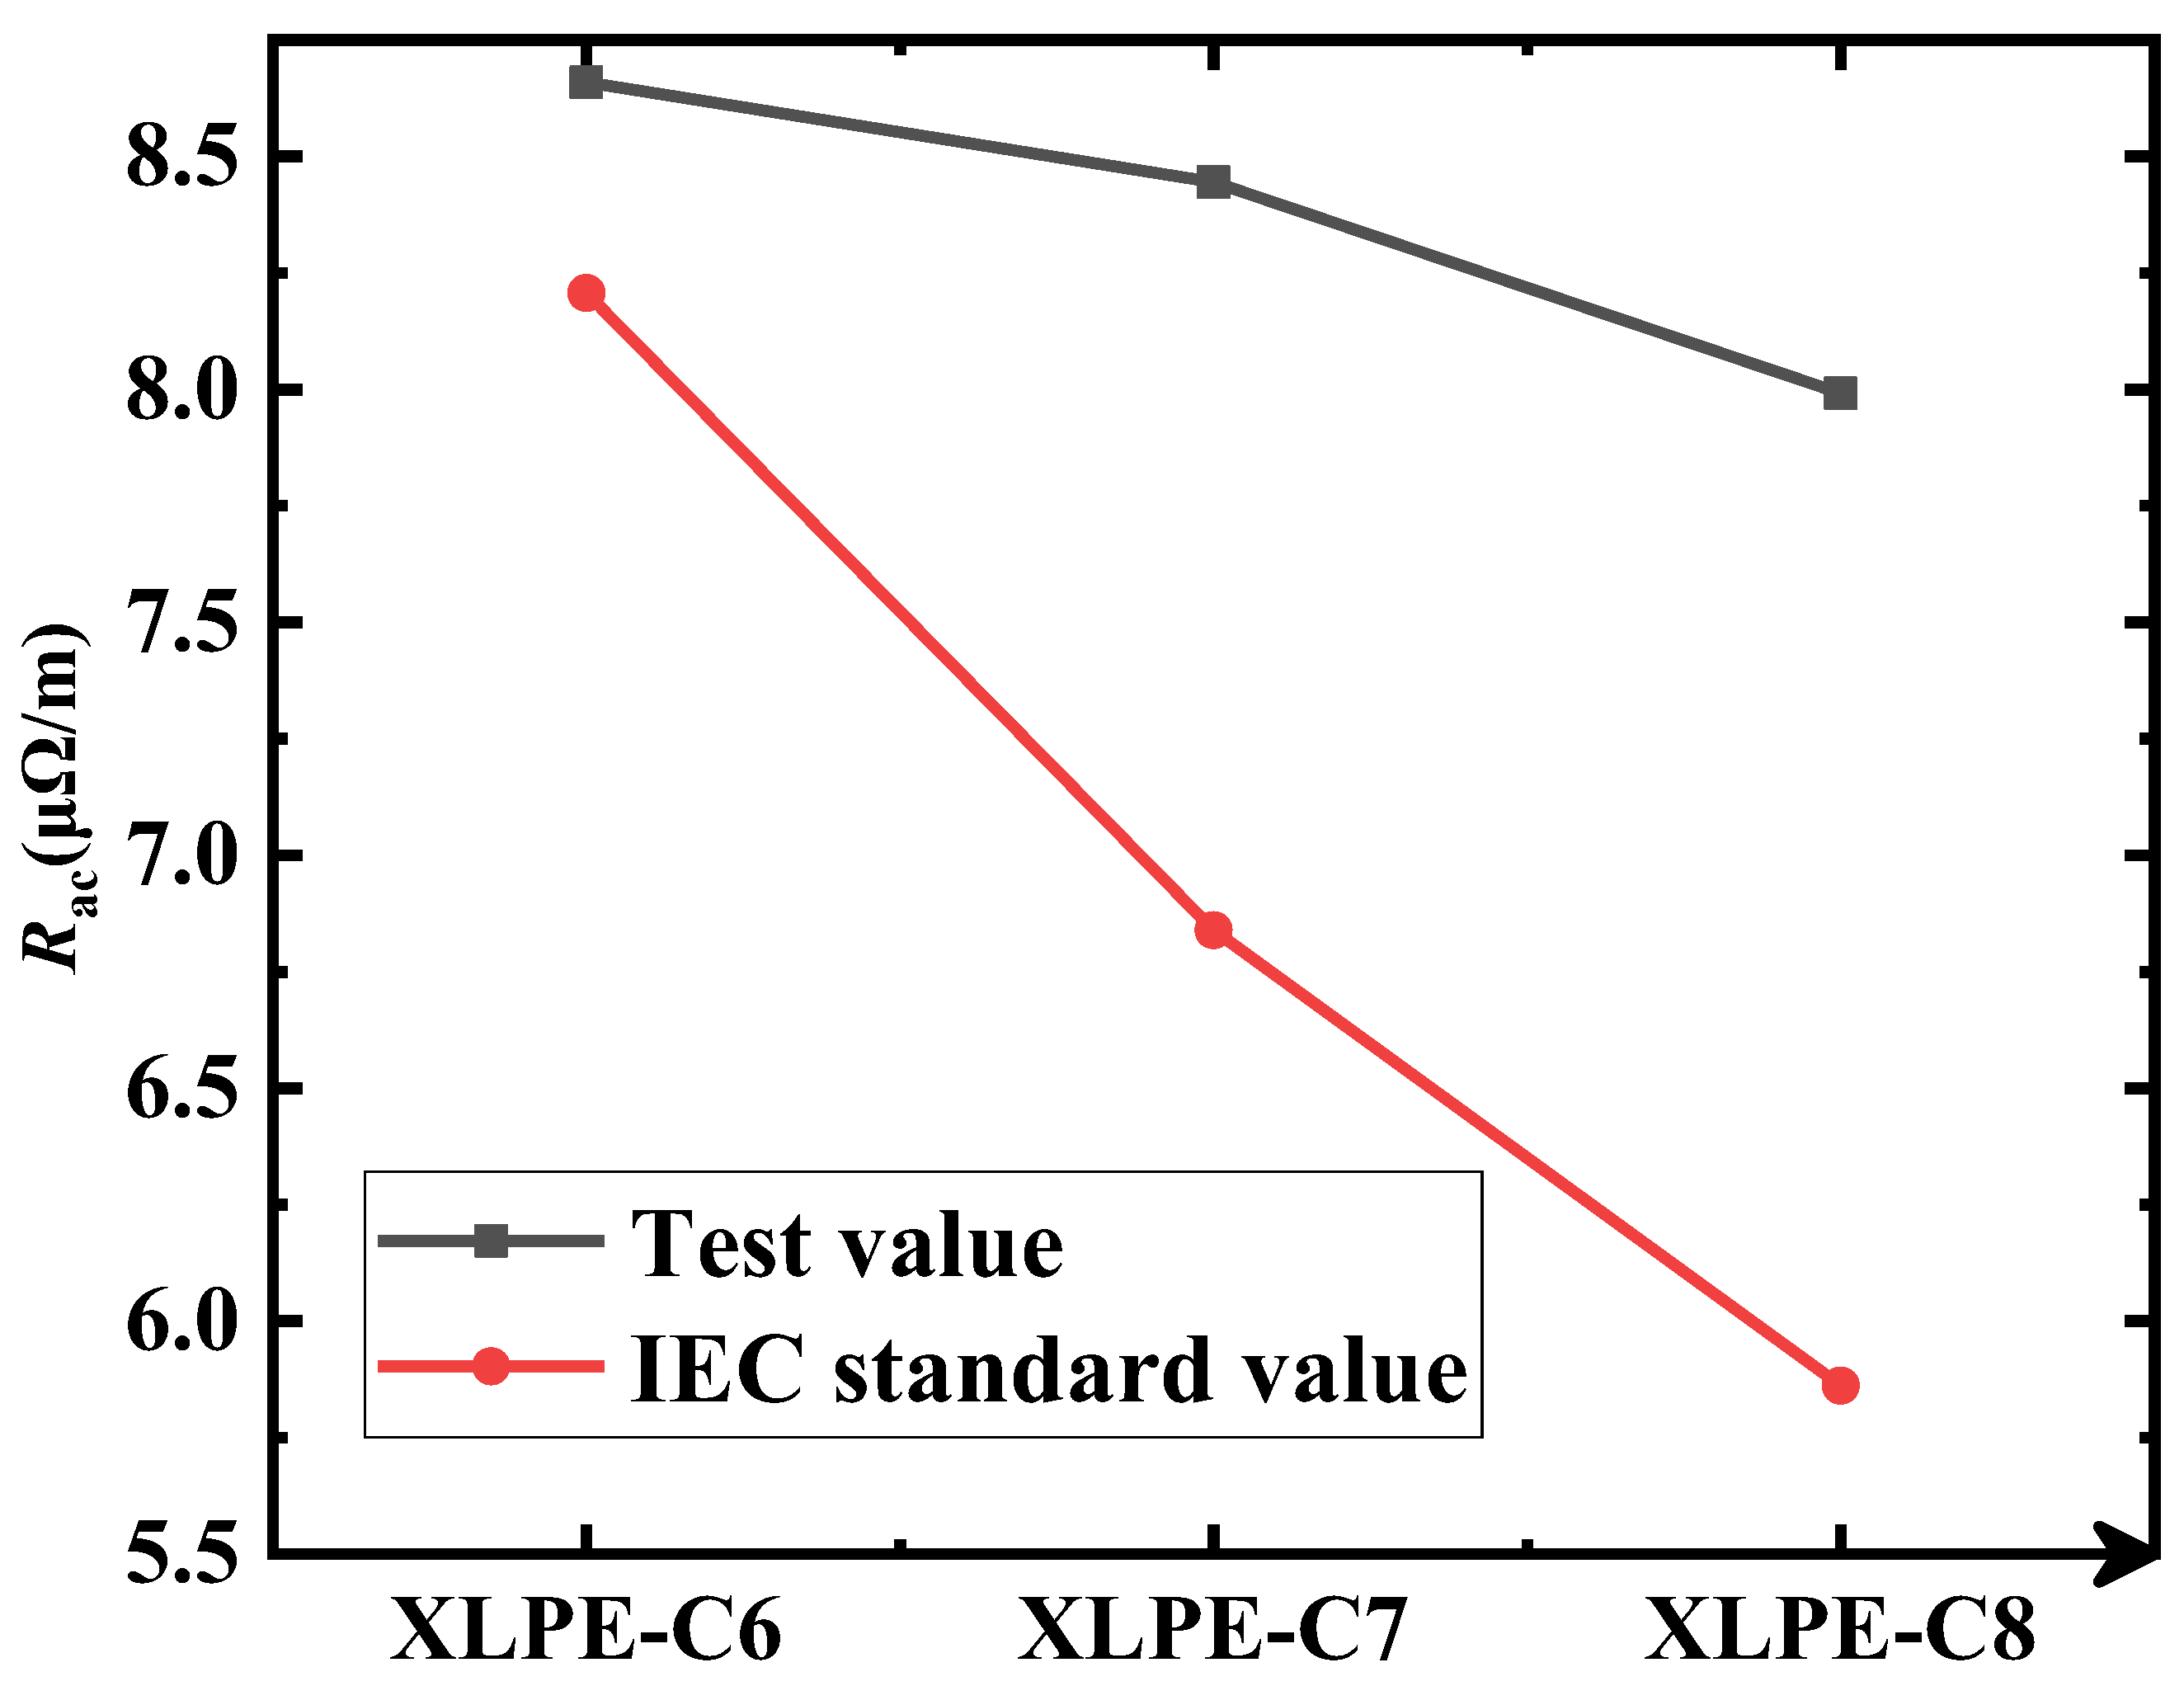
- The conservatism of the AC resistance evaluation of the IEC standard is negatively correlated with the cross-sectional area of the cable conductor. Furthermore, the conservatism is lost when the cross-sectional area of the cable conductor exceeds 2000 mm2.
- (4)
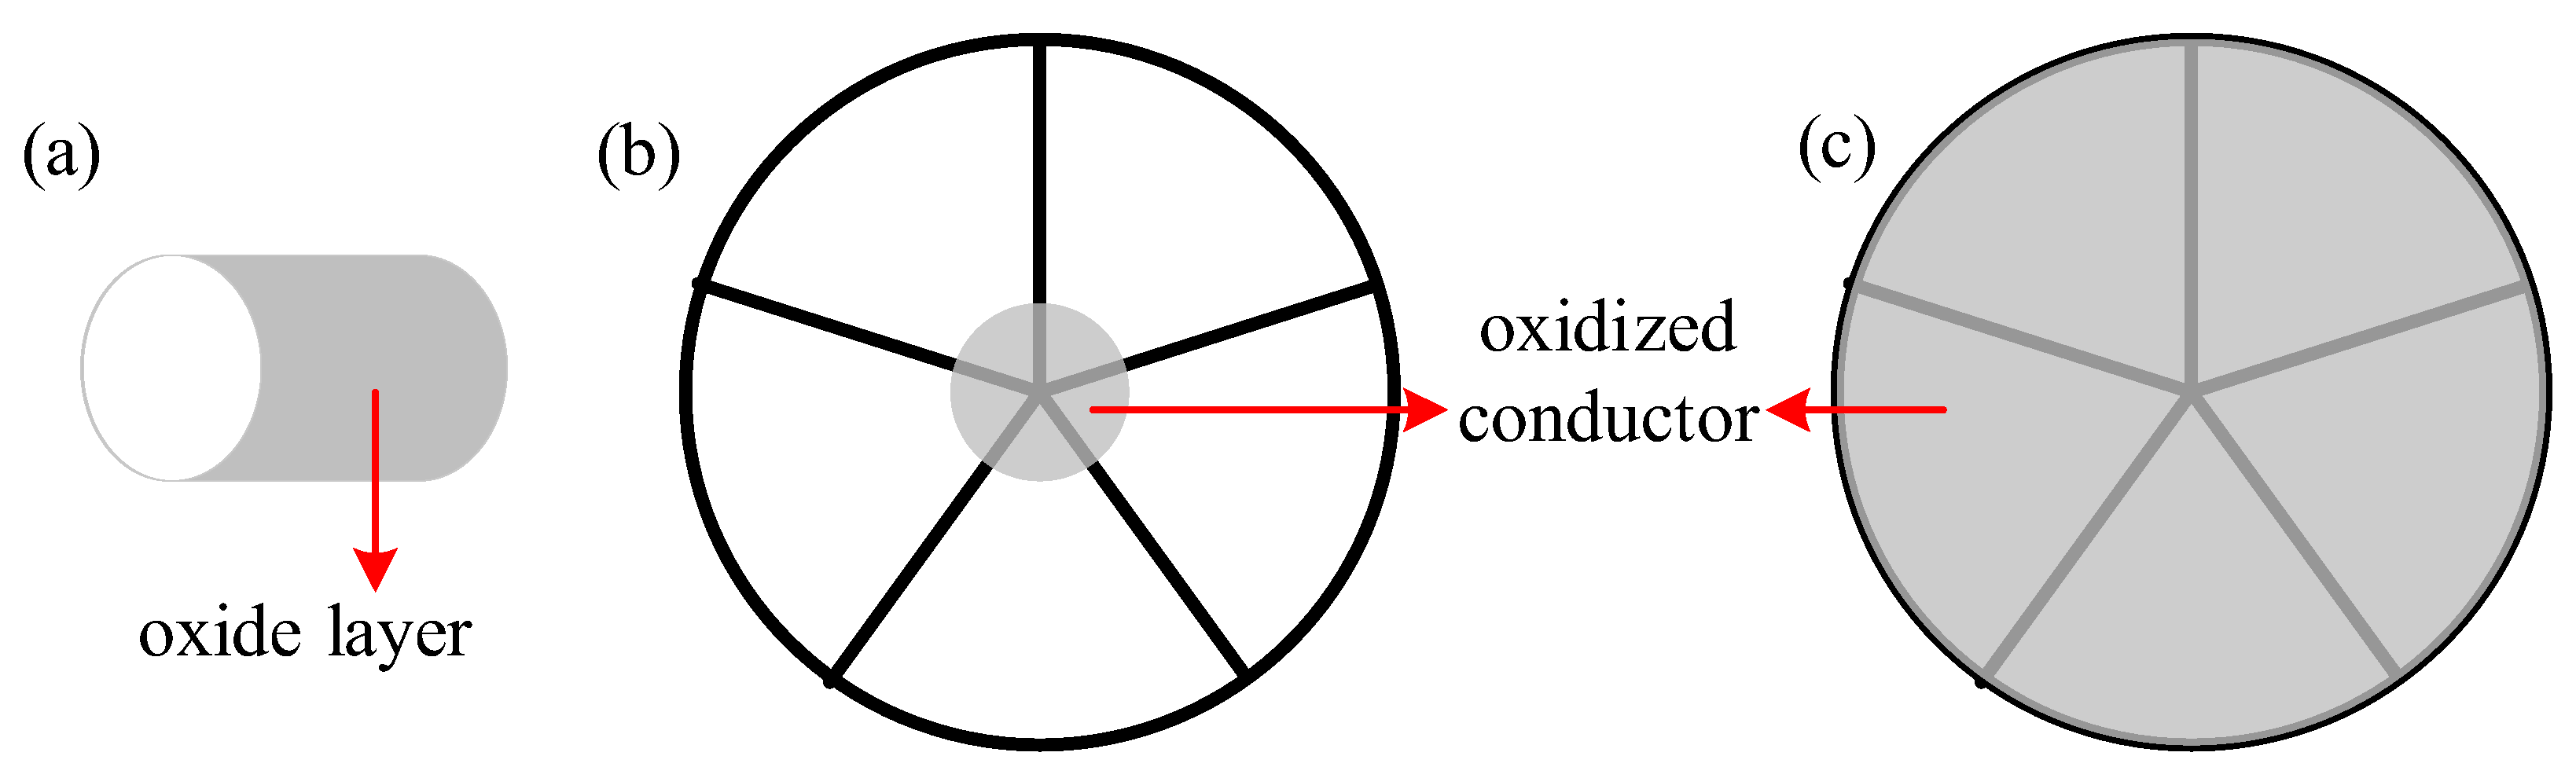
- The AC resistance of cable conductors is negatively correlated with both the degree of segmentation and the number of oxidized copper wires in the conductor. Therefore, increasing the degree of segmentation and the number of oxidized copper wires in production can effectively reduce the AC resistance of cable conductors.
Author Contributions
Funding
Data Availability Statement
Conflicts of Interest
Nomenclature
| I0 | current amplitude |
| U0 | voltage amplitude |
| Θ | phase difference |
| Ak | amplitude of k-th voltage harmonic |
| Ω | angular frequency of power frequency |
| Bk | amplitude of k-th current harmonic |
| u(tk) | voltage data points |
| i(tk) | current data points |
| Tk | sampling time |
| p(tk) | active power |
| n | number of data points |
| RAC | AC resistance |
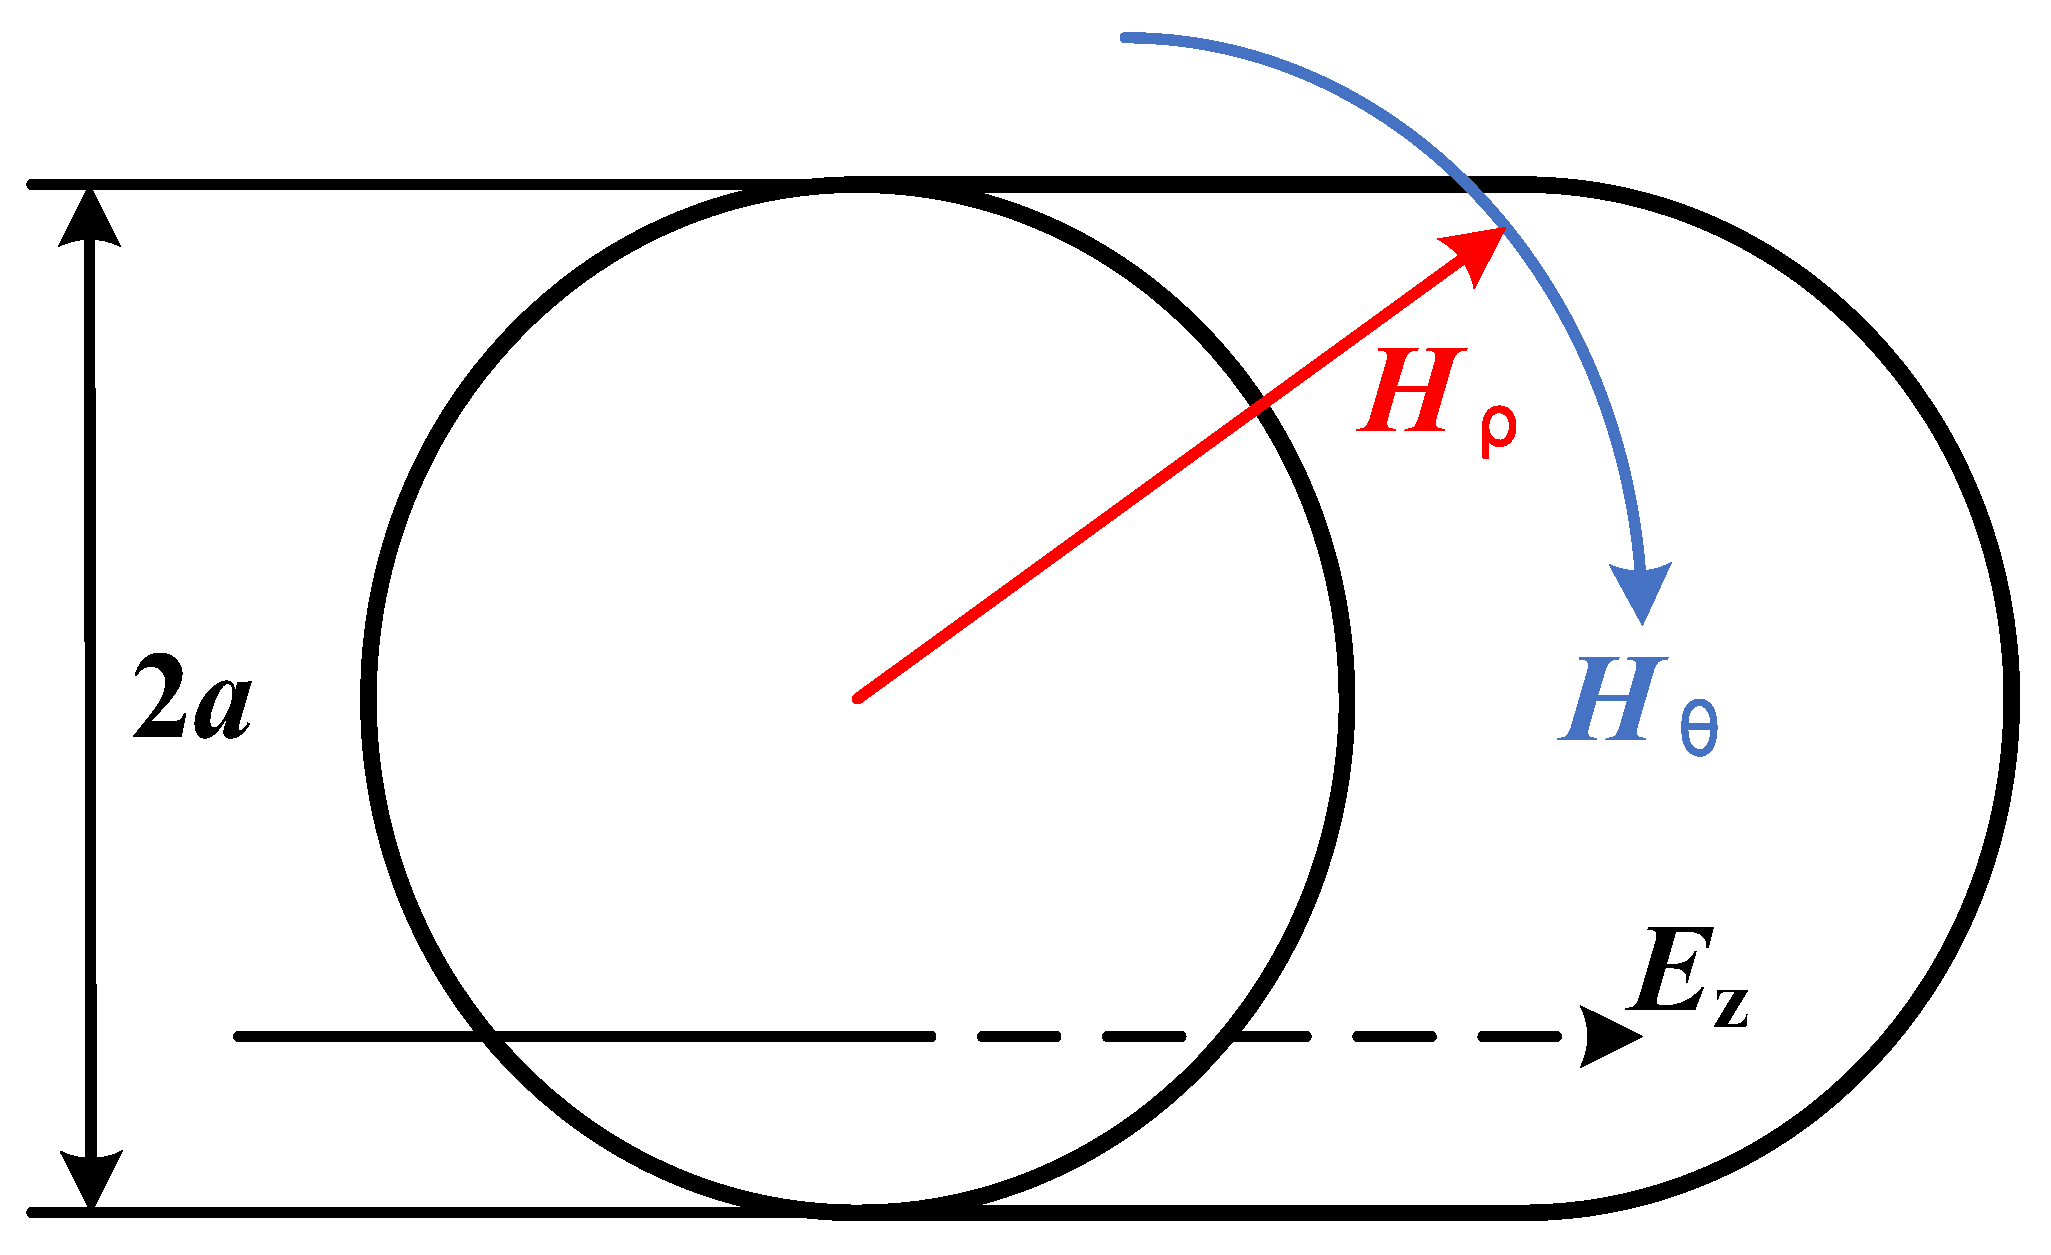
| ρ | radial distance |
| Ez | electric field component in z direction |
| Hρ | component of magnetic field along polar angle (ρ) |
| j | imaginary number unit |
| Hθ | component of magnetic field in polar angle direction (θ) |
| WJ | energy density |
| μ | magnetic permeability |
| f | power frequency |
References
- Zeng, T.; Yang, G.; Yuan, M.; Chen, Y.; Fang, F.; Xu, X. Theoretical modeling and experimental verification of AC resistance in large cross-section XLPE single-core cables. In Proceedings of the 2024 9th International Conference on Power and Renewable Energy (ICPRE), Guangzhou, China, 20–23 September 2024; pp. 77–82. [Google Scholar]
- Li, L. Design and selection of conductor structure for large cross-section high-voltage cable. Wire Cable 2021, 64, 41–43+46. [Google Scholar]
- Zhang, H.; Zhang, J.; Duan, L.; Xie, S.; Xue, J. Application status of XLPE insulated submarine cable used in offshore wind farm in China. J. Eng. 2017, 13, 702–707. [Google Scholar] [CrossRef]
- Lin, R.; Huang, Y.; Lu, Y.; Li, Q.; Liu, S.; Luo, G. Research on optimal selection of submarine cable cross-section considering ampacity matching in all laying scenarios. In Proceedings of the 2024 4th Power System and Green Energy Conference (PSGEC), Shanghai, China, 22–24 August 2024; pp. 604–611. [Google Scholar]
- Song, Y.; Chen, W.; Wan, F.; Zhang, Z.; Du, L.; Wang, P.; Li, J.; Wu, Z.; Huang, H. Online multi-parameter sensing and condition assessment technology for power cables: A review. Electr. Power Syst. Res. 2022, 210, 108140. [Google Scholar] [CrossRef]
- Wang, J.; Li, W.; Zhang, W.; Wan, B.; Zha, J. Aging and life control of cross-linked polyethylene as cable insulation material. Acta Phys. Sin. 2024, 73, 078801. [Google Scholar] [CrossRef]
- Zhu, X.; Yin, Y.; Wu, J.; Wang, X. Study on aging characteristics of XLPE cable insulation based on quantum chemical calculation. IEEE Trans. Dielectr. Electr. Insul. 2020, 27, 1942–1950. [Google Scholar] [CrossRef]
- Wu, K.; Zhang, T.; Lin, W.; Wu, S.; Feng, Y.; Zuo, X.; Zhang, Y. Electrical resistance performance of cable accessory interface considering thermal effects. Materials 2023, 16, 4122. [Google Scholar] [CrossRef] [PubMed]
- Nie, Y.; Zhao, X.P.; Li, S.T. Research progress in condition monitoring and insulation diagnosis of XLPE cable. High Volt. Eng. 2020, 46, 1361–1371. [Google Scholar]
- Zhao, Y.; Xie, Y.; Zhao, Y.; Huang, J.; Fan, X.; Nie, Y.; Liu, G. Dynamic ageing research of cross-linked polyethylene cable insulation based on temporal-spatial dimension under combined electro-thermal effect. High Volt. 2023, 8, 1067–1081. [Google Scholar] [CrossRef]
- Cabral, S.H.L.; Bertoli, S.L.; Medeiros, A.; Hillesheim, C.R.; De Souza, C.K.; Stefenon, S.F. Practical aspects of the skin effect in low frequencies in rectangular conductors. IEEE Access 2021, 9, 49424–49433. [Google Scholar] [CrossRef]
- Jabłoński, P.; Kusiak, D.; Szczegielniak, T.; Piątek, Z. The proximity effect in twin line with round conductors placed in conductive medium. Energies 2020, 13, 6087. [Google Scholar] [CrossRef]
- Raicevic, N.B.; Aleksic, S.R.; Iatcheva, I.; Barukcic, M. Enhanced method for pulse skin effect calculation of cylindrical conductors. COMPEL-Int. J. Comput. Math. Electr. Electron. Eng. 2020, 39, 623–635. [Google Scholar] [CrossRef]
- Tabei, B.; Ametani, A.; Gole, A.M.; Kordi, B. Study of skin and proximity effects of conductors for MTL-based modeling of power transformers using FEM. In Proceedings of the IEEE Power Energy Society General Meeting (PESGM), Montreal, QC, Canada, 2–6 August 2020; pp. 1–5. [Google Scholar]
- GB/T 3048.4-2007; Performance Test Methods for Wires and Cables—Part 4: DC Resistance Test of Conductors. Standardization Administration of China: Beijing, China, 2007.
- IEC 60228-2004; Conductors of Insulated Cables. International Electrotechnical Commission: Geneva, Switzerland, 2004.
- IEC 60287-1-1-2014; Electrical Cables—Calculation of the Current Rating Part 1-1: Current Rating Equations (100% Load Factor) and Calculation of Losses General. International Electrotechnical Commission: Geneva, Switzerland, 2014.
- Deng, X.; Ouyang, B.; Kong, X. Optimization of AC resistance in large cross-section high-voltage cable conductors. High Volt. Eng. 2016, 42, 522–527. [Google Scholar]
- Jabłoński, P.; Szczegielniak, T.; Kusiak, D.; Piątek, Z. Analytical–numerical solution for the skin and proximity effects in two parallel round conductors. Energies 2019, 12, 3584. [Google Scholar] [CrossRef]
- Wu, W.; Qu, X. Measurement of the AC resistance of power cable with large cross-section conductor. In Proceedings of the 16th Annual Conference of China Electrotechnical Society, Proceedings of the 16th Annual Conference of China Electrotechnical Society, Beijing, China, 24–26 September 2021; Yang, Q., Liang, X., Li, Y., He, J., Eds.; Lecture Notes in Electrical Engineering; Springer: Singapore, 2022; Volume 889, pp. 415–419. [Google Scholar]
- Xie, D.; Qin, Z.; Xie, S.; Jiang, J.; Bai, F.; Li, J.; He, G. Research on the measurement of AC resistance of overhead transmission lines considering actual operating conditions. Energies 2024, 17, 6336. [Google Scholar] [CrossRef]
- Suzuki, H.; Kanaoka, M. Theoretical investigation on skin effect factor of conductor in power cables. Electr. Eng. Jpn. 2008, 165, 18–34. [Google Scholar] [CrossRef]
- Qin, S.; Xu, Q.; Wang, Q.; Zhang, J.; Ju, Z.; Hou, Z.; Lian, H.; Wu, T.; Zhang, J. Study on temperature rise characteristics of 110 kV XLPE cable under different service years considering dielectric loss. Energy Rep. 2022, 8 (Suppl. S8), 493–501. [Google Scholar] [CrossRef]
- Domae, A.; Kumagai, M.; Zama, M.; Abe, T.; Oe, T.; Kaneko, N.H. AC characterization of a 1-kΩ metal-foil resistor. in Precision Electromagnetic Measurements. IEEE Trans. Power Electron. 2014, 6, 24–31. [Google Scholar]
- Niroumand, F.J.; Nymand, M. A new method for measuring winding AC resistance of high efficiency power inductors. IEEE Trans. Power Electron. 2018, 33, 10736–10747. [Google Scholar]
- Zhao, E.; Han, Y.; Lin, X.; Liu, E.; Yang, P.; Zalhaf, A.S. Harmonic characteristics and control strategies of grid-connected photovoltaic inverters under weak grid conditions. Int. J. Electr. Power Energy Syst. 2022, 142, 108280. [Google Scholar] [CrossRef]
- Richman, P.; Walker, N. A new fast computing RMS-to-DC conversion. IEEE Trans. Instrum. Meas. 1971, 20, 313–319. [Google Scholar] [CrossRef]
- Liu, P.; Wang, W.; Zhou, L.; Zhao, M.; Wu, C.; He, L.; Liu, H. Development of a zero-flux Hall current sensor dedicated for large-current measurement of superconducting cable. IEEE Trans. Appl. Supercond. 2025, 35, 9000205. [Google Scholar] [CrossRef]
- Riba, J.-R. The role of AC resistance of bare stranded conductors for developing dynamic line rating approaches. Appl. Sci. 2024, 14, 8982. [Google Scholar] [CrossRef]
- Du, G.; Li, N.; Ye, W.; Cui, C.; Jiang, R. Effect of harmonics on AC losses and temperature of round-wire and form-wound windings for HSPMMs. IEEE Trans. Transp. Electrif. 2024, 10, 6115–6128. [Google Scholar] [CrossRef]
- Tang, B.; Yang, S.; Wang, D.; Xie, B.; Li, S.; Jiang, S. A numerical method coupling the T-A formulation for dynamic resistance computation in HTS coated conductors. IEEE Trans. Appl. Supercond. 2024, 34, 8200205. [Google Scholar] [CrossRef]


| Number | Cross-Sectional Area/mm2 | Segmental Method | Oxidation Method |
|---|---|---|---|
| XLPE-C1 | 800 | Sector Segmentation: 5 + 0 | No oxidation |
| XLPE-C2 | 1200 | Sector Segmentation: 5 + 0 | No oxidation |
| XLPE-C3 | 1600 | Sector Segmentation: 5 + 0 | No oxidation |
| XLPE-C4 | 2000 | Sector Segmentation: 5 + 0 | No oxidation |
| XLPE-C5 | 2500 | Sector Segmentation: 5 + 0 | No oxidation |
| XLPE-C6 | 2500 | Sector Segmentation: 5 + 1 | No oxidation |
| XLPE-C7 | 3000 | Sector Segmentation: 5 + 1 | No oxidation |
| XLPE-C8 | 3500 | Sector Segmentation: 5 + 1 | No oxidation |
| Number | Cross-Sectional Area/mm2 | Segmental Method | Oxidation Method |
|---|---|---|---|
| XLPE-S1 | 800 | Sector Segmentation: 4 + 0 | No oxidation |
| XLPE-S2 | 800 | Sector Segmentation: 4 + 1 | No oxidation |
| XLPE-S3 | 800 | Sector Segmentation: 5 + 0 | No oxidation |
| XLPE-S4 | 800 | Sector Segmentation: 5 + 1 | No oxidation |
| Number | Cross-Sectional Area/mm2 | Segmental Method | Oxidation Method |
|---|---|---|---|
| XLPE-O1 | 2500 | Sector Segmentation: 5 + 0 | No oxidation |
| XLPE-O2 | 2500 | Sector Segmentation: 5 + 0 | Partial Oxidation |
| XLPE-O3 | 2500 | Sector Segmentation: 5 + 0 | Entire Oxidation |
Disclaimer/Publisher’s Note: The statements, opinions and data contained in all publications are solely those of the individual author(s) and contributor(s) and not of MDPI and/or the editor(s). MDPI and/or the editor(s) disclaim responsibility for any injury to people or property resulting from any ideas, methods, instructions or products referred to in the content. |
© 2025 by the authors. Licensee MDPI, Basel, Switzerland. This article is an open access article distributed under the terms and conditions of the Creative Commons Attribution (CC BY) license (https://creativecommons.org/licenses/by/4.0/).
Share and Cite
Yang, G.; Zeng, Y.; Xu, X.; Liu, X.; Chen, H.; Dai, D.; Liu, G. Research on Alternating Current Resistance of High-Voltage Cable Conductors: Optimization of Test Method and Discussion of Test Results. Energies 2025, 18, 1417. https://doi.org/10.3390/en18061417
Yang G, Zeng Y, Xu X, Liu X, Chen H, Dai D, Liu G. Research on Alternating Current Resistance of High-Voltage Cable Conductors: Optimization of Test Method and Discussion of Test Results. Energies. 2025; 18(6):1417. https://doi.org/10.3390/en18061417
Chicago/Turabian StyleYang, Guiyuan, Yanqi Zeng, Xiaofeng Xu, Xiaodong Liu, Haowen Chen, Dong Dai, and Gang Liu. 2025. "Research on Alternating Current Resistance of High-Voltage Cable Conductors: Optimization of Test Method and Discussion of Test Results" Energies 18, no. 6: 1417. https://doi.org/10.3390/en18061417
APA StyleYang, G., Zeng, Y., Xu, X., Liu, X., Chen, H., Dai, D., & Liu, G. (2025). Research on Alternating Current Resistance of High-Voltage Cable Conductors: Optimization of Test Method and Discussion of Test Results. Energies, 18(6), 1417. https://doi.org/10.3390/en18061417