Abstract
Project management often overlooks the consideration of long-term effects that may impact sustainability transition and innovation. This paper addresses this gap by presenting an analysis that extends the traditional project life cycle model through the incorporation of a new phase, labelled “system impact”, which integrates innovation and sustainability into project management using a system dynamics methodology. To explore this extension, a simulation model is developed to analyse a solar photovoltaic (PV) power project, providing valuable insights into the systemic and dynamic impacts required for successful project outcomes, including effective benefits management and value creation. The results provide a sustainability-focused assessment of project success. Process innovation efficiency reaches its peak at 140 completed tasks, shortening the project duration from 18 to 13.25 months. This study highlights CO2 emission avoidance over 25 years compared to fossil fuel generators. Economically, despite an initial cost three times higher, the solar PV alternative proves more cost-effective in the long run, amounting to only 19% of the total cost of the fossil fuel option.
1. Introduction
A project can achieve greater success by expanding its reach, providing benefits to the community, and promoting sustainability transitions [1,2,3]. In the case of solar energy projects, one significant long-term impact is improving access to energy, as outlined in Sustainable Development Goal (SDG) 7, which aims to ensure universal energy access [4]. However, the notion of project success can extend beyond merely achieving the project’s immediate goals. This raises important questions about the long-term impacts that follow the delivery of a solar energy project.
The proportion of the global population with access to electricity rose from 87% in 2015 to 91% in 2021, yet 675 million people still lack this essential service [4]. The goal of providing electricity for all can be achieved using either fossil fuels or renewable energy sources. Traditionally, fossil fuels have had lower initial costs than renewables, but the latter have rapidly reduced their costs, becoming an option in some regions [5]. Despite requiring lower initial investments in poorer regions, fossil fuel-based electricity generation incurs significantly higher costs over time and produces emissions that contribute to climate change [6]. When long-term costs and emissions are considered, the effectiveness of fossil fuel projects is diminished, as fossil fuels are the primary driver of climate change. Addressing electricity supply and demand requires affordable, reliable, and sustainable projects to meet growing needs. Studies have demonstrated that the synergy between hydro, solar, and wind energy ensures supply adequacy without the need for fossil fuel backups [7,8,9,10].
Several developing countries have reported a growing share of renewables in their energy matrix as a result of their expansion planning [11,12,13]. To ensure a stable energy supply, these nations are increasingly investing in solar, wind, and thermal power rather than fossil fuels, aligning their efforts with the goal of achieving SDG 7 by 2030 [14]. For instance, since 2016, Colombia has planned 704 projects to generate 52,089 MW, distributed among solar PV (48.63%), wind (22.67%), thermal power (19.35%), and hydropower projects (8.63%) [15]. While hydropower remains Colombia’s primary source of electricity, evidence suggests it has greater environmental impacts compared to solar and wind power generation [16]. A reaction to those negative impacts of hydropower projects has resulted in significant delays in energy projects affecting not only the adoption of renewables but also the well-being of local communities. Even in areas with electricity access, many off-grid communities receive only a few hours of service, typically powered by diesel, which is both expensive and environmentally harmful [17]. Another study highlights the land demands of PV energy and its effects on farming communities in Turkey [18]. This study addresses this by integrating solar panels with farming, a solution gaining traction in renewable energy and farming communities. Additionally, another study conducted in Indonesia shows that localised recycling, improved transport, and tax incentives can enhance solar PV sustainability in small island communities, supporting policy and sustainability goals [19].
Solar projects are implemented in isolated communities that lack access to the electricity grid. These initiatives aim to meet energy needs through clean energy sources, reducing dependence on diesel generators. Project locations are chosen based on community needs rather than electricity yield. While renewable energy availability varies across regions [20], the placement of PV panels is determined by the specific energy requirements of each community.
To address the pressing need for enhancing the well-being of local communities, this paper explores the role of innovation in solar PV energy initiatives aimed at replacing fossil fuel-based generation in isolated regions. The main research question guiding this investigation is the following: How can solar energy projects leverage innovation to achieve and assess the long-term sustainability of a specific region?
This paper explores the relationship between the developing a solar PV energy project in small communities and its long-term impact on sustainability. Furthermore, this research aims to (i) demonstrate the interconnectedness of the energy system, project management, innovation, and sustainability; and (ii) integrate the system impact stage at the end of the project life cycle to achieve both project success and project management (PM) success through systemic intervention.
A system dynamics (SD) methodology is used to forecast a solar PV project at the back-end stage. SD simulation provides a better understanding of the project’s impact and its long-term alternatives. Moreover, the results contribute to promoting the adoption of renewable energy sources in developing countries, particularly in impoverished regions where fossil fuel generation predominates. In this case, the project generates positive outcomes, as the use of solar PV mitigates the environmental impacts of fossil fuel consumption and offers greater long-term economic benefits for sustainability.
The analysis of system impacts is based on data from a Colombian energy project case study under two scenarios: fossil fuel generation and solar PV sources. Fossil fuels are traditionally used to generate electricity in areas not connected to the Colombian energy grid. Energy projects in these regions typically rely on fossil fuels, meeting energy needs but causing significant long-term impacts on innovation and sustainability. In contrast, solar PV technologies have not been widely adopted in Colombia, presenting challenges for the adoption of this technology, the development of projects, and the expansion of installed capacity in remote regions that are not connected to the grid.
Simulation is a useful tool for explaining sustainability systemically, encompassing social, environmental, and economic dimensions at different project stages, from inception to end of life [21]. It also facilitates the connection between innovation and PM within a system, enabling the analysis of impacts over time and the customisation of analyses for specific case studies. This paper employs SD as a tool to enhance the understanding of long-term project impacts on the energy system. SD has been applied to simulate system behaviour over time, incorporating time delays, disruptions, and internal feedback loops [22,23,24,25].
The rest of this paper is organised as follows: Section 2 provides a brief description of the need to integrate SD models into energy projects for assessing the impact of innovation. Section 3 details the simulation model and presents the mathematical framework used. Additionally, a brief description of the Colombian case study is provided. Section 4 presents the results obtained and discusses the impact of innovation and sustainability on a solar PV energy project. Finally, Section 5 presents conclusions and suggestions for future research.
2. Integrating SD in Energy Projects for Assessing Innovation Impact
The life cycle of energy projects is characterised by a sequence of phases, from the start of the project to its completion, involving multiple actors with different goals. In this context, energy projects present complexity and long-term uncertainty due to the numerous decisions and stakeholders involved at each stage [21,26,27]. Although the project life cycle can be extended to include concept and feasibility at the strategic level and by incorporating the product life cycle [28], this extension is rarely addressed by managers and policymakers from a systemic perspective. This strategic approach integrates operation and termination for long-term project future actions [28]. Additionally, innovation and sustainability can be incorporated in this strategic approach [29].
This long term also contributes to developing projects that benefit society are an important social innovation approach which contributes to human progress in a community [30,31,32]. Without a long-term analysis, a project is unlikely to have a positive impact on society. The satisfaction of a society’s needs can be provided and supported by the government. In that sense, a positive impact requires direct communication between the community and the government [33,34].
Another factor to consider is process innovation. This innovation can reduce project costs by eliminating non-value-adding work or by developing efficient work methods. Moreover, process innovation can increase product benefits by enhancing the usability of a product and reduce time schedule for product delivery [35]. Process innovation and product innovation have been linked in new product design [36,37,38]. As a result, there could be a design, building, and integration of a complex product system (CoPS) [39], or directions of change in a service or a product [36].
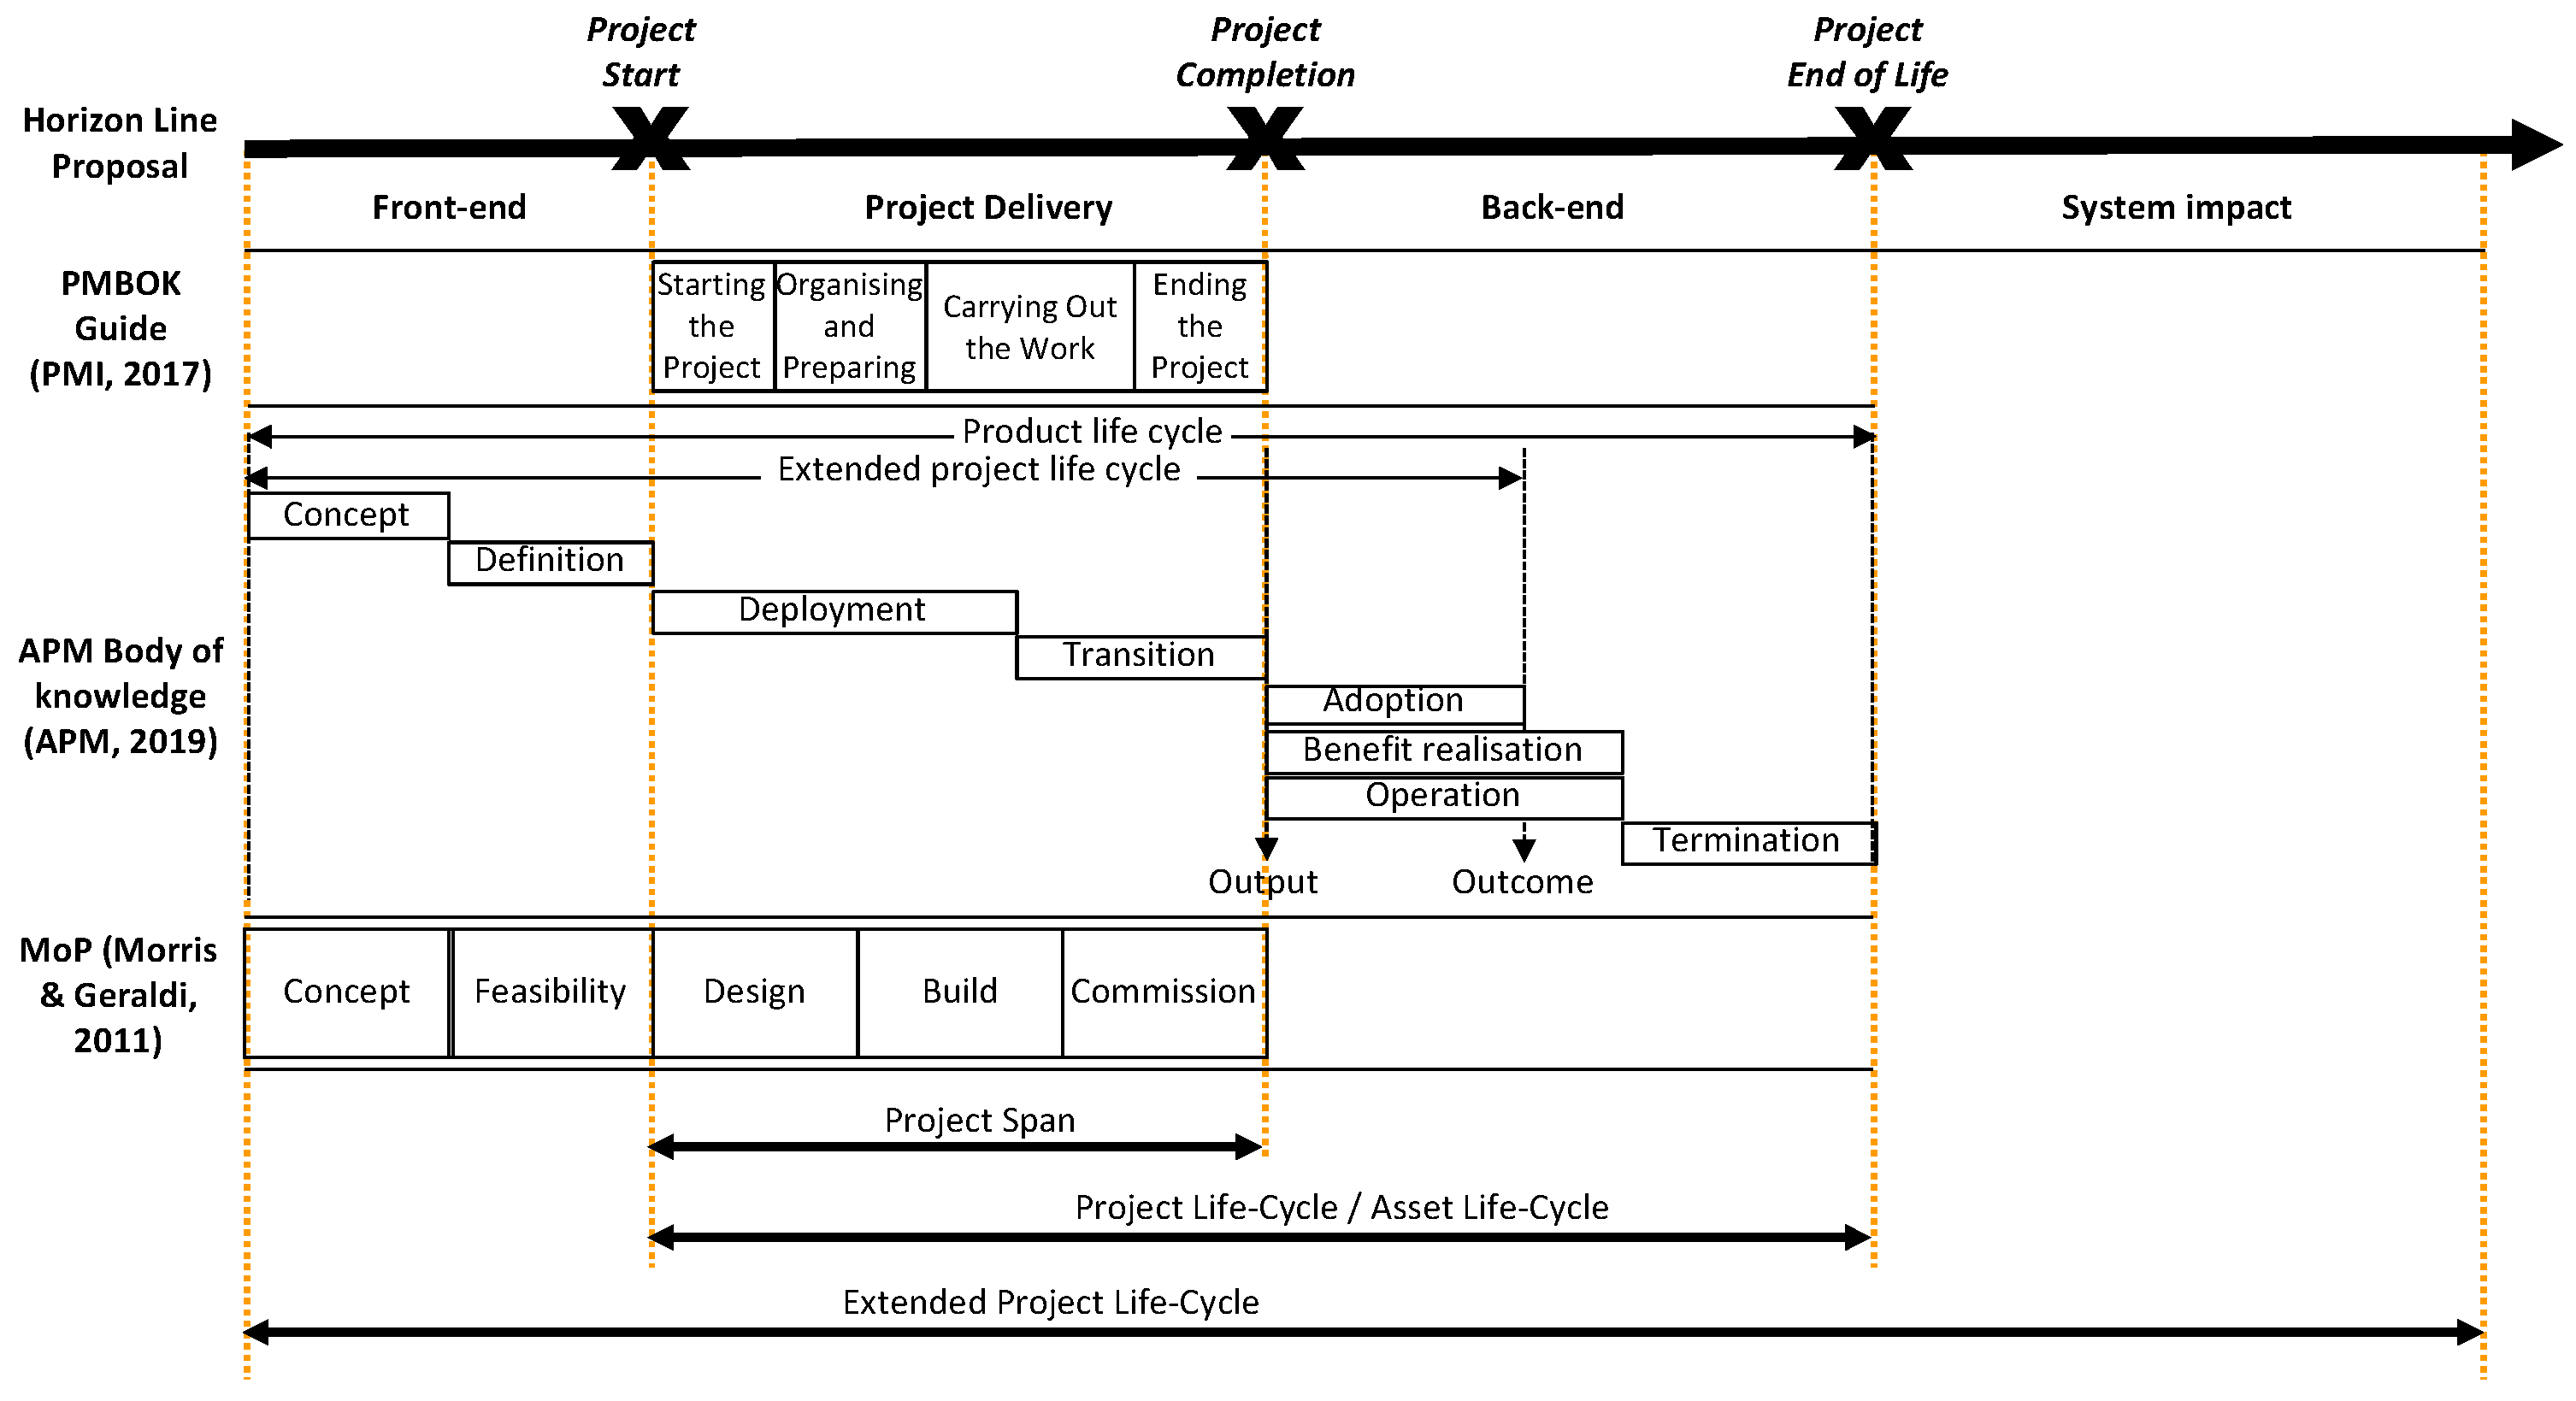
Commonly, the innovation life cycle focuses on manufacturing [40,41], while the sustainability life cycle entails a circular economy approach. However, these life cycle models do not consider the positive or negative impacts after the energy project ends. Figure 1 shows the stages of the energy project life cycle: front-end, project delivery, and back-end. To extend the project life cycle, this paper proposes a system impact stage, which systematically connects PM to innovation and sustainability as integrated energy systems.
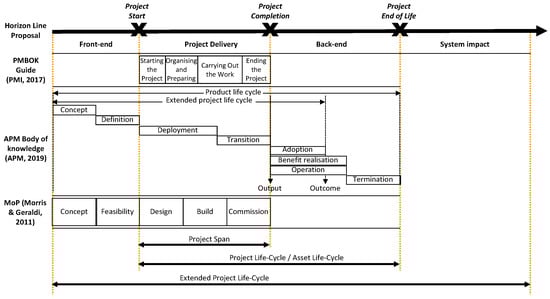
Figure 1.
System impact added to the extended energy project life cycle taken and adapted [28,42,43].
Combining innovation and sustainability life cycles extends the project management life cycle. Extending this life cycle enables managers to see whether the benefit from the project is greater than its negative impact at different stages, from the front-end to the back end of the project [44]. Innovation and sustainability change project conditions satisfying project success for the impact of the sustainability dimensions in the long term. Thus, thinking from the project front-end to the back end builds up better decision-making on the project’s triple constraints of time, cost, and quality [45,46].
SD methodology facilitates the extension and analysis of projects and has been used to study the interaction and behaviour of systems for more than 60 years, providing valuable insights for project management (PM) and energy studies. This approach supports the integration of previous disciplines through the understanding of systems theory [47]. Systems theory explores different disciplines and provides a physical sense to science by fostering holistic thinking [48]. Using this approach helps explain both positive and negative systemic impacts of specific projects with innovation on social, economic, environmental, and administrative sustainability dimensions.
3. Model Description
This section presents two aspects that describe the methodology used in this paper: a brief description of the case study used for modelling and a detailed model description that considers the sub-systems modelled within the sustainability dimensions. These sub-systems are built using the System Dynamics (SD) methodology, as proposed by classical applications in the SD field [49,50,51]. Simulation-based studies are widely used in scientific research to model complex systems where experimental validation is limited or impractical. Therefore, an SD model was developed to understand the long-term dynamics and impacts of an energy project.
Project management studies mainly focus on designing and implementing project deliverables, often overlooking the change management required to achieve the desired future state [52]. The simulation model developed in this paper not only highlights different dimensions of sustainability but also provides deeper insights into the long-term dynamics of energy projects compared to traditional project management methods.
The SD model, in particular, accounts for the interactions of multiple variables, supporting long-term decision-making [29,53]. Recently, SD methodology has evolved to integrate human-created SD models into ChatGPT-4 without requiring advanced Python skills [54]. This enables users and managers to interact with models using natural language, eliminating the need for specialised SD software (Stella Architect 10.1). Additionally, a preliminary set of language configurations has been introduced to support boundary–object engagement, helping clarify design choices for modellers and facilitators [55].
3.1. Case Study on Solar PV Energy Project in Colombia
A large portion of Colombia is not connected to the electricity grid, representing approximately 52% of the country’s territory [6,56]. Most of the installed capacity in non-connected areas relies on diesel, accounting for 84% of the total capacity. Out of the total installed capacity of 311,439 kW in these areas, only about 34,109 kW corresponds to solar PV [57].
The Ministry of Mining and Energy of Colombia aims to provide energy to areas that are not connected to the grid. From the ministry’s energy programme, a single case study was selected for this research and used to validate the SD model. Data from this project were provided by the Colombian Ministry of Mines and Energy. The FAZNI-GGC-521-IPSE-074–2017 project, is located in the Orinoquia region, in the northeastern part of Colombia, and was completed on time and within budget [58]. The project provides energy to the community and has additional benefits, as reported by the Ministry of Mines and Energy in its final report. The availability of energy had a positive impact on the health of communities in remote areas. For example, the energy project enables the community to refrigerate insulin, which is crucial for people with diabetes, allowing them to avoid travelling long distances to find refrigeration.
The project aimed to provide energy to 82 families through two tailored solutions. The first solution included 60 units, each equipped with two solar PV panels of 325–340 Wp, while the second solution comprised 22 units, each featuring three solar PV panels of the same capacity per household. The project was implemented from 10 November 2017 to 30 April 2019, with a total cost of USD 540,839. In total, the project delivered between 60,450 and 63,240 Wp, with type 1 households receiving 650–680 Wp and type 2 households 975–1020 Wp. The SD model incorporates both endogenous and exogenous variables to reflect daily household energy consumption.
3.2. Dynamic Behaviour Hypothesis
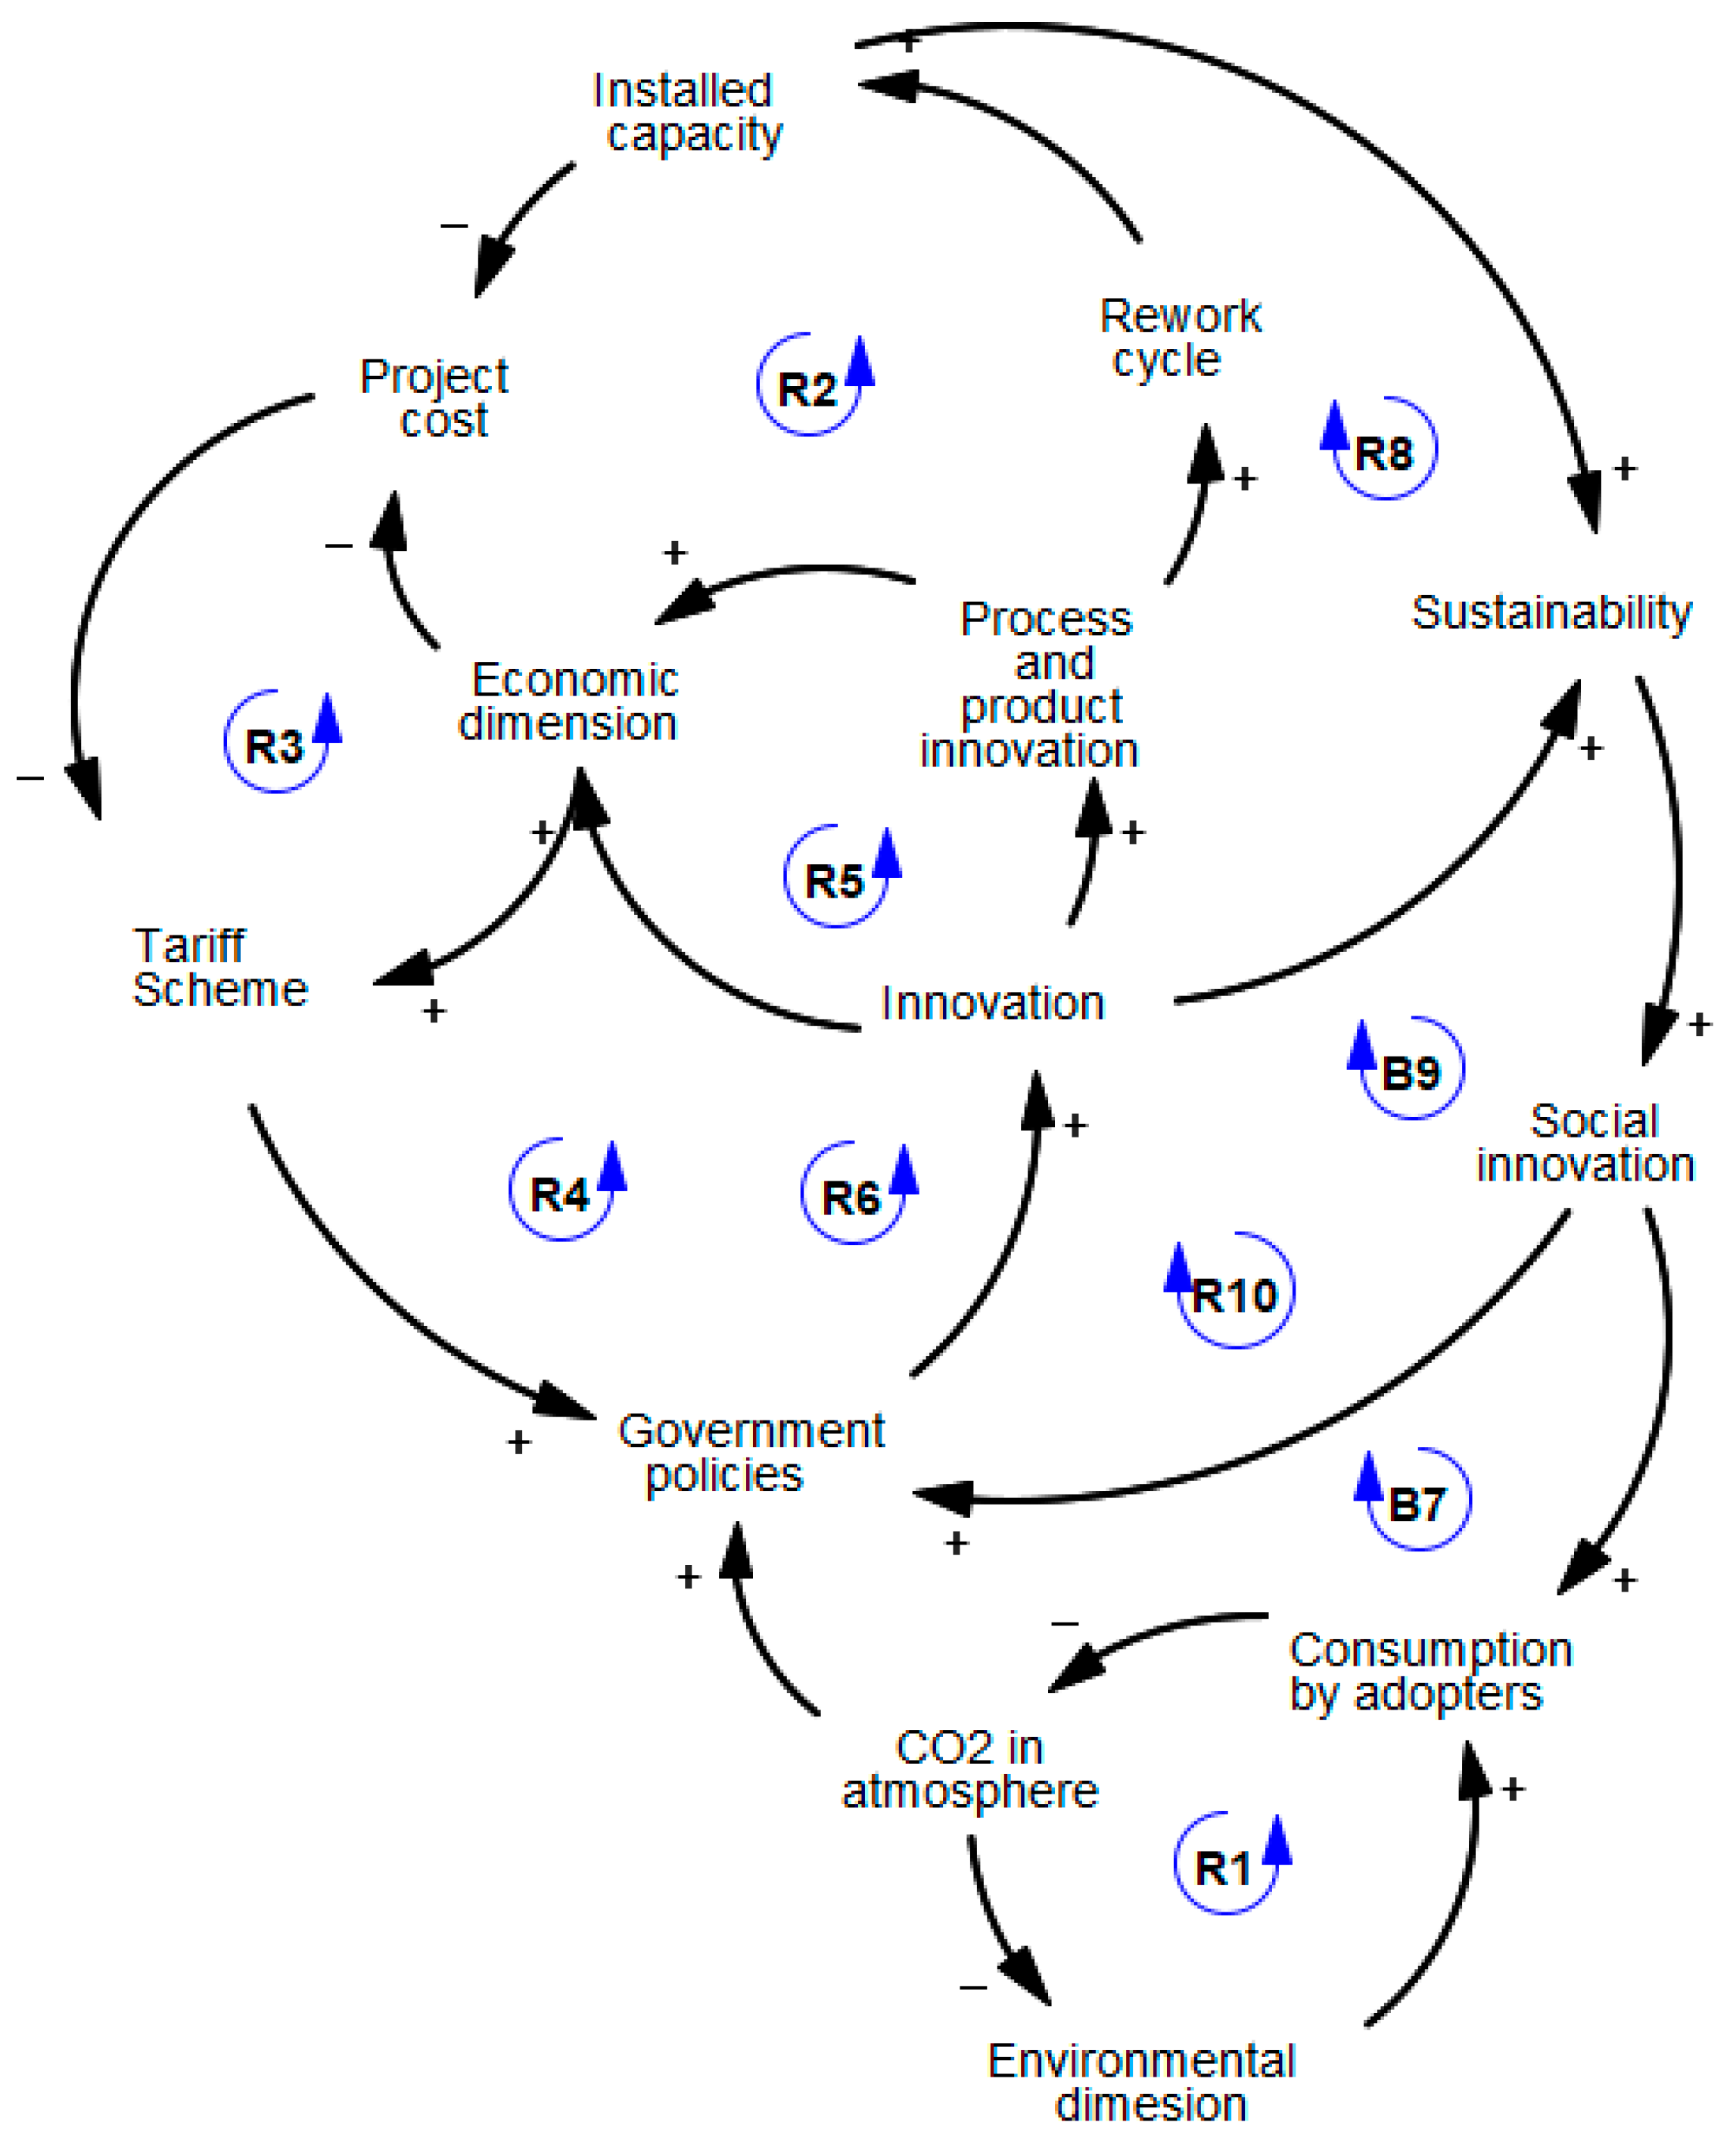
The SD simulation model is based on a dynamic behaviour hypothesis built up in a causal loop diagram as shown in Figure 2. The system has eight reinforcing (R) and two balancing (B) dominant loops.
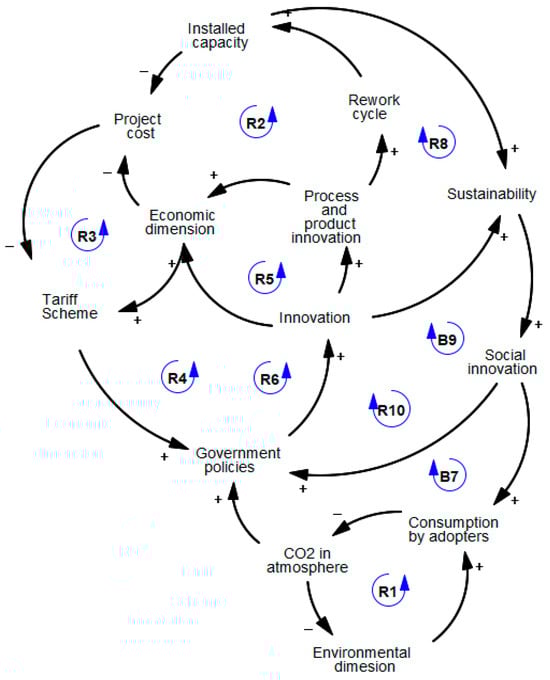
Figure 2.
CLD for the dynamic behaviour hypothesis.
The dynamic behaviour hypothesis connects innovation and sustainability to a PM model through the rework cycle, based on the approach of Rodrigues and Bowers [59] on rework cycle loops. Moreover, the rework cycle links the installed capacity of renewable energy from the solar PV project. Installed capacity can influence the cost of PV solar energy projects due to economies of scale, which, in turn, affects the tariff scheme. This creates a loop with government policies and innovation, forming a reinforcing loop (R2). At the same time, social innovation can lead to increased consumption by adopters, which impacts CO2 levels in the atmosphere and loops back to environmental dimensions, creating a reinforcing loop (R1).
The economic dimension creates a loop with project costs, which affect the tariff scheme and, in turn, influence government policies. These policies impact innovation through process and product innovation, forming reinforcing loops (R3, R4, R5, and R6). The rework cycle connects to sustainability through installed capacity, while sustainability links back to the rework cycle through social innovation (social dimension) via process and product innovation, forming a balancing loop (B7). Moreover, government policies influence innovation and sustainability, which then drive social innovation, forming reinforcing loops (R8 and R10). Finally, the social dimension interacts with consumption by adopters and CO2 levels in the atmosphere, creating a balancing loop (B9).
The dynamic behaviour hypothesis uses innovation, sustainability, and PM as the whole system in which sustainability and PM have variables to make sub-systems. Once the dynamic behaviour hypothesis is raised, the model as a system interconnects the sub-systems by stock-and-flow diagrams, as presented in the next sub-section. This interaction of sub-systems influences the variables within the system. The result of a specific variable within the simulation model at a specific period is what this research has called system impact.
3.3. Description of the System and Sub-Systems
Project management, innovation, and sustainability constitute the entire system, represented by stock-and-flow diagrams composed of a system of differential equations that model the structure of the solar PV project case study. The simulation model is structured into two subsystems: project management and sustainability. Innovation acts as an accelerator within the system, primarily through the R2 loop, helping to reduce project delivery duration through product and process innovation. The system follows a timeline that includes project initiation, project delivery, and back-end management. The project delivery phase lasts 18 months, while the back-end phase spans 300 months, corresponding to the 25-year duty cycle of solar PV panels.
3.3.1. Project Management Sub-System
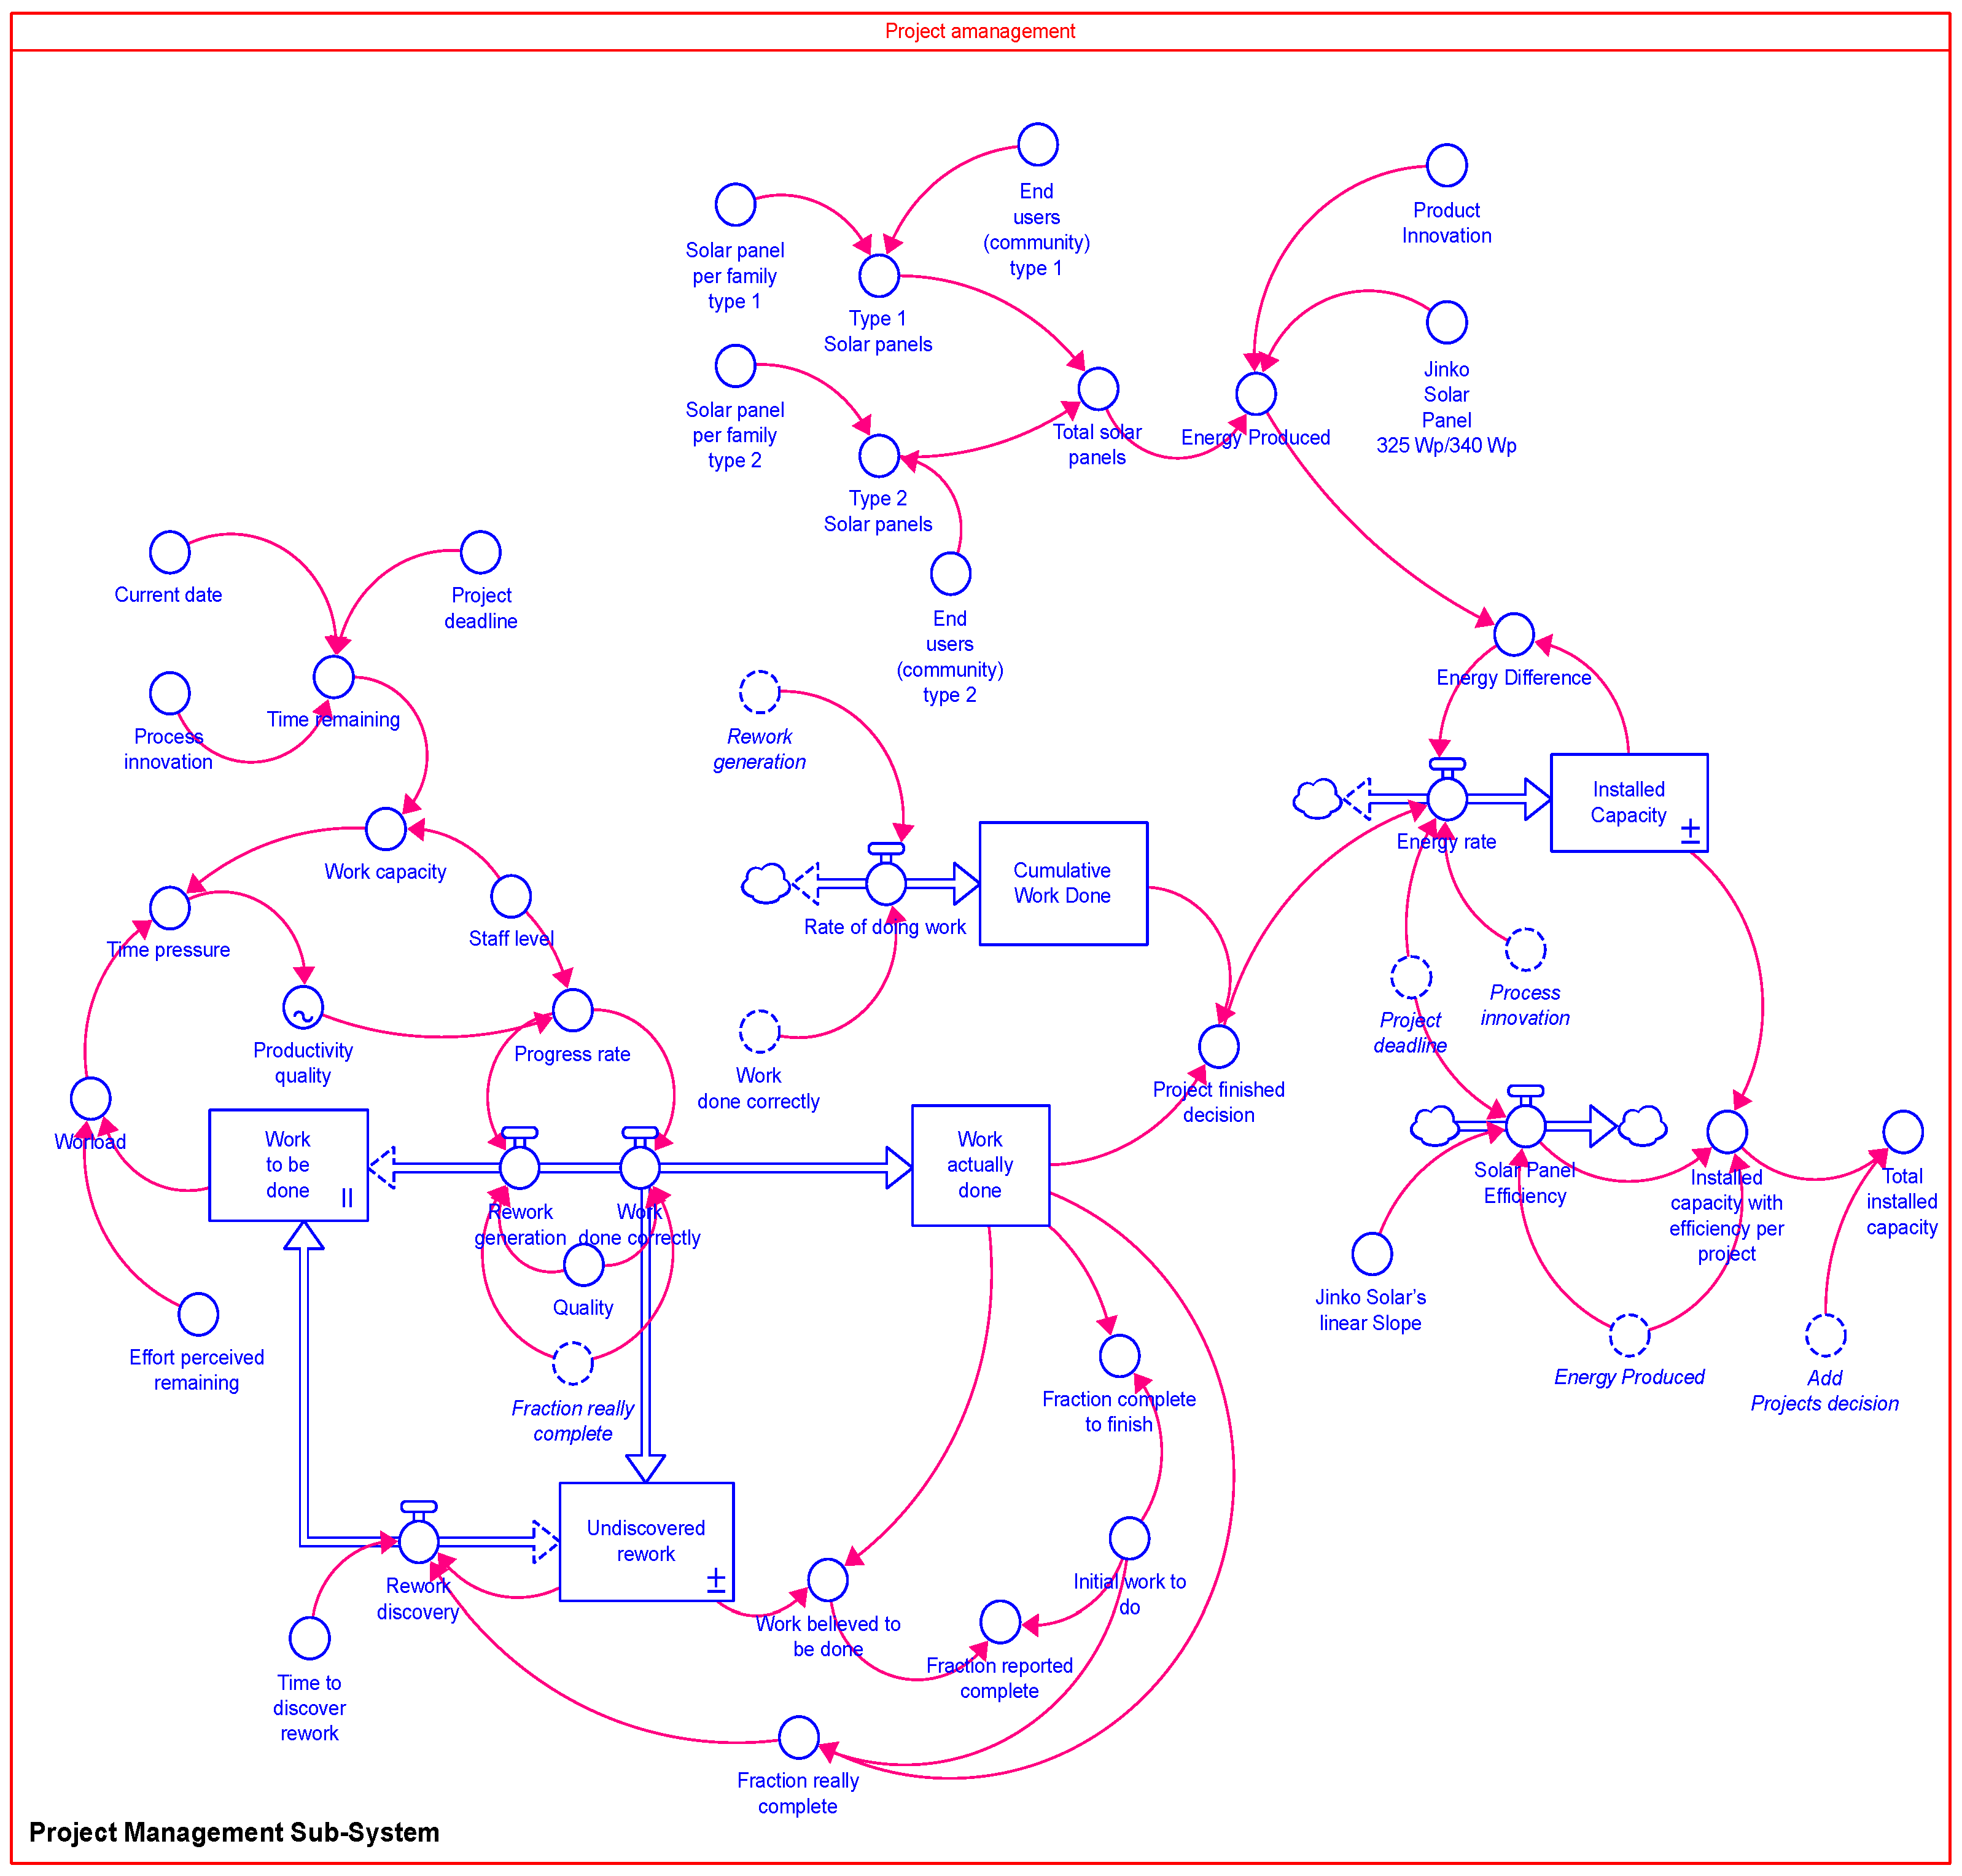
The project management subsystem utilised the rework cycle model to connect innovation through the R2 loop and sustainability through the R8 and R10 loops. The rework cycle was developed by Pugh-Roberts Associates [60]. Its structure incorporates activities categorised as “to be done”, “done correctly”, and “actually done”, as recently discussed by [21]. Figure 3 presents the stock-and-flow diagram used to model decision-making in project management. Some key equations utilised in the simulation model are explained below:
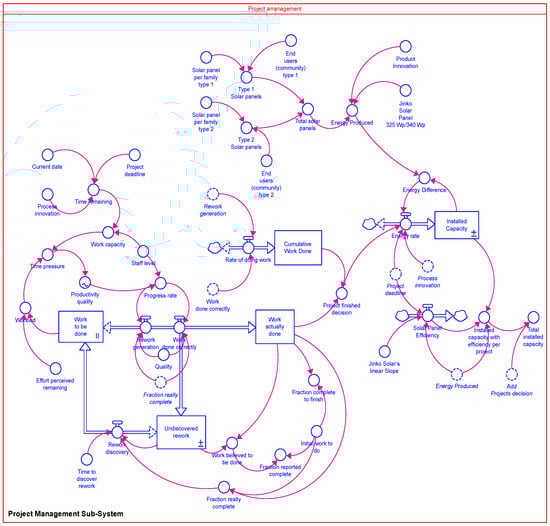
Figure 3.
Stock-and-flow diagram for project management sub-system.
The undiscovered rework (UR) is calculated based on rework generation (RG) and rework discovery (RD), as shown in Equation (1), at each time step (t = t + dt).
Meanwhile “work actually done” (WAD) is calculated from “work done correctly” (WDC), as shown in Equation (2):
The completion of the project offers to the community an installed capacity based on the quantity and efficiency of the solar PV panels. The total solar PV panels and the efficiency affect and change the behaviour of the system in the social, environmental, and economic dimensions.
3.3.2. Sustainability Sub-Systems
The sustainability sub-system is based on the triple bottom line (TBL) dimensions: social, environmental, and economic [45]. Under this approach, the sustainability sub-system, includes social, environmental, and economic sub-systems in the simulation model, and are simulated as explained below.
First, the simulation of the social sustainability dimension involves the electricity demand of the population in the region. The social dimension sub-system is based on a model proposed by [61] to simulate the solar PV diffusion to be disseminated from potential PV adopters to household PV adopters through the adoption rate. The adoption rate is calculated from Equation (3) proposed by [62], where n is the adoption rate, m represents the potential PV adopters, N represents the PV adopter households, p is the project deadline parameter and q is the process innovation parameter.
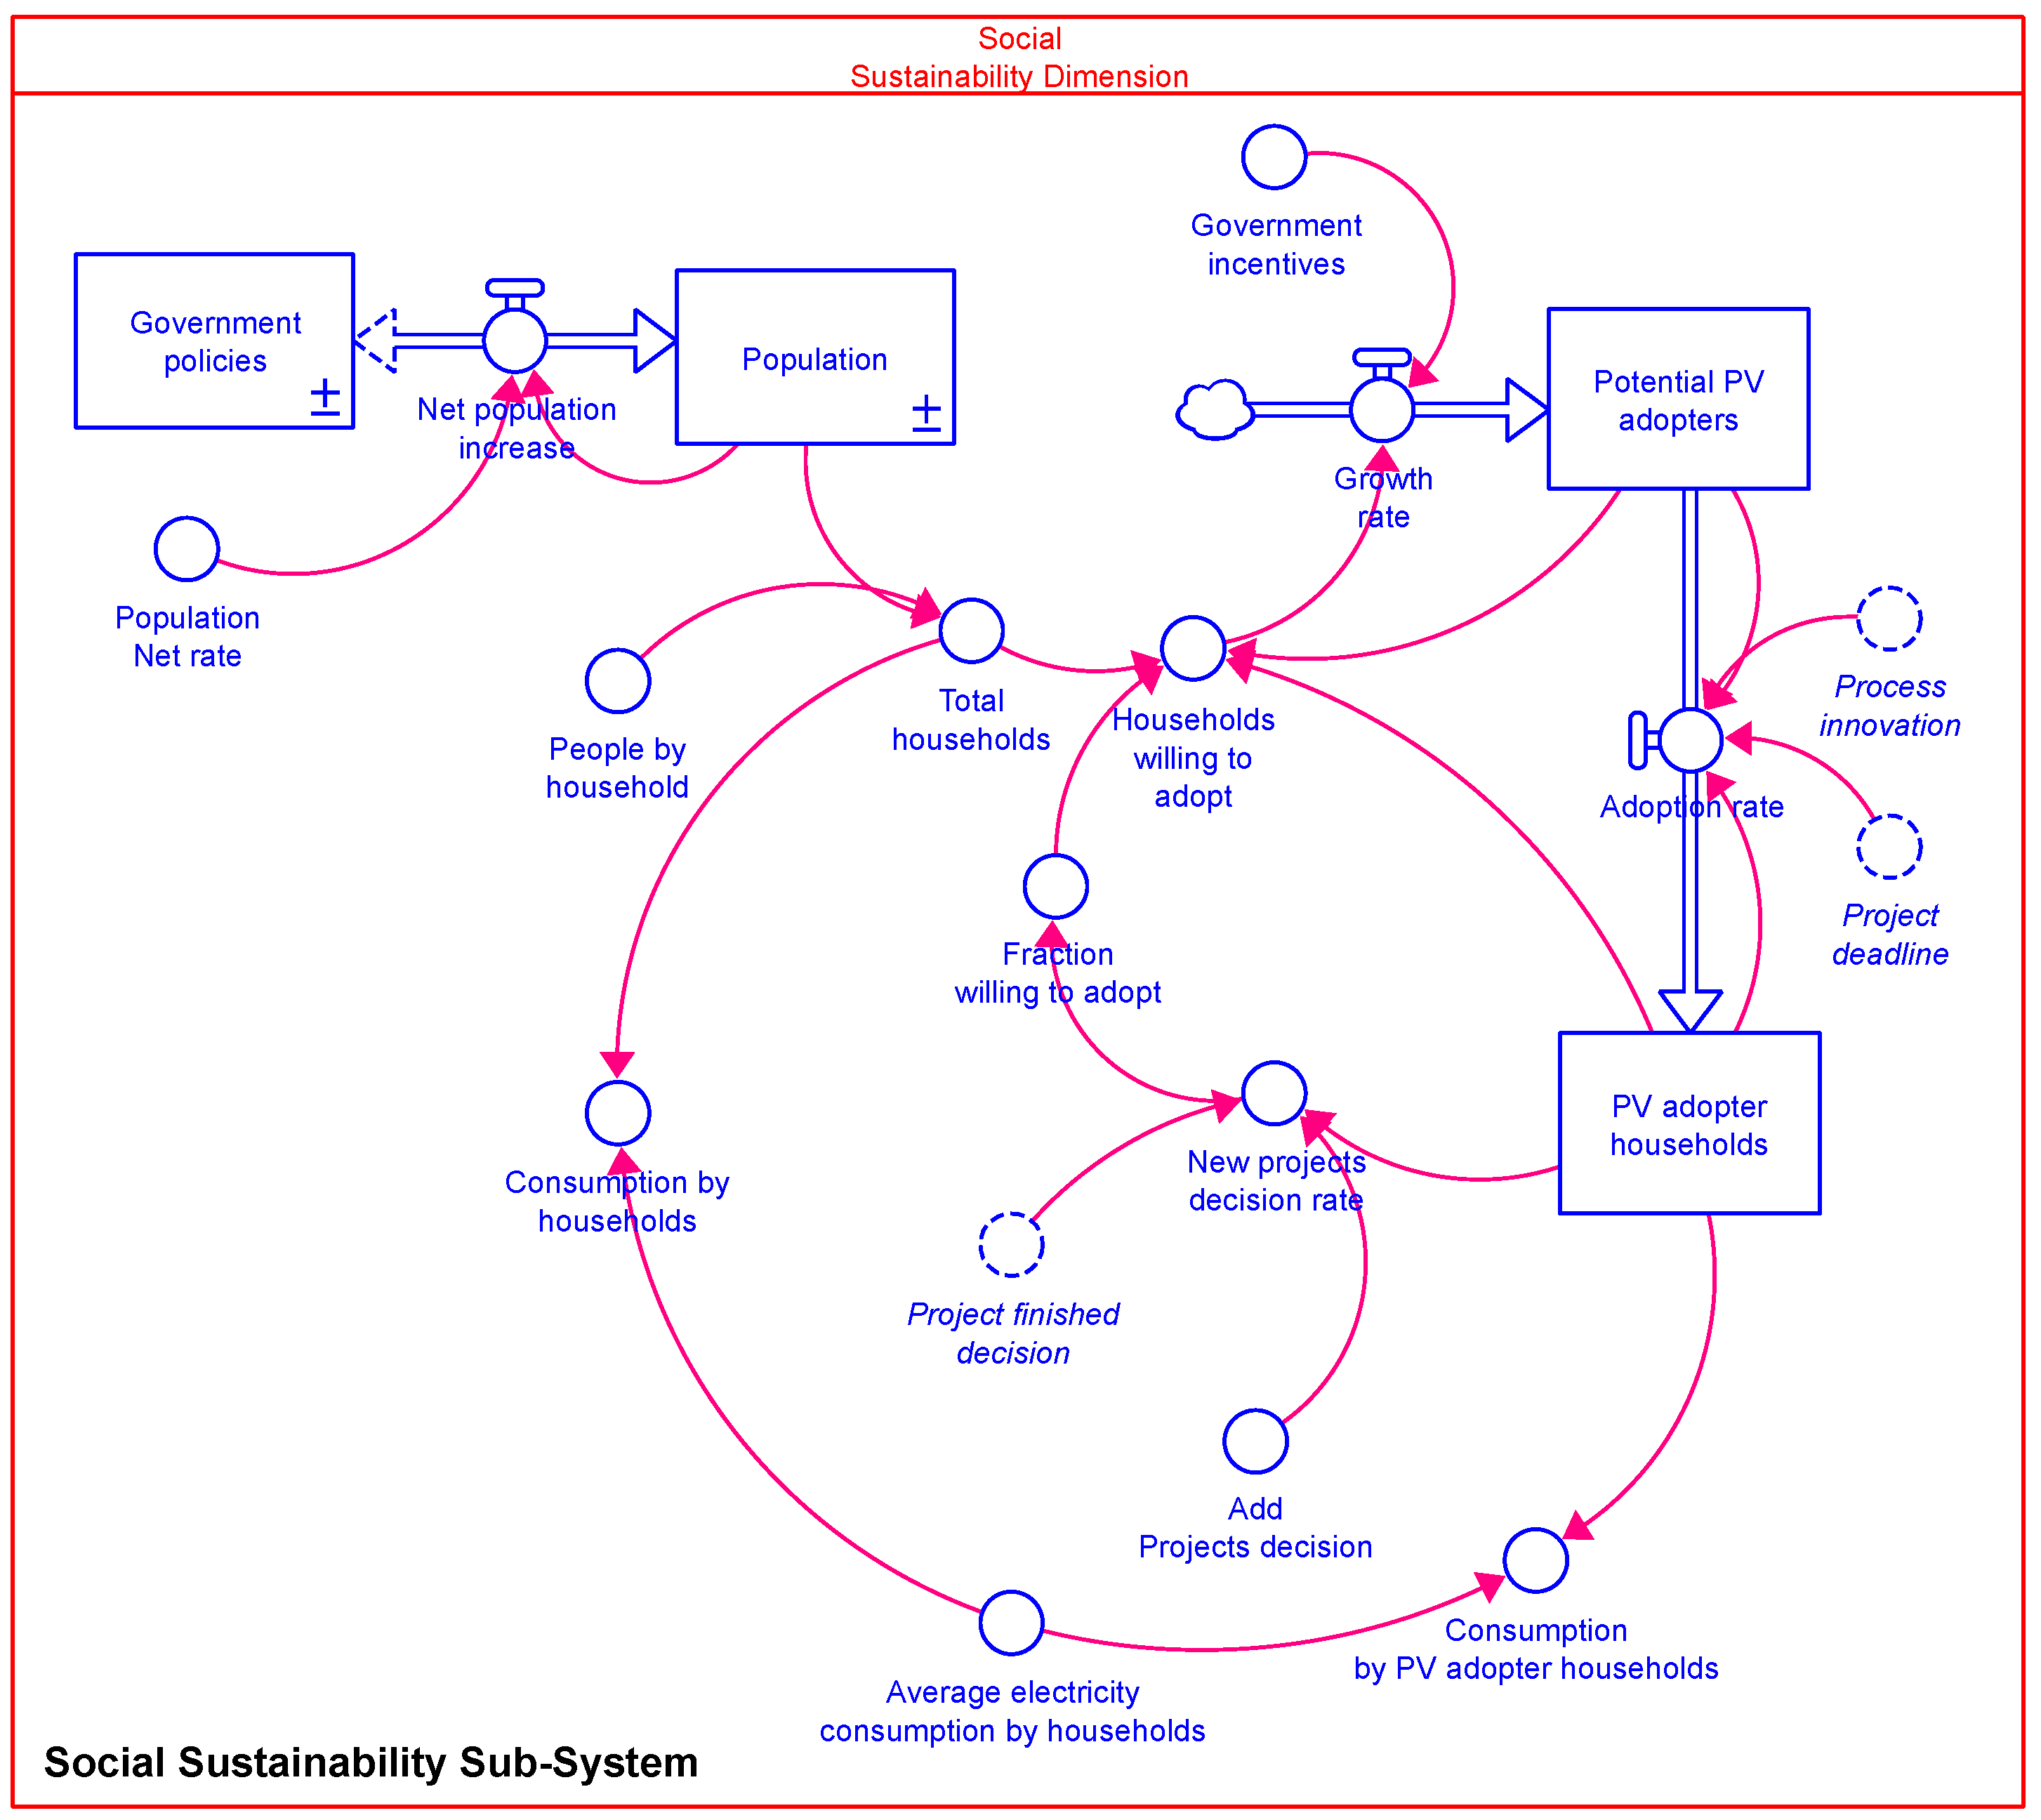
The social sustainability sub-system simulates household PV consumption based on the capacity installed by the project management sub-system and population growth, as shown in Figure 4. While power plants are designed to meet both current and future energy needs, they often fail to account for the impact of population growth and increased demand from new infrastructure and devices. To address these challenges, the system can also expand project capacity by adding new projects with the same case study specifications to accommodate changing electricity demand scenarios.
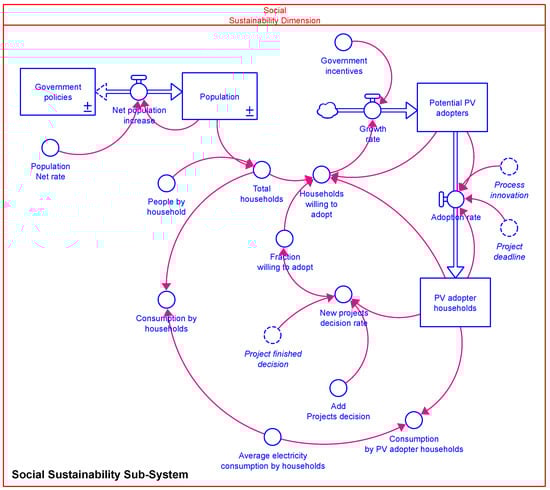
Figure 4.
Stock-and-flow diagram for social sub-system.
Second, the environmental dimension sub-system was adapted from Fiddaman’s model for analysing CO2 emissions and temperature [63,64]. While other simulation programmes can estimate CO2 emission reductions for new photovoltaic projects, SD simulation stands out by integrating social and economic variables, which are often challenging to incorporate in other software. Additionally, general circulation models (GCMs) provide detailed climate simulations but rely on external GHG emission inputs [65]. In contrast, integrated climate–economy models link the economy, emissions, and climate but simplify the carbon cycle and climate system as global averages [63,65].
The variables from Fiddaman’s model used to calculate the atmosphere temperature include (1) the previous CO2 emission, (2) the direct normal irradiance (DNI), and (3) net radiative forcing. The previous CO2 emission is sourced from the Colombian Orinoquia region’s sustainability report, which recorded an initial value of 3754.43 metric tons of CO2 by 2019 [66]. The DNI for the Orinoquia region, as used in the model, is 3.99 kWh/m2 per year [67]. The net radiative forcing to CO2 is calculated using Equation (4) [68].
where Fi is the net radiative forcing, C represents the concentration of CO2, and C0 is equal to 278 × 10−6.
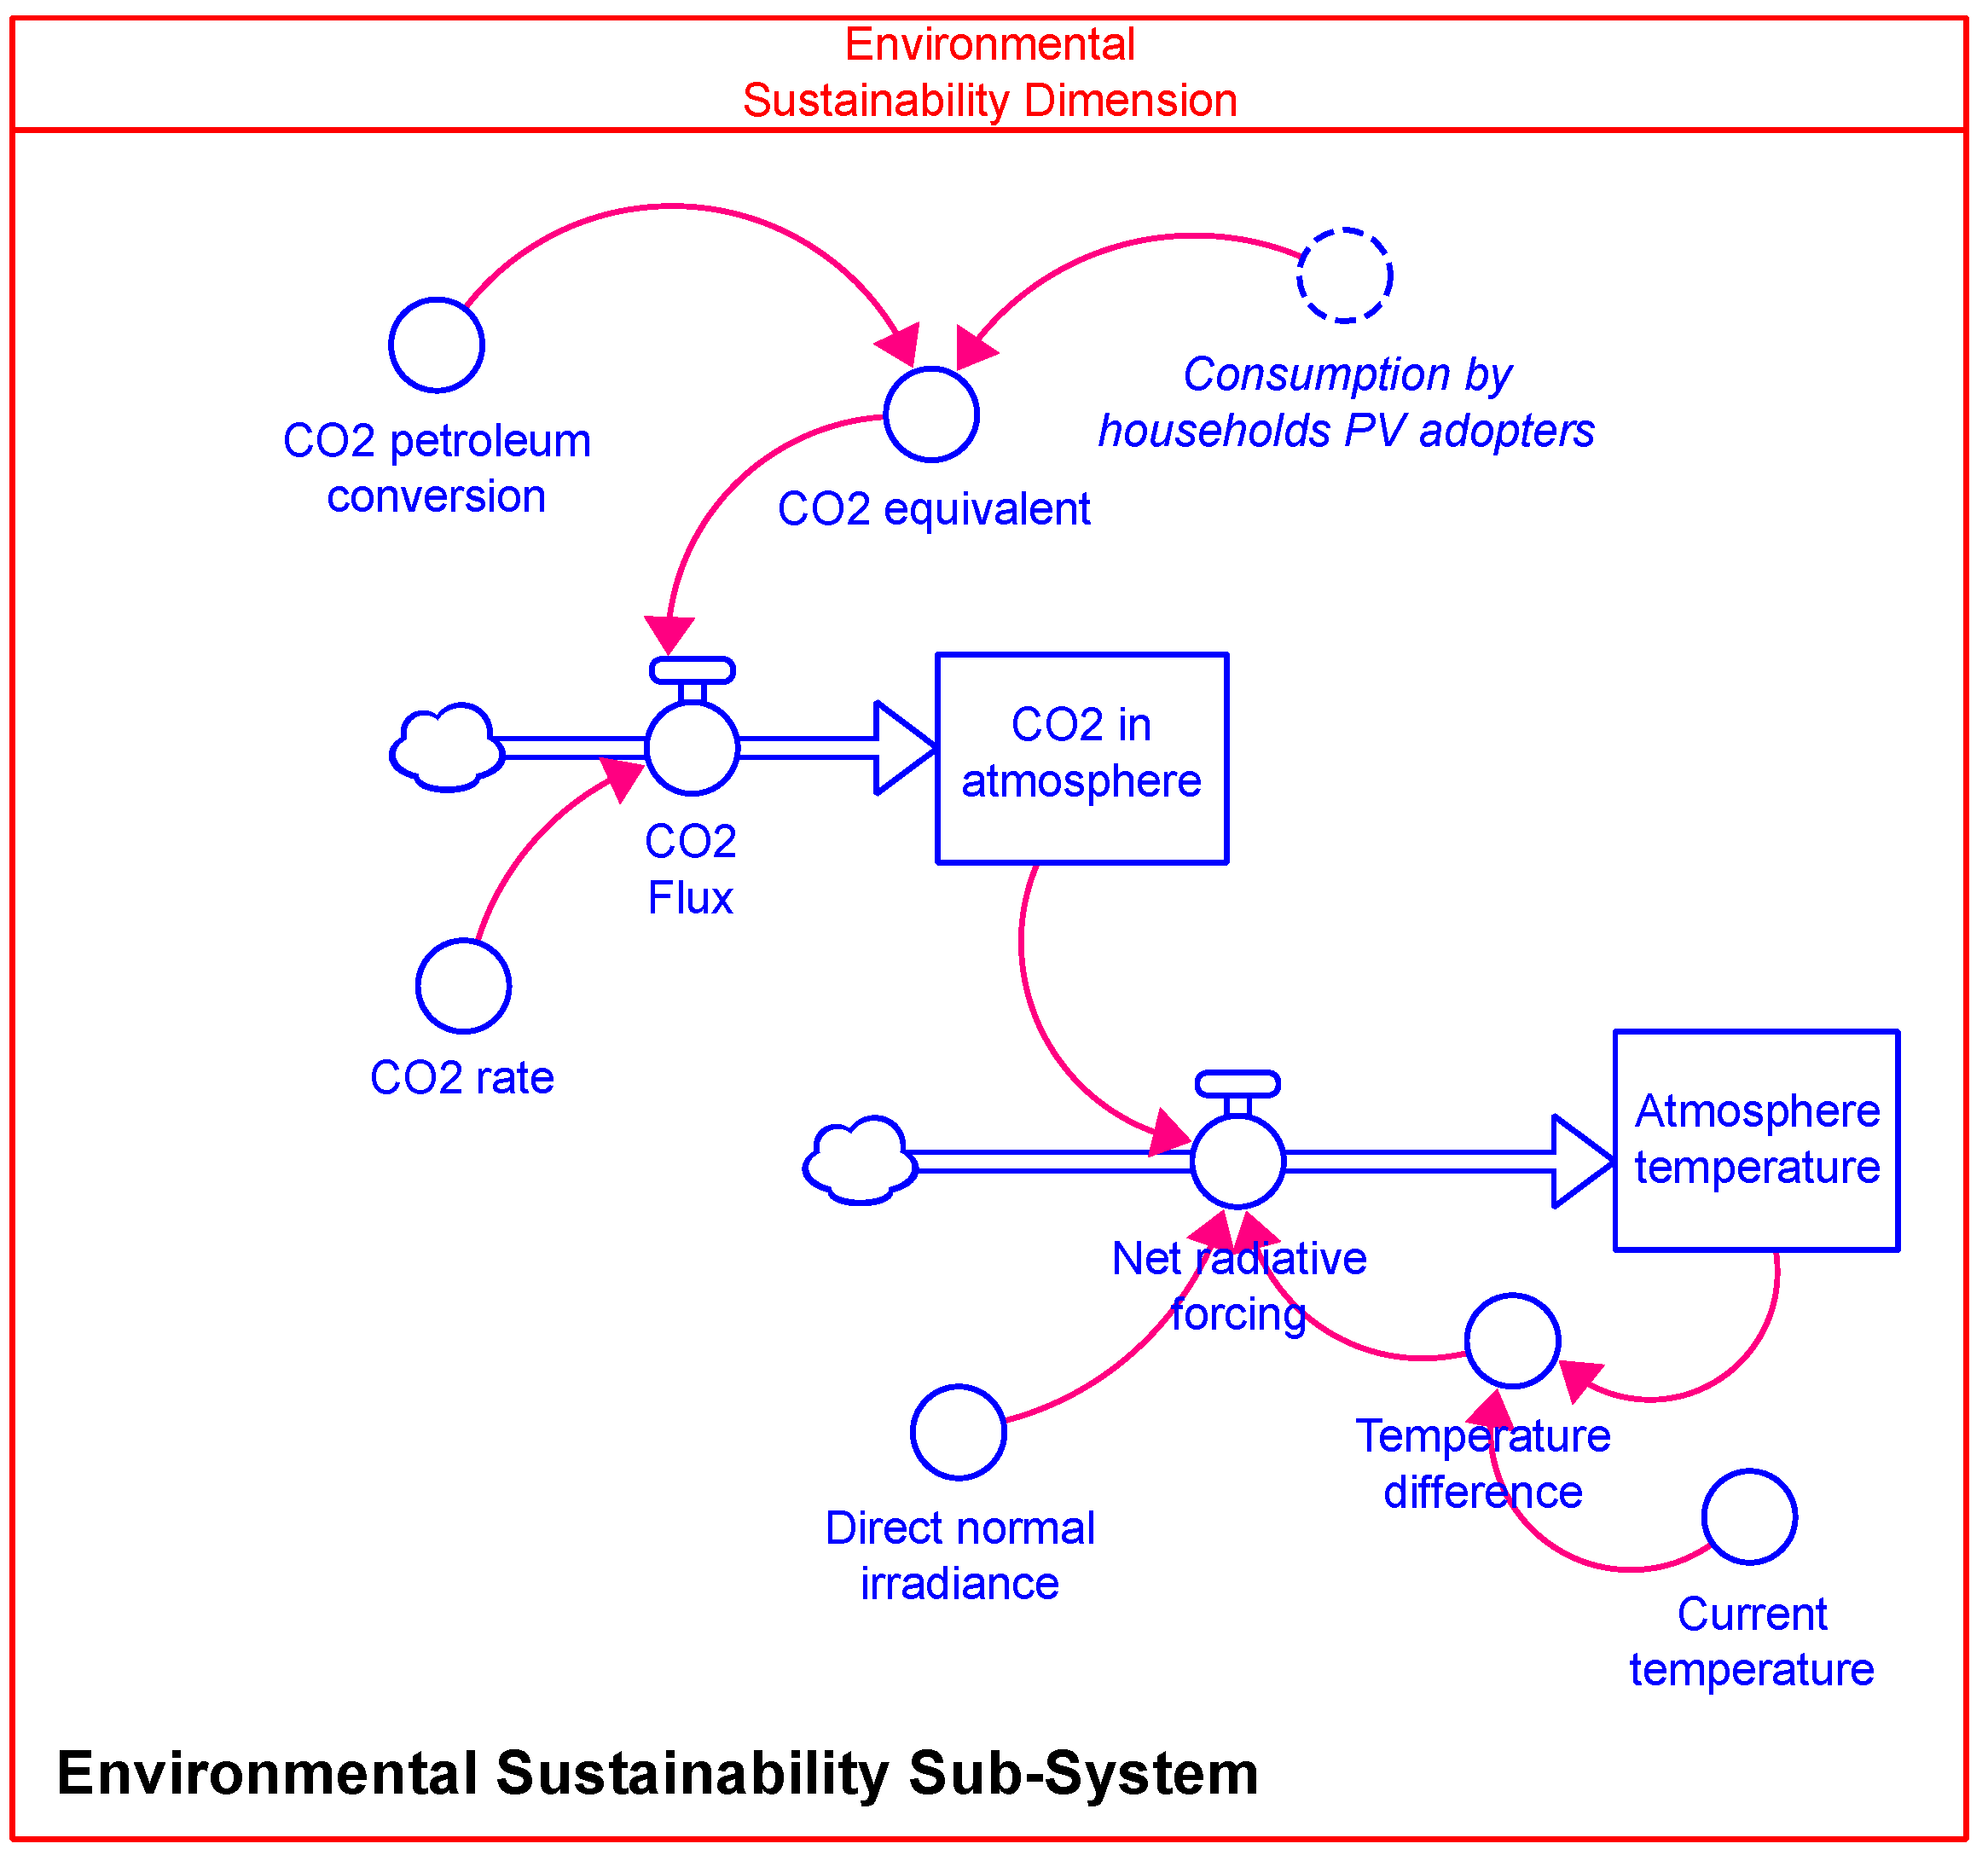
The environmental sustainability sub-system compares electricity generation by solar PV with electricity generated by fossil fuels, as presented in Figure 5. The two scenarios provide different perspectives for analysis at the system impact stage to support decision-making. The relationship of CO2 emissions and electricity generated by fossil fuels is 21,860 kWh generate emissions of 21 metric tons of CO2 [69].
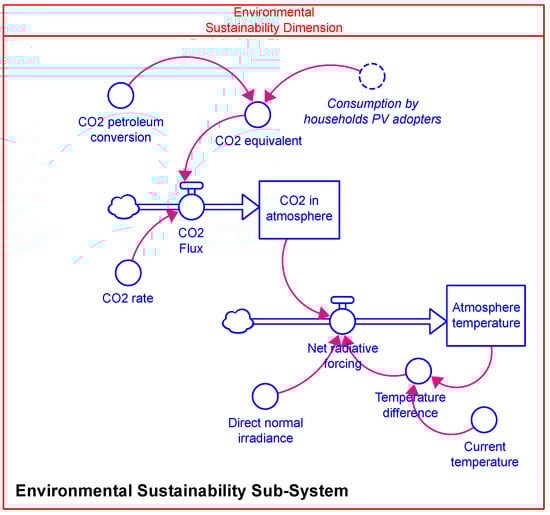
Figure 5.
Stock-and-flow diagram for environmental sub-system.
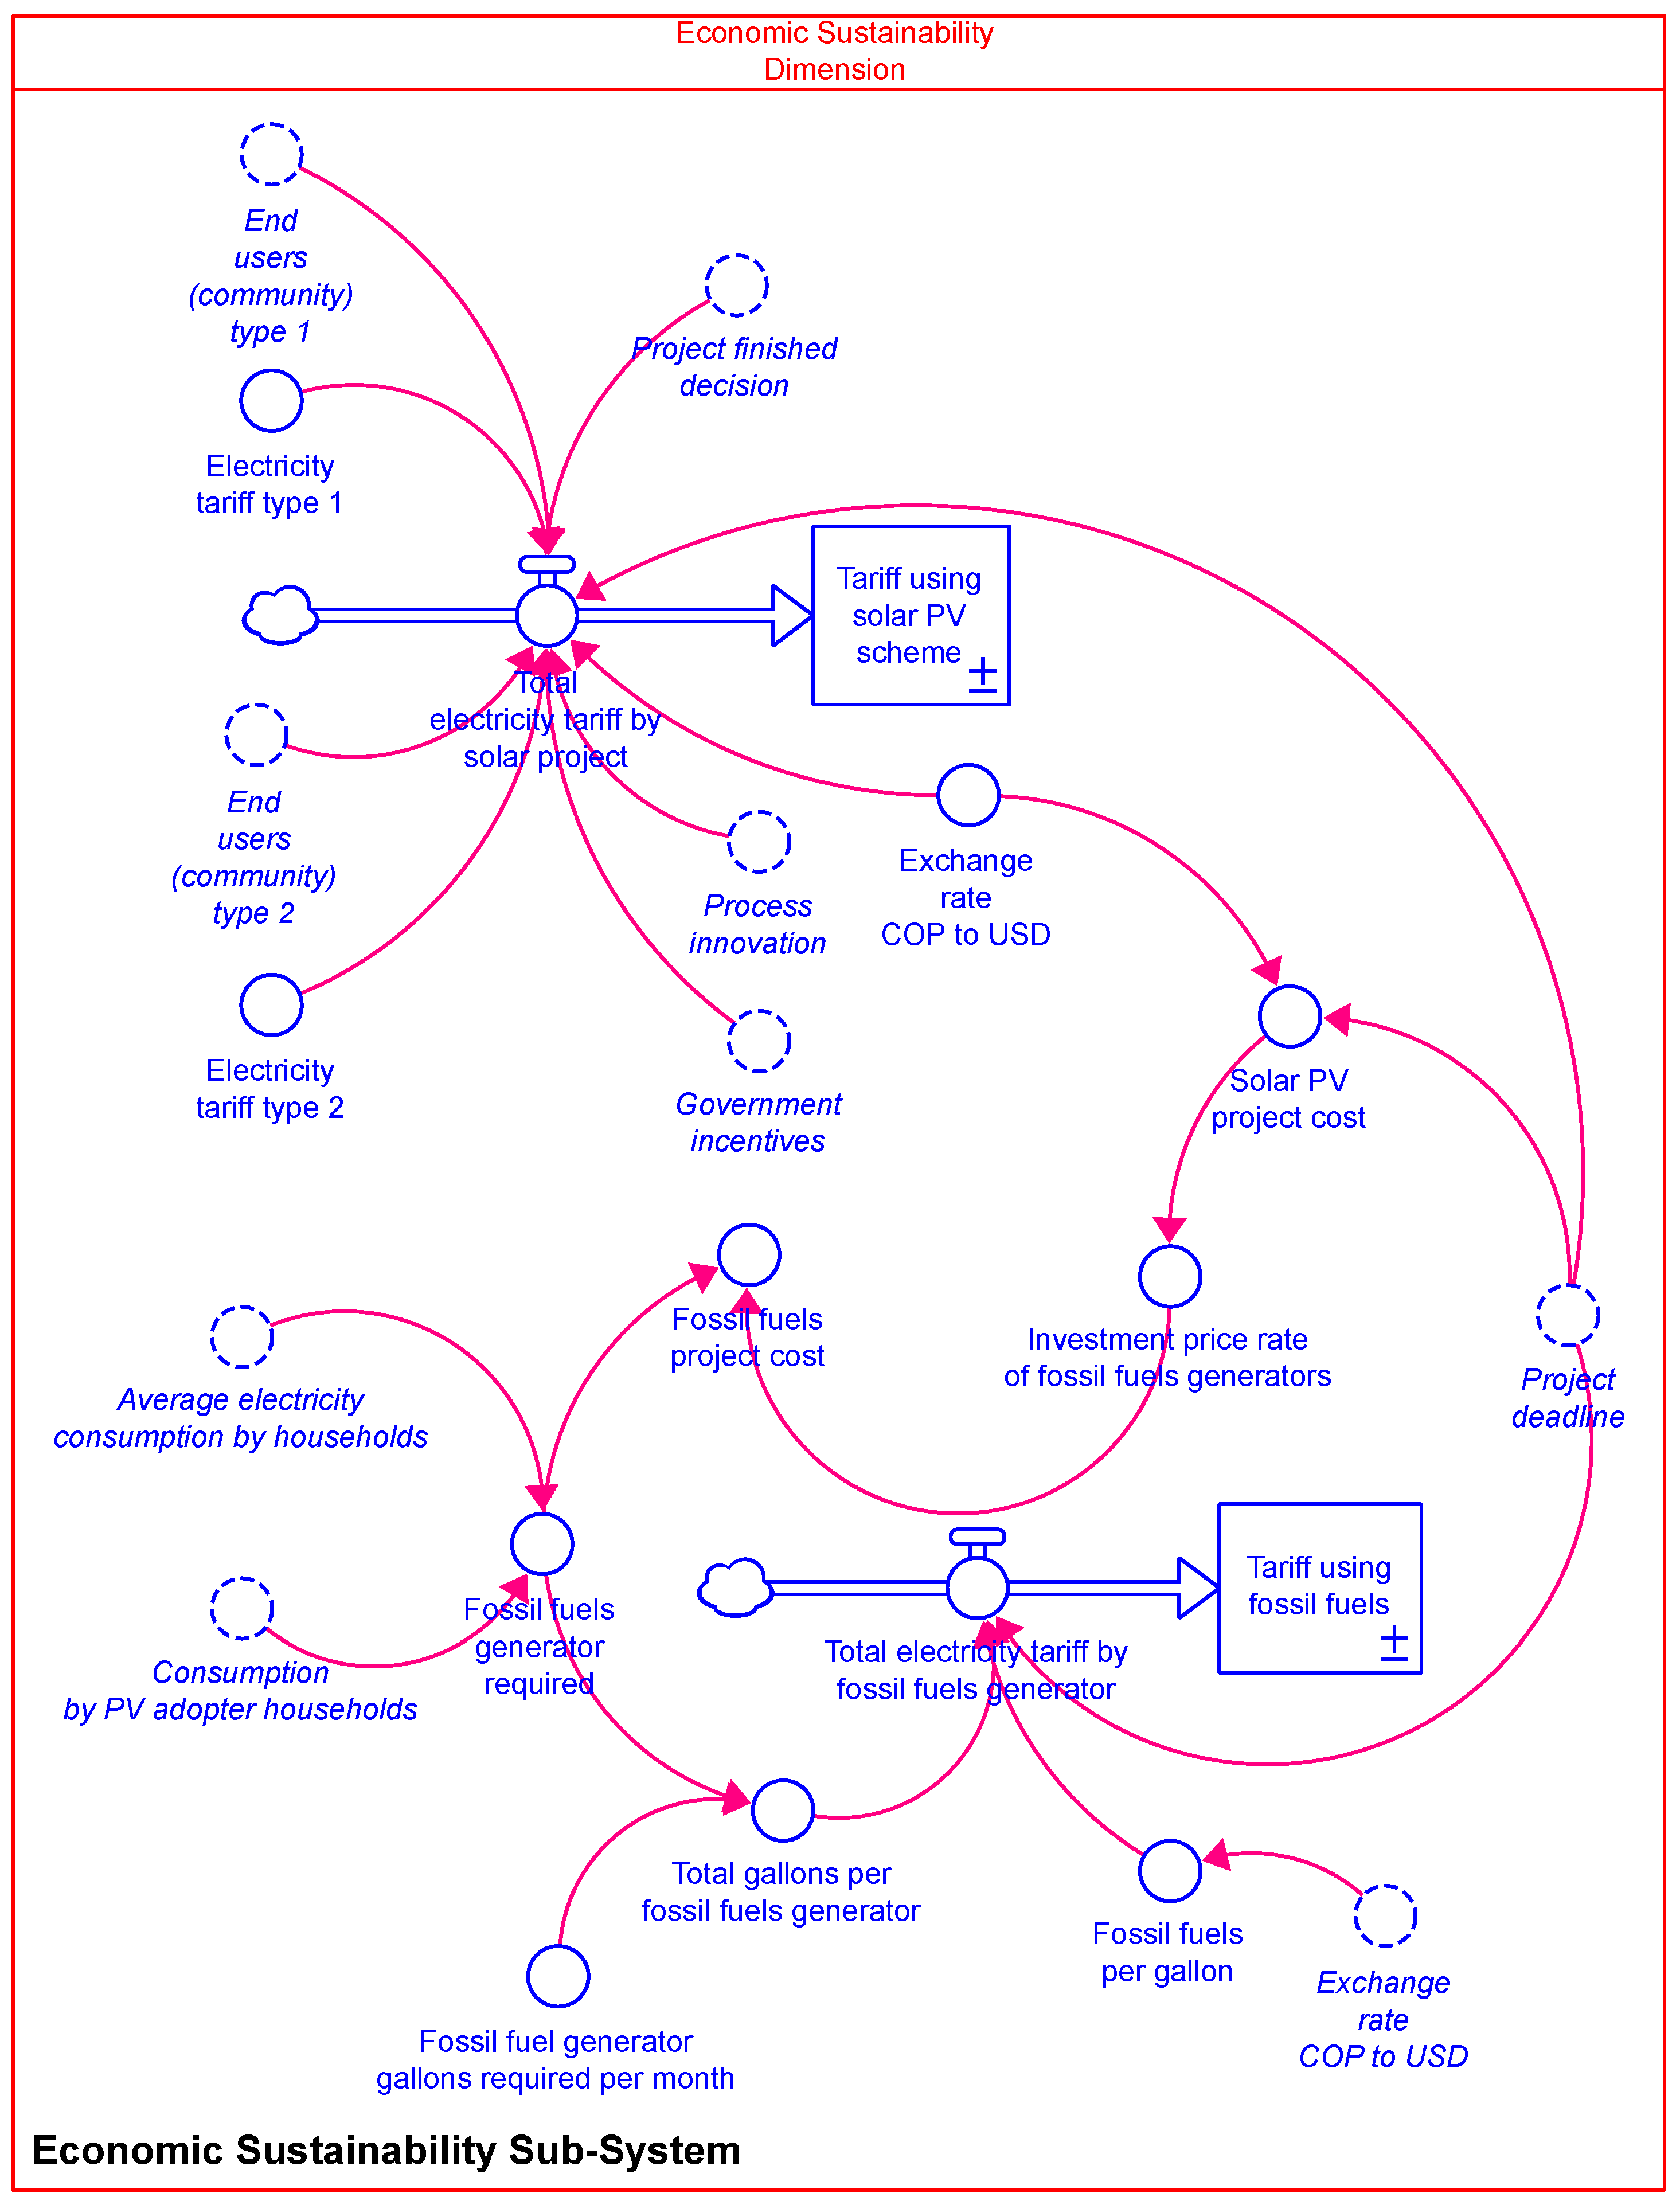
Third, the economic sustainability dimension sub-system was developed in accordance with a fixed government rate (a constant tariff per month) for this specific solar PV project (USD 5.60 for type 1 and USD 8.40 for type 2 per family). The R2 loop links the project cost, tariff scheme, and government policies. In addition, the economic sub-system uses two scenarios to compare electricity generated by solar PV panels with that generated by fossil fuels. Both scenarios equally satisfy the average electricity consumption by households and the consumption by household adopters. The comparison facilitates the analysis of the system impact comparing the two scenarios. Figure 6 shows the stock-and-flow diagram used in this dimension.
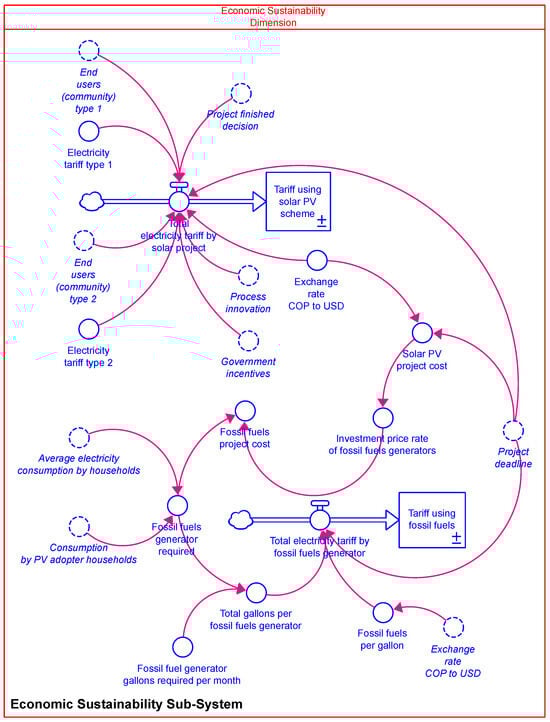
Figure 6.
Stock-and-flow diagram for economic sub-system.
3.4. Model Validation
The SD model has been extensively validated, particularly through tests of dimensionality and consistency [51,70,71]. Validation was conducted using technical data from the solar PV energy project FAZNI-GGC-521-IPSE-074-2017, verified by the Colombian Ministry of Mines and Energy. The assumptions and input data were derived from real project implementation, ensuring alignment with actual conditions (see Section 3.1).
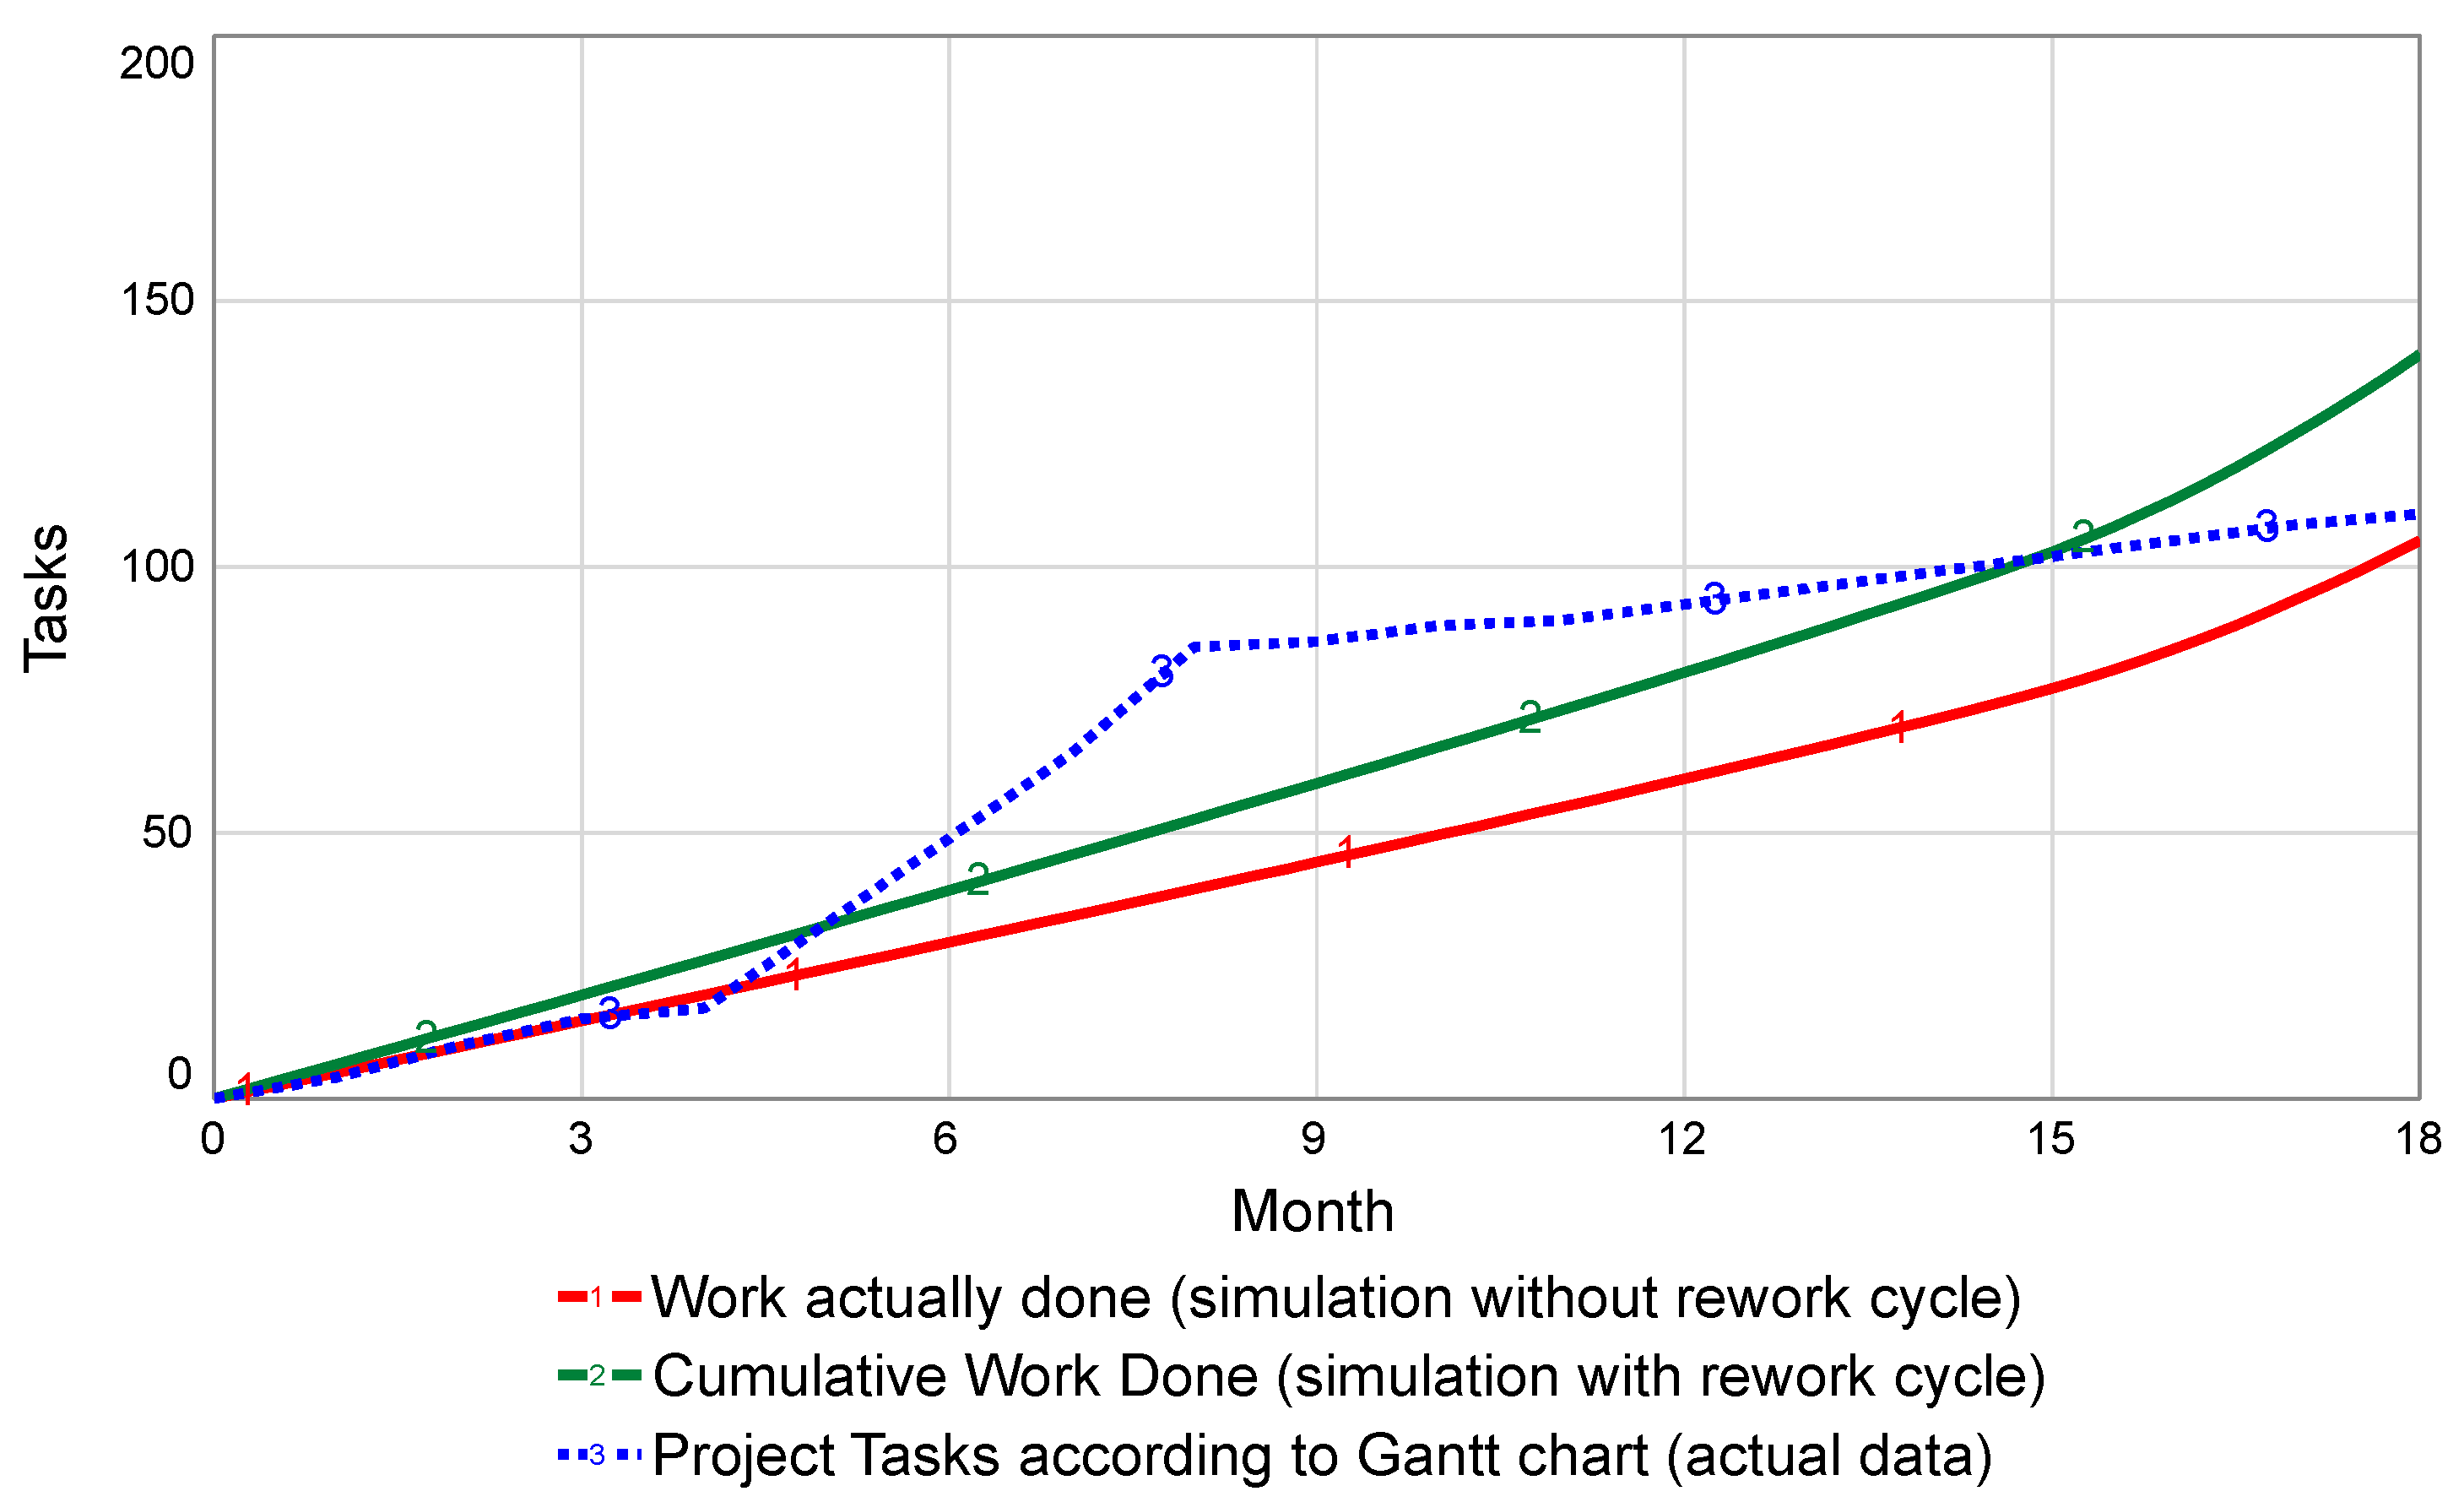
Figure 7 shows a model behaviour test for the actual versus simulated data. The actual data are the tasks developed within the project according to a Gantt chart in which the test compares simulated tasks with “work actually done” (without the rework cycle) and by cumulative “work done” due to rework discovery (considering the rework cycle).
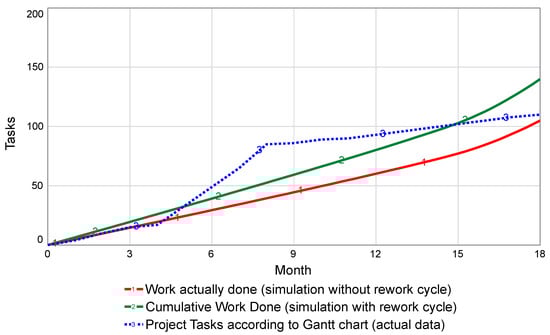
Figure 7.
Model behaviour tests for tasks developed in the solar PV energy project.
The Theil inequality statistics were used to validate the SD model. Theil statistics provide a historical fit with error decomposition of the simulation model to reflect the fraction of the mean squared error (R2) related with bias (Um), unequal variance (US), and unequal covariance (UC). The error analysis and correlation for the variables is represented in Table 1 as “work actually done”, which is the simulation without the rework cycle, and cumulative “work done”, the simulation with the rework cycle. The mean squared error reveals an equal and high value, which indicates a strong and dominant correlation between both trend simulations.

Table 1.
Error analysis and correlation of the ISPM simulation model.
While it is true that the project provides real data from an implemented system, the simulation model was designed to complement this by analysing long-term dynamics that cannot be directly observed in short-term empirical studies. Its purpose is not to replace experimental data but to offer a structured approach to understanding potential outcomes, particularly in process innovation from a project management perspective.
3.5. Model Limitations
The SD model has five limitations, as outlined below:
- The model is adapted from a single solar PV energy case study. As a result, it includes specific inputs that may vary in other countries (e.g., this project assumes a constant government tariff scheme for households).
- The project management sector does not integrate multiple rework cycles to represent the entire project [72,73].
- The system impact stage is evaluated based on two scenarios: (1) the electricity generated by the solar PV energy project case study and (2) an assumed amount of electricity generated from fossil fuels.
- The simulation does not account for the production of solar PV panels because Colombia imports this clean technology rather than manufacturing it domestically. Instead, our system dynamics methodology incorporates product innovation by selecting solar PV panels with the best performance management for the project.
- The SD model simplifies the rework cycle, assuming that rework tasks require the same effort as the original tasks.
4. Results and Discussion
General system theory views disciplines as systems. According to this approach, innovation and sustainability emerge through dynamic, non-linear, and systemic behaviours. By applying the SD methodology, the proposed SD simulation model explains and visualises the non-linear behaviours of innovation, sustainability, and project management (PM) from a holistic perspective. The results align with SD transdisciplinary research, which explains and visualises systems or disciplines from a holistic viewpoint [74]. The simulation demonstrates that the sustainability approach in PM contributes to achieving both project success and project management success which is consistent with [75,76] to exploit innovation and to promote and explore sustainability as stated by [77]. Furthermore, the findings highlight system impacts, including experimenting with new, unknown alternatives for improvements in exploration and extending known alternatives for developments in exploitation, as proposed by [78].
4.1. System Impact of Innovation in Project Management
The levels and type of innovativeness affect innovation projects [79], and implementing change firstly involves costs in the short-term and then benefits in the long-term [80]. The level of innovativeness influences the adaptation and innovation inventory within the project by developing new ideas during the planning and managing stages [81]. The emergence of capabilities from a project is the result of standardising procedures and processes within the organisation’s resources [82,83] where the performance of any processes depends on the time and the capability to develop the work [84]. Thus, although new capabilities emerge from processes of innovation and project management, they are associated with risks and uncertainties [85].
Once the project is completed, it will have the capacity to produce a specific amount of energy, as analysed in this case study. New capabilities emerge when innovation is integrated into a project, fostering growth in a market economy [36,86]. For instance, the innovation system facilitates user–producer interactions through learning-by-doing, learning-by-using, and learning-by-interacting [87]. An adapted approach to engaging an innovation system in project management includes (1) the elements the project will utilise, (2) the actions the project will undertake, and (3) the elements with which the project will interact. Additionally, the innovation system supports the transition from innovation and project management to sustainability [88,89].
The innovation in the SD model focuses on the interaction between the elements utilised during project execution. To establish a connection between innovation and project management, several aspects are considered, including the governance of innovation [90], social innovation [31,91], inclusive innovation [92,93], as well as process and product innovation.
4.1.1. Governance of Innovation and Inclusive Innovation
The project is part of government actions to provide energy to a low-income community. An evaluation of system impact is shown in Figure 8. The results demonstrate that energy provided is insufficient, as household energy consumption increases as a result of population growth in the community.
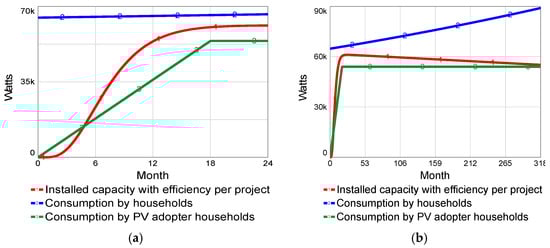
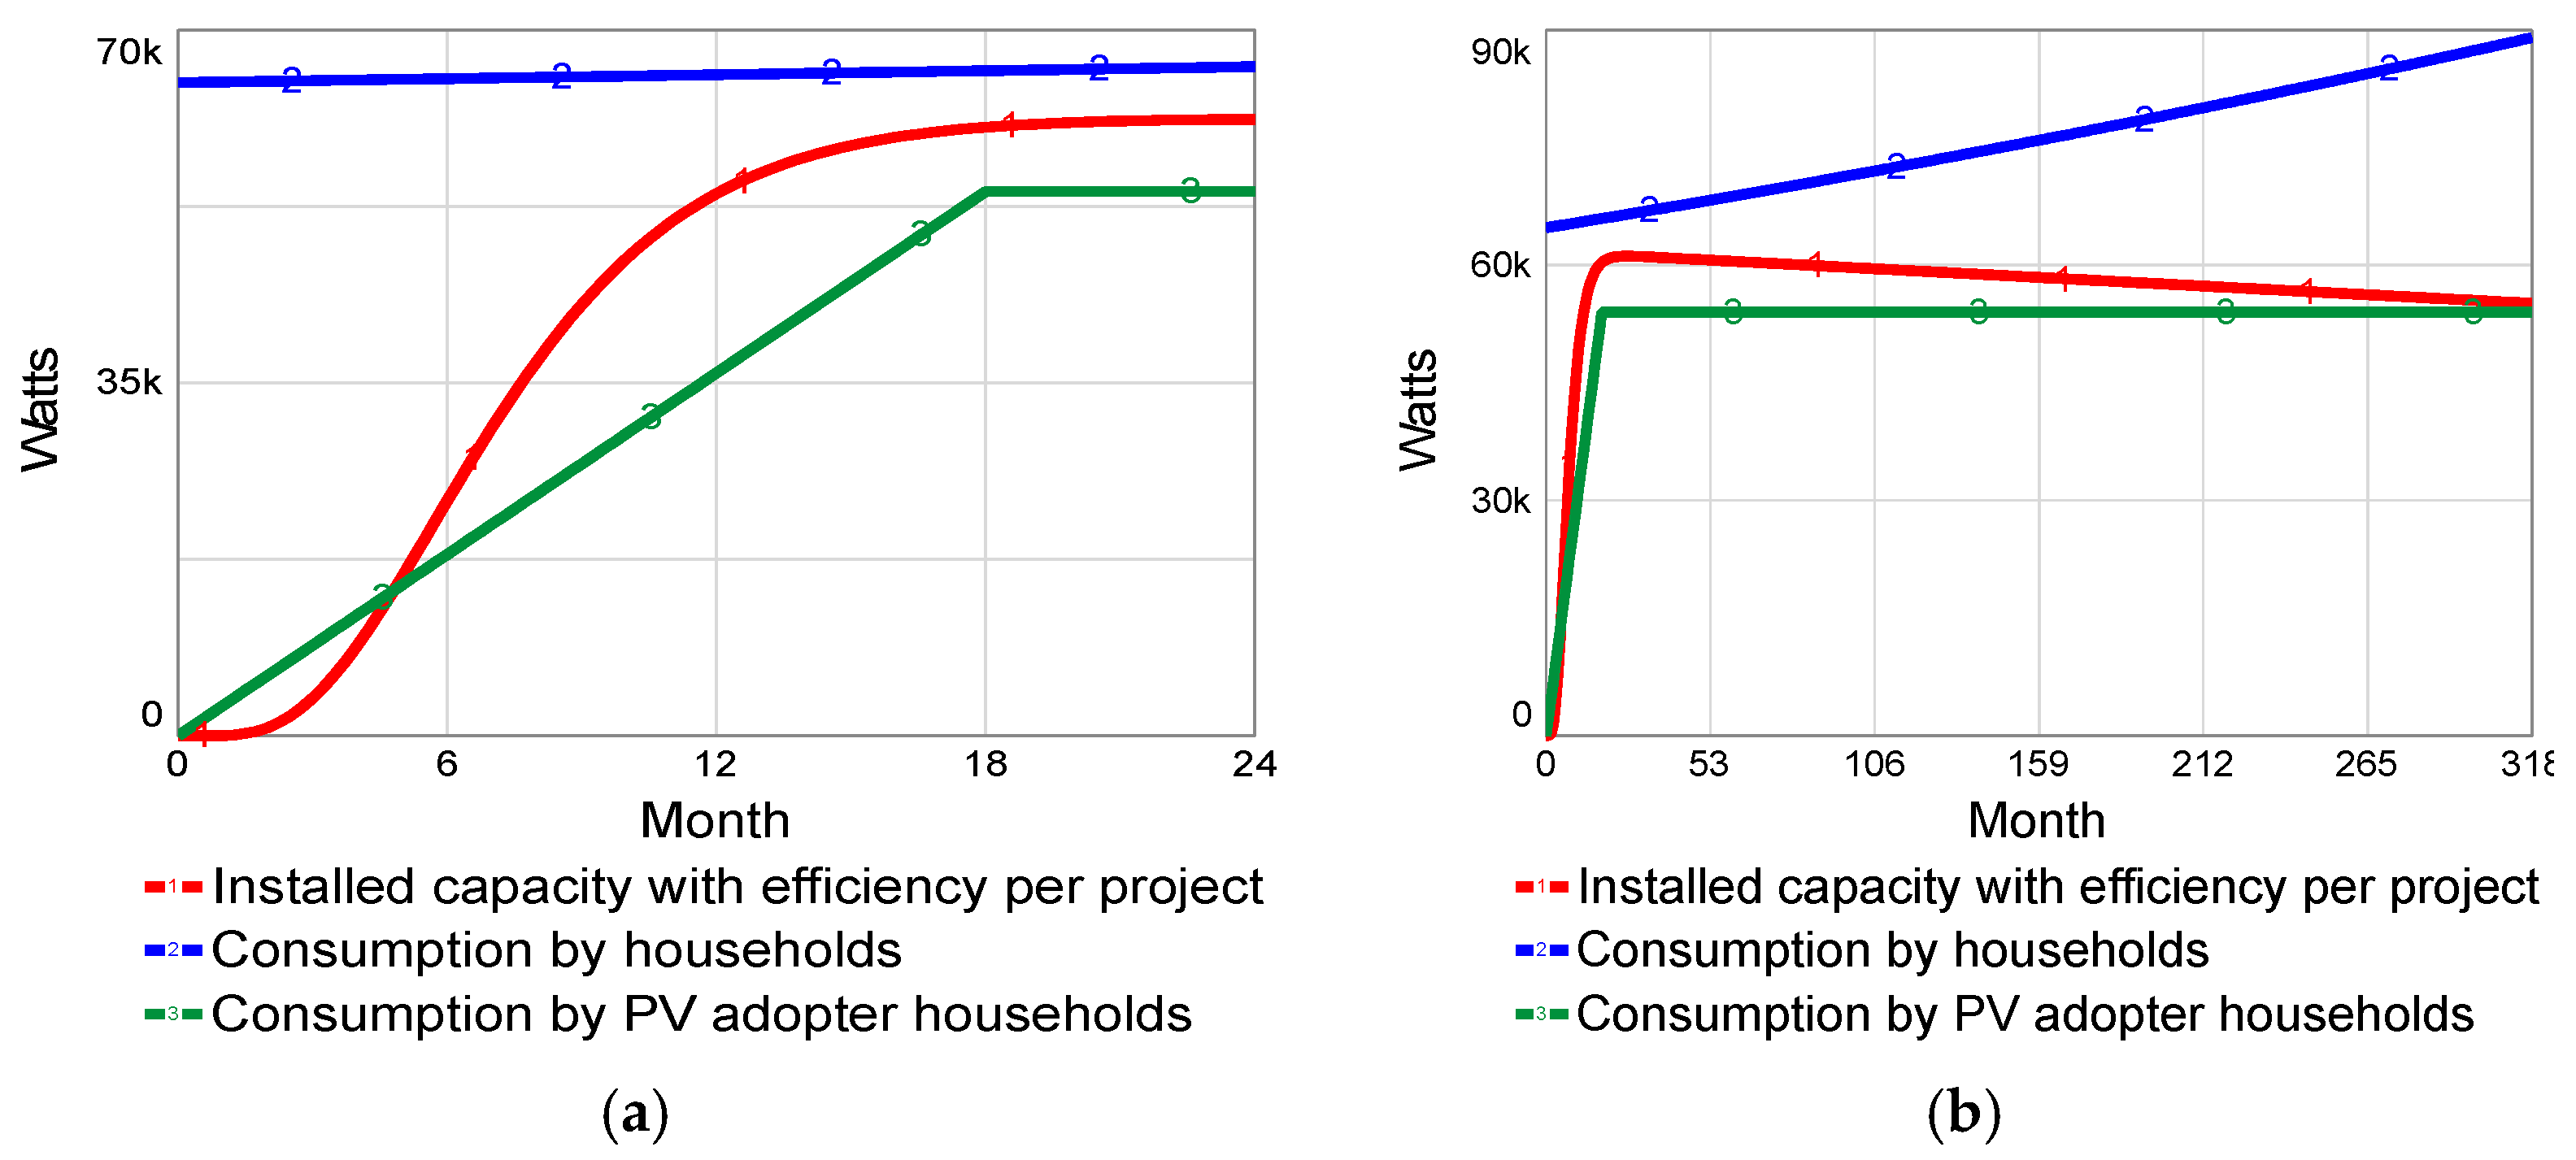
Figure 8.
Energy demand vs. installed capacity per household. (a) System impact during the first 24 months of the project life cycle. (b) System impact over the 25-year lifespan of the solar PV panels.
The solar PV project has an installed capacity of 61.1 kW, which is close to the community’s household consumption of 66.4 kWh. Energy consumption by PV adopter households is currently 54 kWh, which is satisfied by the project, as presented in Figure 8a. The simulation considers a gradual decrease in the efficiency of the solar infrastructure that leads to a reduction in electricity generation. The solar infrastructure is assumed to reach the end of its life cycle at year 25. At year 25, the installed capacity is estimated to be 55.1 kW, which is sufficient for the PV adopter households but cannot satisfy the peak demand of 89 kW for all households, as shown in Figure 8b.
The project provides energy to a community located in a low-income area using the solar PV energy. The results show a form of social innovation that is inclusive, as defined by [92]. Furthermore, the inclusive innovation is linked to governance of innovation as outlined by [94,95].
4.1.2. Process Innovation and Product Innovation
The development of the SD model identifies the elements that the project will use, and the system impact takes the selection of product innovation and the performance of process innovation during project execution.
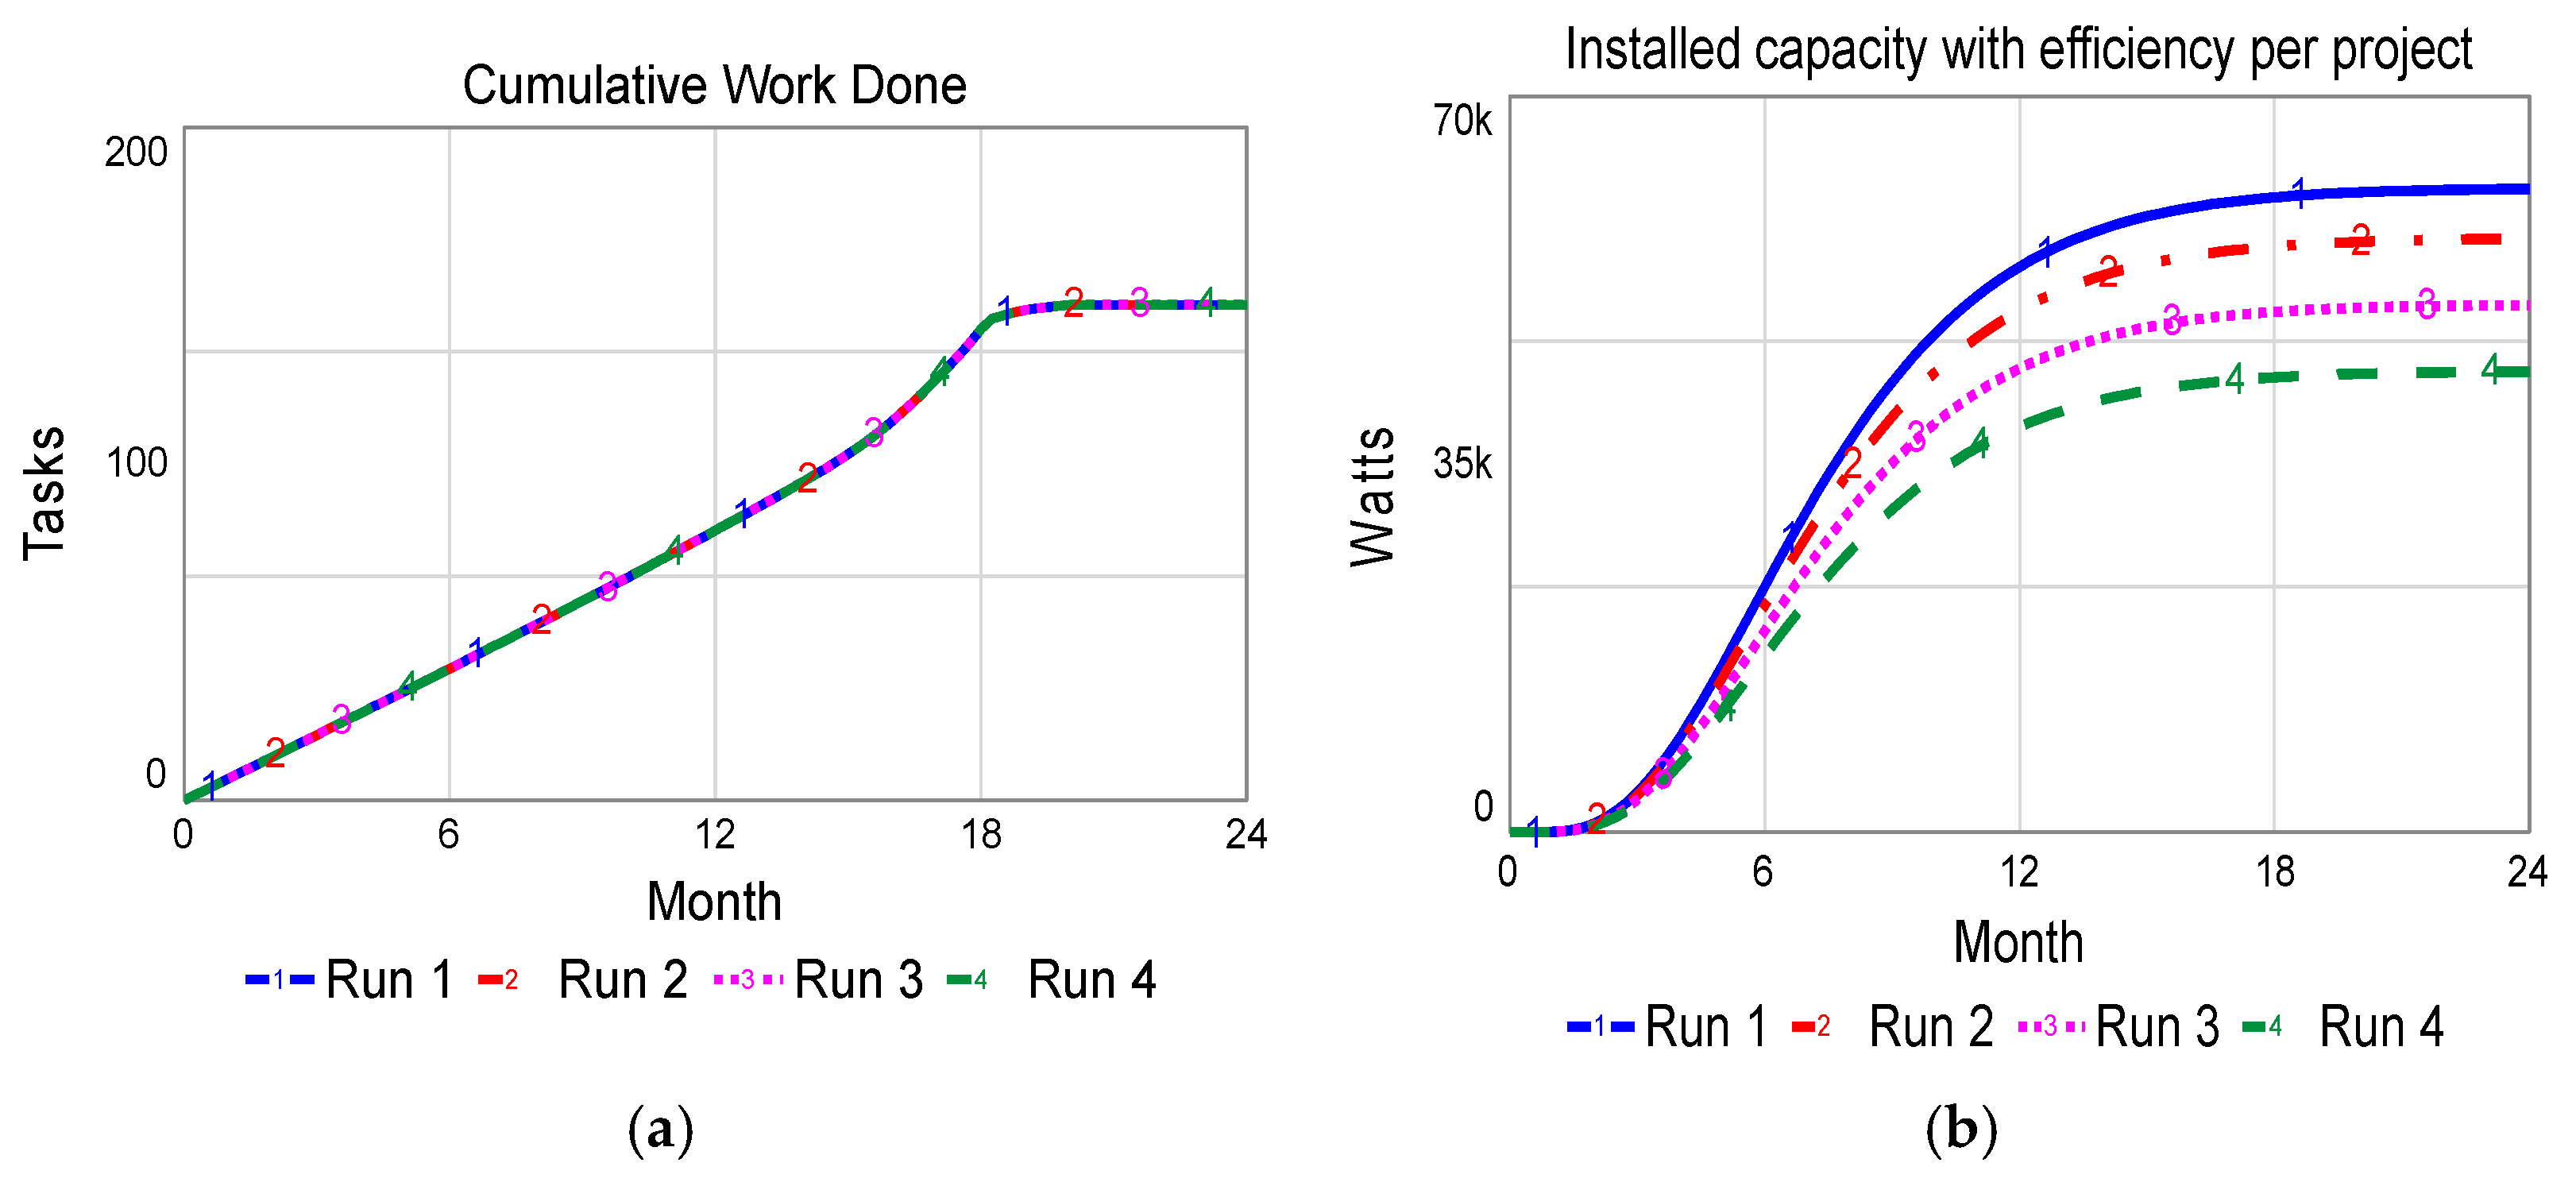
The process innovation variable affects the cumulative work done, the installed capacity, and the efficiency per project, as shown in Figure 9. In the simulation, repetition of tasks enhances processes during the project execution. Figure 9a shows that the efficacy of process innovation within the project is maximised when 140 tasks are completed as the remaining project time is reduced. The number of runs represents the percentage of the enhancing process achieved through innovation.
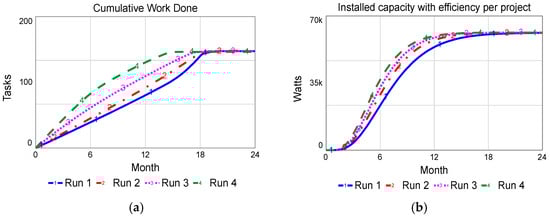
Figure 9.
Sensitivity analysis of process innovation. (a) Cumulative work completed. (b) Installed capacity with project-specific efficiency.
This case study demonstrates that cumulative work is completed by month 18 in run 1 without process innovation. However, improvements in process innovation accelerate completion to month 17.5 in run 2 (20%), month 16.5 in run 3 (30%), and month 13.75 in run 4 (40%). Similarly, the installed capacity reaches 60.4 kW at month 18 in Run 1 to ensure supply security. However, it can be achieved earlier: at 15.25 months in Run 2, 14 months in Run 3, and 13.25 months in Run 4, as shown in Figure 9b.
Product innovation in this study refers to the selection of solar PV panels. As shown in Figure 10a, changing the type of solar PV panels does not affect the “cumulative work done” variable, as the project consists of 140 tasks that remain unchanged regardless of the panels used. However, Figure 10b demonstrates that selecting panels suited to the project significantly impacts the installed capacity. This case study shows that using 325–340 Wp solar panels achieves a total installed capacity of 60.4 kW (Run 1) with a power performance of 97.5%, accounting for power loss and supporting supply security. In contrast, lower-performing panels lead to reduced installed capacity: 55.7 kW (run 2, 92% power performance), 49.5 kW (run 3, 82% power performance), and 43.2 kW (run 4, 72% power performance).
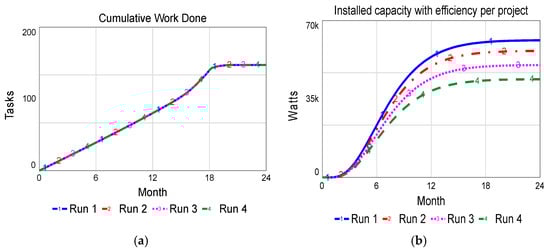
Figure 10.
Sensitivity analysis of product innovation. (a) Cumulative work completed. (b) Installed capacity with project-specific efficiency.
4.2. System Impact of Sustainability in Project Management
Reinforcing an innovation system fosters innovation aligned with sustainability goals by expanding the Management of Projects (MoP) perspective. The system life cycle serves as a catalyst for integrating MoP and sustainability to enhance project success [96,97,98]. Furthermore, the system life cycle supports the extended project life cycle at various stages: the front-end (value creation and strategic framework), project execution (technical core and project phase), the back end (operational phase) consistent with [44], and the extended project stage (system impact).
The system impact aims at sustainability both for and by the project, as an evaluation after the project back-end shows [99]. System impact is an opportunity to achieve Sustainable Development Goals (SDGs) by considering sustainability in relation to MoP discipline using TBL in social efficacy, environmental reality, and economic necessity, as well as adding the required administrative legislation. For instance, the sustainability dimensions are based on combining the TBL and SDGs as follows: social (SDG 1–7, 10), environment (SDG 13–15), and economic (SDG 8, 9, 11, 12).
4.2.1. Social Dimension
The solar PV energy project satisfy the needs of affordable and clean energy for the community contributing to (SDG 7) sustainability social aspects like financing and construction of social action, relationships with local communities, societal interests, and contributions to sustainable communities, as presented by [97,100,101]. The social dimension for sustainability in the Solar PV energy project has a relationship with the governance of innovation, social innovation, and inclusive innovation, discussed in Section 2.
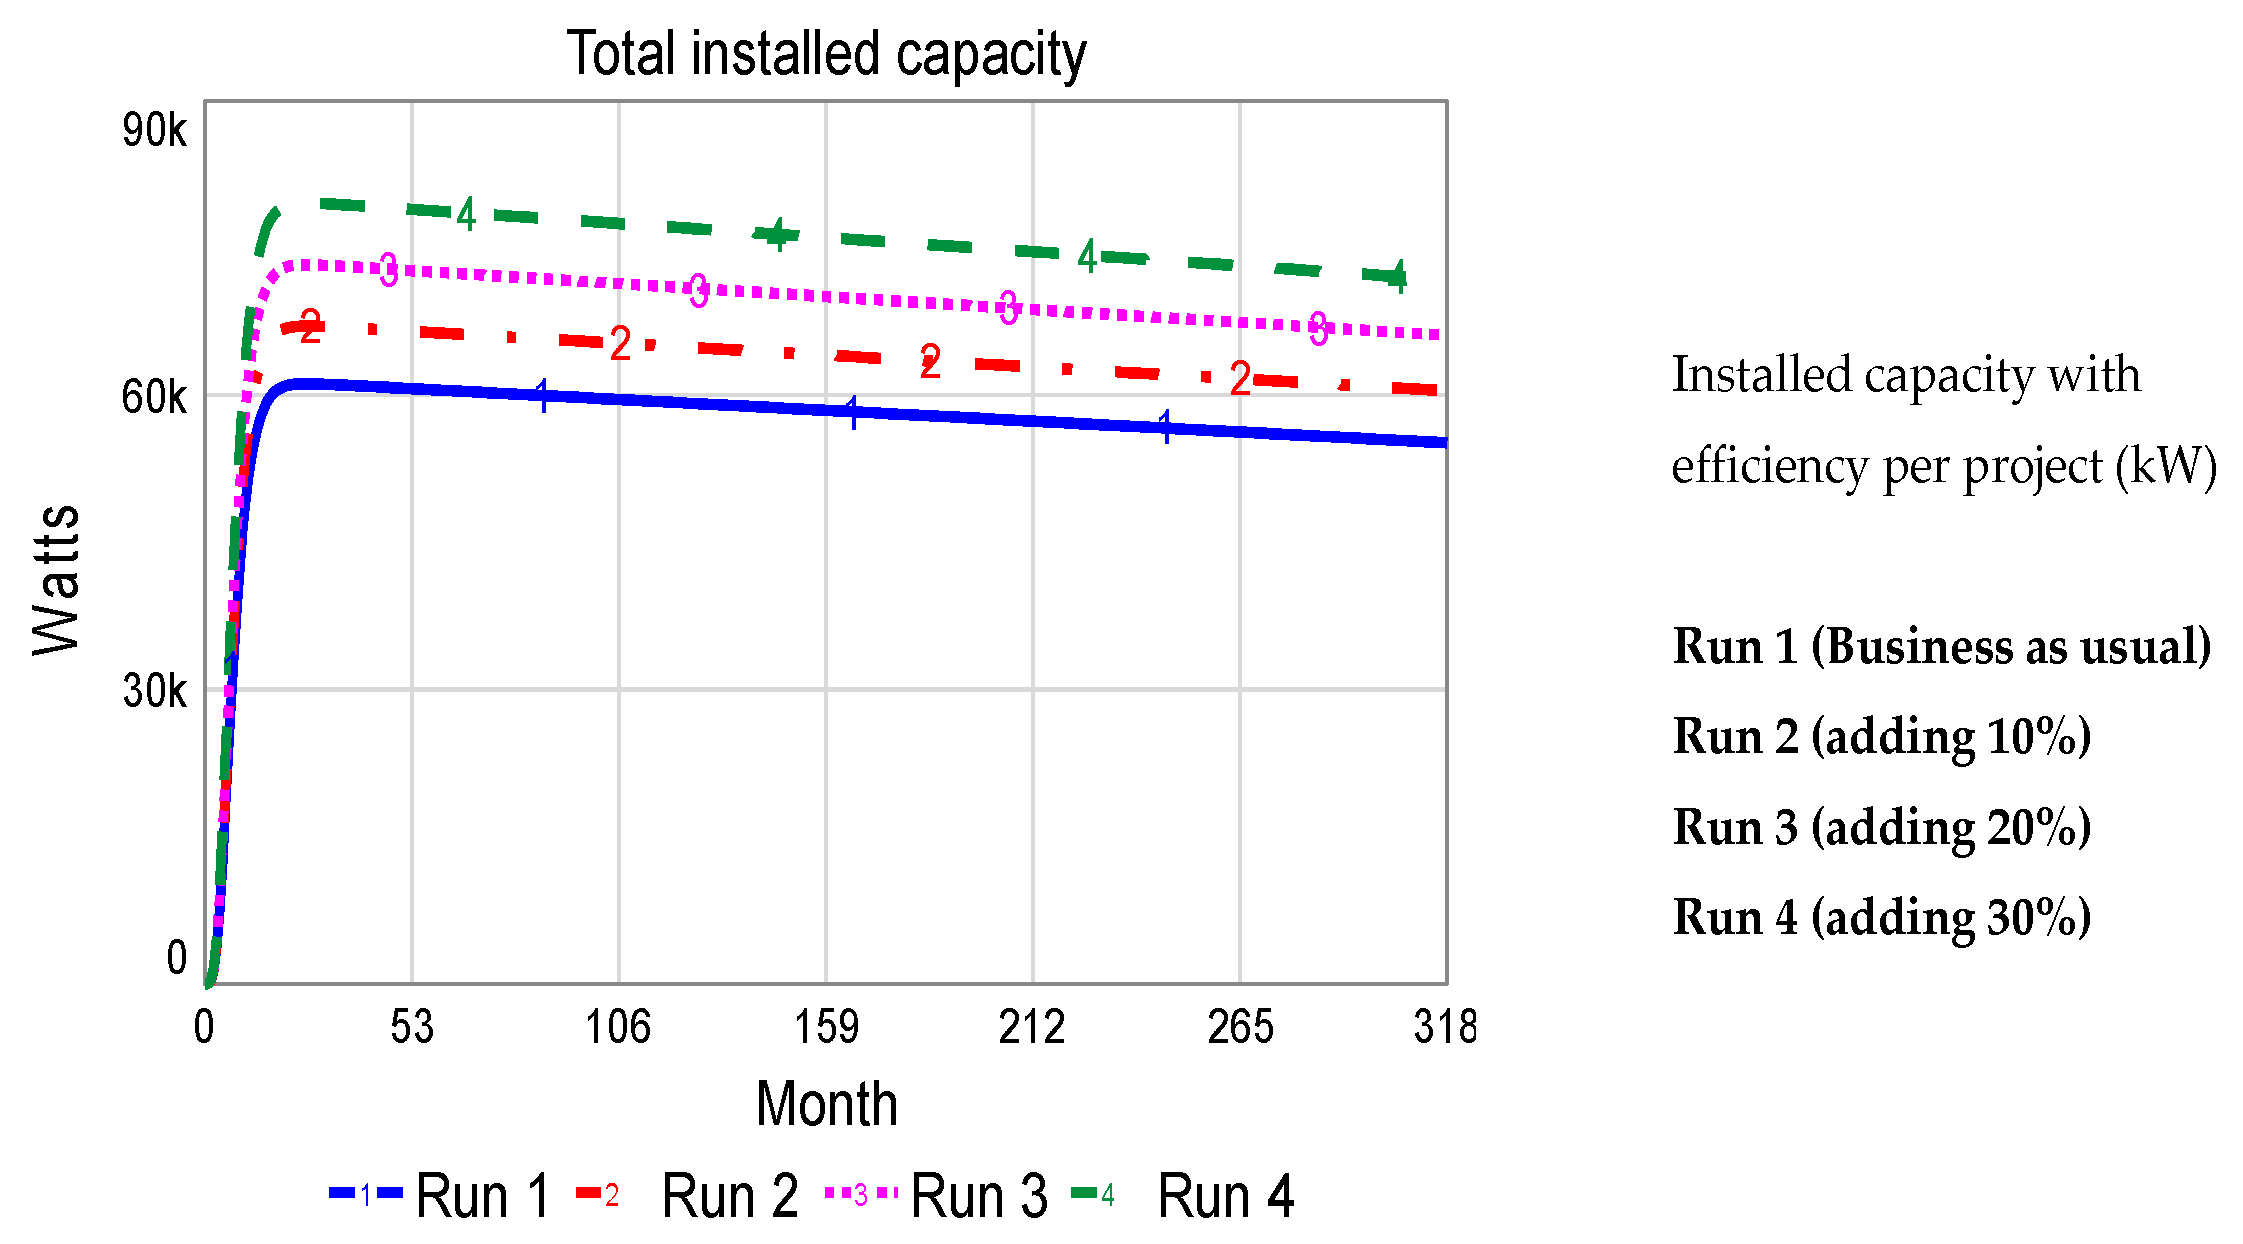
The results of the social dimension indicate that the total installed capacity of the solar PV energy project will not meet household energy consumption over the long term. The lifespan was defined at 25-year for solar PV panels of the project under linear performance assumptions. To assess the social dimension, a sensitivity analysis was conducted as shown in Figure 11, evaluating the total installed capacity under a business-as-usual scenario and considering increases of 10%, 20%, and 30% in solar PV panel deployment to enhance total installed capacity.
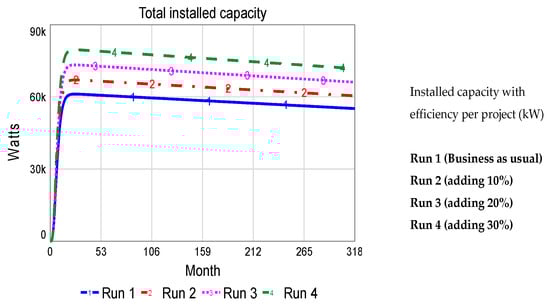
Figure 11.
Sensitivity analysis of total installed capacity, adding solar PV panels.
Consumption by households started at 64.8 kW, but once the project was completed, it rose to 66 kW due to population growth. PV adopter households, 82 families, consumed 54 kW. Sensitivity analysis was used to evaluate changes in value of total installed capacity representing the addition of solar PV panels to the project. For instance, by adding 30% solar PV panels (run 4), the installed capacity started at 78.3 kW in the month 18, but after the duty cycle, decreased to 71.5 kW 25 years later.
System impact results for the social dimension indicate that the capacity of the current solar PV energy project is not enough to satisfy the increasing demand of a growing population. Projects with government sponsorship, need effective communication with the community and plan long-term impact. Another aspect to be considered is what happens at the end of the solar PV panel duty cycle. Since generation decreases, actions need to be taken to guaranty energy supply to the community at that point in time.
4.2.2. Environmental Dimension
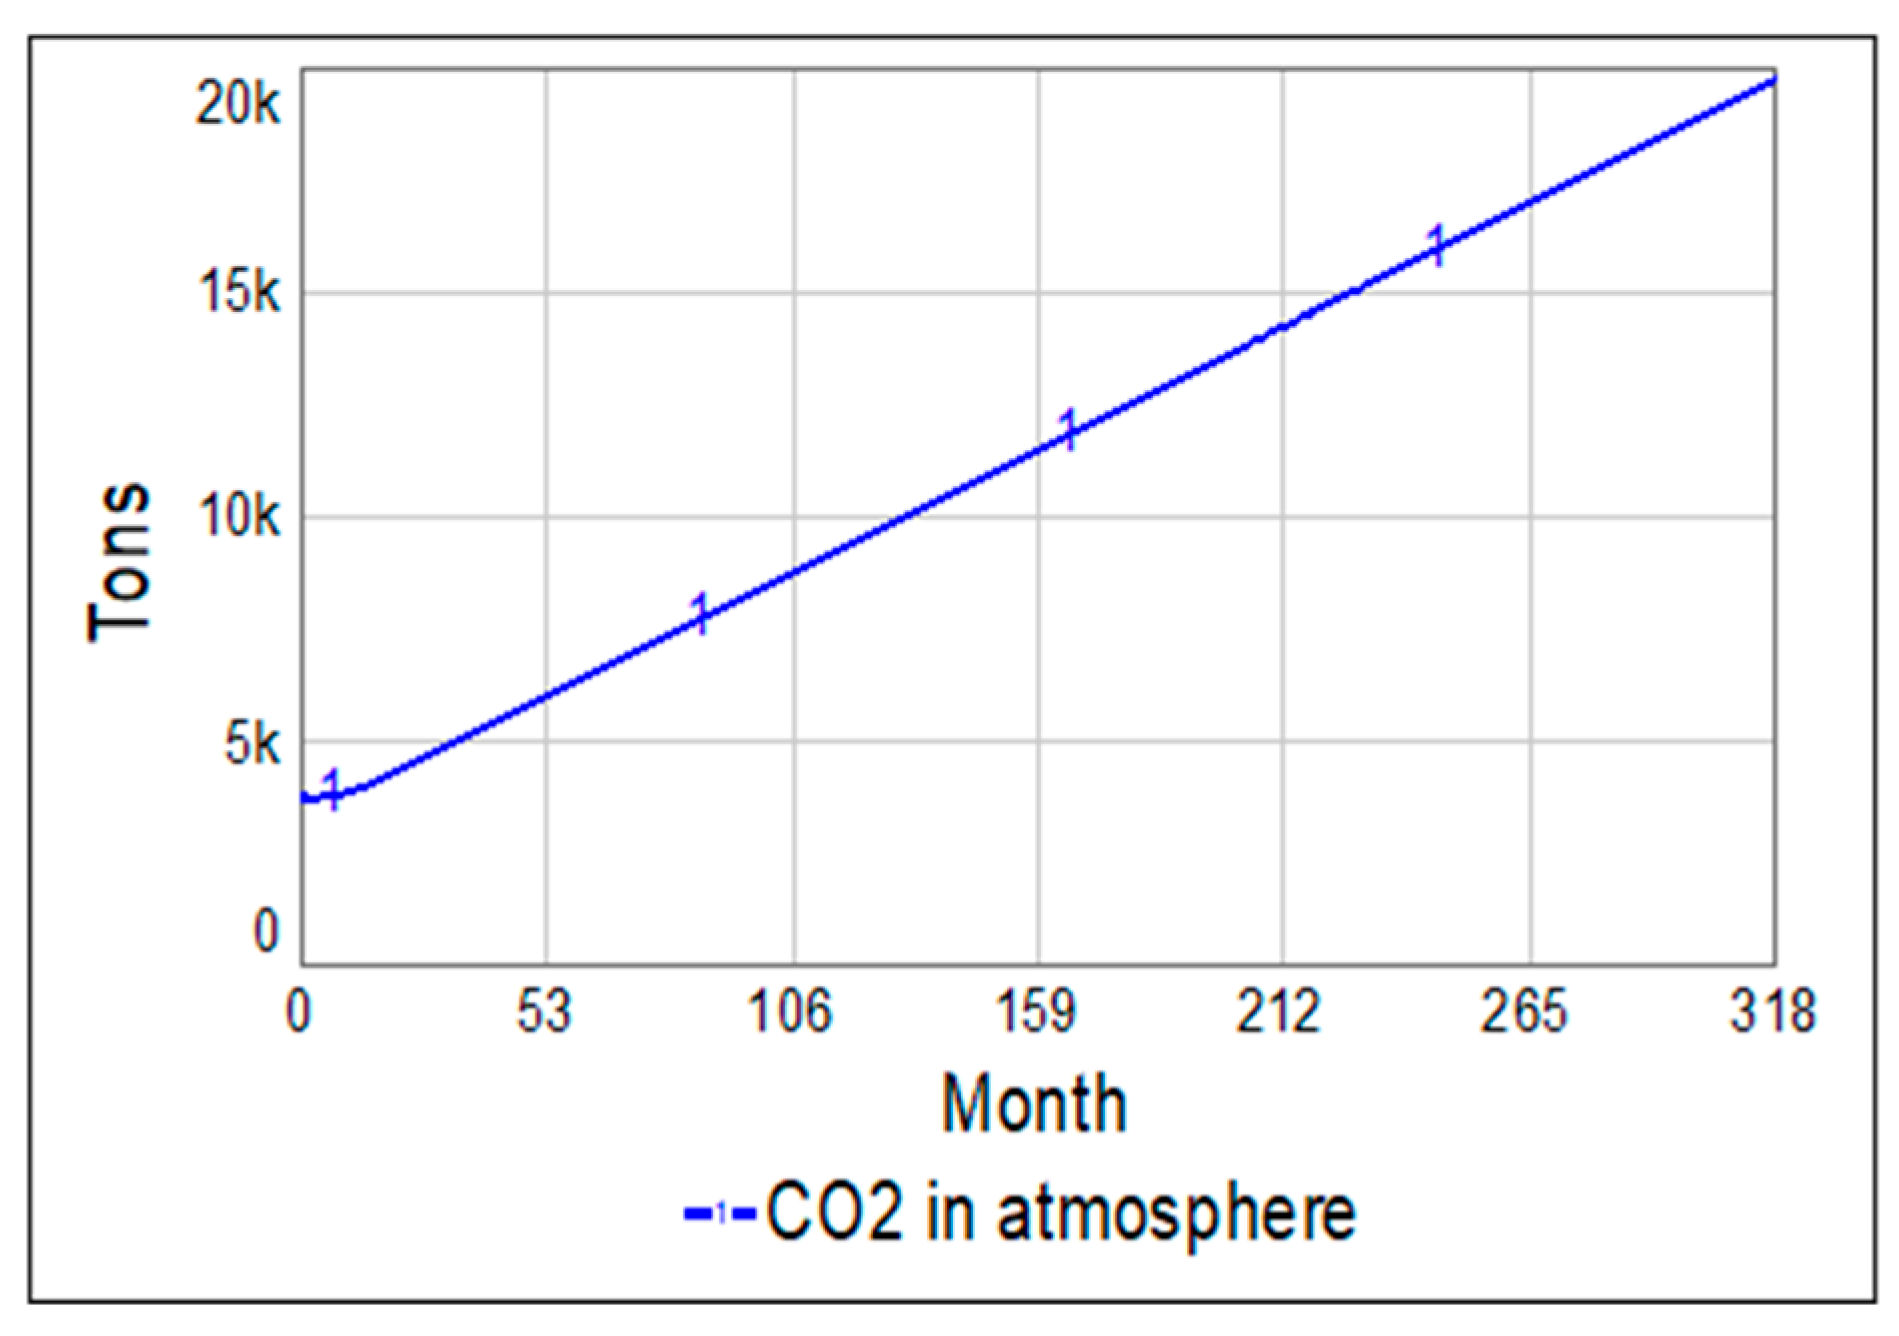
The system impact evaluation of the environmental sustainability dimension considers the generation of CO2 emissions. SD model simulates the amount of CO2 emissions generated to obtain energy for the community in two scenarios. The first scenario of no emissions, in which we assume that solar PV panels do not generate CO2 emissions at electricity generation, and a second scenario that estimates CO2 emissions generated by fossil fuels use. Figure 12 presents the results for CO2 emissions generated by fossil fuel generators, showing a significant increase in atmospheric CO2 within 25 years after project completion.
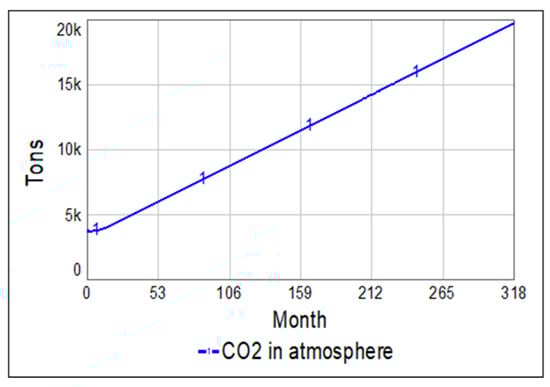
Figure 12.
Electricity generated by fossil fuels and CO2 emissions in the long term.
Supplying electricity to the community with fossil fuel generators meets social sustainability requirements, but due to CO2 emissions it significantly harms environmental sustainability.
The solar PV energy project uses an alternative energy source and is designed to mitigate CO2 emissions reducing environmental impacts in the long term. In addition, this project provides other benefits: climate change action (SDG 13), management of impacts on the environment and the life cycle of products and services, effects on nature and the earth, energy consumption, production and conservation, contamination and pollutants, climate change mitigation, and climate change adaption. Despite the benefits that solar PV energy project brings, it is important to consider potential negative impacts and generate action like waste avoidance, disposal and processing, reuse and recycling of materials.
4.2.3. Economic Dimension
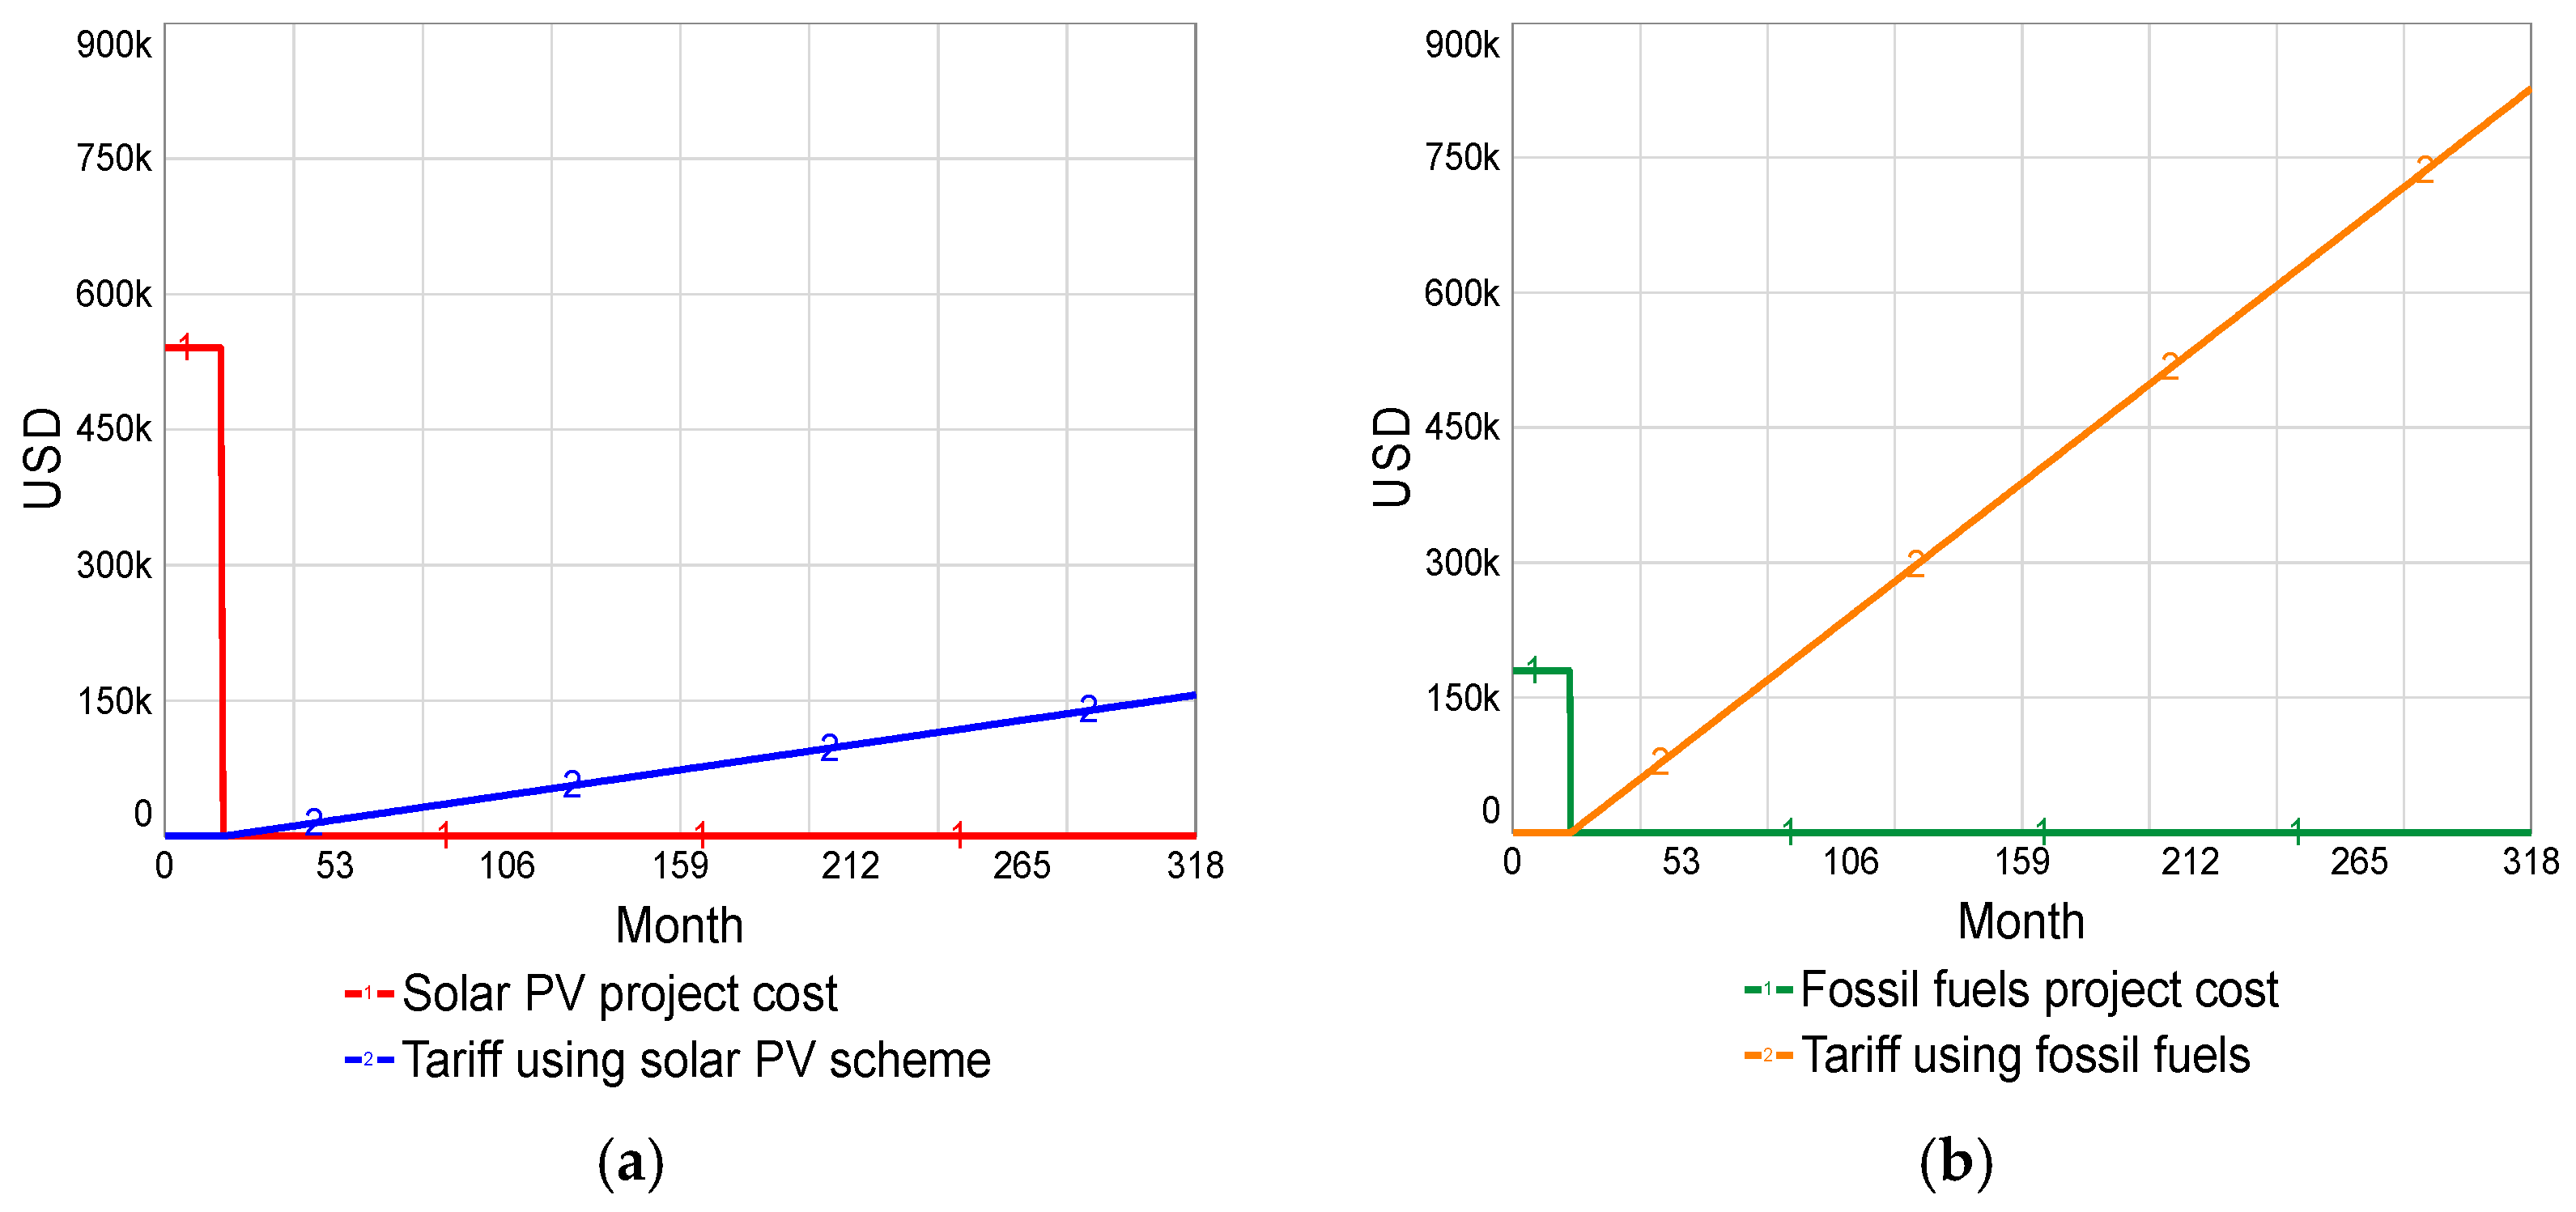
The economic sustainability dimension changes the system impact in the long-term period analysed. The simulation represents the tariff scheme comparison between solar PV panels and fossil fuel generators, as shown in Figure 13.
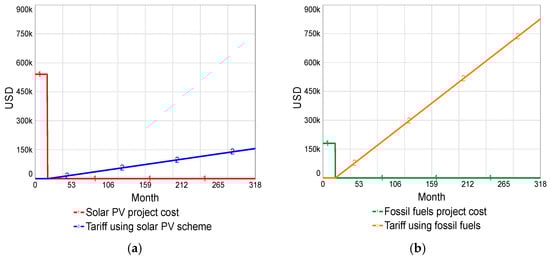
Figure 13.
Cost at long term analysis by solar PV and fossil fuel. (a) solar PV generation. (b) fossil fuel generator.
In the short term, solar PV project costs are higher than those of fossil fuel projects. However, over a longer period, the tariff for fossil fuel use exceeds that of a solar PV system. The economic impact analysis of the solar PV project shows a total cost of USD 541K and a tariff of USD 156K over 25 years (Figure 13a). In contrast, a fossil fuel project incurs a lower initial cost of USD 180K but results in a significantly higher tariff of USD 827K (Figure 13b). These findings indicate that, after 25 years, the economic burden of fossil fuels is substantially greater.
The solar PV project brings additional benefits, such as support of sustainable cities and communities (SDG 11), responsible consumption, and production affordability (SDG 12) as well as economic effects and benefits, better investment criteria, reduction in operational costs, decommissioning, and whole life costings, financial benefits for good practises, and innovation management, as presented by [102].
5. Conclusions
The Management of Projects (MoP) approach considers short term and long-term objectives. In this paper, MoP life cycle is extended to include a system impact stage to forecast and evaluate a project over time. The extension involves the integration of sustainability and innovation with system dynamics for project management. The sustainability dimension allows a broad analysis in the long-term, looking for balanced sustainability analysed from project front-end management. The concept of system impact stage was developed in this paper through a simulation model. The results indicate that, considering the long term, solar PV panels have a large positive impact, have a 73% gain in efficiency, avoid a significant increase in atmospheric CO2 emissions, and satisfy energy need from the community in a more sustainable way compared to the alternative fossil fuel electricity generation.
The positive impact of MoP linked to innovation was demonstrated in a solar PV project case study thanks to the connection of exploitation of governance of innovation with social or inclusive innovation. As shown in simulation Section 4.1. The results also indicate that there is a connection between exploitation of process innovation with product innovation. In addition, robust exploration through sustainability within the system displays the dynamic systemic behaviour through social, environmental, and economic dimensions. The sustainability analysis demonstrates that solar PV helps to satisfy energy needs of communities non-connected to the grid and additionally contributes to achieve several Sustainable Development Goals.
Innovation in projects considers the elements that the project will use, do, or interact with. This paper proposes an SD model that integrates the relationship between innovation and project management. System dynamics applied embeds process innovation with product innovation and governance of innovation with social or inclusive innovation. As a result, the simulations visualise and explain systemically the connectivity between innovation and sustainability through extending the management of projects.
This research proposes an SD model that is a simulation tool for PM in the back-end domain. Including long-term analysis this systemic approach helps to forecast the potential impact on social, environmental, and economic aspects over time.
The proposed SD model is a tool that can be used by project managers and policymakers to have a balanced sustainability assessment within the system impact stage to satisfy societal needs in social, environmental, and economic subsystems. In addition, project managers could use the simulation model for PM and enhance the management of project effectiveness by both project success and project management success in the long run.
Author Contributions
S.Z.: Conceptualization, Formal analysis, Investigation, Methodology, Writing—original draft. J.A.C.-T.: Writing—original draft, Data curation, Software, Formal analysis. M.M.H.: Supervision, Formal analysis, Validation and Data curation, M.T.: Writing—review and editing. J.S.-A.: Conceptualization, Writing—review and editing. All authors have read and agreed to the published version of the manuscript.
Funding
This research was supported by Minciencias under grant 71391.
Data Availability Statement
The original contributions presented in this study are included in the article. Further inquiries can be directed to the corresponding author.
Acknowledgments
We are grateful to our friends who provided us with a lot of advice and support.
Conflicts of Interest
The authors declare that they have no known competing financial interests or personal relationships that could have appeared to influence the work reported in this paper.
References
- Hussain, S.; Xuetong, W.; Maqbool, R.; Hussain, M.; Shahnawaz, M. The Influence of Government Support, Organizational Innovativeness and Community Participation in Renewable Energy Project Success: A Case of Pakistan. Energy 2022, 239, 122172. [Google Scholar] [CrossRef]
- Daniel, P.A. Multi-Level Perspective Framework in Macro Project Studies: Towards a Complex Project Organizing Approach to Sustainability Transitions. Int. J. Proj. Manag. 2022, 40, 865–870. [Google Scholar] [CrossRef]
- Geels, F.W.; Locatelli, G. Broadening Project Studies to Address Sustainability Transitions: Conceptual Suggestions and Crossovers with Socio-Technical Transitions Research. Int. J. Proj. Manag. 2024, 42, 102646. [Google Scholar] [CrossRef]
- United Nations. The Sustainable Development Goals Report 2020; United Nations: New York, NY, USA, 2020.
- International Energy Agency. Strategies for Affordable and Fair Clean Energy Transitions; World Energy Outlook Special Report; International Energy Agency: Paris, France, 2024.
- Garces, E.; Tomei, J.; Franco, C.J.; Dyner, I. Lessons from Last Mile Electrification in Colombia: Examining the Policy Framework and Outcomes for Sustainability. Energy Res. Soc. Sci. 2021, 79, 102156. [Google Scholar] [CrossRef]
- Zapata, S.; Castaneda, M.; Aristizabal, A.J.; Dyner, I. Renewables for Supporting Supply Adequacy in Colombia. Energy 2022, 239, 122157. [Google Scholar] [CrossRef]
- Silva, A.R.; Pimenta, F.M.; Assireu, A.T.; Spyrides, M.H.C. Complementarity of Brazils Hydro and Offshore Wind Power. Renew. Sustain. Energy Rev. 2016, 56, 413–427. [Google Scholar] [CrossRef]
- Ávila, L.; Mine, M.R.M.; Kaviski, E.; Detzel, D.H.M. Evaluation of Hydro-Wind Complementarity in the Medium-Term Planning of Electrical Power Systems by Joint Simulation of Periodic Streamflow and Wind Speed Time Series: A Brazilian Case Study. Renew. Energy 2021, 167, 685–699. [Google Scholar] [CrossRef]
- Viviescas, C.; Lima, L.; Diuana, F.A.; Vasquez, E.; Ludovique, C.; Silva, G.N.; Huback, V.; Magalar, L.; Szklo, A.; Lucena, A.F.P.; et al. Contribution of Variable Renewable Energy to Increase Energy Security in Latin America: Complementarity and Climate Change Impacts on Wind and Solar Resources. Renew. Sustain. Energy Rev. 2019, 113, 109232. [Google Scholar] [CrossRef]
- Galeazzi, C.; Steinbuks, J.; Anadon, L.D. Assessing the Impact of Renewable Energy Policies on Decarbonization in Developing Countries. Renew. Sustain. Energy Rev. 2024, 199, 114444. [Google Scholar] [CrossRef]
- Zapata, S.; Castaneda, M.; Herrera, M.M.; Dyner, I. Investigating the Concurrence of Transmission Grid Expansion and the Dissemination of Renewables. Energy 2023, 276, 127571. [Google Scholar] [CrossRef]
- Leusin, M.E.; Uriona Maldonado, M.; Herrera, M.M. Exploring the Influence of Brazilian Project Cancellation Mechanisms on New Wind Power Generation. Renew. Energy 2024, 221, 119755. [Google Scholar] [CrossRef]
- He, J.; Yang, Y.; Liao, Z.; Xu, A.; Fang, K. Linking SDG 7 to Assess the Renewable Energy Footprint of Nations by 2030. Appl. Energy 2022, 317, 119167. [Google Scholar] [CrossRef]
- UPME. Generación Aprobada 2022–2027. Available online: https://public.tableau.com/profile/upme#!/vizhome/GeneracionAprobada/GeneracionAprobada (accessed on 2 March 2021).
- Henao, F.; Dyner, I. Renewables in the Optimal Expansion of Colombian Power Considering the Hidroituango Crisis. Renew. Energy 2020, 158, 612–627. [Google Scholar] [CrossRef]
- Garces, E.; Franco, C.J.; Tomei, J.; Dyner, I. Sustainable Electricity Supply for Small Off-Grid Communities in Colombia: A System Dynamics Approach. Energy Policy 2023, 172, 113314. [Google Scholar] [CrossRef]
- Coşgun, A.E.; Endiz, M.S.; Demir, H.; Özcan, M. Agrivoltaic Systems for Sustainable Energy and Agriculture Integration in Turkey. Heliyon 2024, 10, e32300. [Google Scholar] [CrossRef]
- Adiansyah, J.S.; Agusdinata, D.B.; Putra, A.P. Environmental Impacts of Solar PV Energy Systems for Small-Island Communities in Indonesia: A Life Cycle Assessment Approach. Energy Sustain. Dev. 2025, 85, 101651. [Google Scholar] [CrossRef]
- Lázár, I.; Szegedi, S.; Tóth, T.; Csákberényi-Nagy, G. An Estimation Model Based on Solar Geometry Parameters for Solar Power Production. Energy Rep. 2020, 6, 1636–1640. [Google Scholar] [CrossRef]
- Calderon-Téllez, J.A.; Herrera, M.M.; Bell, G. The Role of the Rework Cycle from System Dynamics Modelling for Project Management: Challenges and Future Research Agenda. Acad. Rev. Latinoam. Adm. 2025, in press. [Google Scholar] [CrossRef]
- Ansari, R. Dynamic Simulation Model for Project Change-Management Policies: Engineering Project Case. J. Constr. Eng. Manag. 2019, 145, 22. [Google Scholar] [CrossRef]
- Jeng, J.; An, L. System Dynamics Modeling for SOA Project Management. In Proceedings of the IEEE International Conference on Service-Oriented Computing and Applications (SOCA ’07), Newport Beach, CA, USA, 19–20 June 2007; pp. 286–294. [Google Scholar] [CrossRef]
- Morcillo, J.D.; Franco, C.J.; Angulo, F. Delays in Electricity Market Models. Energy Strategy Rev. 2017, 16, 24–32. [Google Scholar] [CrossRef]
- Ford, A. Cycles in Competitive Electricity Markets: A Simulation Study of the Western United States. Energy Policy 1999, 27, 637–658. [Google Scholar] [CrossRef]
- Wang, L.; Kunc, M.; Bai, S.J. Realizing Value from Project Implementation under Uncertainty: An Exploratory Study Using System Dynamics. Int. J. Proj. Manag. 2017, 35, 341–352. [Google Scholar] [CrossRef]
- Lyneis, J.M.; Cooper, K.G.; Els, S.A. Strategic Management of Complex Projects: A Case Study Using System Dynamics. Syst. Dyn. Rev. 2001, 17, 237–260. [Google Scholar] [CrossRef]
- Morris, P.W.G.; Geraldi, J. Managing the Institutional Context for Projects. Proj. Manag. J. 2011, 42, 20–32. [Google Scholar] [CrossRef]
- Calderon-Tellez, J.A.; Sato, C.; Bell, G.; Herrera, M.M. Project Management and System Dynamics Modelling: Time to Connect with Innovation and Sustainability. Syst. Res. Behav. Sci. 2024, 41, 3–29. [Google Scholar] [CrossRef]
- Moulaert, F.; MacCallum, D.; Mehmood, A.; Hamdouch, A. The International Handbook on Social Innovation: Collective Action, Social Learning and Transdisciplinary Research; Edward Elgar: Cheltenham, UK, 2013. [Google Scholar]
- van Wijk, J.; Zietsma, C.; Dorado, S.; de Bakker, F.G.A.; Martí, I. Social Innovation: Integrating Micro, Meso, and Macro Level Insights from Institutional Theory. Bus. Soc. 2019, 58, 887–918. [Google Scholar] [CrossRef]
- Joly, P.-B. Beyond the Competitiveness Framework? Models of Innovation Revisited. J. Innov. Econ. 2017, 22, 79. [Google Scholar] [CrossRef]
- Cosenz, F. Supporting Public Sector Management through Simulation-Based Methods: A Dynamic Performance Management Approach. Int. Rev. Public Adm. 2018, 23, 20–36. [Google Scholar] [CrossRef]
- Herrera, M.M.; Cosenz, F.; Dyner, I. Blending Collaborative Governance and Dynamic Performance Management to Foster Policy Coordination in Renewable Energy Supply Chains. In Enabling Collaborative Governance through Systems Modeling Methods. System Dynamics for Performance Management & Governance; Bianchi, C., Luna-Reyes, L., Rich, E., Eds.; Springer: Cham, Switzerland, 2020; pp. 237–261. [Google Scholar]
- Pargar, F.; Kujala, J.; Aaltonen, K.; Ruutu, S. Value Creation Dynamics in a Project Alliance. Int. J. Proj. Manag. 2019, 37, 716–730. [Google Scholar] [CrossRef]
- Tidd, J.; Bessant, J. Managing Innovation: Integrating Technological, Market and Organizational Change, 6th ed.; John Wiley & Sons, Inc.: Hoboken, NJ, USA, 2018; ISBN 9781119379454. [Google Scholar]
- Severo, E.A.; Sbardelotto, B.; de Guimarães, J.C.F.; de Vasconcelos, C.R.M. Project Management and Innovation Practices: Backgrounds of the Sustainable Competitive Advantage in Southern Brazil Enterprises. Prod. Plan. Control 2020, 31, 1276–1290. [Google Scholar] [CrossRef]
- Ahn, M.J.; Zwikael, O.; Bednarek, R. Technological Invention to Product Innovation: A Project Management Approach. Int. J. Proj. Manag. 2010, 28, 559–568. [Google Scholar] [CrossRef]
- Davies, A. Integrated Solutions: The Changing Business of Systems Integration. In The Business of Systems Integration; Oxford University Press: Oxford, UK, 2011; pp. 333–368. [Google Scholar]
- Utterback, J.M.; Abernathy, W.J. A Dynamic Model of Process and Product Innovation. Omega 1975, 3, 639–656. [Google Scholar] [CrossRef]
- Castaneda, M.; Herrera, M.M.; Méndez-Morales, A. A Simulation-Based Approach for Assessing the Innovation Barriers in the Manufacturing Firms. Technol. Soc. 2023, 75, 102391. [Google Scholar] [CrossRef]
- Project Management Institute (PMI). A Guide to the Project Management Body of Knowledge (PMBOK Guide), 6th ed.; Project Management Institute: Newtown Square, PA, USA, 2017. [Google Scholar]
- Association for Project Management (APM). APM Body of Knowledge, 7th ed.; Association for Project Management: Buckinghamshire, UK, 2019. [Google Scholar]
- Artto, K.; Ahola, T.; Vartiainen, V. From the Front End of Projects to the Back End of Operations: Managing Projects for Value Creation throughout the System Lifecycle. Int. J. Proj. Manag. 2016, 34, 258–270. [Google Scholar] [CrossRef]
- Elkington, J. Cannibals with Forks: The Triple Bottom Line of 21st Century Business; Capstone: Oxford, UK, 1999. [Google Scholar]
- WCED. Our Common Future: Report of the World Commission on Environment and Development. Int. Aff. 1987, 64, 126. [Google Scholar] [CrossRef]
- Von Bertalanffy, L. General System Theory—A Critical Review. In Systems Behaviour; The Open University: London, UK, 1981; pp. 59–79. [Google Scholar]
- Checkland, P.B. Science and the Systems Movement. In Systems Behaviour; The Open University: London, UK, 1981; pp. 26–43. [Google Scholar]
- Sterman, J.D. Business Dynamics System Thinking and Modeling for a Complex World; McGraw Hill: Boston, MA, USA, 2000. [Google Scholar]
- Oliva, R. Model Calibration as a Testing Strategy for System Dynamics Models. Eur. J. Oper. Res. 2003, 151, 552–568. [Google Scholar] [CrossRef]
- Qudrat-Ullah, H.; Seong, B.S. How to Do Structural Validity of a System Dynamics Type Simulation Model: The Case of an Energy Policy Model. Energy Policy 2010, 38, 2216–2224. [Google Scholar] [CrossRef]
- Jääskä, E.; Aaltonen, K.; Hellens, L.; Kujala, J. Bridging Change and Project Management: A Review and Future Research Directions. Proj. Leadersh. Soc. 2025, 6, 100172. [Google Scholar] [CrossRef]
- Peterson, S.; Bush, B.; Inman, D.; Newes, E.; Schwab, A.; Stright, D.; Vimmerstedt, L. Lessons from a Large-Scale Systems Dynamics Modeling Project: The Example of the Biomass Scenario Model. Syst. Dyn. Rev. 2019, 35, 55–69. [Google Scholar] [CrossRef]
- Hu, B. ChatPySD: Embedding and Simulating System Dynamics Models in ChatGPT-4. Syst. Dyn. Rev. 2025, 41, e1797. [Google Scholar] [CrossRef]
- Ballard, E.; Werner, K.; Priyadarshini, P. Boundary Objects in Translation: The Role of Language in Participatory System Dynamics Modeling. Syst. Dyn. Rev. 2021, 37, 310–332. [Google Scholar] [CrossRef]
- Cherni, J.A.; Dyner, I.; Henao, F.; Jaramillo, P.; Smith, R.; Font, R.O. Energy Supply for Sustainable Rural Livelihoods. A Multi-Criteria Decision-Support System. Energy Policy 2007, 35, 1493–1504. [Google Scholar] [CrossRef]
- IPSE. Centro Nacional de Monitoreo. Available online: https://ipse.gov.co/cnm/ (accessed on 3 February 2025).
- Ministerio de Minas y Energía. Formulación del Plan de Mejoramiento suscrito con la Contraloría General de la República, con Ocasión a la Actuación Especial Fiscalización Fondo FAZNI; Ministerio de Minas y Energía: Bogotá, Colombia, 2021. [Google Scholar]
- Rodrigues, A.; Bowers, J. The Role of System Dynamics in Project Management. Int. J. Proj. Manag. 1996, 14, 213–220. [Google Scholar] [CrossRef]
- Cooper, K.G. Naval Ship Production—A Claim Settled and a Framework Built. Interfaces 1980, 10, 20–36. [Google Scholar] [CrossRef]
- Bass, F.M. A New Product Growth for Model Consumer Durables. Manag. Sci 1969, 15, 215–227. [Google Scholar] [CrossRef]
- Castaneda, M.; Zapata, S.; Cherni, J.; Aristizabal, A.J.; Dyner, I. The Long-Term Effects of Cautious Feed-in Tariff Reductions on Photovoltaic Generation in the UK Residential Sector. Renew. Energy 2020, 155, 1432–1443. [Google Scholar] [CrossRef]
- Fiddaman, T.S. Feedback Complexity in Integrated Climate-Economy Models. Ph.D. Thesis, Massachllsetts Institute of Technology, Cambridge, MA, USA, 1997. [Google Scholar]
- Calderon-Tellez, J.A.; Herrera, M.M. Appraising the Impact of Air Transport on the Environment: Lessons from the COVID-19 Pandemic. Transp. Res. Interdiscip. Perspect. 2021, 10, 100351. [Google Scholar] [CrossRef]
- Sterman, J.D.; Sweeney, L.B. Cloudy Skies: Assessing Public Understanding of Global Warming. Syst. Dyn. Rev. 2002, 18, 207–240. [Google Scholar] [CrossRef]
- Parex Resources. 2023 Sustainability Report; Parex Resources: Calgary, AB, Canada, 2023. [Google Scholar]
- World Bank Group Global Solar Atlas. Available online: https://globalsolaratlas.info/detail?c=4.74615,-71.477051,7&m=site&a=-72.125244,5.856475,-72.125244,6.489983,-69.873047,6.489983,-69.873047,5.856475,-72.125244,5.856475 (accessed on 4 February 2025).
- Byrne, B.; Goldblatt, C. Radiative Forcing at High Concentrations of Well-Mixed Greenhouse Gases. Geophys. Res. Lett. 2014, 41, 152–160. [Google Scholar] [CrossRef]
- U.S. Energy Information Administration. How Much Carbon Dioxide Is Produced Per Kilowatthour of U.S. Electricity Generation? Available online: https://www.eia.gov/tools/faqs/faq.php?id=74&t=11 (accessed on 4 February 2025).
- Barlas, Y. Formal Aspects of Model Validity and Validation in System Dynamics. Syst. Dyn. Rev. 1996, 12, 183–210. [Google Scholar] [CrossRef]
- Sterman, J.D. Appropriate Summary Statistics for Evaluating the Historical Fit of System Dynamics Models. Dynamica 1984, 10, 51–66. [Google Scholar]
- Parvan, K.; Rahmandad, H.; Haghani, A. Inter-Phase Feedbacks in Construction Projects. J. Oper. Manag. 2015, 39–40, 48–62. [Google Scholar] [CrossRef]
- Stupples, D.W. Using System Dynamics Modelling to Understand and Address the Systemic Issues on Complex Engineering Projects. Meas. Control 2002, 35, 132–136. [Google Scholar] [CrossRef]
- Nicolescu, B. Manifesto of Transdisciplinarity; State University of New York Press: New York, NY, USA, 2002; ISBN 978-0791452622. [Google Scholar]
- Carvalho, M.M.; Rabechini, R. Can Project Sustainability Management Impact Project Success? An Empirical Study Applying a Contingent Approach. Int. J. Proj. Manag. 2017, 35, 1120–1132. [Google Scholar] [CrossRef]
- Cooke-Davies, T. Project Success. In The Wiley Guide to Project, Program, and Portfolio Management; Morris, P.W.G., Pinto, J.K., Eds.; John Wiley & Sons, Inc.: Hoboken, NJ, USA, 2007; ISBN 9781118000304. [Google Scholar]
- Kivilä, J.; Martinsuo, M.; Vuorinen, L. Sustainable Project Management through Project Control in Infrastructure Projects. Int. J. Proj. Manag. 2017, 35, 1167–1183. [Google Scholar] [CrossRef]
- Benner, M.J.; Tushman, M.L. Exploitation, Exploration, and Process Management: The Productivity Dilemma Revisited. Acad. Manag. Rev. 2003, 28, 238–256. [Google Scholar] [CrossRef]
- Kapsali, M. Systems Thinking in Innovation Project Management: A Match That Works. Int. J. Proj. Manag. 2011, 29, 396–407. [Google Scholar] [CrossRef]
- Lyneis, J.M.; Ford, D.N. System Dynamics Applied to Project Management: A Survey, Assessment, and Directions for Future Research. Syst. Dyn. Rev. 2007, 23, 157–189. [Google Scholar] [CrossRef]
- Herrera, M.M.; Trujillo-Díaz, J. Towards a Strategic Innovation Framework to Support Supply Chain Performance. Int. J. Product. Perform. Manag. 2022, 71, 1872–1894. [Google Scholar] [CrossRef]
- Brady, T.; Davies, A. Building Project Capabilities: From Exploratory to Exploitative Learning. Organ. Stud. 2004, 25, 1601–1621. [Google Scholar] [CrossRef]
- Davies, A. Projects: A Very Short Introduction; Oxford University Press: Oxford, UK, 2017; ISBN 9780198727668. [Google Scholar]
- Repenning, N.P.; Sterman, J.D. Capability Traps and Self-Confirming Attribution Errors in the Dynamics of Process Improvement. Adm. Sci. Q. 2002, 47, 265–295. [Google Scholar] [CrossRef]
- Davies, A.; Manning, S.; Söderlund, J. When Neighboring Disciplines Fail to Learn from Each Other: The Case of Innovation and Project Management Research. Res. Policy 2018, 47, 965–979. [Google Scholar] [CrossRef]
- Davies, A.; Hobday, M. The Business of Projects: Managing Innovation in Complex Products and Systems; Cambridge University Press: Cambridge, UK, 2005. [Google Scholar]
- Foxon, T. The Rationale for Policy Interventions from an Innovation Systems Perspective. In Governing Technology for Sustainability; Earthscan: London, UK, 2007; pp. 129–147. ISBN 9781844073450. [Google Scholar]
- Walrave, B.; Raven, R. Modelling the Dynamics of Technological Innovation Systems. Res. Policy 2016, 45, 1833–1844. [Google Scholar] [CrossRef]
- Markard, J.; Raven, R.; Truffer, B. Sustainability Transitions: An Emerging Field of Research and Its Prospects. Res. Policy 2012, 41, 955–967. [Google Scholar] [CrossRef]
- Ahola, T.; Ruuska, I.; Artto, K.; Kujala, J. What Is Project Governance and What Are Its Origins? Int. J. Proj. Manag. 2014, 32, 1321–1332. [Google Scholar] [CrossRef]
- Lawrence, T.B.; Dover, G.; Gallagher, B. Managing Social Innovation. In The Oxford Handbook of Innovation Management; Oxford University Press: Oxford, UK, 2014; pp. 625–647. ISBN 9780191003875. [Google Scholar]
- Chataway, J.; Hanlin, R.; Kaplinsky, R. Inclusive Innovation: An Architecture for Policy Development. Innov. Dev. 2014, 4, 33–54. [Google Scholar] [CrossRef]
- Foster, C.; Heeks, R. Conceptualising Inclusive Innovation: Modifying Systems of Innovation Frameworks to Understand Diffusion of New Technology to Low-Income Consumers. Eur. J. Dev. Res. 2013, 25, 333–355. [Google Scholar] [CrossRef]
- Knapp, M.; Killen, C.P.; Stevens, C.; Sankaran, S. Governance of Innovation for Project Governance That Supports Innovation. PMI White Paper. 2019. Available online: https://www.pmi.org/learning/library/governance-innovation-projects-programs-portfolios-11796 (accessed on 2 February 2025).
- Sandra Schillo, R.; Robinson, R.M. Inclusive Innovation in Developed Countries: The Who, What, Why, and How. Technol. Innov. Manag. Rev. 2017, 7, 34–46. [Google Scholar] [CrossRef]
- Pinto, J.K.; Winch, G. The Unsettling of “Settled Science:” The Past and Future of the Management of Projects. Int. J. Proj. Manag. 2016, 34, 237–245. [Google Scholar] [CrossRef]
- Silvius, A.J.G.; Schipper, R.P.J. Exploring the Relationship between Sustainability and Project Success-Conceptual Model and Expected Relationships. Int. J. Inf. Syst. Proj. Manag. 2016, 4, 5–22. [Google Scholar] [CrossRef]
- Martens, M.L.; Carvalho, M.M. Sustainability and Success Variables in the Project Management Context: An Expert Panel. Proj. Manag. J. 2016, 47, 24–43. [Google Scholar] [CrossRef]
- Huemann, M.; Silvius, A.J.G. Projects to Create the Future: Managing Projects Meets Sustainable Development. Int. J. Proj. Manag. 2017, 35, 1066–1070. [Google Scholar] [CrossRef]
- Martens, M.L.; Carvalho, M.M. Key Factors of Sustainability in Project Management Context: A Survey Exploring the Project Managers’ Perspective. Int. J. Proj. Manag. 2017, 35, 1084–1102. [Google Scholar] [CrossRef]
- Taylor, T. Sustainability Interventions—for Managers of Projects and Programmes; Dashdot Publications: London, UK, 2011; ISBN 978-0955413285. [Google Scholar]
- Martens, M.L.; Carvalho, M.M. A Conceptual Framework of Sustainability in Project Management; Project Management Institute: Phoenix, AZ, USA, 2014; pp. 1–10. [Google Scholar]

Disclaimer/Publisher’s Note: The statements, opinions and data contained in all publications are solely those of the individual author(s) and contributor(s) and not of MDPI and/or the editor(s). MDPI and/or the editor(s) disclaim responsibility for any injury to people or property resulting from any ideas, methods, instructions or products referred to in the content. |
© 2025 by the authors. Licensee MDPI, Basel, Switzerland. This article is an open access article distributed under the terms and conditions of the Creative Commons Attribution (CC BY) license (https://creativecommons.org/licenses/by/4.0/).