Article

Pyrolysis Characteristics of Empty Fruit Bunches at Different Temperatures and Heating Rates

Department of Environmental Engineering, Kongju National University, Cheonan 31080, Chungcheongnam-do, Republic of Korea
*
Author to whom correspondence should be addressed.
Energies 2025, 18(6), 1404; https://doi.org/10.3390/en18061404
Submission received: 17 February 2025 / Revised: 10 March 2025 / Accepted: 11 March 2025 / Published: 12 March 2025
(This article belongs to the Section J: Thermal Management)

Abstract

:
EFB is a biomass waste primarily generated in Southeast Asia, and its pyrolysis enables both waste management and conversion into valuable products. In pyrolysis, the heating rate is a crucial factor; however, studies on its influence on EFB are extremely limited. This study investigates the pyrolysis characteristics of EFB by analyzing product properties based on reaction temperature and heating rate. TGA showed that the thermal decomposition of EFB begins at approximately 210 °C and is largely complete by 400 °C. Furthermore, kinetic analysis using TGA data, applying both differential and integral methods, revealed distinct trends. Through pyrolysis experiments using a fixed-bed reactor, the yield analysis of products under varying reaction temperatures and heating rates demonstrated that higher temperatures promote pyrolysis, leading to a decrease in biochar yield and an increase in gas product yield. For liquid products, a higher heating rate suppressed secondary reactions and led to an increase in the yield of the aqueous phase. Gas product characterization revealed that CO and CO2 formation began simultaneously at approximately 270 °C. GC-MS analysis of the liquid products recovered under different pyrolysis conditions showed that most compounds contained oxygen, originating from hemicellulose, cellulose, and lignin. Additionally, FT-IR analysis of the biochar confirmed that oxygen-containing functional groups decomposed as pyrolysis progressed, and the presence of turbostratic carbon and crystallinity influenced by trace inorganic elements was identified.

1. Introduction

Industrialization accelerated human production activities, increasing the use of fossil fuels. The use of fossil fuels is regarded as a major contributor to global warming; in fact, the average global temperature from 2011 to 2020 increased by 1.1 °C compared to 1850–1900 [1]. Transitioning from non-renewable energy sources to eco-friendly and sustainable alternatives helps address global warming and energy supply issues [2]. Among these alternatives, biomass can be utilized for power generation, transportation, and chemical product development, providing renewable energy while reducing greenhouse gas emissions [3,4].
As of 2021, the palm oil sector utilizes over 23.98 million hectares of land for plantations globally. With 85% of global palm oil consumption attributed to Indonesia and Malaysia, these countries produce the largest share of palm oil biomass [5,6,7]. The increasing production of palm oil results in greater waste generation, which can lead to environmental issues [8,9]. One of the byproducts of palm oil manufacturing is empty fruit bunch (EFB), which accounts for approximately 23% of total production waste [10,11]. Currently, most EFB is incinerated. Similar to other agricultural residues, EFB primarily consists of hemicellulose, cellulose, and lignin [12]. Therefore, converting these byproducts into energy or value-added products can help mitigate environmental problems while providing additional benefits [13,14].
Pyrolysis, liquefaction, torrefaction, gasification, and combustion are techniques used to convert biomass into energy and chemical compounds [15]. Among these, pyrolysis is considered one of the most effective thermochemical conversion processes, as it can transform biomass into liquid bio-oil [9,16]. Research on pyrolysis for various types of biomass is actively ongoing. Zhang et al. pyrolyzed bamboo residues collected from mountainous areas in China, conducting kinetic analysis and examining pyrolysis mechanisms [17]. Varma et al. investigated optimal yield conditions by pyrolyzing wood sawdust under varying temperatures, heating rates, and gas flow rates [18]. Additionally, Biswas et al. [19] pyrolyzed rice straw and analyzed the resultant bio-oil. The pyrolyzed oil contains functional groups such as carbonyl, carboxyl, and phenol groups, along with energy-rich compounds, making it a valuable resource for synthesizing useful chemicals [20].
In addition, research results on the pyrolysis characteristics of EFB have been published [21,22,23]. However, most studies focus on the effect of reaction temperature, and there has been little research on the effect of heating rate. Therefore, in this study, we investigated both the effects of reaction temperature and the pyrolysis characteristics of EFB in relation to the heating rate. Additionally, we examined the yield variation in each product under various pyrolysis conditions and analyzed their characteristics. Various factors, such as temperature, heating rate, particle size, residence time, and biomass type, influence pyrolysis reactions [24,25]. We investigated the properties of CO, CO2, and total hydrocarbon (THC) gas products generated during the pyrolysis process, and kinetic analysis was performed by using thermogravimetric analysis (TGA). Additionally, the yield properties of each product were analyzed at reaction temperatures of 400–600 °C and heating rates of 5 °C/min, 10 °C/min, and 20 °C/min using a fixed-bed reactor. Gas chromatography–mass spectrometry (GC-MS) was employed to analyze the liquid products, while elemental analysis, Fourier transform infrared (FTIR) spectroscopy, and X-ray diffraction (XRD) were used to examine the biochars.

2. Materials and Methods

2.1. Materials

EFB was dried in an oven at 105 °C for 24 h before use. Table 1 presents the results of the elemental and proximate analyses of the EFB used in this study. The elemental analysis revealed that the carbon, hydrogen, and oxygen contents were 46.58%, 5.94%, and 43.55%, respectively. Additionally, the proximate analysis showed that the volatile matter, fixed carbon, and ash content were 71.91%, 26.45%, and 1.65%, respectively.

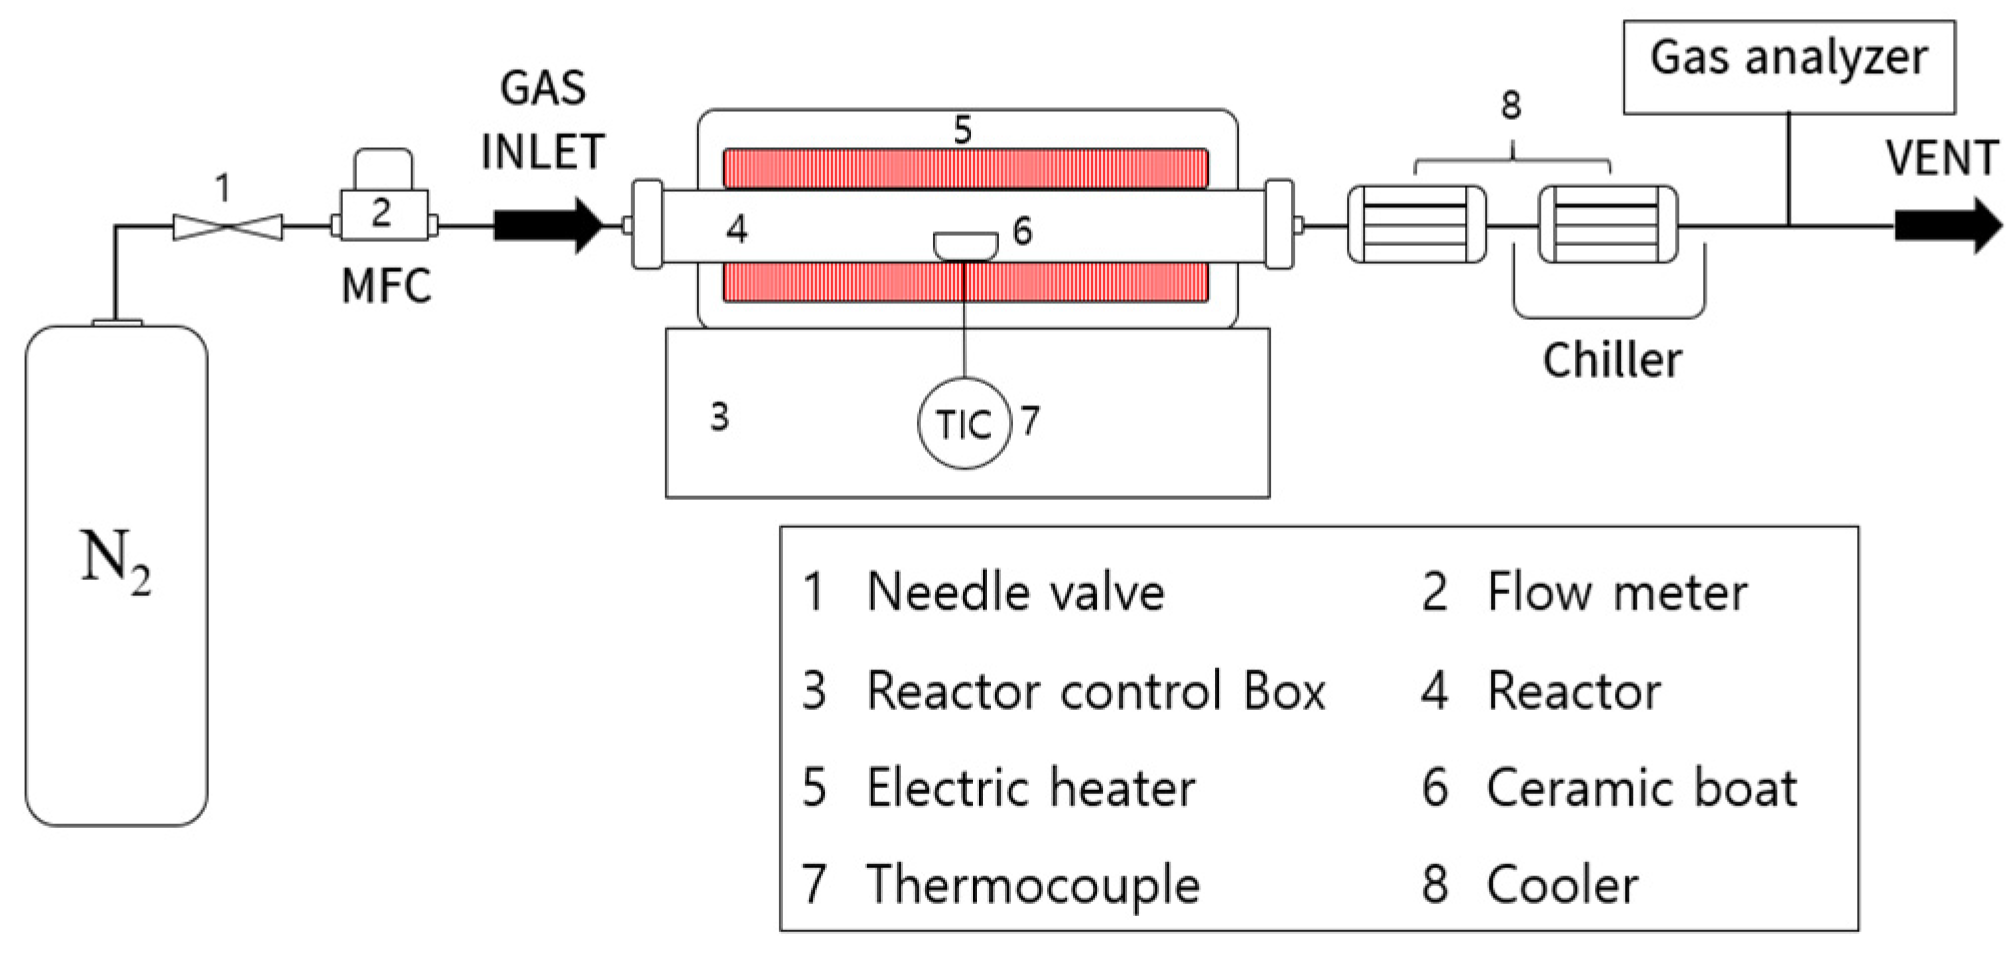
2.2. Experimental Methods

The experiment utilized a furnace with a 450 mm long heating zone, controlled by a PID controller for precise temperature regulation. The fixed-bed reactor, made of quartz tube, had an inner diameter of 60 mm and a length of 550 mm. During each pyrolysis experiment, N2 (99.99%) was supplied at a flow rate of 4 L/min, while 15 g of EFB was placed in a ceramic boat and positioned at the center of the reactor. To analyze pyrolysis trends based on reaction temperature and heating rate, the reaction temperatures were set to 400 °C, 450 °C, 500 °C, 550 °C, and 600 °C, with heating rates of 5 °C/min, 10 °C/min, and 20 °C/min. Each experiment was conducted three times. After reaching the target temperature at the specified heating rate, the temperature was maintained for 30 min. The produced pyrolysis gas was condensed and recovered at room temperature and −15 °C using a condenser located at the rear end of the reactor. The resulting products were classified and analyzed as non-condensed gas, a high-viscosity liquid product (HVLP) and low-viscosity liquid product (LVLP), and biochars remaining in the ceramic boat. Figure 1 shows the schematic diagram of experimental apparatus in this study.

2.2.1. Thermogravimetric Analysis

For the kinetic analysis of the pyrolysis reaction of EFB samples, 5 mg samples were placed in an Al2O3 crucible, and they were heated in a nitrogen atmosphere using a TGA instrument (TG-209-F1-Libra, NETZSCH, Selb, Germany) at heating rates of 5, 10, 20, 30, and 40 °C/min from 30 °C to 800 °C.

2.2.2. Gas Product Analysis

The analysis of the non-condensable gases generated during the pyrolysis process was conducted using a gas analyzer (ECOM-MK 6000+, Ecom GmbH, Iserlohn, Germany). The analyzer was connected to the downstream of the condenser to measure the concentration changes of CO, CO2, and THC. Gas was drawn in at a rate of 2.7 L/min. In the gas analyzer, CO concentration was measured using an electrochemical (EC) sensor, while CO2 and THC concentrations were measured using a non-dispersive infrared (NDIR) sensor. The EC method determines the concentration based on the amount of current generated by the re-dox reaction between gas molecules reaching the surface of the reaction electrode and the electrode itself. And the NDIR method measures the concentration by detecting the difference in infrared intensity.

2.2.3. Gas Chromatography–Mass Spectrometry Analysis of Liquid Products

The recovered liquid products were analyzed using GC-MS (QP2010 Ultra, Dong-il SHI-MADZU, Kyoto, Japan), and the column used was SH-Rxi-1ms. The carrier gas used was helium, and the column was heated at a rate of 10 °C/min. The GC-MS analysis conditions of this study are presented in Table 2.

2.2.4. Fourier Transform Infrared and X-Ray Diffraction of Biochar

FTIR analysis was conducted using the Spectrum 100 (PerkinElmer, Beaconsfield, UK). It was measured at wavenumbers of 4000–500 cm⁻1, using the Attenuated Total Reflectance (ATR) method. XRD was conducted using the MiniFlex600 (Rigaku, Tokyo, Japan). The detector used was D/teX Ultra, and the scan range was from 5 to 80° at a rate of 3°/min with a Cu target tube at 40 kV.

2.3. Kinetic Analysis

The activation energy of EFB was derived from the TGA results, using the differential and integral method [26].
Generally, the rate equation for thermal decomposition reactions can be represented by the following Arrhenius equation.
d α d t = A e E R T 1 α n
  • A: pre-exponential factor (min−1)
  • E: apparent activation energy (kJ/mol)
  • n: apparent order of reactionR: gas constant (8.3136 J/mol·K)
  • T: absolute temperature (K)
  • t: time (min)
The conversion rate α according to pyrolysis in Equation (1) is as follows:
α = m o m i m o
  • α: degree of conversion
  • mo: original mass of the sample
  • mi: instantaneous mass at any time
Taking the natural logarithm of both sides of Equation (1) yields the following equation:
ln ( d α d t ) = ln ( A 1 α n ) E R T
The first term on the right side is constant for a fixed α value. Thus, according to the Friedman method [23], the activation energy E can be calculated from the slope by plotting ln ( d α d t ) and 1 T obtained at each heating rate and deriving the slope.
Additionally, if Equation (1) is rewritten using the linear heating rate β (K/min), it can be expressed as follows:
d α ( 1 α ) n = A β e E R T d T
By performing an integral approximation on the right side along with the integral of the left side of Equation (4), it can be expressed as Equations (5) and (6) [27].
l n 1 1 α 1 n T 2 1 n = l n A R β E 1 2 R T E E R T n 1
ln ln 1 α 1 n T 2 = l n A R β E 1 2 R T E E R T n = 1
Consequently, according to the Coats–Redfern method [26], by assuming each reaction order “n” and determining the slope of the plots of Equations (7) and (8) where linearity is the highest, the activation energy values can be obtained from the slope.
ln 1 1 α 1 n T 2 1 n v s 1 T n 1
ln ln 1 α T 2 v s 1 T n = 1

3. Results and Discussion

3.1. Thermogravimetric Analysis of EFB

To observe the mass change of EFB with temperature, TGA was conducted. Figure 2a shows that decomposition begins at approximately 210–230 °C, with rapid decomposition occurring up to about 310–350 °C, depending on the heating rate. It was also observed that as the heating rate increases, the decomposition temperature rises, likely due to the heat transfer lag caused by the increased heating rate, which can also be confirmed from the DTG curves in Figure 2b. Additionally, the decomposition process is relatively gradual from 210 to 280 °C, followed by a rapid decomposition phase up to 350 °C, with further decomposition continuing up to approximately 700 °C after 350 °C. Ultimately, the residue content at 800 °C was approximately 21–24%, confirming that the sum of the fixed carbon and ash content of the EFB samples shown in Table 1 is nearly equivalent. At a heating rate of 10 °C/min, the thermal decomposition of hemicellulose and cellulose occurs within the ranges of 220–315 °C and 315–400 °C, respectively, while lignin decomposes gradually over a much wider range, extending up to 900 °C [28]. Therefore, in this study, although the decomposition stages of each component are not clearly distinguished, hemicellulose mainly decomposes during the initial gradual decomposition phase, while both hemicellulose and cellulose decompose during the subsequent rapid decomposition phase, and the further gradual decomposition after 350 °C is attributed to the breakdown of lignin. From Figure 2b, it can be confirmed that the second stage of the decomposition process is underway.

3.2. Kinetic Analysis of EFB

The kinetic analysis method applied in this study is used to obtain the apparent activation energy values, which are generally used in engineering applications rather than for analyzing detailed reaction mechanisms linked with product analysis.

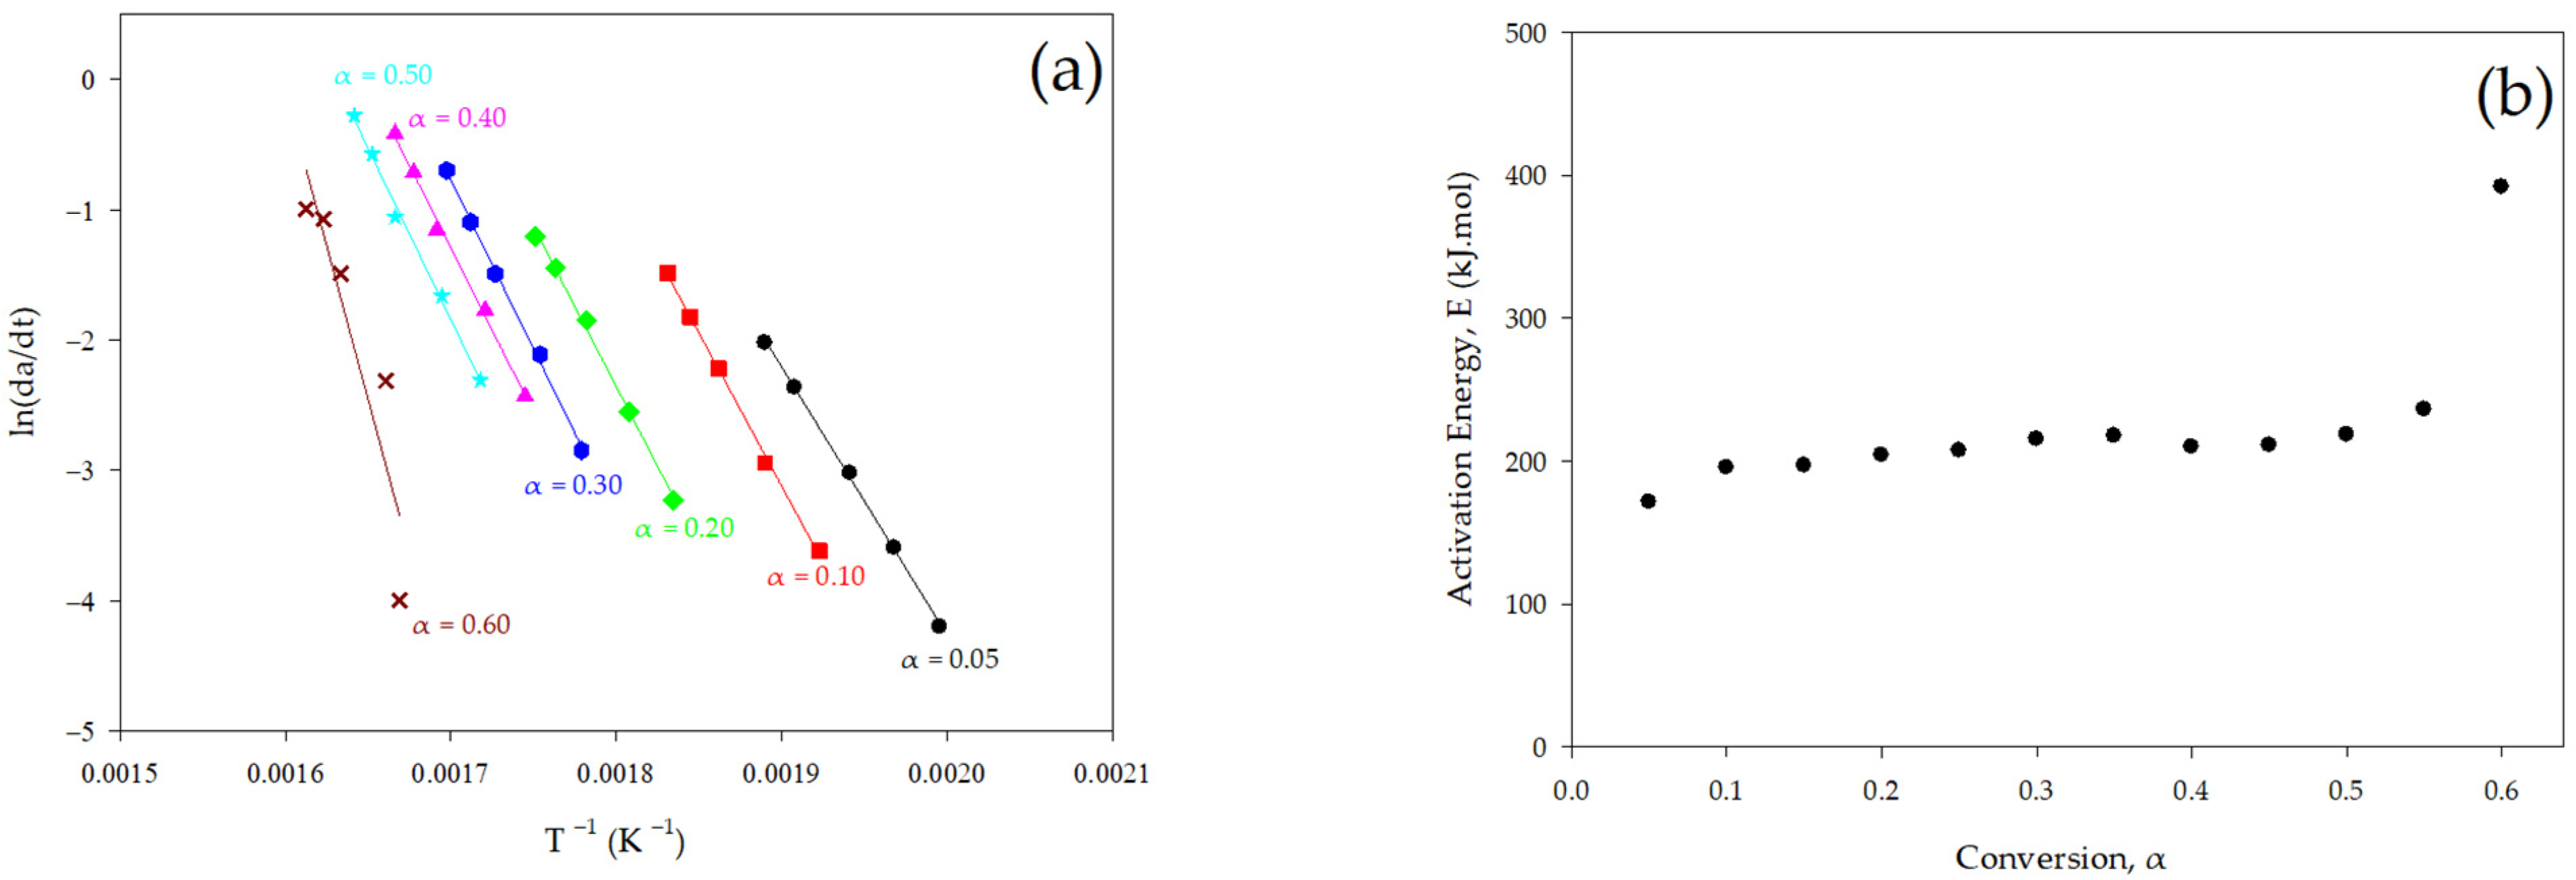
3.2.1. Differential Method

To determine the activation energy using differential methods, the plots of ln ( d α d t ) and 1 T at each conversion rate according to the heating rate, and the activation energy calculated from the slopes of these plots are shown in Figure 3 and Table 3. From Figure 3 and Table 3, it is evident that as the conversion rate increases, the activation energy gradually increases and then sharply rises at a conversion rate of 0.6. Specifically, the activation energy is around 170–235 kJ/mol until a conversion rate of 0.55, which is almost identical to that of the decomposition temperature and activation energy of hemicellulose and cellulose reported in other studies [29,30,31]. The activation energy of the pyrolysis reaction is due to breaking the bonded molecular structure. At low temperatures and conversion rates (~316 °C and conversion 0.30), it is related to the decomposition of hemicellulose. Cellulose is known to have a partially crystalline structure, which provides high thermal stability [32], and this is associated with the decomposition of cellulose in the intermediate range (~350 °C and conversion 0.55). Additionally, the sharp increase in activation energy at a conversion rate of 0.6 is attributed to lignin. According to earlier studies, the activation energy for lignin decomposition was reported to be 200–300 kJ/mol [29,30]. It was impossible to calculate the activation energy at conversion rates above 0.60. This is considered to be due to the significant errors arising from the difficulties in thermodynamic analysis caused by various chemical and transport reactions under the presence of by-products (tar, carbon residues, ash, etc.) in the case of decomposition reactions in that region [29].

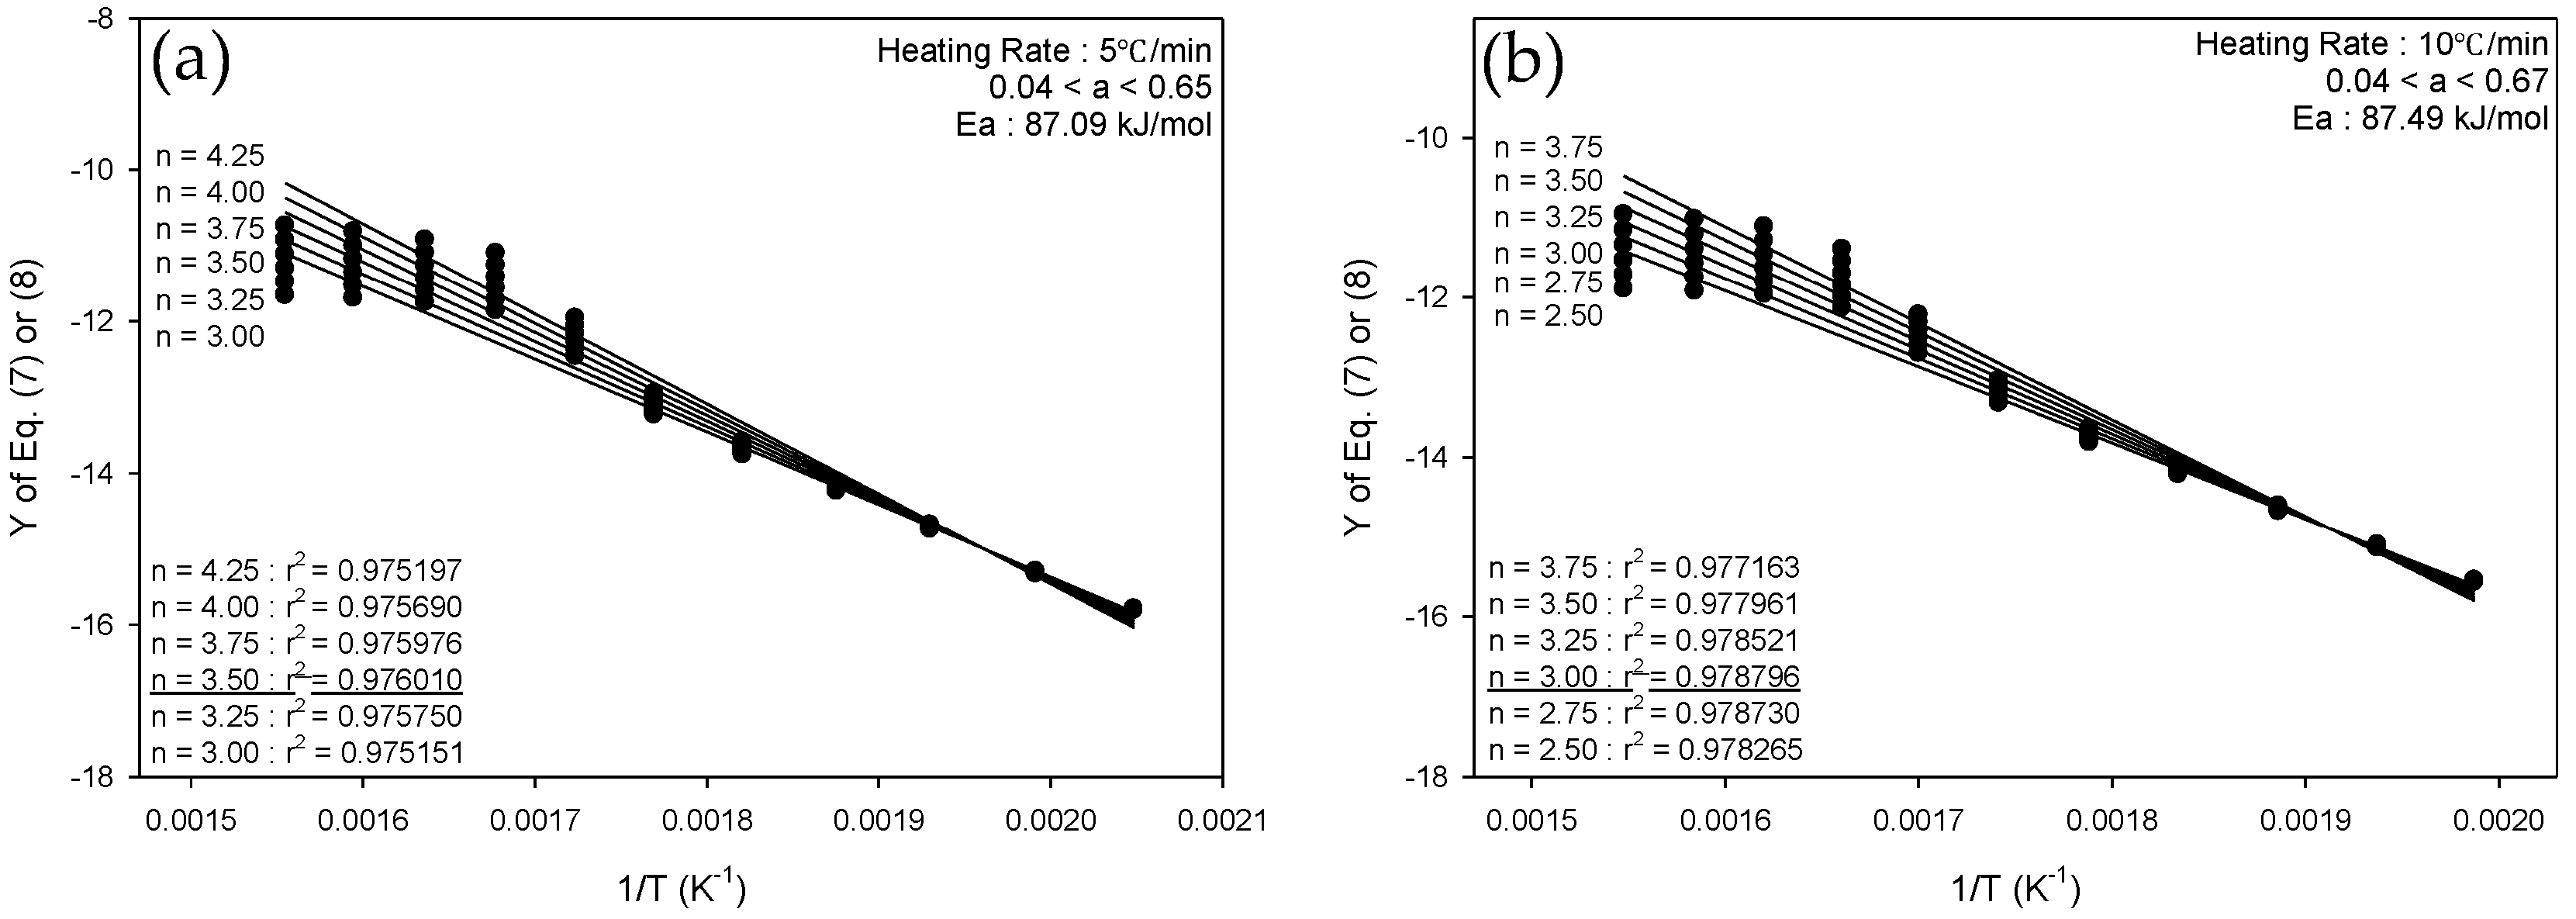
3.2.2. Integral Method

Representative graphs for obtaining activation energy from the integral method are presented for heating rates of 5 °C/min and 10 °C/min in Figure 4. The activation energies for the remaining heating rates of 20 °C/min, 30 °C/min, and 40 °C/min were also calculated using the same method, and the results are summarized in Table 4, which shows that the activation energies for heating rates of 5, 10, and 20 °C/min were all approximately 87 kJ/mol, showing very similar values. However, at heating rates of 30 °C/min or higher, the activation energies of over 100 kJ/mol were observed. In the case of the differential method discussed earlier, it was impossible to examine the trend of activation energy with changes in heating rate due to the use of multiple heating rates. Although in the case of the integral method applied in this study, it was observed that as the heating rate increased, the activation energy also tended to increase. Generally in pyrolysis, the heating rate is related to heat transfer within the biomass, and it is known that the pyrolysis reaction is further promoted accordingly [33]. Therefore, the change in activation energy with respect to the heating rate is deemed valid. However, in the case of the integral method, unlike that in the differential method, the trend of activation energy with respect to conversion rate cannot be examined. Therefore, it is considered efficient to utilize both differential and integral methods to analyze the activation energy of pyrolysis reactions.

3.3. Product Analysis

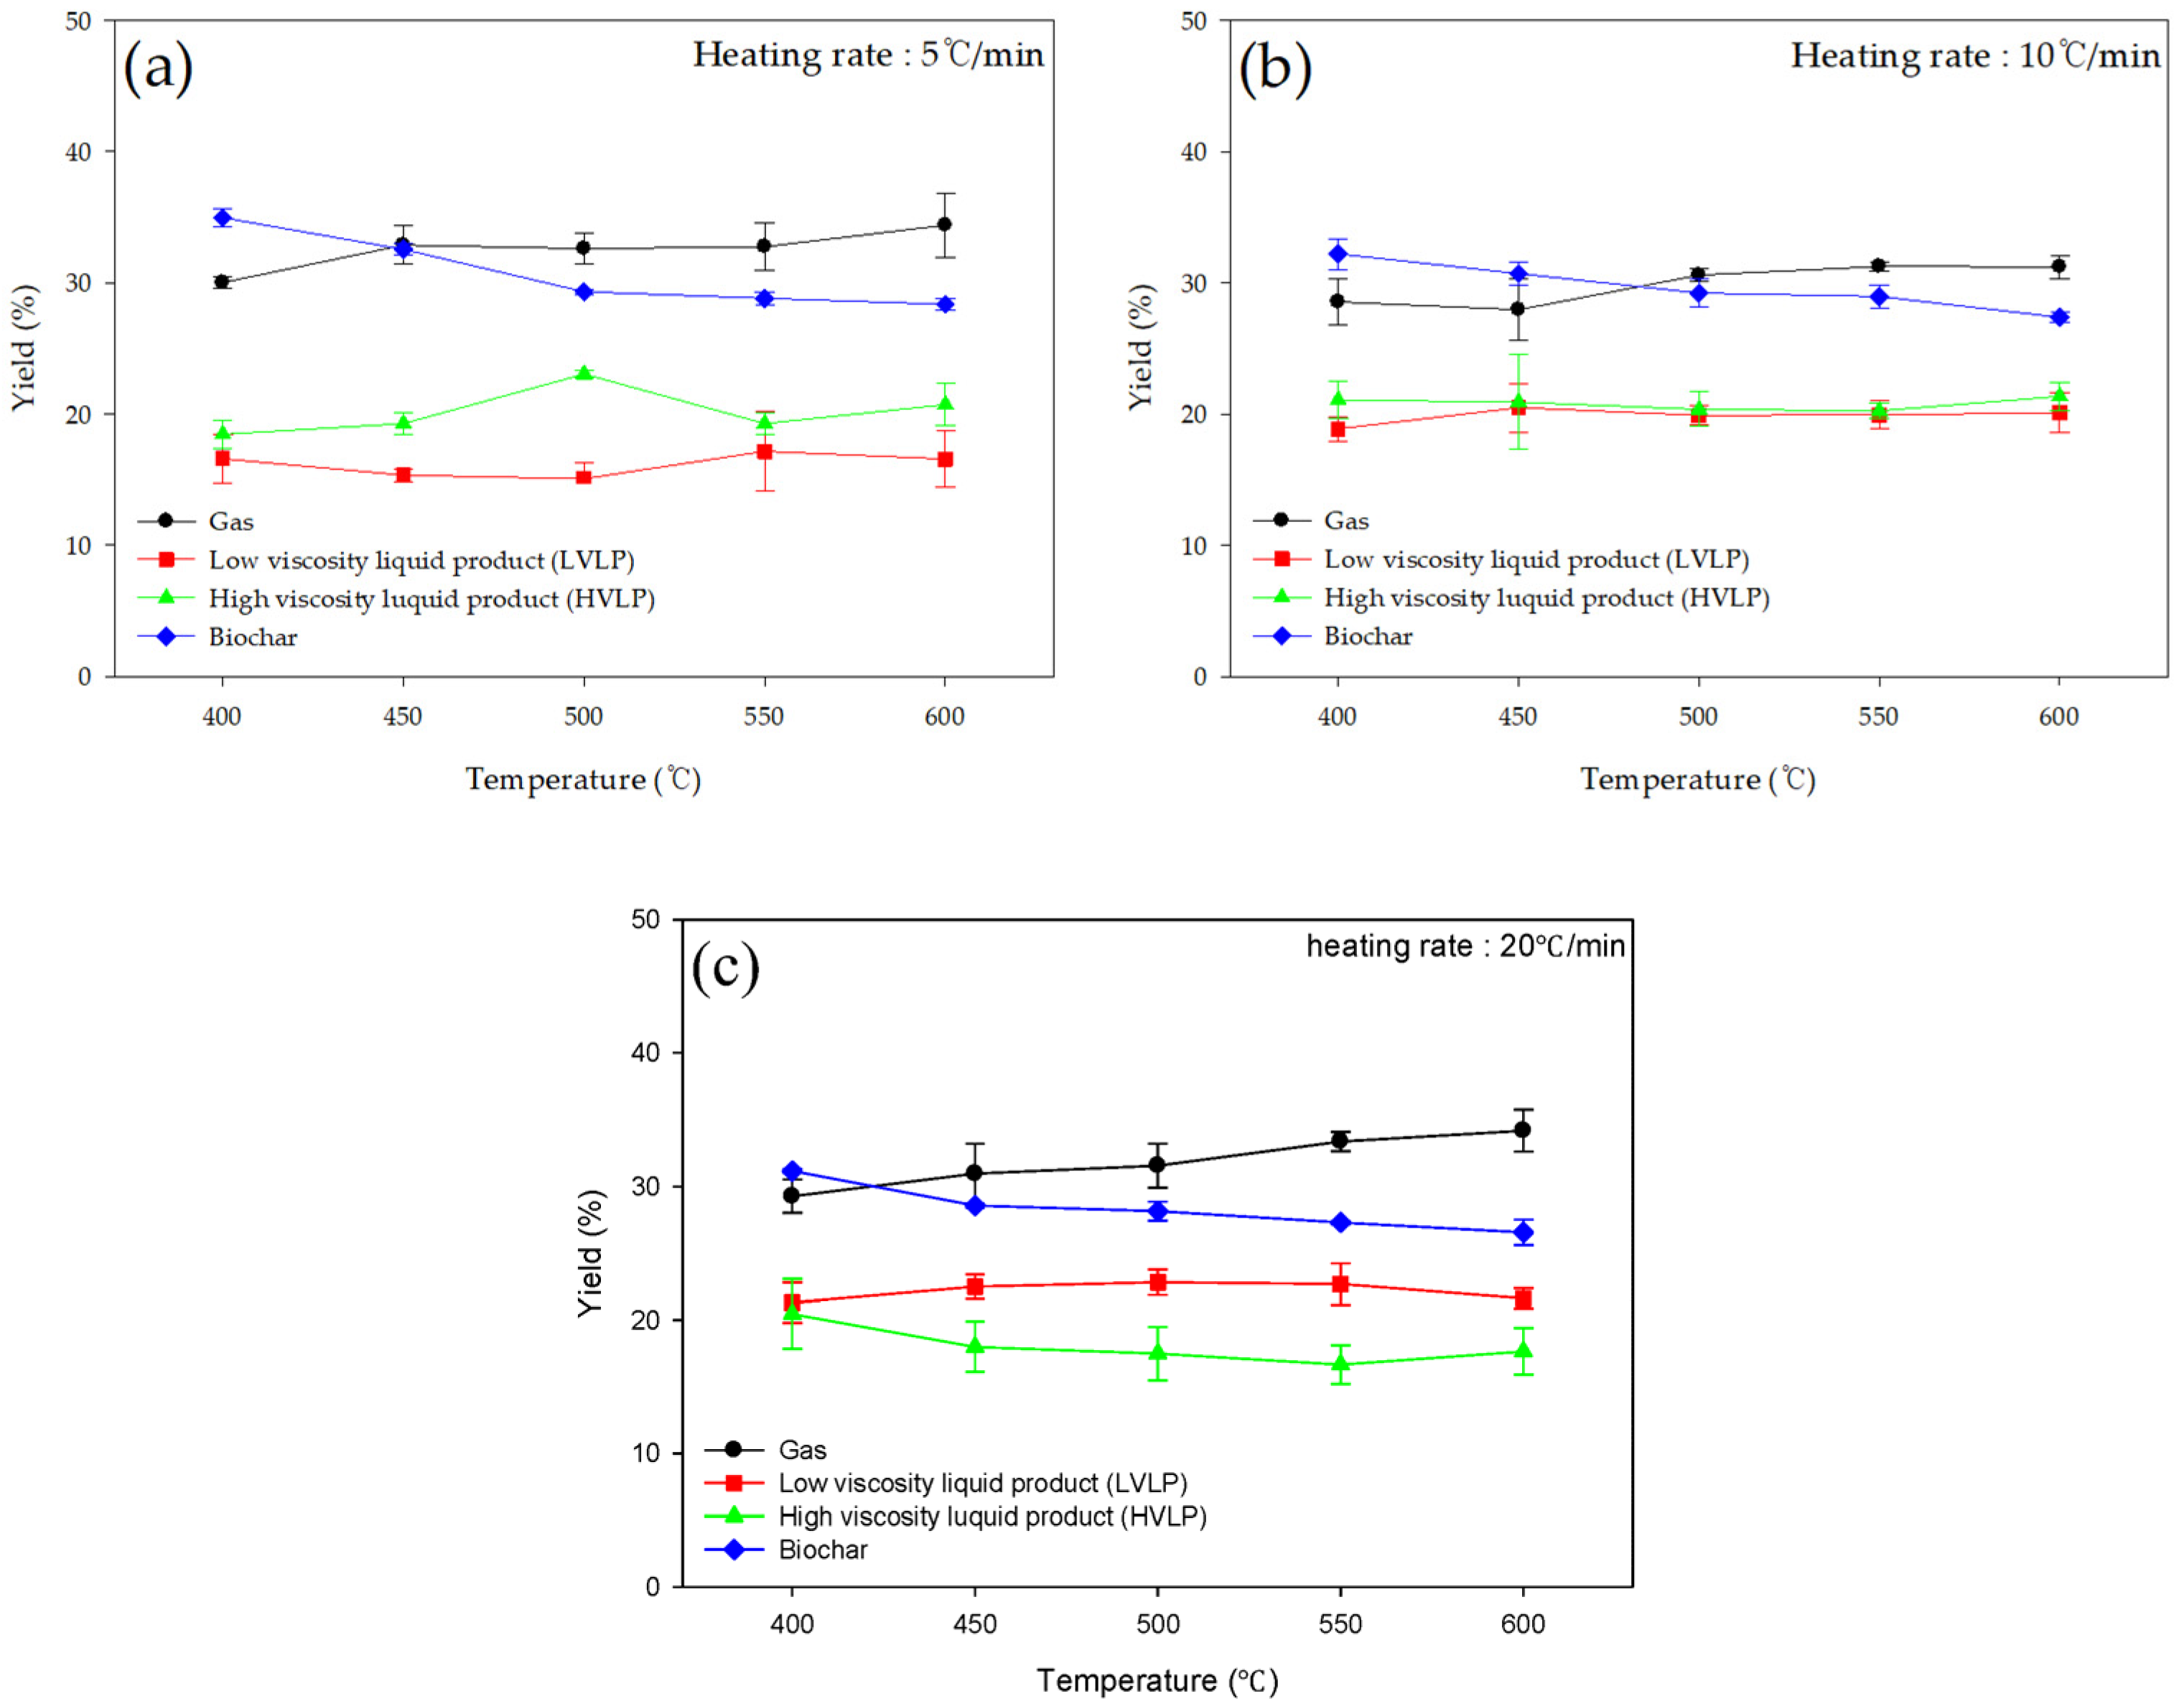
3.3.1. Product Yield

Figure 5 and Table 5 shows the yield changes of gas, low viscosity liquid product (LVLP), high viscosity liquid product (HVLP), and biochar according to reaction temperature and heating rate. At all heating rates, the pyrolysis reaction was promoted with increasing temperature, resulting in a decrease in the yield of biochar and an increase in the yield of gas products. The reaction temperature is the most important factor in pyrolysis; at low temperatures, pyrolysis does not occur sufficiently, resulting in a higher yield of biochar. At high temperatures, it is known that the gas components increase due to the secondary decomposition reactions of the thermally decomposed components [34]. The yield of HVLP did not show significant differences with changes in temperature. However, at a heating rate of 5 °C/min and a reaction temperature of 500 °C, the highest yield of approximately 23.04% was recovered. LVLP also showed little difference in yield with temperature across all heating rates, which is due to the active pyrolysis starting from 400 °C. The yield change of gas components according to the heating rate was almost negligible. However, the yield changes of HVLP and LVLP were clearly observed. Specifically, while the yield of HVLP decreased as the heating rate increased, the yield of LVLP increased, and at a heating rate of 20 °C/min, the yield of LVLP was higher than that of HVLP. A high heating rate is known to promote heat transfer, thereby further inducing decomposition [33]. Akhtar and Saidina also suggested that a high heating rate reduces the heat and mass transfer limitations and minimizes the time available for secondary reactions such as tar cracking and repolymerization [35]. Therefore, the high yield of LVLP at high heating rates can be interpreted as a result of the minimization of LVLP repolymerization, which leads to a decrease in the formation of HVLP.
Generally, the liquid phase generated from biomass pyrolysis contains moisture, so the moisture content in the liquid products is considered a very important issue. Therefore, further research on the characteristics of moisture in the liquid phase, especially in LVLP, generated during pyrolysis is needed in the future.

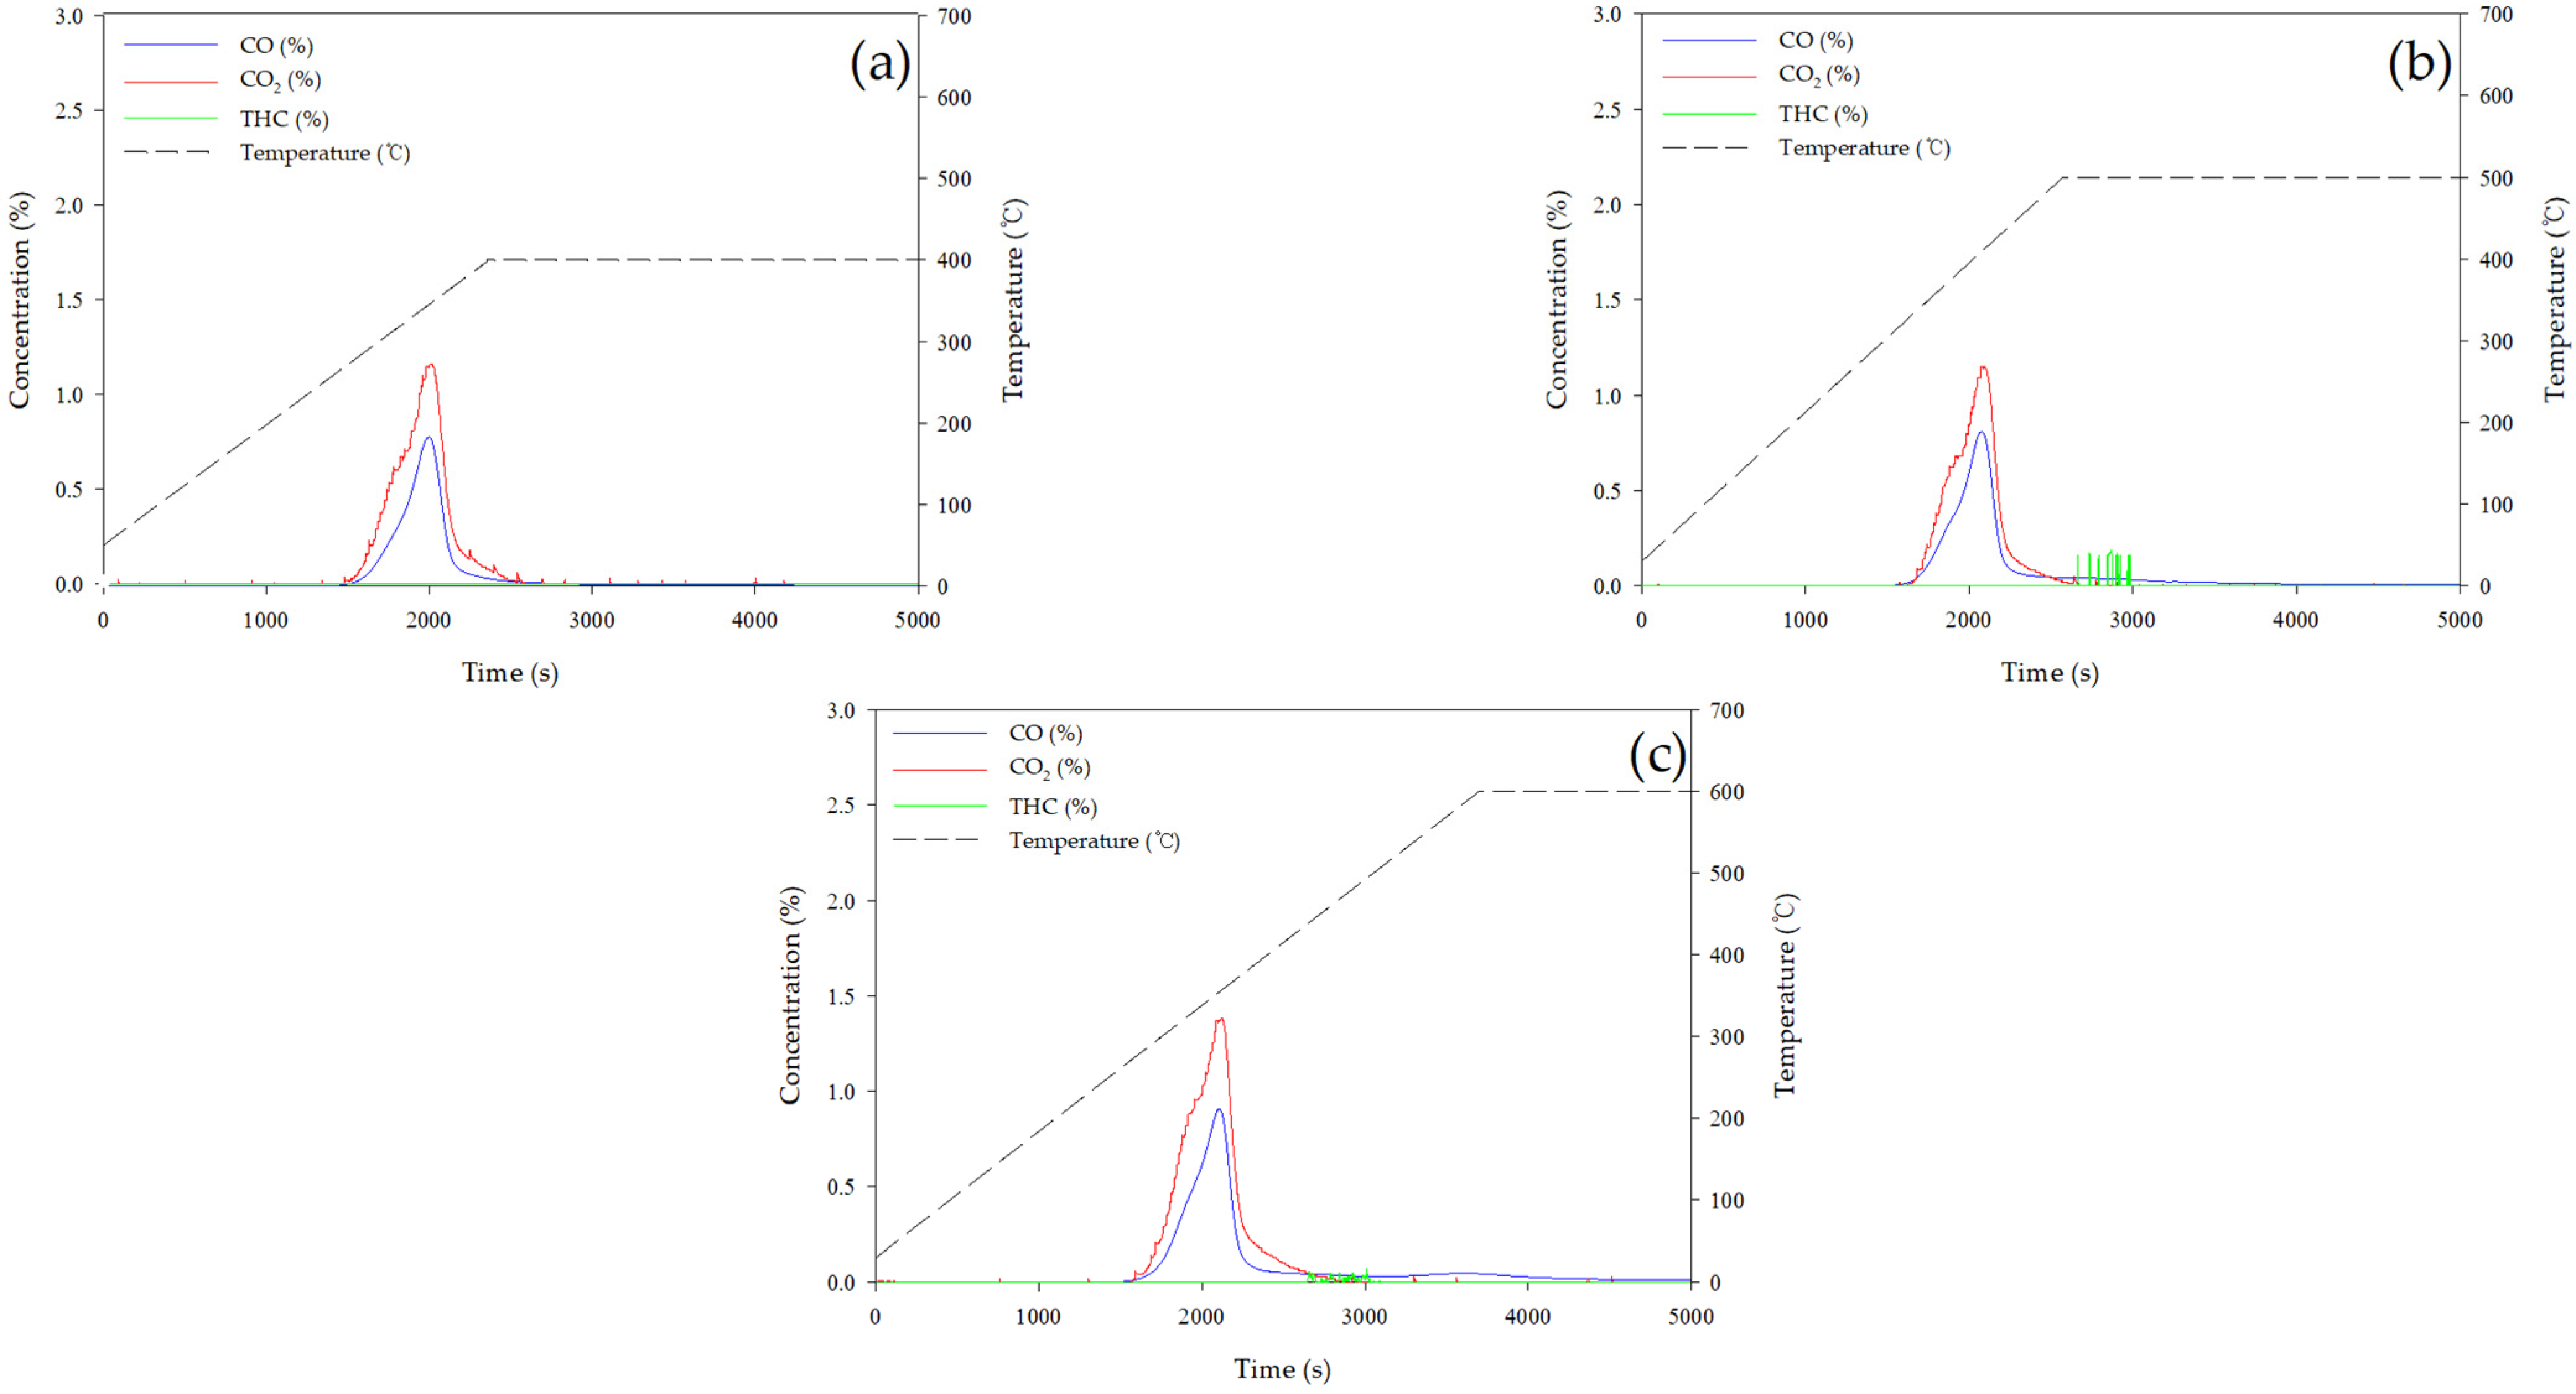
3.3.2. Gas Product Analysis of EFB

Figure 6 and Figure 7 show the concentration changes of CO, CO2, and THC with increasing temperature and heating rate. From these graphs, it can be observed that most gaseous products are generated during the heating process.
Figure 6 shows the changes in gas concentration at a heating rate of 10 °C/min. The generation of CO and CO2 began simultaneously at approximately 270 °C in all cases, which is considered to be due to the decomposition of hemicellulose and cellulose, respectively [36]. However, in Figure 6, the CO and CO2 concentrations at 600 °C showed a slightly higher peak compared to 400 °C and 500 °C, which is considered to be due to experimental errors such as the injected sample amount and nitrogen flow rate. In the case of THC, it was found to occur after 500 °C
According to the literature, CO is produced by the decomposition of carbonyl and carboxyl groups, primarily from the decomposition of hemicellulose. Additionally, CO2 is generated by the decomposition and reformation of the carboxyl group, while methane is primarily reported to result from the decomposition of the methoxy group [37].
The changes in the emission properties of gas components according to the heating rate are illustrated in Figure 7, which shows that when the heating rate is 5 °C/min, CO and CO2 start to be generated at a lower temperature of 250 °C compared to those of other heating rates. This is due to the fact that the difference between the actual particle temperature and the set temperature increases as the heating rate increases. Additionally, when the heating rate is low, the occurrence curves of CO and CO2 show more distinct peaks due to the pyrolysis reactions depending on the types of biomass components. Contrarily, in the case of a high heating rate of 20 °C/min, the rapid temperature increase caused the formation of CO and CO2 to appear as a single curve. Furthermore, when the heating rate is 5 °C/min, THC components are not produced, although they start to appear slightly from a heating rate of 10 °C/min, and THC components are clearly produced at a heating rate of 20 °C/min. CH4 was reported to be generated by the cracking of aliphatic structures and it is known that radical formation plays an important role in this process. Therefore, as the heating rate increases, radical formation is promoted, and consequently, the generation of THC increases [38].

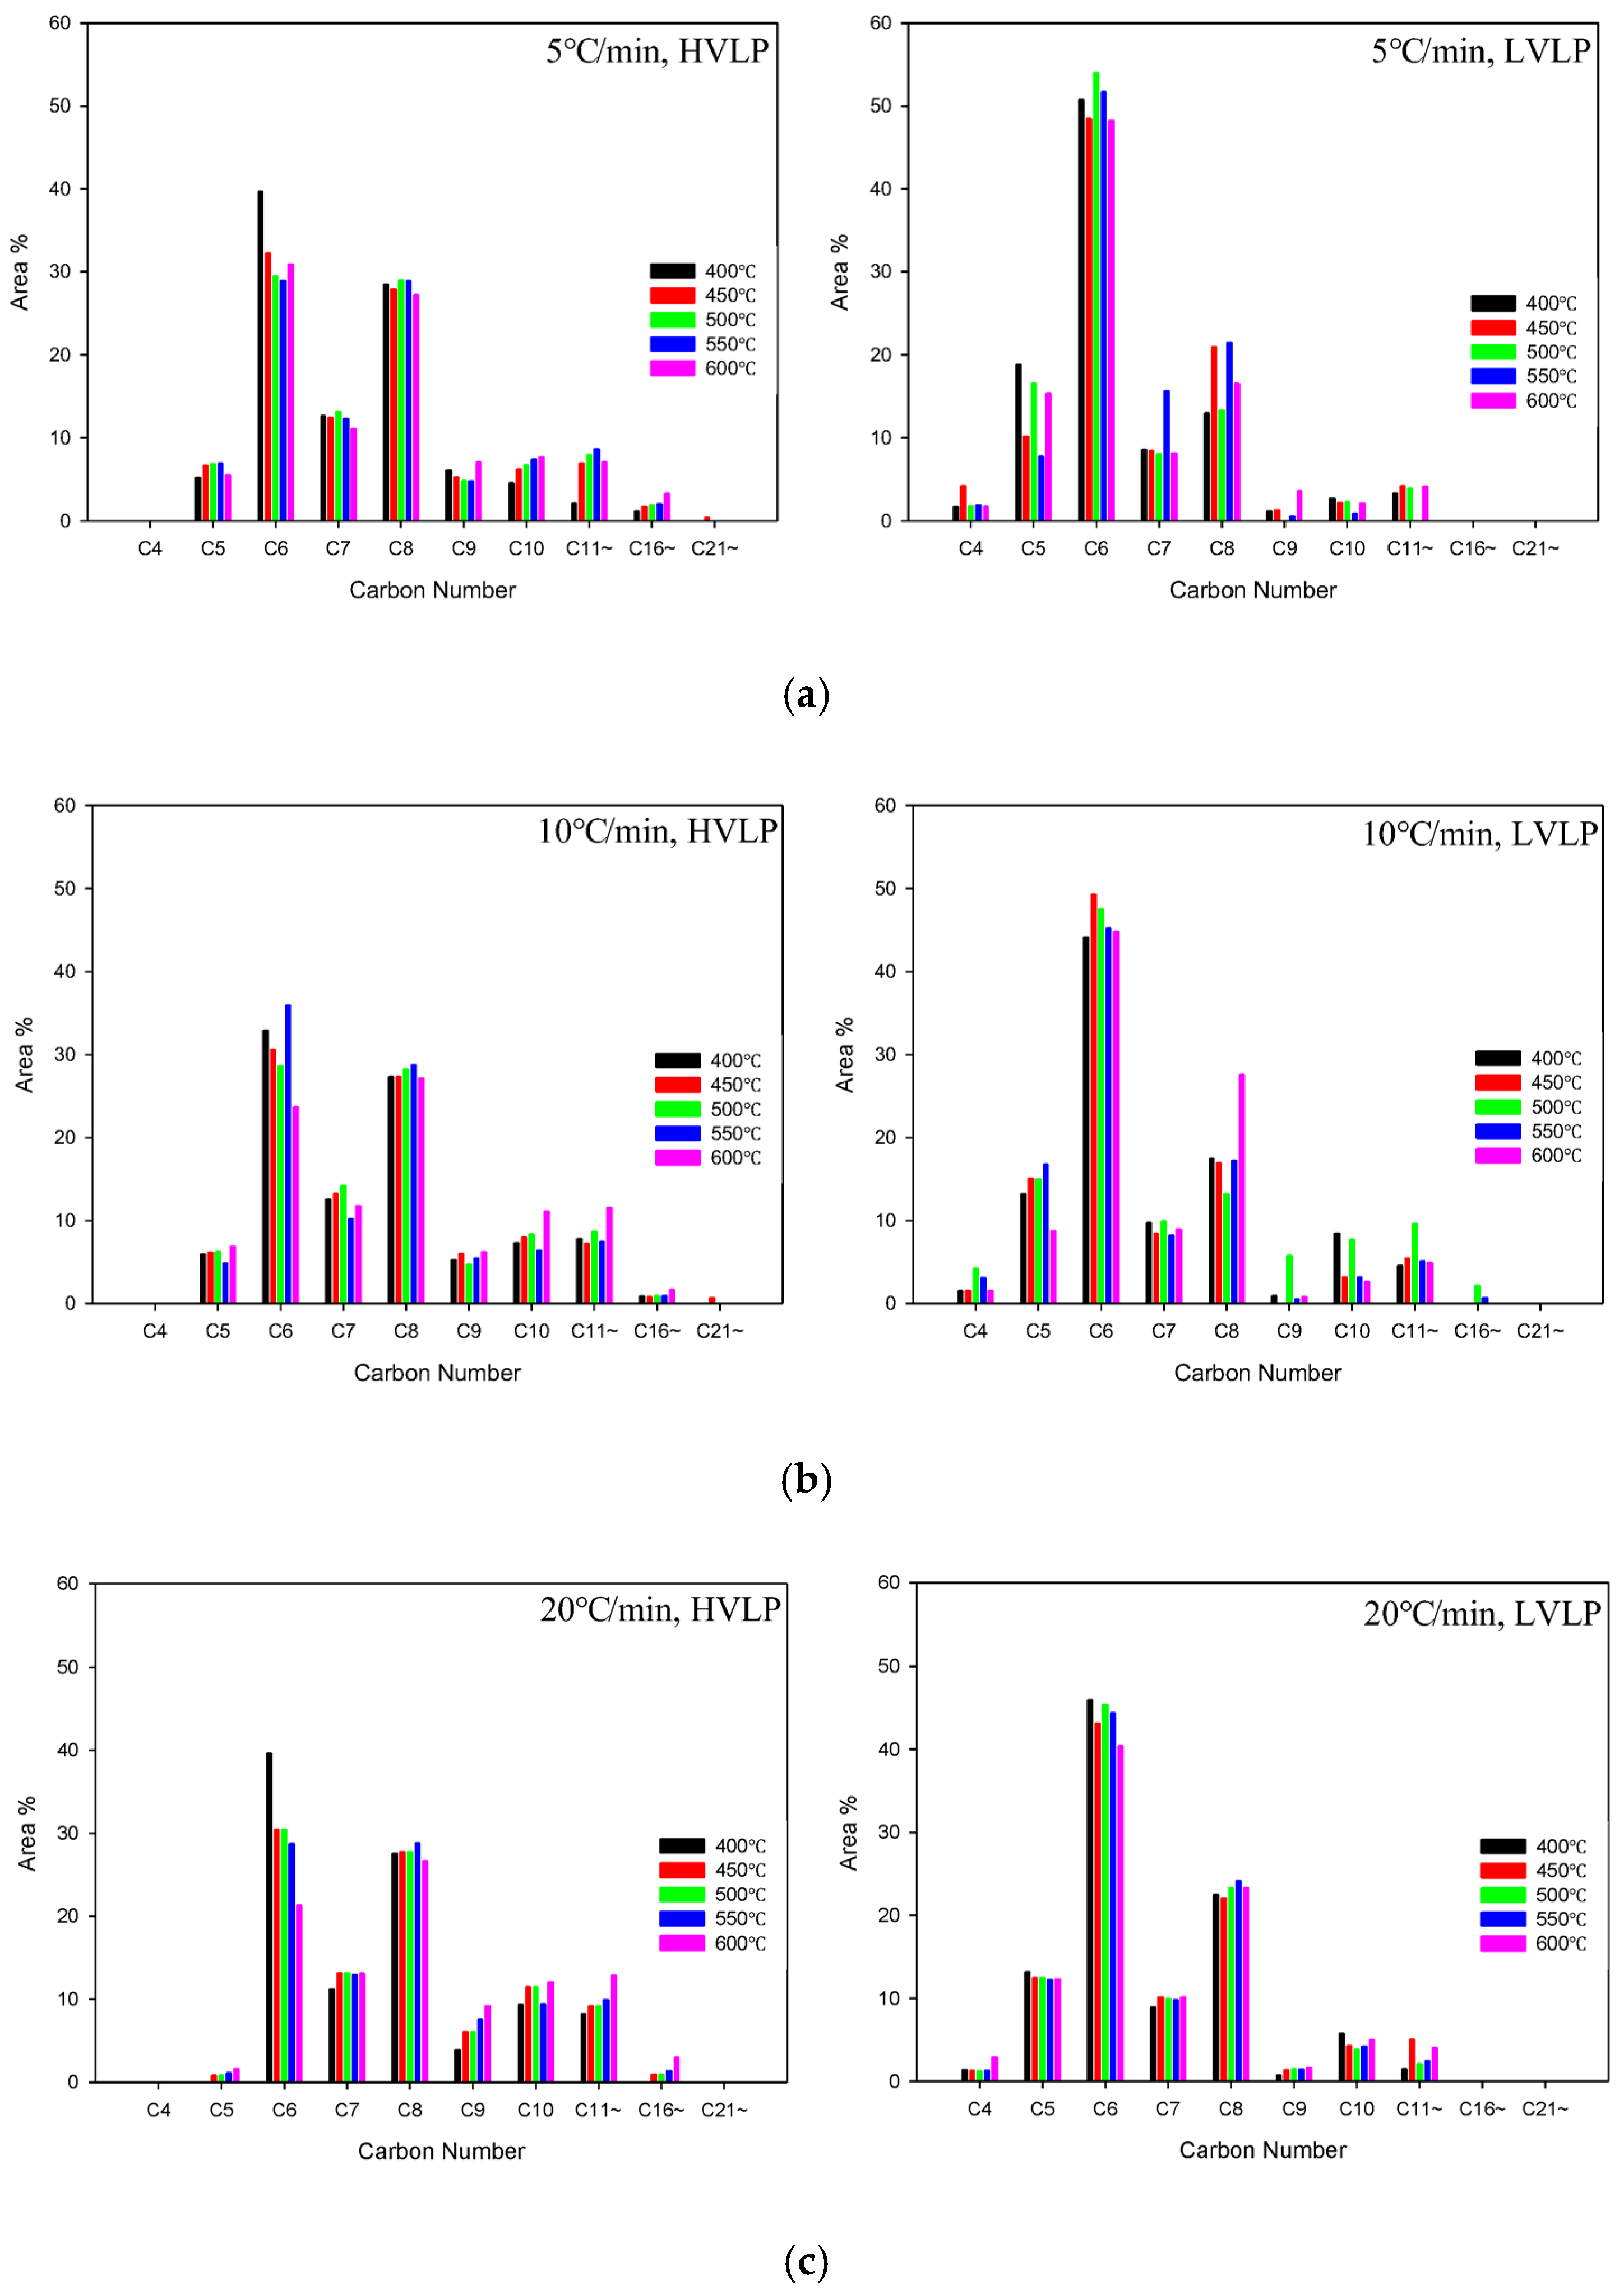
3.3.3. Liquid Product Analysis

Figure 8 shows the result of organizing each component of the liquid products according to the number of carbon molecules based on the GC-MS analysis results. The GC-MS analysis confirmed that the bio-crude oil produced from the pyrolysis of EFB contains approximately 30 to 50 compounds. Both HVLP and LVLP were found to predominantly contain compounds with carbon numbers within the range of C5–C20, with particularly high levels of C6 and C8 compounds. Representative compounds in HVLP included phenol, anhydro-sugar, catechol, (4-hydroxyphenyl)phosphonic acid, 2,6-dimethoxy-phenol and Methyl 4-hydroxybenzoate, while LVLP contained the highest amount of phenol and also had significant amounts of 2,6-dimethoxy-phenol, tetrahydro-2-furanmethanol and 2-furancarboxaldehyde.
Most of the compounds contained oxygen, which is believed to have originated from the oxygen components that constitute hemicellulose, cellulose, and lignin [39]. Phenol,2,6-dimethoxy is known as a representative product of lignin pyrolysis. Furthermore, in the case of HVLP, more compounds with higher carbon numbers were present to some extent compared with those of LVLP. Table 6 and Table 7 show HVLP and LVLP, respectively, categorized into saturated and non-saturated components, as well as aliphatic and aromatic components. The liquid products generated from the pyrolysis reaction contained a significant amount of non-saturated and aromatic components due to dehydration, cyclization, Diels–Alder cycloaddition reactions, and ring rearrangement reactions [40]. In the case of HVLP oil, the proportion of aromatic components was found to be higher than that of LVLP, and this high proportion of aromatic components is considered to be due to the polymerization of non-saturated components in the gas phase [41].
The classification and interpretation of bio-oil based on carbon number have been rarely discussed; however, a few studies exist on this topic [42,43]. As a fuel oil, light fraction compounds are preferred due to their high energy density and excellent combustion properties [42]. However, as mentioned earlier, most compounds in bio-oil contain oxygen, which reduces energy density. Additionally, bio-oil contains a significant amount of unsaturated compounds, which increase oil instability and can lead to viscosity growth during storage [44]. Therefore, further research on post-treatment methods to minimize unsaturated compounds in the liquid products of EFB pyrolysis is necessary. The aromatic compounds in the oil mainly consist of phenolic compounds, which can be utilized for the environmentally friendly production of phenolic chemicals [45].

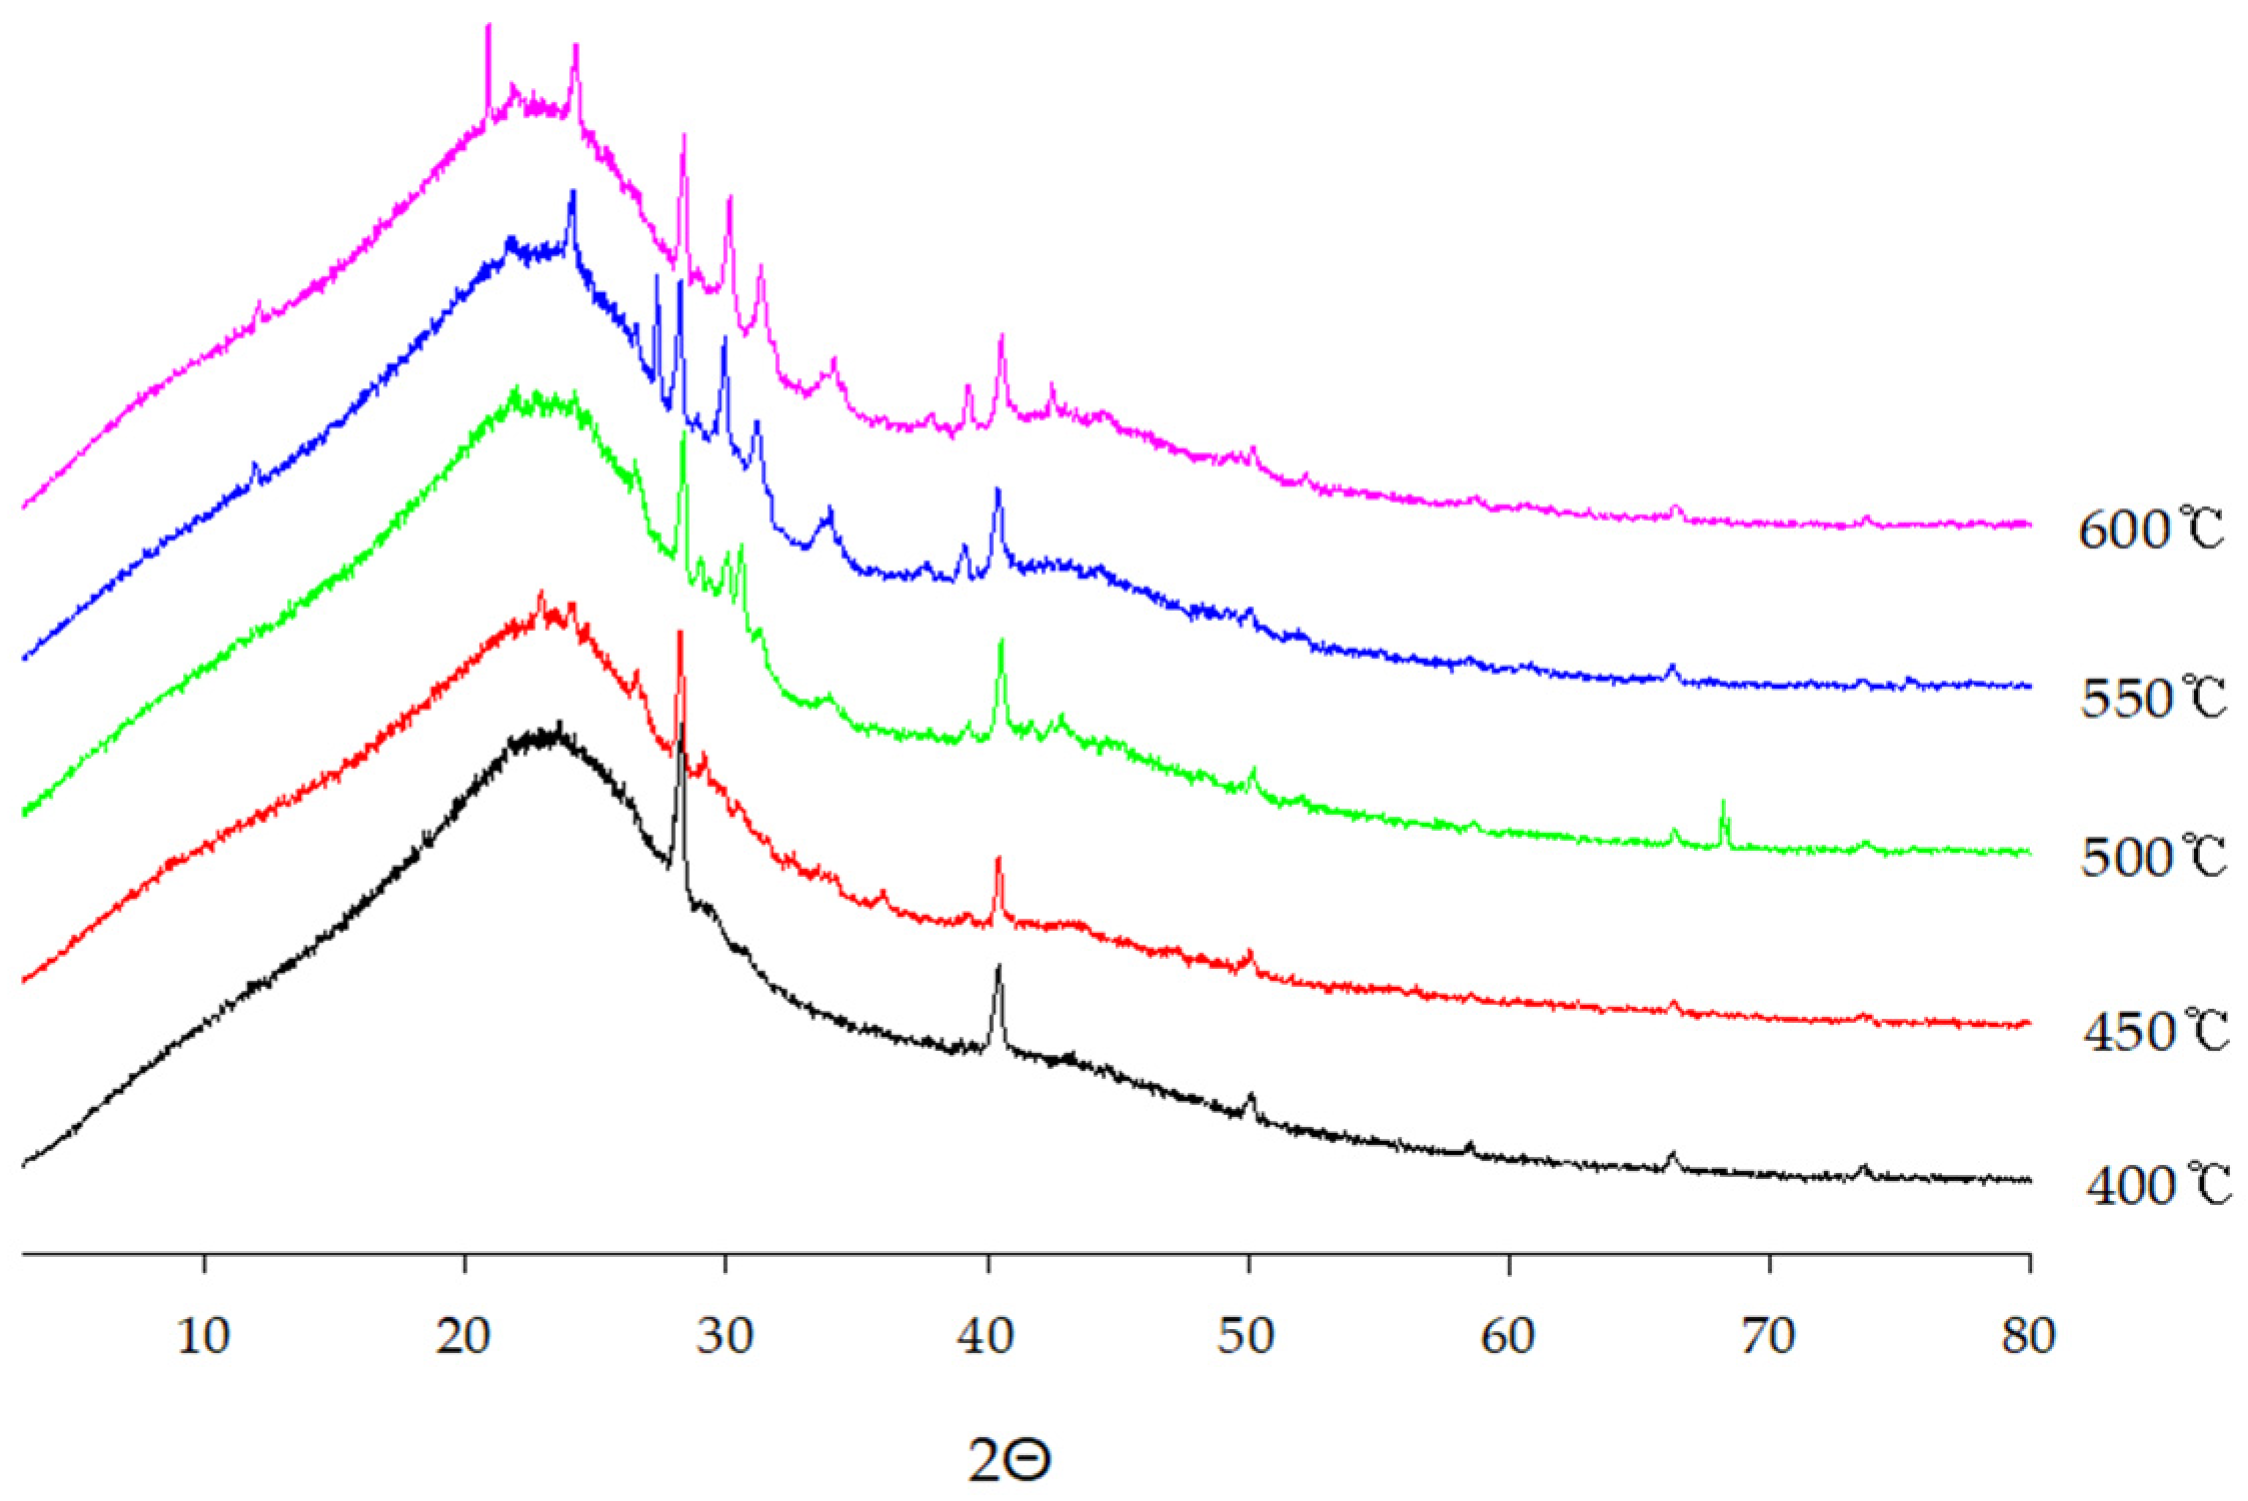
3.3.4. Biochar Analysis

To analyze the properties of the biochar recovered after the pyrolysis reaction, the changes in chemical structure were examined through FTIR analysis. The FTIR spectra of the biochar at each reaction temperature for a heating rate of 10 °C/min and raw EFB are shown in Figure 9. The FTIR graph shows the functional group and the fingerprint region of 4000–1450 cm−1 and 1450–500 cm−1, respectively [46]. The peak in the 3400–3300 cm−1 region is due to the O-H groups of hemicellulose and cellulose [47], while the relatively weak peak appearing at 2920–2850 cm−1 is due to the C-H groups of cellulose [48]. The peak observed at 1710 cm−1 is due to the carbonyl group (C=O) [49], and the vibrations appearing at 1623–1608 cm−1 are due to the C=C of the benzene ring that constitute lignin [50]. Additionally, the peak at 1560 cm−1 is due to C=O [36], and the peak observed at 1360 cm−1 is caused by bending vibrations of the C-H and C-O groups in the polysaccharide aromatic rings of hemicellulose, cellulose, and lignin [50]. The peak at 1232 cm−1 is due to the C-O-C aryl-alkyl ether, which was observed in the raw material but was hardly observed in the biochar at all reaction temperatures [36]. Additionally, at 1032 cm−1, a large peak due to the C-O bond was observed in the raw material [51], although in the case of the biochar, it decreases as the reaction temperature increases. Thus, the FTIR analysis results confirmed that as the pyrolysis reaction progresses, the functional groups containing oxygen in the biochar are decomposed. Table 7 summarizes the elemental analysis results of raw EFB and biochar. Compared with that of the raw materials, the carbon content of the biochar significantly increased, and generally, the carbon content increased with rising temperature. This is because components such as oxygen and hydrogen are converted into gaseous and liquid phases through pyrolysis, resulting in a relative increase in carbon content. As the heating rate increased, the carbon content of the biochar also showed a tendency to increase. This is because, as mentioned in the gas product analysis, the decomposition reaction is promoted as the heating rate increases, leading to a relatively higher increase in carbon content, similar to that of the case where the reaction temperature increases.
Figure 10 demonstrates the XRD pattern of the biochar recovered after pyrolysis according to reaction temperature at a heating rate of 10 °C/min. In the case of raw EFB, XRD analysis was not possible due to the properties of the sample. The XRD results of biochar are known to be primarily due to the formation of a turbostratic carbon structure within the biomass during the pyrolysis process [52]. Our results also confirm that a broad peak around 22° and 42° appears in the turbostratic carbon structure in all biochars. Additionally, it can be confirmed that peaks appear at 28° and 40.3°, which are due to the crystallization of KCl [53]. As the reaction temperature increases, the decrease in the peak observed over a wide range around 22° is not significant. This suggests that the decomposition of cellulose was already completed at reaction temperatures below 400 °C. However, the formation of additional peaks in the XRD pattern at temperatures above 500 °C was observed, which is attributed to the crystallization of inorganic components contained in the biochars as the temperature increases along with the decomposition of cellulose [54].

4. Conclusions

We investigated pyrolysis to recover bio-crude oil from EFB, and the following conclusions were drawn. TGA of EFB revealed that thermal decomposition begins at approximately 210 °C and is largely complete by 400 °C. Based on TGA results, kinetic analysis using both differential and integral methods showed distinct trends: the differential method indicated that the activation energy increased as the conversion rate increased, while the integral method showed that the activation energy tended to increase as the heating rate increased. This suggests that utilizing both differential and integral methods is effective for discussing activation energy in the pyrolysis of EFB. Yield analysis of liquid products, gas products, and biochars under varying reaction temperatures and heating rates demonstrated that higher temperatures promote pyrolysis, leading to decreased biochar yield and increased gas product yield. For liquid products, at pyrolysis temperatures above 400 °C, heating rate had a more significant influence than temperature itself. Gas product characterization showed that CO and CO2 formation began simultaneously at around 270 °C, while total hydrocarbon (THC) production started after 500 °C. Additionally, higher heating rates promoted radical generation, increasing THC production. Characterization of liquid products under different pyrolysis conditions revealed that most compounds contained oxygen, originating from hemicellulose, cellulose, and lignin. Furthermore, non-saturated and aromatic components were more abundant than saturated and aliphatic components. Analysis of the biochar confirmed that oxygen-containing functional groups decomposed as pyrolysis progressed. As oxygen and hydrogen were converted into gaseous and liquid phases, the relative carbon content in the biochar increased.

Author Contributions

Formal analysis, H.K.; Data curation, M.L. and J.C.; Writing—original draft, H.K. and R.S.; Writing—review & editing, S.O.; Project administration, S.O. All authors have read and agreed to the published version of the manuscript.

Funding

This work was supported by the Technology Innovation Program (No. 20015401) funded by the Ministry of Trade, Industry, and Energy (MOTIE, Korea) and the research grant of the Waste to Energy Recycling Human Resource Development Project of Korea Ministry of Environment (ME).

Data Availability Statement

Data are available on request.

Conflicts of Interest

The authors declare no conflict of interest.

References

  1. Bilgili, M.; Tumse, S.; Nar, S. Comprehensive Overview on the Present State and Evolution of Global Warming, Climate Change, Greenhouse Gasses and Renewable Energy. Arab. J. Sci. Eng. 2024, 49, 14503–14531. [Google Scholar] [CrossRef]
  2. Azarpour, A.; Suhaimi, S.; Zahedi, G.; Bahadori, A. A review on the drawbacks of renewable energy as a promising energy source of the future. Arab. J. Sci. Eng. 2013, 38, 317–328. [Google Scholar] [CrossRef]
  3. Vamvuka, D. Bio-oil, solid and gaseous biofuels from biomass pyrolysis processes—An overview. Int. J. Energy Res. 2011, 35, 835–862. [Google Scholar] [CrossRef]
  4. Samiran, N.A.; Jaafar, M.N.M.; Ng, J.; Lam, S.S.; Chong, C.T. Progress in biomass gasification technique–with focus on Malaysian palm biomass for syngas production. Renew. Sustain. Energy Rev. 2016, 62, 1047–1062. [Google Scholar] [CrossRef]
  5. Descals, A.; Gaveau, D.L.; Wich, S.; Szantoi, Z.; Meijaard, E. Global mapping of oil palm planting year from 1990 to 2021. Earth Syst. Sci. Data Discuss. 2024, 16, 5111–5129. [Google Scholar] [CrossRef]
  6. Dolah, R.; Karnik, R.; Hamdan, H. A comprehensive review on biofuels from oil palm empty bunch (EFB): Current status, potential, barriers and way forward. Sustainability 2021, 13, 10210. [Google Scholar] [CrossRef]
  7. Chiew, Y.L.; Iwata, T.; Shimada, S. System analysis for effective use of palm oil waste as energy resources. Biomass Bioenergy 2011, 35, 2925–2935. [Google Scholar] [CrossRef]
  8. Okarda, B.; Purnomo, H.; Juniyanti, L.; Kusumadewi, S.D.; Nadhira, S. Indonesian palm oil towards sustainability: A system dynamic approach. IOP Conf. Ser. Earth Environ. Sci. 2024, 1379, 012037. [Google Scholar] [CrossRef]
  9. Sutrisno, B.; Hidayat, A. Pyrolysis of palm empty fruit bunch: Yields and analysis of bio-oil. MATEC Web Conf. 2018, 154, 01036. [Google Scholar] [CrossRef]
  10. Razali, W.A.W.; Baharuddin, A.S.; Talib, A.T.; Sulaiman, A.; Naim, M.; Hassan, M.A.; Shirai, Y. Degradation of oil palm empty fruit bunches (OPEFB) fiber during composting process using in-vessel composter. BioResources 2012, 7, 4786–4805. [Google Scholar]
  11. Kong, S.; Loh, S.; Bachmann, R.T.; Rahim, S.A.; Salimon, J. Biochar from oil palm biomass: A review of its potential and challenges. Renew. Sustain. Energy Rev. 2014, 39, 729–739. [Google Scholar] [CrossRef]
  12. Windiastuti, E.; Bindar, Y.; Hasanudin, U. Identification of potential application of oil palm empty fruit bunches (EFB): A review. IOP Conf. Ser. Earth Environ. Sci. 2022, 1063, 012024. [Google Scholar] [CrossRef]
  13. Umana, U.S.; Ebong, M.S.; Godwin, E.O. Biomass production from oil palm and its value chain. J. Hum. Earth Future 2020, 1, 30–38. [Google Scholar] [CrossRef]
  14. Sumathi, S.; Chai, S.P.; Mohamed, A.R. Utilization of oil palm as a source of renewable energy in Malaysia. Renew. Sustain. Energy Rev. 2008, 12, 2404–2421. [Google Scholar] [CrossRef]
  15. Hardianto, T.; Wenas, A.A.; Juangsa, F.B. Upgrading process of palm empty fruit bunches as alternative solid fuel: A review. Clean Energy 2023, 7, 1173–1188. [Google Scholar] [CrossRef]
  16. Jamil, K.; Hayashi, J.; Li, C. Pyrolysis of a Victorian brown coal and gasification of nascent char in CO2 atmosphere in a wire-mesh reactor. Fuel 2004, 83, 833–843. [Google Scholar] [CrossRef]
  17. Zhang, G.; Feng, Q.; Hu, J.; Sun, G.; Evrendilek, F.; Liu, H.; Liu, J. Performance and mechanism of bamboo residues pyrolysis: Gas emissions, by-products, and reaction kinetics. Sci. Total Environ. 2022, 838, 156560. [Google Scholar] [CrossRef]
  18. Varma, A.K.; Thakur, L.S.; Shankar, R.; Mondal, P. Pyrolysis of wood sawdust: Effects of process parameters on products yield and characterization of products. Waste Manag. 2019, 89, 224–235. [Google Scholar] [CrossRef]
  19. Biswas, B.; Singh, R.; Kumar, J.; Singh, R.; Gupta, P.; Krishna, B.B.; Bhaskar, T. Pyrolysis behavior of rice straw under carbon dioxide for production of bio-oil. Renew. Energy 2018, 129, 686–694. [Google Scholar] [CrossRef]
  20. Abnisa, F.; Arami-Niya, A.; Daud, W.W.; Sahu, J.N.; Noor, I.M. Utilization of oil palm tree residues to produce bio-oil and bio-char via pyrolysis. Energy Convers. Manag. 2013, 76, 1073–1082. [Google Scholar] [CrossRef]
  21. Rahayu, D.E.; Karnaningroem, N.; Altway, A.; Slamet, A. Utilization of oil palm empty fruit bunches biomass through slow pyrolysis process. IOP Conf. Ser. Earth Environ. Sci. 2021, 913, 012018. [Google Scholar] [CrossRef]
  22. Sukiran, M.A.; Kheang, L.S.; Bakar, N.A.; May, C.Y. Production and characterization of bio-char from the pyrolysis of empty fruit bunches. Am. J. Appl. Sci. 2011, 8, 984. [Google Scholar] [CrossRef]
  23. Mohamed, A.R.; Hamzah, Z.; Daud, M.Z.M.; Zakaria, Z. The effects of holding time and the sweeping nitrogen gas flowrates on the pyrolysis of EFB using a fixed–bed reactor. Procedia Eng. 2013, 53, 185–191. [Google Scholar] [CrossRef]
  24. Lim, X.; Sanna, A.; Andrésen, J.M. Influence of red mud impregnation on the pyrolysis of oil palm biomass-EFB. Fuel 2014, 119, 259–265. [Google Scholar] [CrossRef]
  25. Bridgwater, A.V.; Meier, D.; Radlein, D. An overview of fast pyrolysis of biomass. Org. Geochem. 1999, 30, 1479–1493. [Google Scholar] [CrossRef]
  26. Cooney, J.D.; Day, M.; Wiles, D.M. Thermal degradation of poly (ethylene terephthalate): A kinetic analysis of thermogravimetric data. J. Appl. Polym. Sci. 1983, 28, 2887–2902. [Google Scholar] [CrossRef]
  27. Coats, A.W.; Redfern, J.P. Kinetic parameters from thermogravimetric data. Nature 1964, 201, 68–69. [Google Scholar] [CrossRef]
  28. Yang, H.; Yan, R.; Chen, H.; Zheng, C.; Lee, D.H.; Liang, D.T. In-depth investigation of biomass pyrolysis based on three major components: Hemicellulose, cellulose and lignin. Energy Fuels 2006, 20, 388–393. [Google Scholar] [CrossRef]
  29. Brachi, P.; Santes, V.; Torres-Garcia, E. Pyrolytic degradation of spent coffee ground: A thermokinetic analysis through the dependence of activation energy on conversion and temperature. Fuel 2021, 302, 120995. [Google Scholar] [CrossRef]
  30. Torres-García, E.; Ramírez-Verduzco, L.F.; Aburto, J. Pyrolytic degradation of peanut shell: Activation energy dependence on the conversion. Waste Manag. 2020, 106, 203–212. [Google Scholar] [CrossRef]
  31. Yeo, J.Y.; Chin, B.L.F.; Tan, J.K.; Loh, Y.S. Comparative studies on the pyrolysis of cellulose, hemicellulose, and lignin based on combined kinetics. J. Energy Inst. 2019, 92, 27–37. [Google Scholar] [CrossRef]
  32. Zhang, Z.; Zhu, M.; Zhang, D. A Thermogravimetric study of the characteristics of pyrolysis of cellulose isolated from selected biomass. Appl. Energy 2018, 220, 87–93. [Google Scholar] [CrossRef]
  33. Kan, T.; Strezov, V.; Evans, T.J. Lignocellulosic biomass pyrolysis: A review of product properties and effects of pyrolysis parameters. Renew. Sustain. Energy Rev. 2016, 57, 1126–1140. [Google Scholar] [CrossRef]
  34. Sundaram, E.G.; Natarajan, E. Pyrolysis of coconut shell: An experimental investigation. J. Eng. Res. [TJER] 2009, 6, 33–39. [Google Scholar] [CrossRef]
  35. Akhtar, J.; Amin, N.S. A review on operating parameters for optimum liquid oil yield in biomass pyrolysis. Renew. Sustain. Energy Rev. 2012, 16, 5101–5109. [Google Scholar] [CrossRef]
  36. Yang, H.; Yan, R.; Chen, H.; Lee, D.H.; Zheng, C. Characteristics of hemicellulose, cellulose and lignin pyrolysis. Fuel 2007, 86, 1781–1788. [Google Scholar] [CrossRef]
  37. Yan, M.; Hantoko, D.; Susanto, H.; Ardy, A.; Waluyo, J.; Weng, Z.; Lin, J. Hydrothermal treatment of empty fruit bunch and its pyrolysis characteristics. Biomass Convers. Biorefinery 2019, 9, 709–717. [Google Scholar] [CrossRef]
  38. Li, C.; Hayashi, J.; Sun, Y.; Zhang, L.; Zhang, S.; Wang, S.; Hu, X. Impact of heating rates on the evolution of function groups of the biochar from lignin pyrolysis. J. Anal. Appl. Pyrolysis 2021, 155, 105031. [Google Scholar] [CrossRef]
  39. Mohan, D.; Pittman Jr, C.U.; Steele, P.H. Pyrolysis of wood/biomass for bio-oil: A critical review. Energy Fuels 2006, 20, 848–889. [Google Scholar] [CrossRef]
  40. Demirbas, A. The influence of temperature on the yields of compounds existing in bio-oils obtained from biomass samples via pyrolysis. Fuel Process Technol 2007, 88, 591–597. [Google Scholar] [CrossRef]
  41. Evans, R.J.; Milne, T.A. Molecular characterization of the pyrolysis of biomass. Energy Fuels 1987, 1, 123–137. [Google Scholar] [CrossRef]
  42. Wang, F.; Zheng, Y.; Huang, Y.; Yang, X.; Liu, C.; Kang, J.; Zheng, Z. Effect of Temperature on Characteristics of Bio-Oil and Bio-Char During Pyrolysis of Yunnan Pine. J. Biobased Mater. Bioenergy 2016, 10, 81–89. [Google Scholar] [CrossRef]
  43. Cai, W.; Zhu, X.; Kumar, R.; Zhu, Z.; Ye, J.; Zhao, J. Catalytic pyrolysis of biomass waste using montmorillonite-supported ultrafine iron nanoparticles for enhanced bio-oil yield and quality. Green Energy Resour. 2024, 2, 100085. [Google Scholar] [CrossRef]
  44. Gollakota, A.R.; Reddy, M.; Subramanyam, M.D.; Kishore, N. A review on the upgradation techniques of pyrolysis oil. Renew. Sustain. Energy Rev. 2016, 58, 1543–1568. [Google Scholar] [CrossRef]
  45. Wang, D.; Li, D.; Liu, Y.; Lv, D.; Ye, Y.; Zhu, S.; Zhang, B. Study of a new complex method for extraction of phenolic compounds from bio-oils. Sep. Purif. Technol. 2014, 134, 132–138. [Google Scholar] [CrossRef]
  46. Abel, S.E.R.; Loh, S.K.; Wahab, N.A.; Masek, O.; Tanimu, M.I.; Bachmann, R.T. Effect of operating temperature on physicochemical properties of empty fruit bunch cellulose-derived biochar. J. Oil Palm Res. 2021, 33, 643–652. [Google Scholar]
  47. Sukiran, M.A.; Daud, W.M.A.W.; Abnisa, F.; Nasrin, A.B.; Aziz, A.A.; Loh, S.K. A comprehensive study on torrefaction of empty fruit bunches: Characterization of solid, liquid and gas products. Energy 2021, 230, 120877. [Google Scholar] [CrossRef]
  48. Rosli, N.S.; Harun, S.; Jahim, J.M.; Othaman, R. Chemical and physical characterization of oil palm empty fruit bunch. Malays. J. Anal. Sci. 2017, 21, 188–196. [Google Scholar]
  49. Kasim, N.N.; Ismail, K.; Mohamed, A.R.; Ishak, M.A.M.; Ahmad, R.; Ismail, W. Characteristic, thermochemical behaviors and kinetic of demineralized and torrefied empty fruit bunches (EFB). Adv. Sci. Technol. Eng. Syst. J. 2018, 3, 365–373. [Google Scholar] [CrossRef]
  50. Lani, N.S.; Ngadi, N.; Johari, A.; Jusoh, M. Isolation, characterization, and application of nanocellulose from oil palm empty fruit bunch fiber as nanocomposites. J. Nanomater. 2014, 2014, 702538. [Google Scholar] [CrossRef]
  51. Marhani; Sahur, A.; Laban, S.; Musa, Y. Characterization of biochar empty fruit bunches OPEFB at various temperatures and burning time. J. Exp. Biol. Agric. Sci. 2022, 10, 599–606. [Google Scholar] [CrossRef]
  52. Kim, P.; Johnson, A.; Edmunds, C.W.; Radosevich, M.; Vogt, F.; Rials, T.G.; Labbé, N. Surface functionality and carbon structures in lignocellulosic-derived biochars produced by fast pyrolysis. Energy Fuels 2011, 25, 4693–4703. [Google Scholar] [CrossRef]
  53. Luo, Q.; Deng, Y.; Li, Y.; He, Q.; Wu, H.; Fang, X. Effects of pyrolysis temperatures on the structural properties of straw biochar and its adsorption of tris-(1-chloro-2-propyl) phosphate. Sci. Rep. 2024, 14, 25711. [Google Scholar] [CrossRef] [PubMed]
  54. Waqas, M.; Aburiazaiza, A.S.; Miandad, R.; Rehan, M.; Barakat, M.A.; Nizami, A.S. Development of biochar as fuel and catalyst in energy recovery technologies. J. Clean. Prod. 2018, 188, 477–488. [Google Scholar] [CrossRef]
Figure 1. Schematic diagram of the experimental apparatus used in this study.
Energies 18 01404 g001
Figure 2. (a) Thermogravimetric analysis (TGA) and (b) derivative thermogravimetry (DTG) curves of EFB.
Energies 18 01404 g002
Figure 3. (a) Application of differential method and (b) activation energies over a range of conversion.
Energies 18 01404 g003
Figure 4. Application of integral method used in this study at heating rates of (a) 5 °C/min and (b) 10 °C/min. The underlined part in the figure represents the highest R2 value.
Energies 18 01404 g004
Figure 5. Product yields of EFB pyrolysis according to reaction temperatures and heating rates of (a) 5 °C/min, (b) 10 °C/min, and (c) 20 °C/min.
Energies 18 01404 g005
Figure 6. Gas components from EFB pyrolysis according to reaction temperatures of (a) 400 °C, (b) 500 °C, and (c) 600 °C at a heating rate of 10 °C/min.
Energies 18 01404 g006
Figure 7. Gas components from EFB pyrolysis according to heating rates of (a) 5 °C/min, (b) 10 °C/min, and (c) 20 °C/min at a reaction temperature of 500 °C.
Energies 18 01404 g007
Figure 8. Compounds according to the carbon number of HVLP and LVLP at heating rates of (a) 5 °C/min, (b) 10 °C/min, and (c) 20 °C/min.
Energies 18 01404 g008
Figure 9. FTIR spectra of EFB and biochars according to reaction temperatures.
Energies 18 01404 g009
Figure 10. XRD patterns of EFB and biochars according to reaction temperatures.
Energies 18 01404 g010
Table 1. Properties of EFB used in this study.
Elements (%)C46.58
H5.94
N0.54
S0.04
O43.55
Others3.55
Volatile (%)71.91
Fixed Carbon (%)26.45
Ash (%)1.65
Based on dried samples.
Table 2. Conditions under which the GC-MS was used in this study.
ItemCondition
Column over temp40.0 °C
Injection temperature250.0 °C
Injection modeSplit
Flow control modeLinear velocity
Pressure60.1 kPa
Total flow579.2 mL/min
Column flow (He)1.15 mL/min
Linear velocity38.6 cm/s
Purge flow3.0 mL/min
Split ratio500.0
Table 3. Activation energies obtained from the differential method.
Conversion
(α)
Temperature and Heating RateActivation Energy (kJ/mol)
0.05228 °C (5 °C/min)–256 °C (40 °C/min)171.32
0.10247 °C (5 °C/min)–273 °C (40 °C/min)195.35
0.15260 °C (5 °C/min)–287 °C (40 °C/min)196.83
0.20272 °C (5 °C/min)–298 °C (40 °C/min)203.92
0.25281 °C (5 °C/min)–308 °C (40 °C/min)207.12
0.30289 °C (5 °C/min)–316 °C (40 °C/min)215.31
0.35295 °C (5 °C/min)–322 °C (40 °C/min)217.57
0.40300 °C (5 °C/min)–327 °C (40 °C/min)209.72
0.45305 °C (5 °C/min)–332 °C (40 °C/min)211.03
0.50309 °C (5 °C/min)–336 °C (40 °C/min)218.45
0.55314 °C (5 °C/min)–341 °C (40 °C/min)235.98
0.60326 °C (5 °C/min)–347 °C (40 °C/min)391.65
Table 4. Activation energies obtained from integral method.
Heating RateConversion
(α)
Activation Energy (kJ/mol)
5 °C/min0.04 < α < 0.6587.09
10 °C/min0.04 < α < 0.6787.49
20 °C/min0.03 < α < 0.6987.00
30 °C/min0.03 < α < 0.68105.96
40 °C/min0.02 < α < 0.68110.44
Table 5. Product yields of EFB pyrolysis according to reaction temperatures and heating rates.
Heating RateTemperature (°C)Gas (%)High Viscosity Liquid Product (%)Low Viscosity Liquid Product (%)Biochar (%)
5 °C/min40030.0018.4516.6034.95
45032.8619.2615.3432.54
50032.6023.0415.0729.31
55032.7419.2617.1628.81
60034.3720.7116.5628.35
10 °C/min40028.5421.0718.8732.19
45027.9420.8920.4830.69
50030.5820.3519.8929.21
55031.2420.2419.9228.95
60031.2021.3320.1027.37
20 °C/min40029.2620.4621.2931.16
45030.9717.9922.4828.56
50031.5617.4922.8128.15
55033.3816.6622.6827.29
60034.1917.6521.6126.55
Table 6. Properties of HVLP and LVLP compounds according to reaction temperatures and heating rates.
Heating RateTemp. (°C)Saturated Components
(%)
Non-Saturated Components (%)Aliphatic Components
(%)
Aromatic Components
(%)
HVLPLVLPHVLPLVLPHVLPLVLPHVLPLVLP
5 °C/min40020.9718.3879.0381.6223.8138.1076.1961.90
45016.8822.683.1277.423.6644.6876.3455.32
50016.6319.6483.3780.3623.4941.9776.5158.03
55019.8617.8380.1482.1720.8637.7079.1462.30
60016.4618.283.5481.819.6242.7580.3857.25
10 °C/min40014.6224.2385.3875.7717.0748.8382.9351.17
45014.3321.8885.6778.1220.1845.0679.8254.94
50013.8830.4086.1269.6019.5845.4480.4254.56
55022.7322.6877.2777.3225.8846.1174.1253.89
60015.2120.9884.7979.0220.0944.2779.9155.73
20 °C/min4009.9422.7990.0677.2114.0142.9585.9957.05
4509.8921.6490.1178.3614.6645.5885.3454.42
50012.1422.0987.8677.9119.9942.3680.0153.44
55013.1421.0986.8678.9116.8846.7183.1253.29
60015.8523.2184.1576.7923.147.1976.952.81
Based on area %.
Table 7. Elemental analysis of EFB and biochars.
CategoryC (%)H (%)N (%)S (%)O (%)Others (%)
EFB (raw)46.585.940.540.0443.553.55
5 °C/min400 °C73.633.960.790.0816.914.63
450 °C 73.713.270.700.0511.2910.98
500 °C 74.422.520.690.0611.3310.98
550 °C 76.532.200.680.1011.279.22
600 °C 77.002.020.550.0410.2110.18
10 °C/min400 °C 73.064.180.760.1115.386.51
450 °C 82.363.430.640.089.883.61
500 °C 78.233.040.720.0911.296.63
550 °C 79.843.100.790.0610.365.85
600 °C 83.402.300.560.059.134.56
20 °C/min400 °C 77.923.820.670.0713.643.88
450 °C 80.473.460.640.0511.843.54
500 °C 81.452.660.630.0511.673.54
550 °C 80.592.740.730.079.206.67
600 °C 85.062.780.750.079.641.70
Disclaimer/Publisher’s Note: The statements, opinions and data contained in all publications are solely those of the individual author(s) and contributor(s) and not of MDPI and/or the editor(s). MDPI and/or the editor(s) disclaim responsibility for any injury to people or property resulting from any ideas, methods, instructions or products referred to in the content.

