
Distributed Risk-Averse Optimization Scheduling of Hybrid Energy System with Complementary Renewable Energy Generation

Abstract
1. Introduction
- The complementarity and relevance of wind and solar generations in HWSS is analyzed and quantified based on the Frank copula, by which the cumulative distribution function of joint probability distribution is derived.
- The uncertainty of REG is quantified by CVaR which is modelled into the cost function of risk-averse operation optimization problem of HWSS based on a parameterized linear function of CVaR.
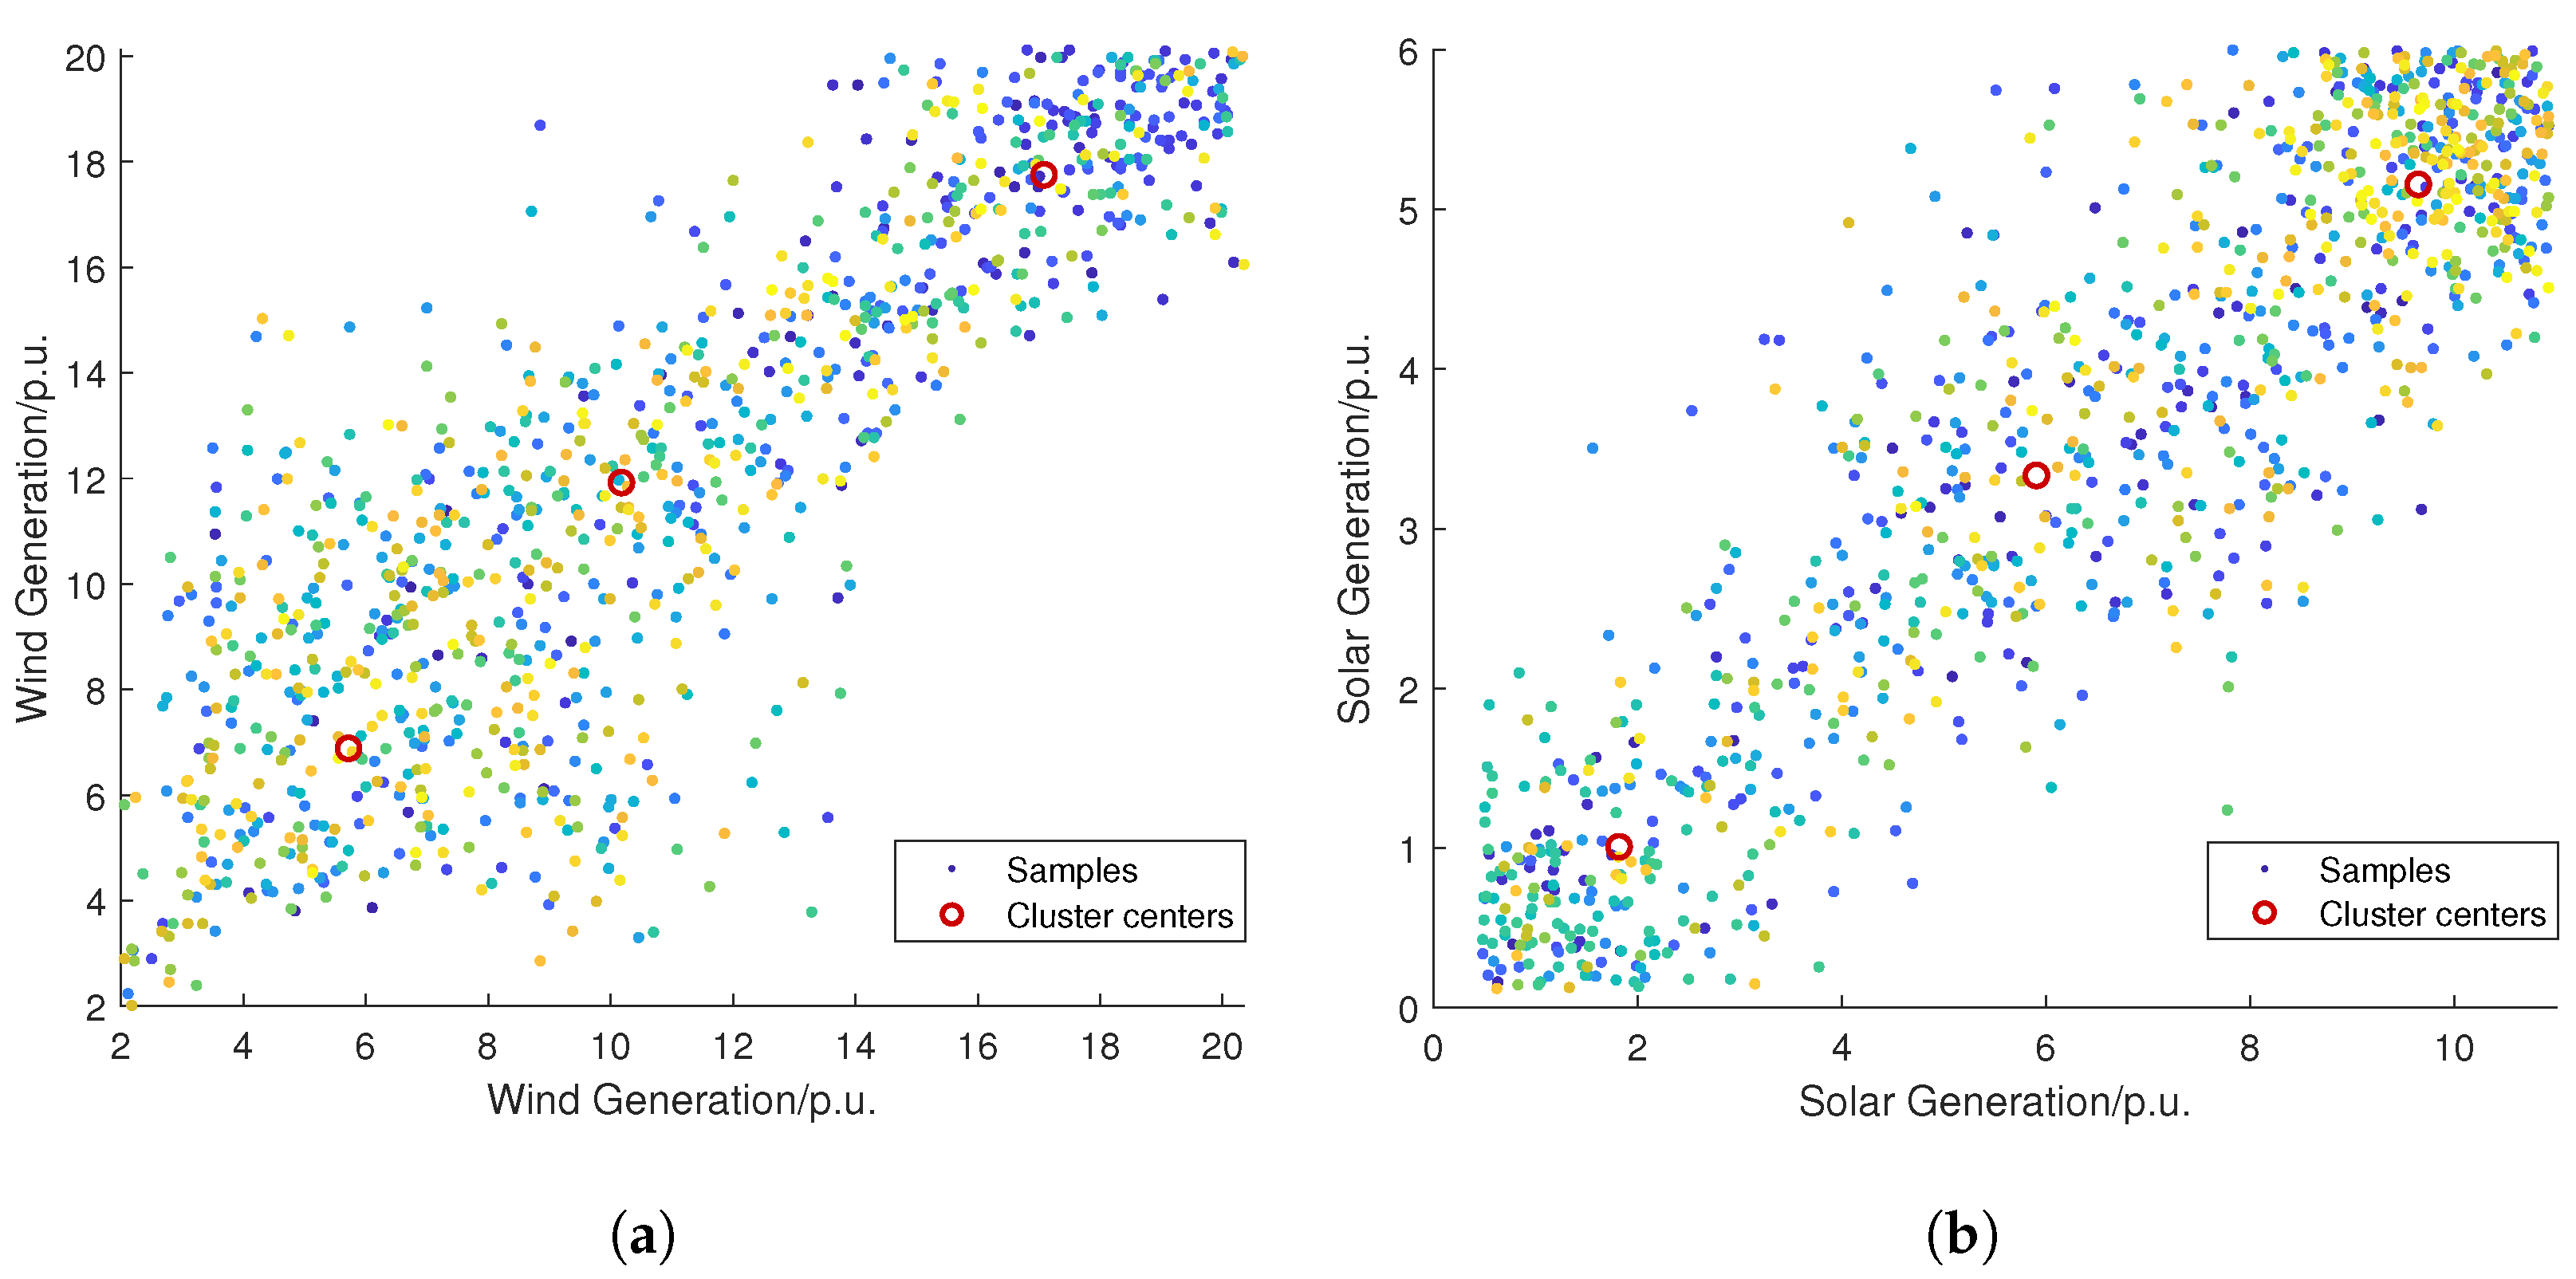
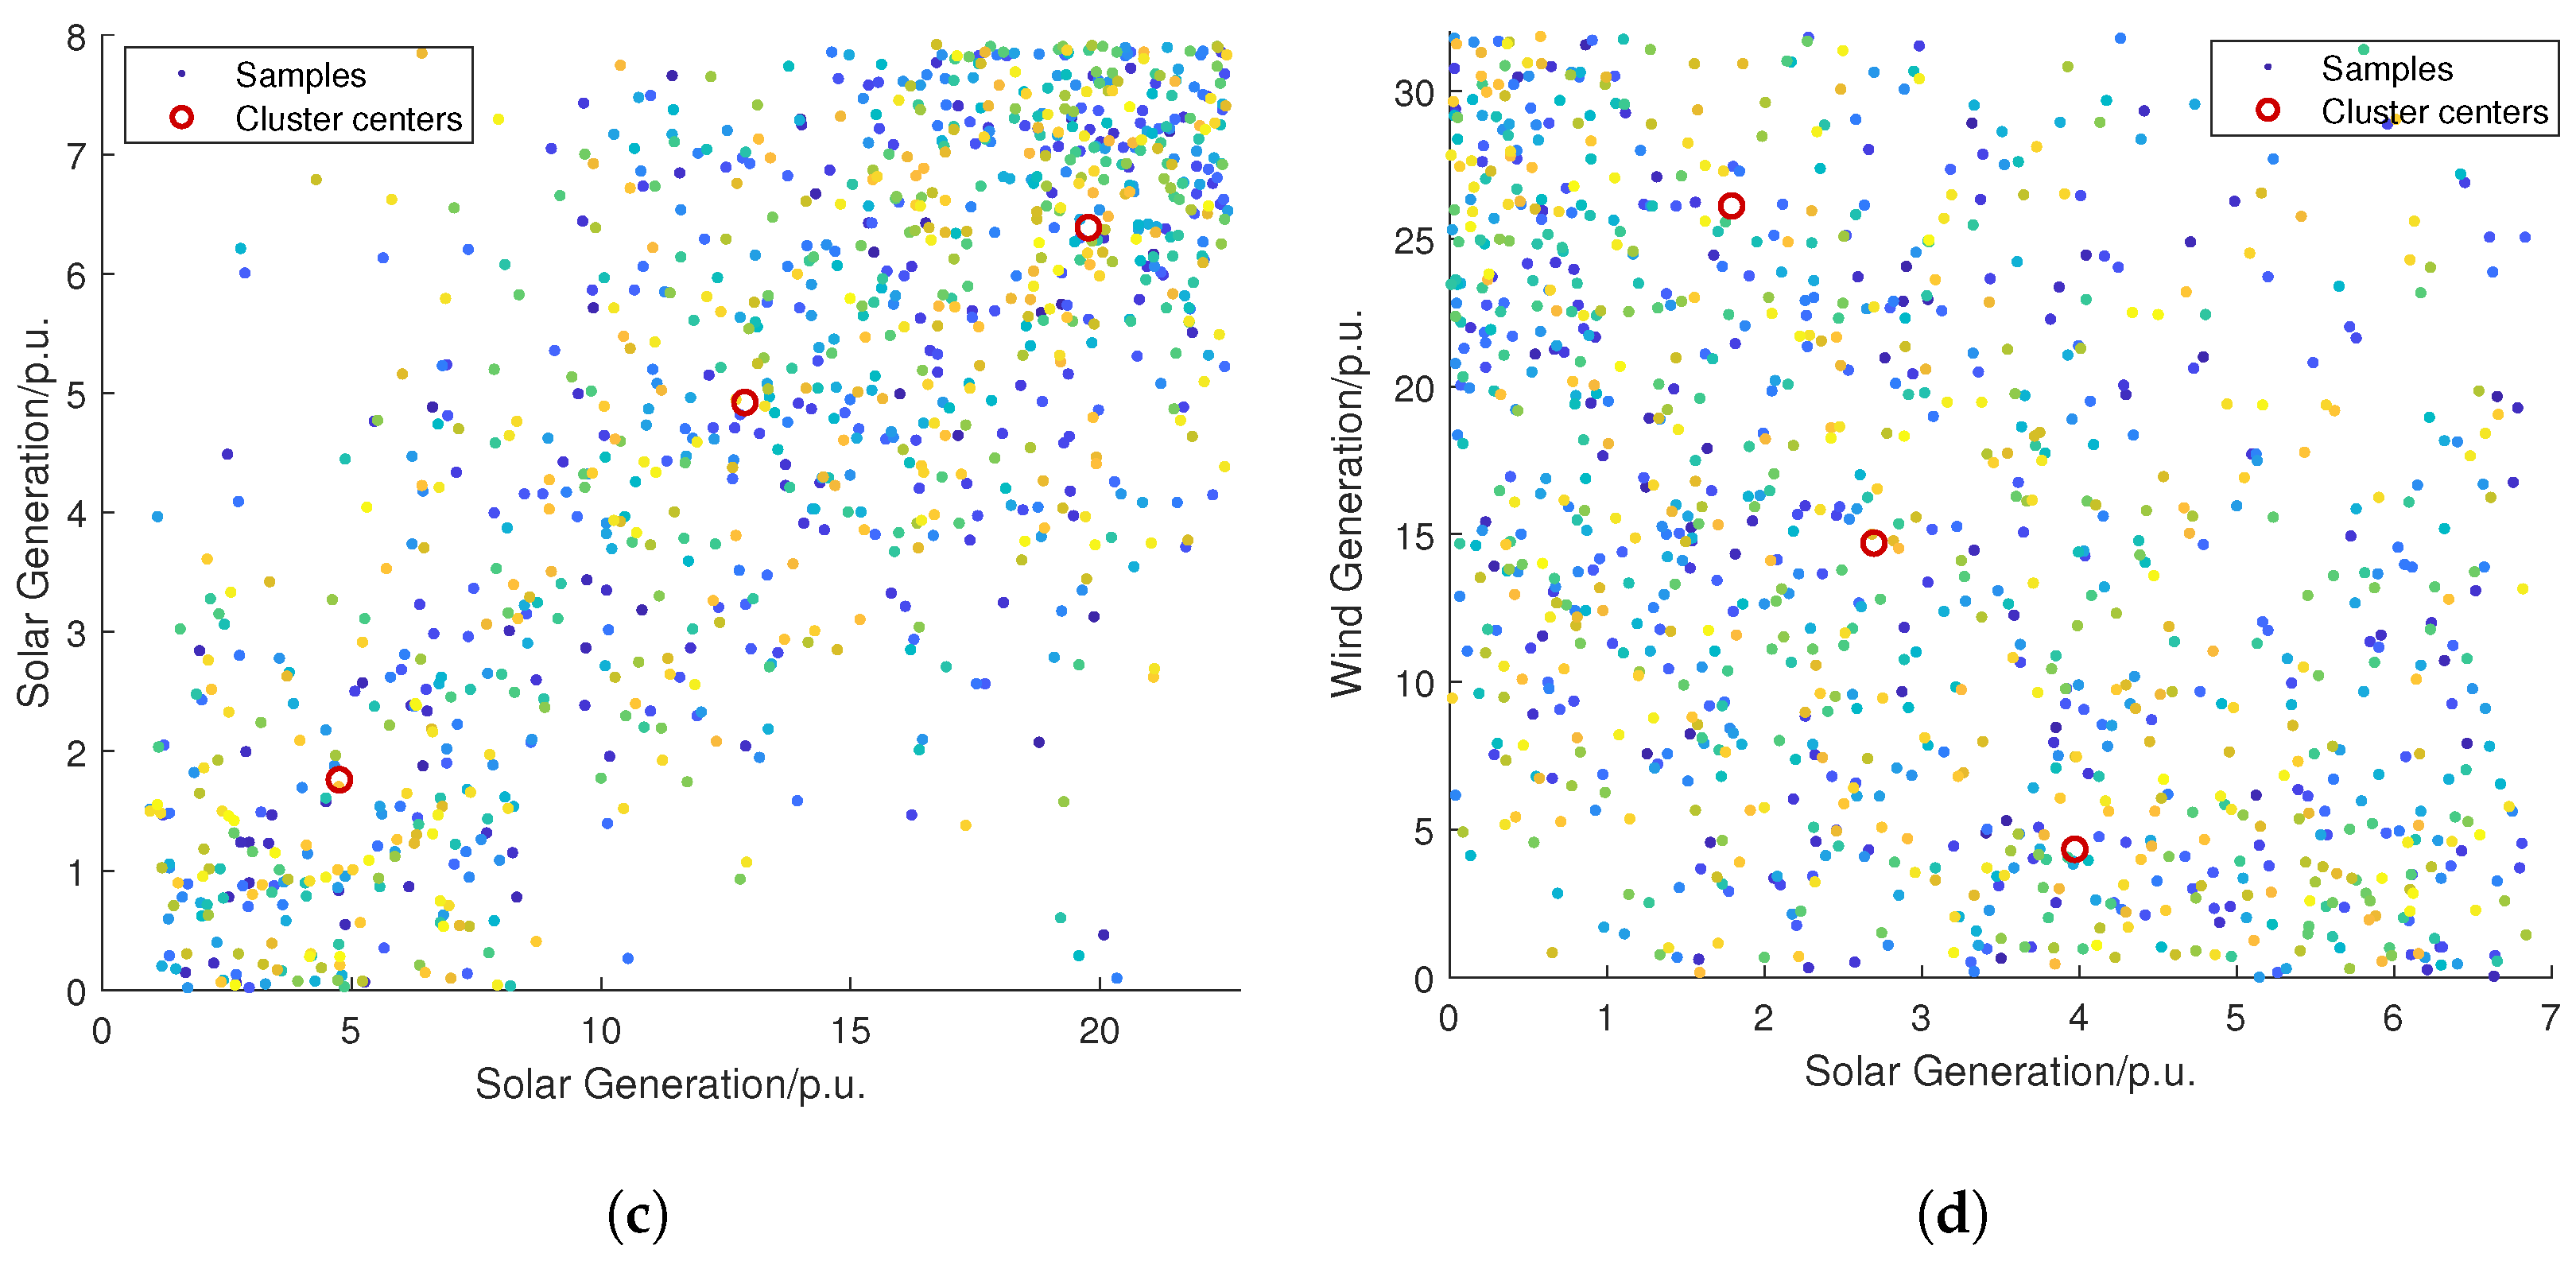
- A linear formulation of CVaR under typical scenarios is utilized to transform the risk-averse operation optimization model of HWSS into a deterministic optimization problem. Typical scenarios are selected based on Gibbs sampling and Fuzzy C-Means algorithm.
- A distributed algorithm based on ADMM is developed to solve the risk-averse operation optimization problem in distributed manner with limited variables exchanged.
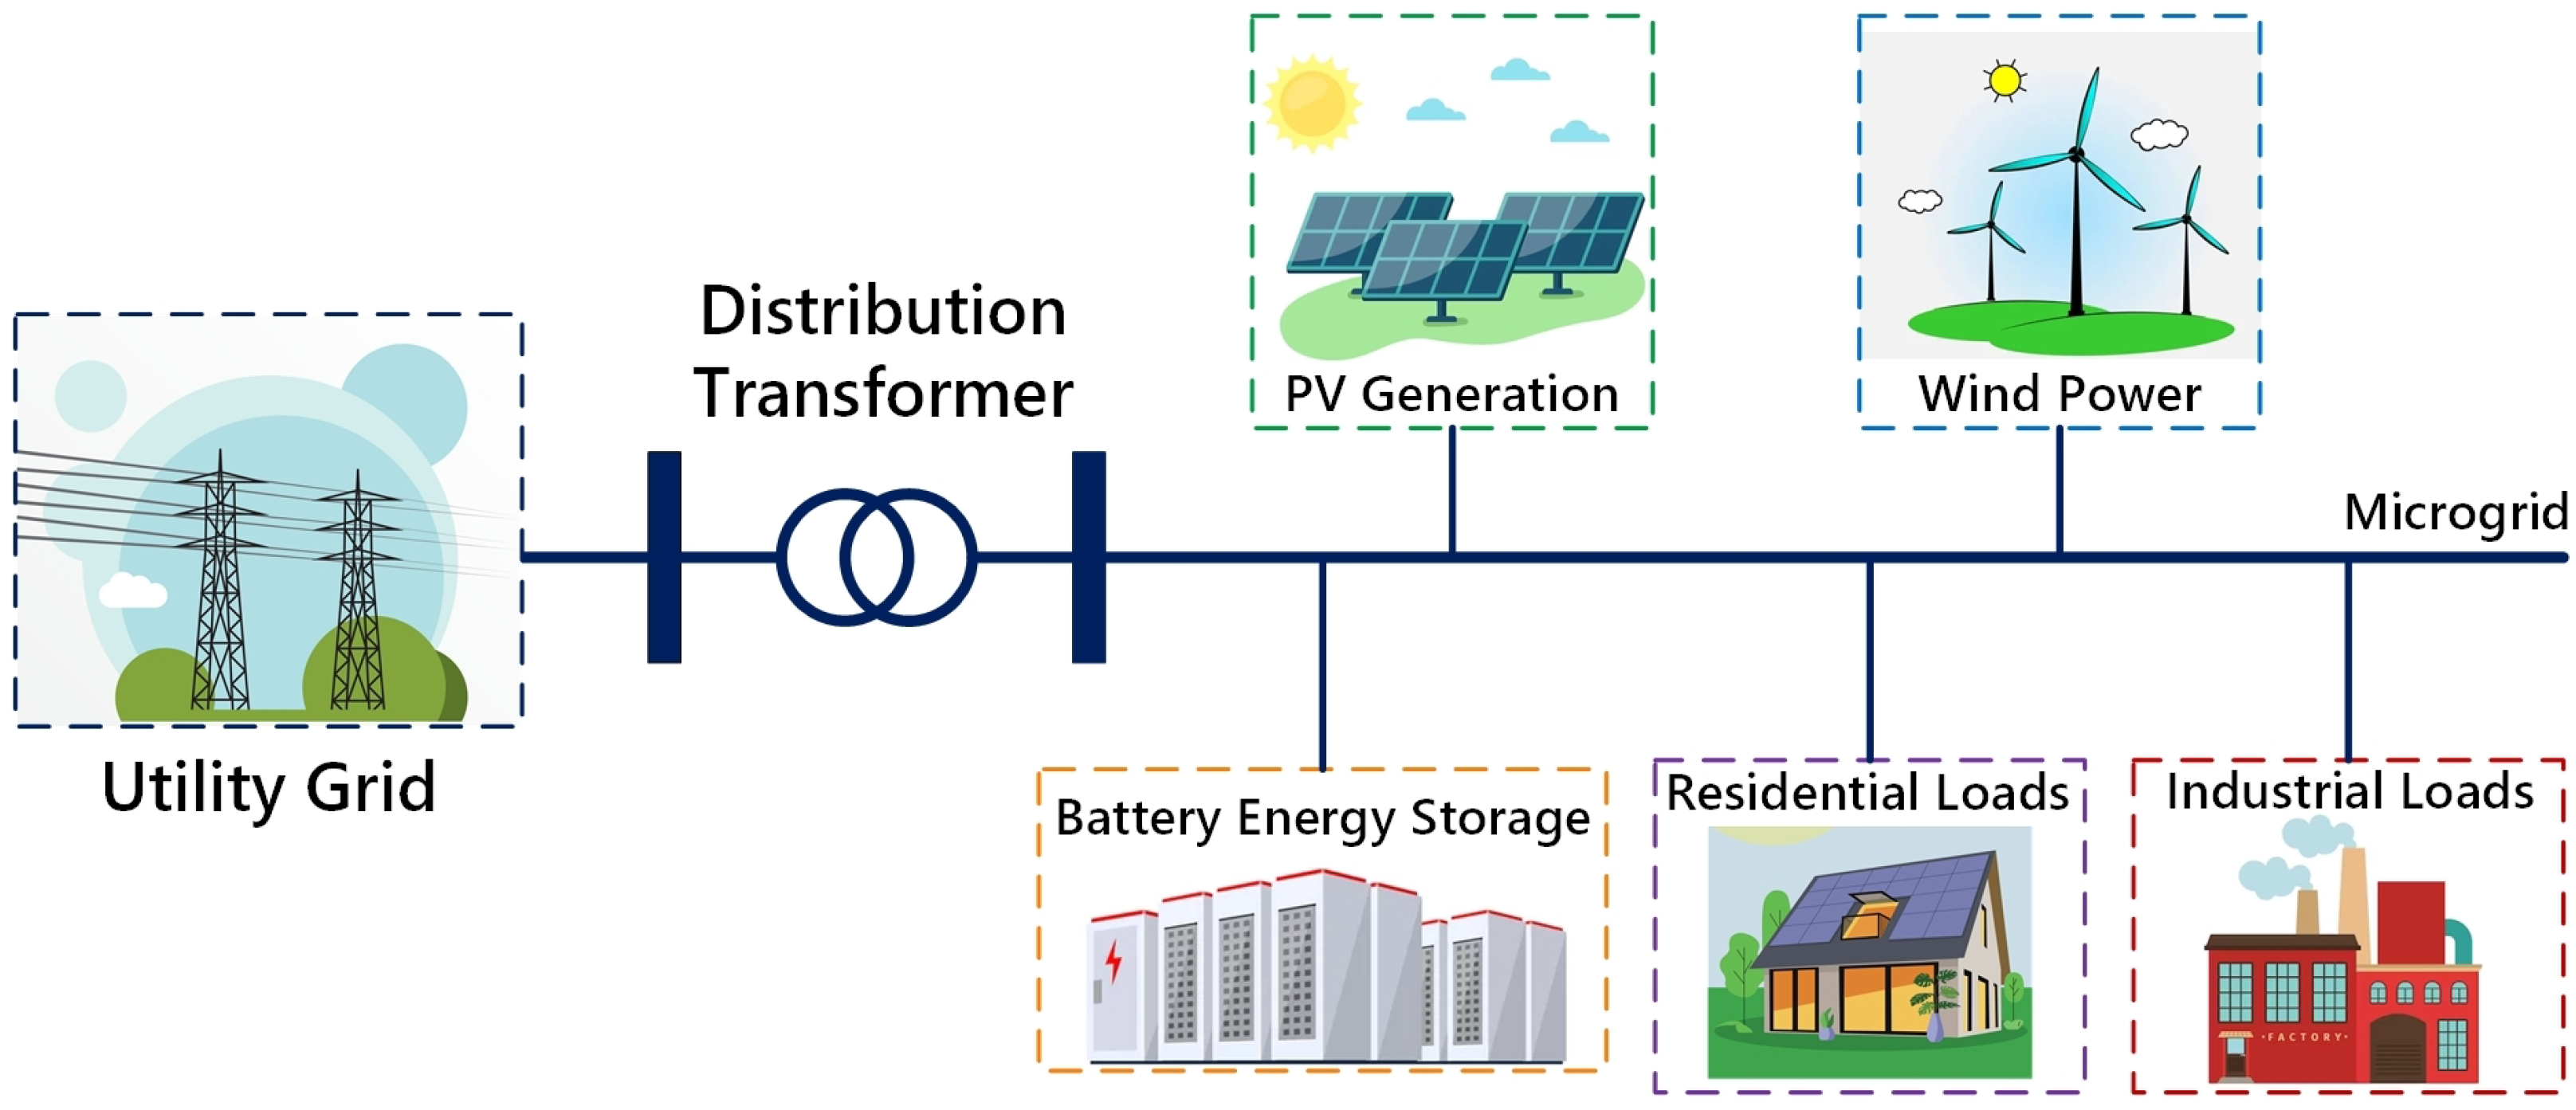
2. Hybrid Renewable Energy System Model
2.1. Network Model
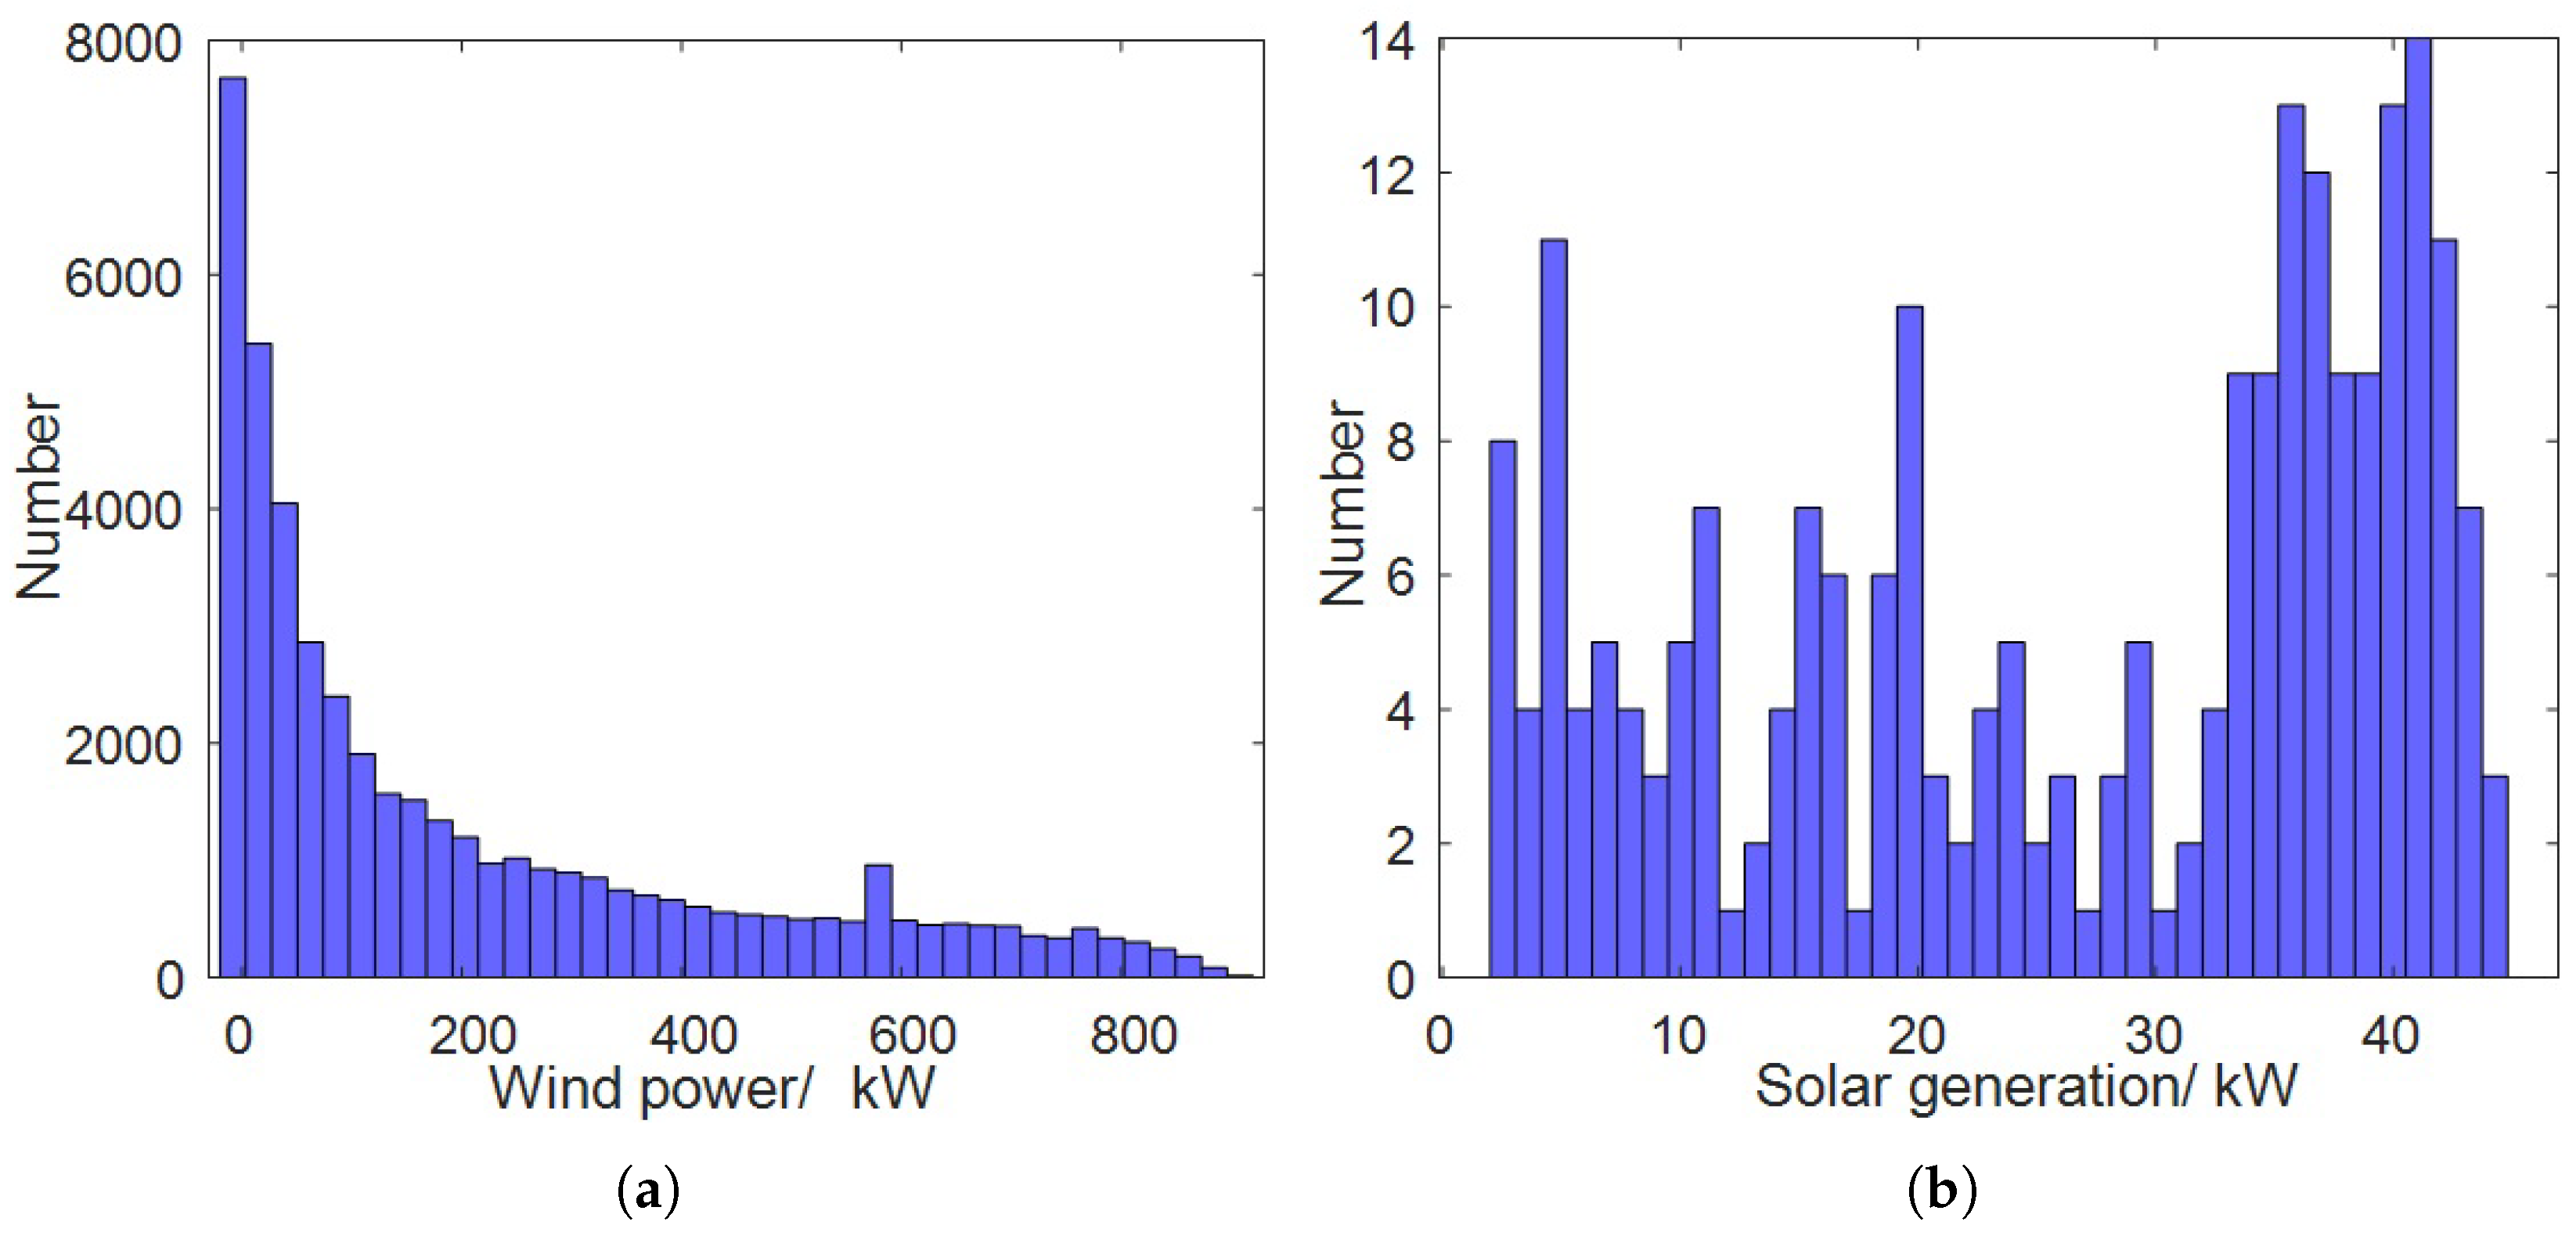
2.2. Wind–Photovoltaic Correlation Model
2.3. Battery Energy Storage Model
3. Risk-Averse Operation Optimization Model
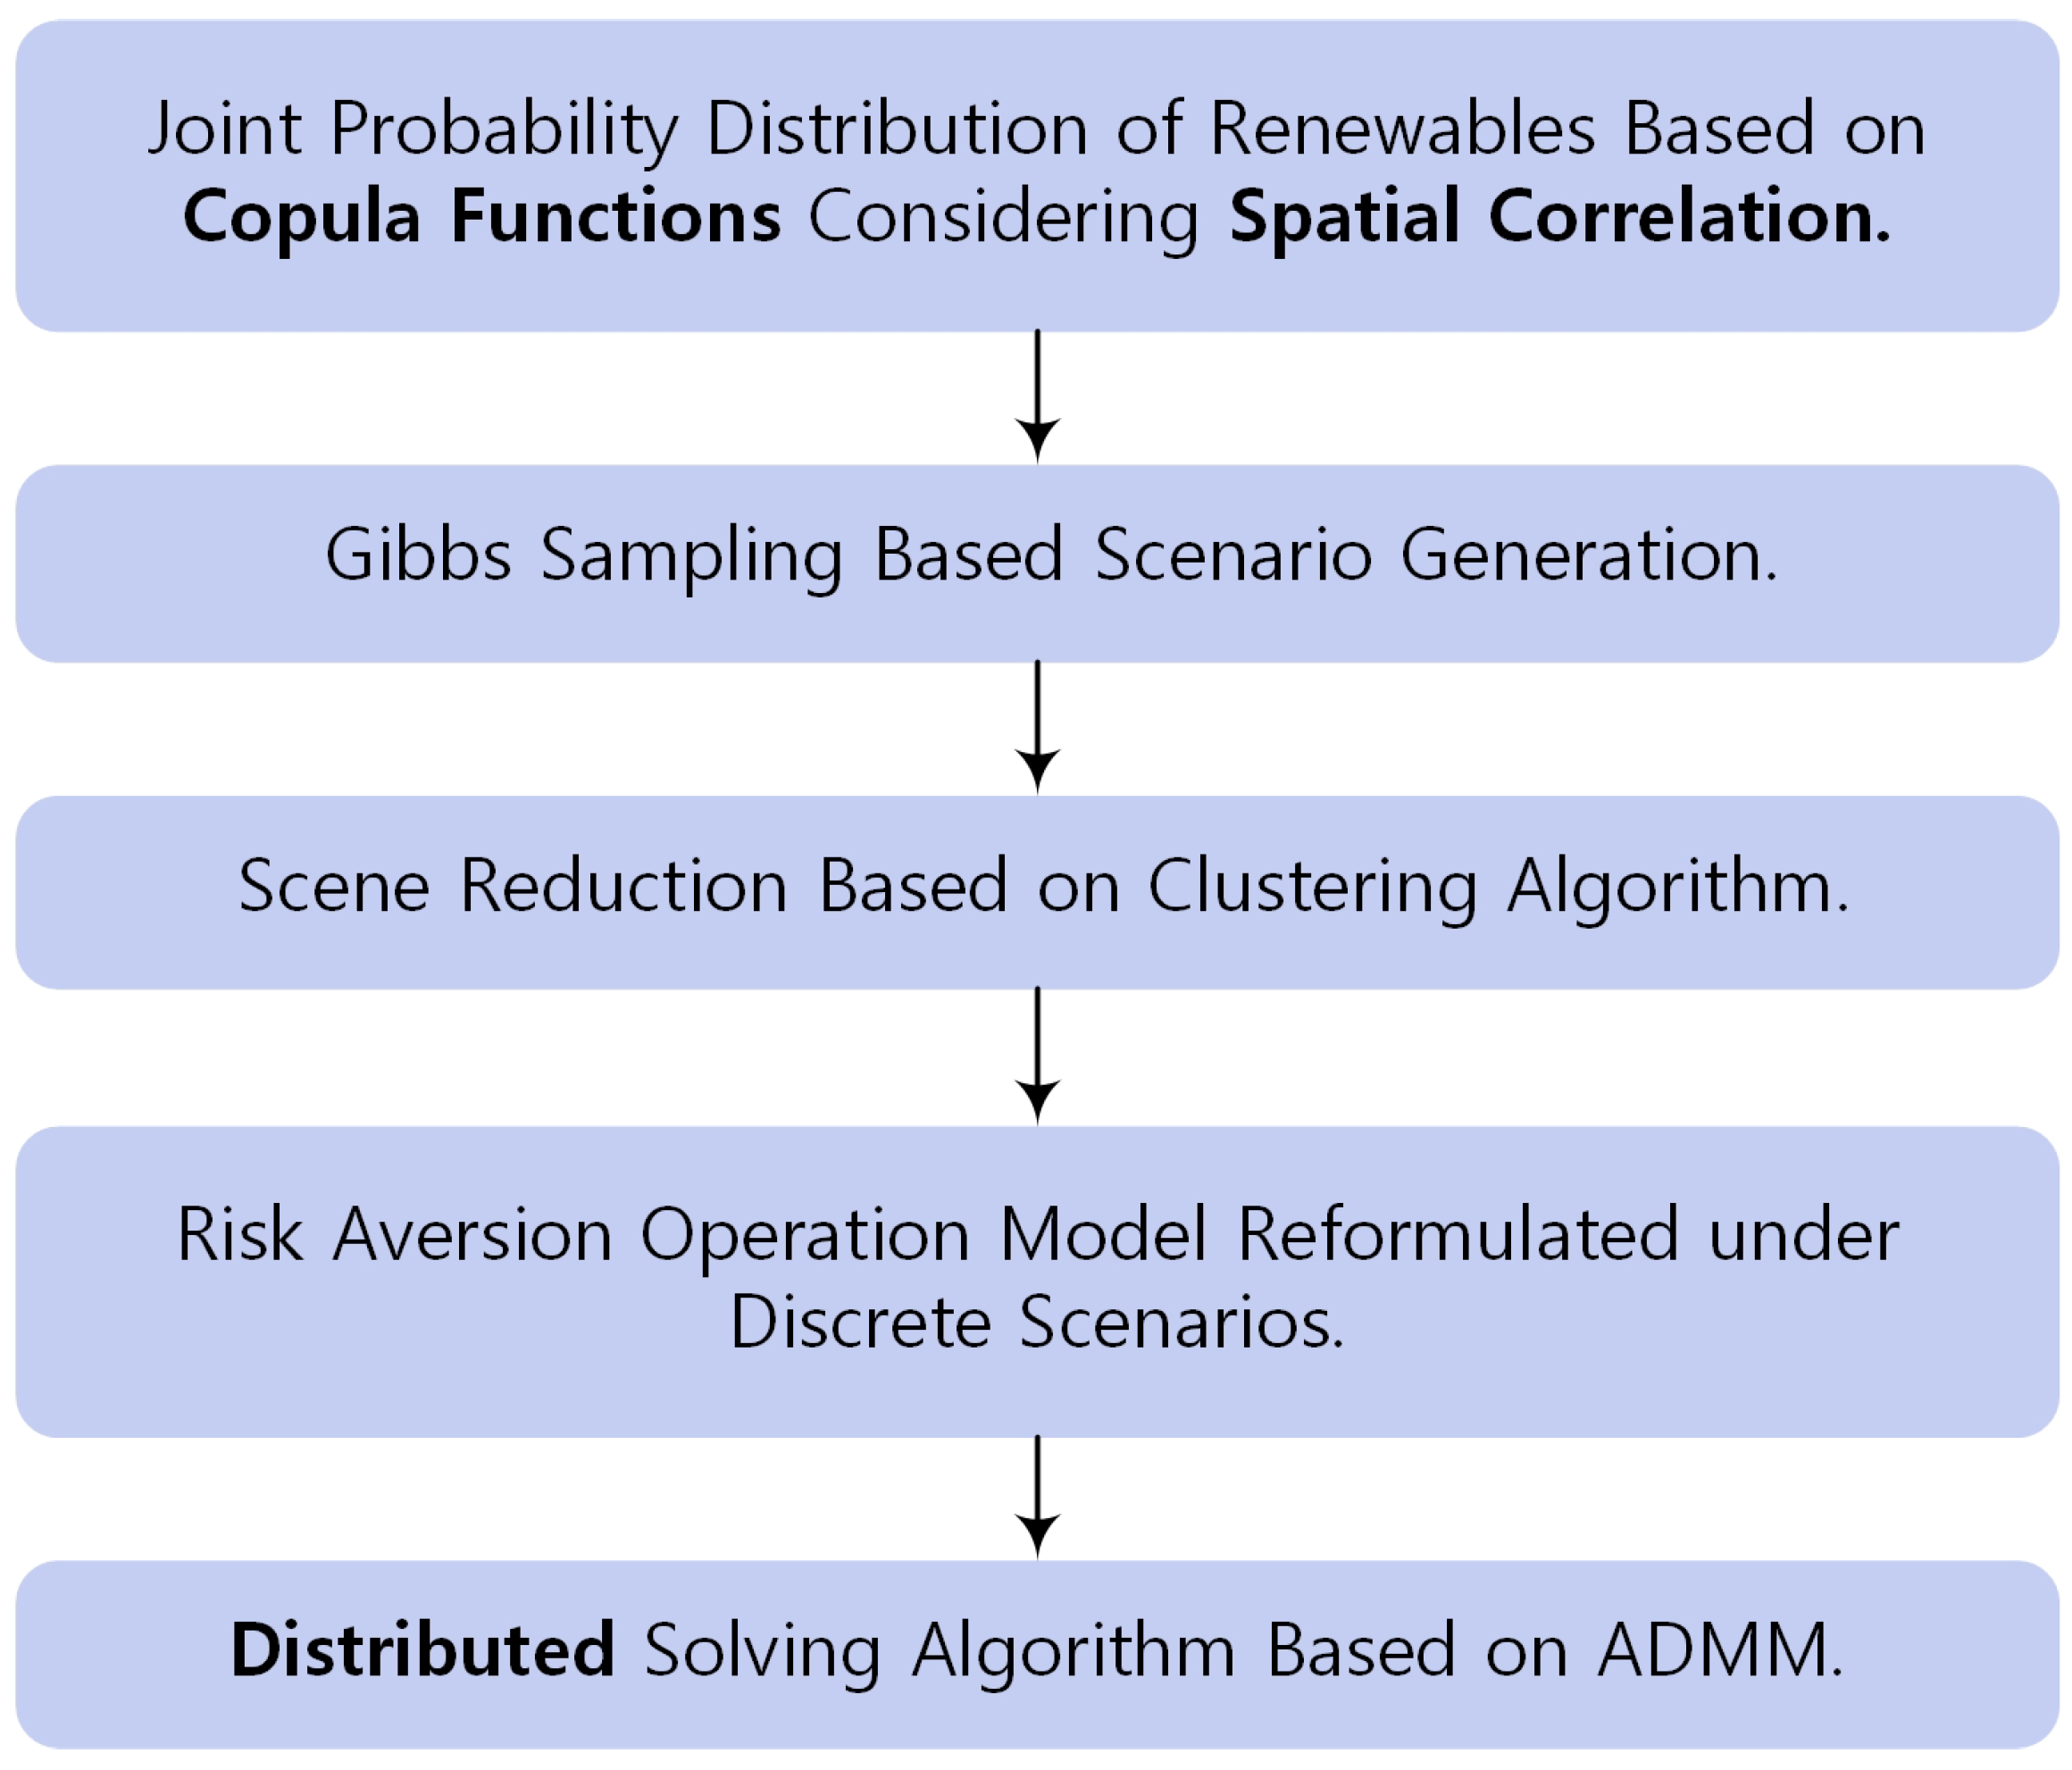
4. Solution Methodology
4.1. Typical Scenario-Based Problem Reformulation
| Algorithm 1: Basic process of FCM |
Initialize parameters 1: Initialize the number of cluster centers C, the ambiguity index m, the membership degree matrix Iterative calculation 2: do 3: Calculate cluster center according to (18). 4: Update membership-degree matrix U according to (17). 5: until , denotes the iterative index. |
4.2. ADMM-Based Distribution Algorithm
| Algorithm 2: Distributed algorithm for risk-aversion operation optimization problem of the HWSS system |
Initialize variables 1: Initialize all , , . Particularly, is calculated using the historical data of renewable energy generation and power-flow calculation. 2: Initialize iteration index Iterative calculation 3: do 4: Each bus i updates according to (26a). 5: Each bus i updates according to (26b). 6: Each bus i updates according to (26c). 7: Update iteration index . 8: until and |
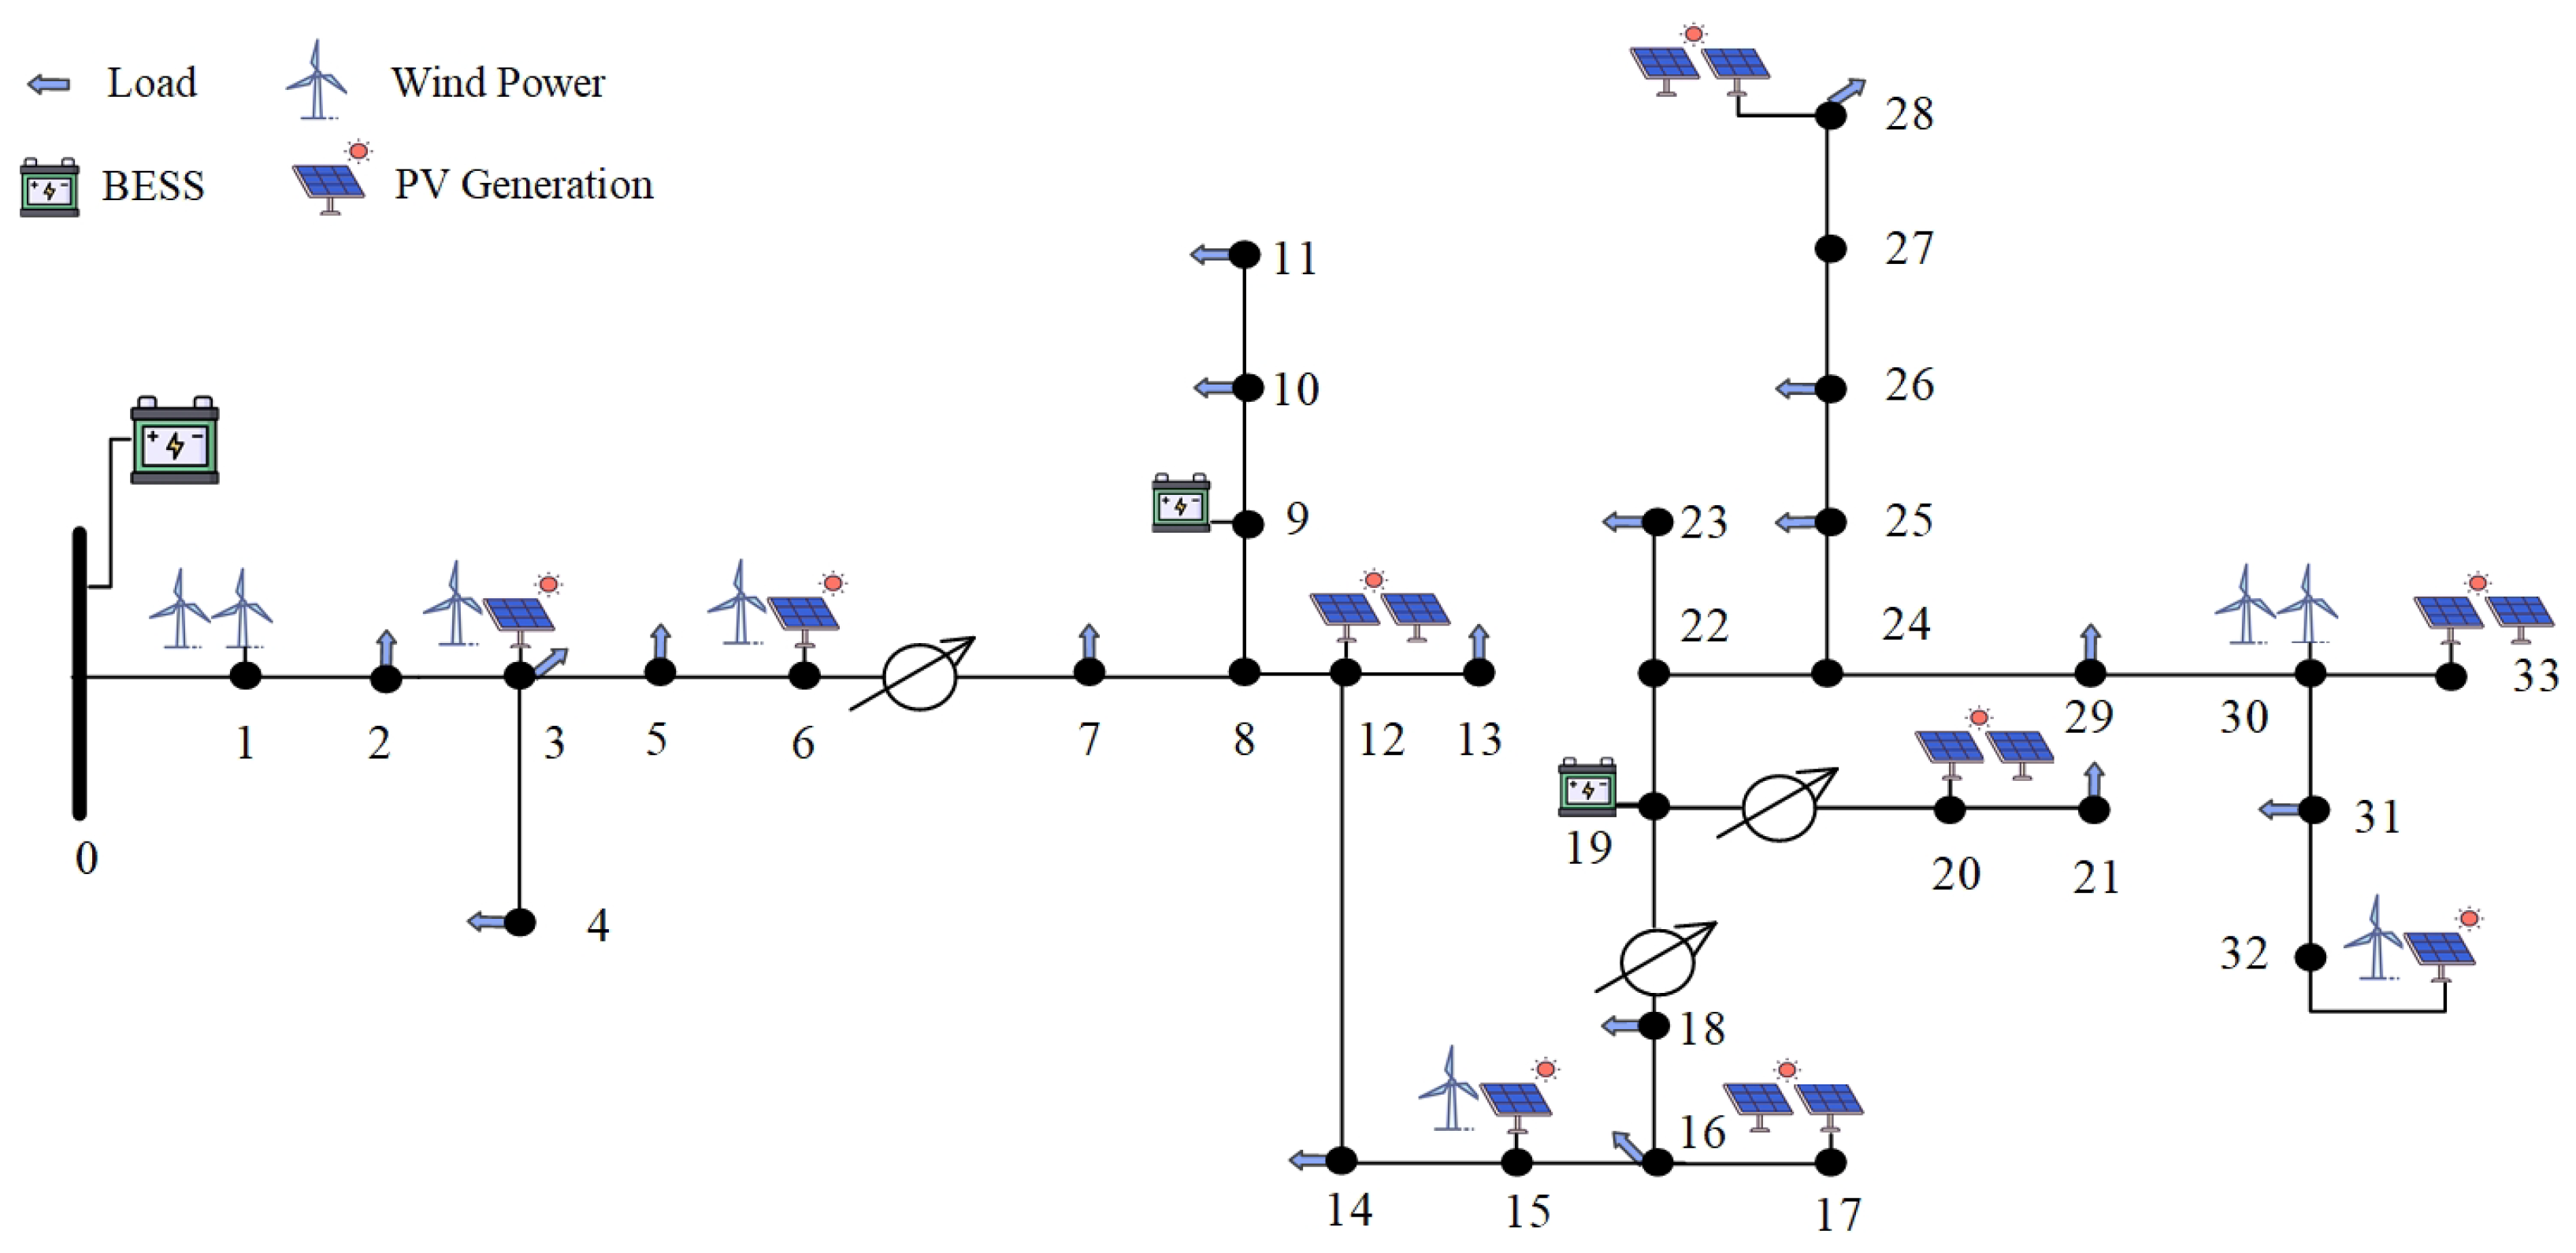
5. Case Study
5.1. System Configuration
5.2. Correlation Analysis
5.3. Performance on Uncertainty Risk Aversion
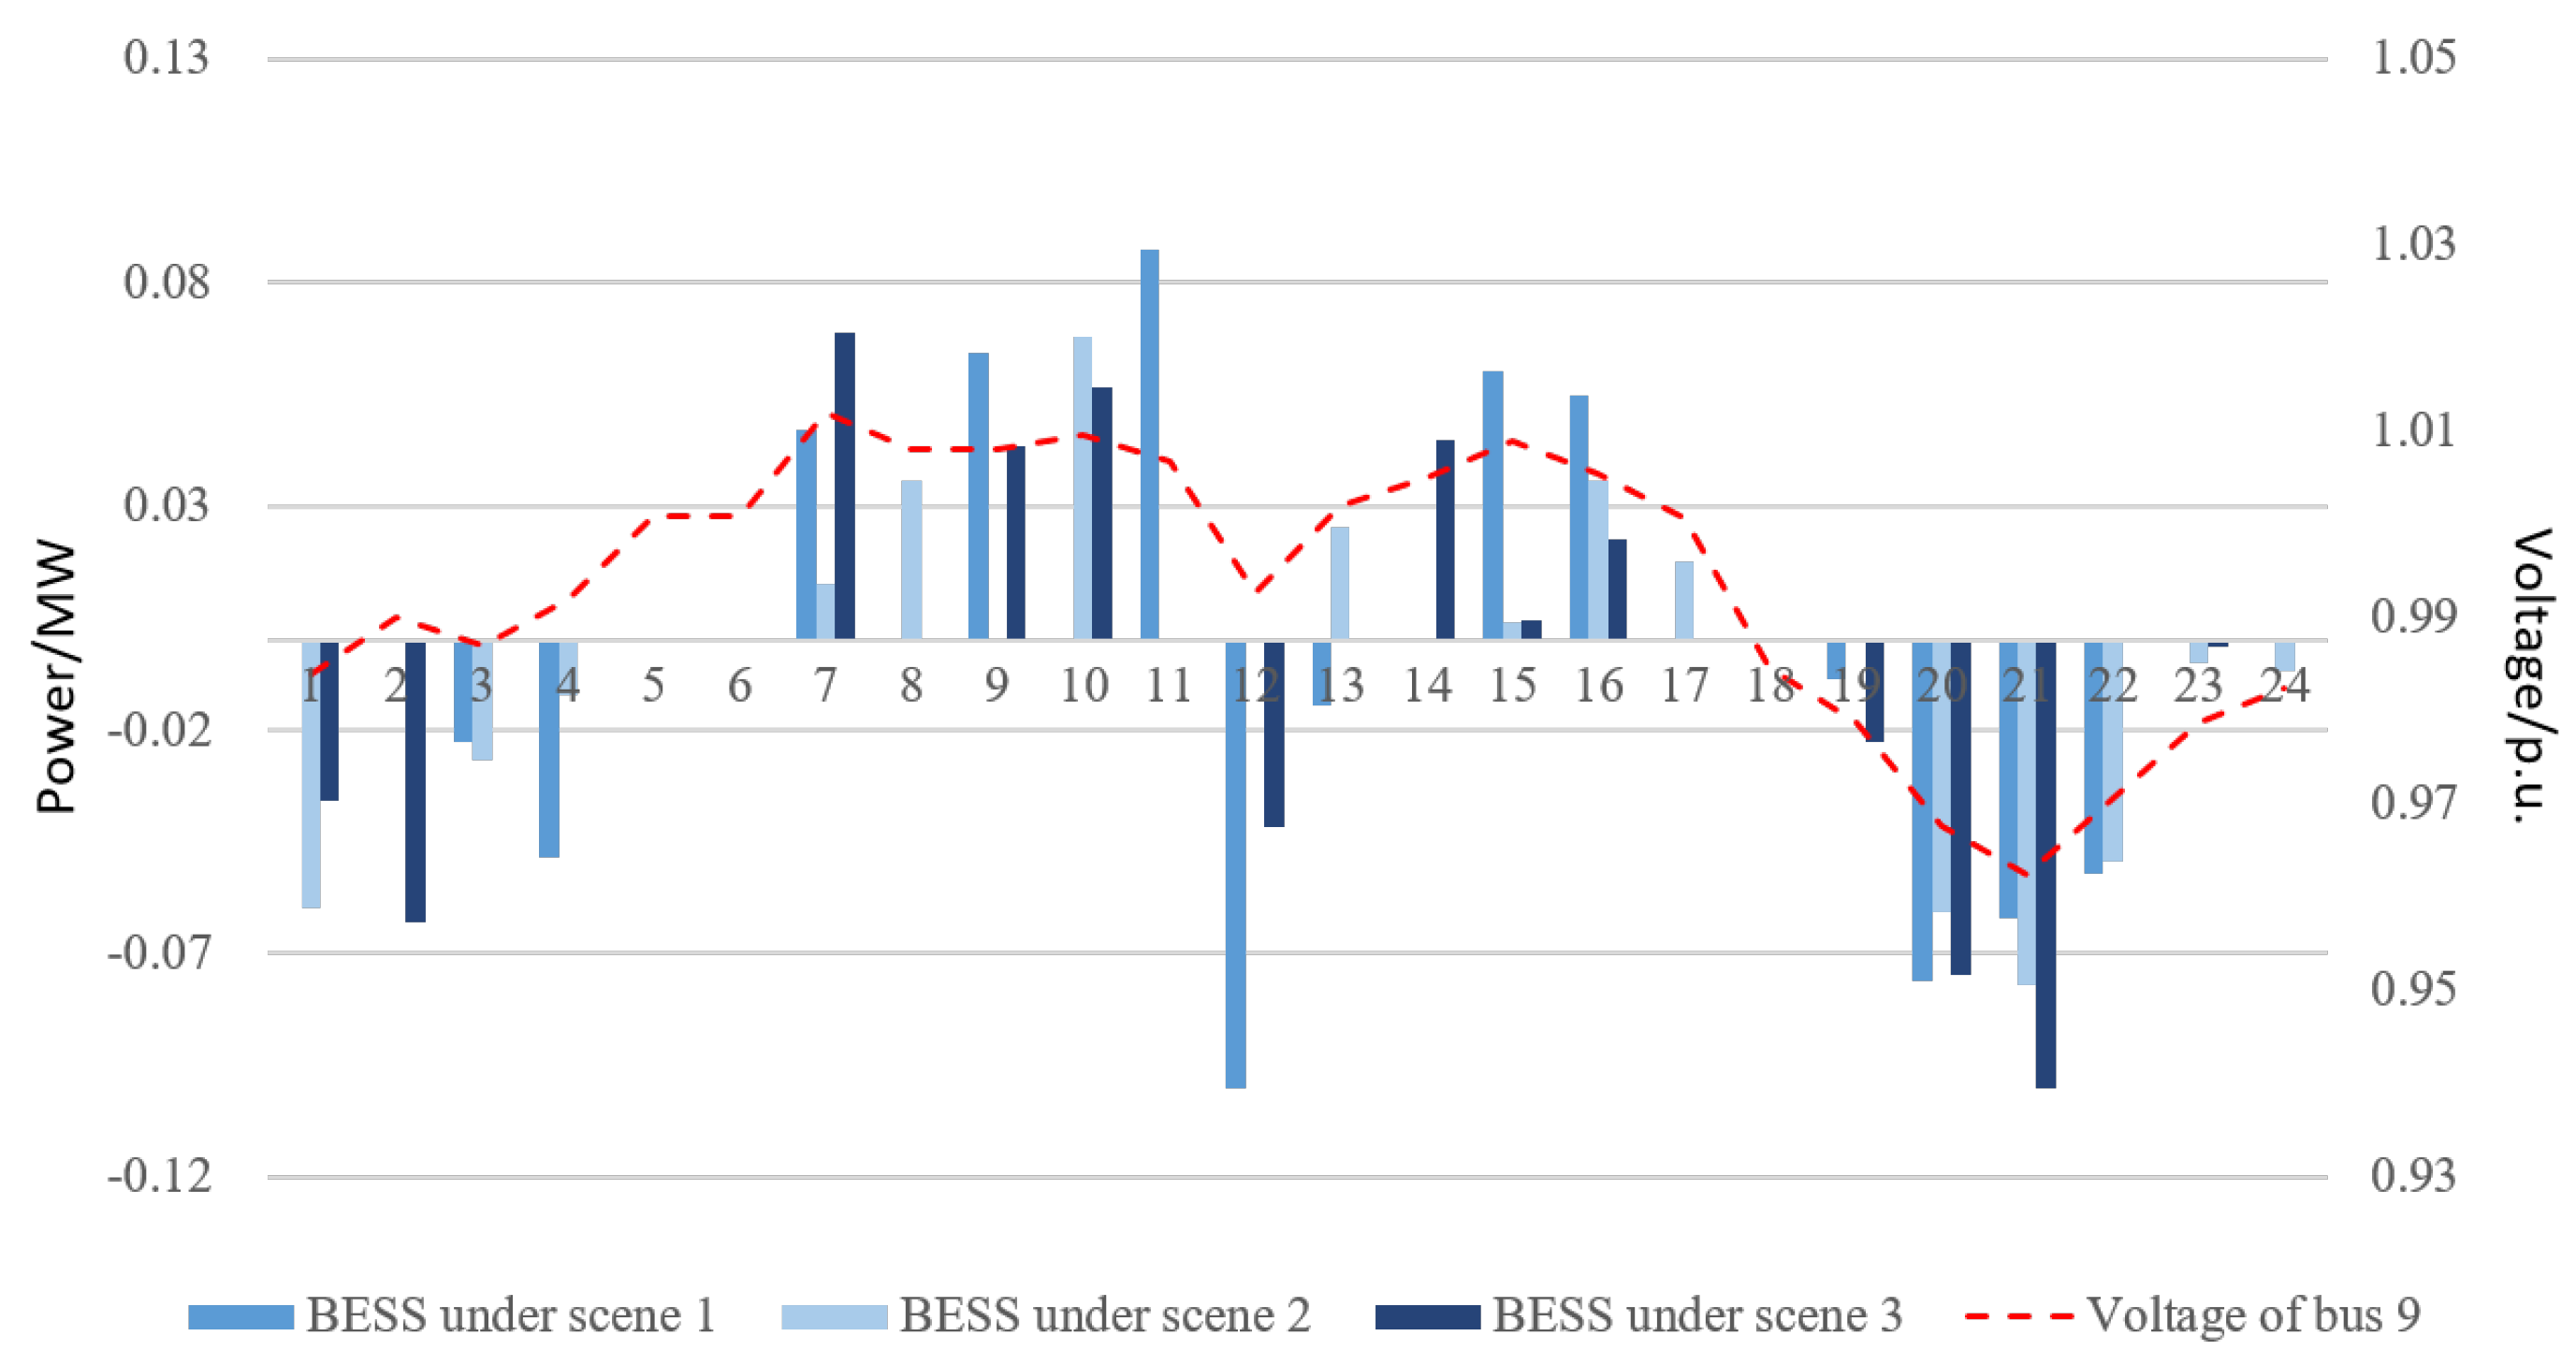
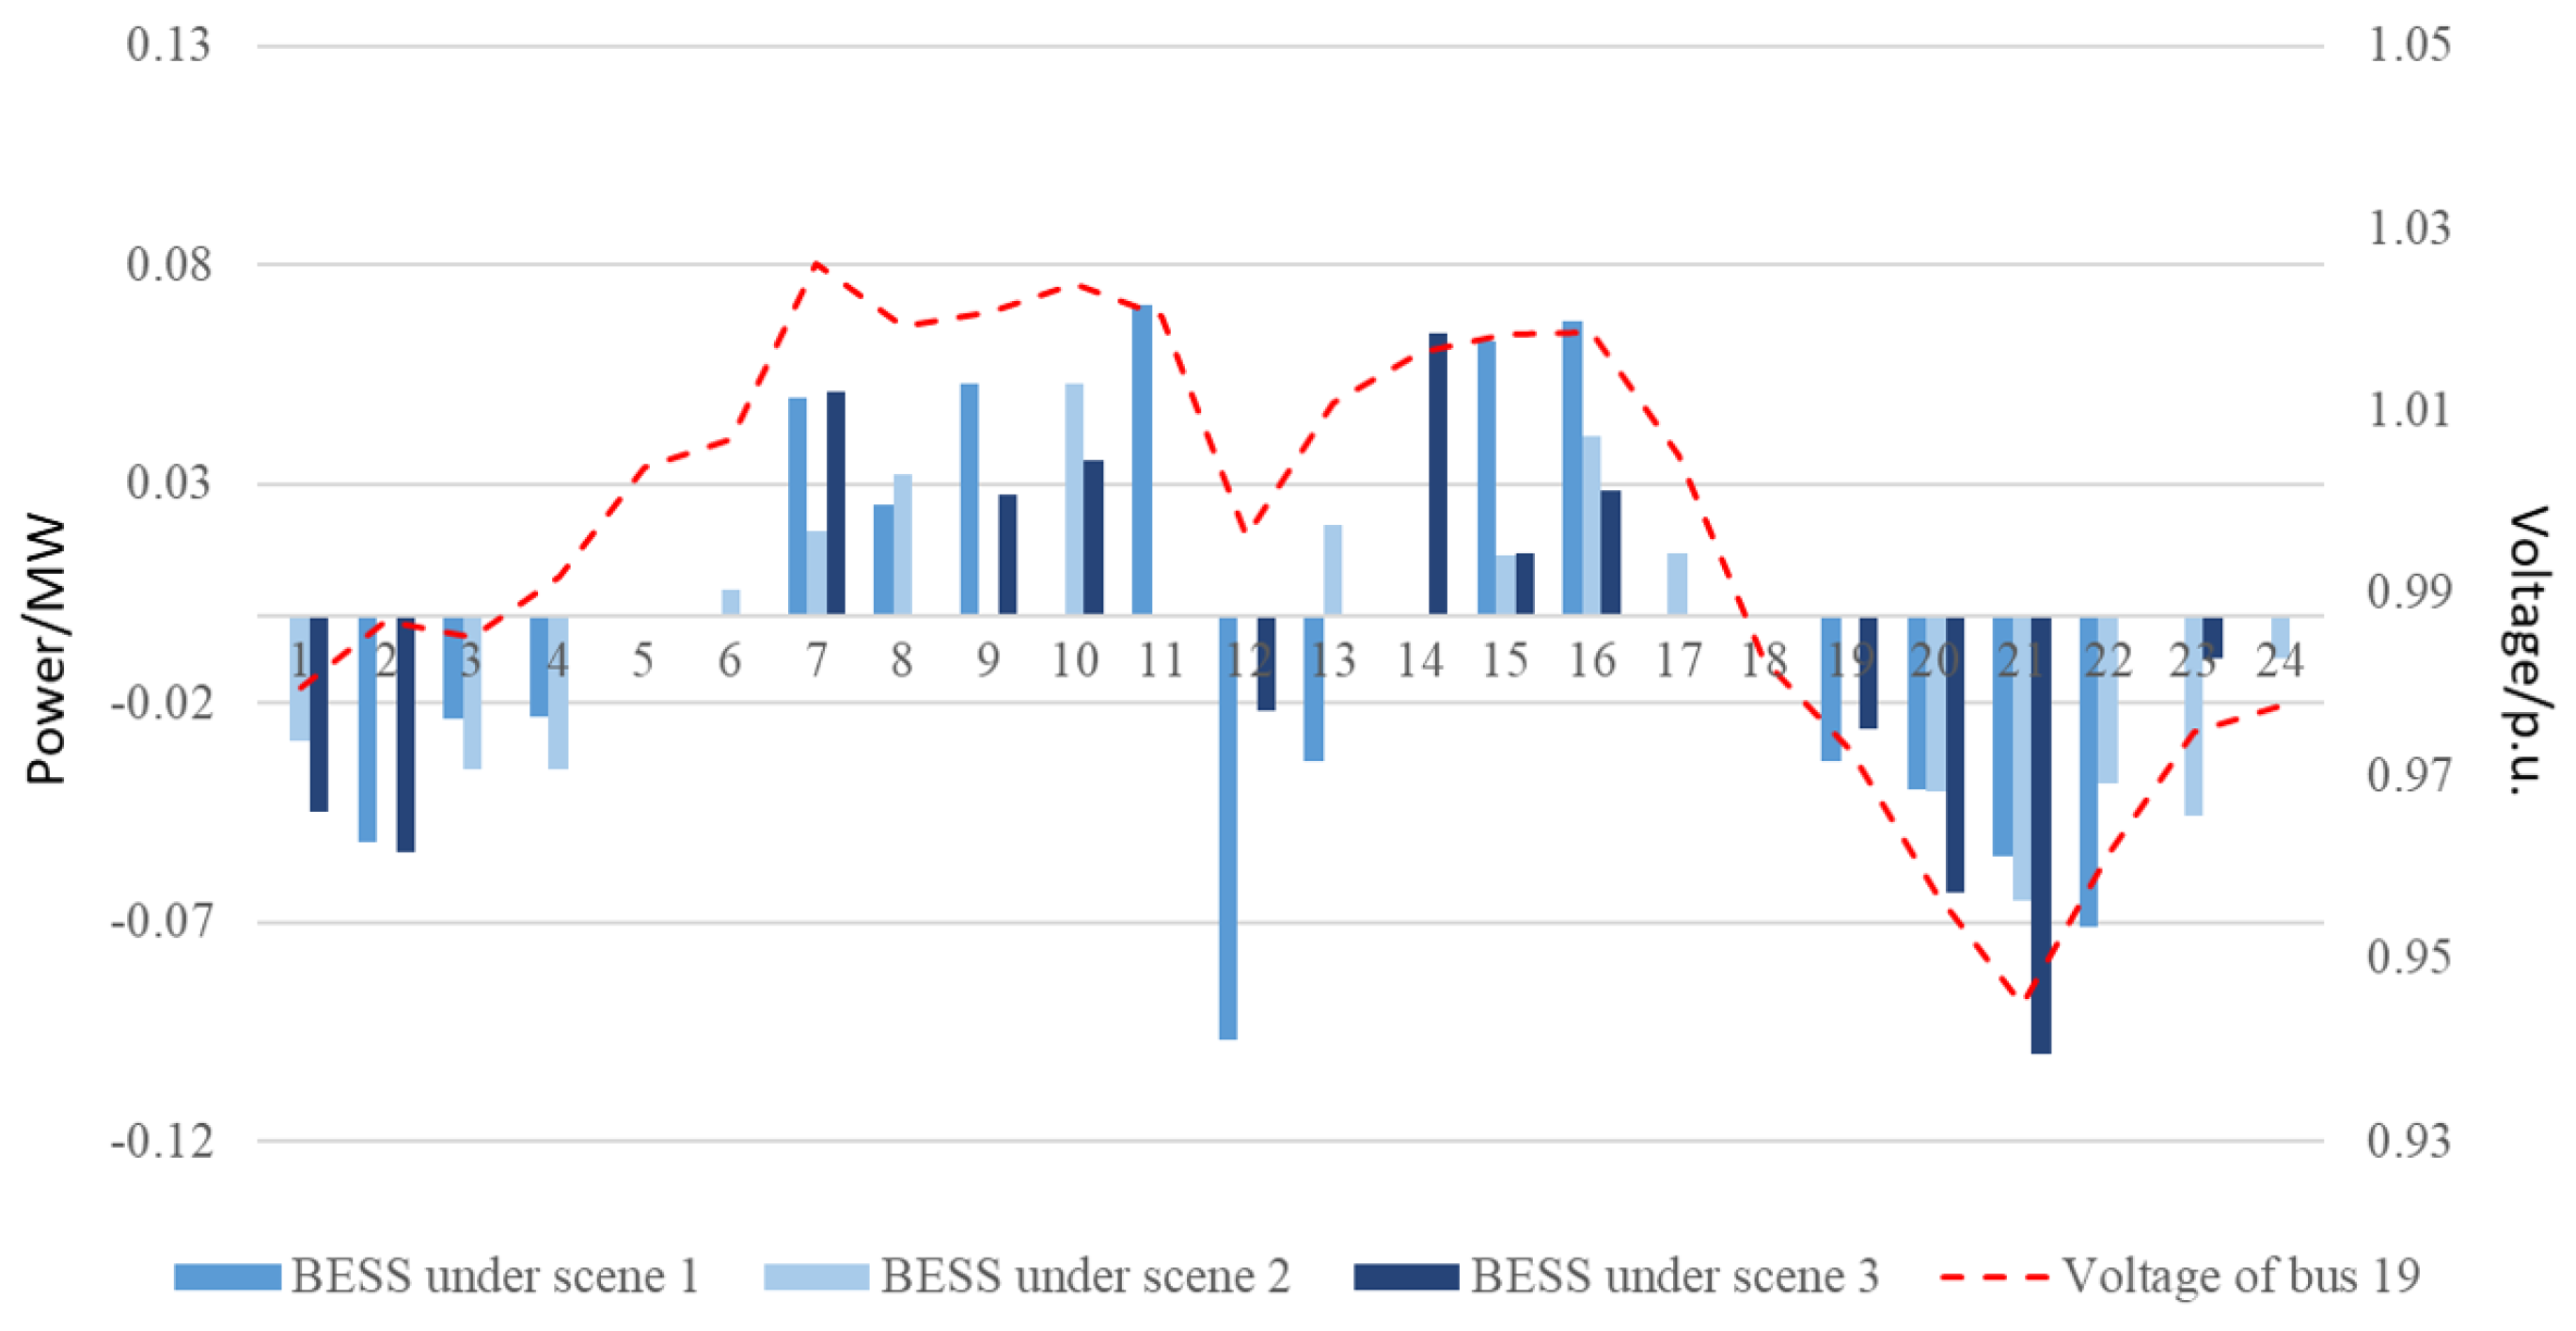
5.4. Voltage Regulation Effectiveness
5.5. Sensitivity Analysis
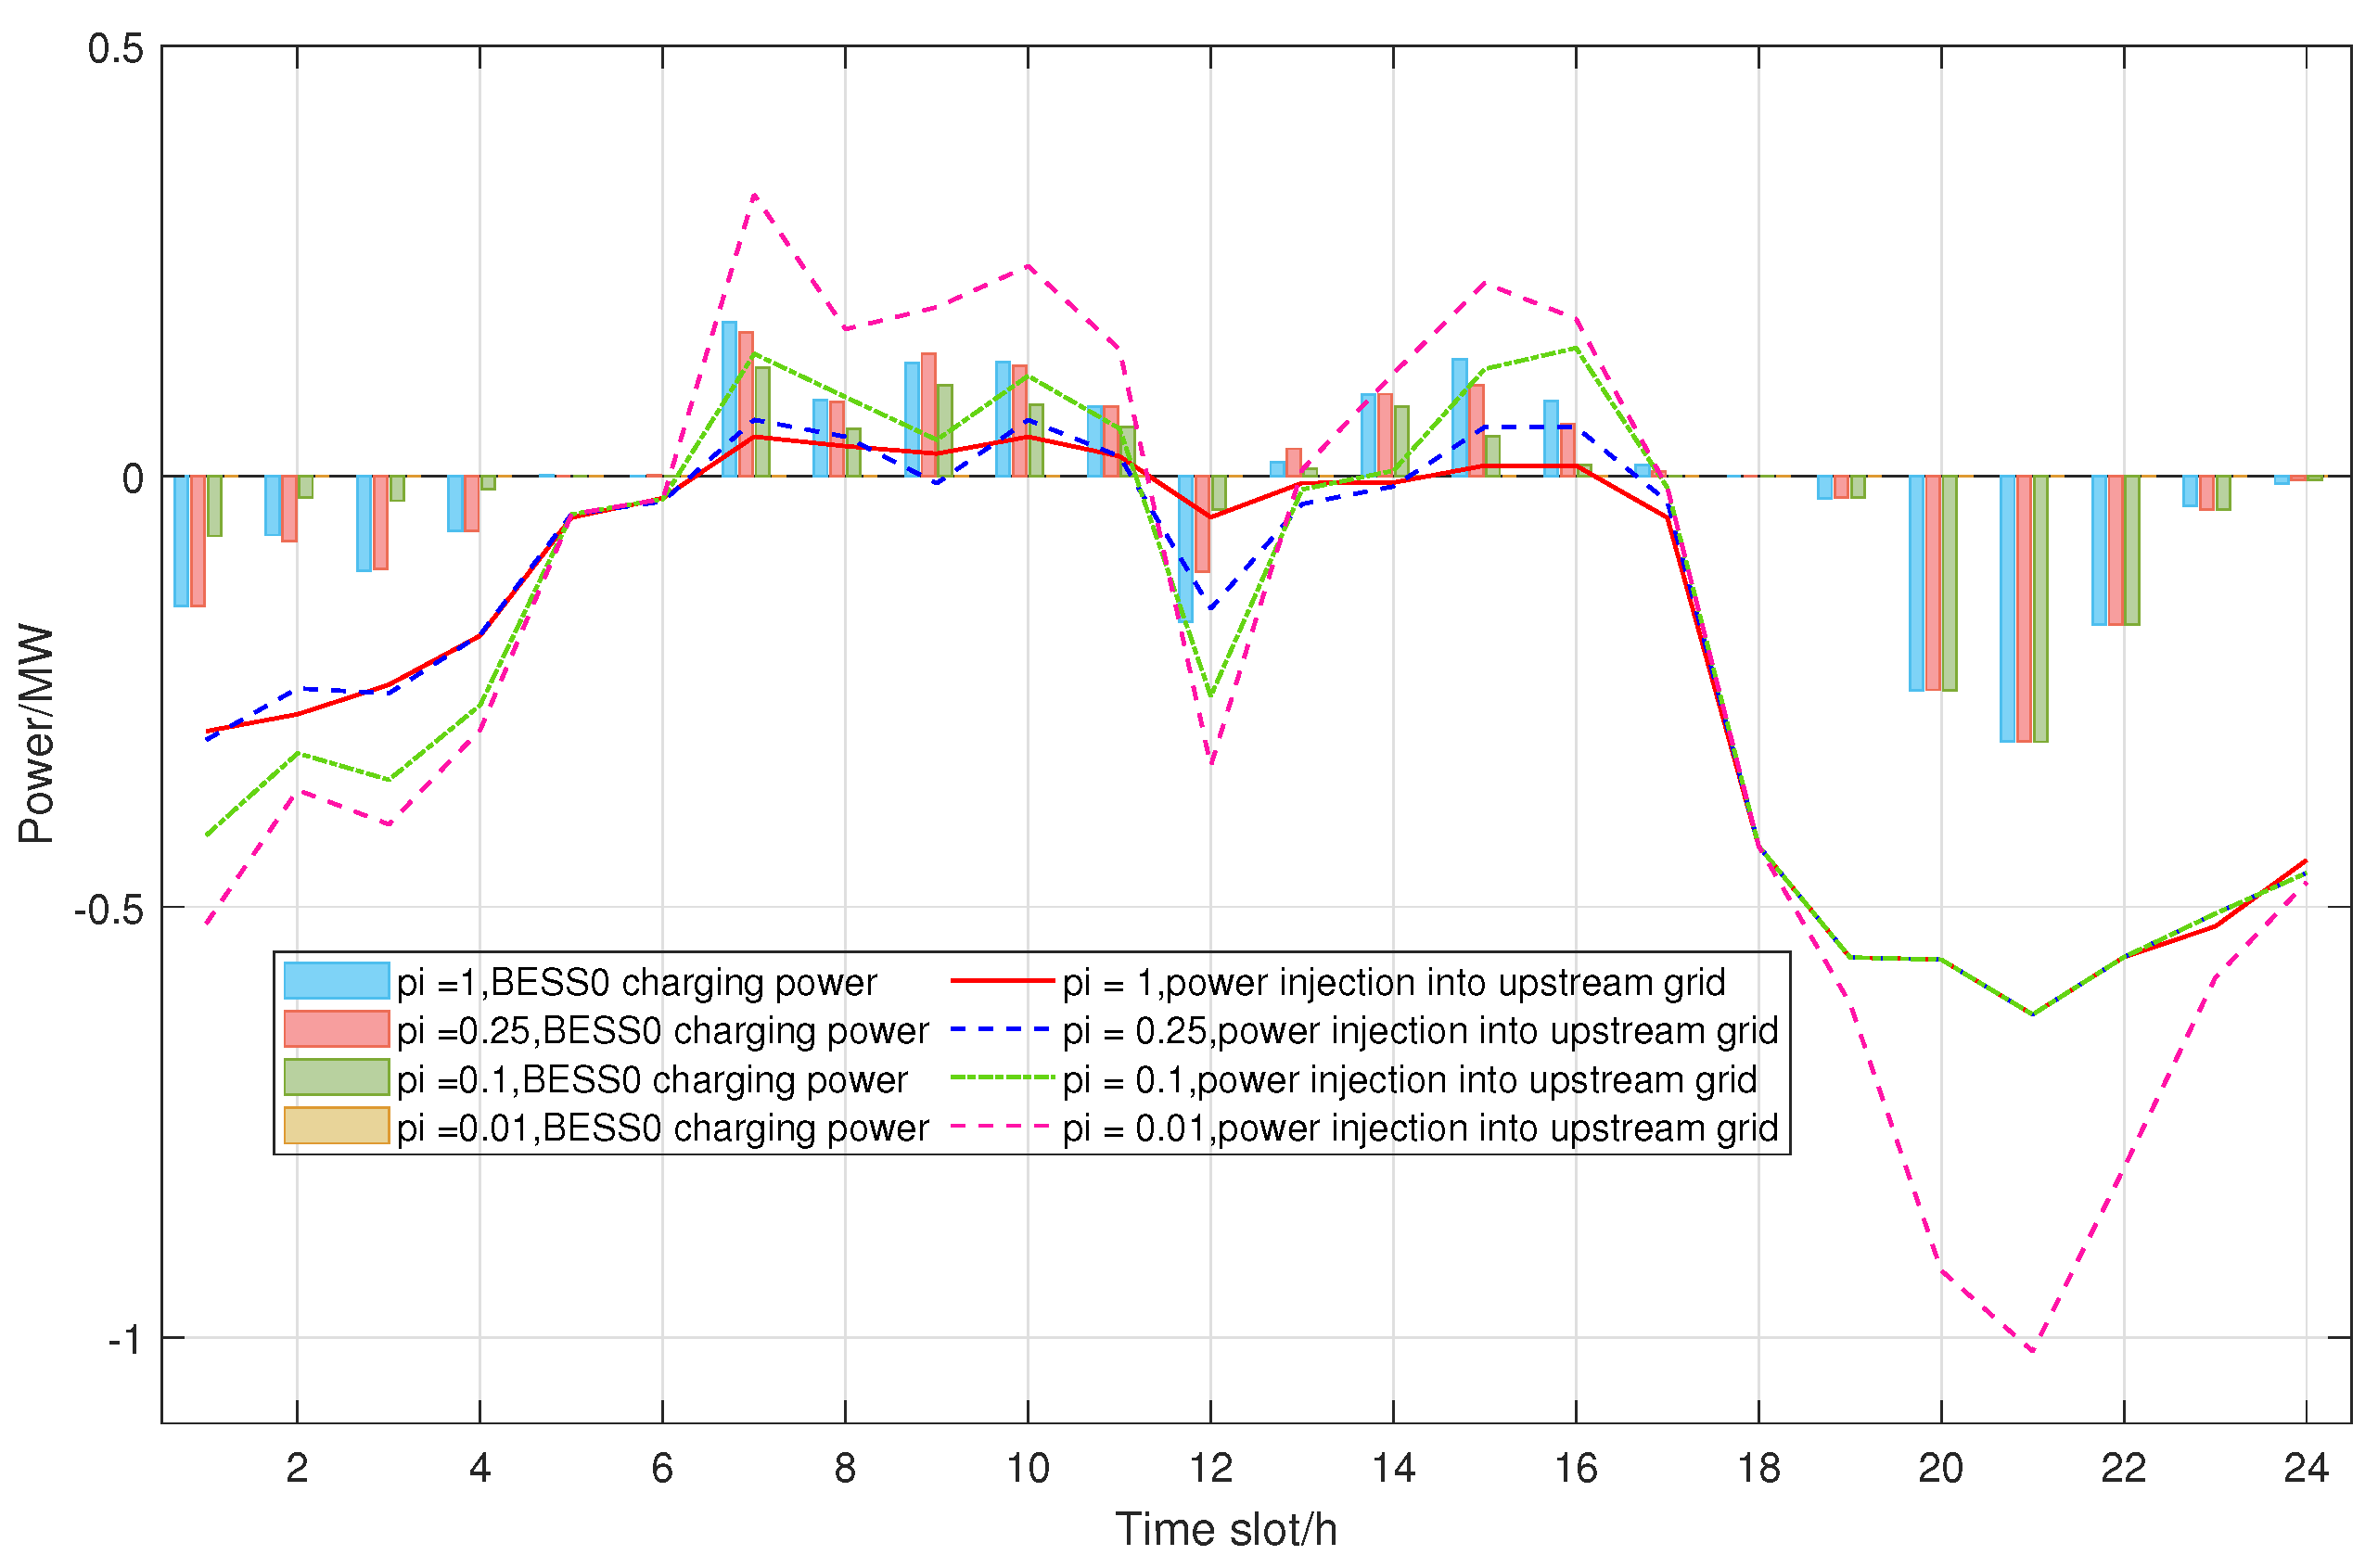
5.5.1. Penalty Coefficient for Exchanging Energy with Upstream Grid
5.5.2. The Risk-Preference Coefficient of HWSS System
5.5.3. The Confidence Level of CVaR
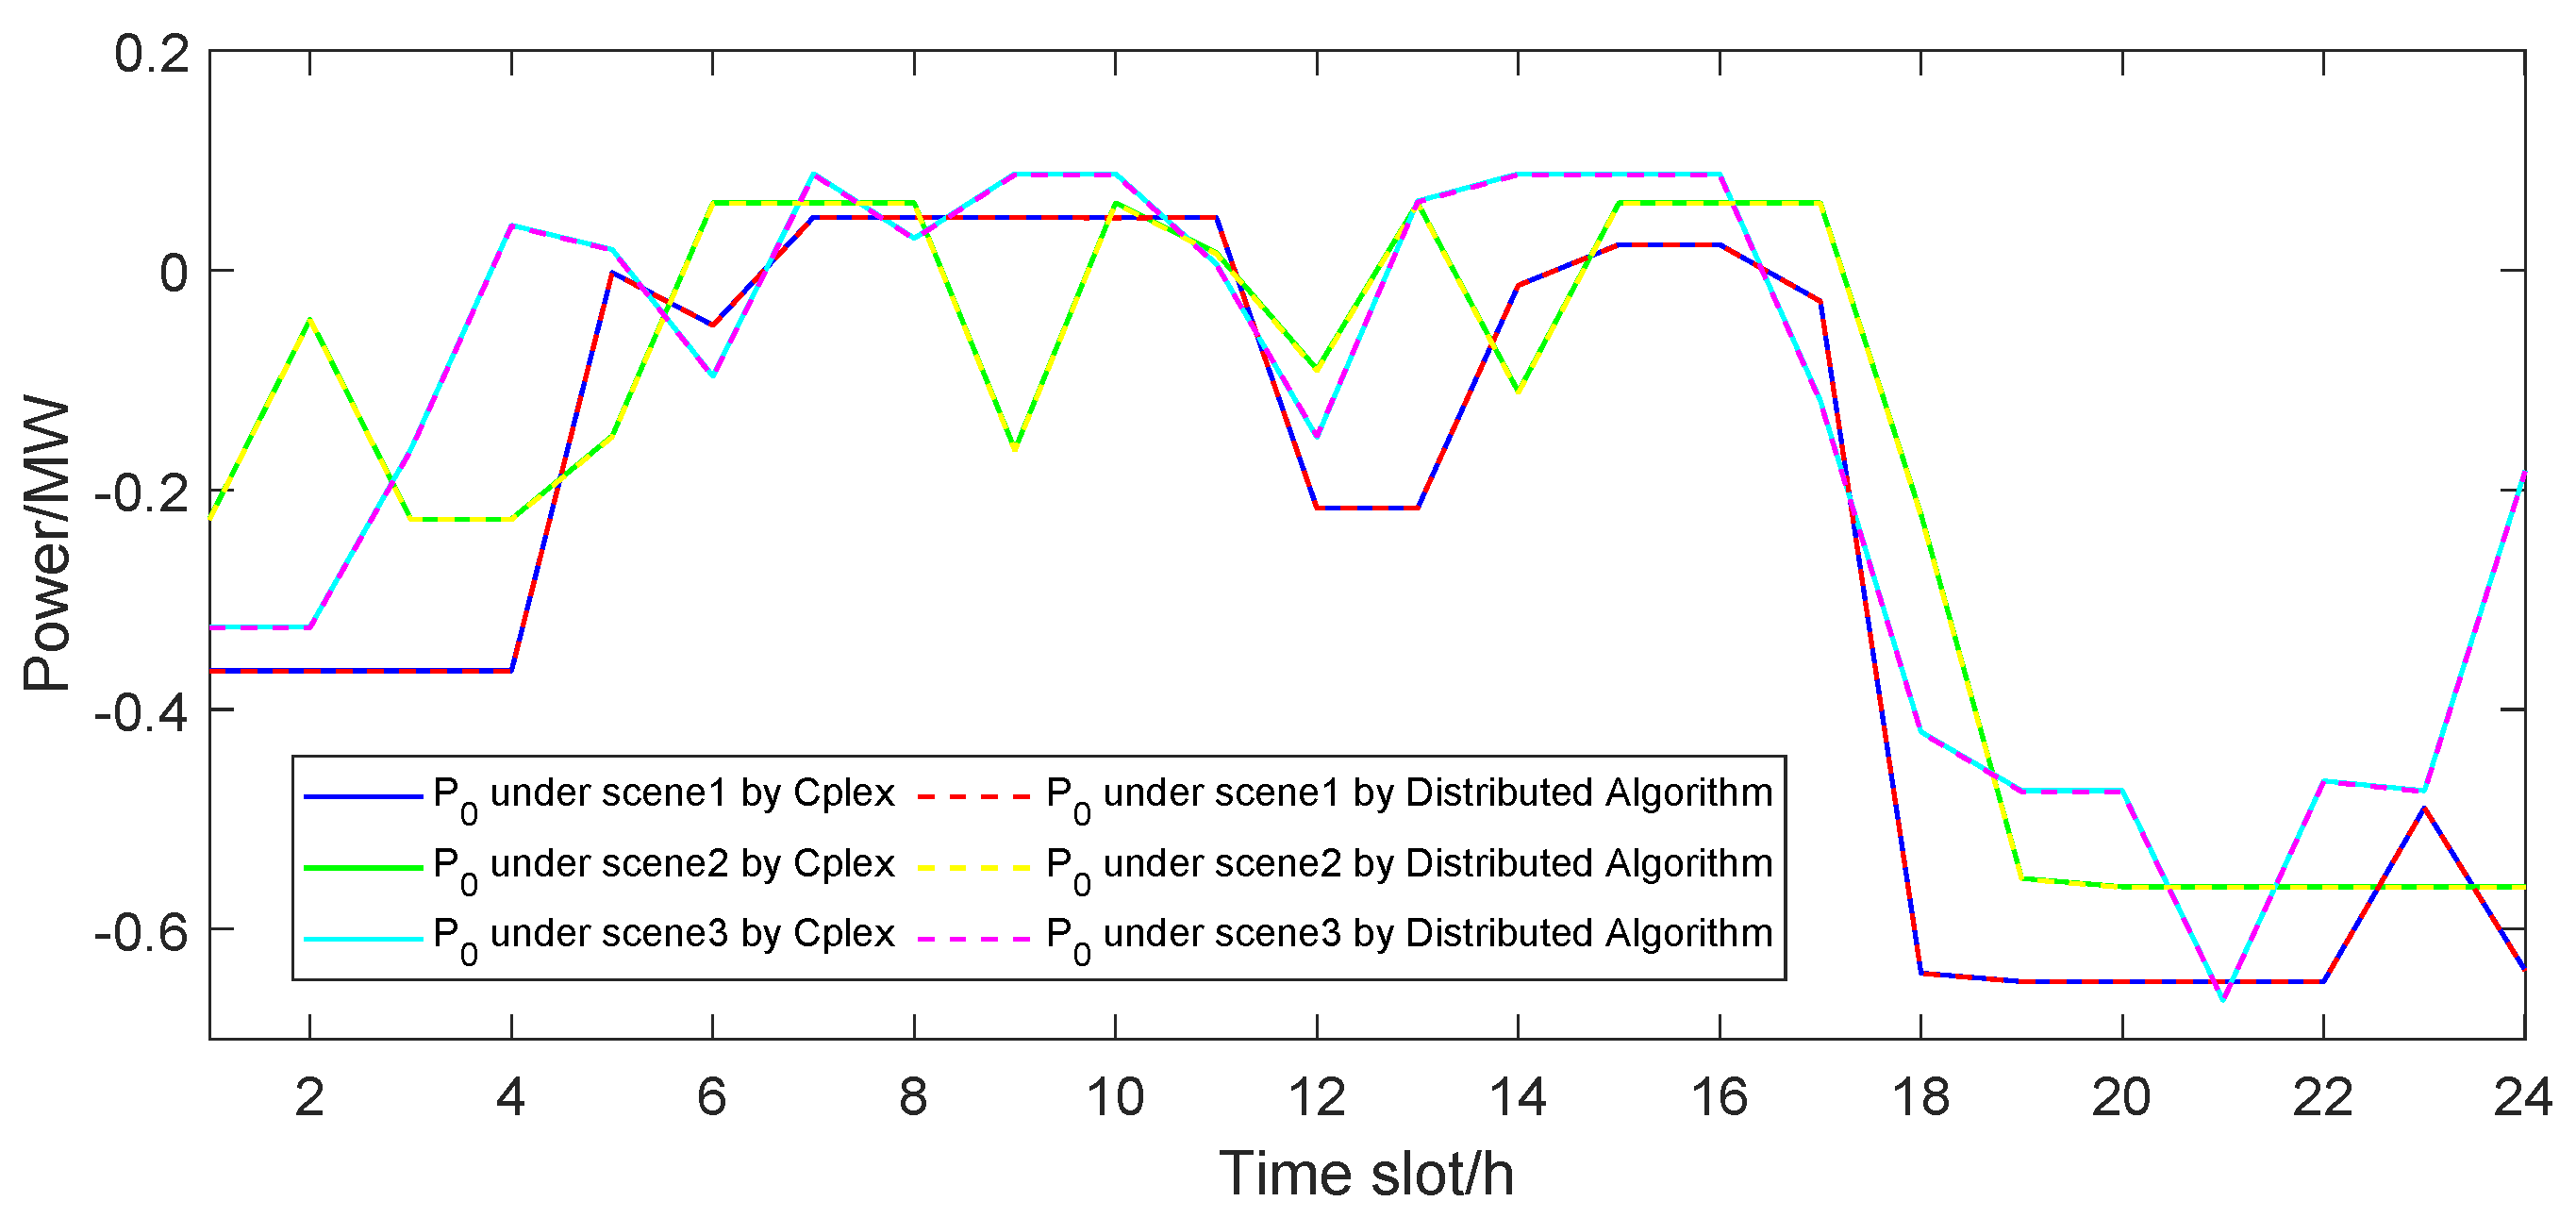
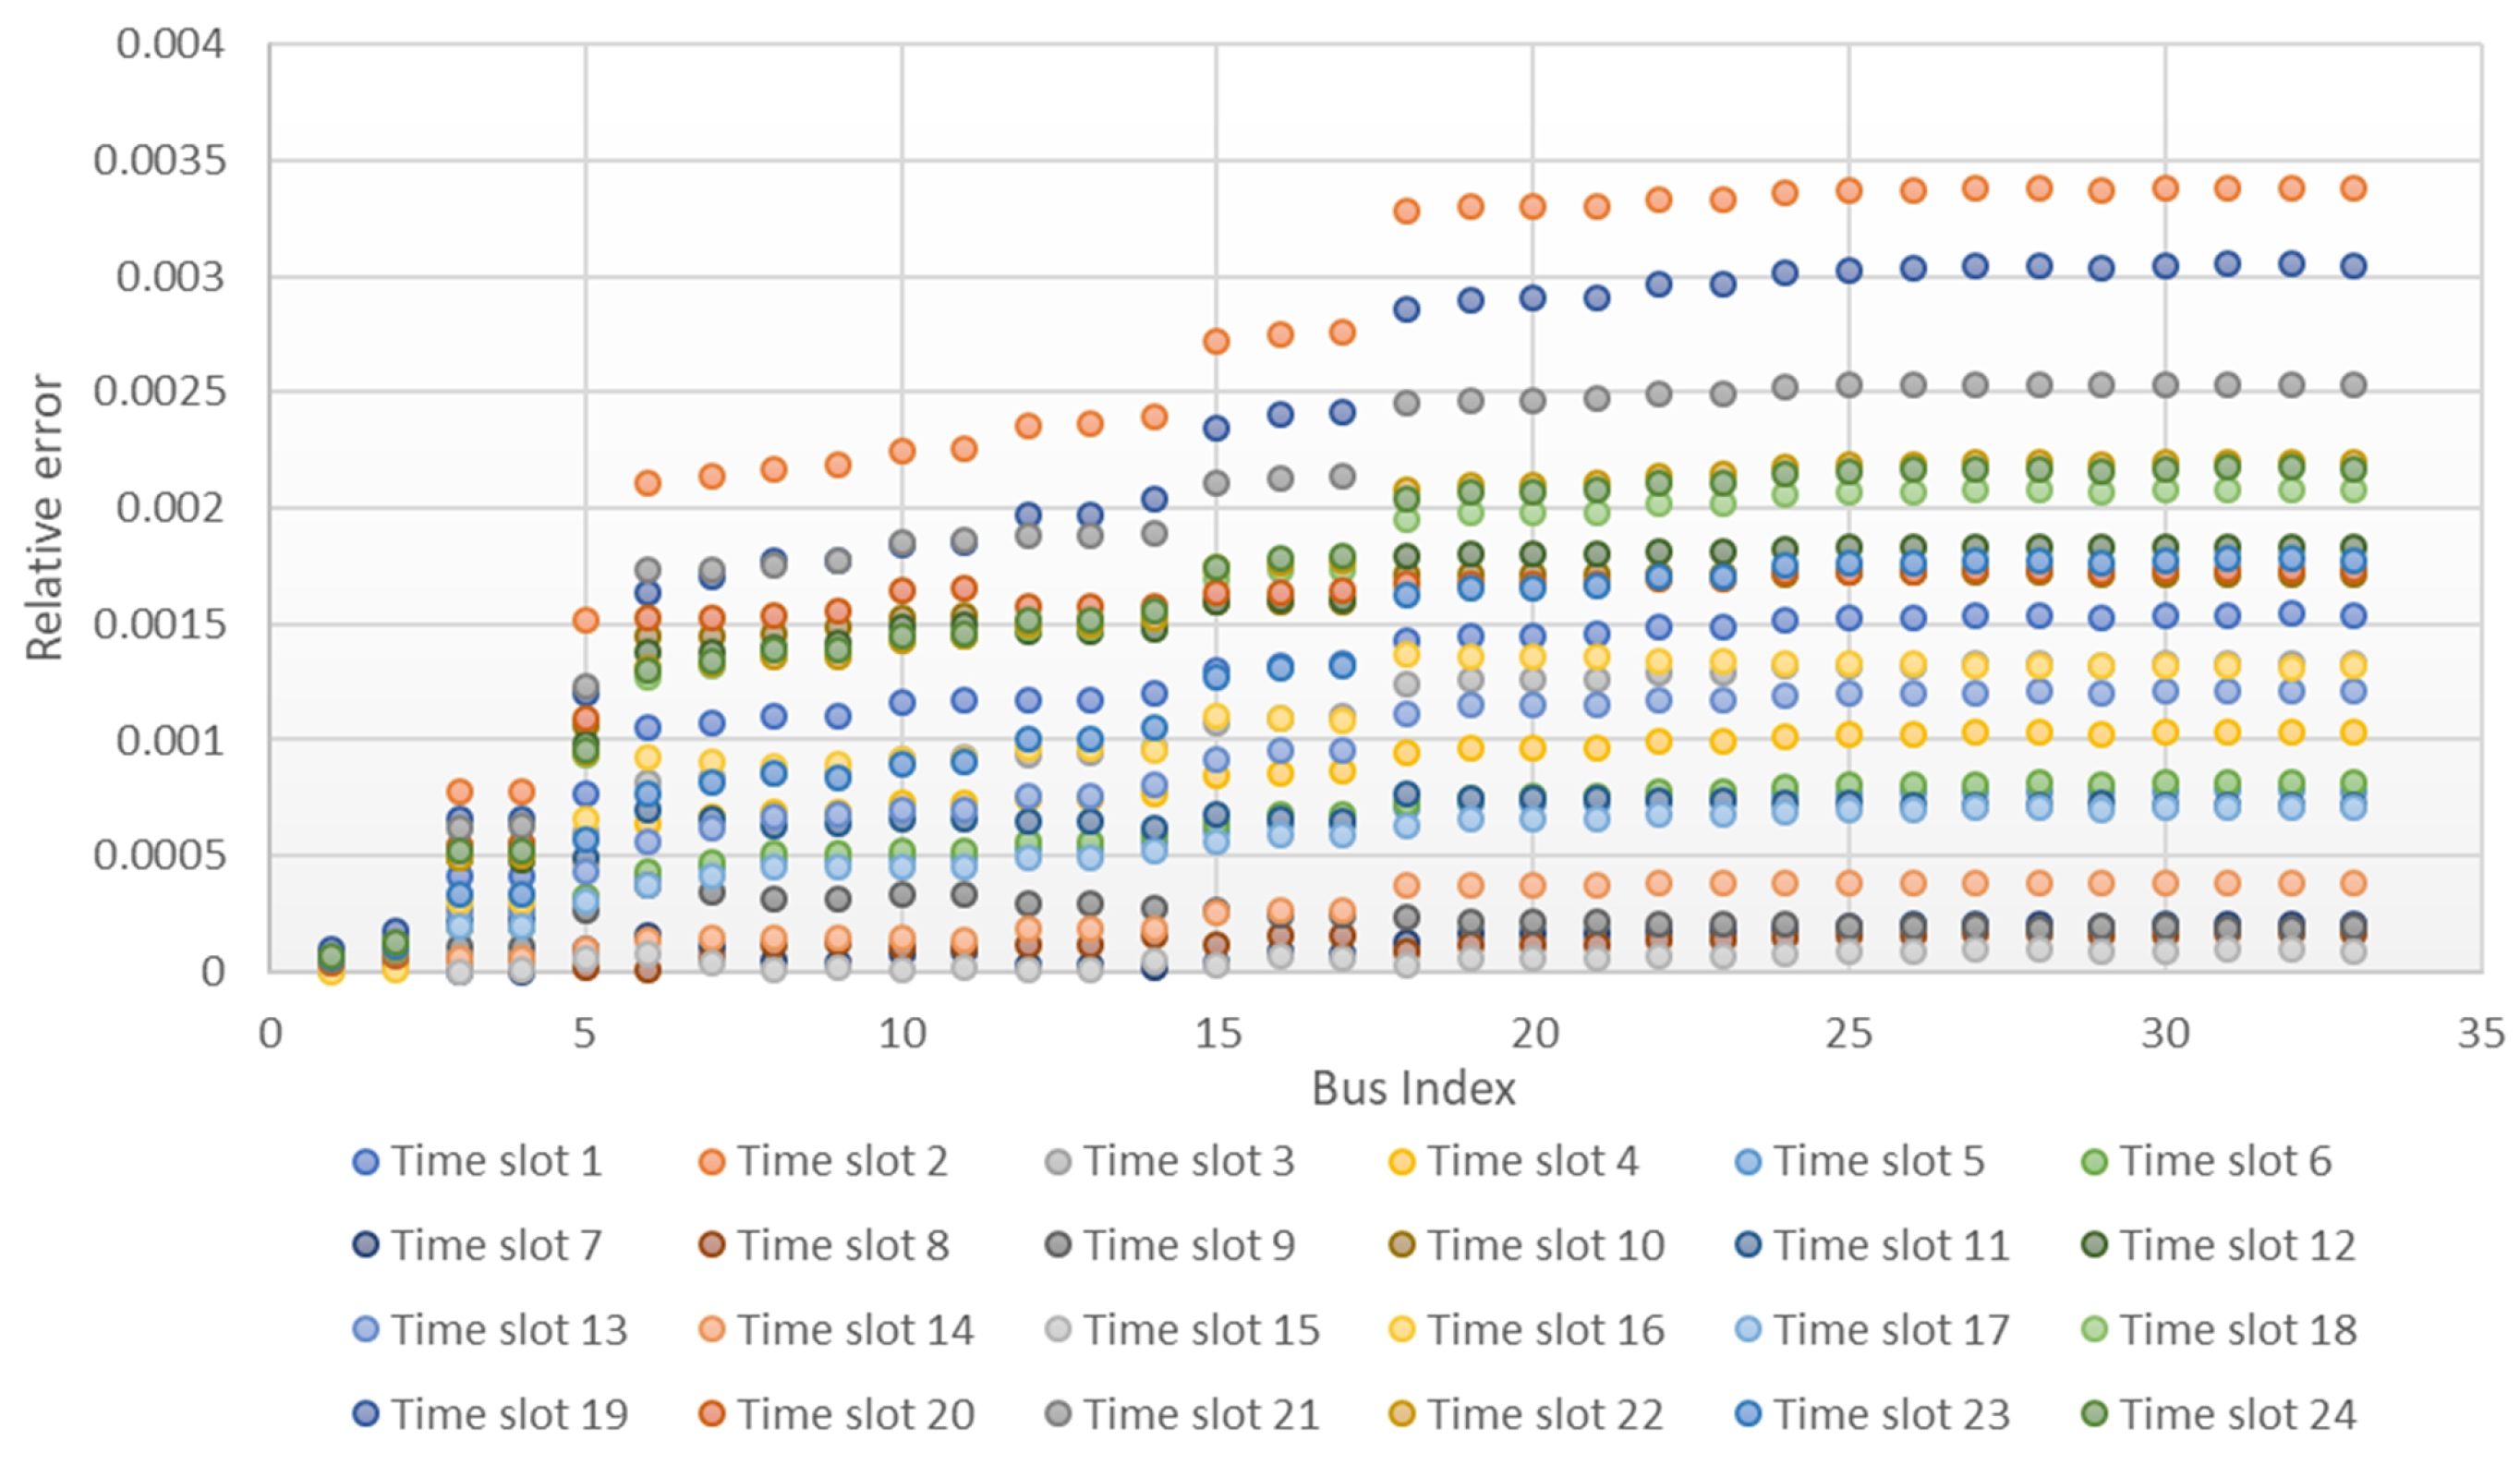
5.6. Effectiveness of Distributed Algorithm
6. Discussion
Author Contributions
Funding
Data Availability Statement
Conflicts of Interest
Abbreviations
| HWSS | Hybrid Wind–Solar–Storage |
| REG | Renewable energy generation |
| DRO | Distributionally robust optimization |
| CVaR | Conditional value at risk |
| ADMM | Alternating-direction method of multipliers |
| PV | Photovoltaic |
| WG | Wind Generation |
| BESS | Battery energy-storage system |
| Probability Density Functions | |
| CDF | Cumulative Distribution Function |
| FCM | Fuzzy C-Means |
| PSO | Particle Swarm Optimization |
| CHP | Combined Heating and Power |
| NLP | Non-Linear Programming |
| DR | Demand Response |
References
- World Energy Outlook 2023—Analysis. Available online: https://www.iea.org/reports/world-energy-outlook-2023 (accessed on 20 May 2024).
- Ren, G.; Wan, J.; Liu, J.; Yu, D. Spatial and Temporal Assessments of Complementarity for Renewable Energy Resources in China. Energy 2019, 177, 262–275. [Google Scholar] [CrossRef]
- Khare, V.; Nema, S.; Baredar, P. Solar–Wind Hybrid Renewable Energy System: A Review. Renew. Sustain. Energy Rev. 2016, 58, 23–33. [Google Scholar] [CrossRef]
- Ren, G.; Liu, J.; Wan, J.; Wang, W.; Fang, F.; Hong, F.; Yu, D. Investigating the Complementarity Characteristics of Wind and Solar Power for Load Matching Based on the Typical Load Demand in China. IEEE Trans. Sustain. Energy 2022, 13, 778–790. [Google Scholar] [CrossRef]
- Han, S.; Zhang, L.n.; Liu, Y.Q.; Zhang, H.; Yan, J.; Li, L.; Lei, X.H.; Wang, X. Quantitative Evaluation Method for the Complementarity of Wind–Solar–Hydro Power and Optimization of Wind–Solar Ratio. Appl. Energy 2019, 236, 973–984. [Google Scholar] [CrossRef]
- Papaefthymiou, G.; Pinson, P. Modeling of Spatial Dependence in Wind Power Forecast Uncertainty. In Proceedings of the 10th International Conference on Probablistic Methods Applied to Power Systems, Boise, ID, USA, 24–28 June 2008; pp. 1–9. [Google Scholar]
- Papaefthymiou, G.; Kurowicka, D. Using Copulas for Modeling Stochastic Dependence in Power System Uncertainty Analysis. IEEE Trans. Power Syst. 2009, 24, 40–49. [Google Scholar] [CrossRef]
- Bhatti, M.I.; Do, H.Q. Recent Development in Copula and Its Applications to the Energy, Forestry and Environmental Sciences. Int. J. Hydrogen Energy 2019, 44, 19453–19473. [Google Scholar] [CrossRef]
- Li, B.; Wan, C.; Luo, F.; Yu, P.; Sun, M. A Bi-Level Transactive Control Model for Integrating Decision-Making and DLMP-pricing in Distribution Networks. IET Gener. Transm. Distrib. 2022, 16, 3814–3824. [Google Scholar] [CrossRef]
- Xu, Y.; Singh, C. Power System Reliability Impact of Energy Storage Integration With Intelligent Operation Strategy. IEEE Trans. Smart Grid 2014, 5, 1129–1137. [Google Scholar] [CrossRef]
- Gouveia, C.; Moreira, J.; Moreira, C.L.; Peças Lopes, J.A. Coordinating Storage and Demand Response for Microgrid Emergency Operation. IEEE Trans. Smart Grid 2013, 4, 1898–1908. [Google Scholar] [CrossRef]
- Huang, Y.; Mao, S.; Nelms, R.M. Adaptive Electricity Scheduling in Microgrids. IEEE Trans. Smart Grid 2014, 5, 270–281. [Google Scholar] [CrossRef]
- Li, X.; Geng, G.; Jiang, Q. A Hierarchical Energy Management Strategy for Grid-Connected Microgrid. In Proceedings of the 2014 IEEE PES General Meeting|Conference & Exposition, National Harbor, MD, USA, 27–31 July 2014; pp. 1–5. [Google Scholar] [CrossRef]
- Farzin, H.; Fotuhi-Firuzabad, M.; Moeini-Aghtaie, M. A Stochastic Multi-Objective Framework for Optimal Scheduling of Energy Storage Systems in Microgrids. IEEE Trans. Smart Grid 2017, 8, 117–127. [Google Scholar] [CrossRef]
- Liang, Z.; Chung, C.Y.; Zhang, W.; Wang, Q.; Lin, W.; Wang, C. Enabling High-Efficiency Economic Dispatch of Hybrid AC/DC Networked Microgrids: Steady-State Convex Bi-Directional Converter Models. IEEE Trans. Smart Grid 2025, 16, 45–61. [Google Scholar] [CrossRef]
- Ben-Haim, Y. Info-Gap Decision Theory: Decisions Under Severe Uncertainty; Elsevier: Amsterdam, The Netherlands, 2006. [Google Scholar]
- Ruszczyński, A.; Shapiro, A. Stochastic Programming Models. In Handbooks in Operations Research and Management Science; Elsevier: Amsterdam, The Netherlands, 2003. [Google Scholar]
- Ben-Tal, A.; Ghaoui, L.E.; Nemirovski, A. Robust Optimization; Princeton University Press: Princeton, NJ, USA, 2009. [Google Scholar]
- Rahimian, H.; Mehrotra, S. Distributionally Robust Optimization: A Review. Open J. Math. Optim. 2022, 3, 1–85. [Google Scholar] [CrossRef]
- Conejo, A.J.; Wu, X. Robust Optimization in Power Systems: A Tutorial Overview. Optim. Eng. 2022, 23, 2051–2073. [Google Scholar] [CrossRef]
- Zhong, Z.; Fan, N.; Wu, L. Multistage Robust Optimization for the Day-Ahead Scheduling of Hybrid Thermal-Hydro-Wind-Solar Systems. J. Glob. Optim. 2024, 88, 999–1034. [Google Scholar] [CrossRef]
- Peng, C.; Xie, P.; Pan, L.; Yu, R. Flexible Robust Optimization Dispatch for Hybrid Wind/Photovoltaic/Hydro/Thermal Power System. IEEE Trans. Smart Grid 2016, 7, 751–762. [Google Scholar] [CrossRef]
- Jin, X.; Liu, B.; Liao, S.; Cheng, C.; Yan, Z. A Wasserstein Metric-Based Distributionally Robust Optimization Approach for Reliable-Economic Equilibrium Operation of Hydro-Wind-Solar Energy Systems. Renew. Energy 2022, 196, 204–219. [Google Scholar] [CrossRef]
- Duan, C.; Fang, W.; Jiang, L.; Yao, L.; Liu, J. Distributionally Robust Chance-Constrained Approximate AC-OPF With Wasserstein Metric. IEEE Trans. Power Syst. 2018, 33, 4924–4936. [Google Scholar] [CrossRef]
- Xu, Y.; Deng, Z. Bi-Level Planning of Microgrid Considering Seasonal Hydrogen Storage and Efficiency Degradation of Electrolyzer. IEEE Trans. Ind. Appl. 2025, 61, 1385–1398. [Google Scholar] [CrossRef]
- Bahramara, S.; Sheikhahmadi, P.; Golpîra, H. Co-Optimization of Energy and Reserve in Standalone Micro-Grid Considering Uncertainties. Energy 2019, 176, 792–804. [Google Scholar] [CrossRef]
- Zhang, S.; Pan, G.; Li, B.; Gu, W.; Fu, J.; Sun, Y. Multi-Timescale Security Evaluation and Regulation of Integrated Electricity and Heating System. IEEE Trans. Smart Grid 2025, 16, 1088–1099. [Google Scholar] [CrossRef]
- Li, R.; Wang, W.; Xia, M. Cooperative Planning of Active Distribution System With Renewable Energy Sources and Energy Storage Systems. IEEE Access 2018, 6, 5916–5926. [Google Scholar] [CrossRef]
- Elkadeem, M.R.; Abd Elaziz, M.; Ullah, Z.; Wang, S.; Sharshir, S.W. Optimal Planning of Renewable Energy-Integrated Distribution System Considering Uncertainties. IEEE Access 2019, 7, 164887–164907. [Google Scholar] [CrossRef]
- Lin, S.; Liu, C.; Shen, Y.; Li, F.; Li, D.; Fu, Y. Stochastic Planning of Integrated Energy System via Frank-Copula Function and Scenario Reduction. IEEE Trans. Smart Grid 2022, 13, 202–212. [Google Scholar] [CrossRef]
- Wu, G.; Yi, C.; Xiao, H.; Wu, Q.; Zeng, L.; Yan, Q.; Zhang, M. Multi-Objective Optimization of Integrated Energy Systems Considering Renewable Energy Uncertainty and Electric Vehicles. IEEE Trans. Smart Grid 2023, 14, 4322–4332. [Google Scholar] [CrossRef]
- Li, Y.; Wang, P.; Gooi, H.B.; Ye, J.; Wu, L. Multi-Objective Optimal Dispatch of Microgrid Under Uncertainties via Interval Optimization. IEEE Trans. Smart Grid 2019, 10, 2046–2058. [Google Scholar] [CrossRef]
- Zakariazadeh, A.; Jadid, S.; Siano, P. Smart Microgrid Energy and Reserve Scheduling with Demand Response Using Stochastic Optimization. Int. J. Electr. Power Energy Syst. 2014, 63, 523–533. [Google Scholar] [CrossRef]
- Zhang, Y.; Gatsis, N.; Giannakis, G.B. Robust Energy Management for Microgrids With High-Penetration Renewables. IEEE Trans. Sustain. Energy 2013, 4, 944–953. [Google Scholar] [CrossRef]
- Farivar, M.; Low, S.H. Branch Flow Model: Relaxations and Convexification—Part I. IEEE Trans. Power Syst. 2013, 28, 2554–2564. [Google Scholar] [CrossRef]
- Wan, C.; Lin, J.; Wang, J.; Song, Y.; Dong, Z.Y. Direct Quantile Regression for Nonparametric Probabilistic Forecasting of Wind Power Generation. IEEE Trans. Power Syst. 2017, 32, 2767–2778. [Google Scholar] [CrossRef]
- Nelsen, R.B. 14—Copulas and Quasi-Copulas: An Introduction to Their Properties and Applications. In Logical, Algebraic, Analytic and Probabilistic Aspects of Triangular Norms; Klement, E.P., Mesiar, R., Eds.; Elsevier Science B.V.: Amsterdam, The Netherlands, 2005; pp. 391–413. [Google Scholar] [CrossRef]
- Nelsen, R.B. An Introduction to Copulas; Springer Series in Statistics; Springer: New York, NY, USA, 2006. [Google Scholar] [CrossRef]
- Embrechts, P.; Lindskog, F.; Mcneil, A. Modelling Dependence with Copulas and Applications to Risk Management. In Handbook of Heavy Tailed Distributions in Finance; Elsevier: Amsterdam, The Netherlands, 2003; pp. 329–384. [Google Scholar] [CrossRef]
- Yu, N.; Tesfatsion, L.; Liu, C.C. Financial Bilateral Contract Negotiation in Wholesale Electricity Markets Using Nash Bargaining Theory. IEEE Trans. Power Syst. 2012, 27, 251–267. [Google Scholar] [CrossRef]
- Höppner, F.; Klawonn, F.; Kruse, R.; Runkler, T. Fuzzy Cluster Analysis: Methods for Classification, Data Analysis and Image Recognition; John Wiley & Sons: Hoboken, NJ, USA, 1999. [Google Scholar]
- Conejo, A.J.; Carrión, M.; Morales, J.M. Decision Making Under Uncertainty in Electricity Markets; International Series in Operations Research & Management Science; Springer: Boston, MA, USA, 2010; Volume 153. [Google Scholar] [CrossRef]
- Sheikhahmadi, P.; Bahramara, S.; Moshtagh, J.; Yazdani Damavandi, M. A risk-based approach for modeling the strategic behavior of a distribution company in wholesale energy market. Appl. Energy 2018, 214, 24–38. [Google Scholar] [CrossRef]
- Shi, H.n.; Wang, P.; Zhang, J.; Du, W.S. Notes on judgment criteria of convex functions of several variables. Res. Nonlinear Anal. 2021, 4, 235–243. [Google Scholar] [CrossRef]
- Boyd, S. Distributed Optimization and Statistical Learning via the Alternating Direction Method of Multipliers. Found. Trends Mach. Learn. 2010, 3, 1–122. [Google Scholar] [CrossRef]
- Li, J.; Zhang, C.; Xu, Z.; Wang, J.; Zhao, J.; Zhang, Y.J.A. Distributed transactive energy trading framework in distribution networks. IEEE Trans. Power Syst. 2018, 33, 7215–7227. [Google Scholar] [CrossRef]


| Ref. | Operational Stage | Resources | Distribution Network | REG Correlation | Uncertainty Model | Approah | Solution |
|---|---|---|---|---|---|---|---|
| [28] | Planning | WGs, PVs, ESS | Graph theory | No | No | NLP | PSO |
| [29] | Planning | WGs, PVs | Distflow | No | No | NLP | PSO |
| [30] | Planning | WGs, PVs, ES, CHP, ect. | No | Frank Copula | Stochastic Programming | NLP | PSO |
| [25] | Planning | WGs, PVs, hydrogen storage | No | No | No | MILP | Yalmip+Gurobi |
| [31] | Daily operation | WGs, PVs, ES, EV, heater, etc. | No | No | Robust Optimization | MILP | Yalmip+CPLEX |
| [32] | Daily operation | WGs, PVs, Diesel Engines, Fuel Cells | Standard Model | No | Interval Optimization | Non-convex NLP | Group Search Optimizer |
| [33] | Daily operation | WGs, PVs, ESS, DR | Standard Model | No | Stochastic Programming | MINLP | Benders Decomposition + CPLEX + CONOPT |
| [34] | Daily operation | WGs, PVs, ESS, DR, Fuel Gen | No | No | Robust Optimization | Convex | Dual decomposition |
| This paper | Daily operation | WGs, PVs, ESS | Branch flow model | Frank Copula | Stochastic Programming | Convex QP | ADMM |
| Item | Bus 1 | Bus 12 | Bus 2 | Bus 32 |
|---|---|---|---|---|
| t = 14 | 0.8470 | 0.5669 | 0.4807 | −0.2221 |
| t = 15 | 0.8012 | 0.6657 | 0.4929 | −0.3164 |
Disclaimer/Publisher’s Note: The statements, opinions and data contained in all publications are solely those of the individual author(s) and contributor(s) and not of MDPI and/or the editor(s). MDPI and/or the editor(s) disclaim responsibility for any injury to people or property resulting from any ideas, methods, instructions or products referred to in the content. |
© 2025 by the authors. Licensee MDPI, Basel, Switzerland. This article is an open access article distributed under the terms and conditions of the Creative Commons Attribution (CC BY) license (https://creativecommons.org/licenses/by/4.0/).
Share and Cite
Jia, Y.; Xia, B.; Shi, Z.; Chen, W.; Zhang, L. Distributed Risk-Averse Optimization Scheduling of Hybrid Energy System with Complementary Renewable Energy Generation. Energies 2025, 18, 1405. https://doi.org/10.3390/en18061405
Jia Y, Xia B, Shi Z, Chen W, Zhang L. Distributed Risk-Averse Optimization Scheduling of Hybrid Energy System with Complementary Renewable Energy Generation. Energies. 2025; 18(6):1405. https://doi.org/10.3390/en18061405
Chicago/Turabian StyleJia, Yanbo, Bingqing Xia, Zhaohui Shi, Wei Chen, and Lei Zhang. 2025. "Distributed Risk-Averse Optimization Scheduling of Hybrid Energy System with Complementary Renewable Energy Generation" Energies 18, no. 6: 1405. https://doi.org/10.3390/en18061405
APA StyleJia, Y., Xia, B., Shi, Z., Chen, W., & Zhang, L. (2025). Distributed Risk-Averse Optimization Scheduling of Hybrid Energy System with Complementary Renewable Energy Generation. Energies, 18(6), 1405. https://doi.org/10.3390/en18061405