Abstract
The control of environmental parameters in livestock farming is essential to achieve optimal ranges of temperature and humidity. HVAC systems for this purpose are characterized by high energy demands, causing significant GHG emissions when relying on fossil fuels. The aim of this study is the development and testing of a sustainable heating system for a nursery barn hosting 2500 weaners, as well as the assessment of the effectiveness and the performance of the new system. This work involved the implementation of a renewable energy source (RES) system incorporating a borehole thermal energy storage and photovoltaic thermal collectors, integrated with a Dual-Source Heat Pump. A smart control system was installed and the collected data were processed to define the optimal settings of the integrated plant for energy production and efficiency. The performance in terms of the control of the environmental conditions of the nursery barn was assessed on the basis of the environmental parameters analyzed, with particular reference to the animal-occupied zones. The results showed that a mix of RESs can be properly defined and integrated in an automated heating system to meet the specific requirements of a swine farm, thanks to a project specifically designed to exploit the renewable resources typically available in farming environments.
1. Introduction
Swine farming, like many intensive livestock farming activities, demands the meticulous control of environmental conditions to ensure the health and optimal growth of weaners. The nursery barn environment plays a crucial role in mitigating stress factors that can affect animal welfare and productivity. Temperature and humidity are two key parameters that require careful management throughout the year, especially during extreme weather conditions. Research has consistently shown the profound impact of environmental conditions on swine health and performance [1]. In fact, the scientific literature highlights the importance of maintaining optimal temperature and humidity levels to prevent heat stress in pigs, which can lead to reduced feed intake, impaired growth, and increased susceptibility to diseases [2]. Similarly, inadequate temperature regulation during cold seasons can compromise piglet health and increase mortality rates; thus, proper heating is required in pig barns [3].
Heating, ventilation, and air conditioning (HVAC) systems are indispensable tools for controlling the environmental parameters in swine barns [4]. However, traditional systems often rely on fossil fuels for energy, leading to significant greenhouse gas (GHG) emissions. This has raised concerns about the sustainability of intensive swine production systems, particularly in light of the growing emphasis on reducing carbon footprints across intensive animal productions [5]. Efforts to address the environmental impact of HVAC systems in swine farming have spurred research into alternative technologies and management strategies [4]. For instance, advancements in energy-efficient heating systems, such as radiant heating and heat recovery ventilation, offer promising solutions for reducing energy consumption and mitigating GHG emissions [6]. Fossil fuels used today are characterized primarily by high CO2 emissions, the uneven distribution of sources, expensive production, limited potential, etc. Their alternatives are renewable energy sources (RESs), which are environmentally friendly, evenly available, and can significantly replace fossil fuels used in the production of electricity and heat [7]. In this framework, agriculture plays a pivotal role as a sector which is increasingly a supplier of energy produced from RESs [8]. Agriculture also benefits from RES production, and the combination of increased energy efficiency in farming practices and renewable energy technologies proved fundamental to achieving long-term sustainability goals [9]. In fact, integrating renewable energy sources, such as solar panels or geothermal heat exchangers for microclimatic control, can further reduce reliance on fossil fuels and enhance sustainability [10]. Focusing on the livestock sector, optimizing the design and operation of HVAC systems through computational modeling and advanced control algorithms can maximize energy efficiency while maintaining optimal environmental conditions for pig welfare. Research in this area has demonstrated the significant potential for reducing energy consumption and GHG emissions without compromising animal performance [11]. In particular, the control of environmental conditions in swine nursery barns is thus crucial for ensuring the health and productivity of weaners.
The intersection of sustainability and animal welfare goals in livestock farming necessitates the development of renewable energy systems capable of meeting the energy demands of farm buildings while ensuring optimal conditions for animal health and productivity. Achieving this balance requires not only the availability of renewable energy but also the implementation of smart monitoring and actuation systems to effectively manage energy production and usage in real time. However, the intermittent nature of renewable energy sources presents challenges in matching energy supply with demand, particularly in farm settings where energy requirements fluctuate based on factors such as weather conditions and animal metabolism. To address this issue, smart monitoring and actuation systems are essential for dynamically adjusting energy production and usage in response to real-time demands [12]. A targeted study [13] has demonstrated the effectiveness of advanced control algorithms and sensor networks in optimizing animal monitoring and energy management in farm buildings. These authors considered the development of a numerical model of energy usage to maximize its efficiency in swine barns while adjusting heating, cooling, and ventilation systems according to animal welfare requirements [13]. At the same time, the application of smart technologies as a sustainable strategy in swine farming has also been analyzed in the literature [14], as several solutions were implemented along the three stages of development of smart livestock farming, as identified by the authors: the first generation was focused on animal monitoring; the second one focused on environment control, health management, big data, and AI; finally, the third-generation model consisted of energy management and the automation of farming. By harnessing renewable energy sources and optimizing energy management in real time, farmers can reduce their environmental footprint while ensuring the optimal conditions for animal health and productivity.
In fact, one of the agricultural activities with the highest energy intensity is confined livestock farming, where the demand of electrical and thermal energy is considerable to feed the manifold technical operations and technological functions [15], such as cooling or heating the indoor environment of animal housing facilities [16], and powering equipment, lighting, ventilation, and feeding systems [17]. The energy demands of livestock farming have traditionally been met primarily through fossil fuels; however, their use significantly contributes to GHG emissions and global climate change. Advances in RES technologies, alongside declining costs and improved reliability and performance, are expanding opportunities for farmers in the EU to adopt RES production. Additionally, the geopolitical imperative to enhance energy independence and reduce reliance on fossil fuels imports further supports this transition. The innovative applications of geothermal systems have proved effective in livestock buildings at increasing energy efficiency and environmental sustainability, thanks to the combined potential of efficient cooling, energy storage, and contemporary water heating [18]. Nevertheless, studies focused on the development of integrated RES systems specifically intended for livestock farms are lacking in the scientific literature. In this context, the innovation project RES4LIVE “Energy Smart Livestock Farming towards Zero Fossil Fuel Consumption”, running in the period 2020–2024 under the call for “Defossilising agriculture—solutions and pathways for fossil-energy-free farming” of the European program Horizon 2020, aimed to develop integrated, cost-effective, and case-sensitive RES solutions aimed towards achieving fossil-free livestock farming. The project adapted and tested promising RES technologies in energy-intensive livestock farming to greatly reduce the fossil energy that has been the main source used so far to cover the energy demand.
This research was carried out within RES4LIVE and focused on the development of a sustainable heating system, with reference to the pilot case of the nursery barn of a farrow-to-nursery swine farm. This work entailed the design and testing of an RES system incorporating borehole thermal energy storage (BTES) and photovoltaic thermal (PVT) collectors, integrated with a Dual-Source Heat Pump (DSHP). A smart control system was developed and installed to monitor RES production, energy use, and the environmental conditions outdoors and in the various sectors of the barn. The data collected were processed to define the optimal settings of the integrated plant for energy production and efficiency.
2. Materials and Methods
2.1. Study Case
The pilot case presented in this research is a swine farm, namely Golinelli farm, located in northern Italy near the northern boundary of Modena province (Emilia-Romagna region) in the municipality of Mirandola (Figure 1) at altitude of 10 m a.s.l. The farm is a partner in RES4LIVE and it is structured as a farrow-to-nursery system, rearing 500 sows and 2500 weaners. When dealing with a BTES project, the knowledge of the exact location and the geological and hydrogeological characteristics are of primary importance during the design phase. The hydrogeological features of the site, together with the choice of the appropriate depth for the BTES, technically and economically, were discussed in a previous paper [19], as well as the climatic framework [20].
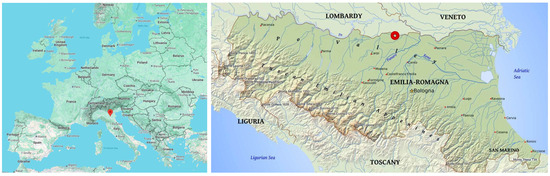
Figure 1.
Location of the pilot farm (red circle) in the European and in the regional geographic context.
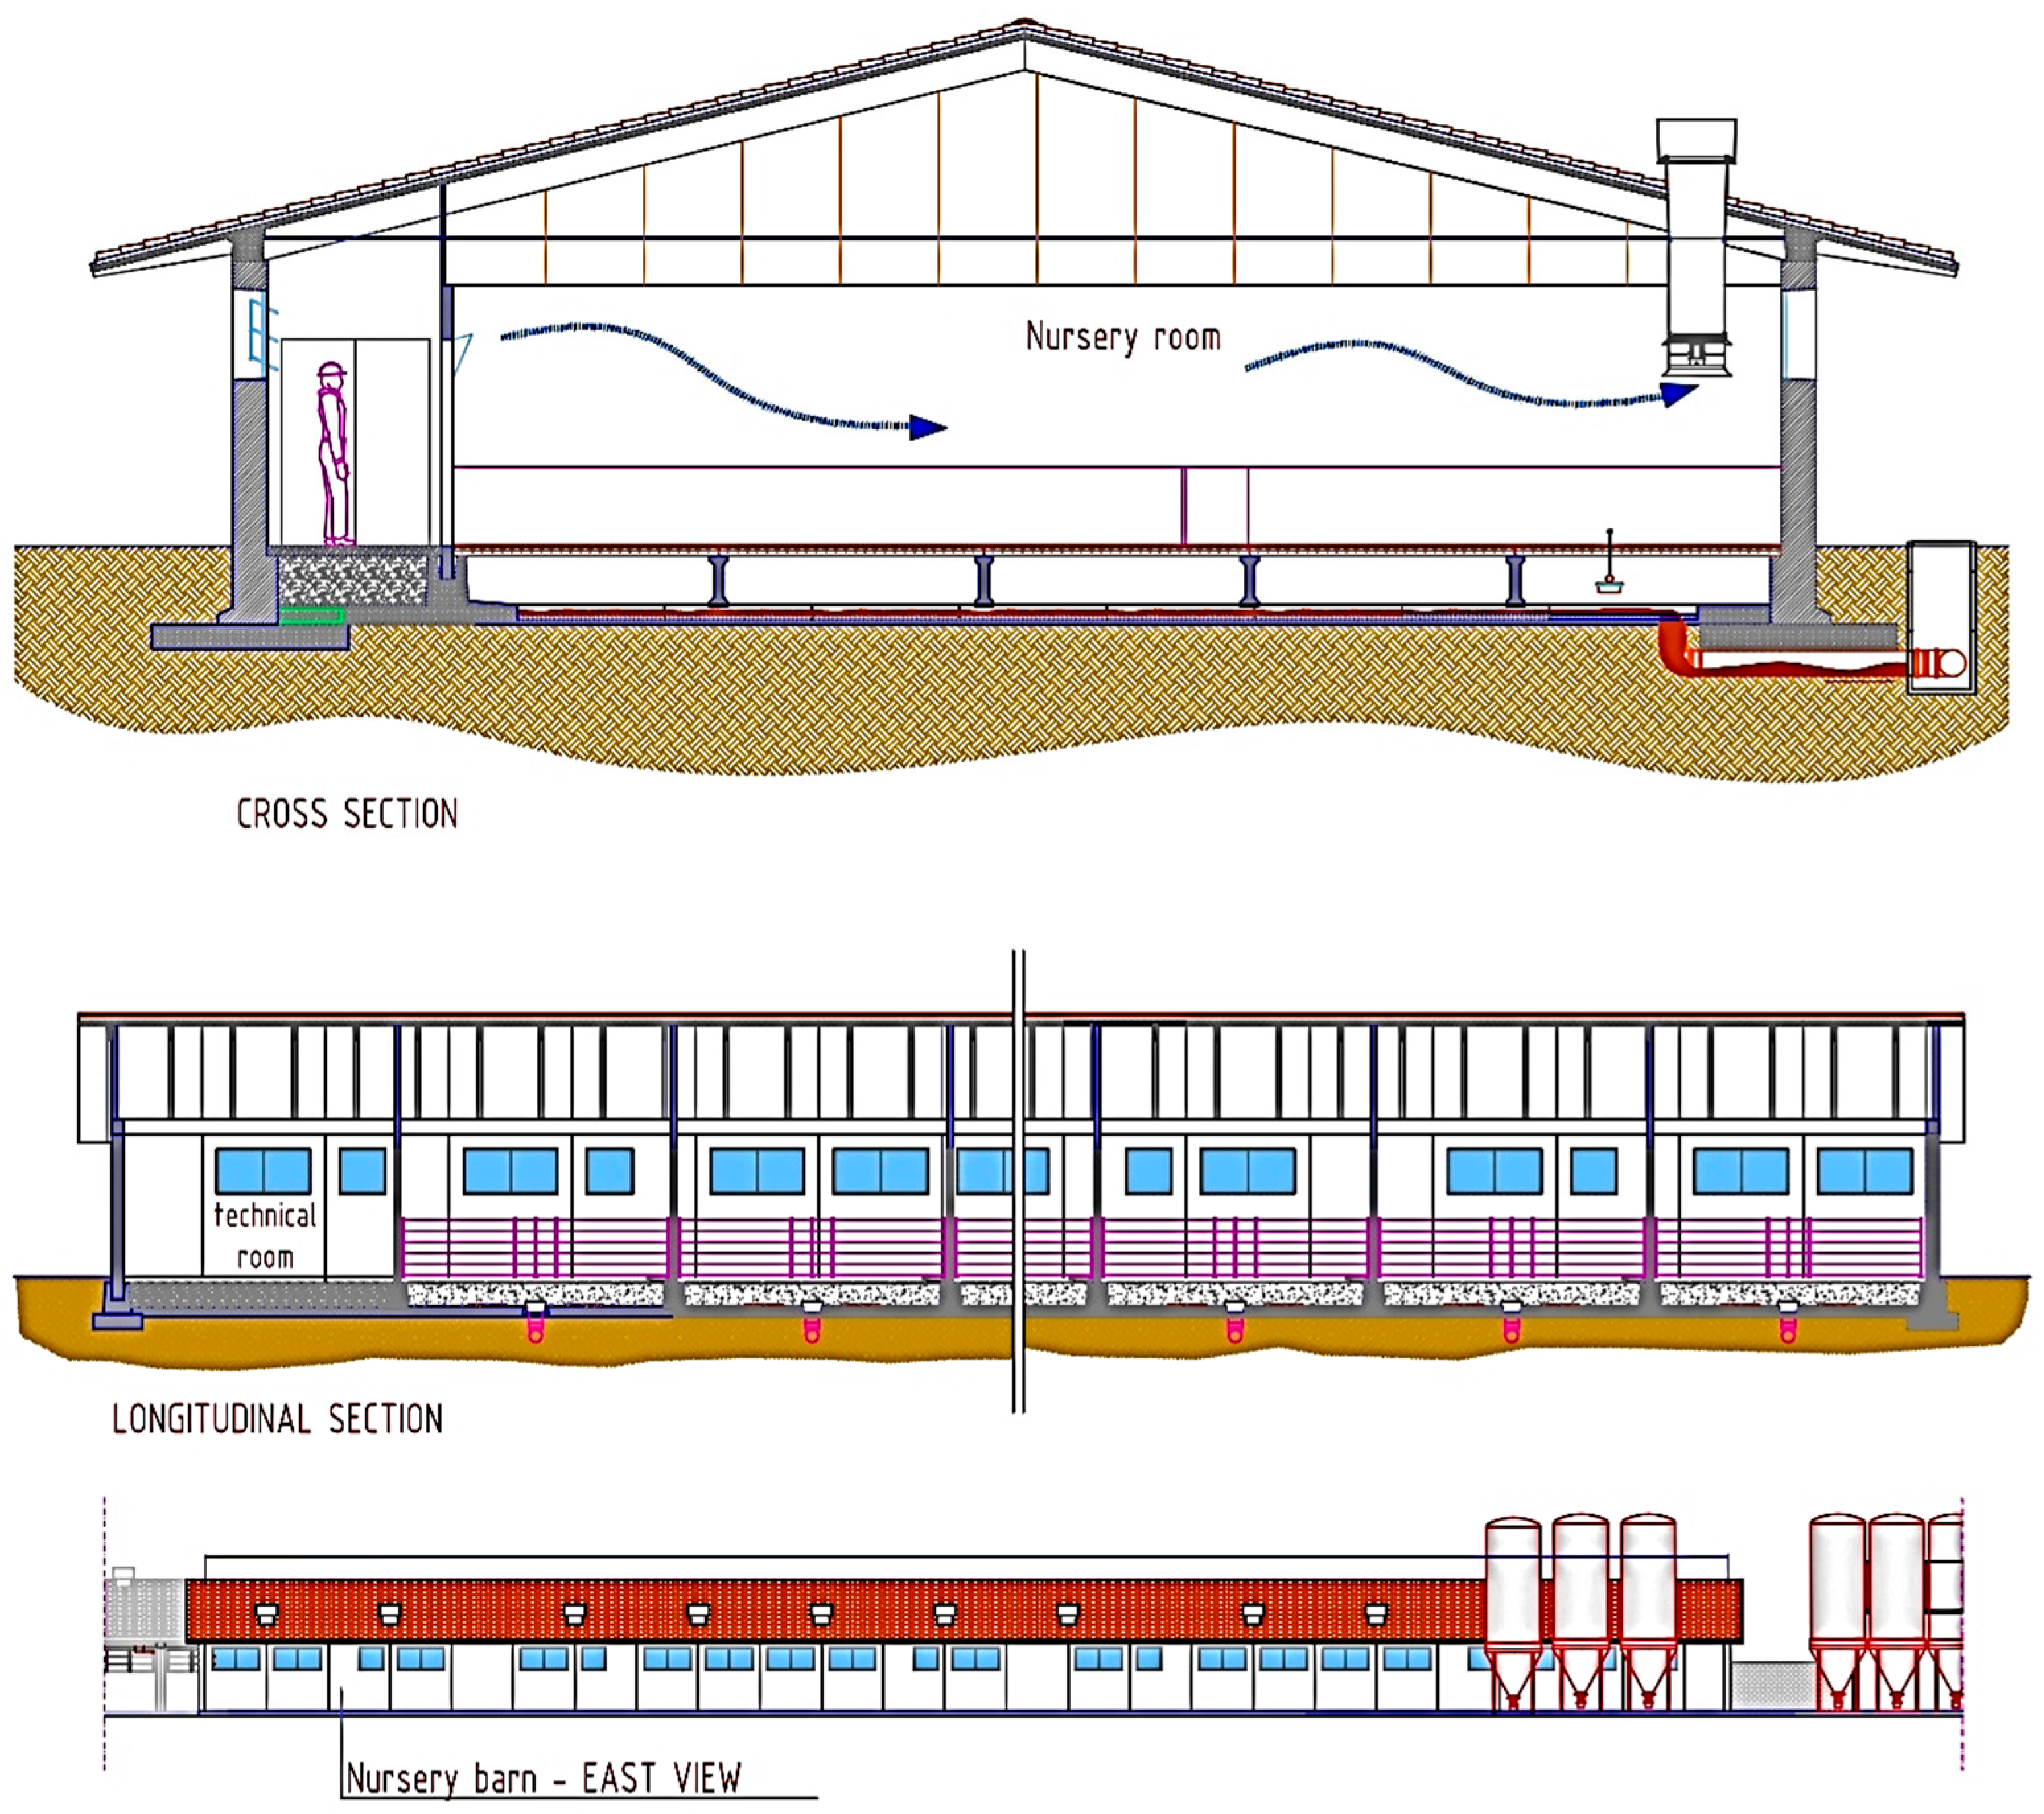
The experimental study focused on the nursery barn, a building with a reinforced concrete (RC) precast structure and infills made of insulated precast RC panels. The barn has an elongated rectangular plan layout, measuring 62.26 m by 16.10 m, with a double-pitched roof 2.80 m high at the eaves and 5.40 m at the ridge. The internal layout is made up of ten rooms for weaners and a technical room, all measuring 74.25 m2 and accessible from a 1.76 m wide hallway placed along the western side of the building. This corridor also represents a filter zone for the pre-treatment of the clean air conveyed inside the nursery rooms, as it has windows both on the outer wall and in the separation wall of the weaners’ rooms. Figure 2 represents the configuration of the building, which was not modified by the interventions carried out, because they involved the energy production plants and the heating system without modifications to the barn’s layout or structure.
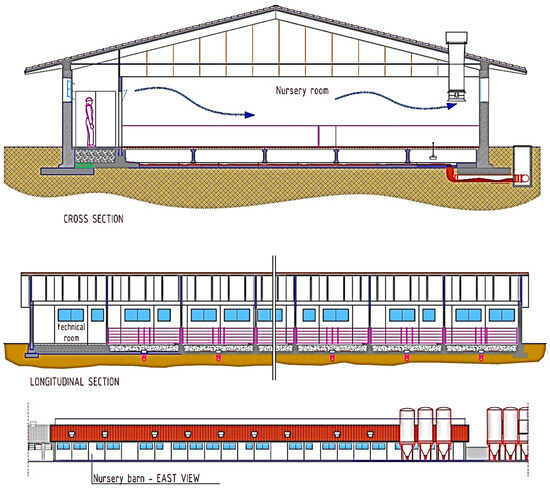
Figure 2.
Top: Cross section of the nursery barn. The hallway along the western side allows access to the nursery rooms and also represents a zone for the pre-treatment of the clean air conveyed inside the nursery rooms. Below: Longitudinal section and view.
Air pre-treatment is carried out by managing the opening of the outer windows and through a heating system consisting of four finned pipes placed all along the hallway, beside the outer windows. Each room can hold up to 240 weaners, while additional pigs can be reared in temporary shelters outside the southern façade (Figure 3). Every room is equipped with five thermal lamps of 1.8 kW each and a chimney with an extraction fan. The thermal lamps, the windows on the corridor, and the fans of the nursery rooms are controlled on the basis of temperature, which is monitored through sensors in every room. The minimum setpoint temperature is 28 °C for one month old piglets weighing around 8 kg, and decreases down to 24 °C for weaners of about 3 months old weighing 25–30 kg. The extraction fans work at 5% of the maximum power below the minimum temperature, and the working rate linearly increases with temperature up to 100% at 32 °C. The minimum temperature in the hallway is set by the farmer to 15 °C at the window height, as this temperature is suitable to properly balance hair exchange and heating in the weaners’ rooms.
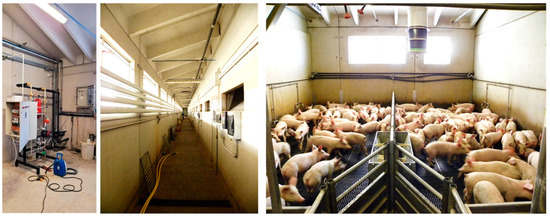
Figure 3.
From the left: solar station, heated hallway, and nursery room.
2.2. Outline of the Implemented RES System
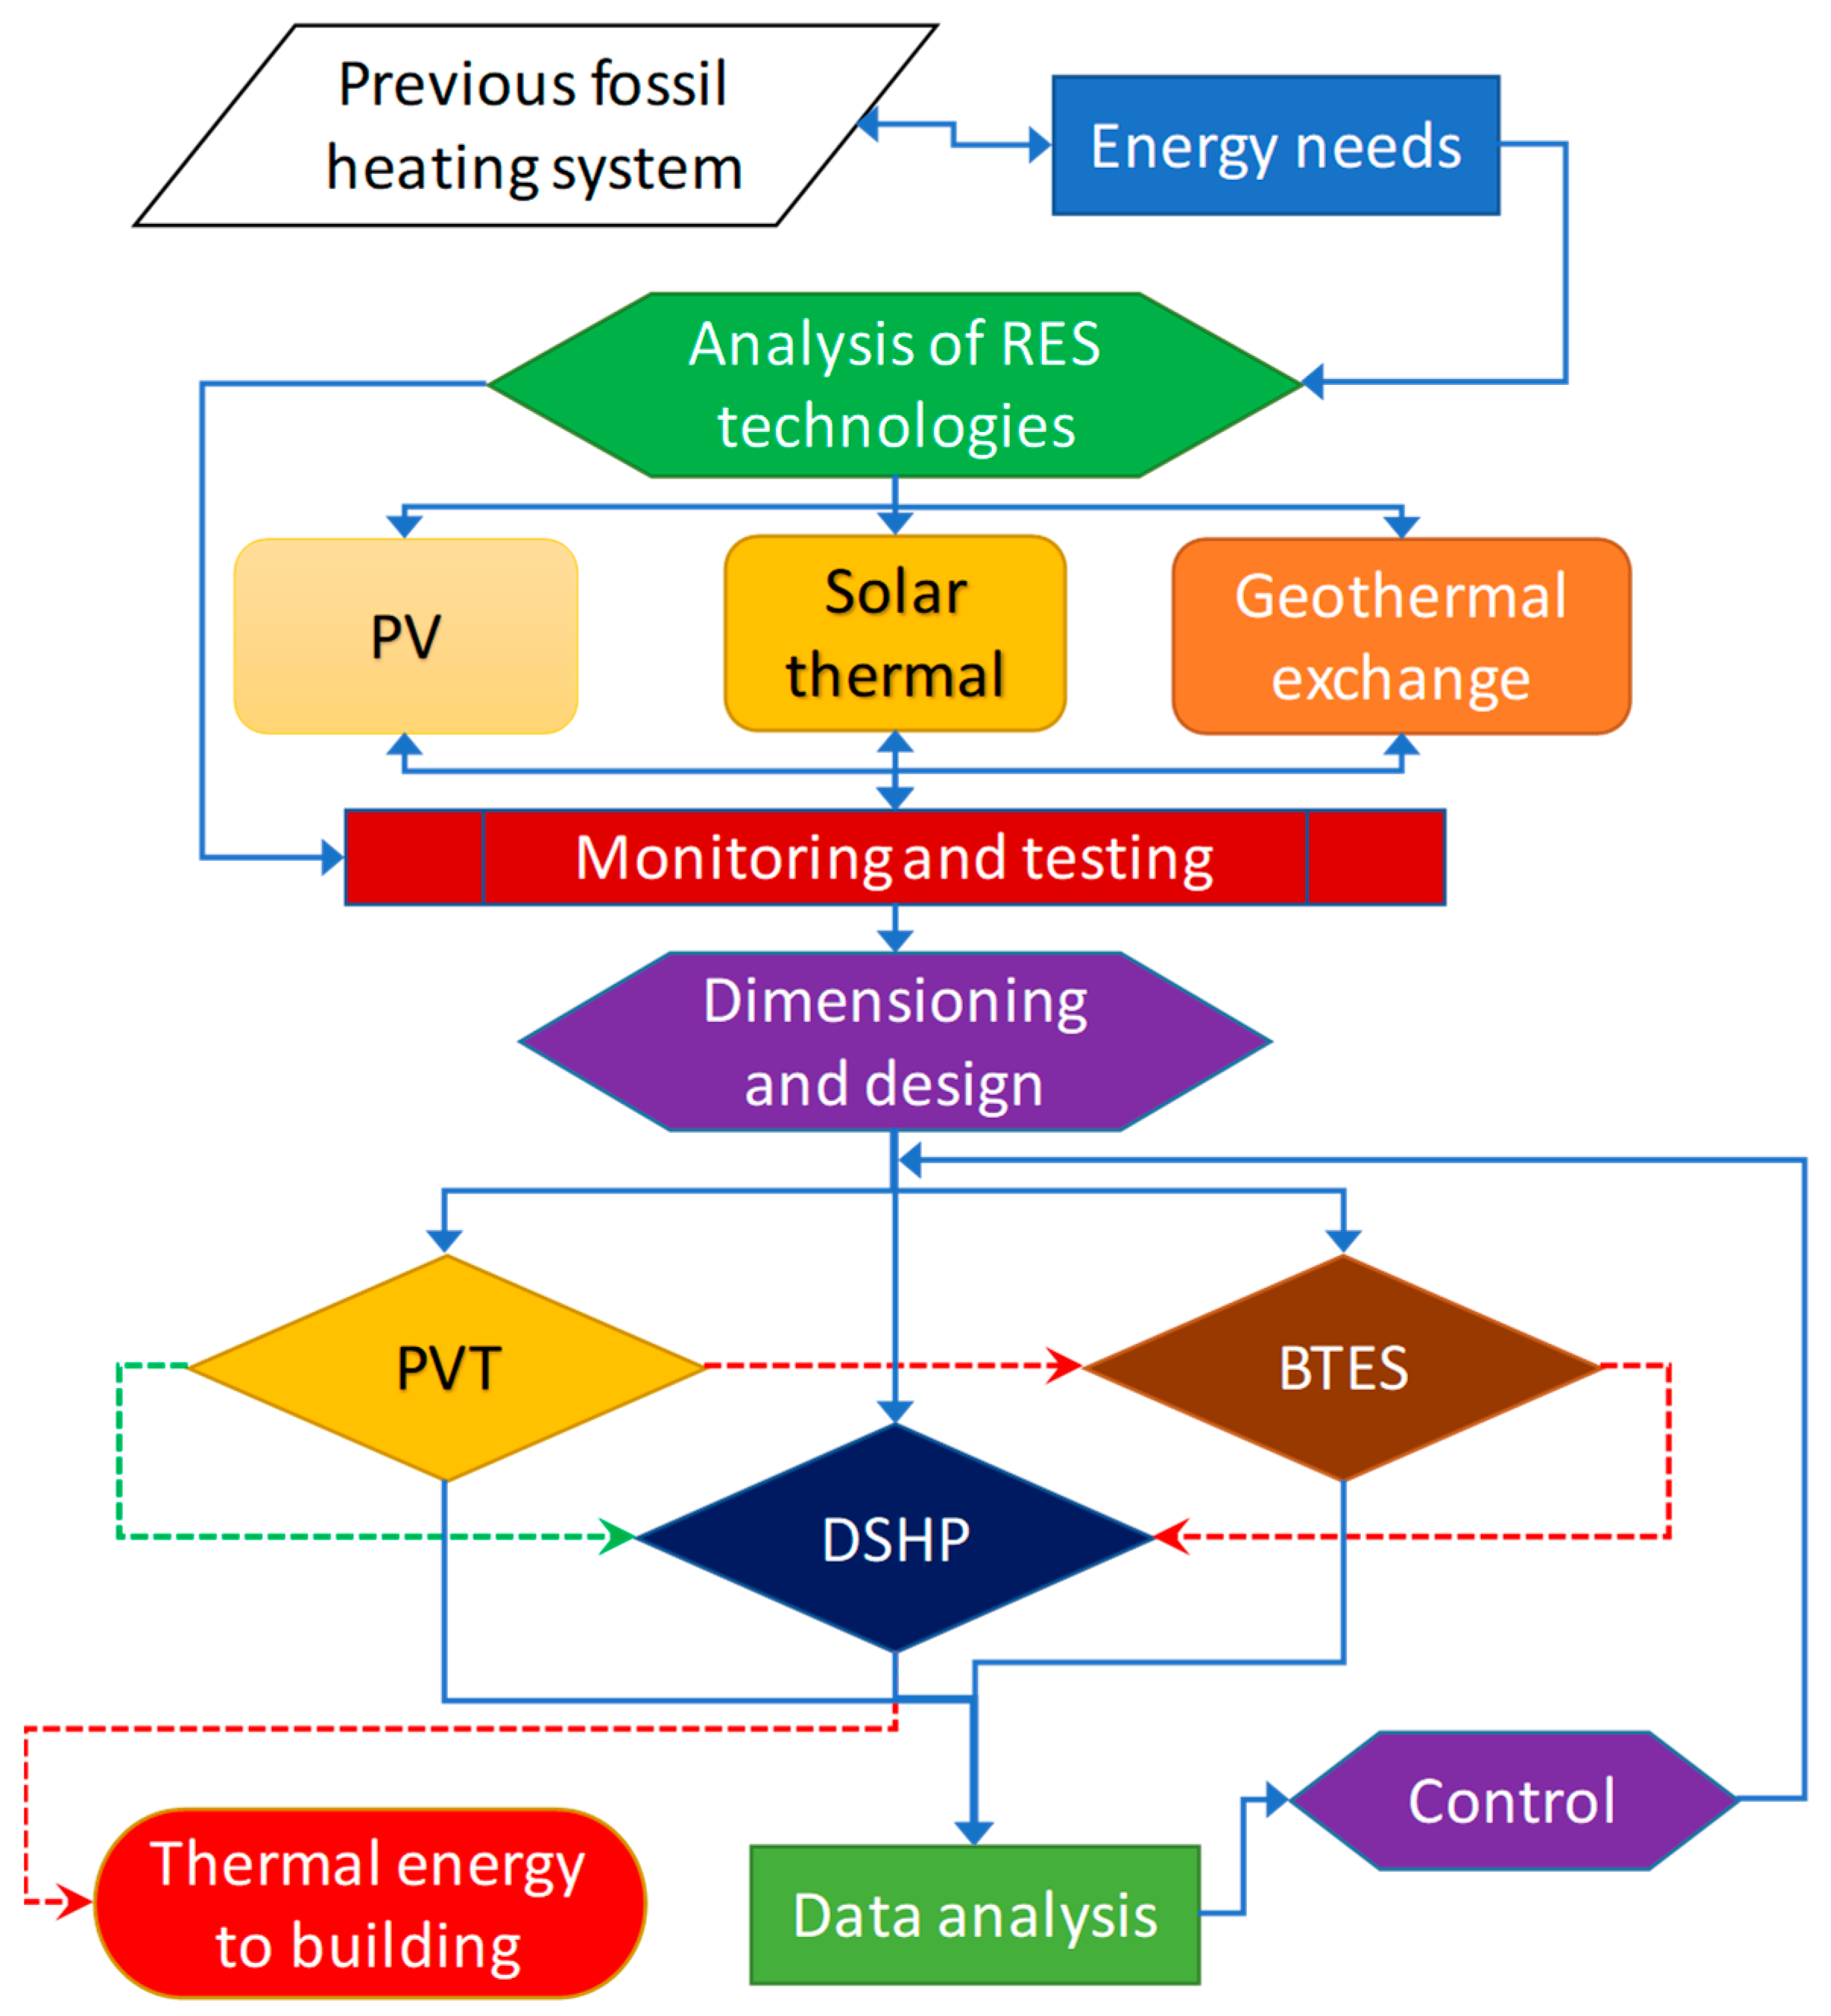
The RES system was designed to replace a 34 kW LPG boiler by Riello (Legnago, VR, Italy) used to pre-heat the air in the hallway of the building, so that the inlet airflows into the nursery room, driven by extraction fans, had an adequate temperature during the cold season. Specifically, the integrated system was composed of PVT collectors, a DSHP, and a BTES, and it was conceived and developed according the flowchart in Figure 4. The PVT collector installed was the Samster-SunPro 320 W monocrystalline model from Samster AB in Kungsbacka, Sweden. This model was characterized by a peak power of 320 W with 19.55% efficiency. A thermal absorber of 1.64 m2 was located beneath the photovoltaic module. Specifically, the PVT system consisted of 24 PVT collectors arranged in a single row on the roof, resulting in a total aperture area of 39.3 m2 on the roof of the nursery barn. The peak powers of such collectors were 25 kWth and 7.68 kWel, and they were thus capable of providing thermal energy to the BTES and electricity for the DSHP operations and, possibly, the further electrical needs of the building. The hydraulic arrangement of the collectors was made of four rows, each containing six elements. At the same time, each row was designed to have the same volumetric flow of 400 L h−1. The pressure drop in a single collector was assessed to be 10 kPa. The specifications of the installed PVT system are given in [20]. The heating load provided by the geothermal heat pump could raise the temperature of the radiant pipes up to 55 °C, corresponding to the operating temperature targeted with the previous fossil-fuel-based boiler. The fundamental system architecture incorporated a DSHP featuring not only an air-cooled evaporator but also a heat exchanger for transferring heat with a water/glycol blend sourced from a sequence of PVT collectors connected to boreholes.

Figure 4.
Flowchart of the implementation process of the RES system. Continuous lines: data flows/workflows; dashed lines: energy flows (red: thermal; green: electric).
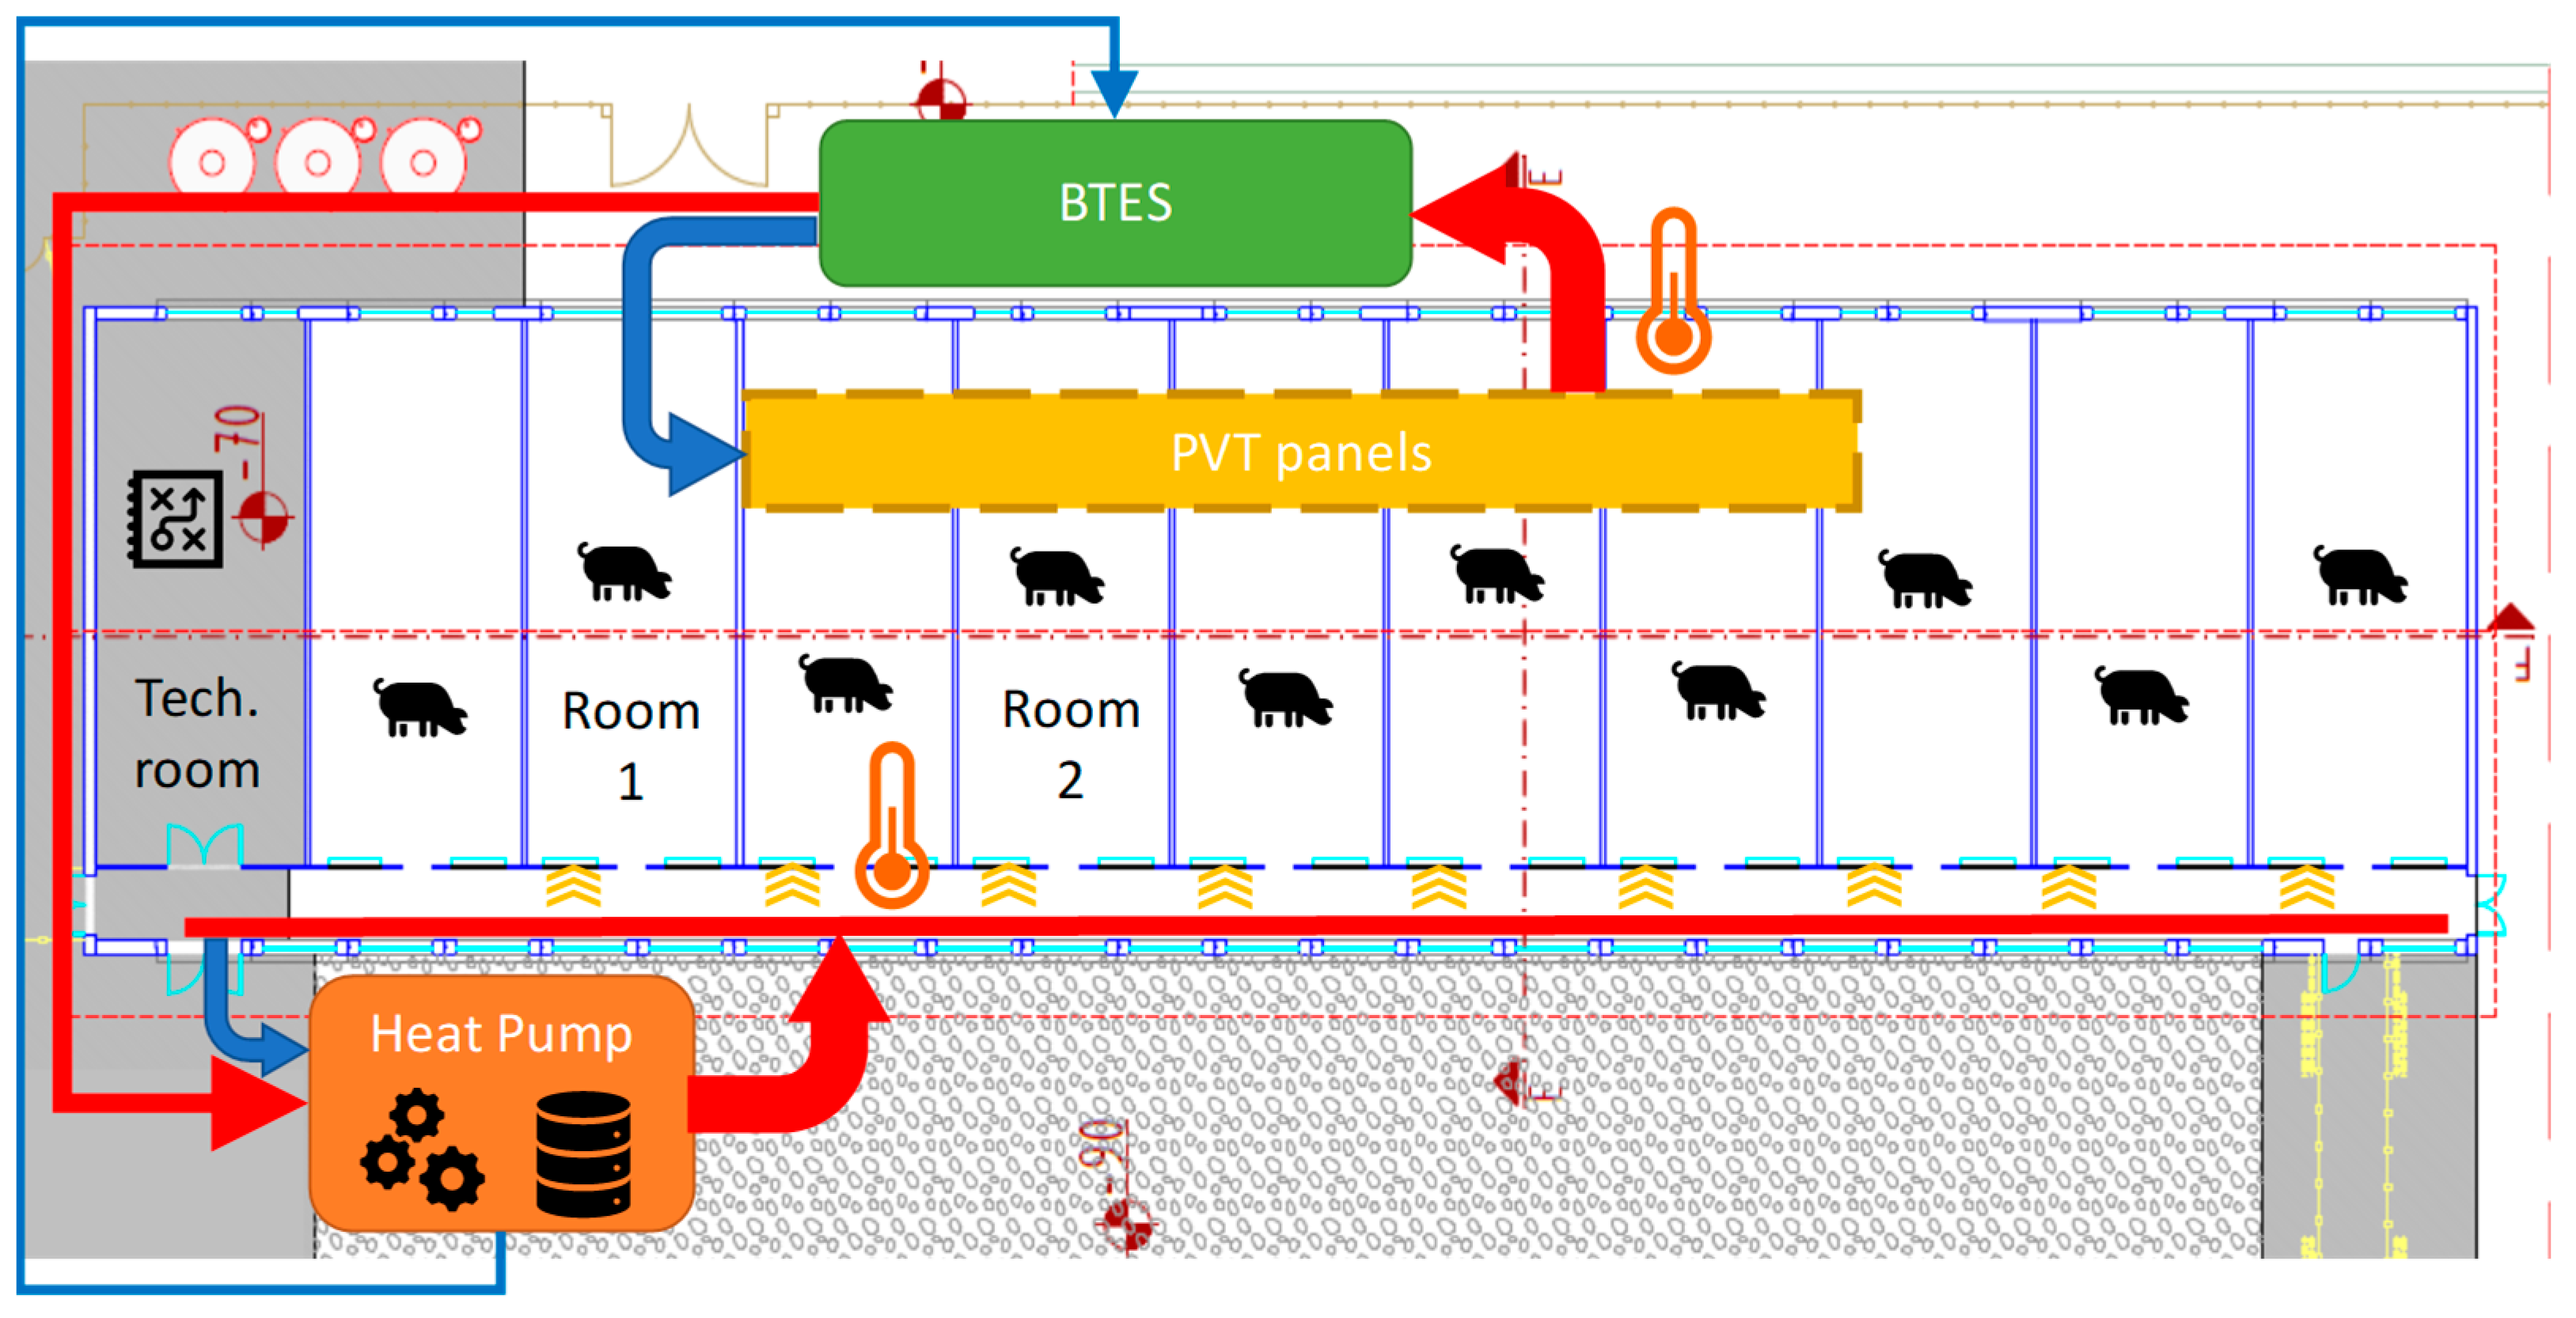
The RES system completely replaced the fossil fuel boiler, so that the latter was removed after the new installation. The primary novelty of the system lay in the integration of two different RESs, i.e., solar and geothermal exchange, so that it was possible to store the solar heat produced in summer for its exploitation in winter through the BTES (Figure 5). At the same time, the electrical energy produced by the PVT was made available to the grid through net metering, and thus the corresponding energy could be fully used for the DSHP and no battery was used, because it was unnecessary. The novelty of the installed system (illustrated in Figure 6) also resided in its capability for hybrid operations, enabling the simultaneous utilization of both ground-sourced and air-sourced heat, resulting in increased heating capacity and efficiency. The core of the integrated system was thus the BTES, where the thermal energy produced was injected and from which it was extracted, as described in detail in a previous paper [19]. It is an innovative geothermal storage configuration, specifically designed for agricultural companies and which has obtained specific authorization from the regional environmental agency following a dedicated authorization process. The innovative characteristics of this BTES have meant that it has been recognized as an invention, for which a patent has been filed entitled “Closed-loop seasonal heat storage system for agro-industrial and agro-livestock structures”.
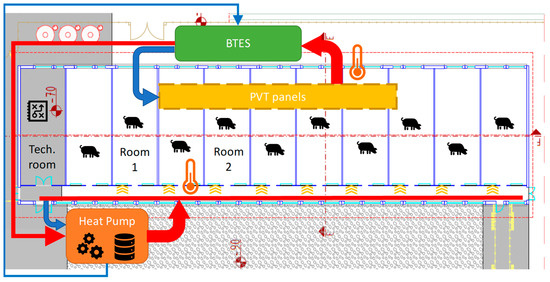
Figure 5.
Schematic plan layout of the nursery barn with diagrams of the main flows of thermal energy between the PVT panels and the BTES field and among the Dual Source Heat Pump, the BTES, and the radiant pipes along the building hallway. The red arrows indicate the hot water fluxes.
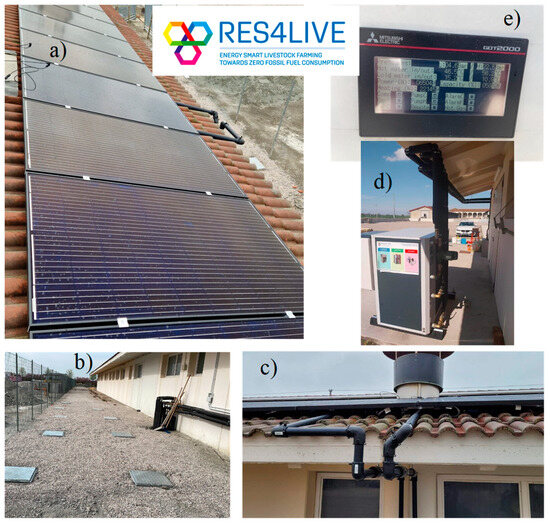
Figure 6.
Pictures of the installed system: (a) PVT panels; (b) BTES field; (c) PVT-BTES circuit of the vector fluid; (d) DSHP machine; and (e) control panel of the DSHP.
A smart monitoring and control system was developed by the Consortium of RES4LIVE and installed by the Authors in the farm under study to monitor environmental variables and automate the integrated RES plant. The system was described in detail in a previous paper [10]. Data have been collected since May 2021. The system comprised a gateway, weather station powered through PV, and monitoring nodes for gases and environmental conditions in different areas, including the hallway and two rooms of the nursery barn.
2.3. Methodology for Data Analysis
The data collected allow, in particular, for the computation of the Temperature Humidity Index (THI), broadly acknowledged in the scientific literature as a reliable indicator of the condition of animal welfare or heat stress [21]. It is computed based on Equation (1):
where Tdb is the dry bulb temperature (°C) and RH is the relative humidity (%). The THI can be categorized in four ranges, corresponding to different levels of animal welfare or heat stress: normal condition (THI ≤ 74), alert (75 ≤ THI ≤ 78), danger (79 ≤ THI ≤ 83), and emergency (THI ≥ 84) [22].
Further sensor nodes monitor all the relevant parameters of the DSHP, including the temperature of the cooling and heating water at the inlet and outlet, the power consumption, the heating capacity, and the source used (air, BTES, or both). The RES4LIVE gateway, powered by a Raspberry Pi 4 model B with 4 gb RAM, 128 gb SSD, and 32 gb microSD for initialization, is cost-effective and efficient. The PVT system, also equipped with PT100 temperature sensors and a radiation sensor Resol CS10, is controlled through RESOL VBus, a communication protocol which has allowed various devices to connect and exchange data since May 2023 (Figure 7).
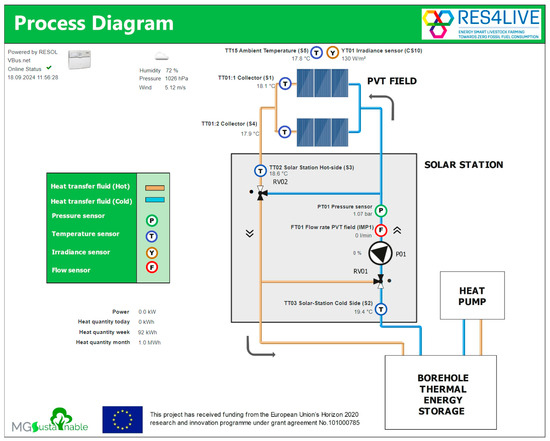
Figure 7.
Process dynamic diagram of the RESOL controller. It displays the following: the measured values of the main variables, the direction of the flow, the activation/stopping of the circulation pump, and the opening/closing of the two circuit valves.
In order to analyze the work of the PVT-BTES-DSHP system at the pilot farm, a representative period has been chosen, namely from 10 to 25 April 2024. There are essentially two reasons for this choice:
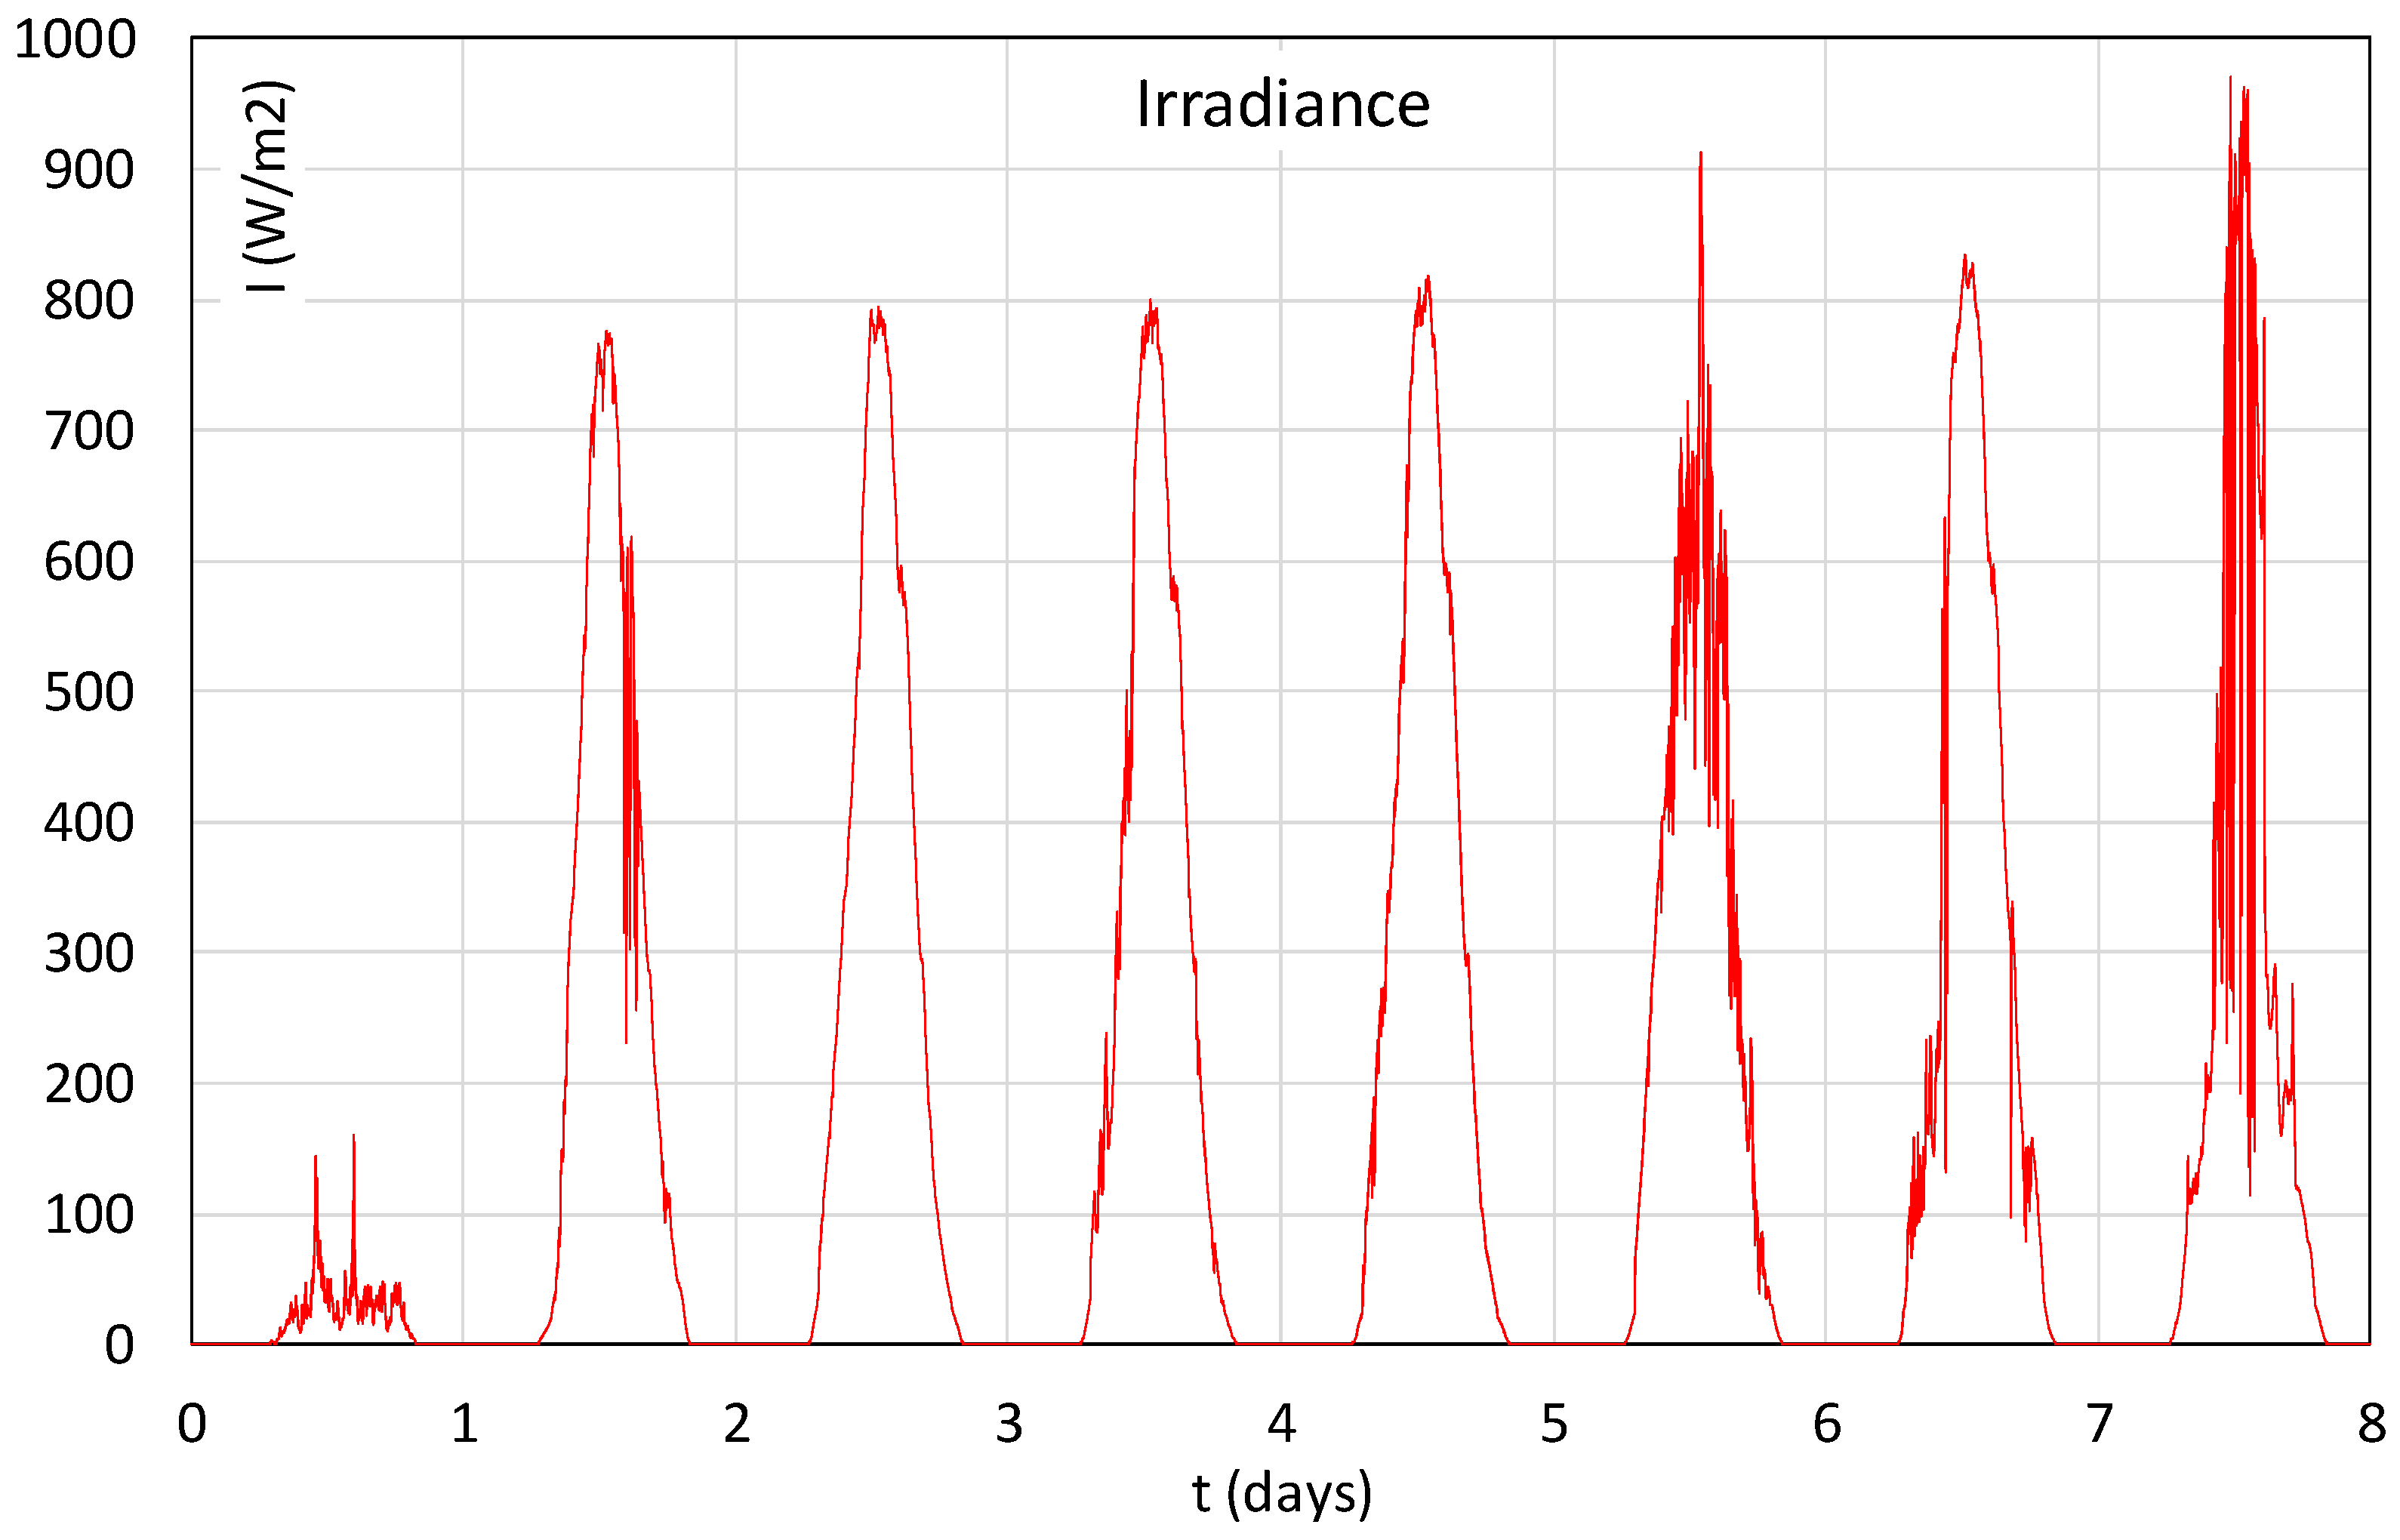
- From 10 to 17 April: The weather at the farm site was very sunny, with an average irradiance during the day of around 300 W/m2 and a peak of 970 W/m2 (Figure 8). The outdoor temperature in the period was high as well, with a mean of over 20 °C, above the average value recorded for April in the previous years. In this period, the PVT and the solar central station both activated and solar heat energy was injected into the BTES.
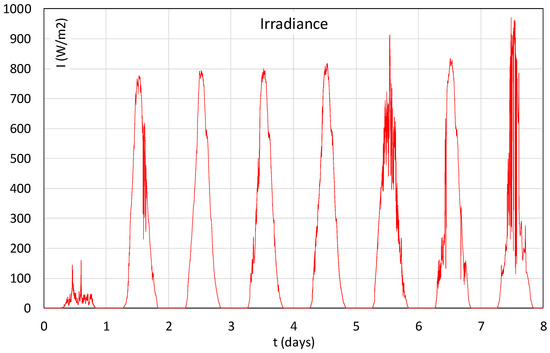 Figure 8. Irradiance measured through the pyranometer integrated in the PVT system in the period 10–17 April 2024.
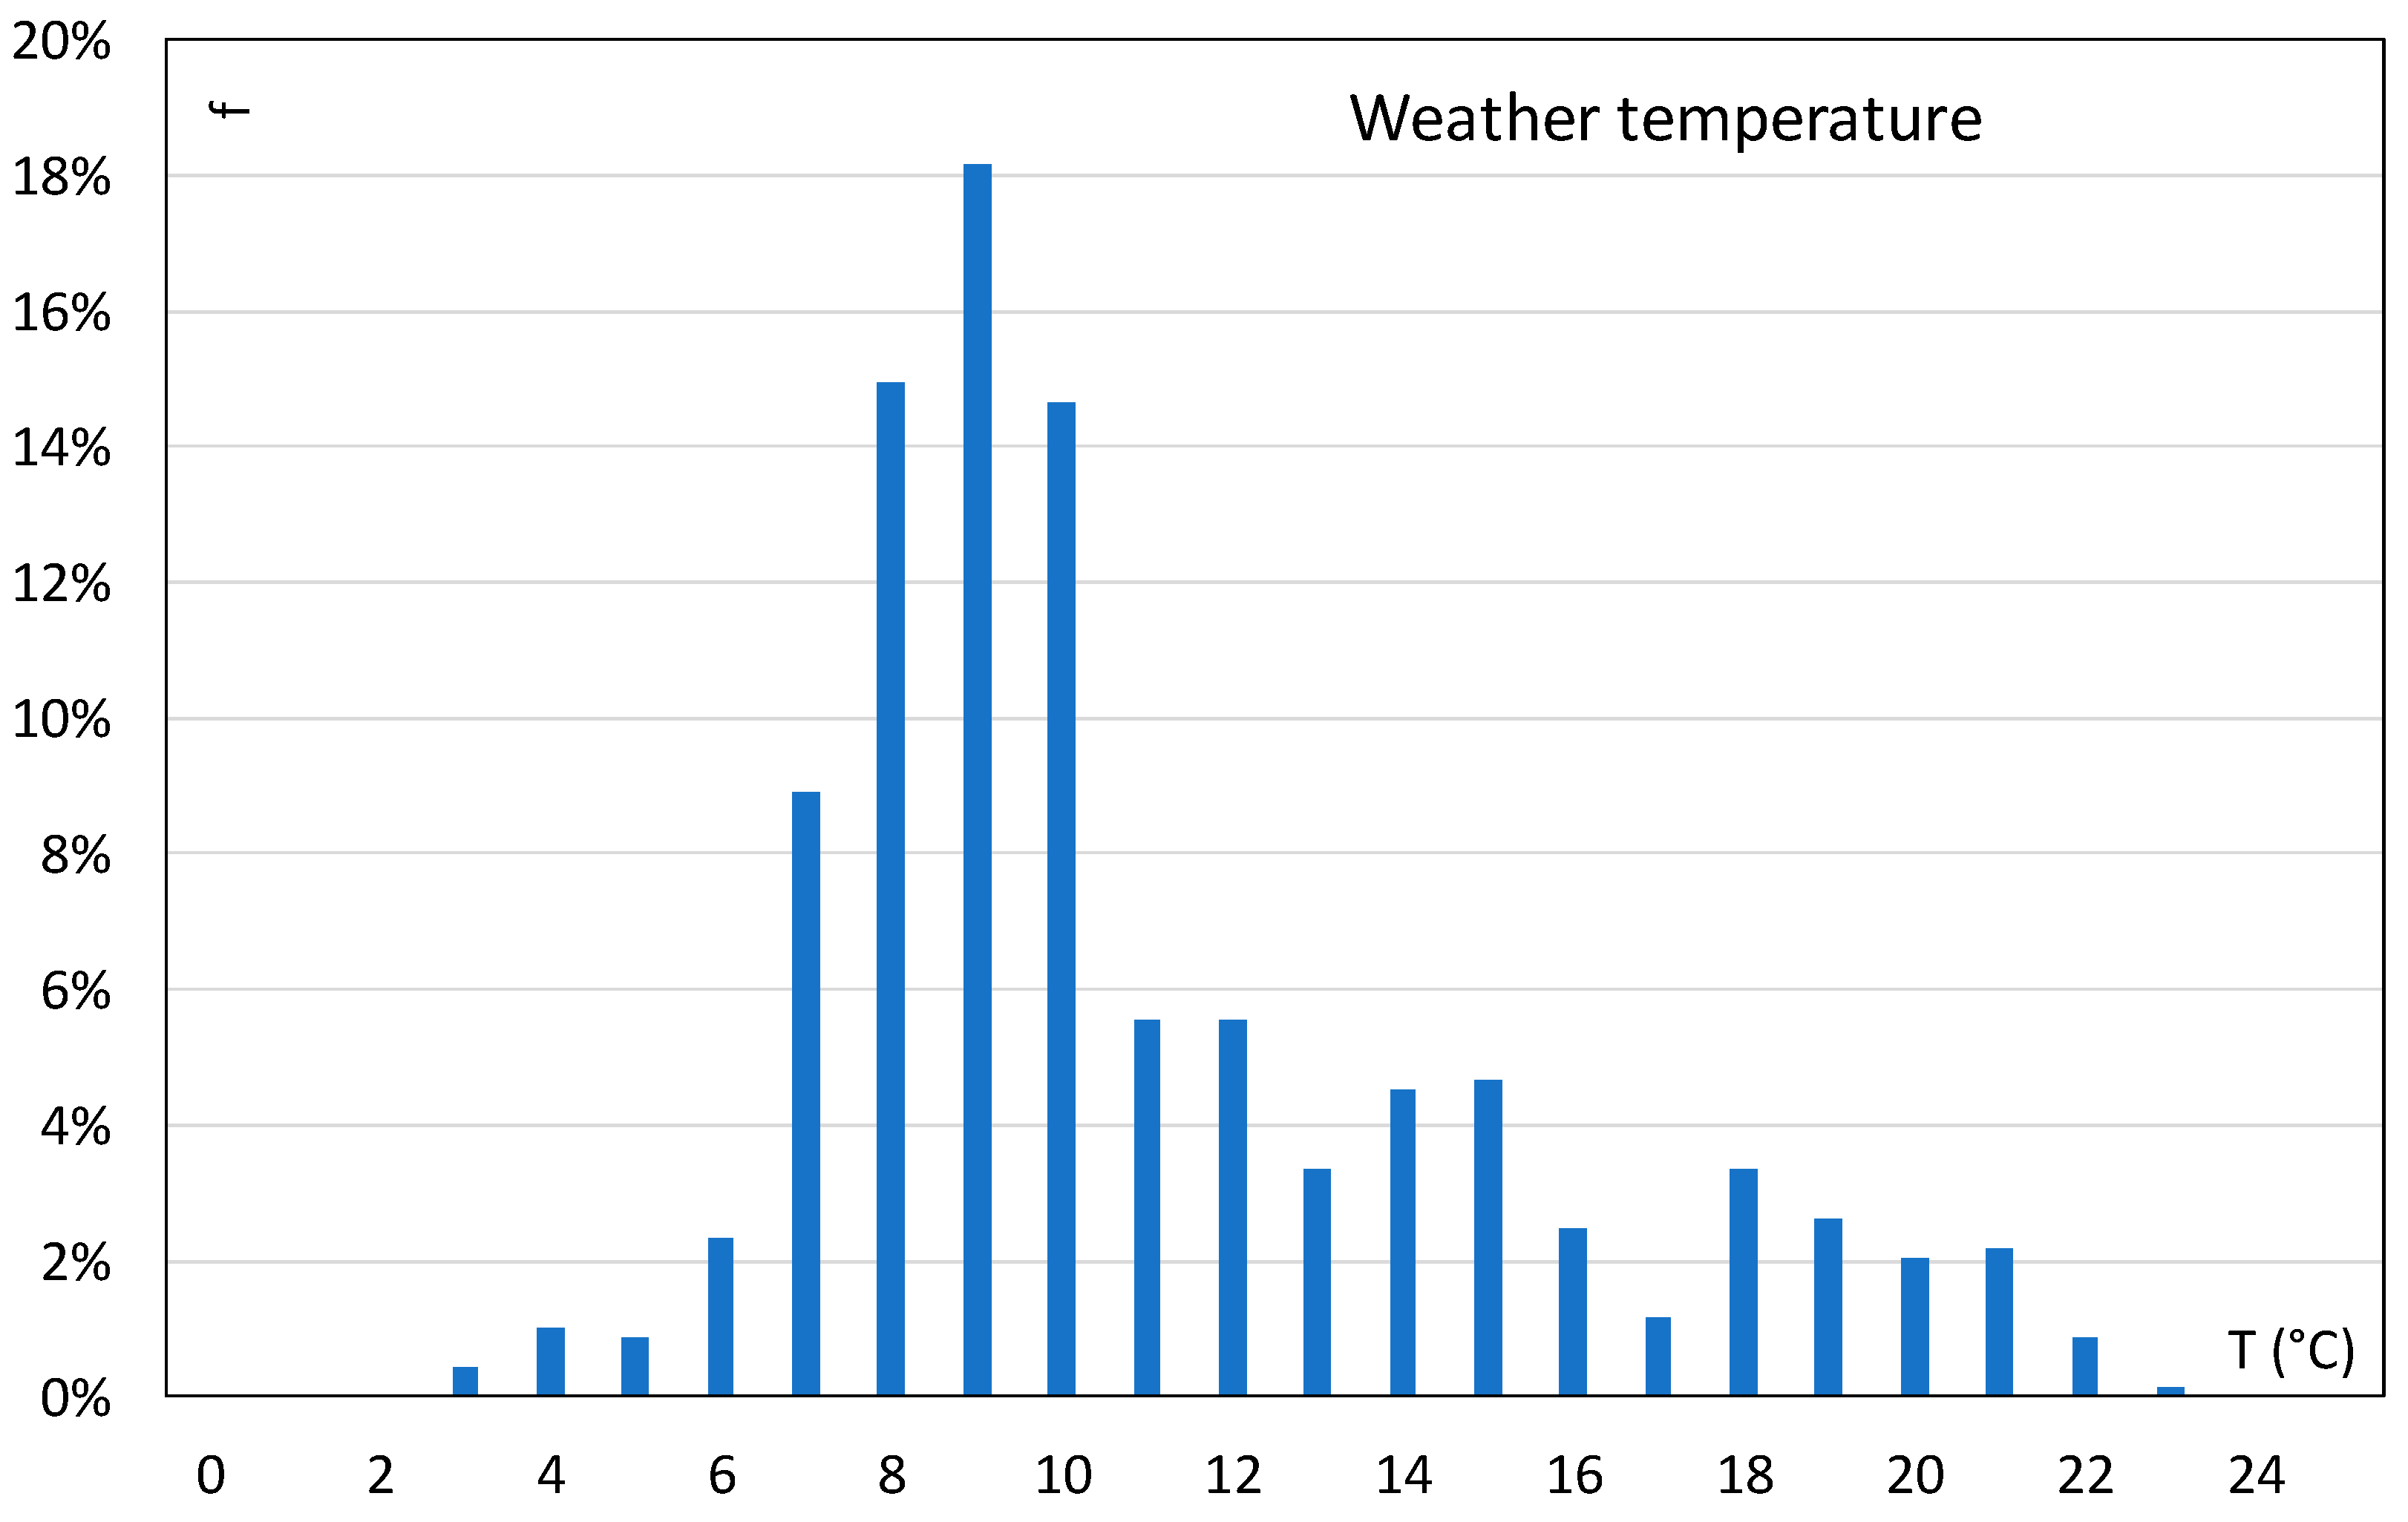
 - From 17 to 25 April, the weather temperature abruptly dropped, with reduced sun and the presence of precipitation on various days. The average weather temperature reduced to 11 °C, with low peaks down to 2.5 °C during the night. During the period, a high variability of weather temperature occurred (Figure 9). In these conditions, the hallway of the piglets’ building started to drop its ambient temperature, and the heat pump automatically activated to provide the necessary comfort by extracting the heat from the borehole heat exchangers (BHEs) of the BTES and, working in hybrid mode, from the ambient air.
 Figure 9. Frequency distribution of weather temperatures measured through temperature sensors integrated in the PVT system in the period 17–24 April.
The two consecutive periods are then representative of the sequence injection—the extraction of the PVT-BTES-DSHP system. Knowing the amount of antifreeze in the system (unavoidable for the safety of the PVT panels), it is then possible to calculate, by the standard Equation (2), the stored energy in the BTES [23].
where (Tin,i − Tout,i) is the fluid temperature difference between the inlet and outlet of the BTES at step i (K), Qi is the fluid flow at step i (m3 s−1), cp is the fluid specific heat (J kg−1·K−1), ρ is the fluid density (kg m−3), and (ti − ti-1) is the reference period step for the energy calculation (s).
It is worth noticing that, for environmental protection and technical reasons (the reduced heat stress of the BTES pipes) the imposed maximum temperature of the injected water inside the BTES is 35 °C. After reaching this threshold, the recirculation of the fluid in the solar central station occurs.
At the beginning of the period, the equivalent ground temperature in the BTES is measured at around 12 °C. Since it was April, this value was the result of the several working hours of the DSHP for heat extraction in the previous winter. Using Equation (3), it is then possible to estimate the equivalent ground temperature in the BTES at the end of the solar heat injection period [23]
where Tg,i is the equivalent ground temperature before heat injection (°C), Tg,f is the equivalent ground temperature after heat injection (°C), E is the total heat injection (J), cg is the equivalent ground thermal capacity (J m−3·K−1), r is the radius of the area covered by the BTES (m), and H is the depth of the ground covered by the BTES (m).
The equivalent ground thermal capacity was previously obtained by thermal response tests (TRT) and it is around 1.7 MJ m−3·K−1 [19]. With respect to the radius and depth of the area affected, the geometry of the BTES is considered. Moreover, thanks to the piezometers and the monitoring points located upwards and downwards of the BTES (with respect to groundwater flow), it is verified that the heat pulse does not go beyond the BTES geometry [20]. With such premises, an increase in the ground temperature in the BTES of around 0.7 °C is expected due to solar injection.
3. Results and Discussion
3.1. Implementation of the Integrated RES System
Hydrogeological data were gathered about the site and TRTs were carried out to determine the most suitable depth for the BTES field. Based on these results, the potential for underground thermal storage was quantified, heat dispersion due to groundwater movement was assessed, and the BTES behavior was modeled under different operational scenarios. A depth of 30 m was deemed the most efficient solution and, on such a basis, eight BHEs of this depth were drilled for the BTES field as a result of system dimensioning [19]. To create a Thermal Core (TC) at the center of the BTES system for optimal thermal storage, hybrid connections were employed among the BHEs in series/parallel configurations. Heat was thus injected from the TC to the boundaries during heat storage, resulting in a higher temperature rise compared to different configurations. During the exploitation phase, heat was extracted first from the boundaries and then from the TC. The BTES field, designed to meet the thermal loads of a weaners’ nursery building, consisted of 4 × 2 BHEs arranged in a rectangular configuration, spaced 3 m apart in the North–South direction and 2 m apart in the East–West direction to optimize land use in the farmyard.
The DSHP could harness energy from the ground, air, or a combination of both, depending on two user-defined temperature thresholds. The system’s expected performance was evaluated based on its technical characteristics. The circulation of the vector fluid (a water and propylene glycol mixture, with a maximum glycol concentration of 35%) between the BTES and the DSHP was automated by the heat pump’s smart control system, which also regulated the circulation of the heating fluid within the livestock barn. The controller optimized system operations by selecting the most efficient temperature thresholds for switching between energy sources. Additionally, the circulation of the vector fluid between the PVT system and the BTES was managed by a solar station, ensuring that the injection fluid temperature remained below 35 °C, in compliance with regional environmental regulations for aquifer protection. The system commenced operation on 1 June 2023. During the summer months, solar heat was stored in the BTES, while in winter, the stored energy was extracted to heat the barn. Continuous year-round monitoring was conducted to assess the system performance and validate the accuracy of the initial design assumptions.
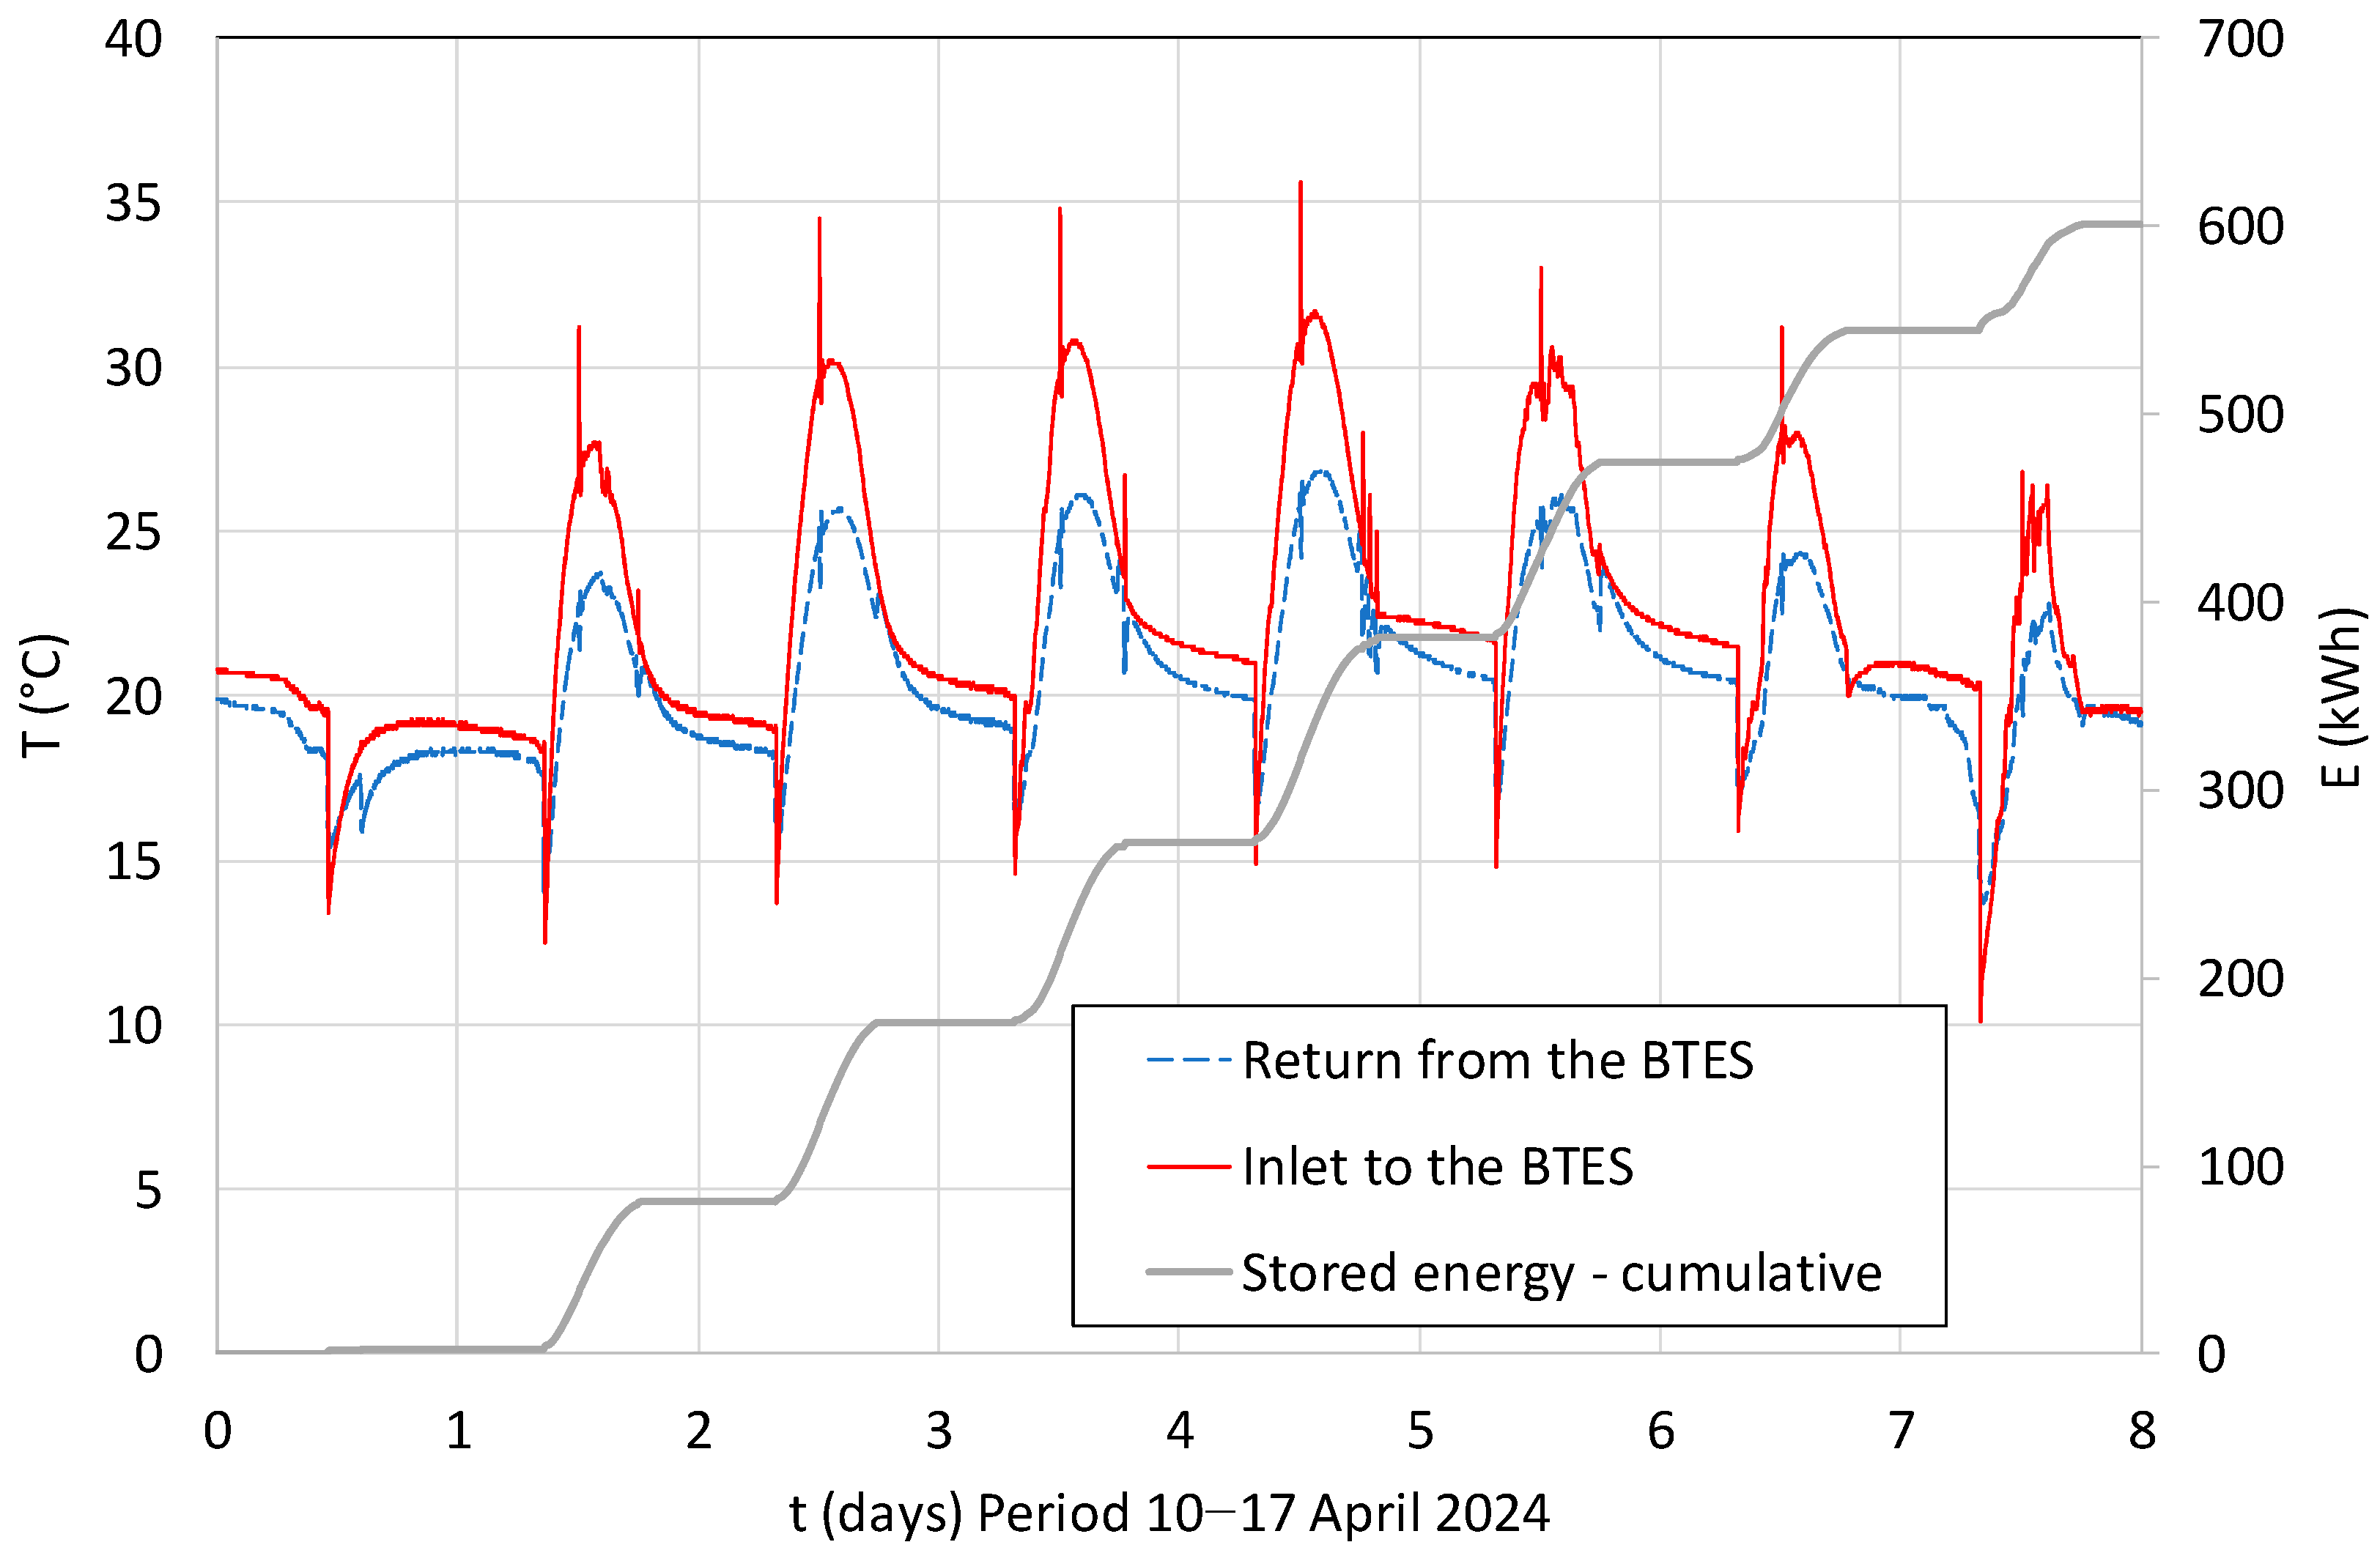
During the injection phase of solar energy into the BTES (10–17 April 2024), from the monitoring system it was possible to record the values from various sensor temperatures on the PVT and the BTES circuit (inlet/outlet) as well as the flow (average: 2530 L h−1). The calculated stored energy was around 2160 MJ, equal to 600 kWh, which is represented in cumulative form in Figure 10.

Figure 10.
Energy stored in the BTES in the period 10–17 April 2024 and the related inlet and outlet temperatures.
3.2. Performance of the Integrated RES Heating System
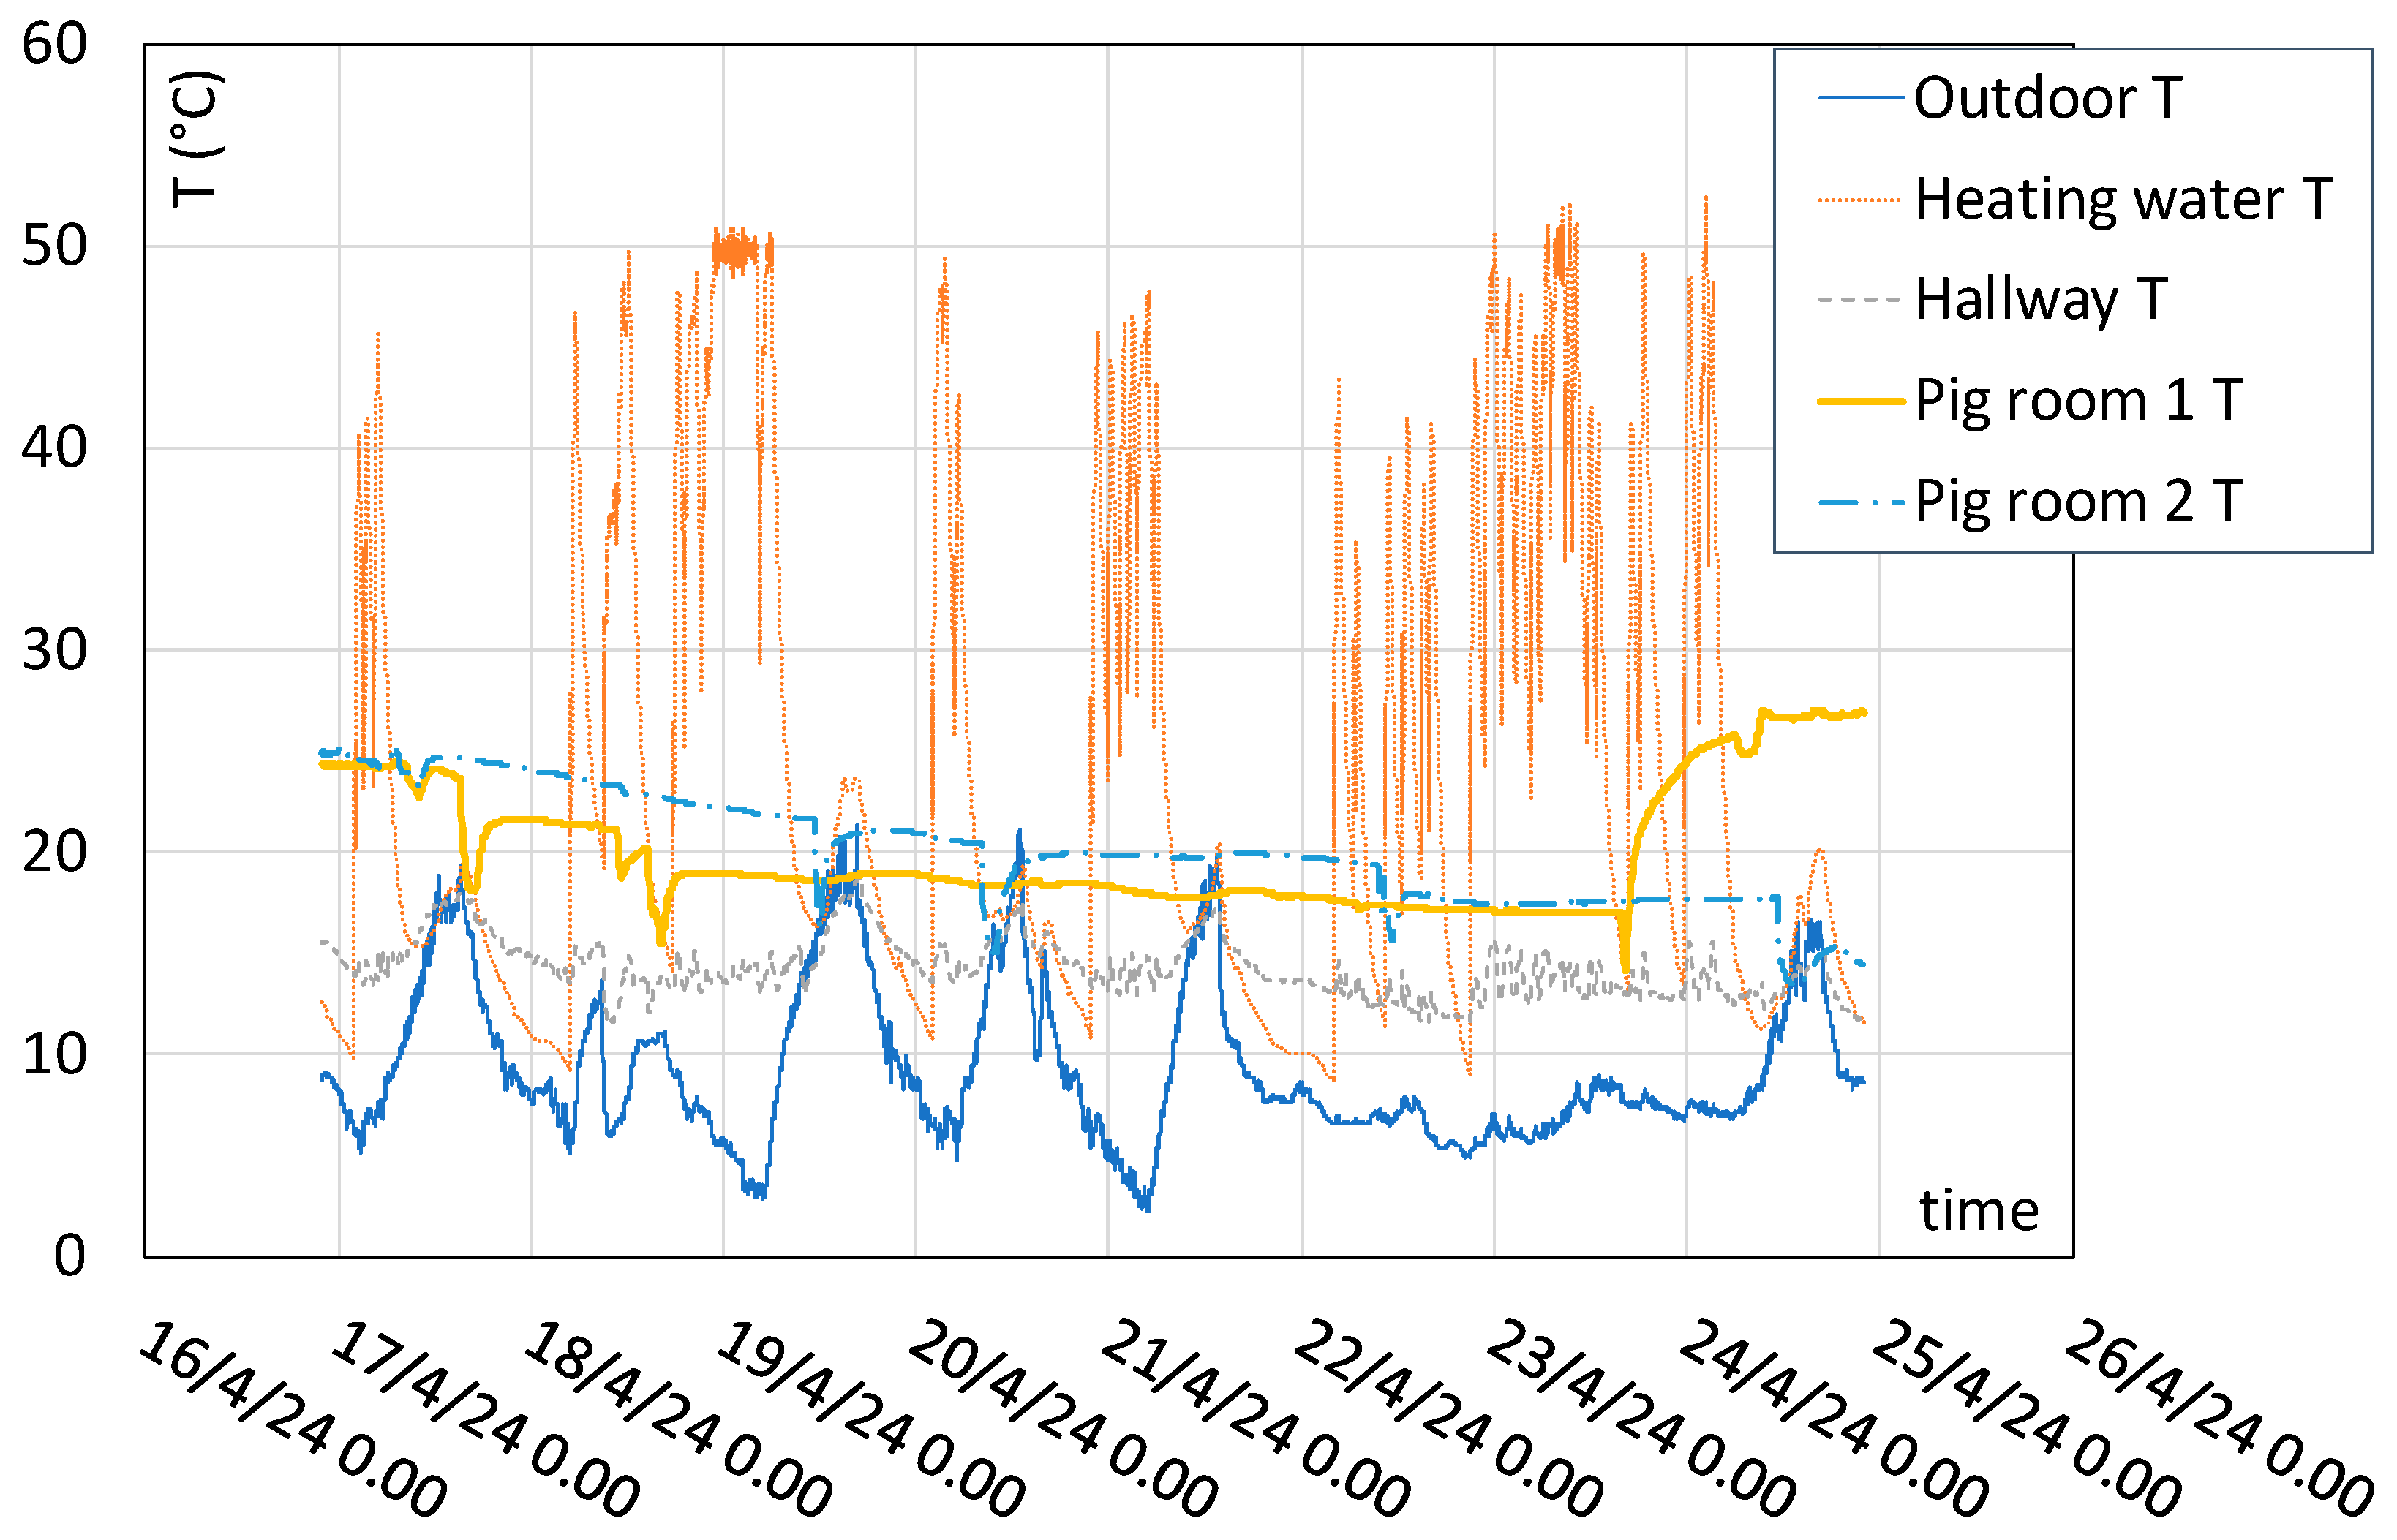
The integrated heating system was analyzed on the basis of the temperature and humidity data recorded in the period 17–24 April 2024. In this week, outside temperatures proved to be significantly low, with 9.2 °C as the average and 2.9 °C as the minimum value, thus calling for almost continuously heating the hallway through the DSHP. The temperature in the hallway was then kept above the setpoint of 15 °C (with a tolerance interval of 0.5 °C) for the period considered, with the temperature in the finned pipes reaching over 50 °C in several periods. The two monitored rooms, indicated in Figure 1, hosted weaners until 17 April, and room 1 also hosted weaners from 24 April. However, other rooms in the building hosted weaners also in the period 18–23 April, which was why the hallway was continuously kept heated during the entire period. The trend of the temperature of the heating water is shown in Figure 11, together with the temperature in the hallway, which was thus stabilized around the target level, in comparison with the outdoor temperature.
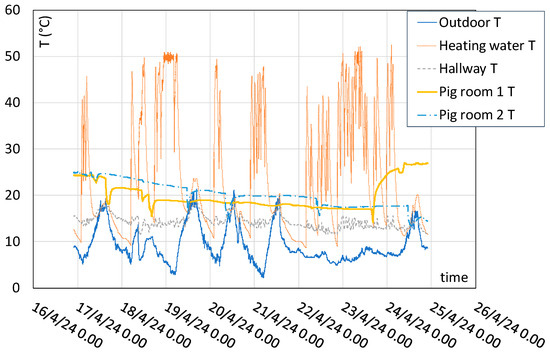
Figure 11.
Measured values of temperature trends of the heating water and ambient temperature of the hallway and pig rooms, compared with the outdoor temperature in the study period.
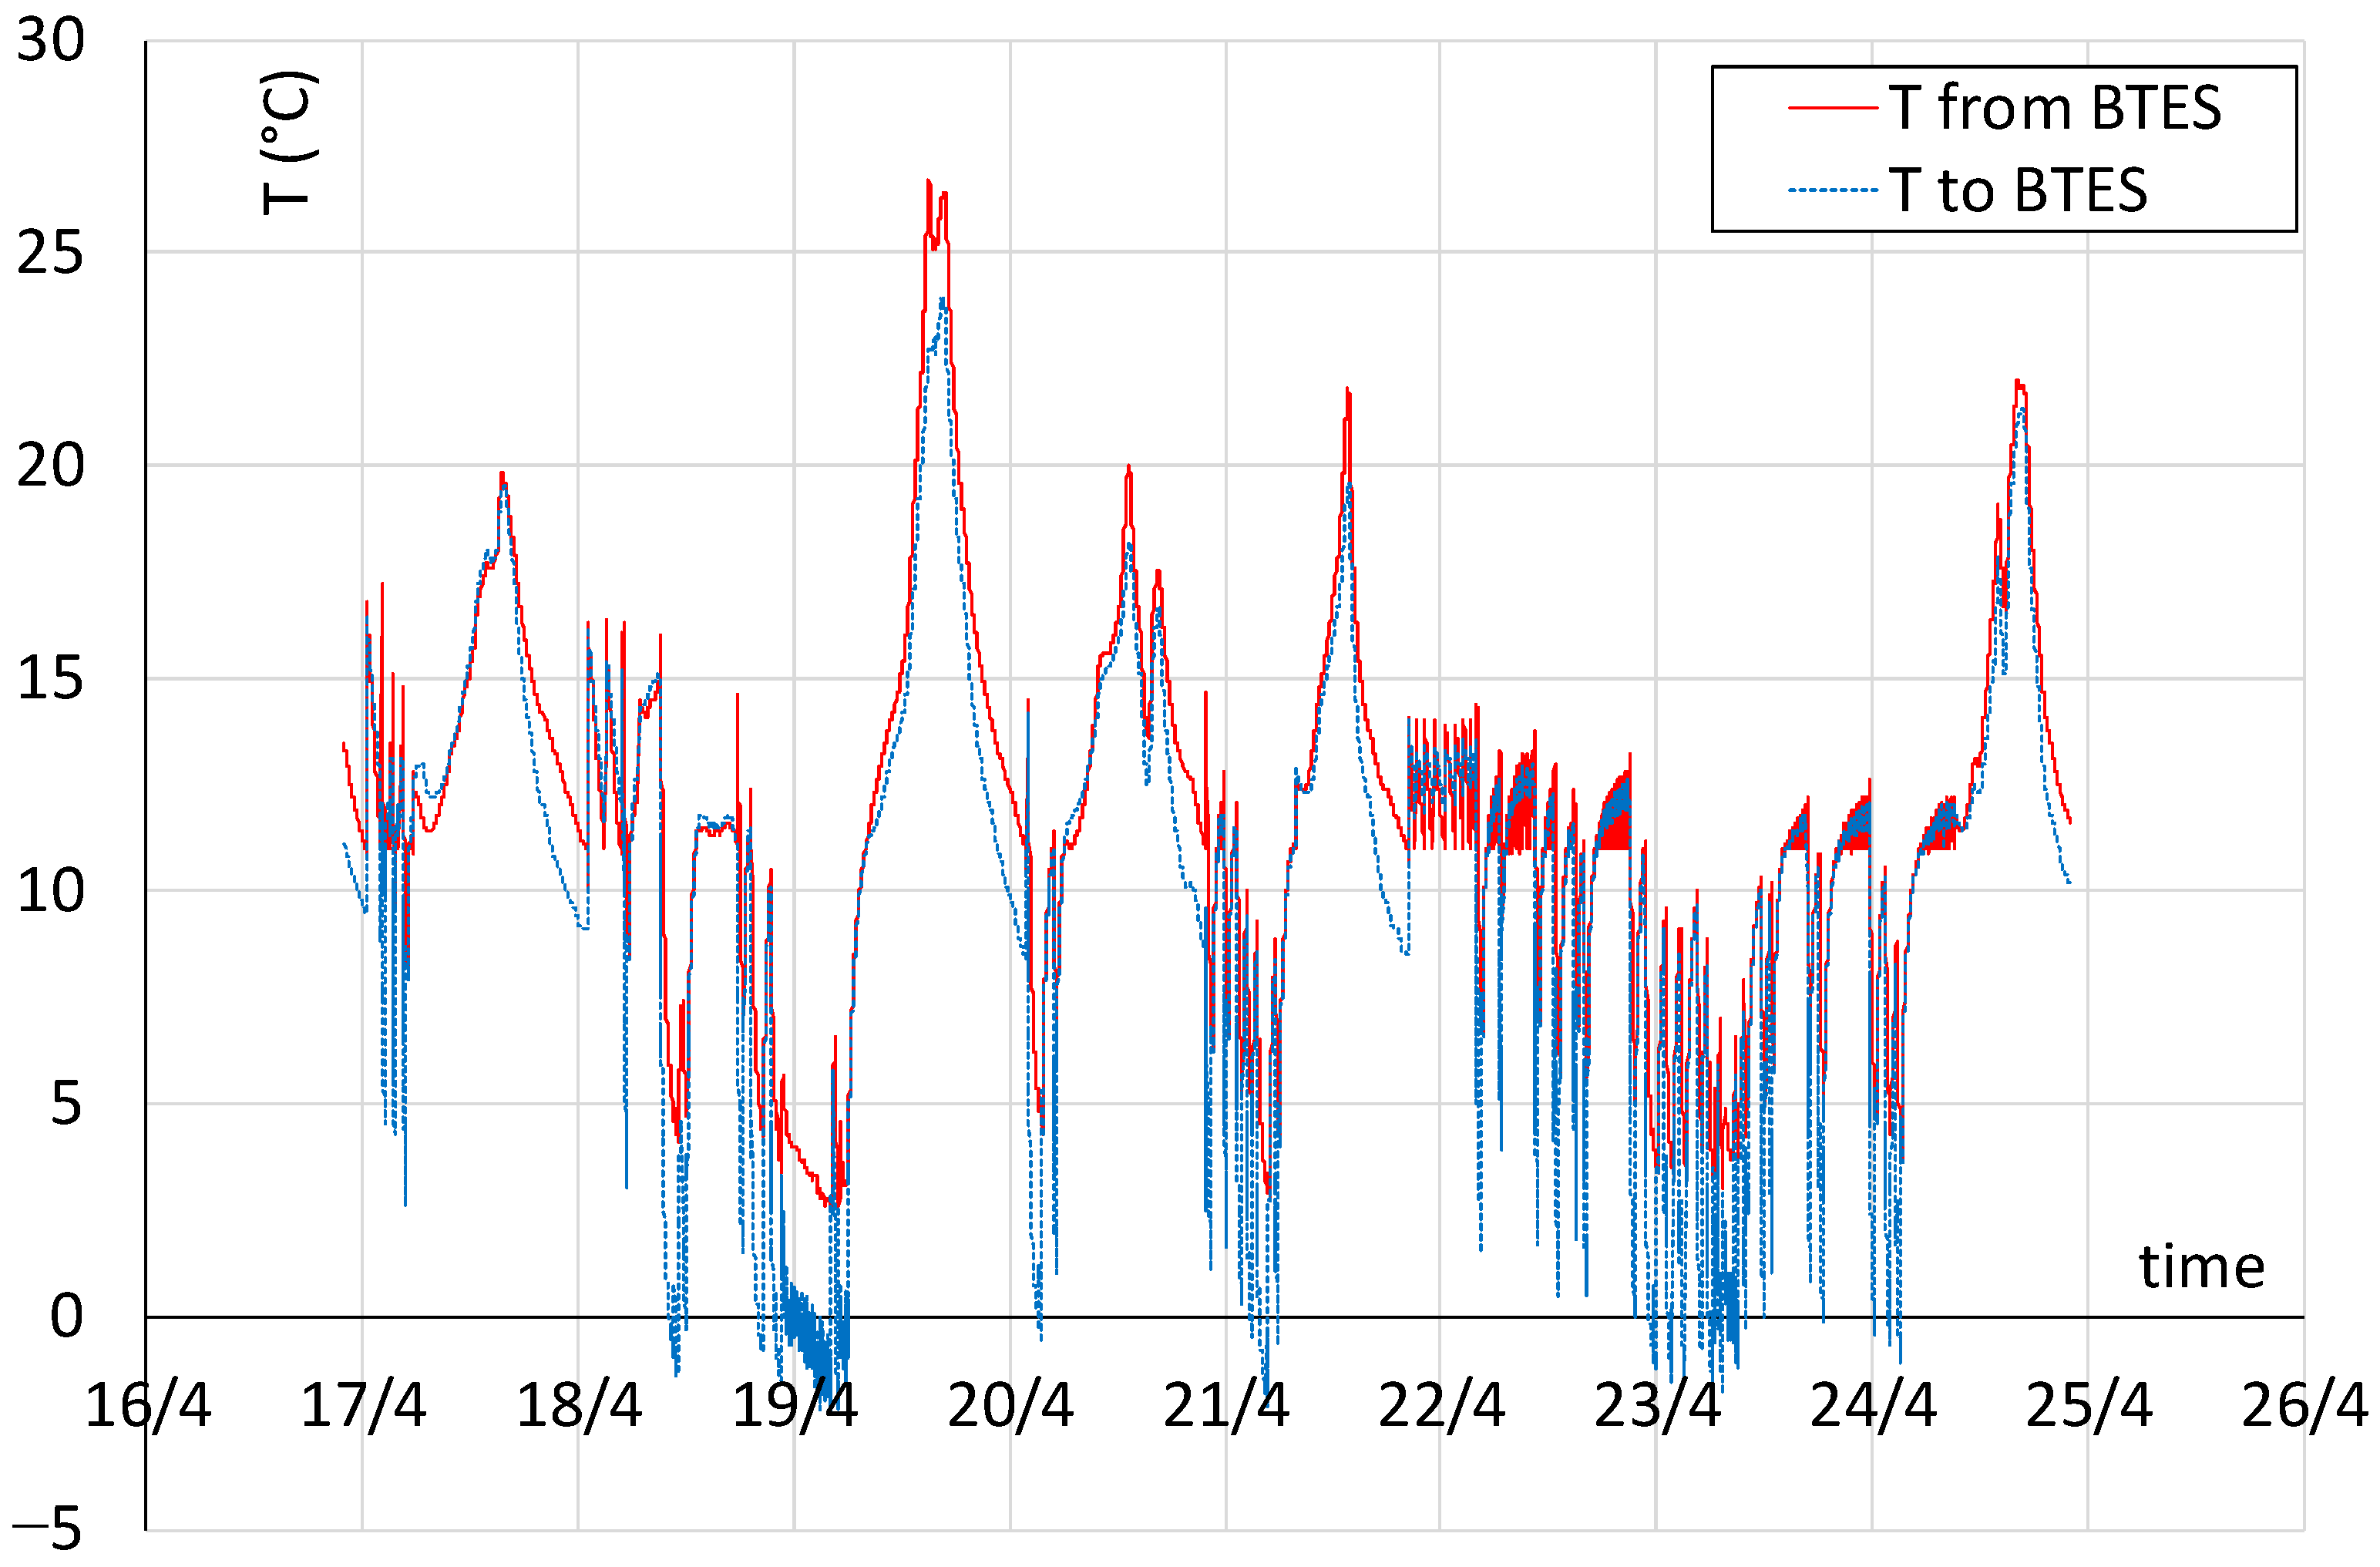
Thanks to this thermal condition, the temperature in the pig rooms proved to be kept at the above-mentioned values. The heating performance of the DSHP was made possible by the exploitation of the thermal energy storage in the BTES, which was expressed by the values of the water circulating between DSHP and BTES, as represented in Figure 12. The diagram highlights that the geothermal source was always used during the working time of the heating system and that the circulation through the BHEs produced a temperature increase up to 9.1 K in the cold side of the DSHP. The average temperature difference between the flows from and to BTES during the period analyzed was 3.0 K.
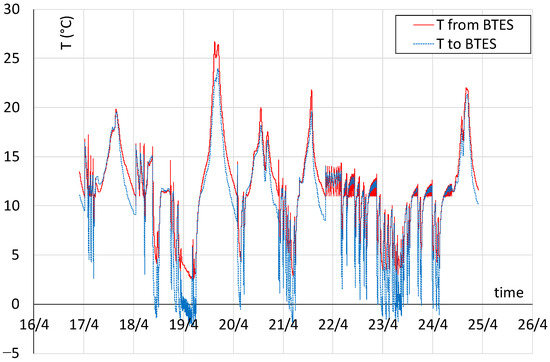
Figure 12.
Measured values of the temperatures of the water circulating from the BTES to the cold side of the DSHP and of the cooled water.
3.3. Performance of the Hybrid Geothermal–Air Heat Pump
The DSHP extracting energy from the BTES is a 35 kW hybrid heat pump able to harness heat from the ground only, air only, or in a hybrid mode. All working parameters of the machine are measured, and the target is to find an optimized solution to maximize the Seasonal Performance Factor (SPF), which is intended to be the ratio between the total thermal energy provided to the building and the fully absorbed electrical energy in the heating season. During the period 17–25 April 2024, when indoor heating was necessary, the DSHP worked only in heating mode, but it was designed to reverse the circulation for cooling, too.
The imposed temperatures for the hallway and the heat pump are as follows:
- The hallway must keep a minimum temperature of 14 °C;
- The outlet heating temperature from the DSHP to the hallway can reach a maximum of 50 °C;
- The upper limit of the cooling water temperature to deactivate the circulation pump is 10 °C;
- The ground is the preliminary source of heat for the heat pump (GEO mode);
- The standard temperature difference between the inlet and outlet from the ground side is about 3 K;
- The lower limit of the inlet ground temperature to the DSHP for activating the fans (HYBRID mode) is 3 °C;
- The lower limit of the inlet ground temperature to the DSHP for deactivating the geothermal mode is 2 °C (air mode).
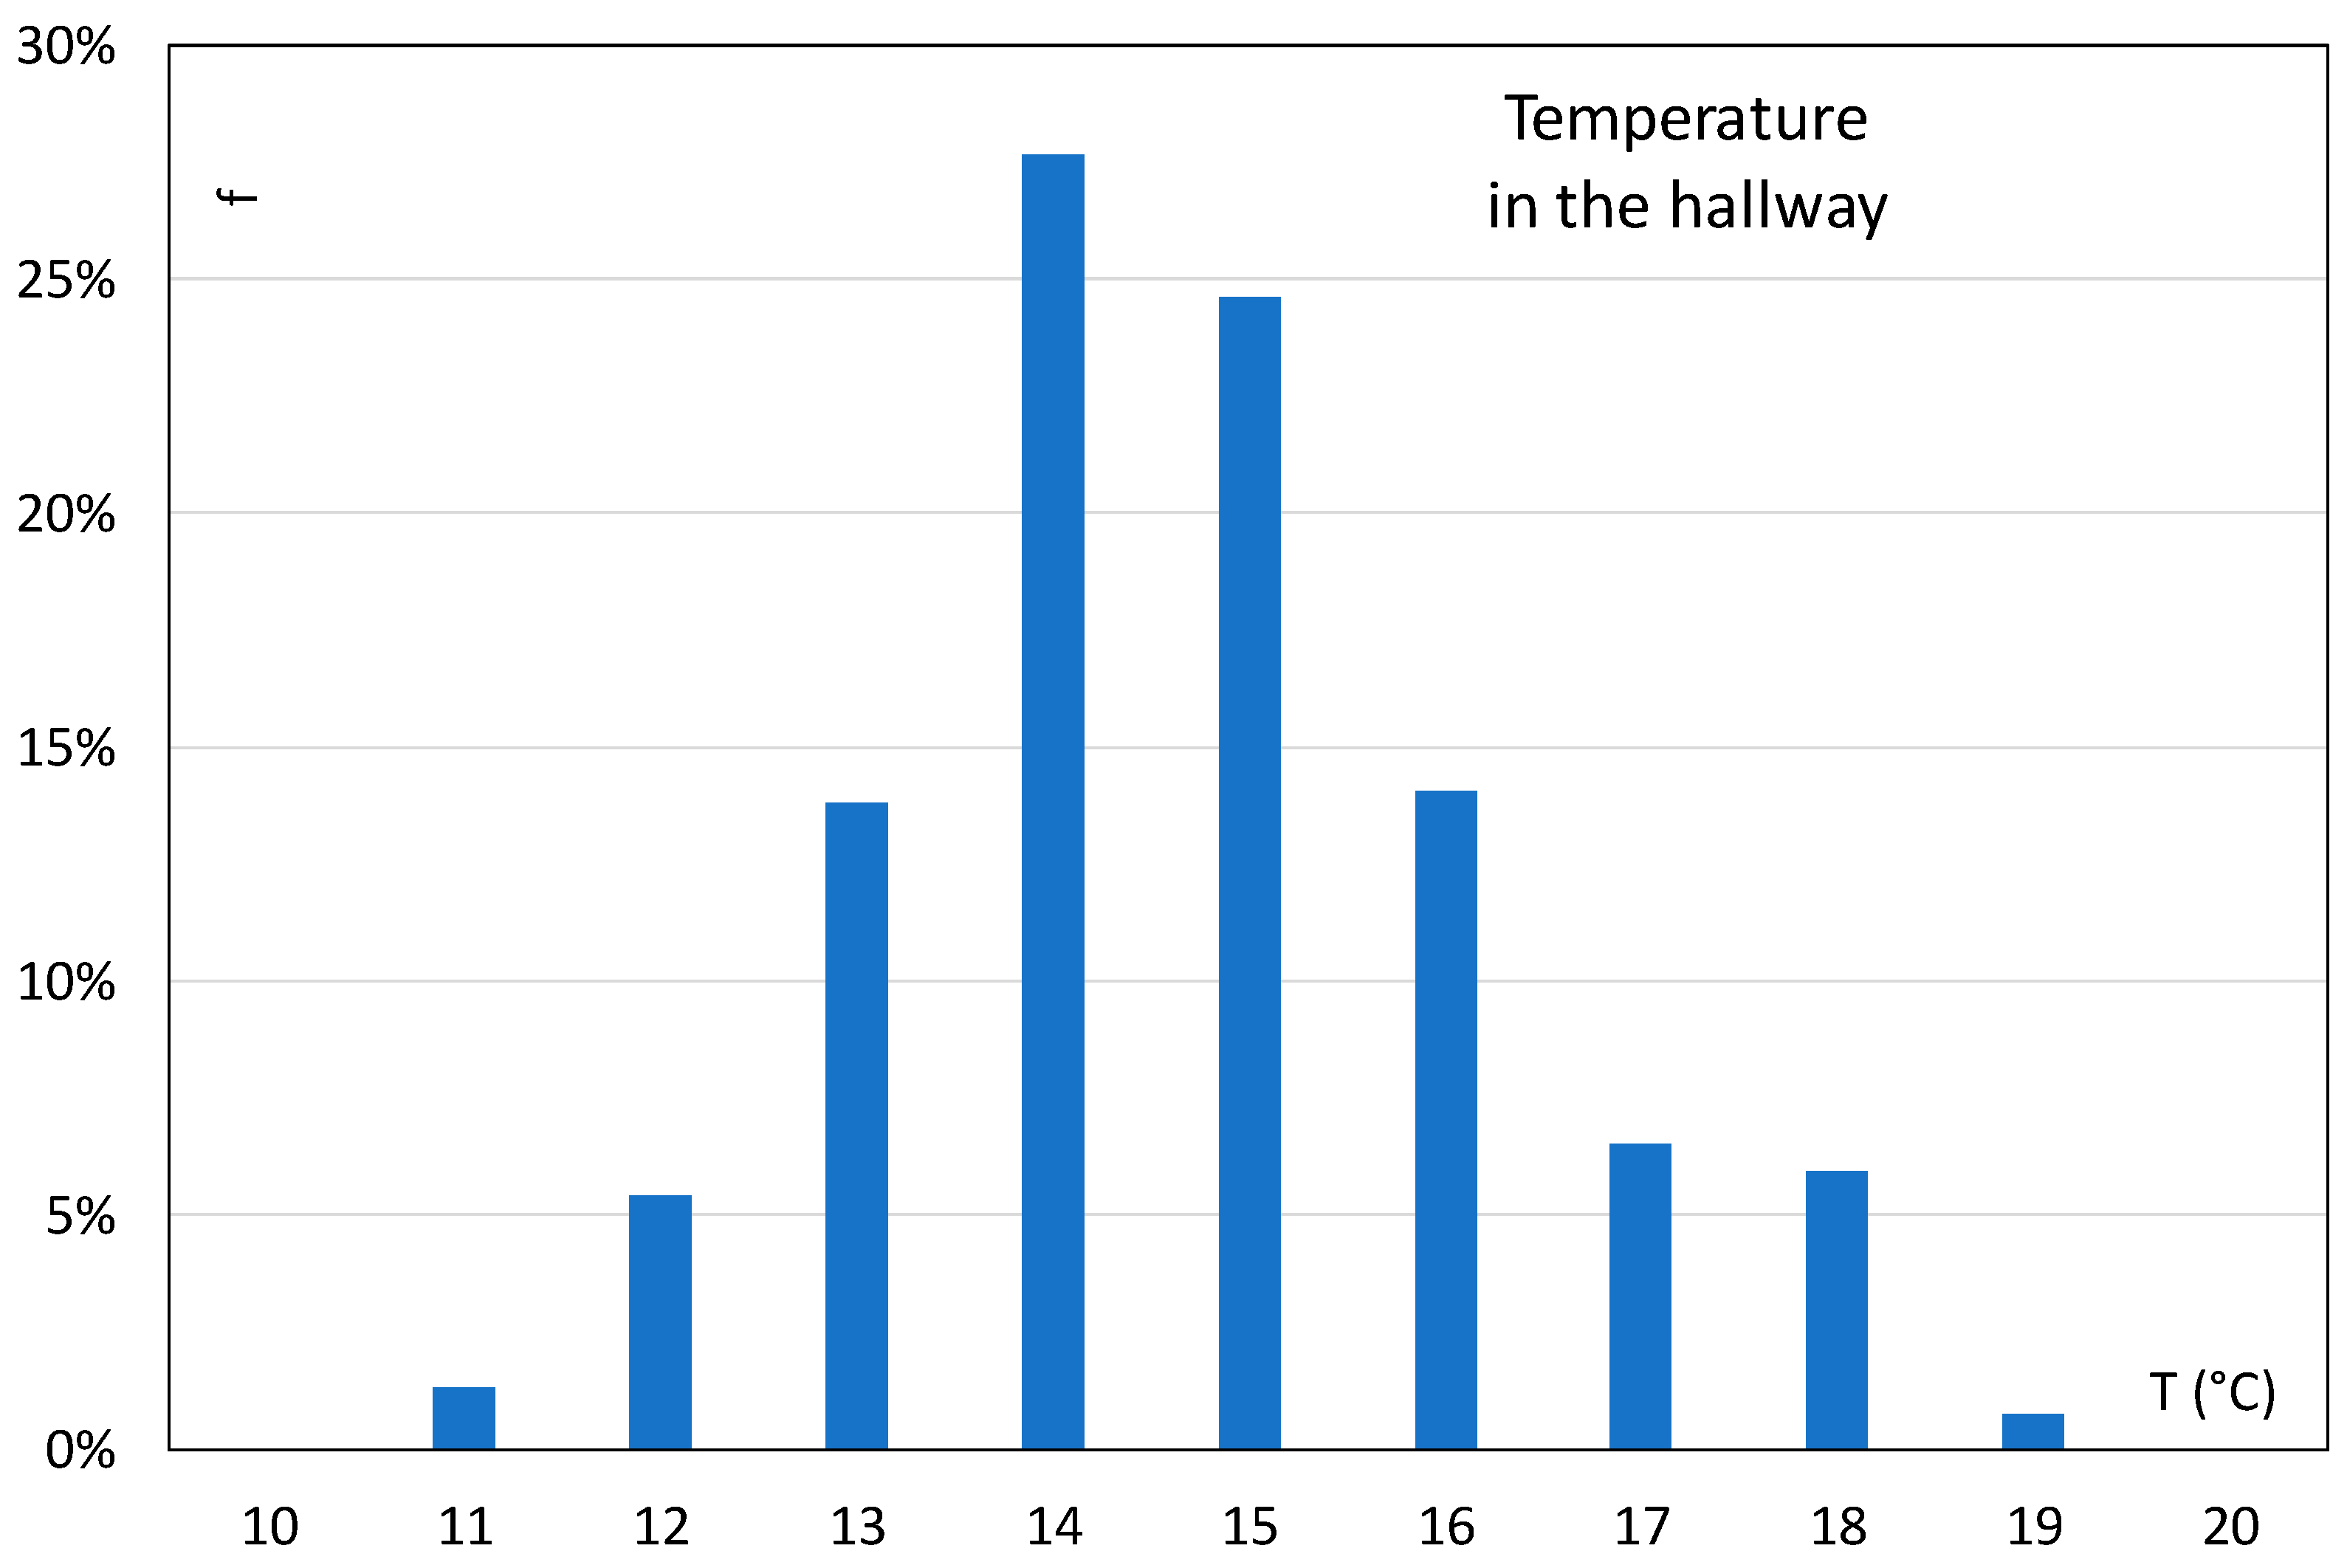
The heat pump system was almost able to retain the minimum temperature of the hallway in the period. The measured temperature data in the hallway are represented in Figure 13.

Figure 13.
Frequency distribution of temperature in the hallway in the period 17–24 April.
Comparing the frequency distributions and statistics of weather temperature and temperature in the hallway, it was possible to verify that the stability of the internal temperature was achieved (Table 1).

Table 1.
Comparison of statistics on weather temperature and temperature in the hallway for the same period.
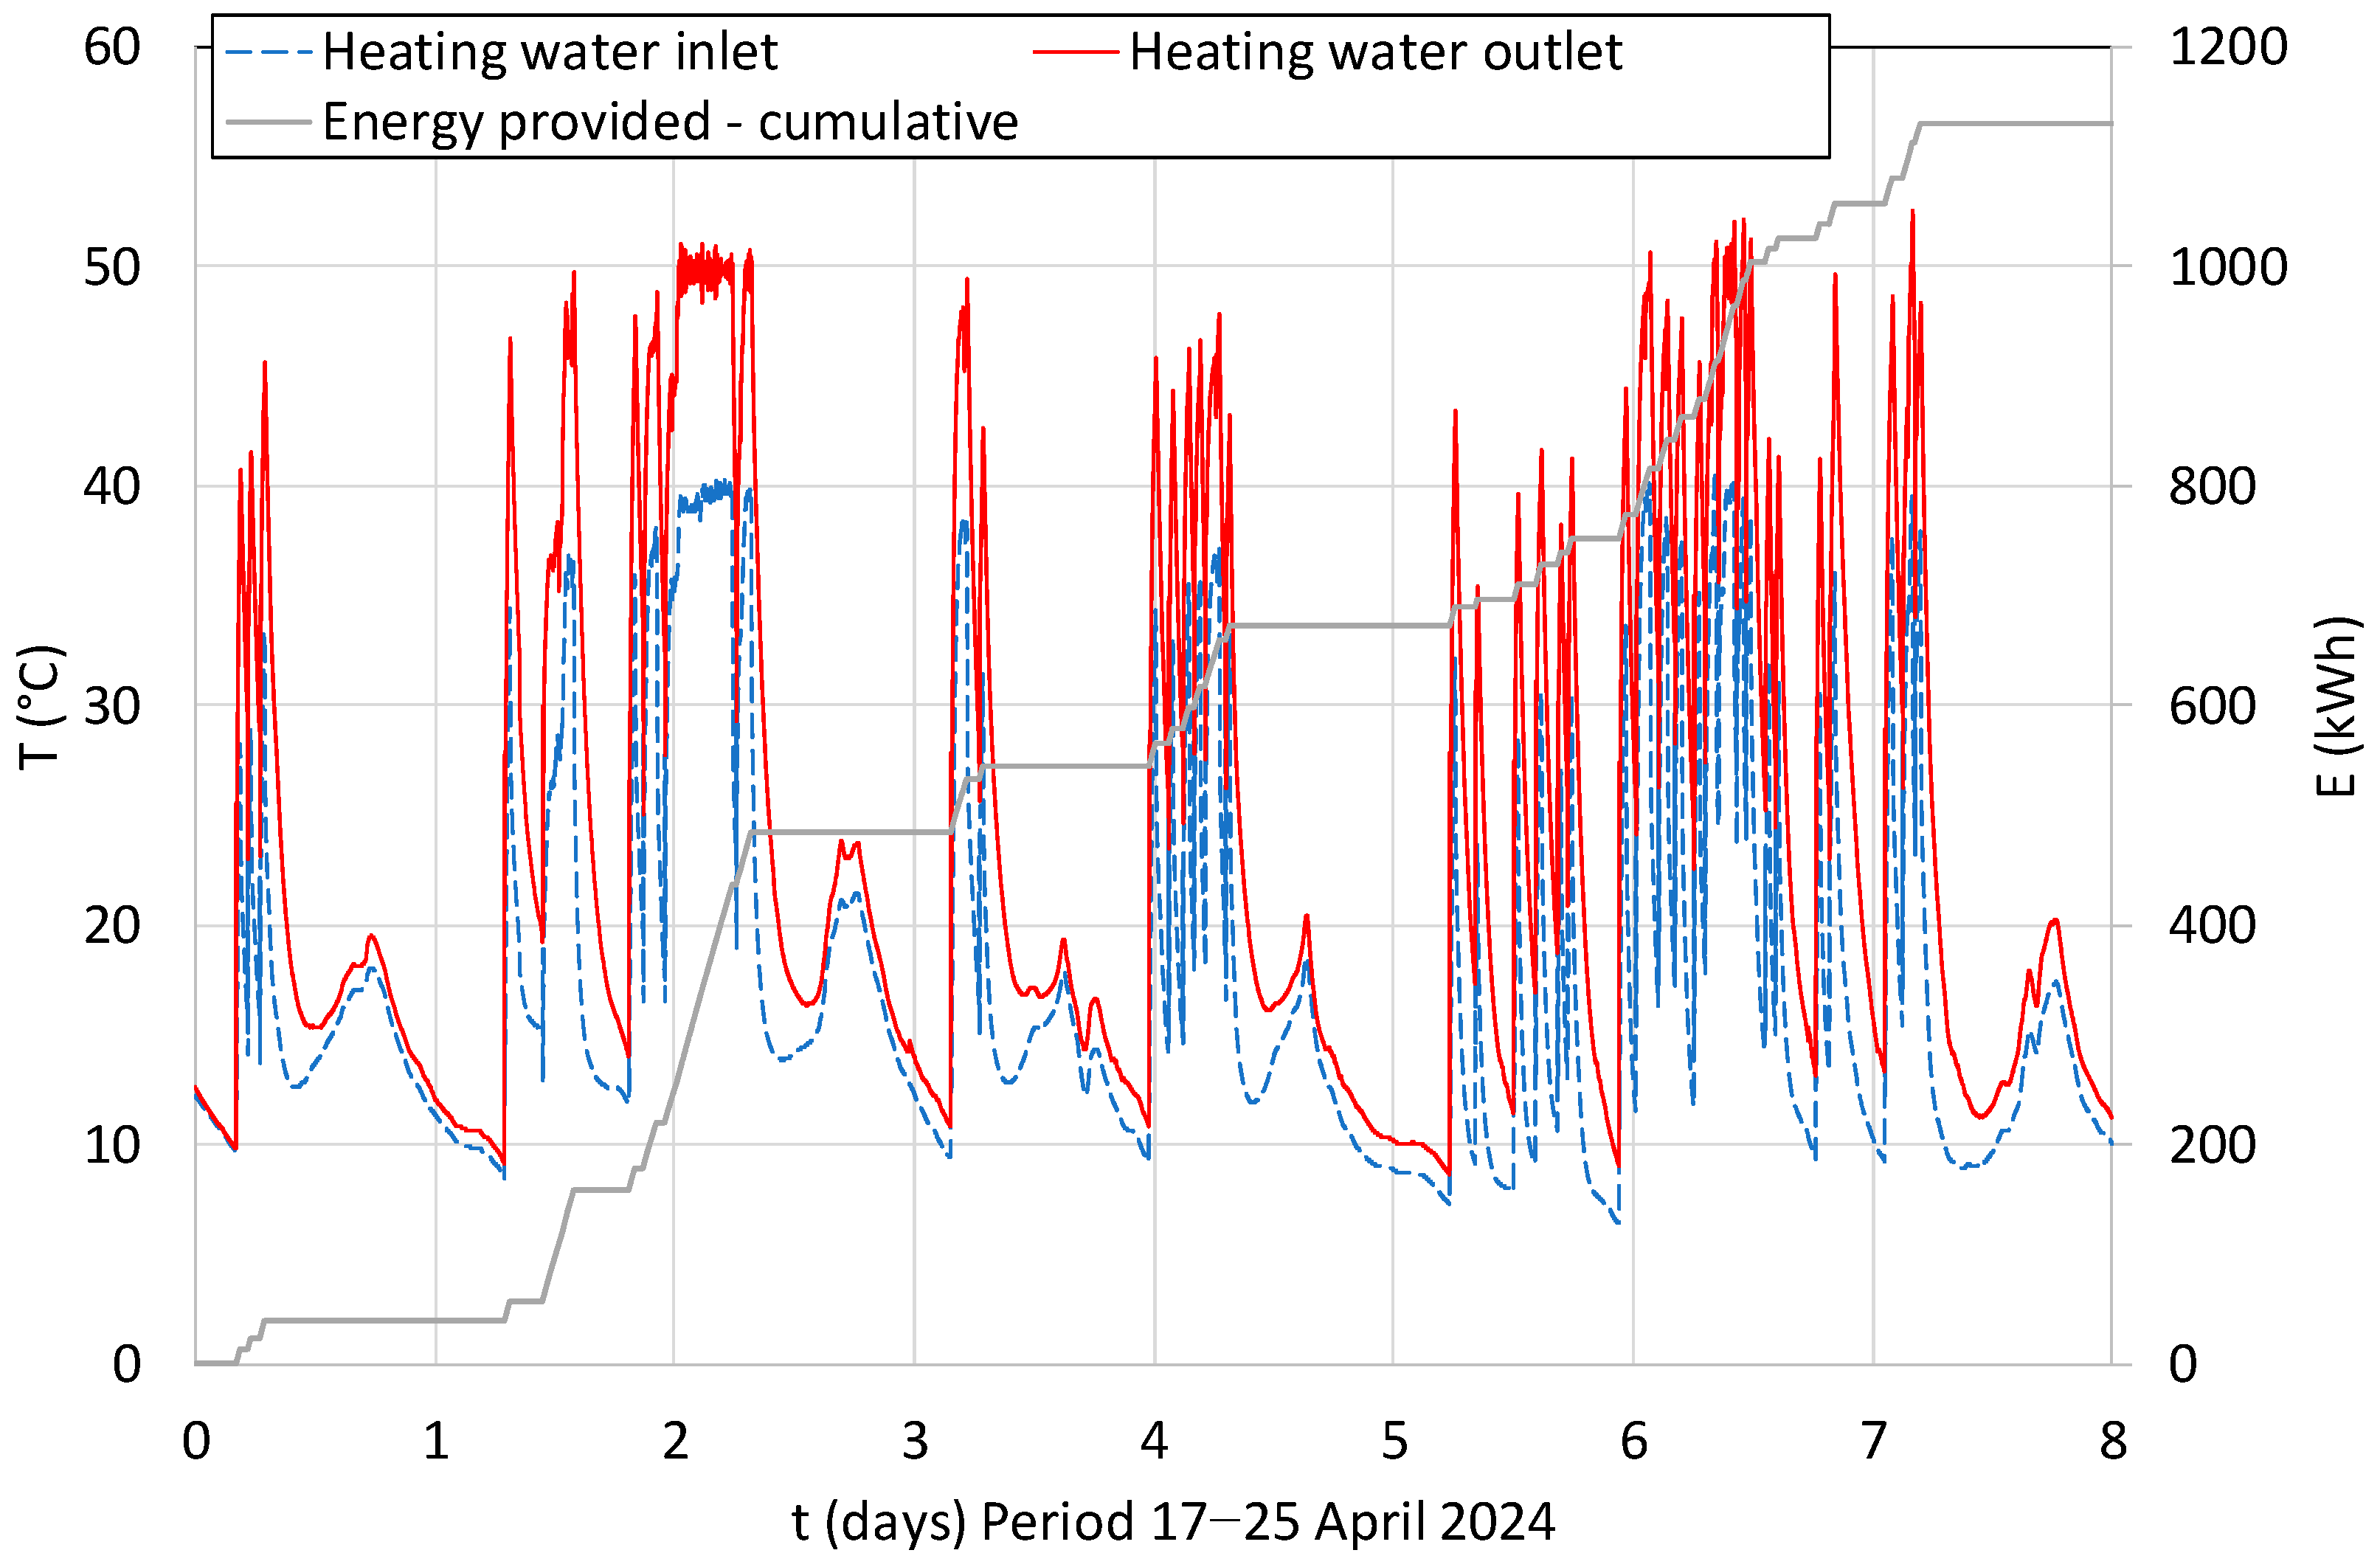
This result was possible by the work of the DSHP, which was activated 17.4% of the time. The heating fluid temperature and the cumulative energy provided are presented in Figure 14.
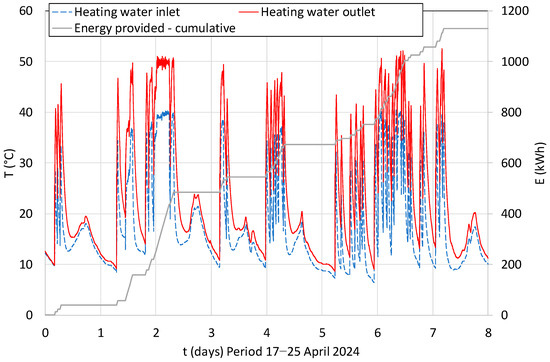
Figure 14.
Measured values of the inlet and outlet temperatures of the finned pipes in the hallway in the period 17–25 April 2024 and the relevant energy provided by the DSHP.
The extracted energy from the BHE and air was obtained by measurements, as well as the absorbed electrical energy of all devices (compressor, pumps, fans, etc.). Therefore, the energy provided by ambient sources in the heat pump cycle is given by Equation (4) [24].
where Ea is the ambient energy, Ep is the energy provided to the building, and El is the electric energy absorbed.
The energy provided to the building was around 1200 kWh, while the electric energy absorbed was around 300 kWh, and the remaining 900 kWh were provided by the ambient sources (Figure 14). In such conditions, for the analyzed period, the SPF was 4.02, on the basis of Equation (5) [24]
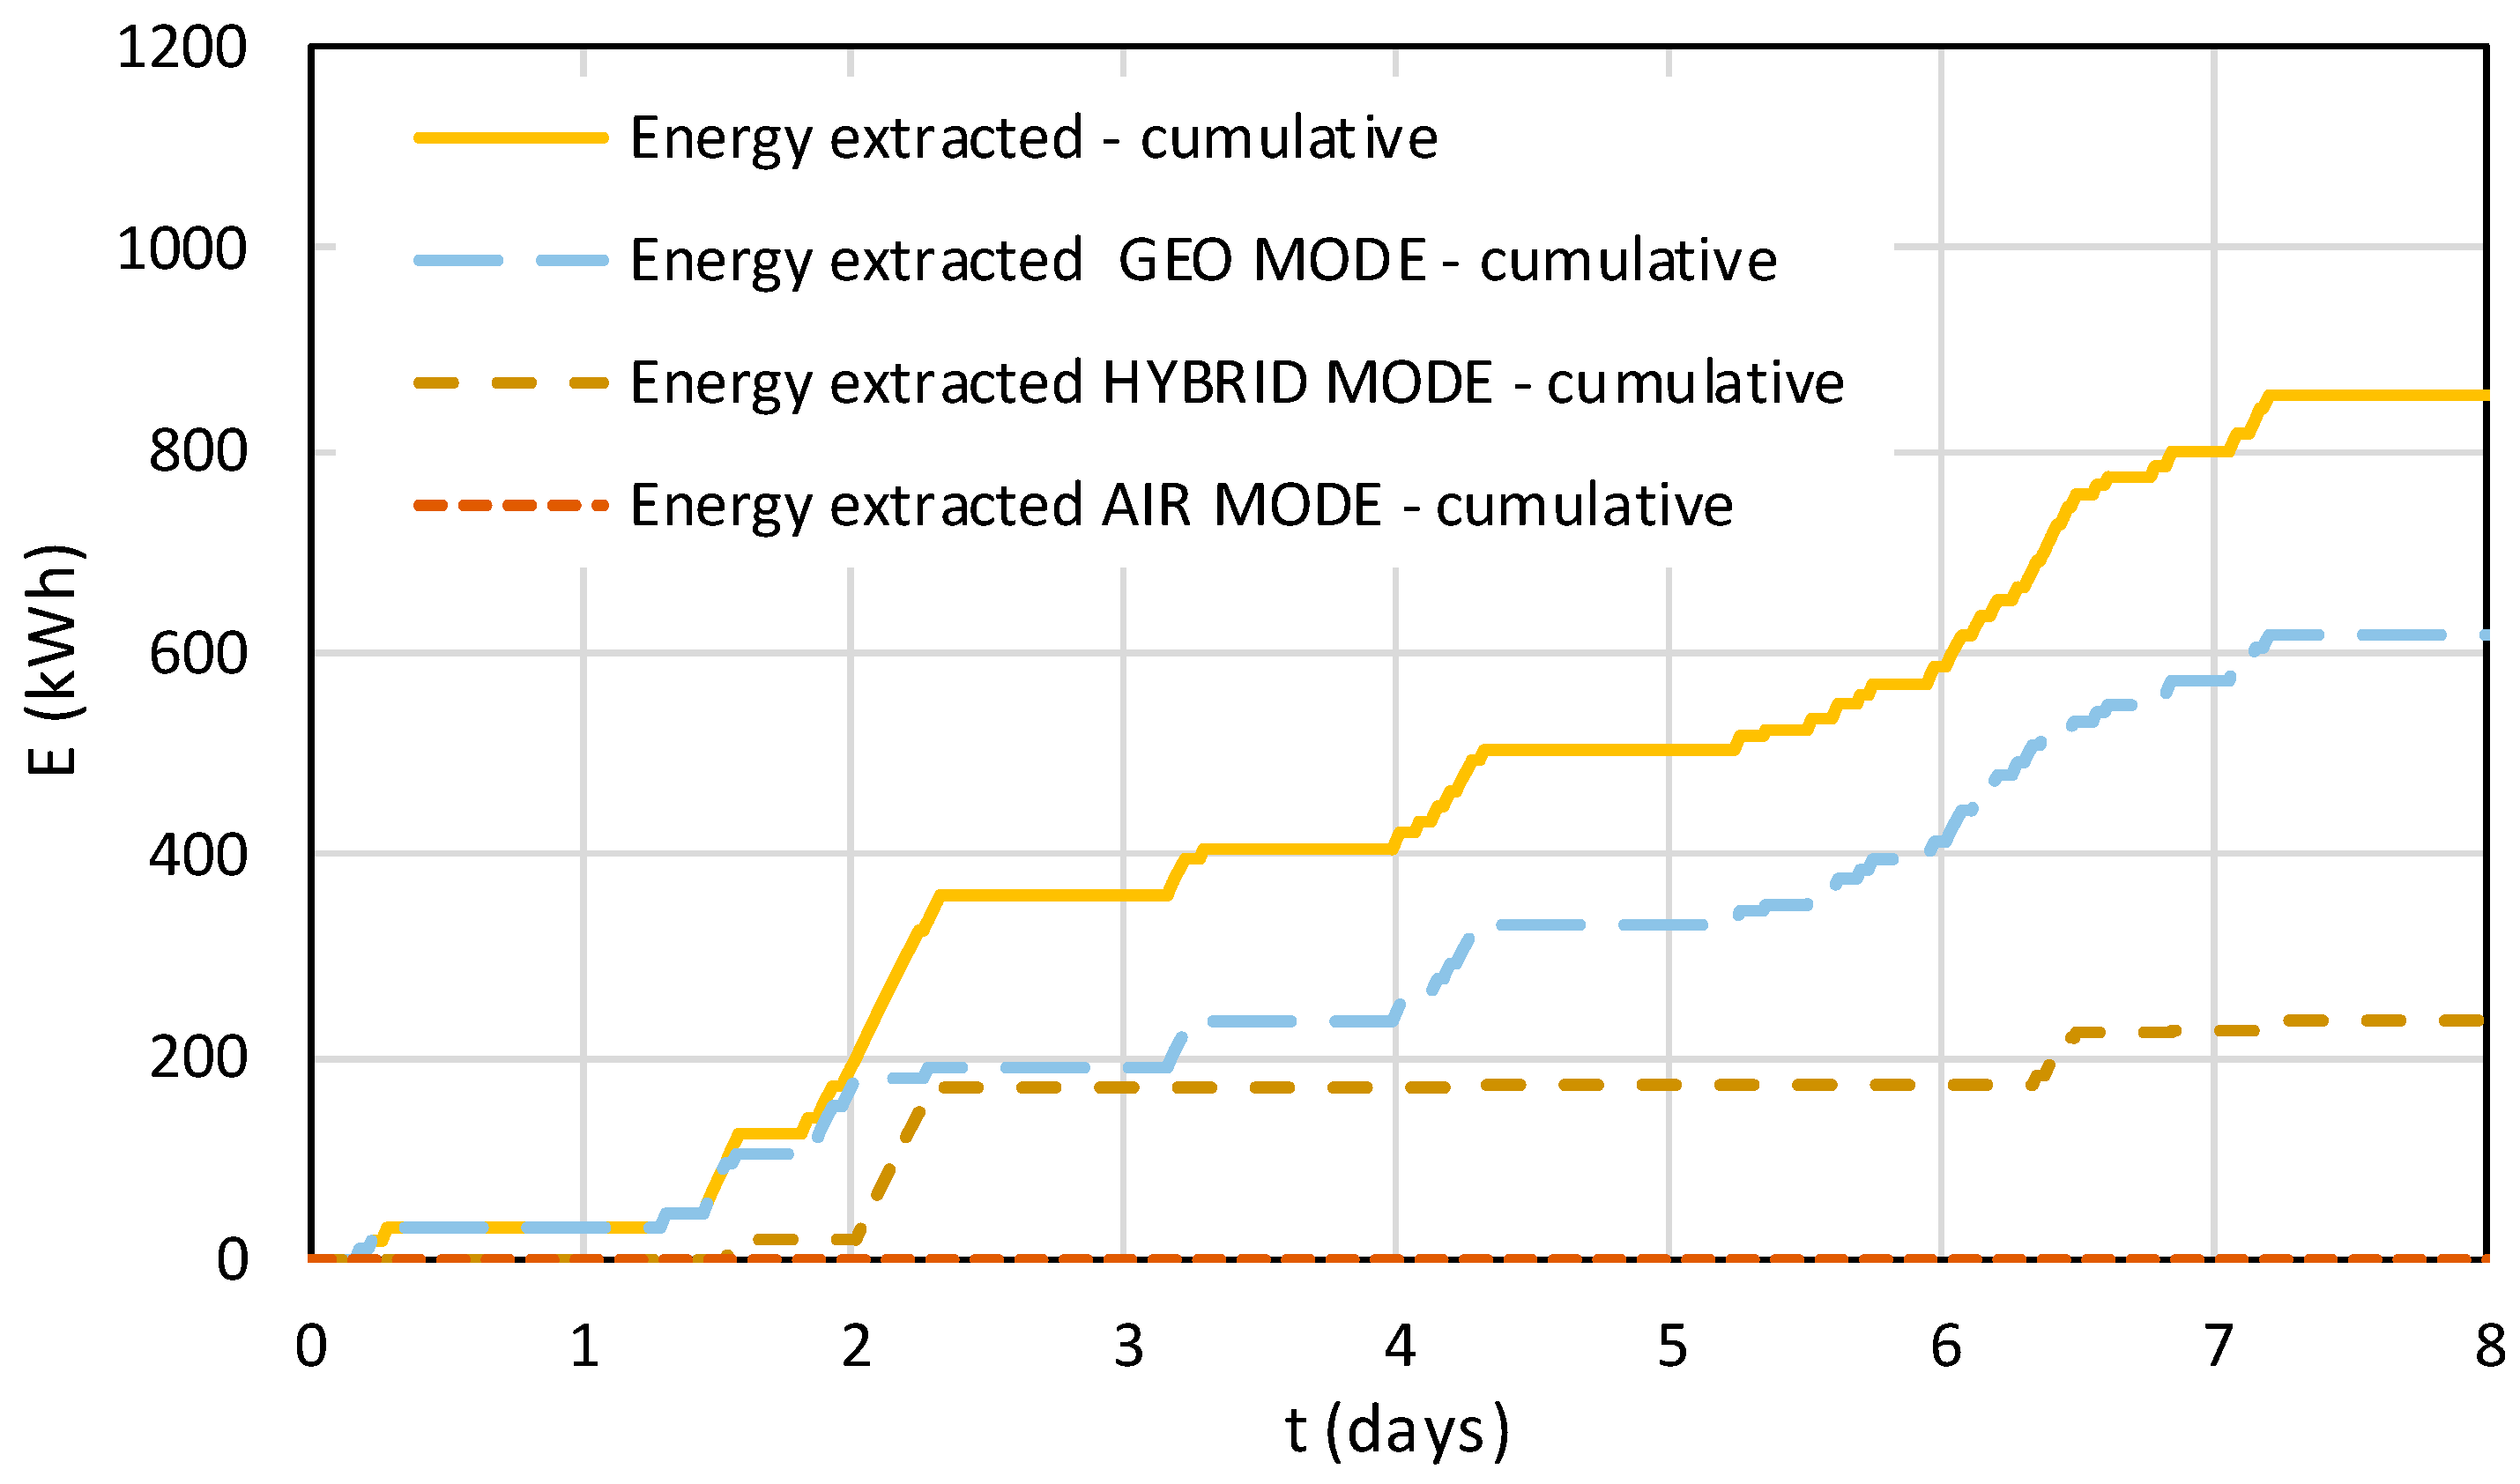
Using Equation (2) and the measurements in the DSHP, it was possible to divide the extracted energy in the three modes as follows: GEO mode (only circulation in the BTES), HYBRID mode (both BTES and fans active), and AIR mode (only fans active). The result is presented in Figure 15.

Figure 15.
Computed energy contributions from the different DSHP modes in the period 17−25 April 2024: GEO, HYBRID, and AIR.
The total energy extracted by the GEO mode was about 670 kWh, while the remaining 230 kWh were extracted from the HYBRID mode. The AIR mode was never activated. The percentage of use in the GEO mode was around 75%, and the remaining 25% was use in HYBRID mode.
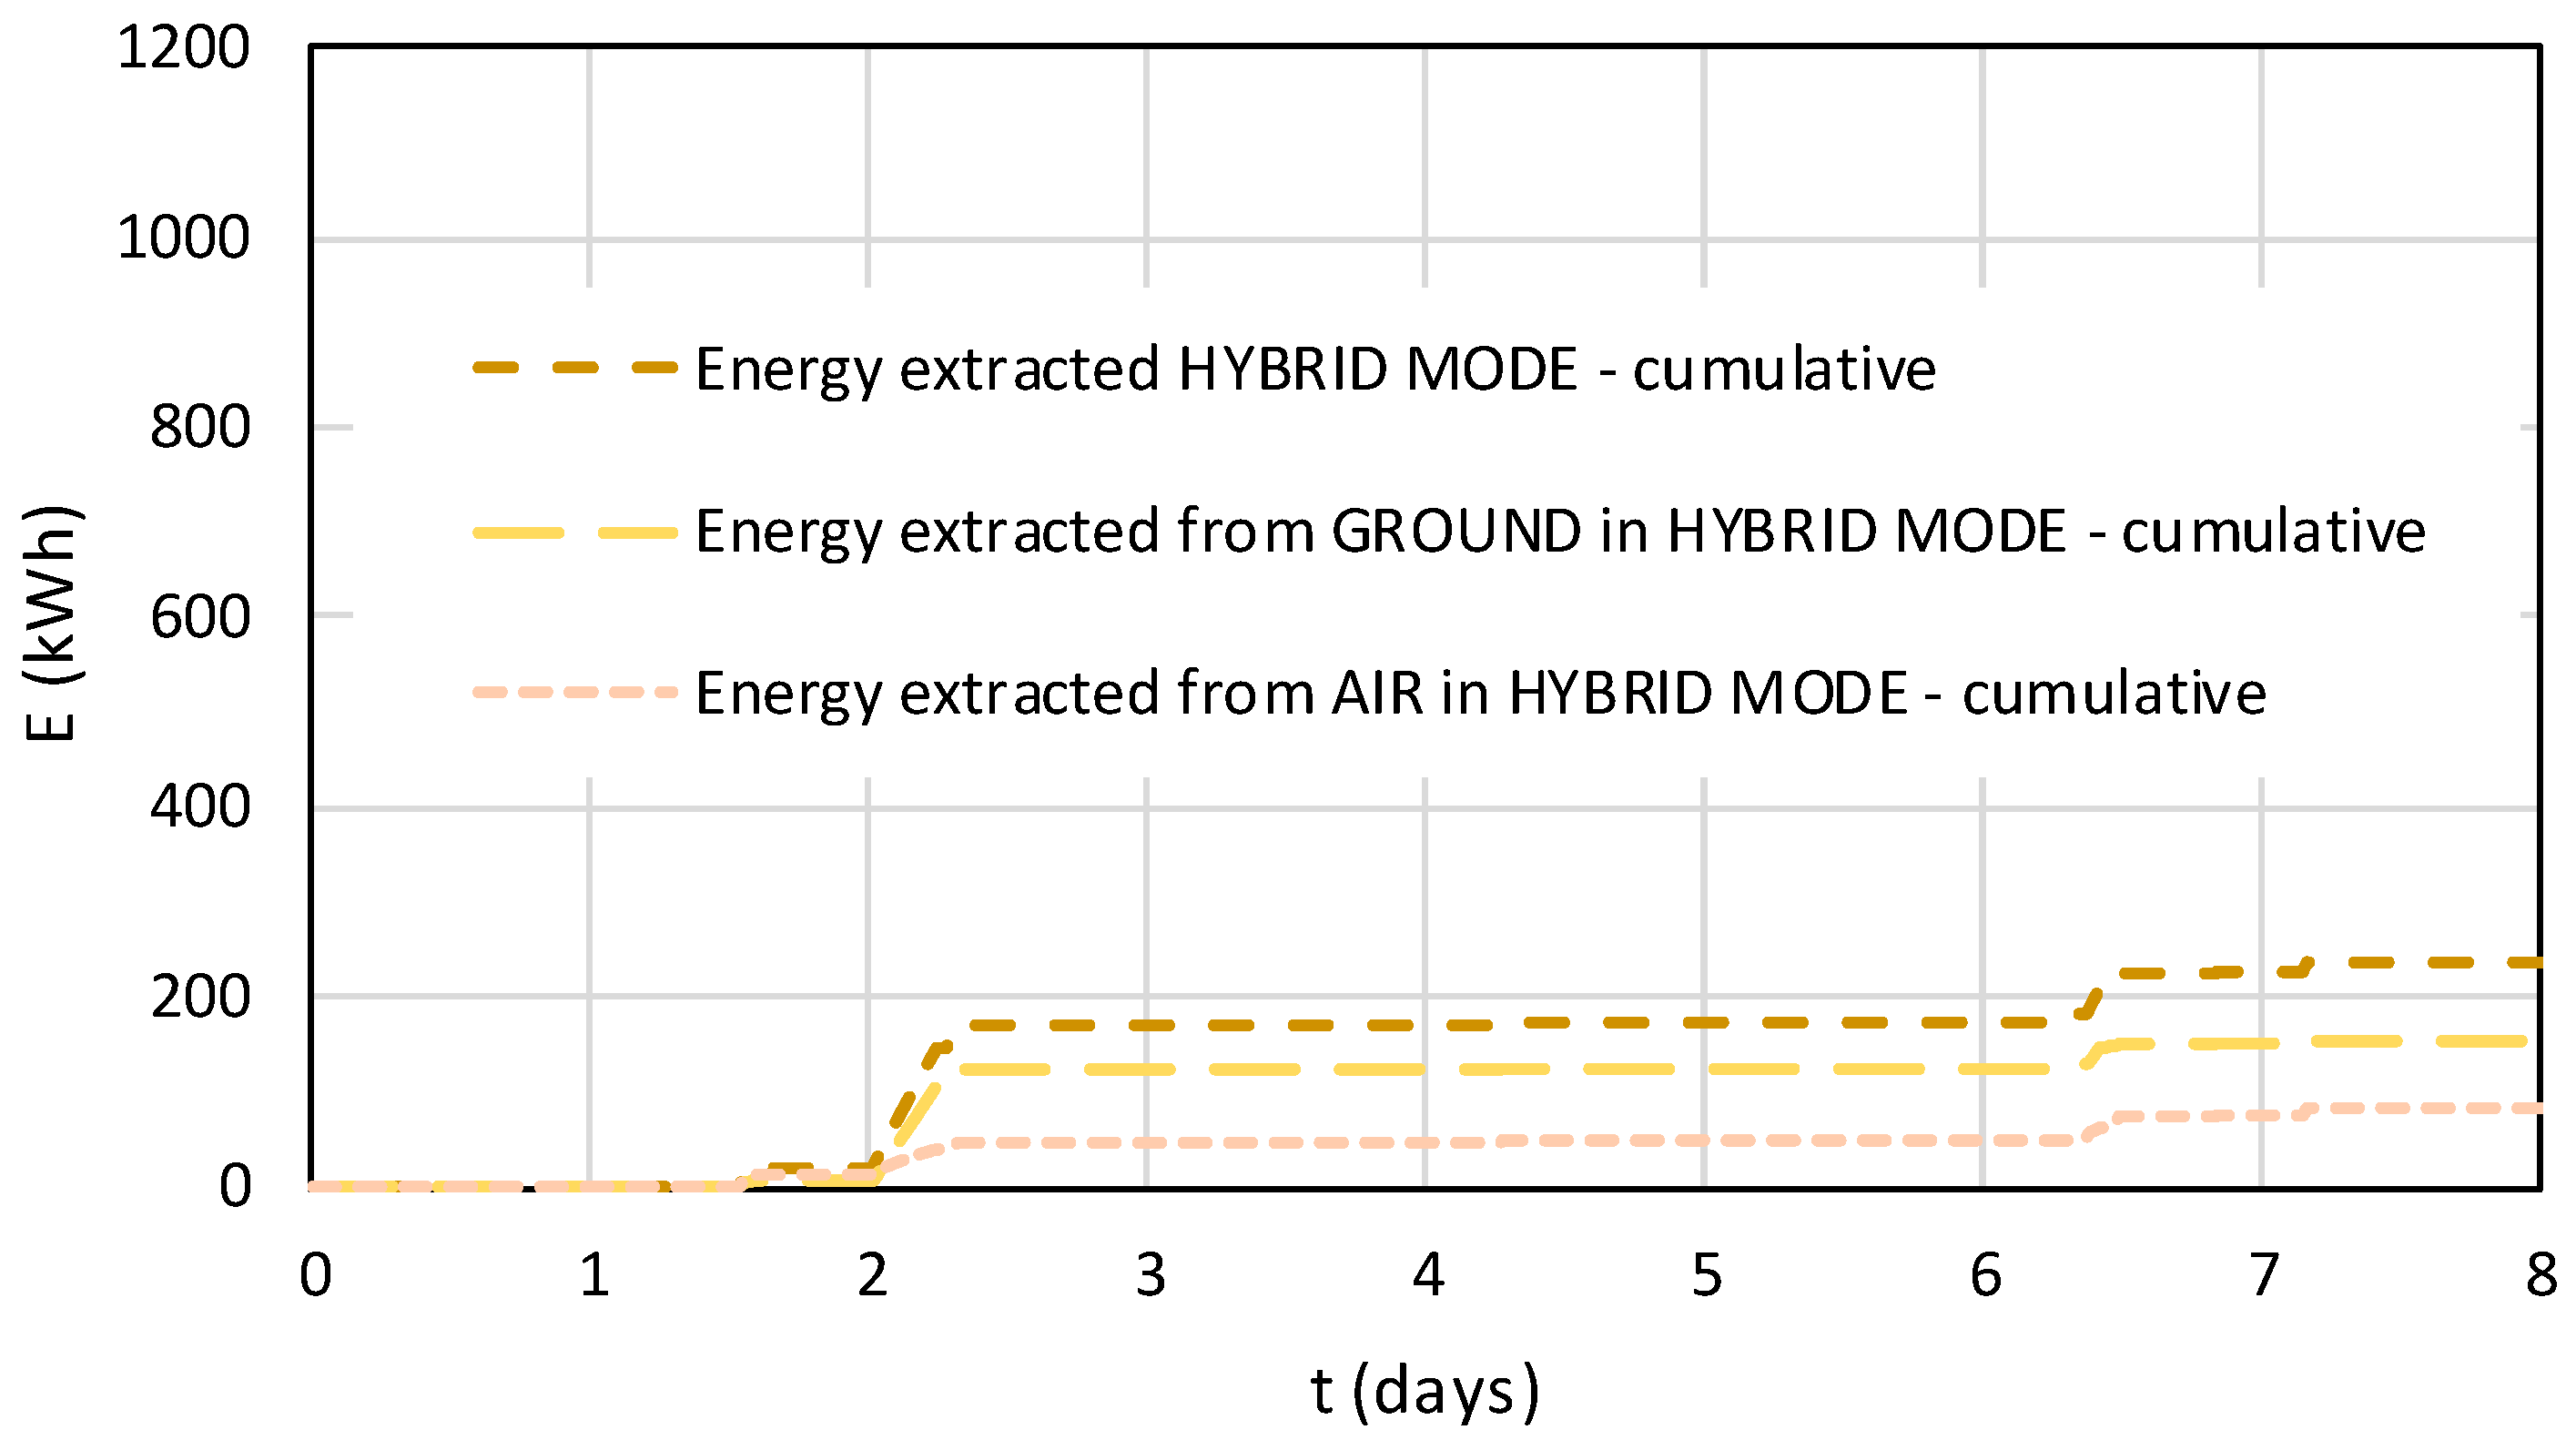
It was finally possible to decompose the ground contribution from the air contribution inside the HYBRID mode. The results are represented in Figure 16.
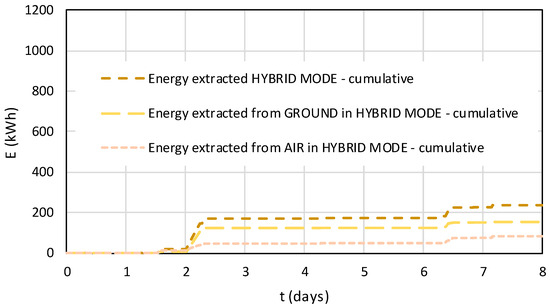
Figure 16.
Computed energy contributions of the BTES and fans in the HYBRID mode in the period 17−25 April 2024.
The total energy extracted from the BTES in the HYBRID mode was about 150 kWh, while 80 kWh were extracted from the air. The contribution of the ground in the HYBRID mode was therefore about 65%, while the remaining 35% was provided by the air. Therefore, summing the contributions of the ground in GEO mode and HYBRID mode, the total contribution of the BTES was 820 kWh, while summing the contributions of the air in AIR mode and HYBRID mode, the total contribution of the fans was 80 kWh. The BTES contributed 91% of the total ambient sources in the selected period.
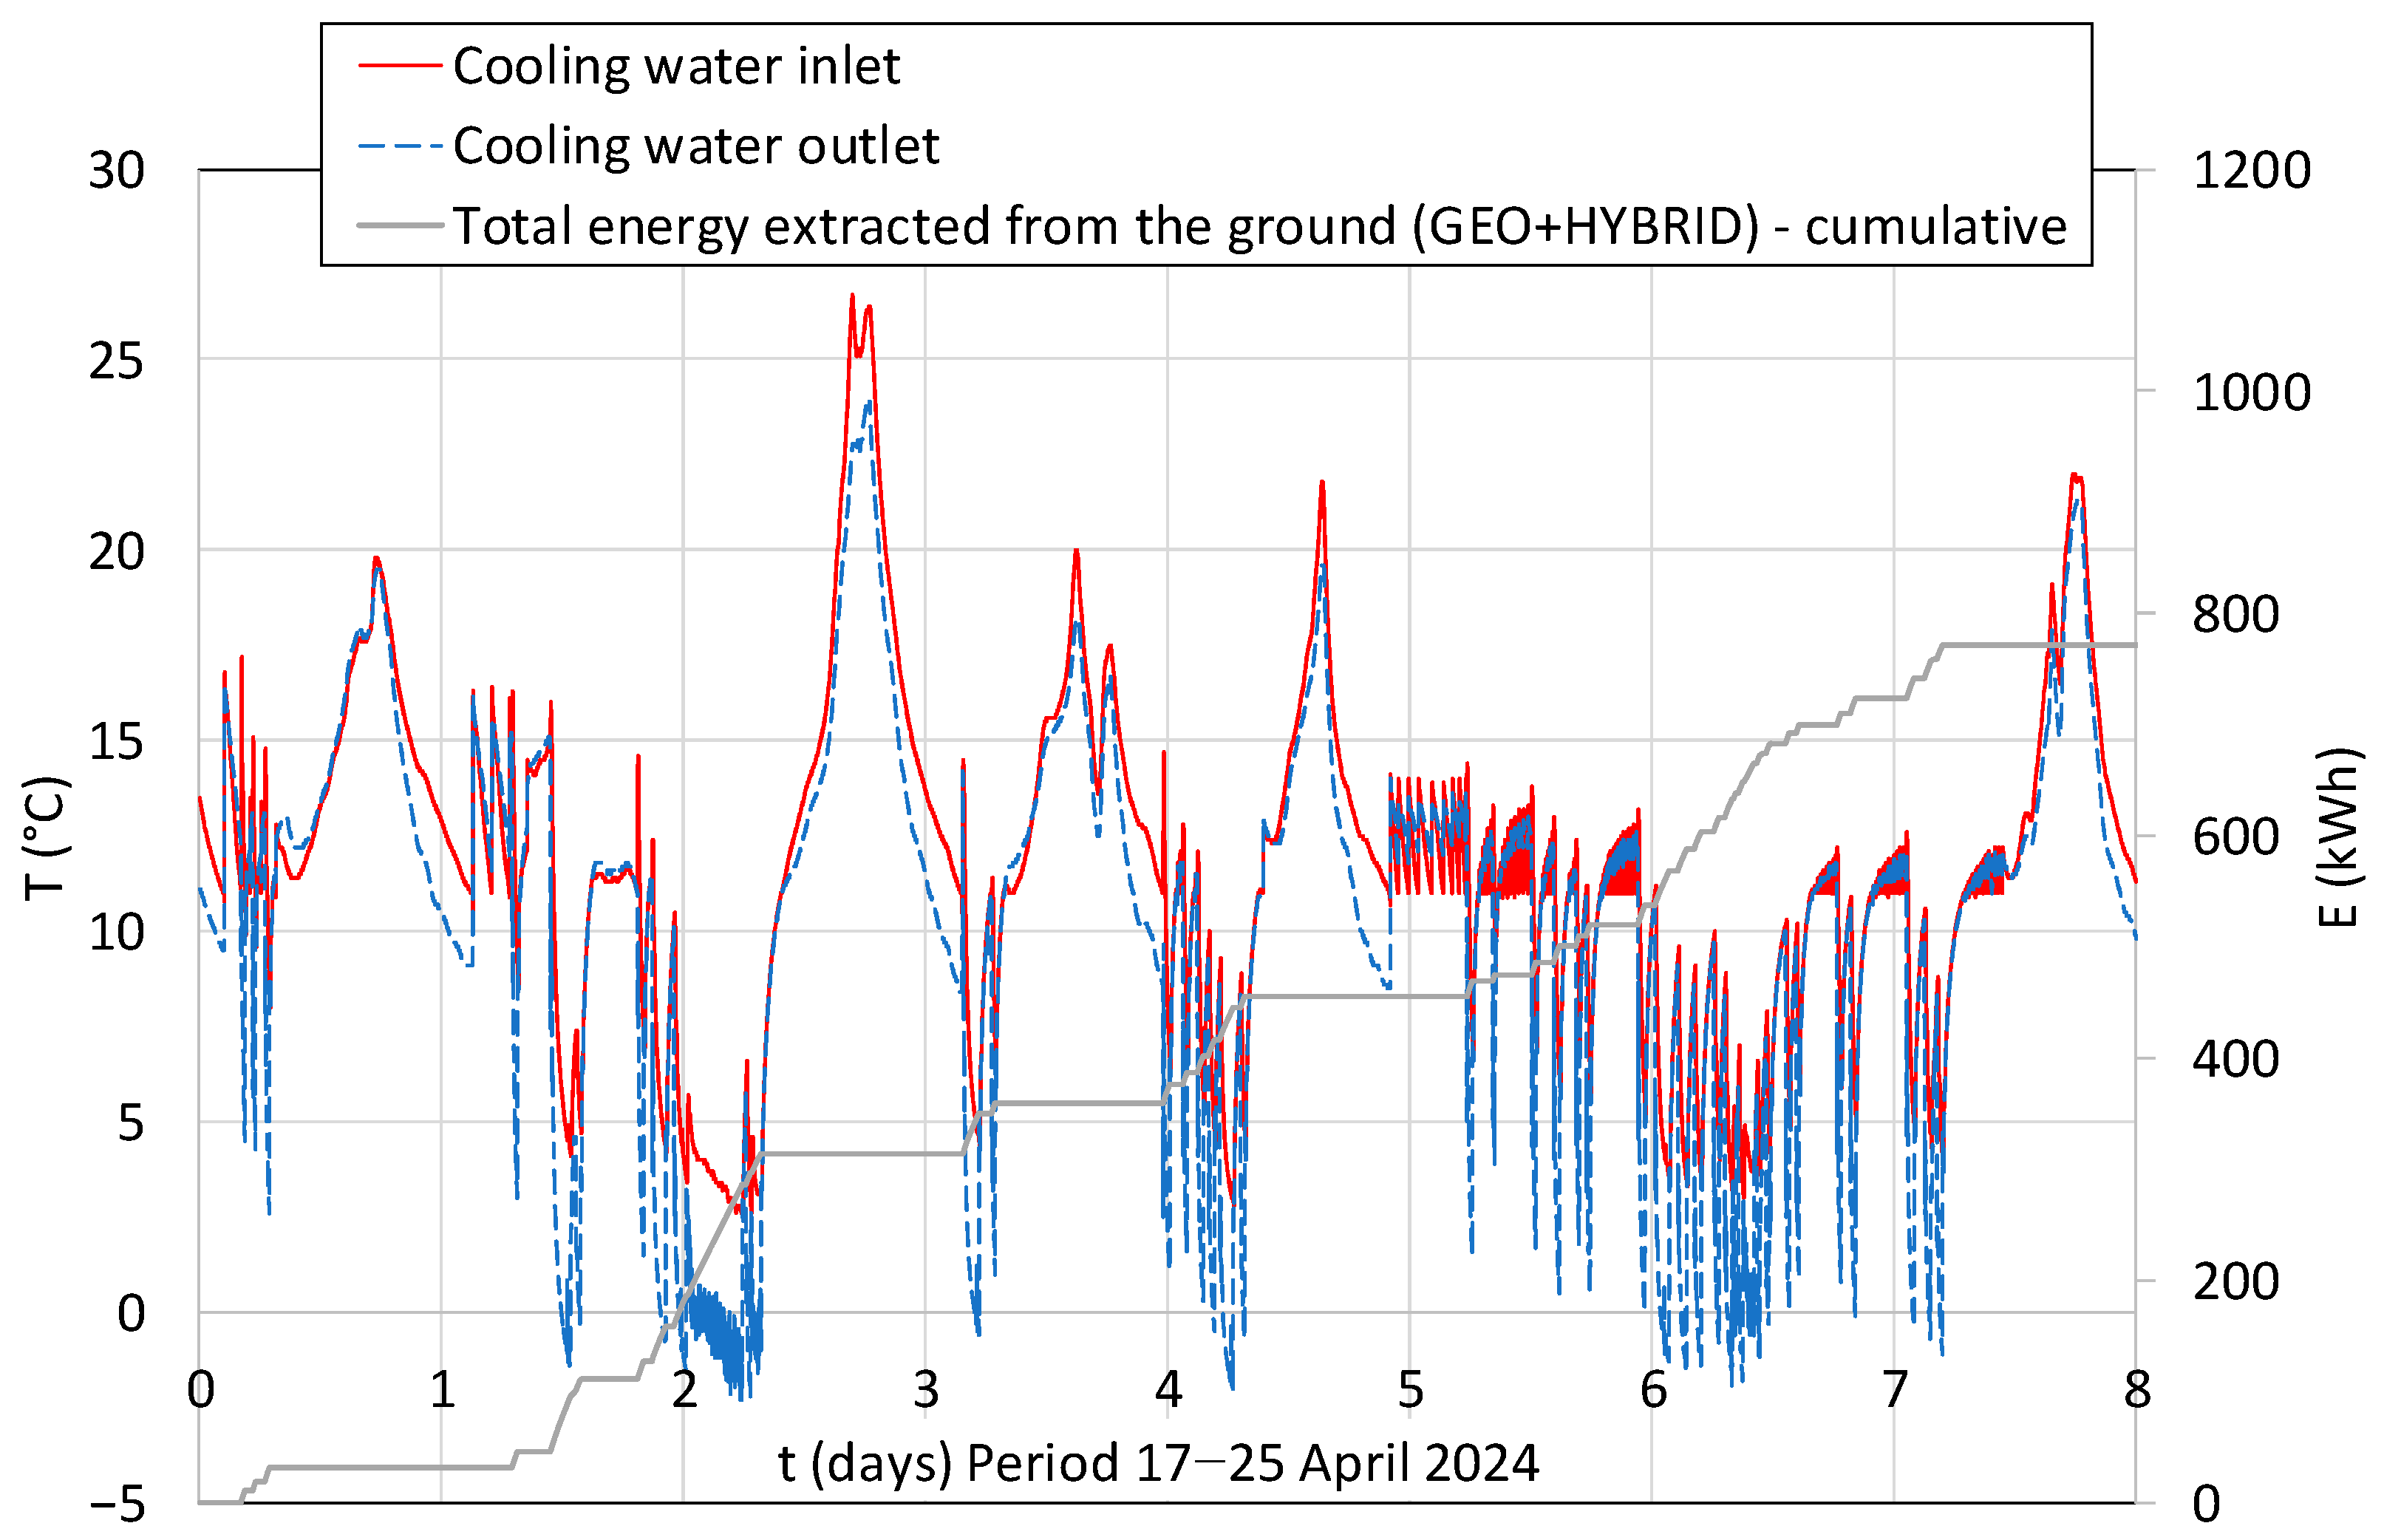
Comparing the energy stored in the previous sunny period (10–17 April) and the energy extracted, the solar heat storage provided 73% of the energy, while the remaining 27% was furnished by the aquifer natural flow. It resulted, at the end of the cold April week (17–25), in a slightly lower temperature of the ground with respect to the initial 12 °C, before the warm April week (10–17 April). According to Equation (3), the decrease in ground temperature in this period, due to the cumulative negative contribution, should have been: 0.7 − 0.9 = −0.2 °C. The inlet and outlet temperature values compared with the total energy extraction from the ground are presented in Figure 17.
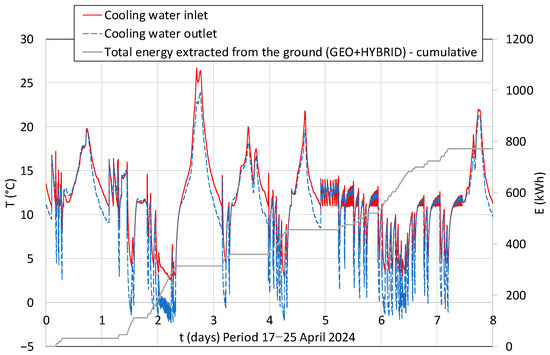
Figure 17.
Energy extracted from the ground in both modes (GEO + HYBRID) by the DSHP in the period 17–25 April 2024 and the related inlet and outlet temperatures.
It is worth pointing out that when the cooling water temperature overcame 10 °C, the circulation pumps stopped working to save energy; therefore, the sensors of the inlet and outlet temperature measured and recorded the temperature of the water in the outside pipes, not the ones of the BTES. On the other hand, thanks to the presence of antifreeze, the ground heat potential could be fully exploited and the outlet temperatures of the circulation fluid reached values below zero degrees.
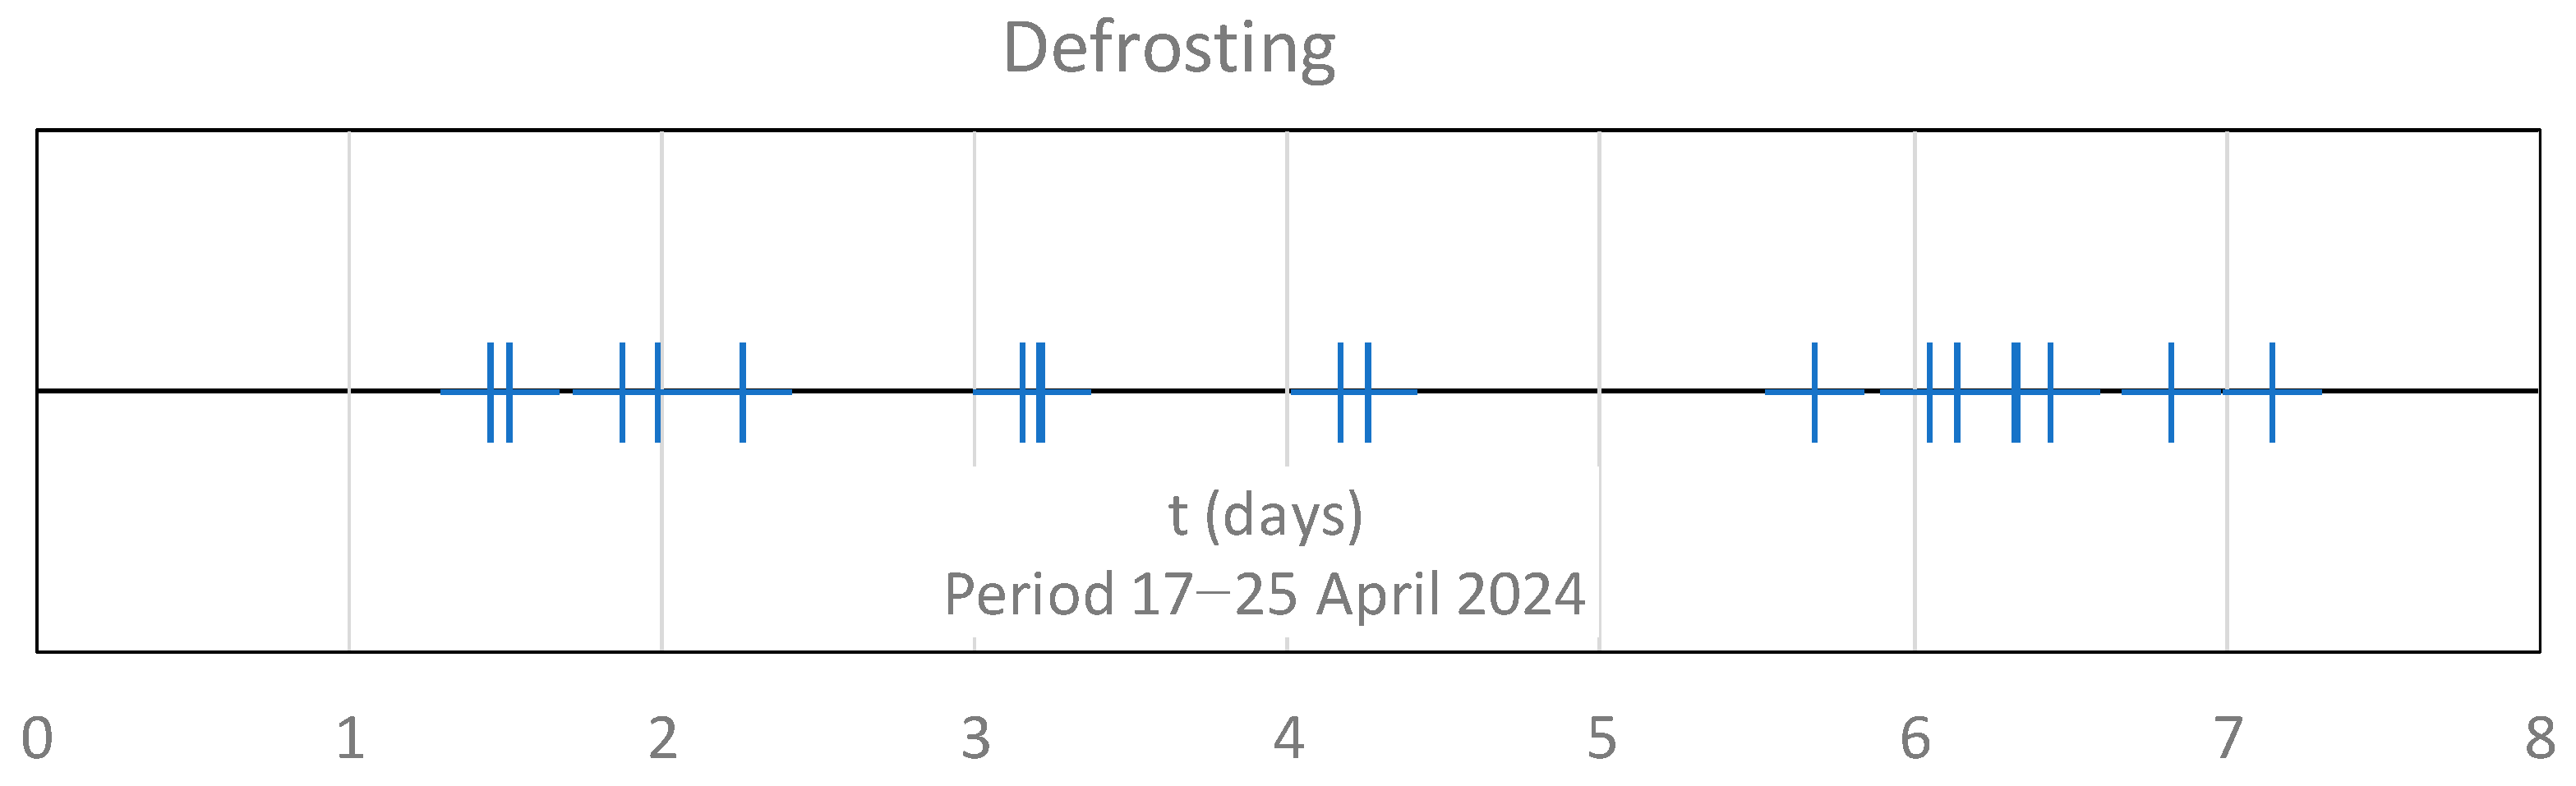
Finally, the activation of the air in the HYBRID mode was necessary in the coldest weather, basically during the nights. This required the activation of some defrost cycles to heat up the fans. In total, fifty defrosting cycles, equal to 8.3% of the total use of fans, were necessary (Figure 18). The defrosting of fans was mainly accomplished by an electric heater installed inside the DSHP beside the fans; however, the electric absorption was limited thanks to the use of the DSHP itself, activated by the ground circuit, to support the electric heater. The lowest measured values of outlet water temperature in the ground circuit, below 0 °C, were mainly reached during the use of DSHP as a defrosting support tool.
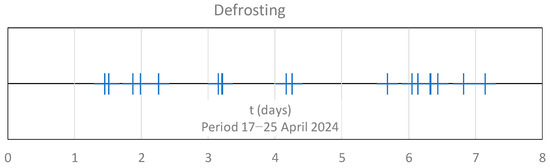
Figure 18.
Defrosting cycles during the reference period 17–25 April 2024.
By knowing the energy flows at regular intervals, it was then possible to calculate the average Coefficient of Performance (COP) for the various operational modes. The practical COP is defined by Equation (6) [24]:
where P is the heat provided to the building by the heat pump (heating capacity), while L is the electrical power absorbed by the machine and its auxiliaries to fulfill the cycle.
Integrating the data contained in Figure 13, Figure 14, Figure 15, Figure 16 and Figure 17, it was possible the calculate the average COP for the GEO, AIR, HYBRID, and TOTAL work modes of the heat pump for the period 17–25 April 2024. The results are presented in Table 2.
Table 2.
Average COP of the heat pump in the reference period 17–25 April 2024.
The exploitation of the geothermal storage allowed high efficiency to be achieved in the DSHP. The graphical comparison between the total heating capacity and the total electrical power absorbed is represented in Figure 19. The resulting COP, as a ratio of heating capacity and power absorbed, is represented at hourly intervals in the same diagram. As already reported in Table 2, the average COP in the studied period was 4.34. Thanks to this performance, the demand for electrical energy was kept at a minimum level in comparison with the thermal energy provided, and it could be covered by the electrical production of the PVT panels, which could be easily integrated with further PV panels that were already installed on the farm. Therefore, the RES system produced the benefit of replacing fossil energy with renewable energy self-produced on the farm, which determined an environmental benefit in terms of CO2 emission reduction, in addition to an improvement of the energetic independency of the farm, which, if widely adopted, could contribute to the energy autonomy of the agricultural sector.
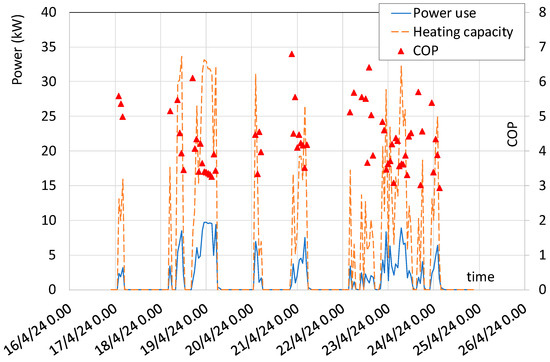
Figure 19.
Electric power used by the DSHP in comparison with the resulting heating capacity. COP is represented at hourly intervals.
3.4. Environmental and Energy Benefits
Relating to primary energy and cost savings, the specific values of LPG (the previous energy source in the boiler) and the electricity mix and cost in Italy must be used. The values used for comparison [25] are reported in Table 3.
Table 3.
Primary energy, GHG emissions, and cost values of the Italian situation for the two energy vectors compared: LPG and electricity.
For the efficiency of the pre-existing boiler, the common value of 90% was considered. For the SPF of the system in the analyzed period, the calculated value was considered. For the comparison of primary energy consumptions, the following equations have been used:
where Epr,lpg is the primary energy consumed by the use of LPG, Epr,lpg is the primary energy consumed by the use of electricity, η is the efficiency of the LPG boiler, Fpr,lpg is the primary energy factor for the LPG, and Fpr,lpg is the primary energy factor for the Italian energy mix.
For the comparison of the GHG emissions, the following equations have been used:
where FCO2,lpg is the CO2 emission factor for LPG, while FCO2,el is the CO2 emission factor for the Italian energy mix.
For the economic comparison, the following equations have been used:
where Cu,lpg is the current cost for LPG for heating, while Cu,el is the current cost for electricity.
By applying the above equations, the results for the provision of 1200 kWh of heat to the building are reported in Table 4.
Table 4.
Comparison results between the pre-existing solution (LPG boiler) and the new DSHP solution.
In all three categories, the introduction of the RES system provided substantial improvements. Moreover, it is worth recalling that the solar panel system was of the PVT type, so was then able to produce electric energy. By adding the self-production of electric energy to the analysis, the primary energy consumptions, GHG emissions, and total energy costs amounted to almost zero.
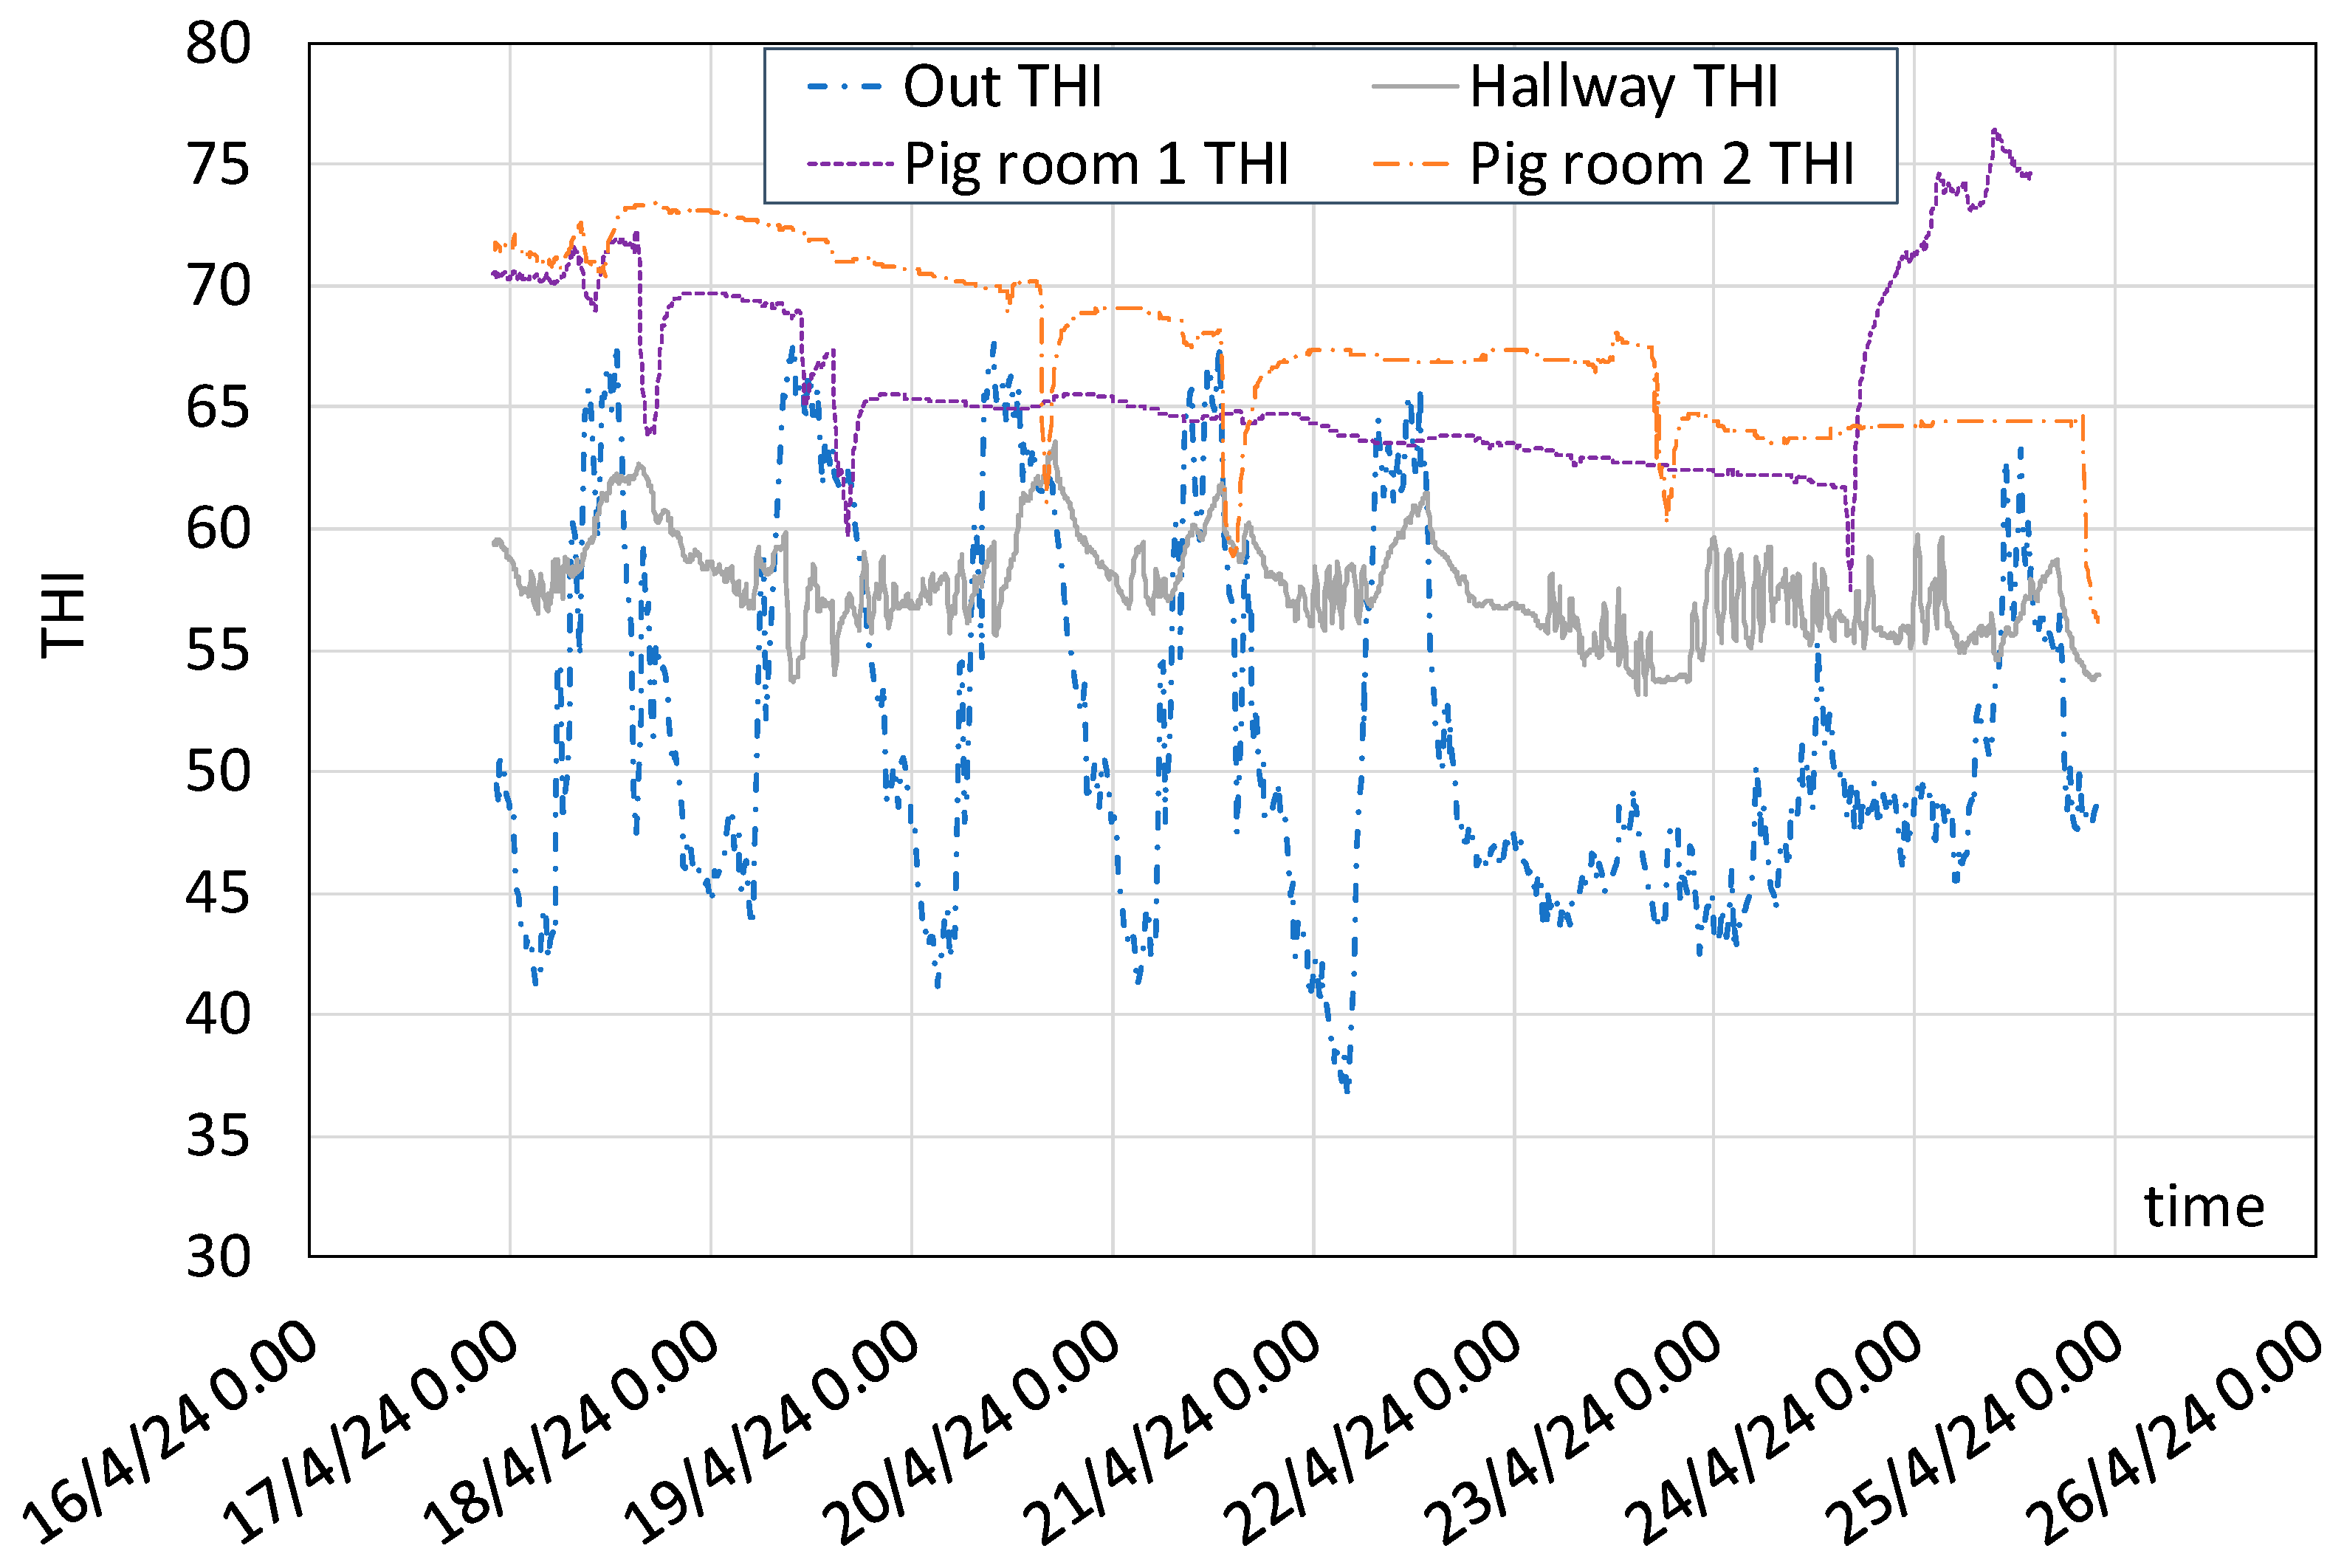
Finally, the heating system developed also proved effective for the control of humidity conditions in the cold season, as was witnessed by the trends of the THI—computed with Equation (1)—in the weaners’ rooms (Figure 20): it was kept substantially below the alert threshold of 75 [22]. Specifically, the THI at the following locations were represented and compared: outdoors, the hallway, pig room 1, and pig room 2 (see Figure 4). Pig room 1 and pig room 2 had systematically higher values than the hallway and outdoors overall, without overpassing the limit of 75.
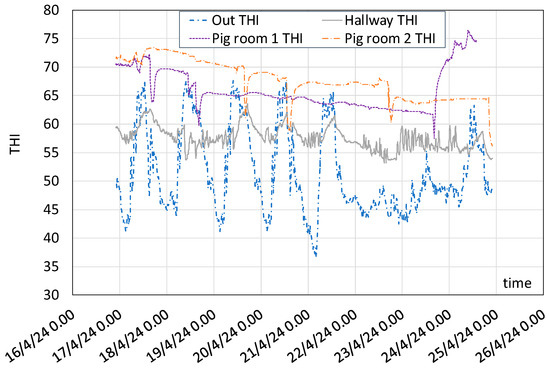
Figure 20.
THI measured in the monitored indoor spaces and outside the barn.
4. Conclusions
The pilot installation of an RES system featuring a combination of BTES, PVT collectors, and a DSHP at a swine farm exemplified the effective utilization of renewable resources commonly available in livestock environments. This integrated system was specifically designed to address the heating requirements of a swine farm during the colder seasons, with a particular focus on maintaining optimal environmental conditions for animal welfare, namely, in the nursery barn. The environmental data recorded by the smart monitoring system developed within the RES heating plant, and the results of the analyses carried out, confirmed the suitability of the solution for the purpose of temperature and humidity control for weaners in cold climates. Moreover, the interventions did not require modification in the structure or layout of the building, as the new systems were fully integrated on the roof (PVT panels), in the courtyard underground (BTES), and in the technical room (solar station) of the livestock barn.
This study demonstrated that a carefully planned mix of RES components can be seamlessly integrated into an automated heating system to meet the farm needs. By harnessing solar energy and utilizing thermal energy storage, coupled with the efficiency of a DSHP, the system effectively managed indoor temperatures without the reliance on fossil sources. Specifically, during an 8-day phase of solar thermal energy injection into the BTES in spring, 2160 MJ were stored. Then, during an equal period of energy extraction to heat the barn, the average temperature difference between the flows from and to the BTES during the period analyzed was 3.0 K. These results demonstrated that a COP over 4 could be obtained for the DSHP thanks to the integration of PVT and BTES, while assuring the target indoor thermal conditions for animal welfare. Such conditions were monitored continuously and remotely through a smart control system that could automatically enable the activation of the heating system.
The system developed can be adapted for different energy demands and is suitable for scaling up. Its installation in a large number of farms would make a significant contribution to the achievement of at least two of the UN’s Sustainable Development Goals (SDGs), namely SDG 7 “Ensure access to affordable, reliable, sustainable and modern energy for all” and SDG 2 “End hunger, achieve food security and improved nutrition and promote sustainable agriculture”. In particular, the results of this research proved effective in the achievement of the objectives of ensuring universal access to affordable, reliable, and modern energy services (target 7.1 of SDG 7) and increasing substantially the share of renewable energy in the global energy mix (target 7.2). At the same time, the adoption of the RES system developed can contribute to ensuring sustainable food production systems (target 2.4 of SDG 2).
Future developments aim to extend this approach to other farm building typologies, such as farrowing barns, and to integrate solar and geothermal energy resources to regulate temperature and humidity in warmer climatic conditions. Continued research and innovation in this area will further refine and optimize these integrated systems, leveraging advancements in renewable energy technology to enhance farm operations while promoting environmental stewardship and animal welfare. The successful implementation of such solutions sets a promising precedent for the broader adoption of renewable energy systems in farming practices, driving towards a more sustainable and resilient future for livestock production.
Author Contributions
Conceptualization, S.B. and F.T.; methodology, S.B. and F.T.; software, F.T.; validation, F.T. and P.B.; formal analysis, C.A.P.G.; investigation, S.B., F.T., A.L. and I.P.A.-P.; resources, A.L., I.P.A.-P. and P.B.; data curation, C.A.P.G.; writing—original draft preparation, S.B.; writing—review and editing, F.T., P.T. and D.T.; visualization, M.B. and A.B.; supervision, P.T. and D.T.; project administration, S.B., P.T. and D.T.; funding acquisition, S.B. All authors have read and agreed to the published version of the manuscript.
Funding
This study was funded by the European Commission, within the Horizon 2020 program for the Innovation Action project RES4LIVE “Energy Smart Livestock Farming towards Zero Fossil Fuel Consumption”, running in the period 2020–2024. Grant agreement ID: 101000785, DOI 10.3030/101000785.
Data Availability Statement
The collected primary raw data from the pilot farms of the project RES4LIVE are not openly available, with access limited to the members of the project consortium. The data and deliverables are made openly available, depending on ethics and IP rights. The data are downloadable through the RES4LIVE website at https://res4live.eu/ (accessed on 21 February 2025).
Acknowledgments
The Authors thank Emanuele Bedeschi and Francesco Maria La Rota for the support provided in data collection. The Authors also want to thank the Golinelli farm, a RES4LIVE Project Partner, for the technical and practical assistance during the installation works on their own property.
Conflicts of Interest
The authors declare no conflicts of interest. The funders had no role in the design of the study; in the collection, analyses, or interpretation of data; in the writing of the manuscript; or in the decision to publish the results.
Abbreviations
The following abbreviations are used in this manuscript:
| BHE | Borehole Heat Exchanger |
| BTES | Borehole Thermal Energy Storage |
| COP | Coefficient of Performance |
| DSHP | Dual Source Heat Pump |
| GHG | Greenhouse Gas |
| HVAC | Heating, Ventilation, Air Conditioning |
| LPG | Liquefied Petroleum Gas |
| PVT | Photovoltaic–Thermal |
| RES | Renewable Energy Source |
| SDG | Sustainable Development Goal |
| SPF | Seasonal Performance Factor |
| TRT | Thermal Response Test |
References
- Lagua, E.B.; Mun, H.-S.; Ampode, K.M.B.; Chem, V.; Park, H.-R.; Kim, Y.-H.; Yang, C.-J. Monitoring Using Artificial Intelligence Reveals Critical Links between Housing Conditions and Respiratory Health in Pigs. J. Anim. Behav. Biometeorol. 2024, 12, e2024008. [Google Scholar] [CrossRef]
- Niu, K.; Zhong, J.; Hu, X. Impacts of Climate Change-Induced Heat Stress on Pig Productivity in China. Sci. Total Environ. 2024, 908, 168215. [Google Scholar] [CrossRef]
- Costantino, A. Development, Validation, and Application of Building Energy Simulation Models for Livestock Houses: A Systematic Review. Agriculture 2023, 13, 2280. [Google Scholar] [CrossRef]
- Kim, J.; Lee, I.; Aarnink, A.; Lee, B.; Jeong, D.; Jeong, H.; Kim, S.; Lee, B.; Lee, D. Development and Validation of an Air Recirculated Ventilation System, Part 1: Application of System in a Pig Farm and Evaluation of Pig Productivity during Winter. Biosyst. Eng. 2023, 230, 106–130. [Google Scholar] [CrossRef]
- Tyris, D.; Manolakos, D.; Bartzanas, T.; Benni, S.; Amon, T.; Maselyne, J.; Lecompte, S.; Grammelis, P.; Balafoutis, A.; Zhang, G.; et al. RES4LIVE–Energy Smart Livestock Farming towards Zero Fossil Fuel Consumption. VDI Berichte 2022, 2022, 493–498. [Google Scholar] [CrossRef]
- Deeken, H.F.; Lengling, A.; Krommweh, M.S.; Büscher, W. Improvement of Piglet Rearing’s Energy Efficiency and Sustainability Using Air-to-Air Heat Exchangers—A Two-Year Case Study. Energies 2023, 16, 1799. [Google Scholar] [CrossRef]
- Elqadhi, M.E.; Skrbic, S.; Mohamoud, O.; Asonja, A. Energy Integration of Corn Cob in the Process of Drying the Corn Seeds. Therm. Sci. 2024, 28, 3325–3336. [Google Scholar] [CrossRef]
- Hahn, C.; Lindkvist, E.; Magnusson, D.; Johansson, M. The Role of Agriculture in a Sustainable Energy System–The Farmers’ Perspective. Renew. Sustain. Energy Rev. 2025, 213, 115437. [Google Scholar] [CrossRef]
- Nikolić, D.; Jovanović, S.; Jurišević, N.; Nikolić, N.; Radulović, J.; Velemir Radović, M.; Grujić, I. Sustainable Design in Agriculture—Energy Optimization of Solar Greenhouses with Renewable Energy Technologies. Energies 2025, 18, 416. [Google Scholar] [CrossRef]
- Benni, S.; Tinti, F.; Bovo, M.; Barbaresi, A.; Torreggiani, D.; Tassinari, P. An Integrated Renewable Energy Plant with Smart Monitoring System for Sustainable Farming. In Proceedings of the 2023 IEEE International Workshop on Metrology for Agriculture and Forestry (MetroAgriFor), Pisa, Italy, 6–8 November 2023; pp. 547–552. [Google Scholar]
- Mun, H.-S.; Dilawar, M.A.; Mahfuz, S.; Ampode, K.M.B.; Chem, V.; Kim, Y.-H.; Moon, J.-P.; Yang, C.-J. Effects of a Combined Geothermal and Solar Heating System as a Renewable Energy Source in a Pig House and Estimation of Energy Consumption Using Artificial Intelligence-Based Prediction Model. Animals 2022, 12, 2860. [Google Scholar] [CrossRef]
- Jeong, D.-Y.; Jo, S.-K.; Lee, I.-B.; Shin, H.; Kim, J.-G. Digital Twin Application: Making a Virtual Pig House Toward Digital Livestock Farming. IEEE Access 2023, 11, 121592–121602. [Google Scholar] [CrossRef]
- Kwak, Y.; Shin, H.; Kang, M.; Mun, S.-H.; Jo, S.-K.; Kim, S.-H.; Huh, J.-H. Energy Modeling of Pig Houses: A South Korean Feasibility Study. Energy Strategy Rev. 2021, 36, 100672. [Google Scholar] [CrossRef]
- Mahfuz, S.; Mun, H.-S.; Dilawar, M.A.; Yang, C.-J. Applications of Smart Technology as a Sustainable Strategy in Modern Swine Farming. Sustainability 2022, 14, 2607. [Google Scholar] [CrossRef]
- Bilardo, M.; Comba, L.; Cornale, P.; Costantino, A.; Fabrizio, E. Relation between Energy Use and Indoor Thermal Environment in Animal Husbandry: A Case Study. E3S Web Conf. 2019, 111, 01042. [Google Scholar] [CrossRef]
- Du, L.; Yang, L.; Yang, C.; Hu, C.; Yu, C.; Qiu, M.; Liu, S.; Zhu, S.; Ye, X. Development and Validation of an Energy Consumption Model for Animal Houses Achieving Precision Livestock Farming. Animals 2022, 12, 2580. [Google Scholar] [CrossRef] [PubMed]
- Pezzuolo, A.; Chiumenti, A.; Sartori, L.; Da Borso, F. Automatic Feeding System: Evaluation of Energy Consumption and Labour Requirement in North-East Italy Dairy Farm. Eng. Rural Dev. 2016, 15, 882–887. [Google Scholar]
- Alberti, L.; Antelmi, M.; Angelotti, A.; Formentin, G. Geothermal Heat Pumps for Sustainable Farm Climatization and Field Irrigation. Agric. Water Manag. 2018, 195, 187–200. [Google Scholar] [CrossRef]
- Tinti, F.; Tassinari, P.; Rapti, D.; Benni, S. Development of a Pilot Borehole Storage System of Solar Thermal Energy: Modeling, Design, and Installation. Sustainability 2023, 15, 7432. [Google Scholar] [CrossRef]
- Murali, D.; Acosta-Pazmiño, I.P.; Loris, A.; García, A.C.; Benni, S.; Tinti, F.; Gomes, J. Experimental Assessment of a Solar Photovoltaic-Thermal System in a Livestock Farm in Italy. Sol. Energy Adv. 2024, 4, 100051. [Google Scholar] [CrossRef]
- Silveira, R.M.F.; Mcmanus, C.; da Siva, I.J.O. Global Trends and Research Frontiers on Machine Learning in Sustainable Animal Production in Times of Climate Change: Bibliometric Analysis Aimed at Insights and Orientations for the Coming Decades. Environ. Sustain. Indic. 2025, 26, 100563. [Google Scholar] [CrossRef]
- Shin, H.; Lee, S.; Kim, J.; Park, D.-H.; Jo, S.-K.; Kwak, Y. Applicability Evaluation of a Temperature Humidity Index-Controlled Ventilation System in Livestock Using a Building Energy Simulation Model. Case Stud. Therm. Eng. 2024, 57, 104335. [Google Scholar] [CrossRef]
- Fourier, J.B.J. Théorie Analytique de La Chaleur; Gauthier-Villars: Paris, France, 1888; Volume 1. [Google Scholar]
- Bosma, J. Heat Pumps for Energy Efficiency and Environmental Progress; Elsevier Science: Amsterdam, The Netherlands, 2012; ISBN 9780444596550. [Google Scholar]
- ISPRA. Fattori Di Emissione Di CO2 Nel Settore Elettrico e Analisi Della Decomposizione Delle Emissioni; ISPRA: Rome, Italy, 2012. [Google Scholar]


Disclaimer/Publisher’s Note: The statements, opinions and data contained in all publications are solely those of the individual author(s) and contributor(s) and not of MDPI and/or the editor(s). MDPI and/or the editor(s) disclaim responsibility for any injury to people or property resulting from any ideas, methods, instructions or products referred to in the content. |
© 2025 by the authors. Licensee MDPI, Basel, Switzerland. This article is an open access article distributed under the terms and conditions of the Creative Commons Attribution (CC BY) license (https://creativecommons.org/licenses/by/4.0/).