
Simulation and Optimization Study on an Energy Efficiency Improvement Strategy of an Air Source Heat Pump Under Australian Standards


Abstract
1. Introduction
2. System Modelling
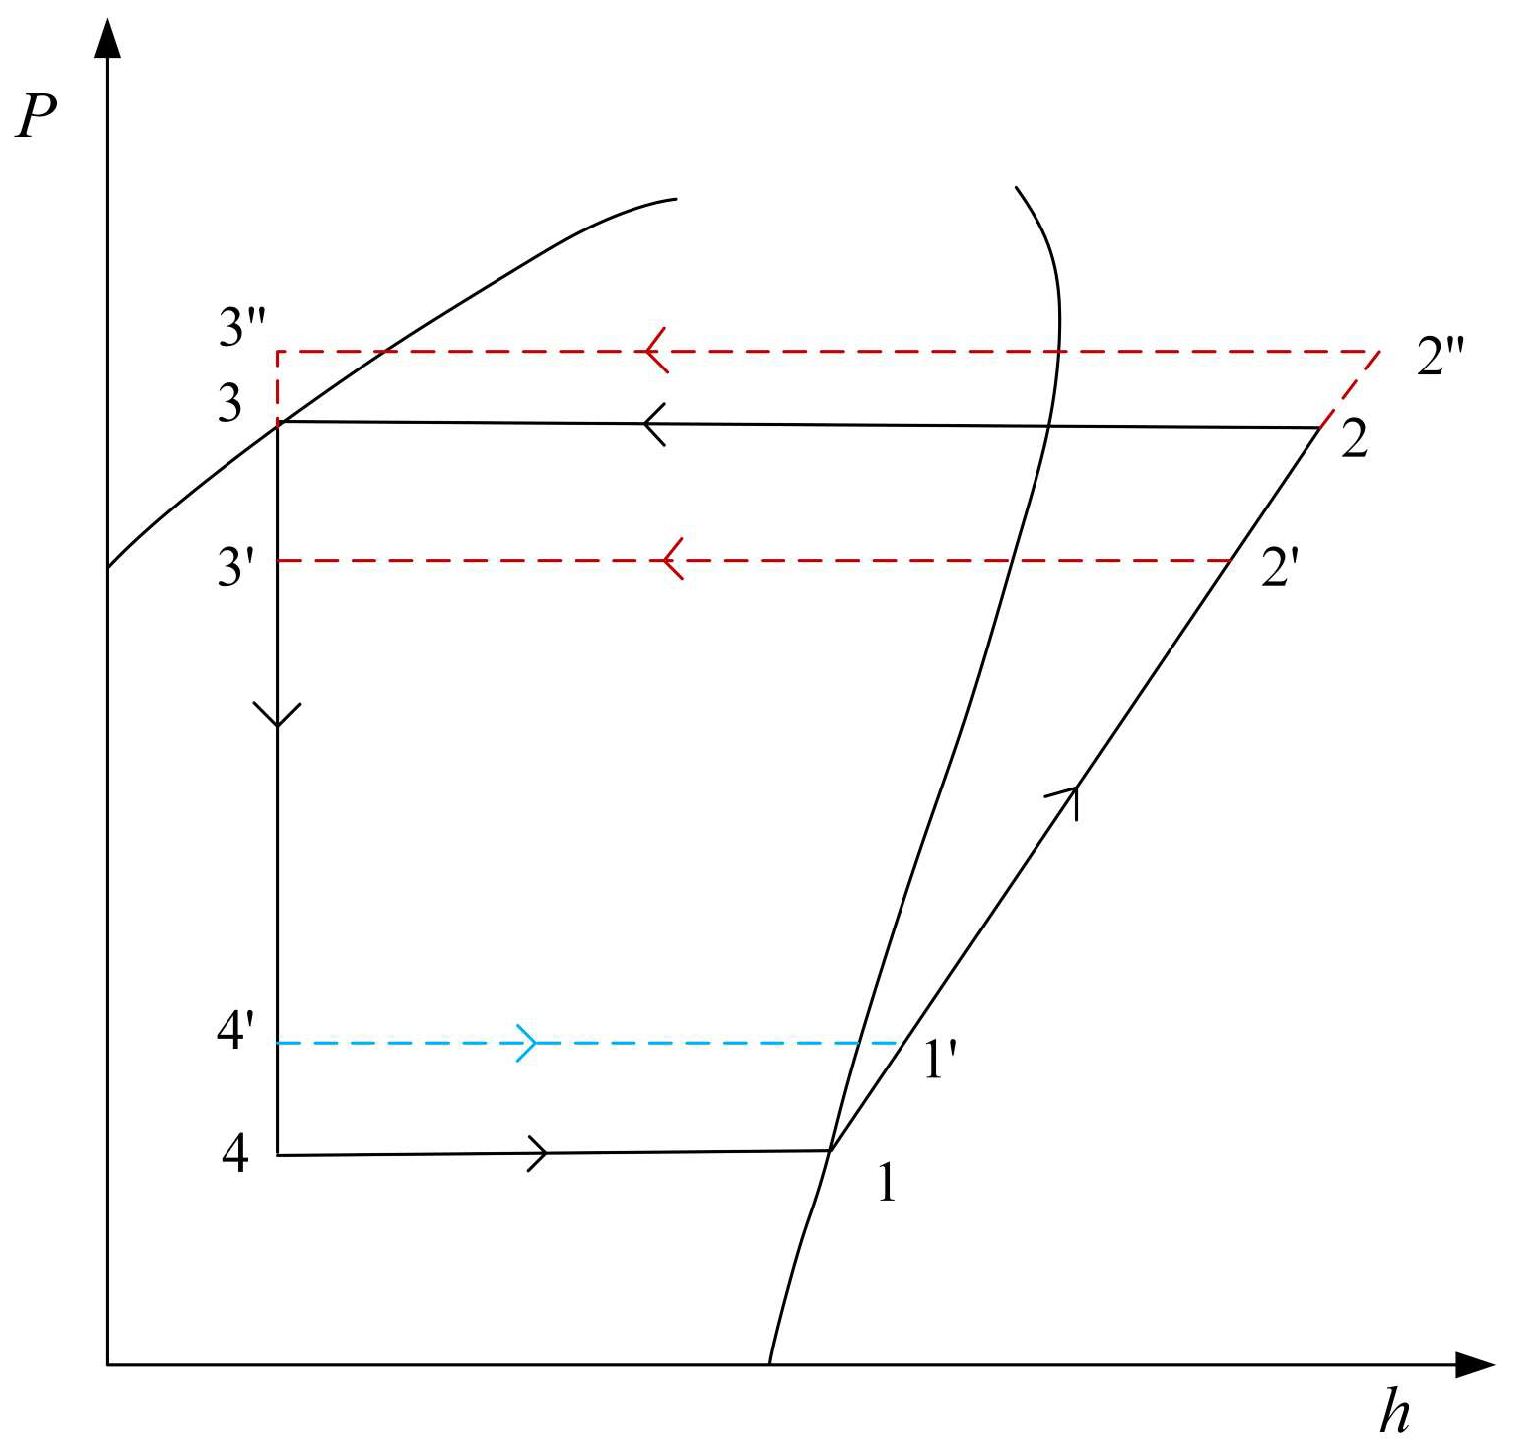
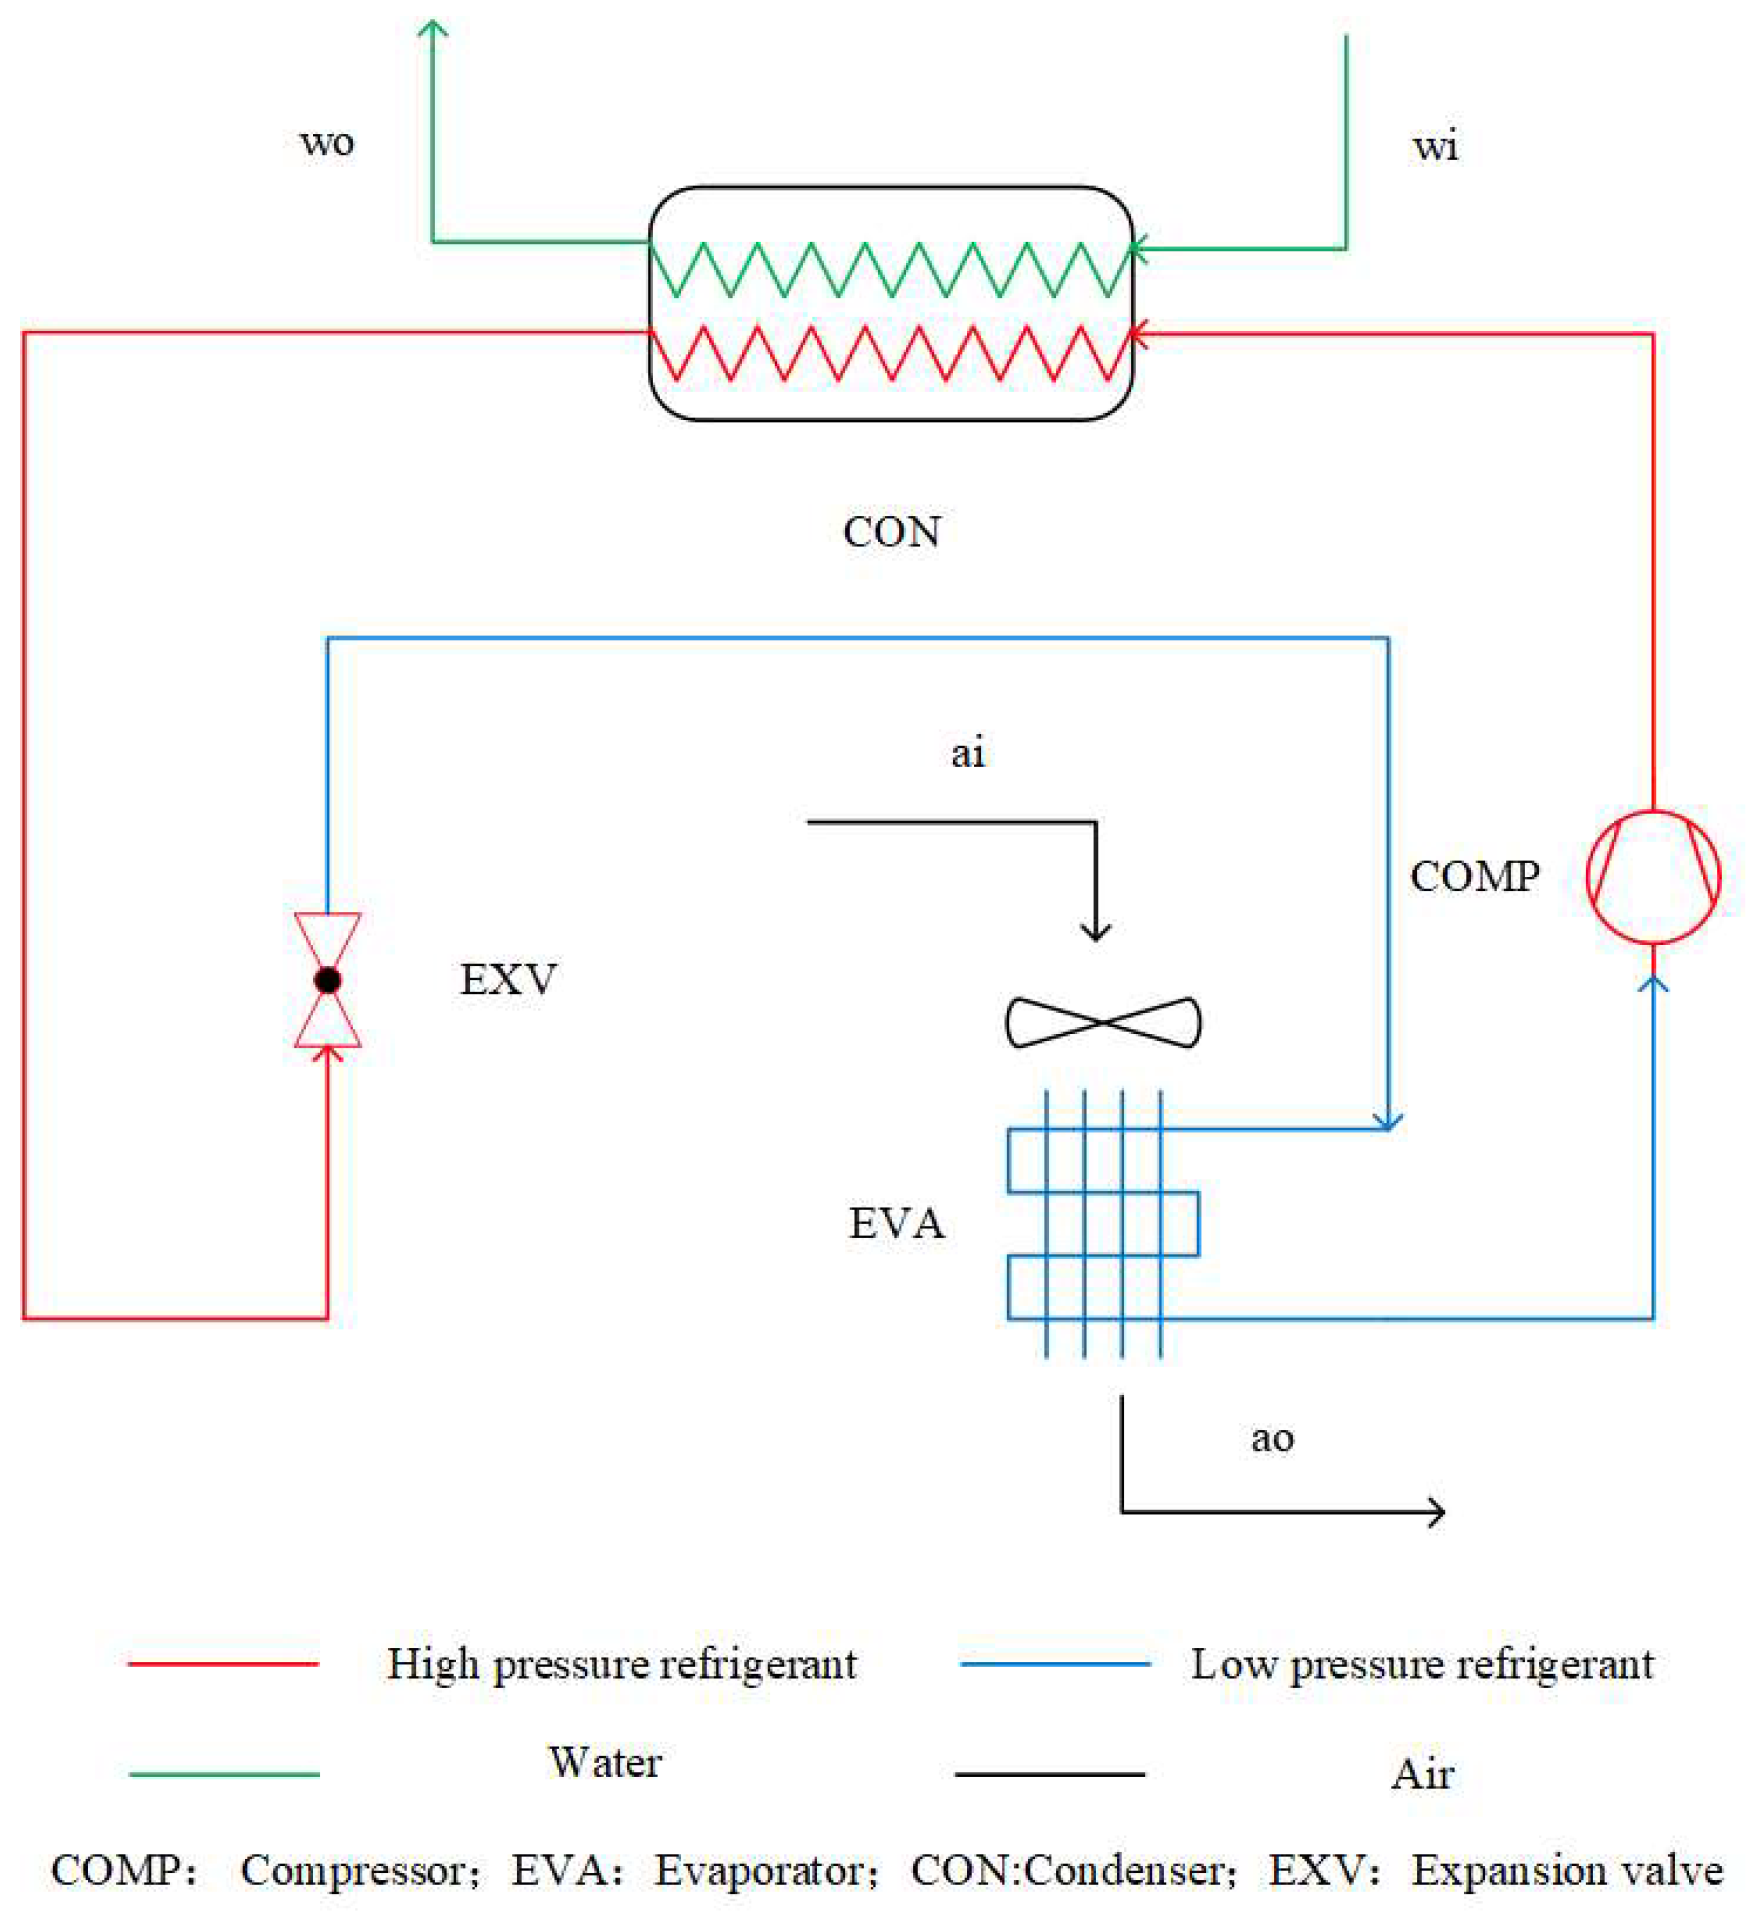
2.1. Principle of Heat Pump for Air Source Water Heater
- (1)
- The pressure drop of the refrigerant in the exchanger and piping is assumed to be negligible.
- (2)
- Heat loss from the evaporator, condenser, compressor, electronic expansion valve, and piping to the surroundings needs to be addressed.
- (3)
- The compressor inlet superheat temperature is assumed to be 5 °C, with a subcooling of 5 °C at the condenser outlet temperature.
- (4)
- The throttling process in the throttle valve is isenthalpic.
- (5)
- The compression process of the compressor is adiabatic.
2.2. Compressor Modelling
2.3. Condenser Modelling
2.4. Throttle Modelling
2.5. Evaporators
2.6. Performance Analysis Modelling
2.7. Performance Analysis at Different Air and Water Temperatures
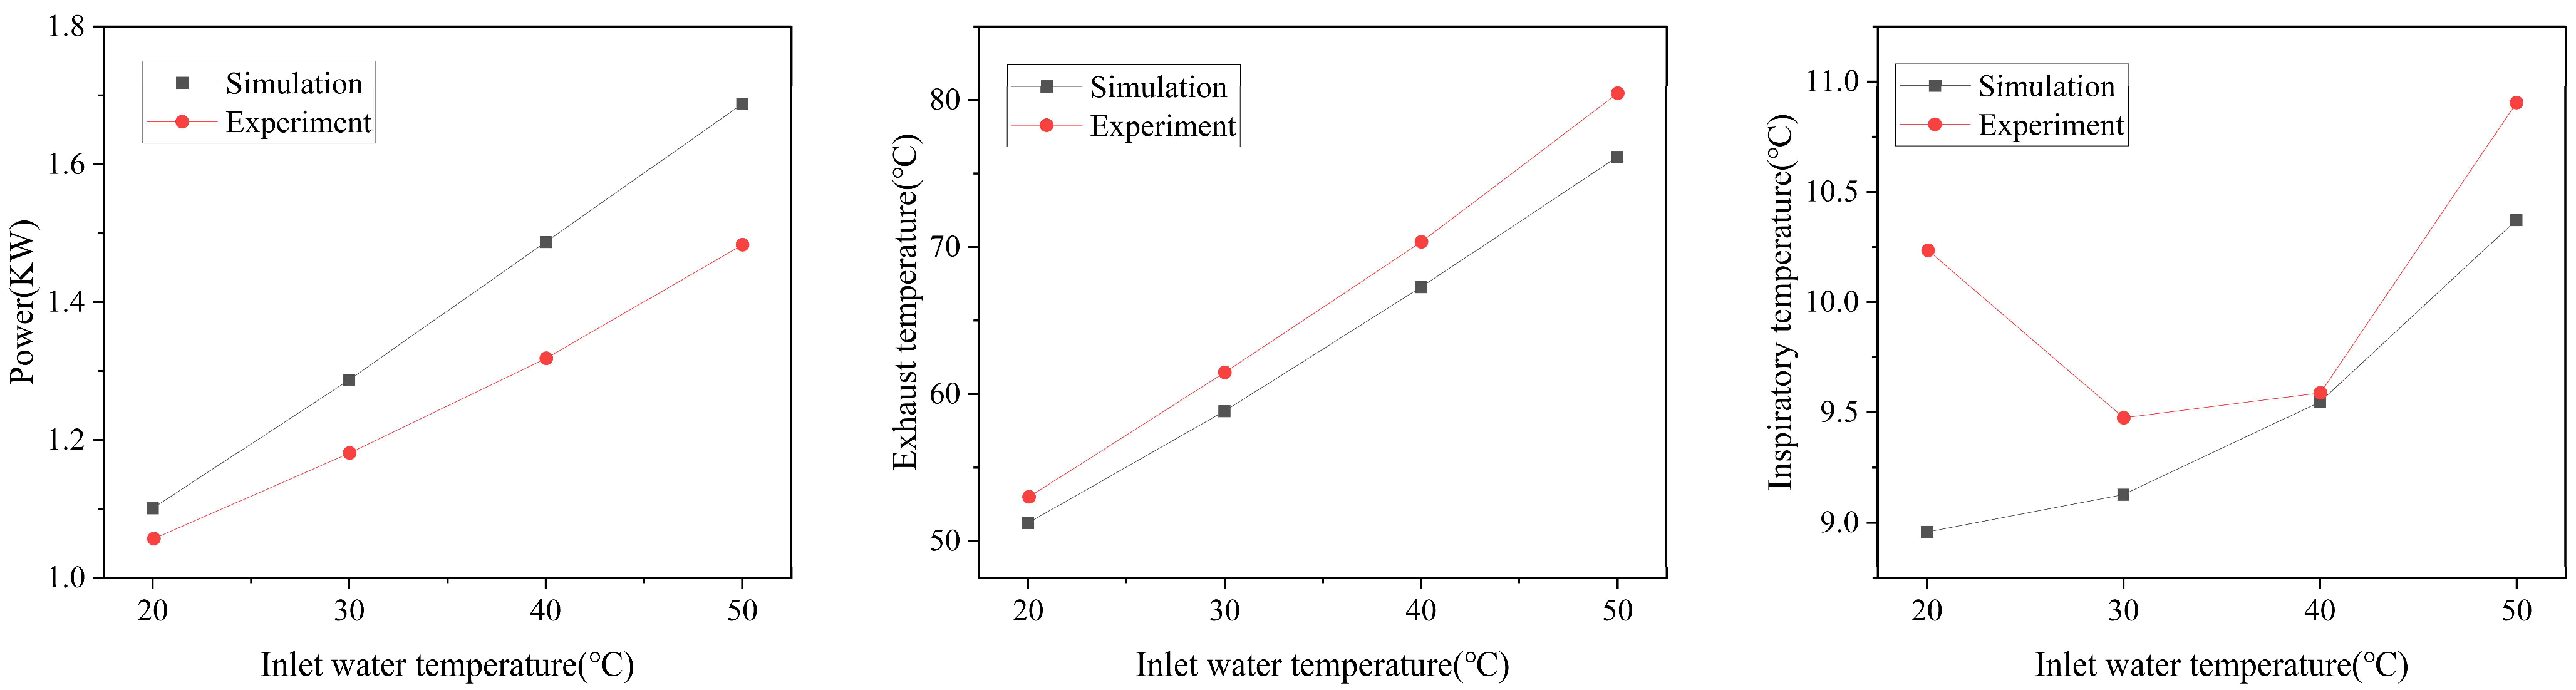
2.7.1. Simulation Results
2.7.2. Analysis of Causes
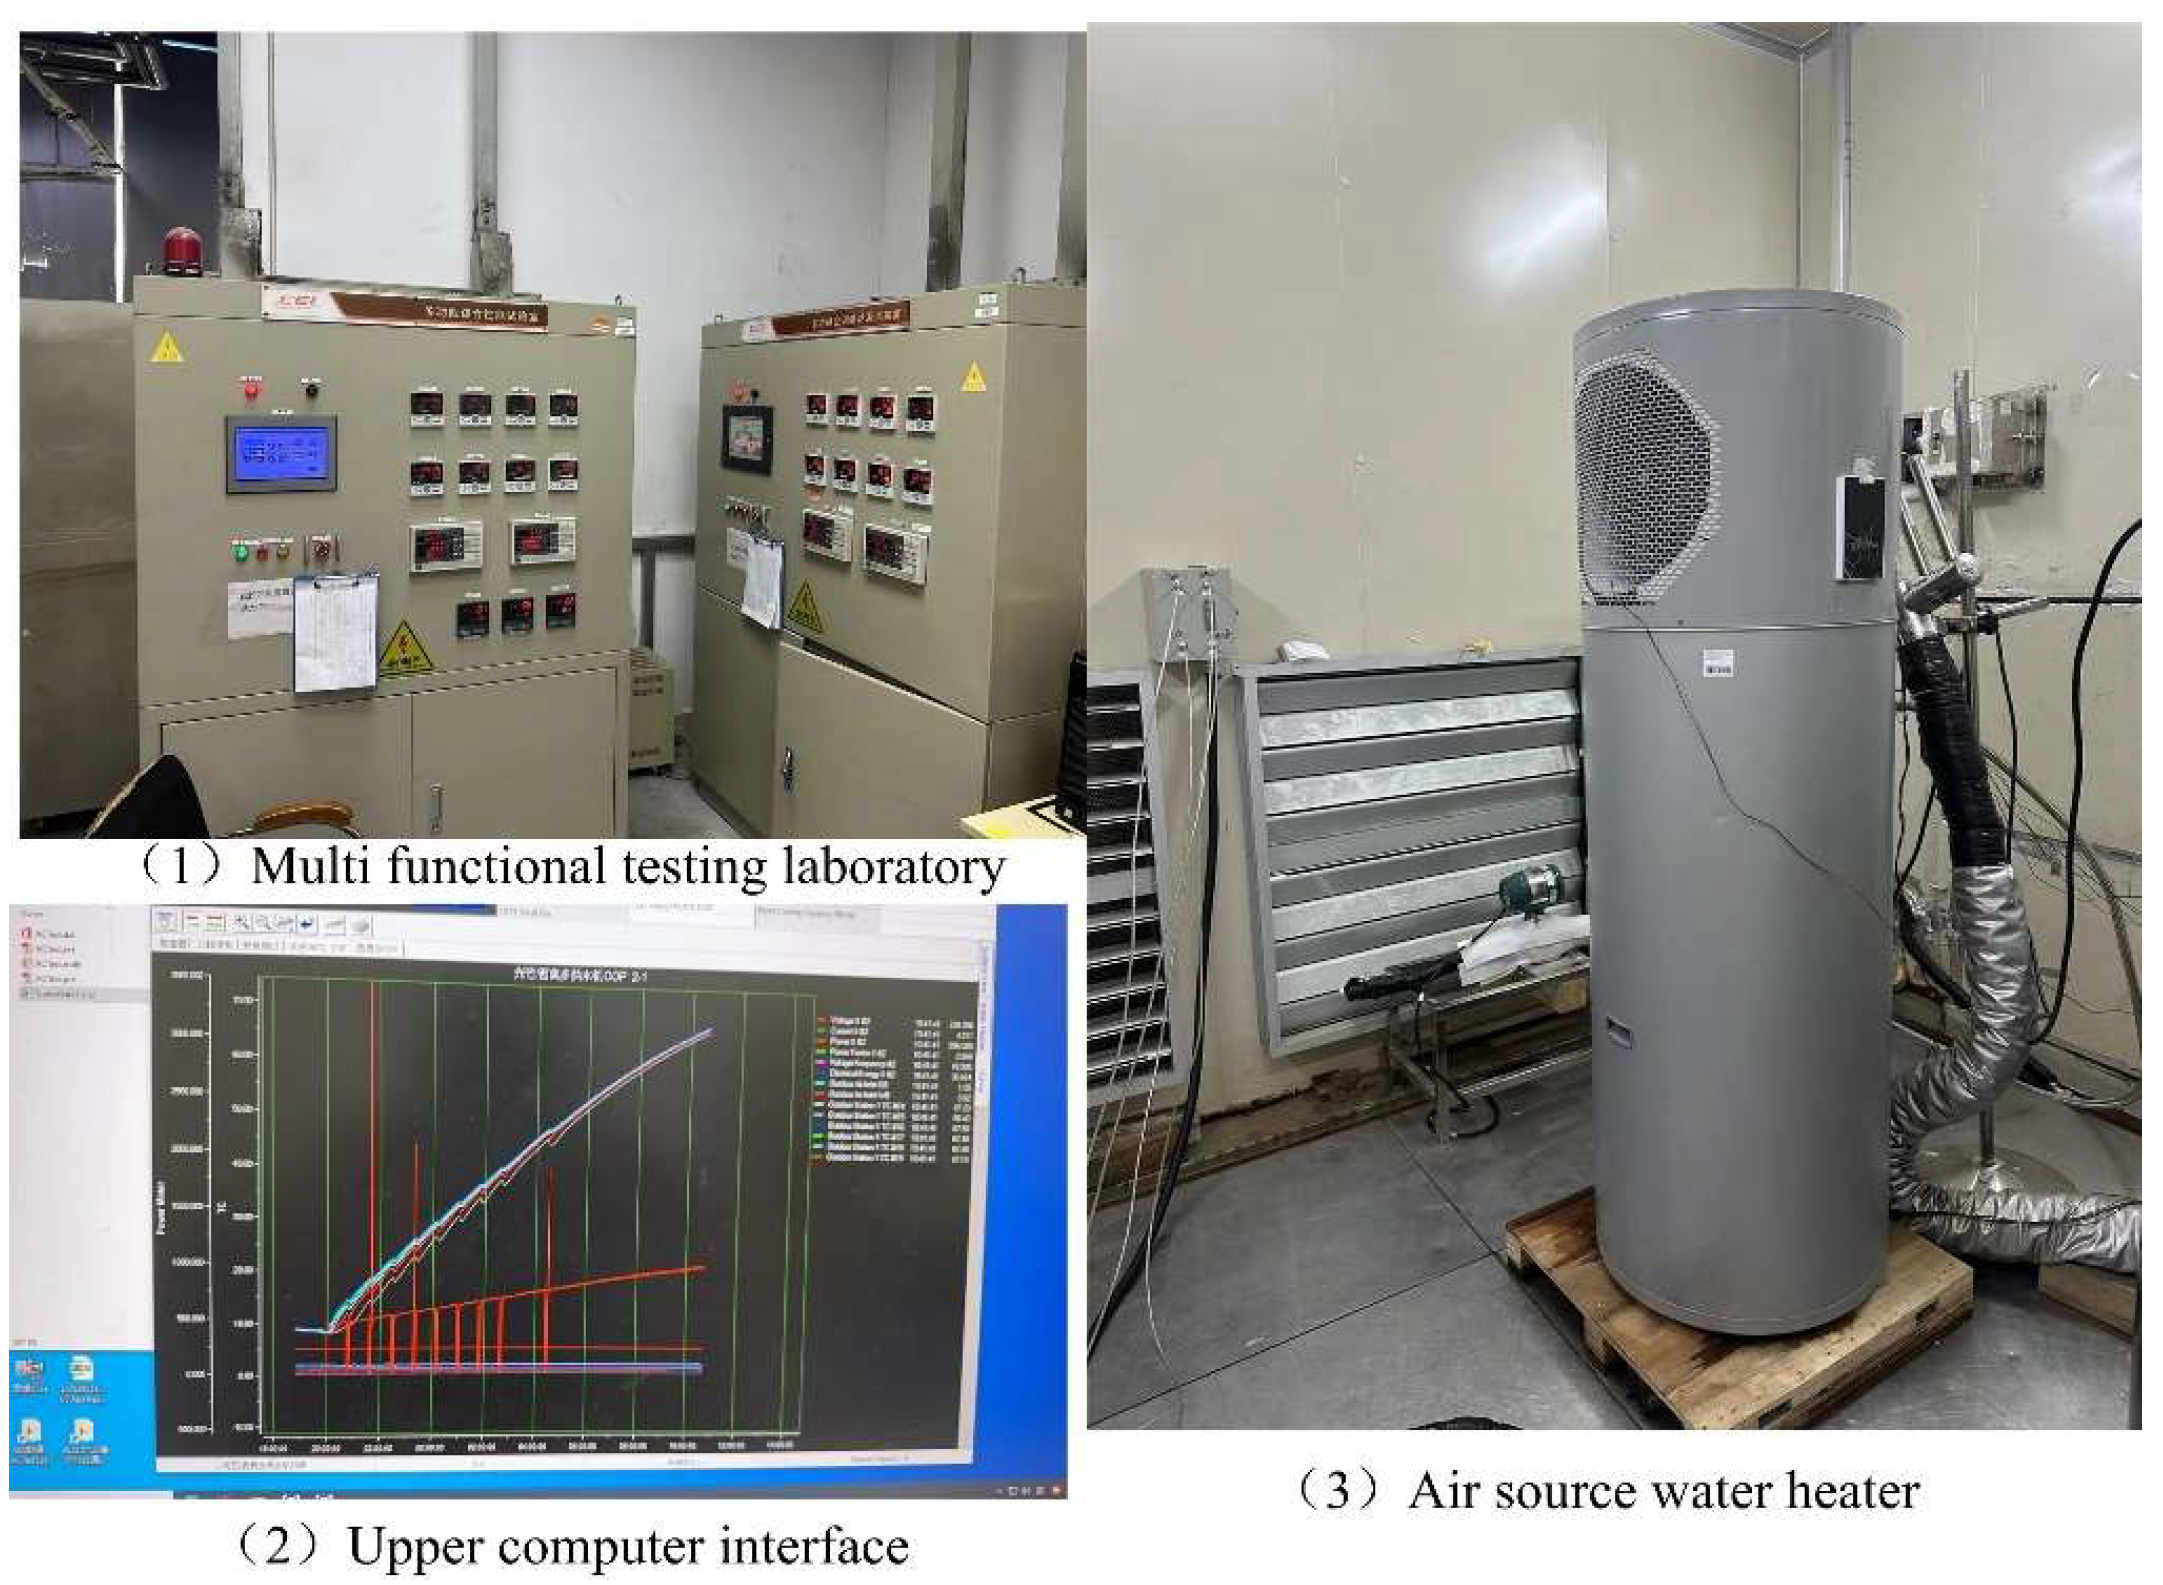
2.7.3. Experimental Result
3. Results of COP Improvement Strategies
3.1. Compressor Inverter
3.2. Electronic Expansion Valve Regulation
3.3. New Refrigerant Mass Ratio
4. Calculation of Annual Energy Consumption Under Australian Standards
4.1. Annual Performance Analysis
4.2. Years of Thermal Performance
5. Conclusions
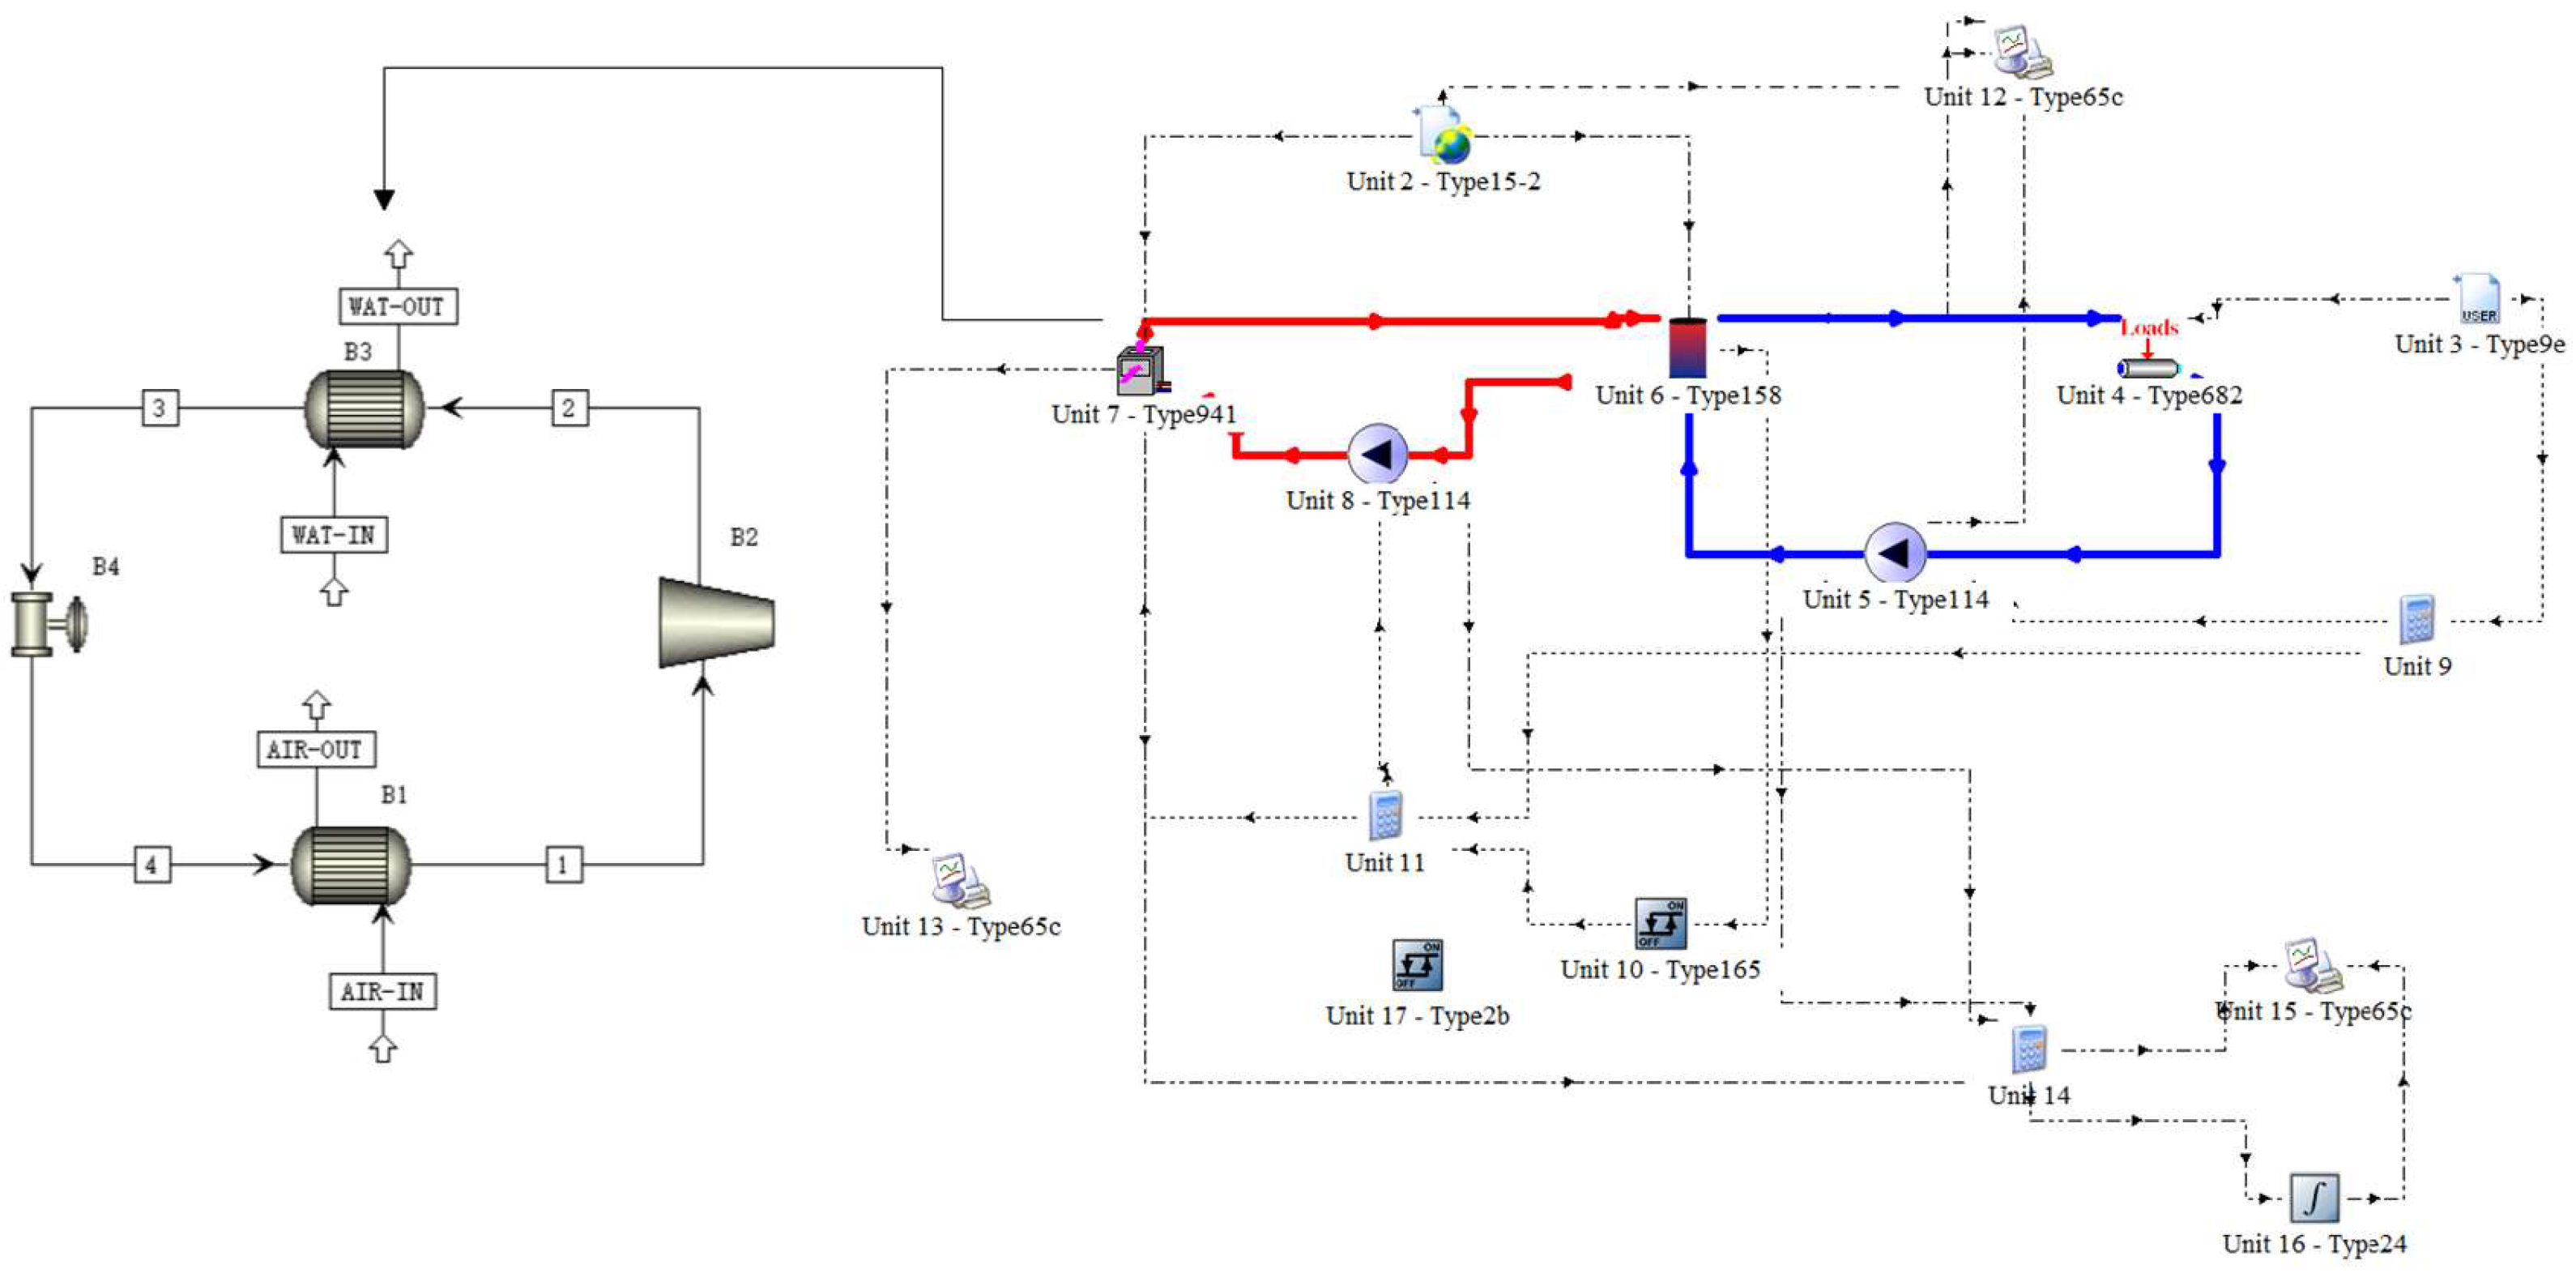
- (1)
- An innovative joint Aspen and Trnsys simulation model was developed for this study. The model combines the flexibility of Aspen v11 software in constructing models of the four main components of the heat pump and setting parameters and the advantages of Trnsys software in evaluating the energy consumption and the COP of the system to reflect the system behavior under different operating conditions accurately. Based on this common simulation platform, we were able to thoroughly study the effects of various improvement measures and ensure that the results obtained are highly reliable and practical.
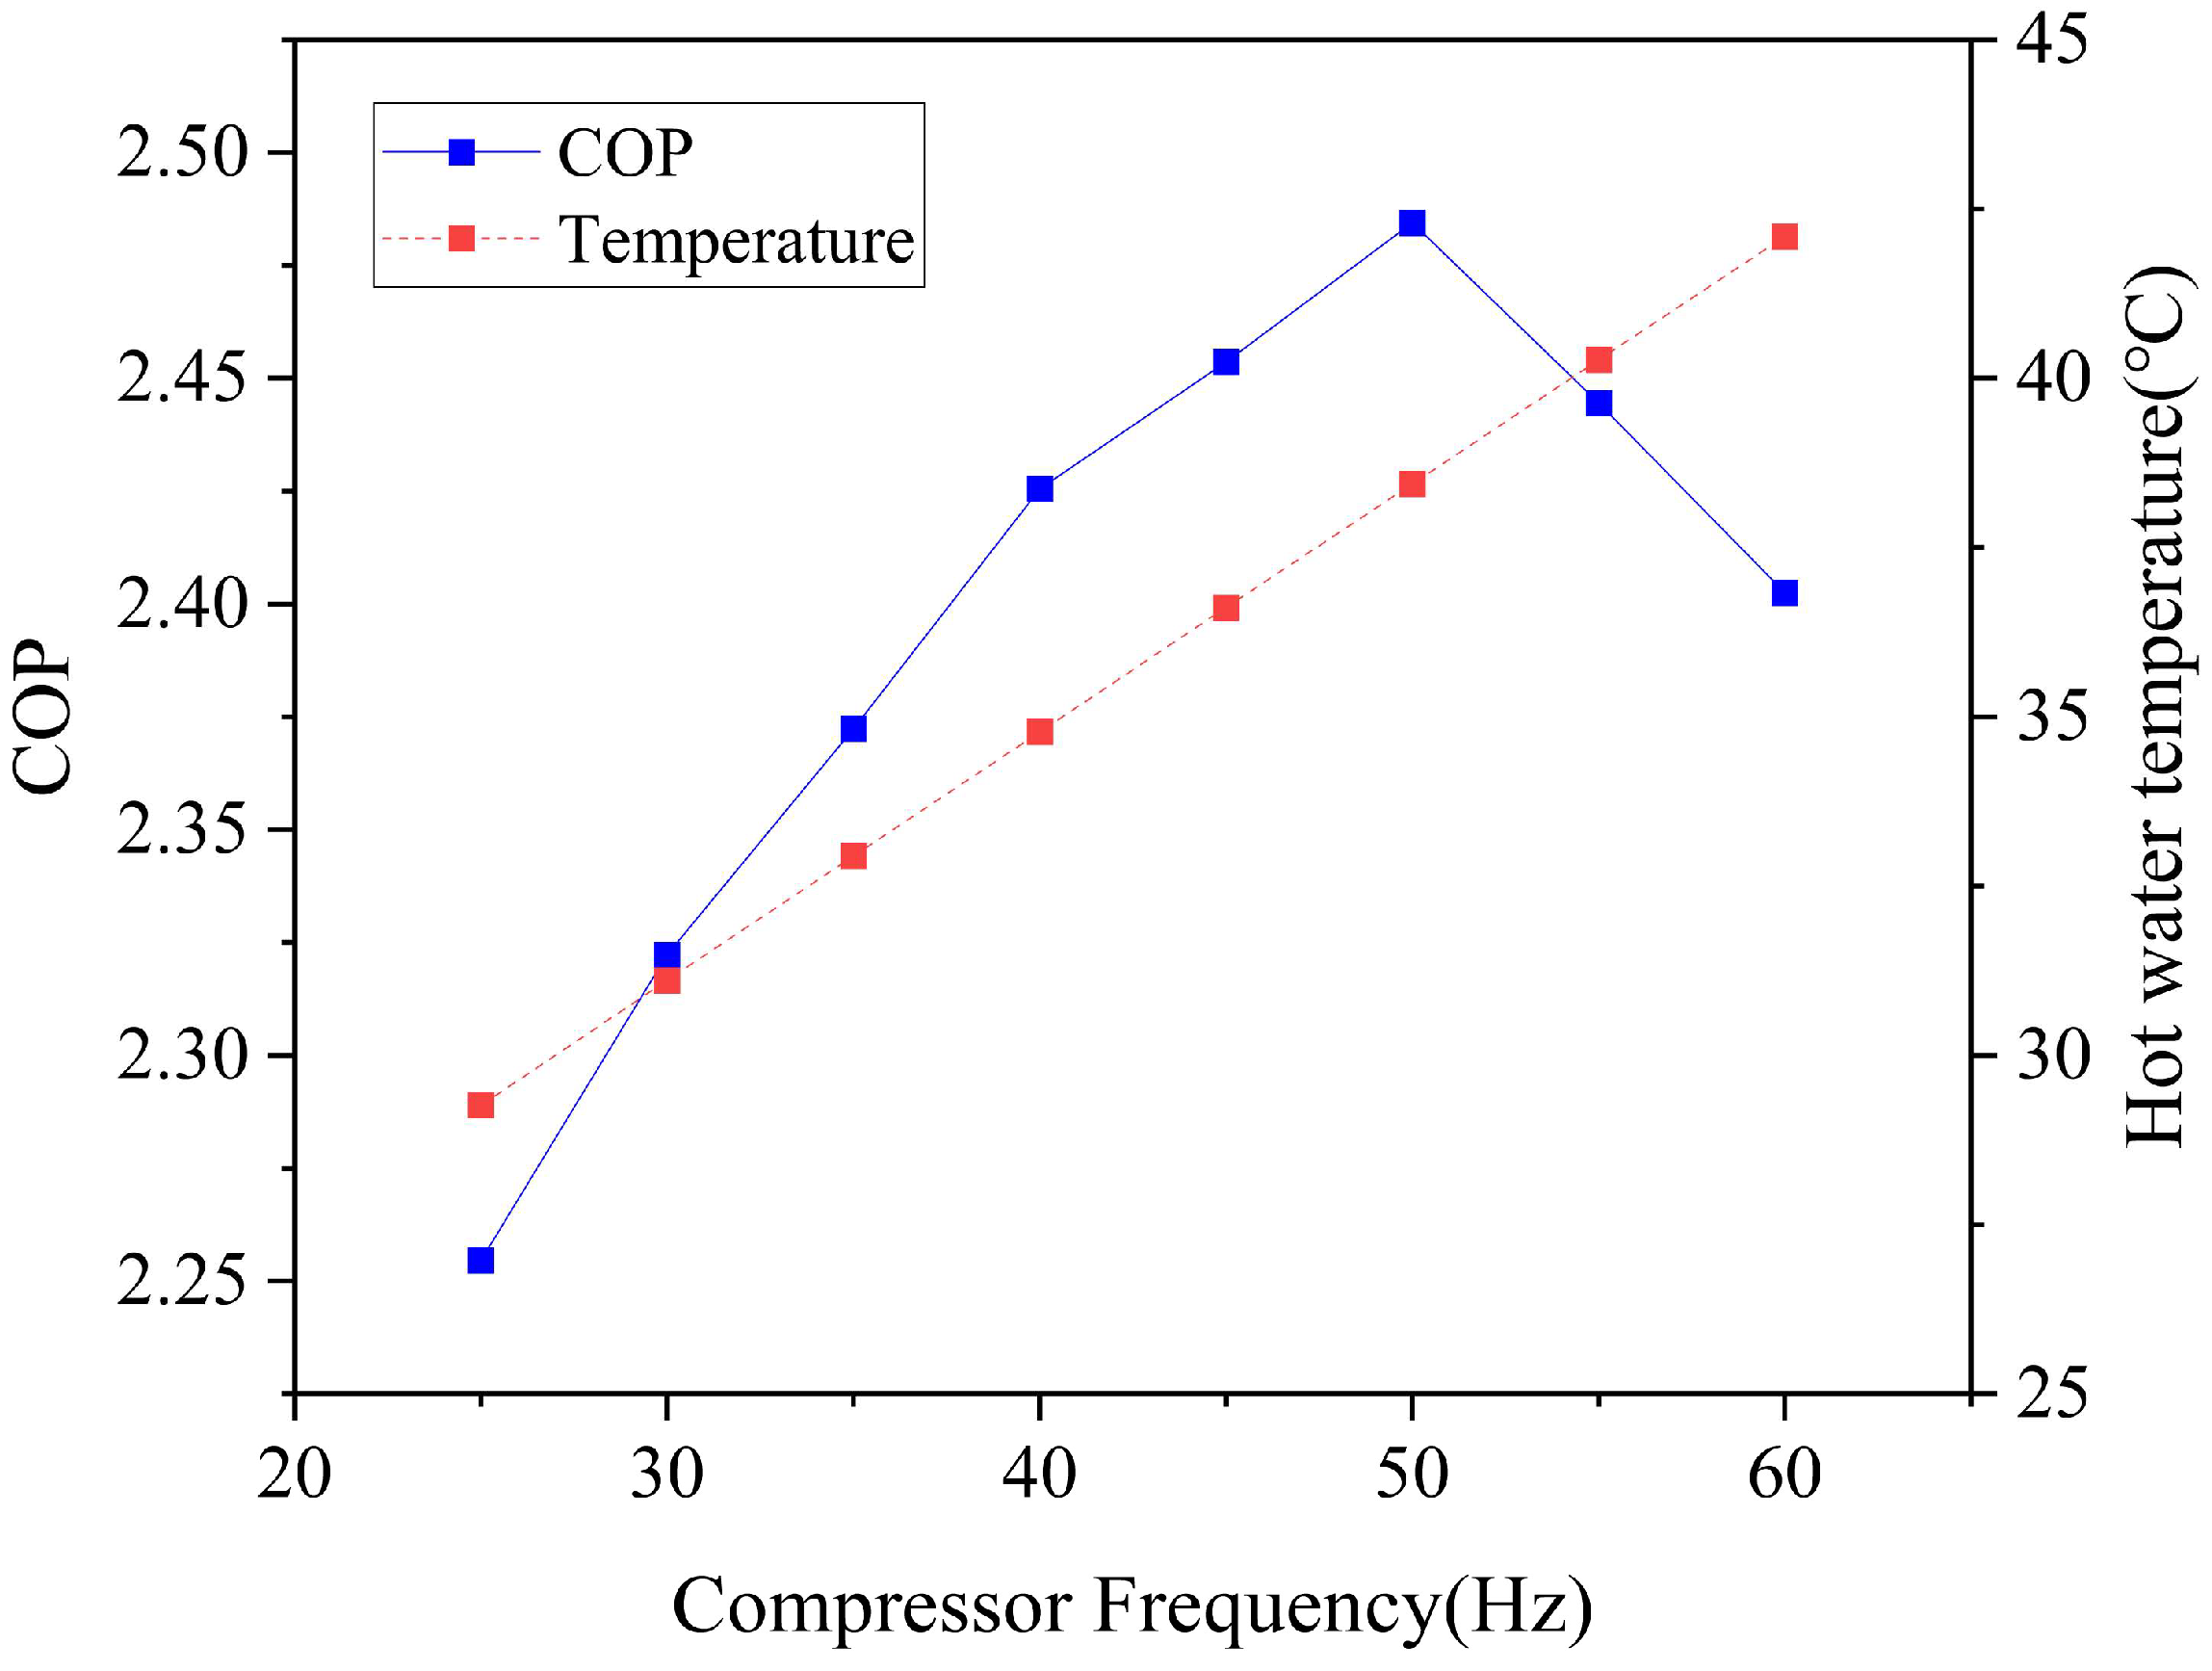
- (2)
- In a low-temperature environment, when the compressor frequency is adjusted individually, the heating system shows the best performance in the frequency range of 45 to 55 Hz, with a coefficient of performance (COP) of 2.51. At the same time, the outlet water temperature continues to increase as the frequency increases.
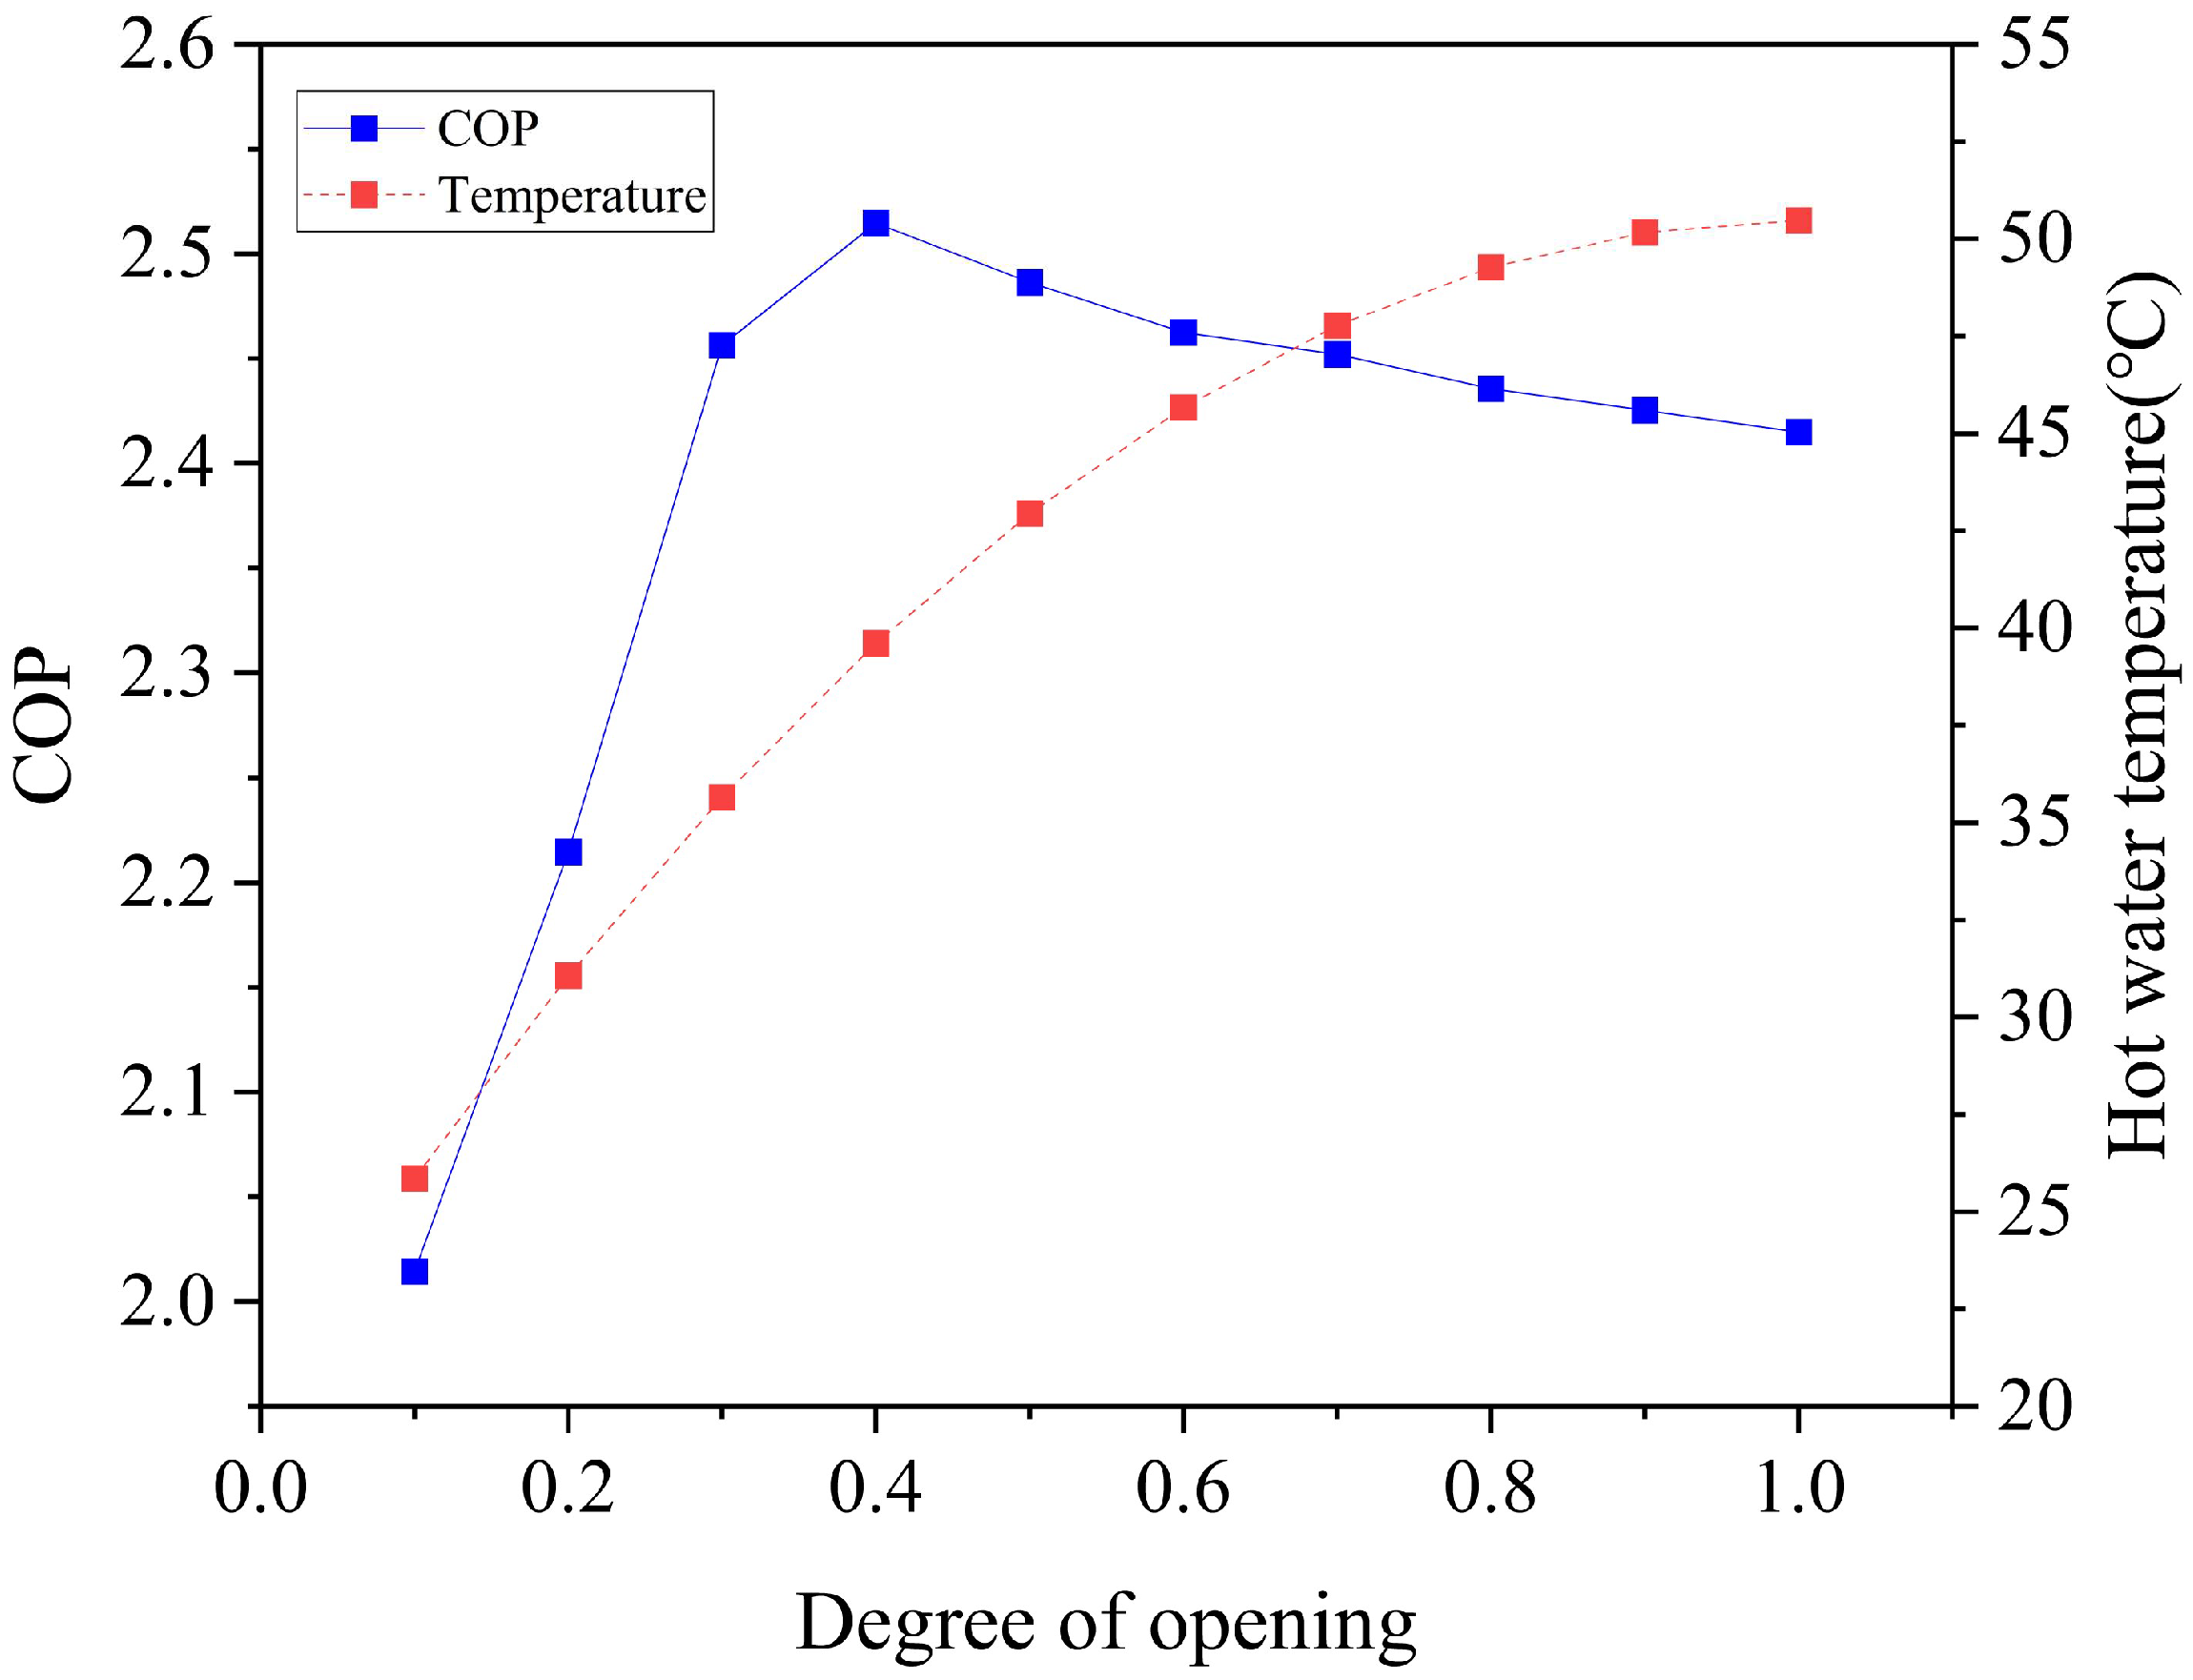
- (3)
- In a low-temperature environment, the COP tends to increase and then decrease as the opening degree of the electronic expansion valve increases. When the degree of opening is 0.4, the coefficient of performance reaches a maximum value of 2.51; then, as the degree of opening continues to increase, the coefficient of performance gradually decreases. At the same time, the water temperature continues to rise, but the rate of increase has also slowed down.
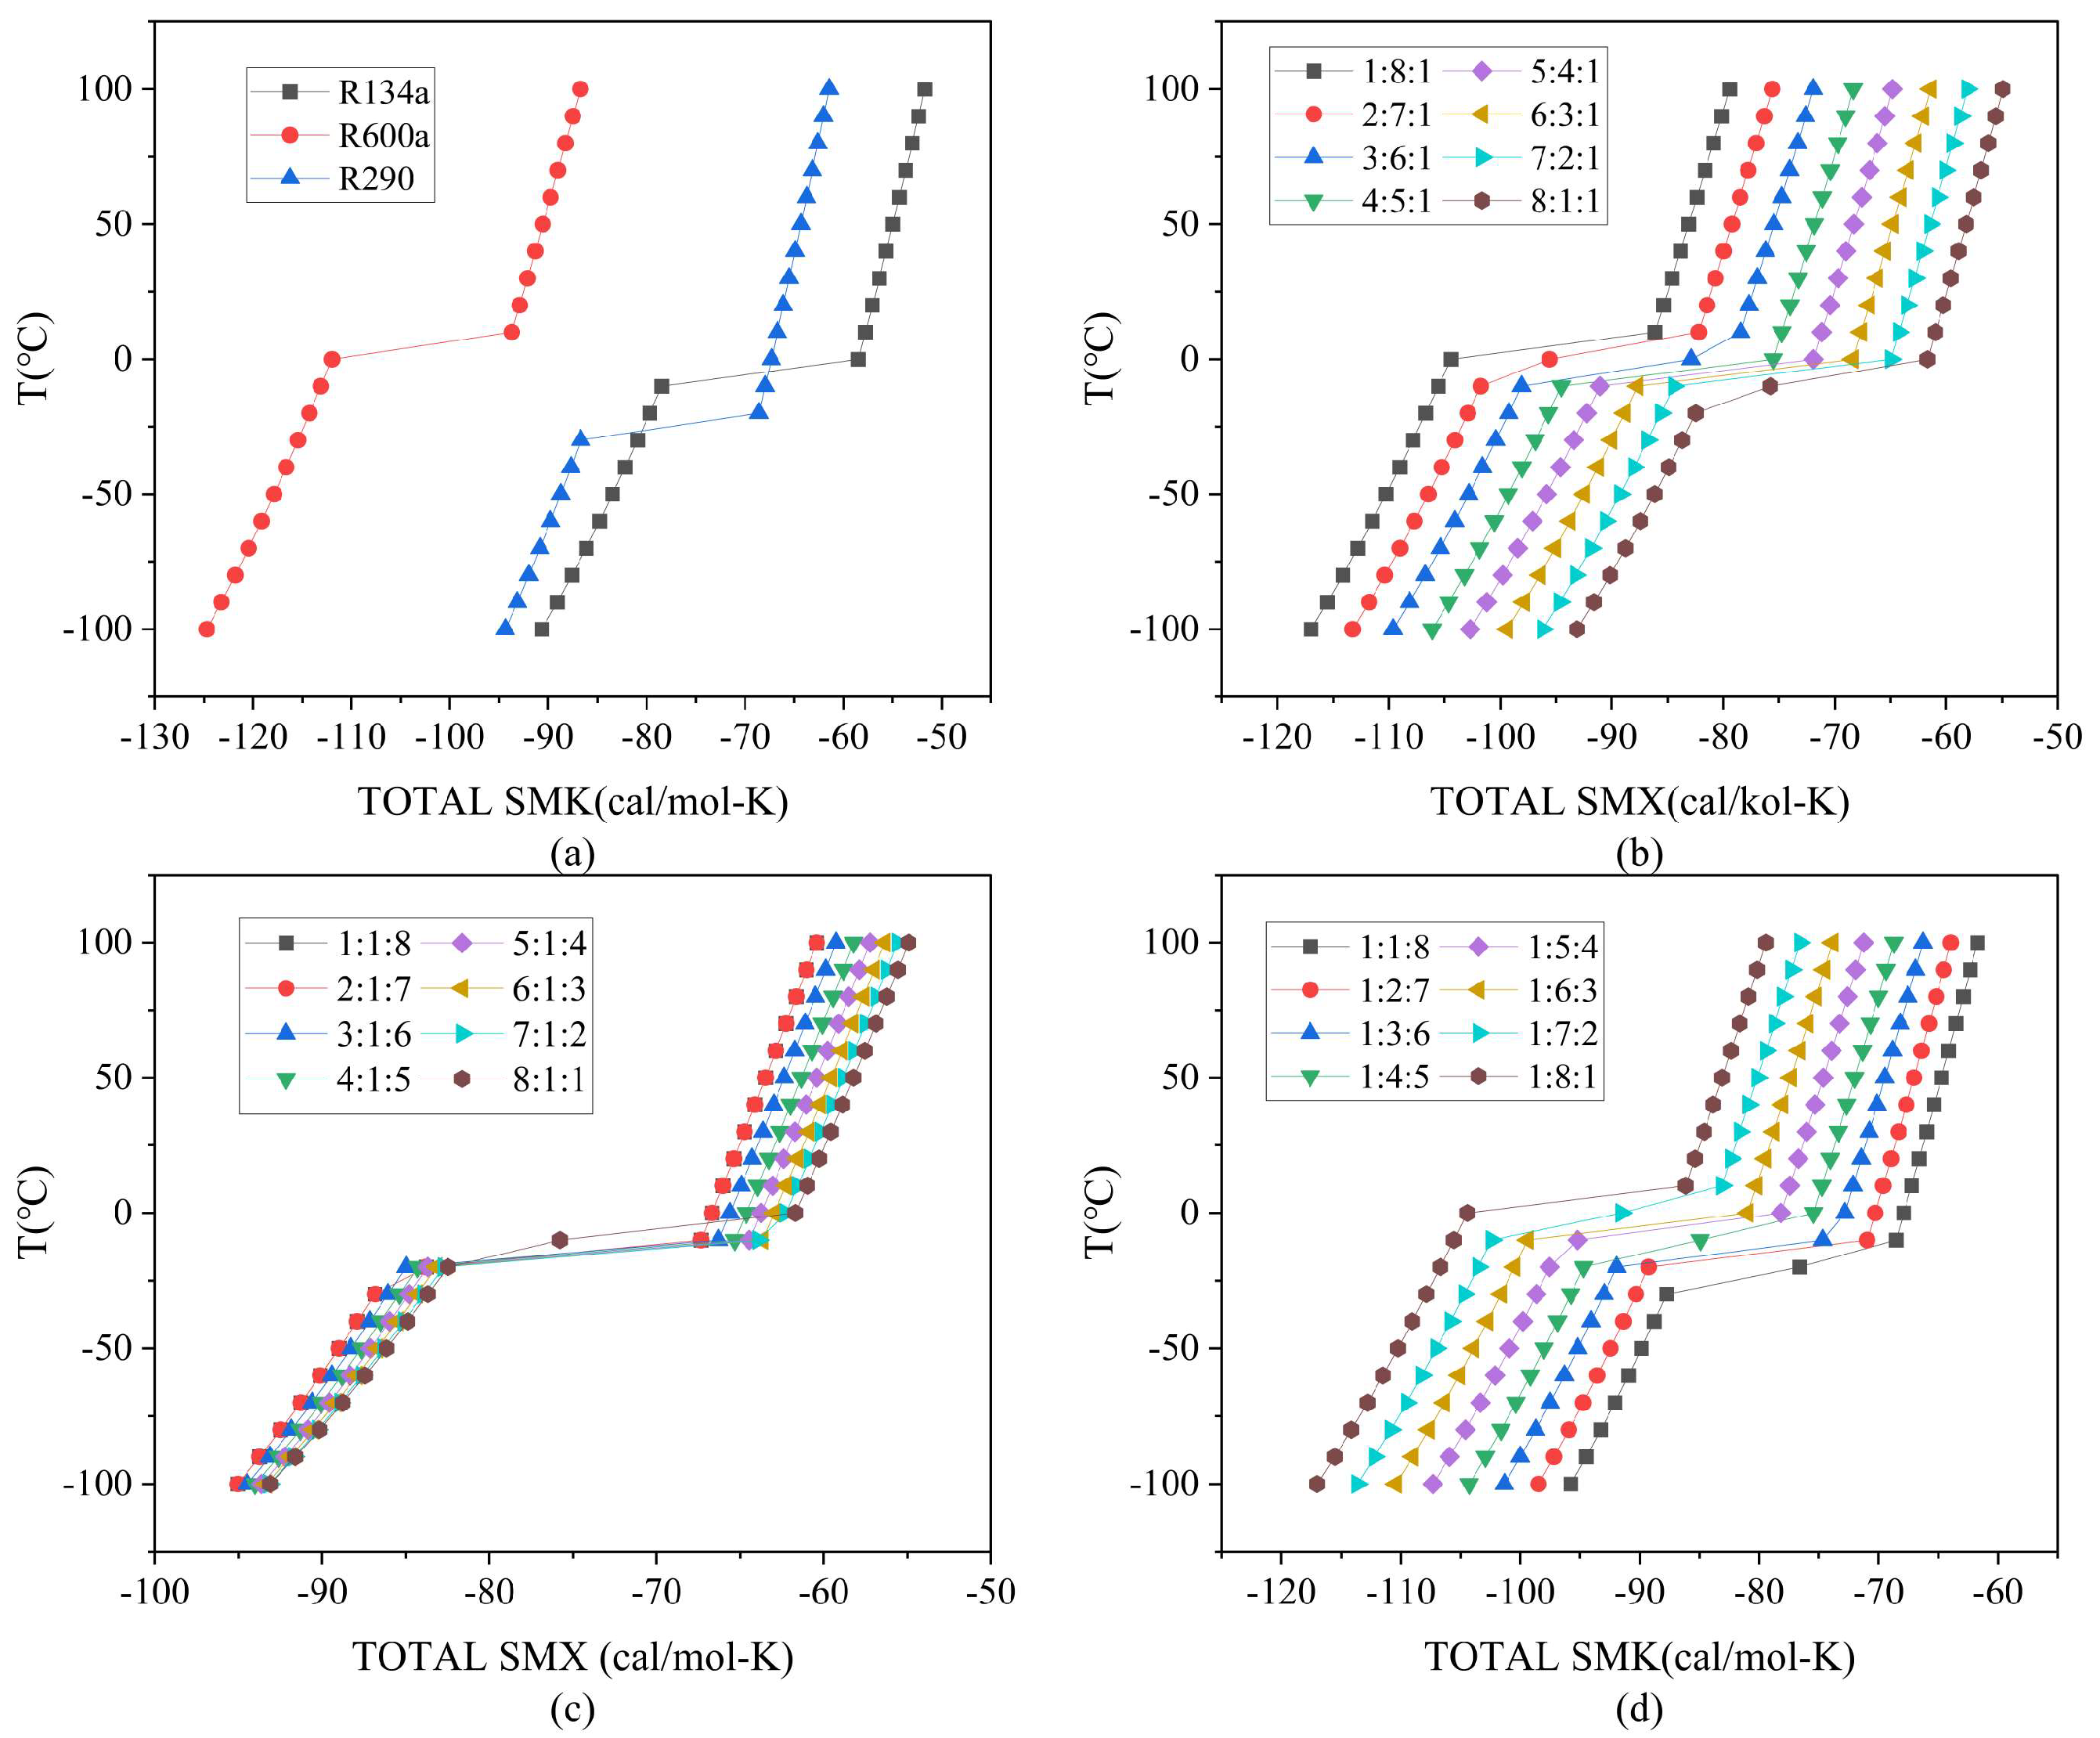
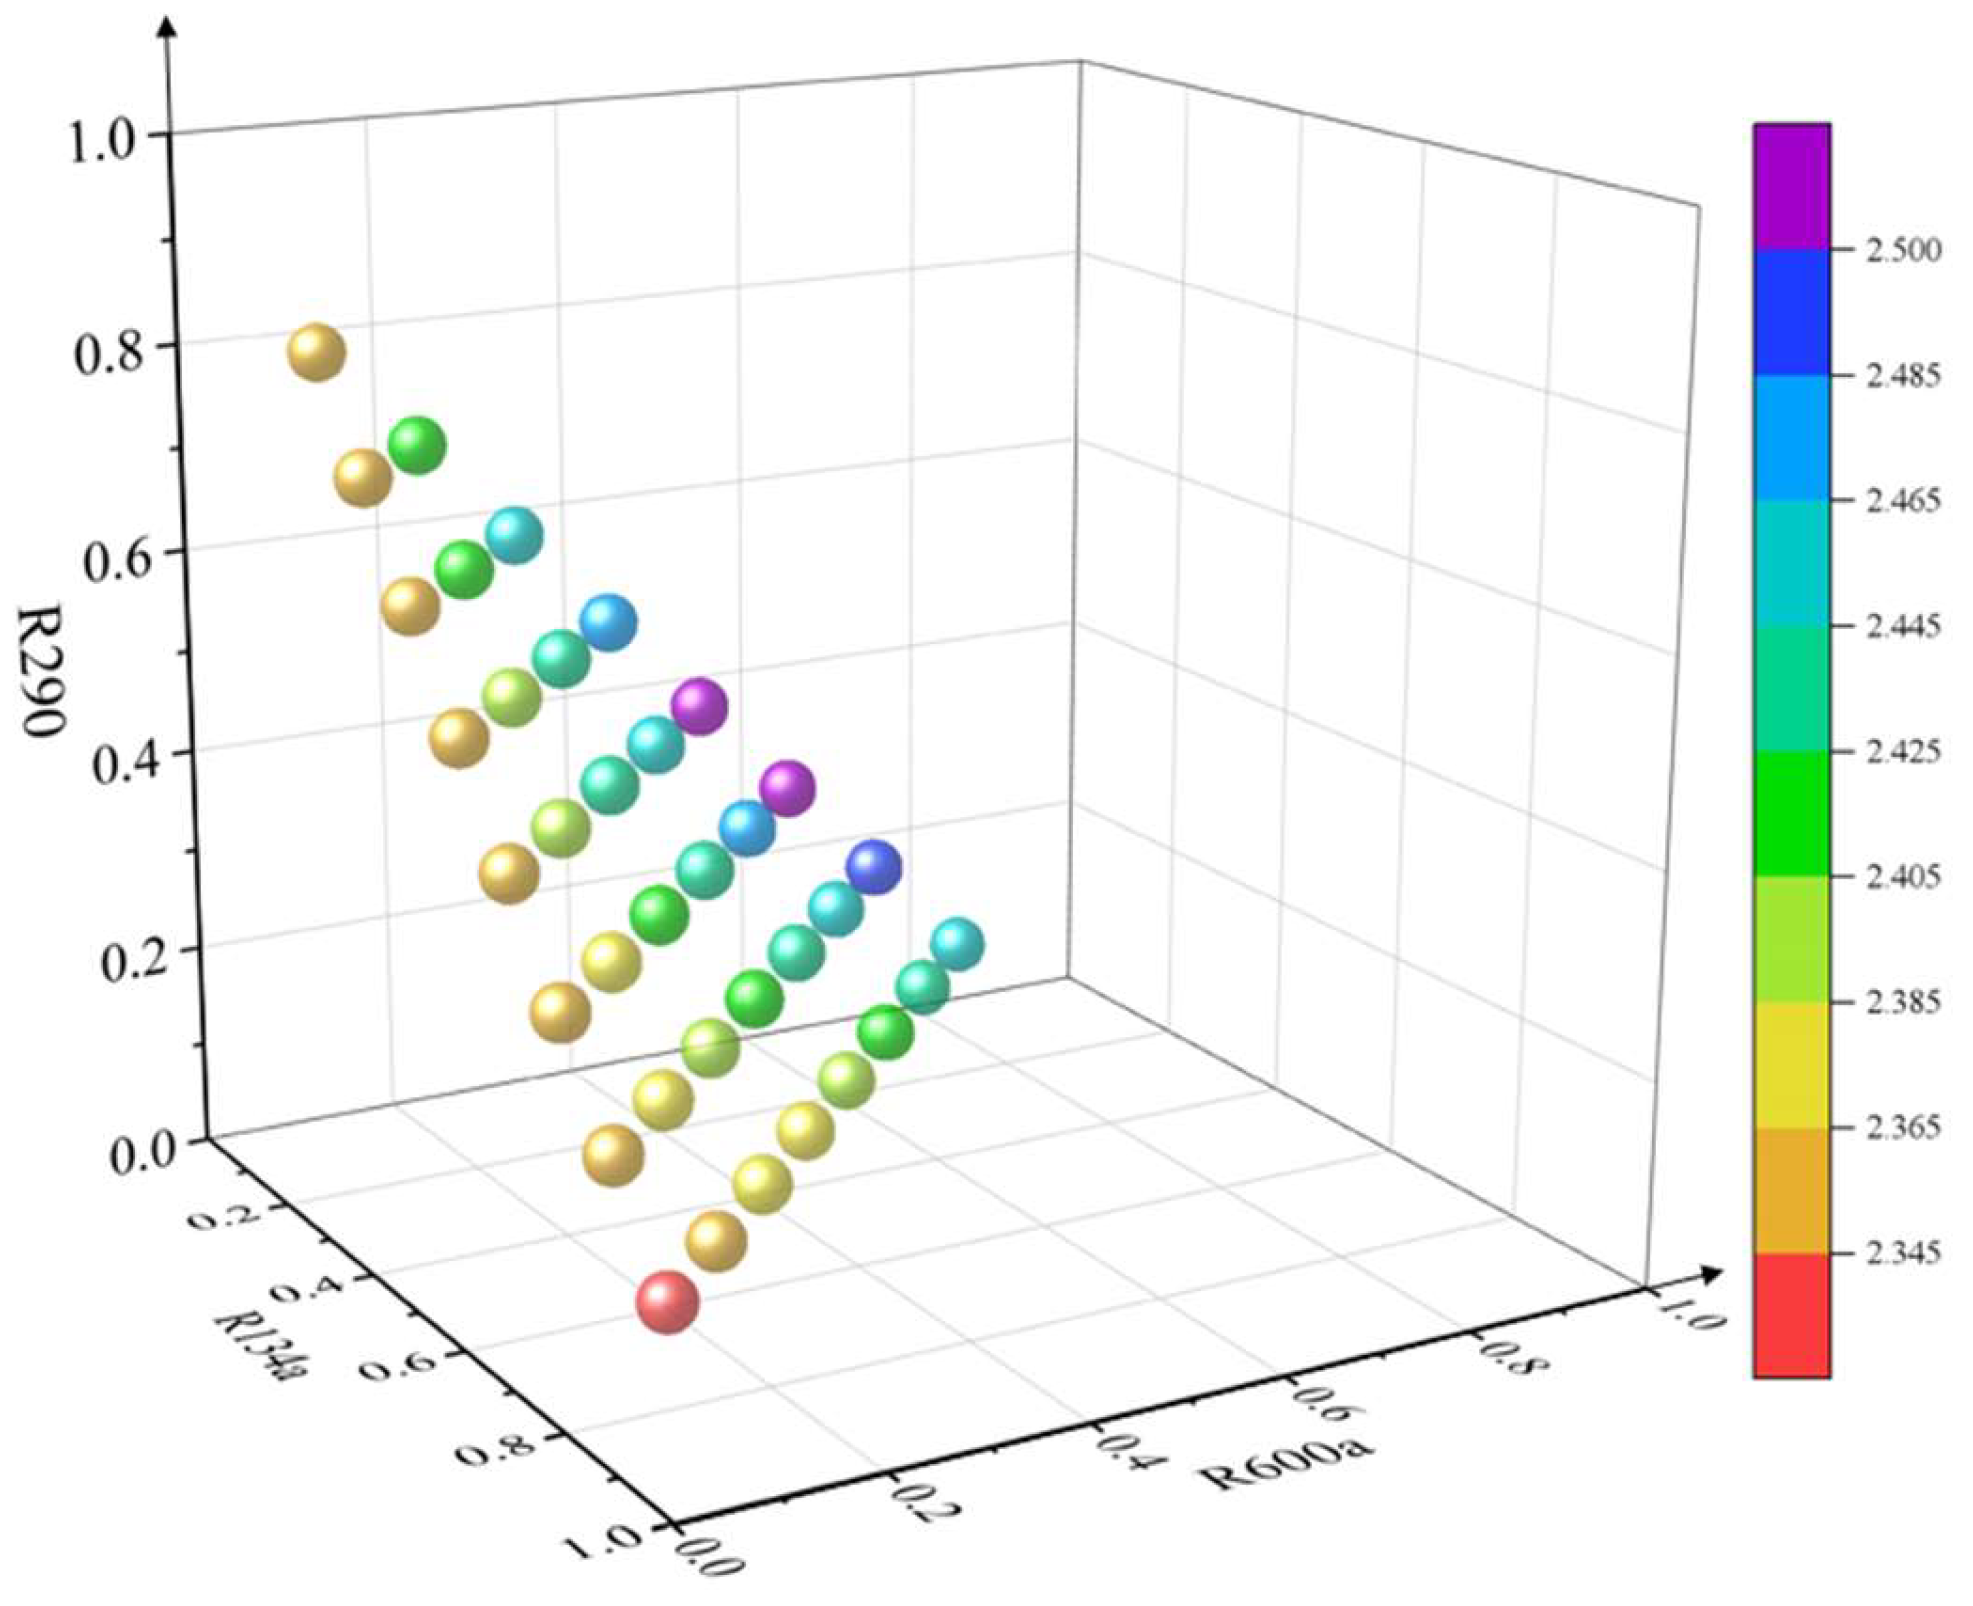
- (4)
- A new hybrid refrigerant R290/R600a/R134a is proposed to replace the conventional R134a in the air source heat pump system, and the simulation results show that, when the molar ratio of the mixed work masses is set to R134a:R600a:R290 = 0. 1:0.6:0.3, the COP of the simulated heat pump system reaches a maximum value of 2.502, which is higher than that of R134a. Under the same conditions, the COP of R134a (2.347) is improved by 6.61%.
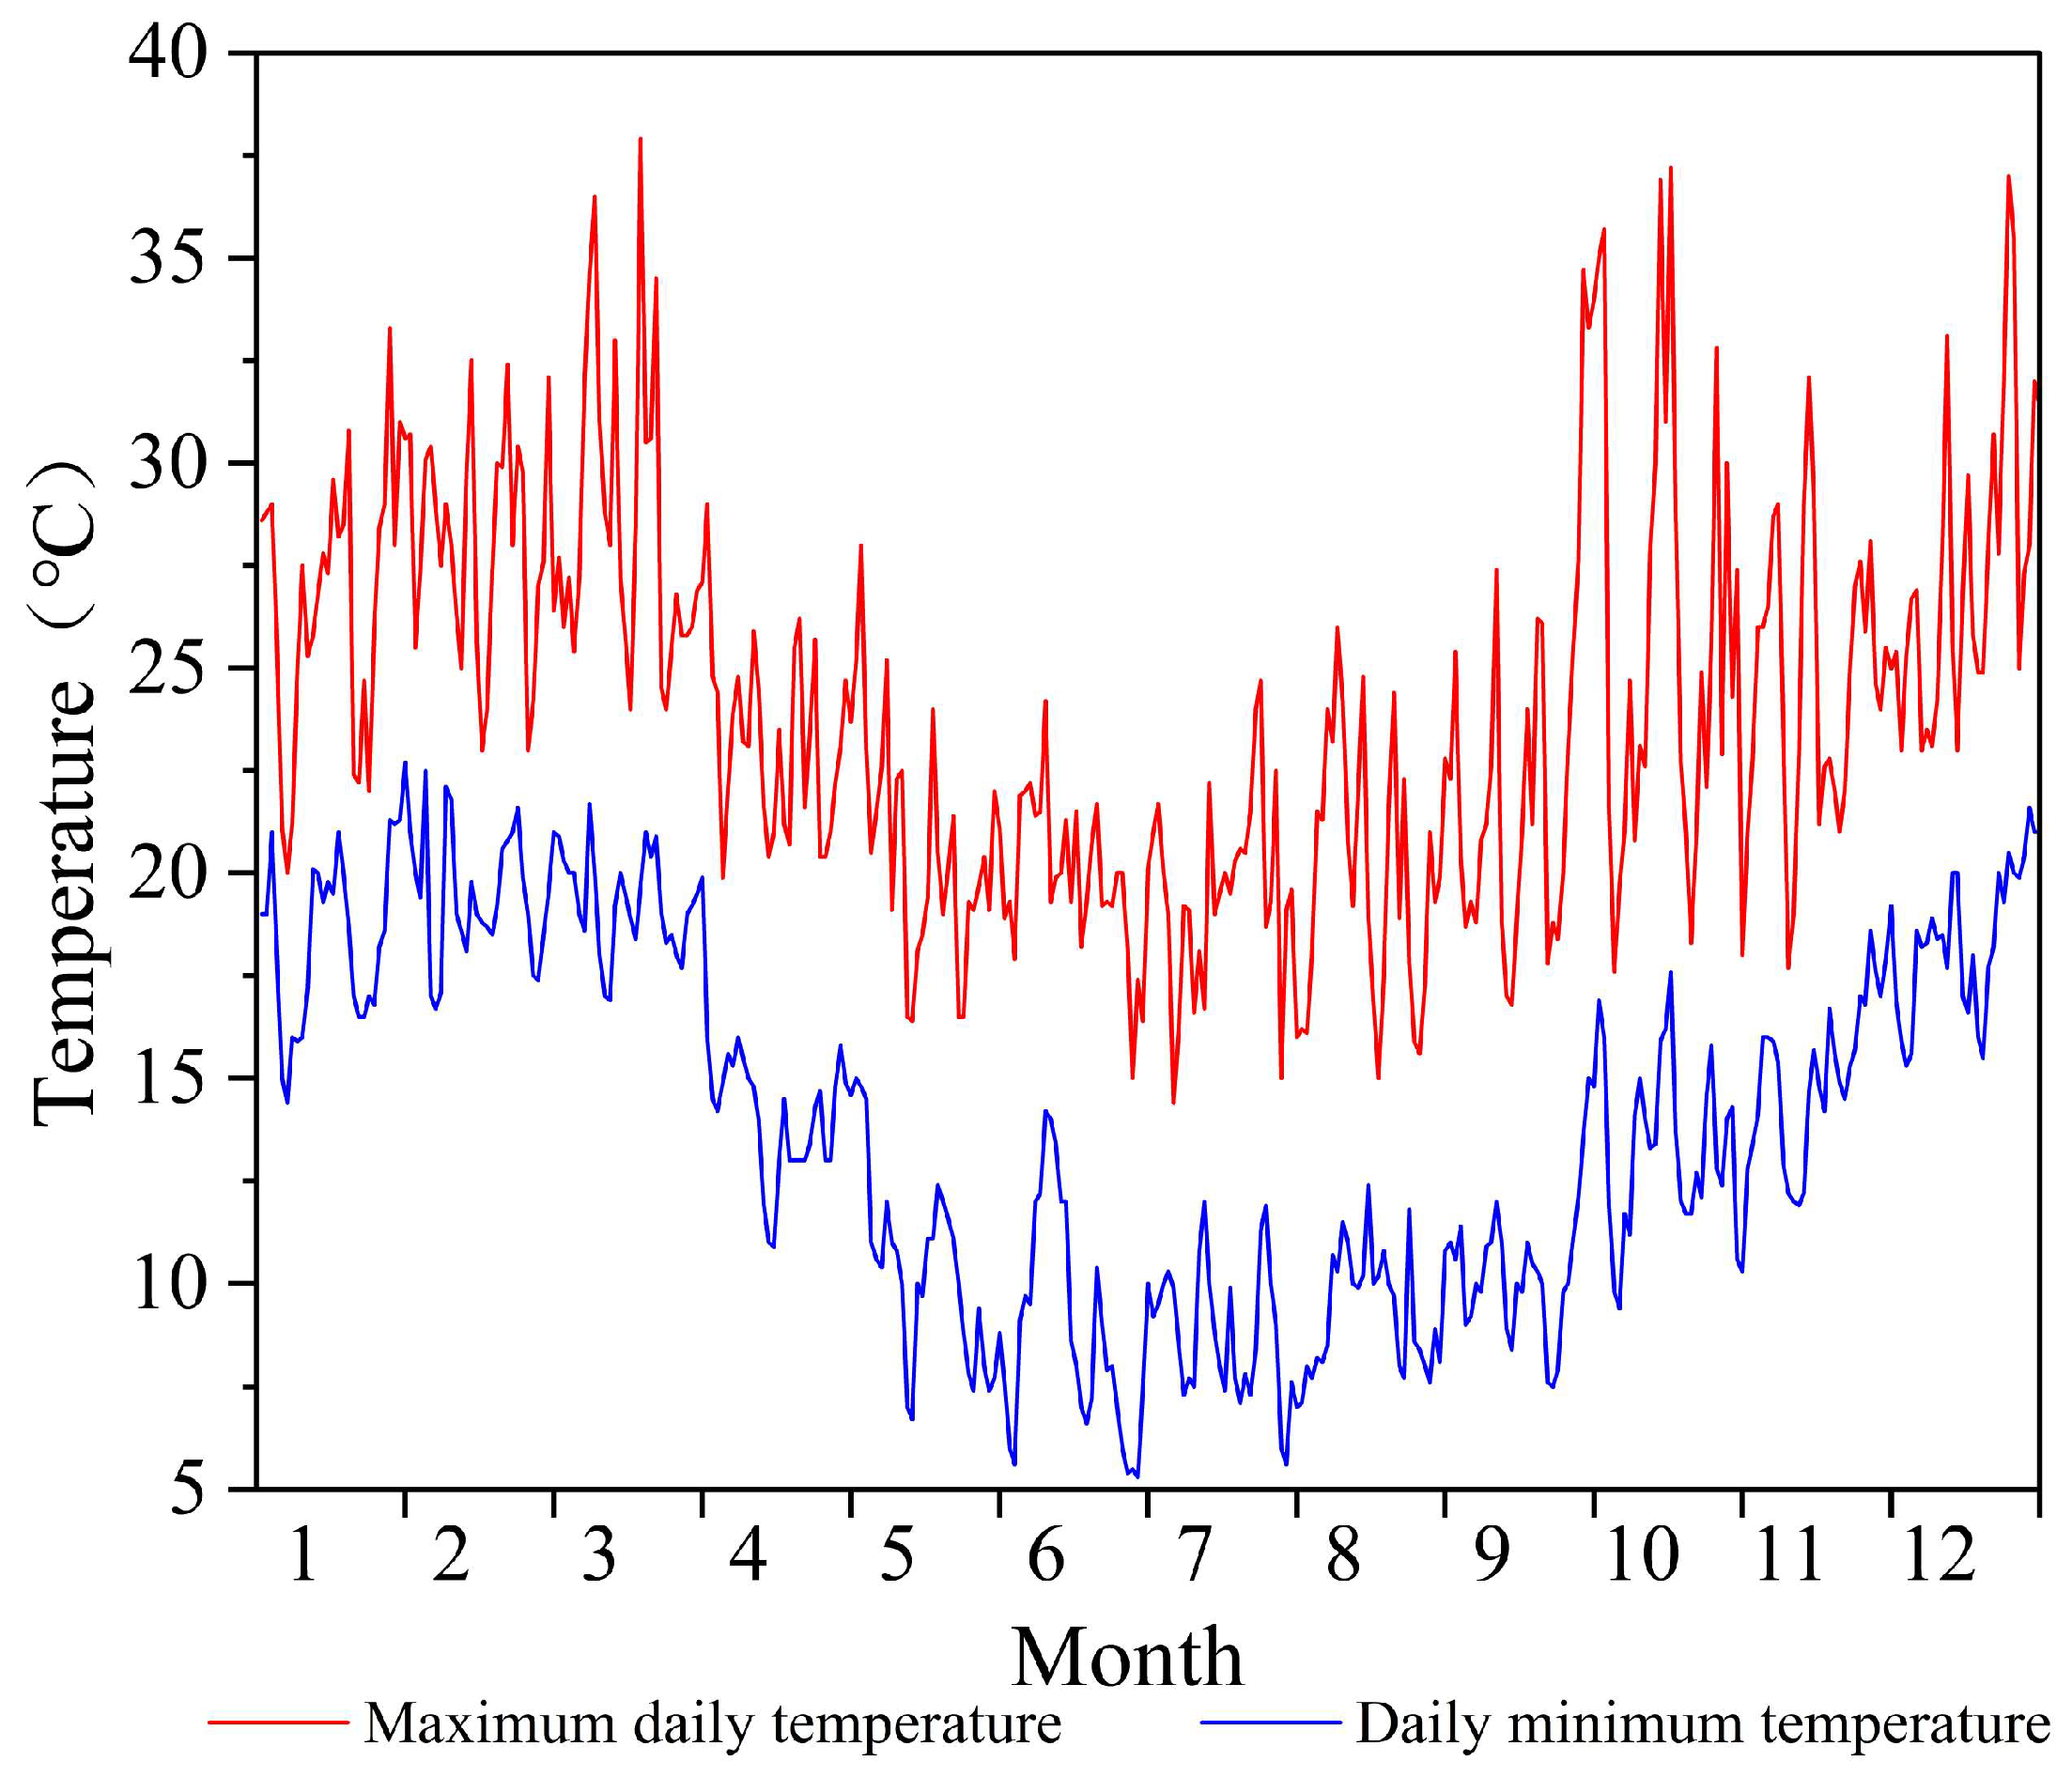
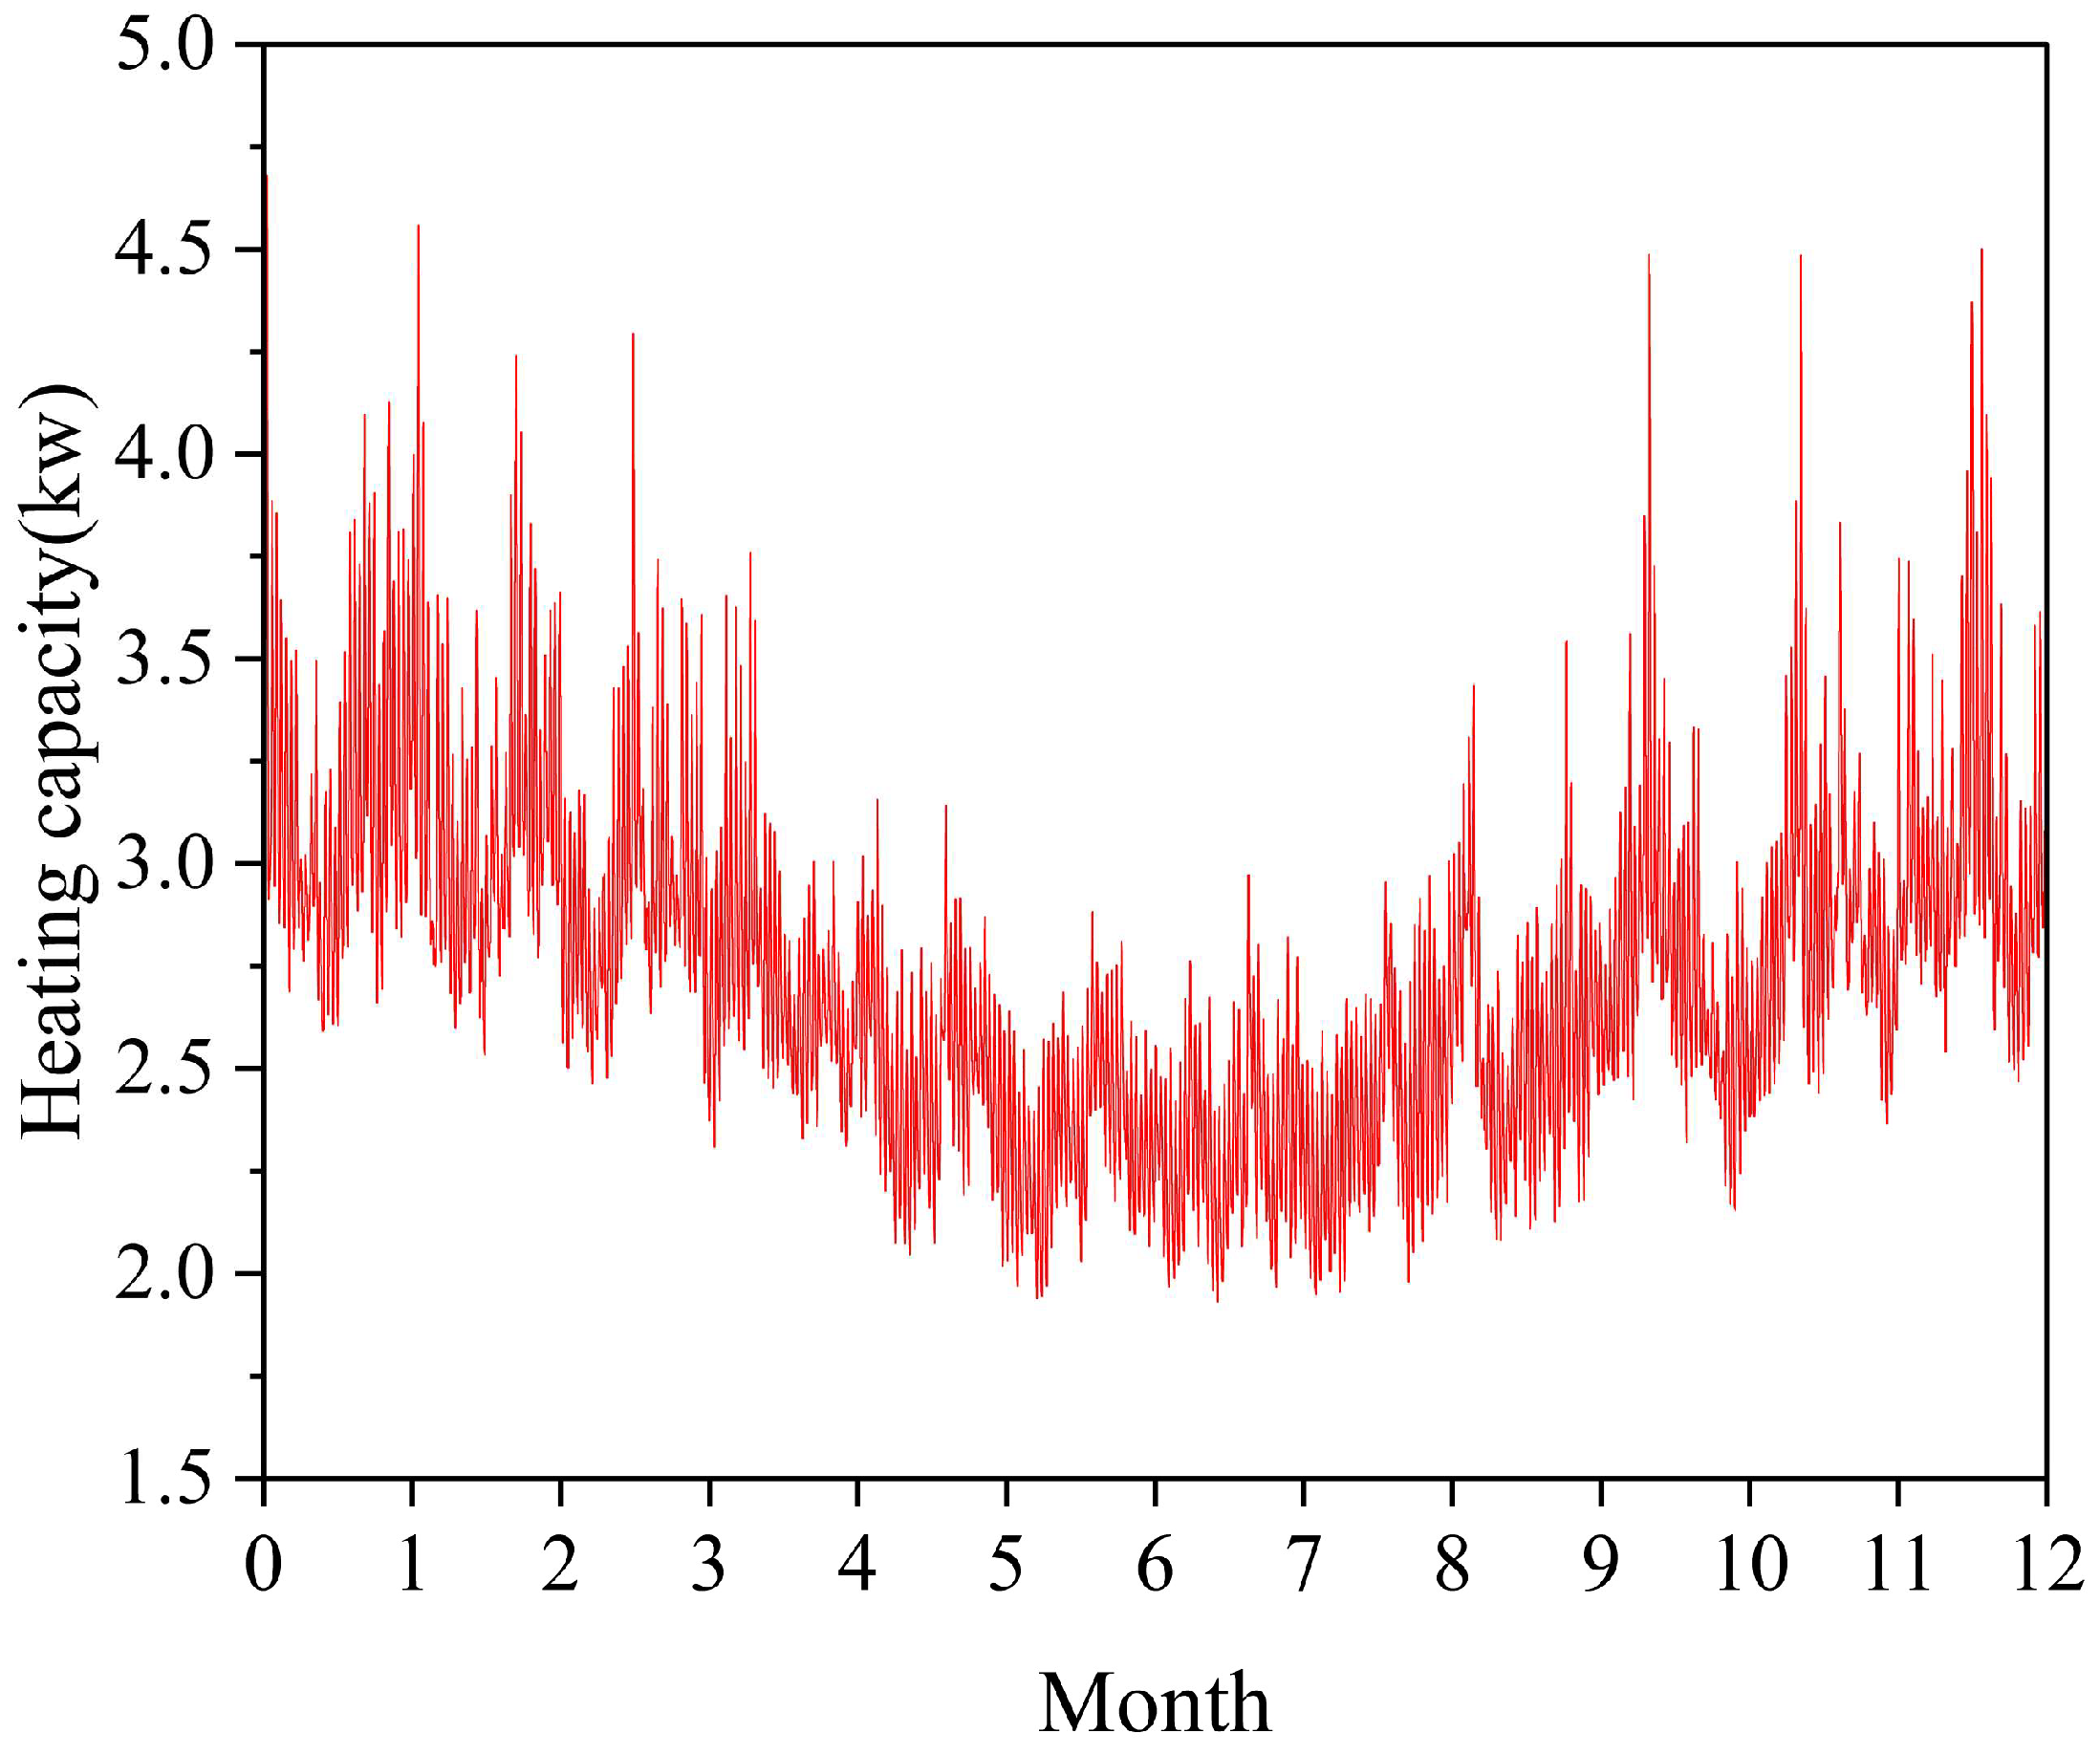
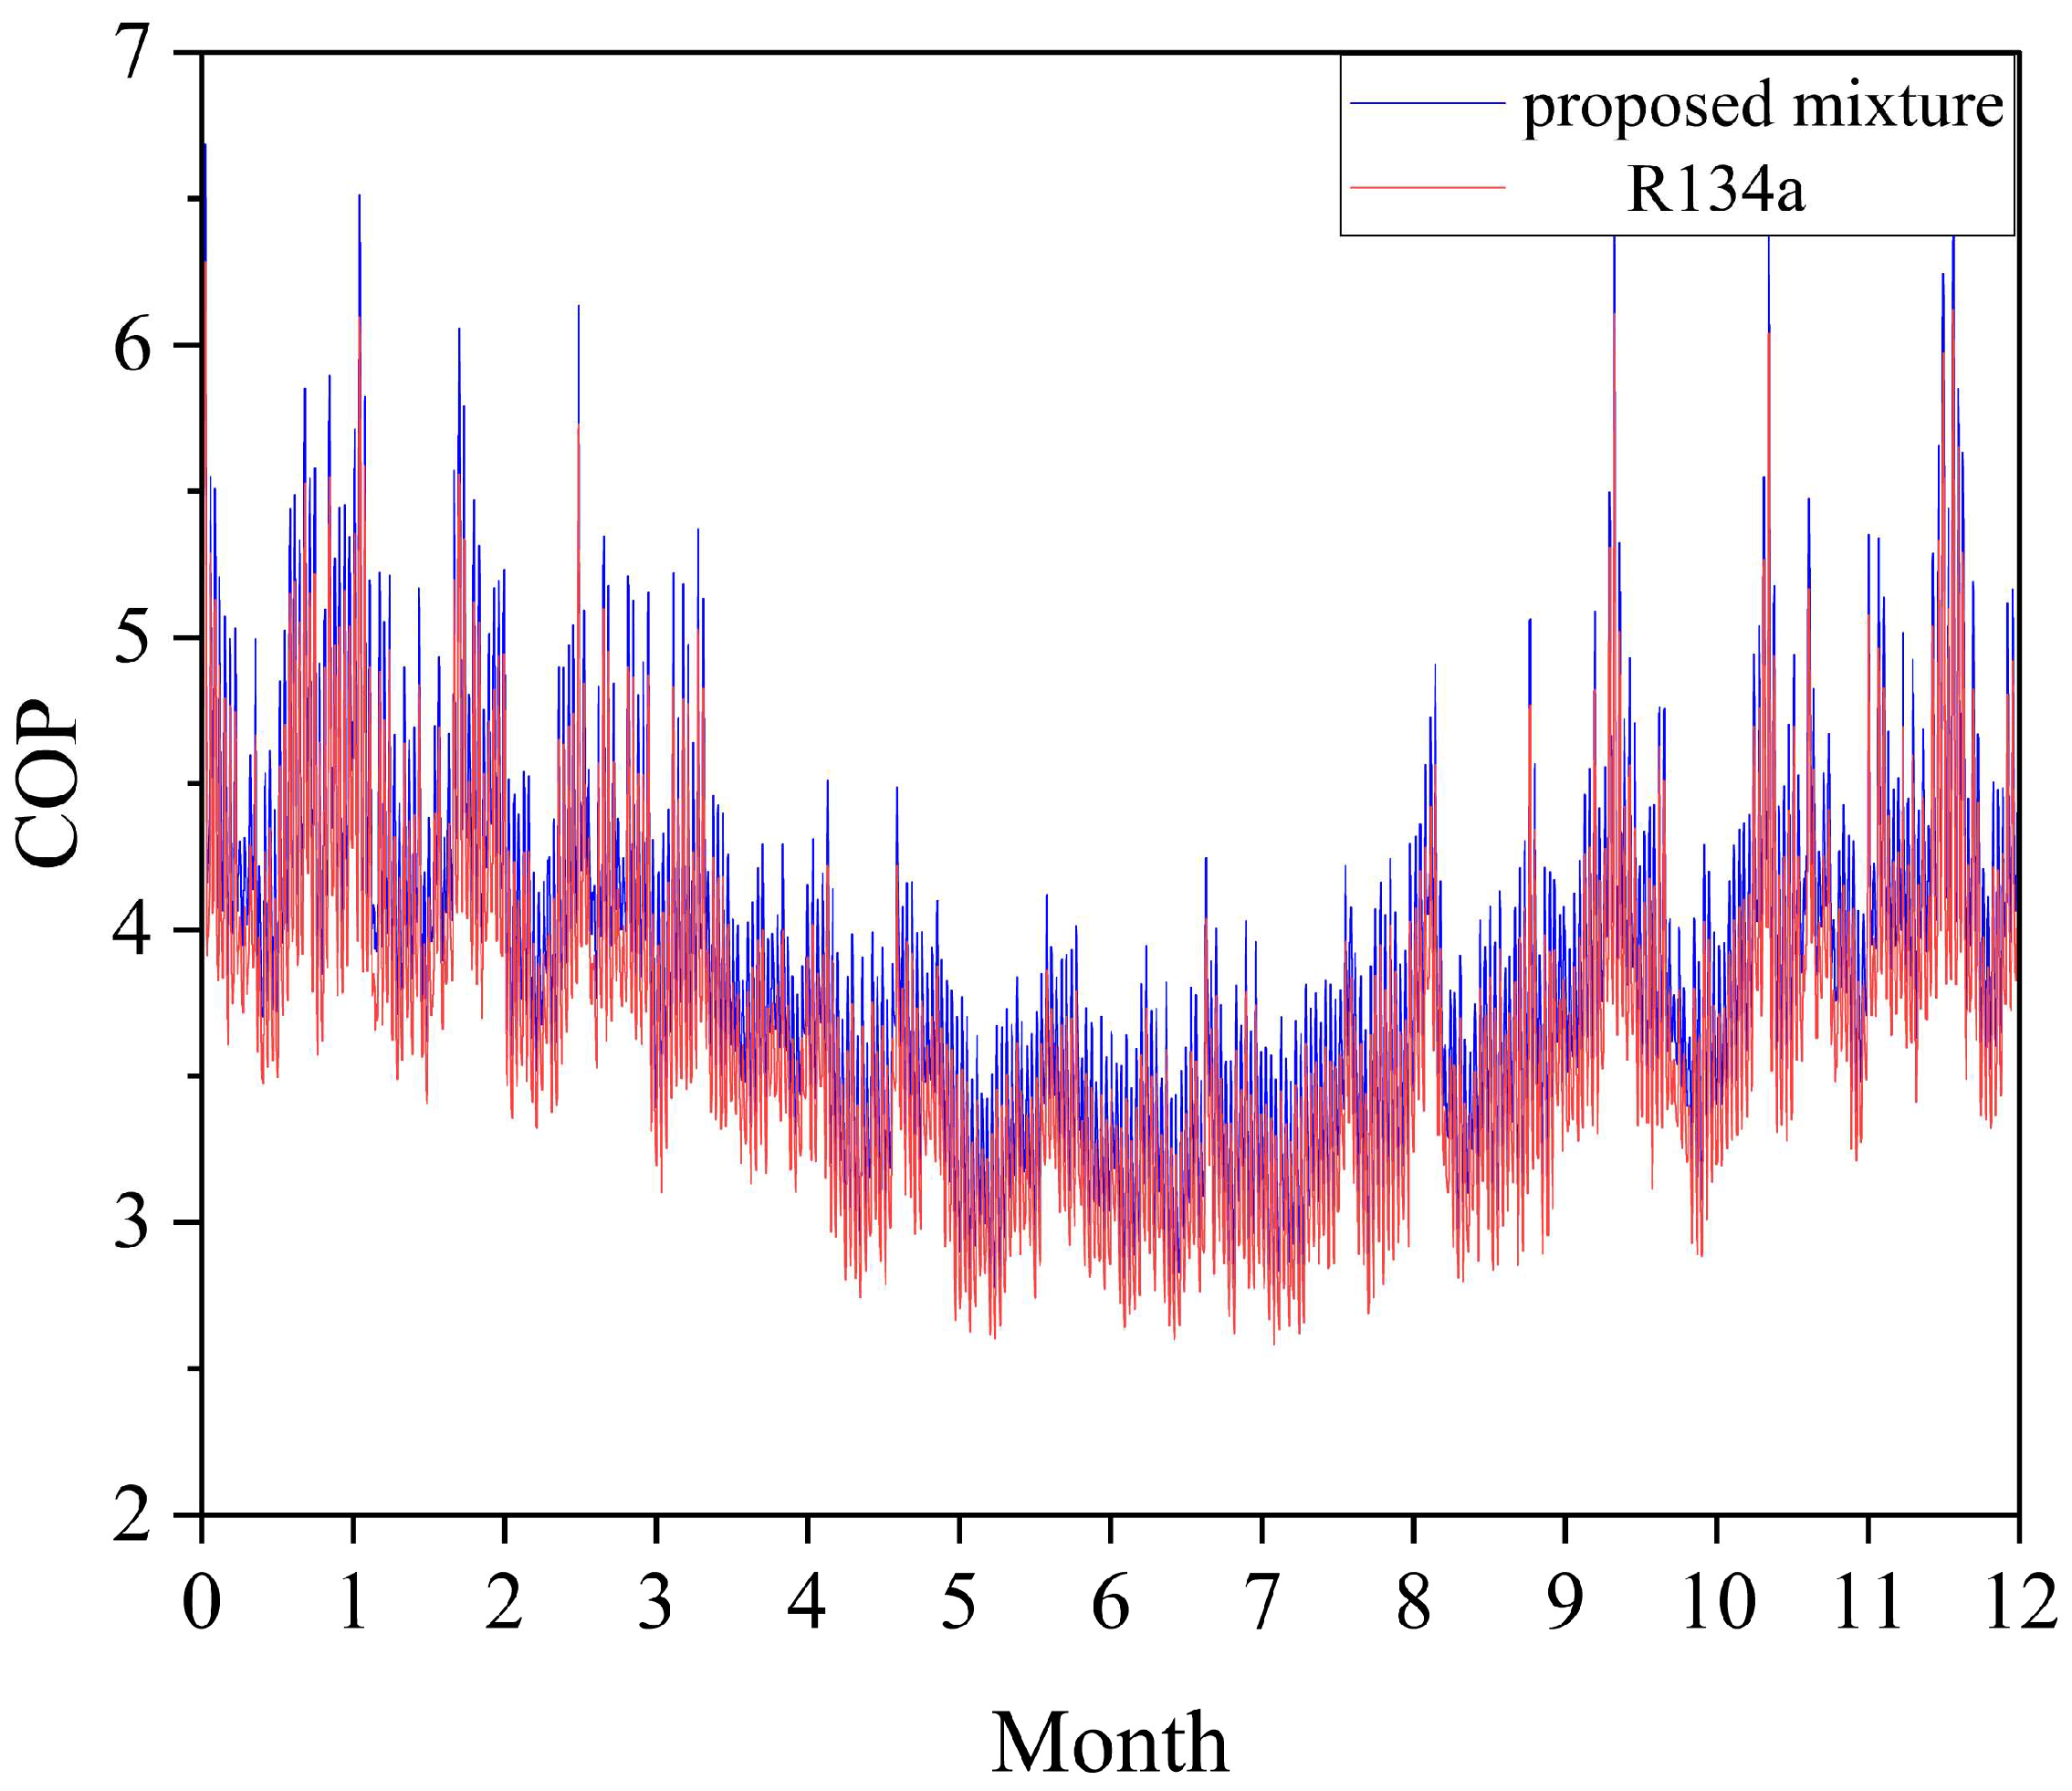
- (5)
- Based on the previous optimization conclusions, a full-year energy analysis for standard Australian weather conditions was carried out, which showed that the ASHPWH system with this refrigerant could operate up to 69.70% for one year. The minimum heating capacity is 1.9306 kW, and the maximum heating capacity can be up to 4.679 kW. The maximum COP is 6.5, and the average COP is approximately 3.894, which is a 6.3% improvement over the results using R134a.
Author Contributions
Funding
Data Availability Statement
Conflicts of Interest
Nomenclature
| Abbreviations | |
| COP | Coefficient of performance |
| ASHPWH | Air source heat pump water heater |
| COMP | Compressor |
| EVA | Evaporator |
| CON | Condenser |
| EXV | Expansion valve |
| ai | Input air |
| ao | Eliminate air |
| wi | Water inlet |
| wo | Water outlet |
| GWP | Global warming potential |
| ODP | Ozone depletion potential |
| English letters | |
| A | Area, m2 |
| Effective passage flow area of the valve, m2 | |
| Nominal orifice of the valve, m2 | |
| Discharge coefficient of the throttle valve | |
| Frequency, Hz | |
| h | Specific enthalpy, |
| m | Mass flow, kg/s |
| N | Rotational speed |
| p | Number of electrode pairs/Pressure, MPa |
| Q | Heating capacity, kW |
| T | Temperature, °C |
| V | Volume, m3 |
| Specific volume, | |
| Greek symbols | |
| Compression ratio | |
| Density, kg/m3 | |
| Volumetric efficiency | |
| Isentropic efficiency | |
| Mechanical efficiency | |
| Indicated efficiency | |
| Motor efficiency | |
| Opening degree of the valve | |
| Subscripts | |
| 1–4 | State point in Figure 1 |
| m | Average |
| i | Inner wall of condenser |
| 0 | Outer wall of condenser |
| r | Refrigerant |
| valve, in | Inlet of the valve |
| valve, out | Outlet of the valve |
| w | Water |
| wall | Wall |
References
- Bahman, A.M.; Parikhani, T.; Ziviani, D. Multi-objective optimization of a cold-climate two-stage economized heat pump for residential heating applications. J. Build. Eng. 2022, 46, 103799. [Google Scholar] [CrossRef]
- Zhang, D.; Li, J.; Liu, W.; Nan, J.; Wang, L. Evaluation and Prediction of Thermal Performance of Jet Enthalpy Air Source Heat Pump. J. Chem. Eng. 2014, 65, 5004–5009. [Google Scholar]
- Bach, C.K.; Vetsch, B.; Groll, E.A.; Horton, W.T.; Braun, J.E. Experimental investigation of vapor injected compression for cold climate heat pumps. In Proceedings of the 15th International Refrigeration and Air Conditioning Conference, West Lafayette, IN, USA, 14–17 July 2014. [Google Scholar]
- Xu, Y.; Huang, Y.; Jiang, N.; Song, M.; Xie, X.; Xu, X. Experimental and theoretical study on an air-source heat pump water heater for northern China in cold winter: Effects of environment temperature and switch of operating modes. Energy Build. 2019, 191, 164–173. [Google Scholar] [CrossRef]
- Yang, L.; Yuan, H.; Peng, J.-W.; Zhang, C.-L. Performance modeling of air cycle heat pump water heater in cold climate. Renew. Energy 2016, 87, 1067–1075. [Google Scholar] [CrossRef]
- Luo, J.; Yang, K.; Liu, Y.; Zhao, Z.; Chen, G.; Wang, Q. Experimental and theoretical assessments on the systematic performance of a single-stage air-source heat pump using ternary mixture in cold regions. Appl. Therm. Eng. 2023, 234, 121300. [Google Scholar] [CrossRef]
- Xiao, B.; Chang, H.; He, L.; Zhao, S.; Shu, S. Annual performance analysis of an air source heat pump water heater using a new eco-friendly refrigerant mixture as an alternative to R134a. Renew. Energy 2020, 147, 2013–2023. [Google Scholar] [CrossRef]
- Ma, Y.; Zhang, X.; Xu, M.; Xie, S. Hybrid model based on Preisach and support vector machine for novel dual-stack piezoelectric actuator. Mech. Syst. Signal Process. 2013, 34, 156–172. [Google Scholar] [CrossRef]
- Li, J.; Qu, C.; Li, C.; Liu, X.; Novakovic, V. Technical and economic performance analysis of large flat plate solar collector coupled air source heat pump heating system. Energy Build. 2022, 277, 112564. [Google Scholar] [CrossRef]
- Li, J.; Wei, S.; Dong, Y.; Liu, X.; Novakovic, V. Technical and economic performance study on winter heating system of air source heat pump assisted solar evacuated tube water heater. Appl. Therm. Eng. 2023, 221, 119851. [Google Scholar] [CrossRef]
- AS/NZS 4234:2021; Heated Water Systems—Calculation of Energy Consumption. Standards Australia: Sydney, Australia, 2021.
- Li, Y.; Yu, J. Theoretical analysis on optimal configurations of heat exchanger and compressor in a two-stage compression air source heat pump system. Appl. Therm. Eng. 2016, 96, 682–689. [Google Scholar] [CrossRef]
- Bertsch, S.S.; Groll, E.A. Two-stage air-source heat pump for residential heating and cooling applications in northern US climates. Int. J. Refrig. 2008, 31, 1282–1292. [Google Scholar] [CrossRef]
- Brunin, O.; Feidt, M.; Hivet, B. Comparison of the working domains of some compression heat pumps and a compression-absorption heat pump. Int. J. Refrig. 1997, 20, 308–318. [Google Scholar] [CrossRef]
- Xu, G.; Zhang, X.; Deng, S. A simulation study on the operating performance of a solar–air source heat pump water heater. Appl. Therm. Eng. 2006, 26, 1257–1265. [Google Scholar] [CrossRef]
- Sleicher, C.; Rouse, M. A convenient correlation for heat transfer to constant and variable property fluids in turbulent pipe flow. Int. J. Heat Mass Transf. 1975, 18, 677–683. [Google Scholar] [CrossRef]


| Ambient Dry Bulb Temperature | Ambient Wet Bulb Temperature | Ambient Relative Humidity | Inlet Water Temperature |
|---|---|---|---|
| 20 °C | 15 °C | 60.95% | 20 °C |
| Ambient Temperature | Temperature of the Water to Be Heated | Evaporation Temperature | Condensing Temperature |
|---|---|---|---|
| 0 °C | 20 °C | −10 °C | 50 °C |
| R290 | R600a | R134a | |
|---|---|---|---|
| Molecular formula | CH3CH2CH3 | CH3CH(CH3)CH3 | CH2FCF3 |
| Relative molecular mass | 44.10 | 58.12 | 102.03 |
| Standard boiling point (°C) | −42.1 | −11.6 | −26.5 |
| Critical pressure (MPa) | 4.25 | 3.63 | 4.06 |
| Critical temperature (°C) | 96.7 | 134.7 | 101.1 |
Disclaimer/Publisher’s Note: The statements, opinions and data contained in all publications are solely those of the individual author(s) and contributor(s) and not of MDPI and/or the editor(s). MDPI and/or the editor(s) disclaim responsibility for any injury to people or property resulting from any ideas, methods, instructions or products referred to in the content. |
© 2025 by the authors. Licensee MDPI, Basel, Switzerland. This article is an open access article distributed under the terms and conditions of the Creative Commons Attribution (CC BY) license (https://creativecommons.org/licenses/by/4.0/).
Share and Cite
Xu, J.; Liu, C.; Liu, X.; Sun, X.; Li, Y. Simulation and Optimization Study on an Energy Efficiency Improvement Strategy of an Air Source Heat Pump Under Australian Standards. Energies 2025, 18, 1392. https://doi.org/10.3390/en18061392
Xu J, Liu C, Liu X, Sun X, Li Y. Simulation and Optimization Study on an Energy Efficiency Improvement Strategy of an Air Source Heat Pump Under Australian Standards. Energies. 2025; 18(6):1392. https://doi.org/10.3390/en18061392
Chicago/Turabian StyleXu, Jiangtao, Cheng Liu, Xiaojun Liu, Xiaoxiao Sun, and Yongjian Li. 2025. "Simulation and Optimization Study on an Energy Efficiency Improvement Strategy of an Air Source Heat Pump Under Australian Standards" Energies 18, no. 6: 1392. https://doi.org/10.3390/en18061392
APA StyleXu, J., Liu, C., Liu, X., Sun, X., & Li, Y. (2025). Simulation and Optimization Study on an Energy Efficiency Improvement Strategy of an Air Source Heat Pump Under Australian Standards. Energies, 18(6), 1392. https://doi.org/10.3390/en18061392