1. Introduction
Net zero refers to balancing greenhouse gas (GHG) emissions and removals, with the objective being to ensure that the amount of GHGs emitted into the atmosphere is offset by an equivalent amount removed, thereby achieving net emissions of zero. Globally, governments are actively leading initiatives to achieve net-zero emissions. As of 23 April 2021, the European Union and 44 other countries have committed to achieving net-zero emissions targets, covering approximately 70% of global CO
2 emissions [
1]. Among these, ten countries have enshrined their net-zero targets into law, eight are legalizing their commitments, and the remaining have formalized their pledges in official policy documents. Several countries have implemented policies focusing on expanding renewable energy sources (RESs) as a key strategy to achieve these goals. For example, the United Kingdom has actively pursued the development of RESs as part of its legally binding Net Zero Carbon Strategy 2024, which aims to achieve net-zero GHG emissions by 2050 [
2].
However, given the inherently unpredictable nature of RESs, challenges to grid stability and market operations are inevitable. Additionally, the uncertainty of electricity demand further complicates market dynamics, as fluctuations in consumption patterns create imbalances between supply and demand. In order to address these challenges, virtual power plants (VPPs) have emerged as an innovative solution that aggregates distributed energy resources (DERs) to enhance energy generation efficiency and facilitate participation in power markets [
3,
4].
A VPP is defined as an aggregation of various types of distributed resources that may be geographically dispersed across different points in a distribution network [
5]. While individual RES units exhibit variability in their outputs, the aggregation of multiple DERs within a VPP enables greater reliability and predictability in energy generation [
6].
Recent research highlights the growing importance of VPP operations in electricity markets, particularly in optimizing energy storage systems (ESSs) and power curtailment. Effective ESS management—including charging, discharging while accounting for EV demand, and mitigating battery degradation—is crucial for enhancing market efficiency and maximizing economic returns [
7,
8]. Additionally, given the unique characteristics of RESs, generation control is often one-sided, relying primarily on power curtailment strategies to manage excess generation and maintain grid stability [
9,
10].
The global VPP market will surpass USD 4.7 billion by 2027, expanding at a robust compound annual growth rate of 34% between 2021 and 2027 [
11]. This rapid market growth indicates the pivot function of VPPs and bidding strategies in influencing market operations. As VPPs continue to expand, the emergence of more complex bidding strategies necessitates a more sophisticated analysis of VPP bidding behaviors to ensure the stability of electricity markets [
12].
Electricity markets operate under two primary auction mechanisms: pay-as-bid (PAB) and pay-as-clear (PAC) [
13]. In the PAB mechanism, each successful bid is compensated at the price submitted by the bidder. In contrast, in the PAC mechanism—also known as uniform-price auctions—all successful bids are compensated at the uniform market-clearing price, irrespective of the bid prices. These auction mechanisms significantly influence the bidding strategies of VPPs, particularly in managing financial risks associated with market volatility and imbalance penalties.
Imbalance penalties are a cost structure that manages discrepancies between actual generation and bid quantities. Given the variability and forecasting uncertainties of renewable energy output, penalties are particularly relevant. A well-designed imbalance penalty structure is essential for maintaining market stability and encouraging accurate bidding behavior [
14].
This study investigates VPP bidding strategies under PAC and PAB markets with different imbalance penalty frameworks and evaluates their effects on market operations. The primary contributions of this study are as follows:
A detailed comparative analysis of PAC and PAB mechanisms and their associated asymmetric and symmetric imbalance penalty structures has been conducted to evaluate their effects on VPP bidding behavior, revenue, and power utilization. This provides valuable insights into market dynamics.
A three-stage stochastic programming model is developed and implemented to address the complexities of stochastic market operations and the bidding process. The problem is reformulated through linearization as a linear programming (LP) problem, enabling the efficient evaluation of imbalance penalties and optimizing VPP bidding strategies.
The results highlight trade-offs between PAC and PAB mechanisms, demonstrating PAC’s higher revenue potential and PAB’s advantages in supporting stable market operations by discouraging over/underbidding and mitigating revenue volatility.
A discussion is presented on whether the PAC or PAB market is better suited for markets with high DER penetration. It further examines how PAB markets, particularly during high- or moderate-generation periods, exhibit minor revenue differences from PAC markets while incurring lower imbalance penalty costs and supporting higher power generation levels.
The remainder of this paper is structured as follows:
Section 2 reviews the theoretical background and related research.
Section 3 presents the modeling framework for imbalance penalties and the stochastic optimization of VPP bidding strategies.
Section 4 discusses the case study and simulation results.
Section 5 provides an in-depth discussion of PAC and PAB market evaluations focusing on market operations, and
Section 6 concludes the study.
2. Theoretical Background and Literature Review
2.1. Pay-as-Clear vs. Pay-as-Bid
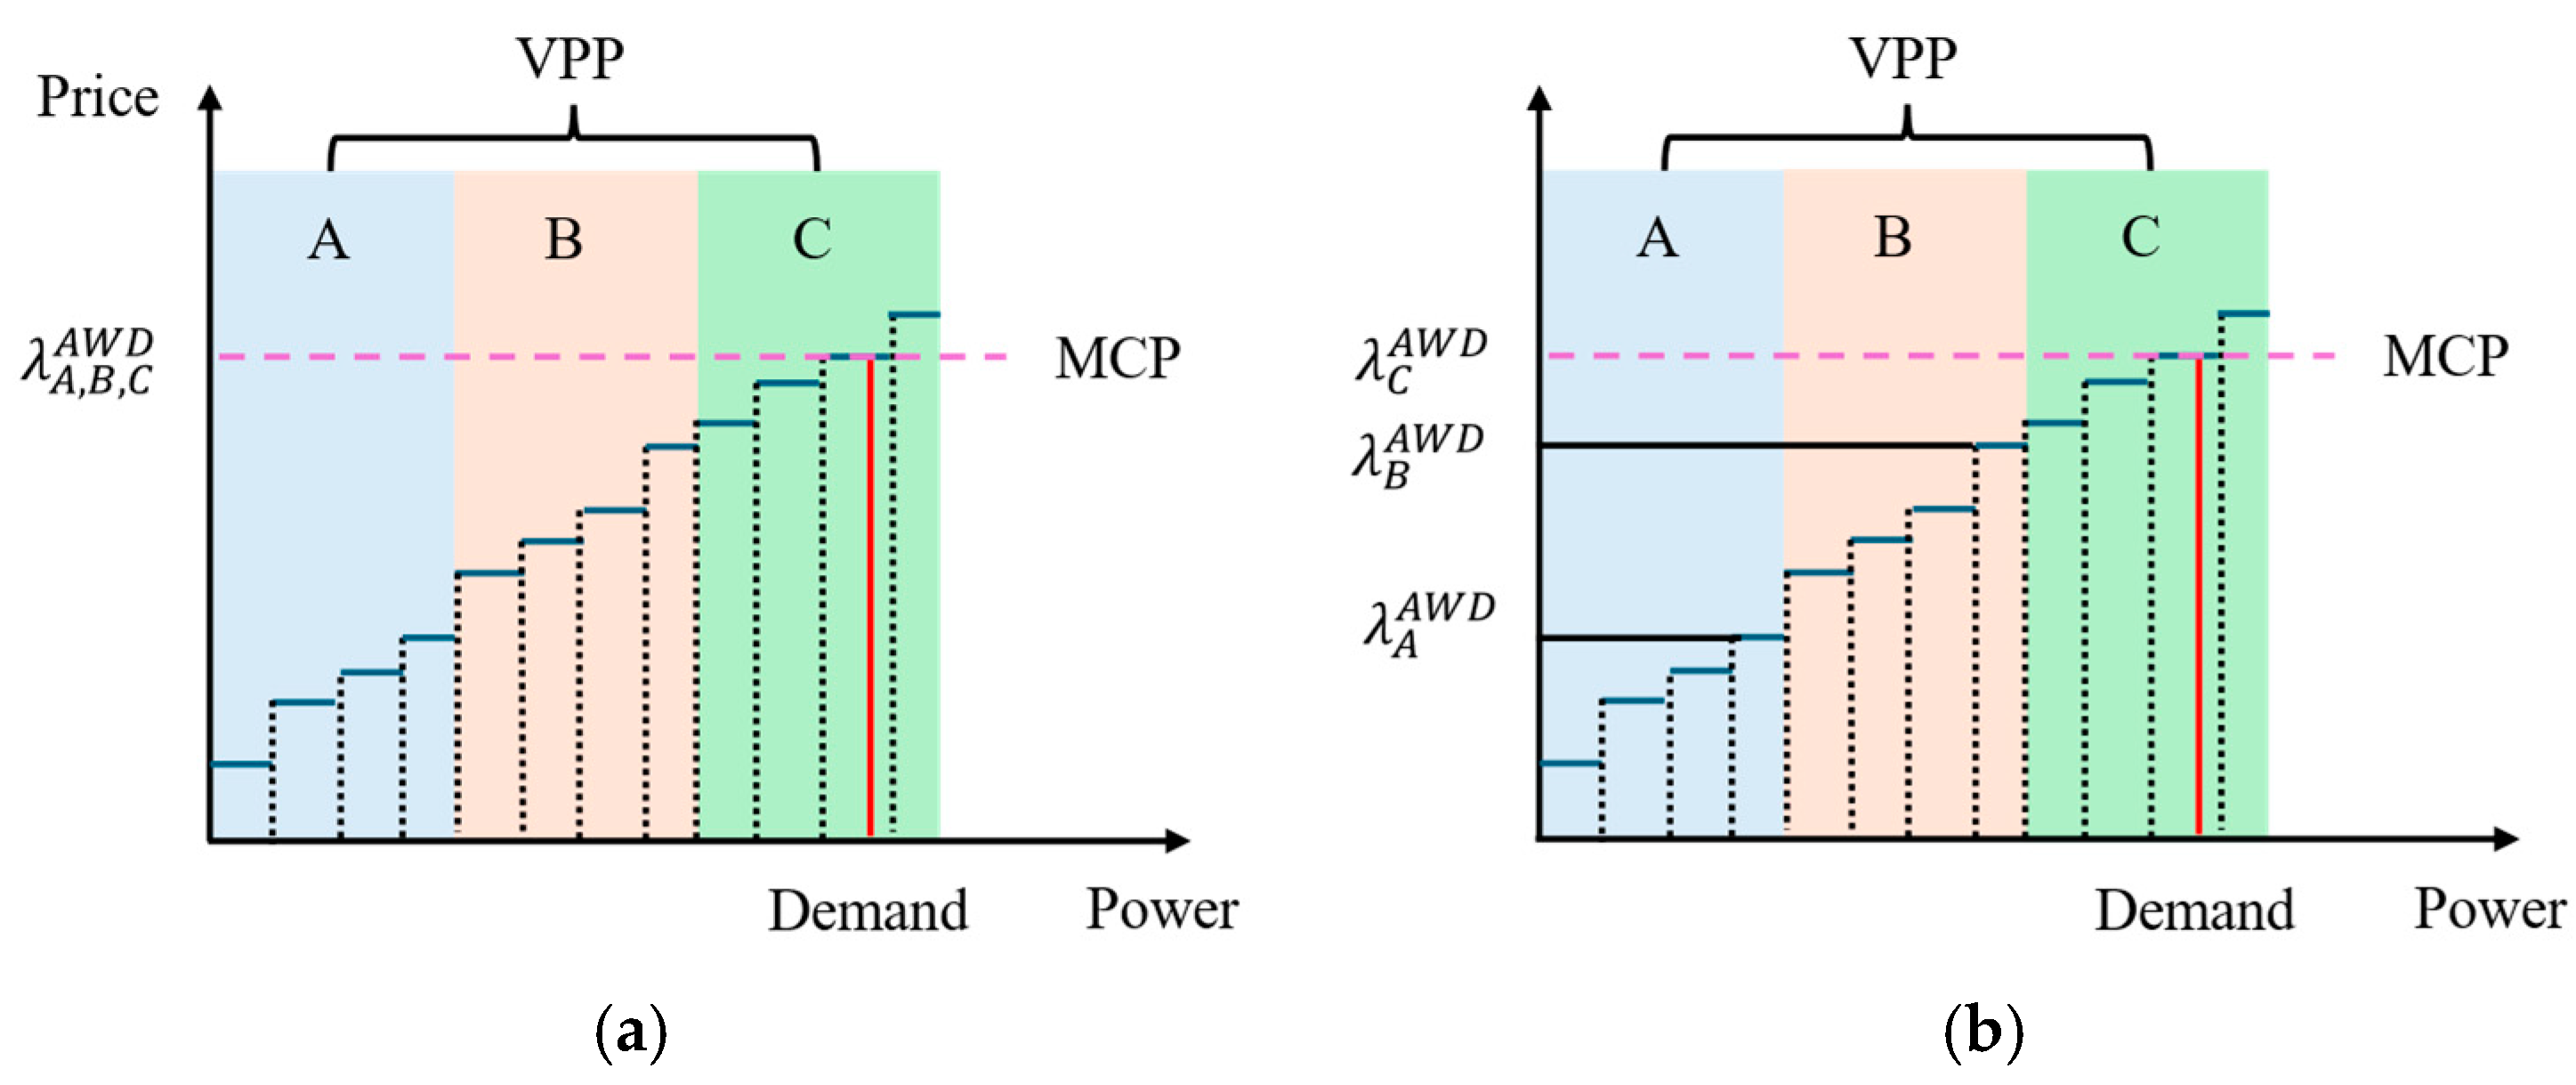
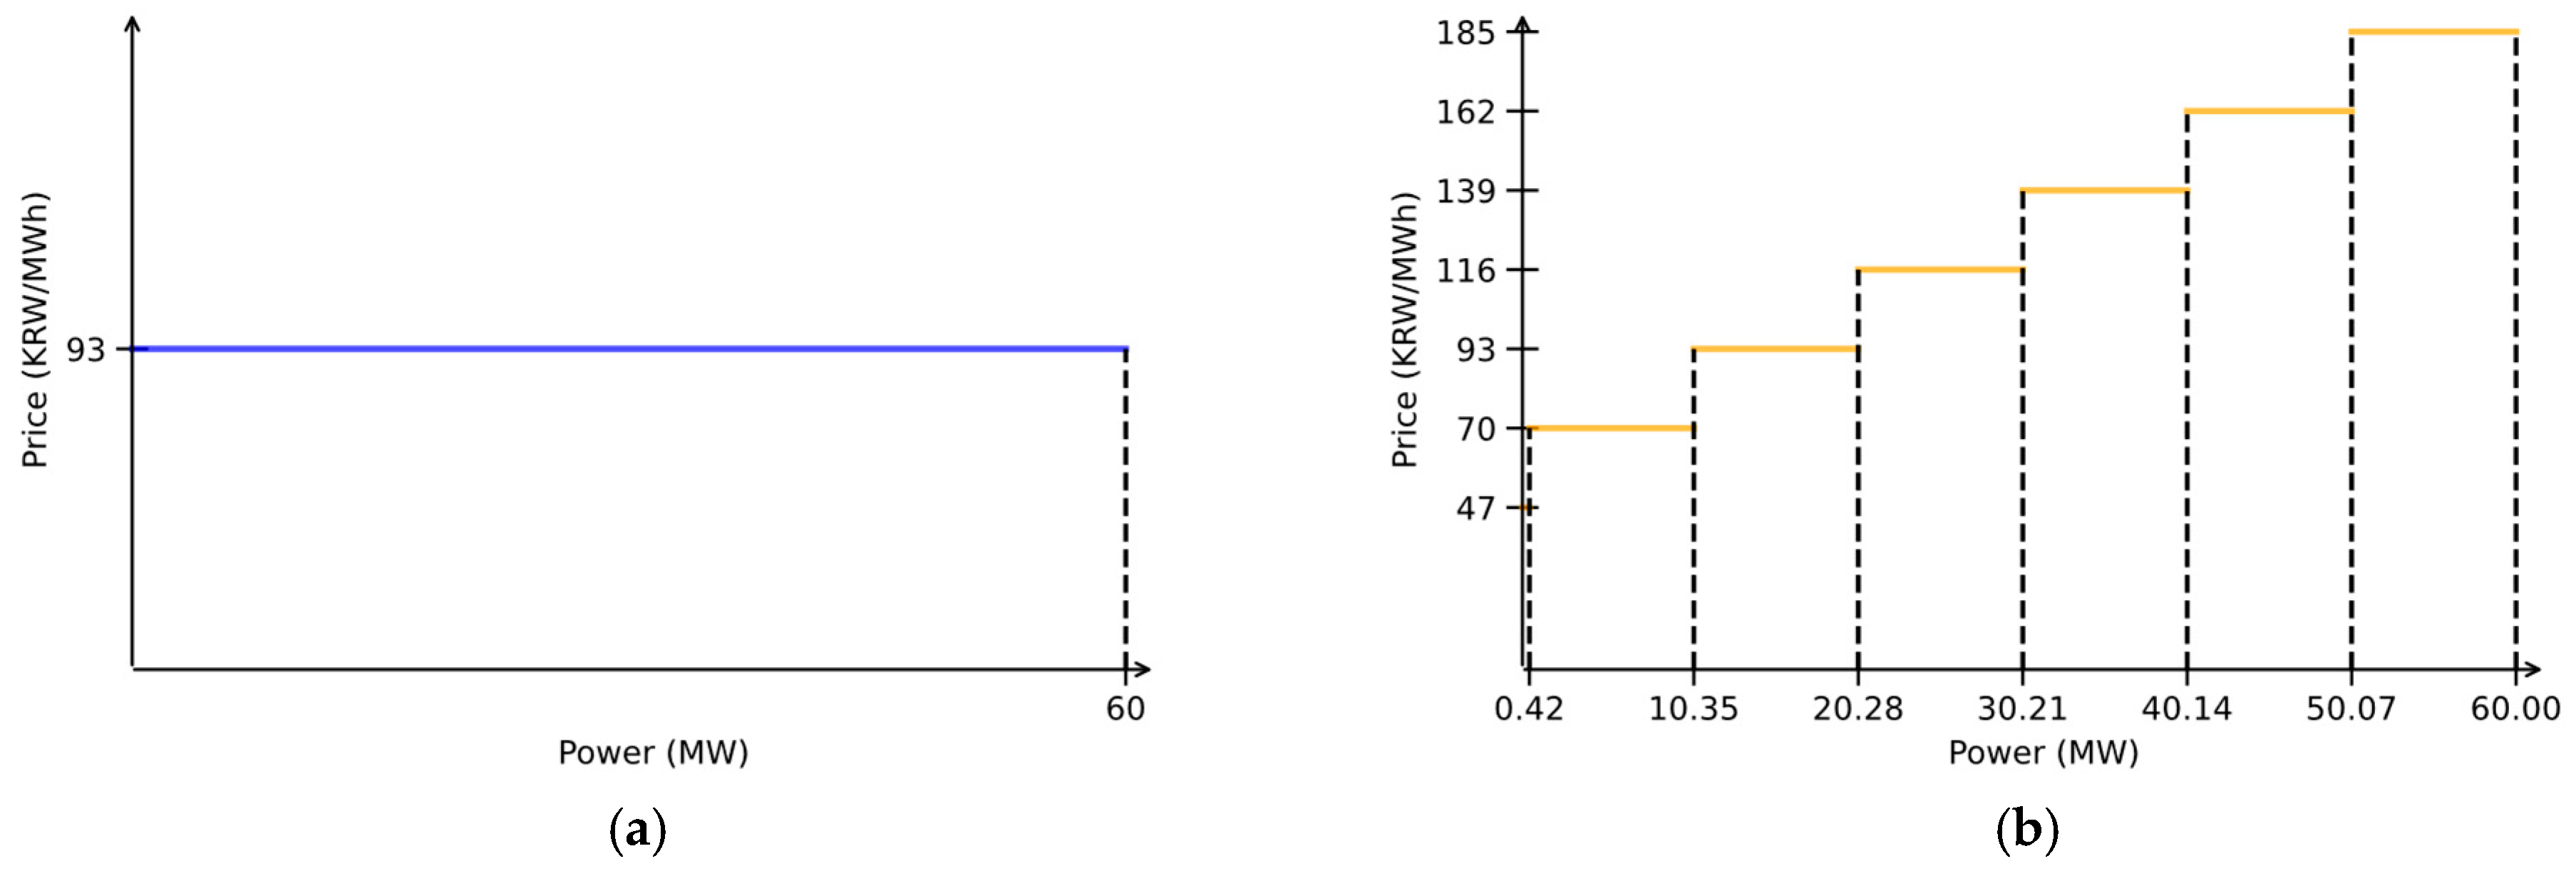
Figure 1 provides a comparative analysis of PAC and PAB auction mechanisms, illustrating their bid stacking and price formation processes. The market clearing price (MCP) is determined by the total power demand and the bidding behavior of VPPs.
In a PAC auction, all successful bidders receive the MCP, which is set by the highest accepted bid that meets market demand. The auction process begins with generators submitting bids specifying their desired price and corresponding power quantity. The market operator ranks these bids in ascending order and accepts them sequentially until the total demand is met. The price of the marginal bid, i.e., the last accepted bid, determines the MCP. Under this mechanism, all accepted bidders receive a uniform MCP, regardless of their individual bid prices. As illustrated in
Figure 1a, VPPs A, B, and C are awarded the same price, which is the MCP.
In contrast, a PAB auction compensates each successful bidder based on their individual bid price rather than a uniform MCP. Similar to the PAC process, bids are ranked in ascending order and accepted until the market demand is fulfilled. However, instead of receiving the MCP, each accepted bidder is paid the exact price they submitted. This results in a variation in the awarded prices among VPPs, as depicted in
Figure 1b. Unlike the PAC mechanism, where all successful bidders receive the same clearing price, the PAB mechanism leads to heterogeneous price allocations among VPPs A, B, and C, based on their respective bids.
The choice between PAC and PAB auction mechanisms is an ongoing topic of discussion in electricity markets, given their differing impacts on market dynamics. Previous studies have extensively examined the impacts of these auction mechanisms on electricity markets, with several studies highlighting that the PAC mechanism’s transparent pricing structure effectively mitigates the incentive for suppliers to inflate their bids. Ahlqvist et al. [
15] advocated for the PAC mechanism over PAB, highlighting PAC’s transparent pricing structure, which fosters market efficiency by aligning the final price with market conditions rather than individual bidding strategies. Guerci et al. [
16] argued that PAB markets often result in higher prices due to strategic bidding, where suppliers aim to estimate and bid close to the expected market-clearing price to maximize profits. Crampton et al. [
17] emphasized that PAC mechanisms promote efficient market outcomes by delivering essential price signals for short-term operational decisions and long-term investment planning. They caution that transitioning to PAB could introduce inefficiencies and elevate consumer costs due to distorted bidding behaviors.
On the other hand, many studies suggest that the PAB mechanism is better suited for markets with a high penetration of DERs. This preference arises primarily from its ability to address three critical challenges: mitigating market price volatility, minimizing manipulation risk, and reducing support costs. Zhao et al. [
18] emphasize that while PAC consistently settles at the market-clearing price, renewable energy sources with near-zero marginal costs can lead to excessive price volatility and unsustainably low market prices under PAC. This volatility increases real-time balancing costs and creates revenue instability for suppliers, often incentivizing strategic behaviors like underbidding quantities to inflate prices in 100%-renewable electricity markets.
Furthermore, Banaei et al. [
19] analyzed the strategic behaviors of suppliers and consumers in markets with large-scale wind power integration using a game-theoretic supply function equilibrium model. The study concludes that PAB is more effective in curbing market power by discouraging suppliers from manipulating bid prices to inflate market prices artificially. Fabra et al. [
20] suggest that PAB mechanisms foster a highly competitive environment that mitigates manipulation risks by requiring participants to compete at market margins. Although PAC may lower the entry barrier for smaller suppliers due to its more straightforward information requirements, PAB effectively reduces the potential for collusion and strategic supply withholding. Anatolitis et al. [
21], using an agent-based modeling approach on German onshore wind auctions, show that PAB achieves significantly lower support costs for DERs, such as feed-in tariffs and premiums, compared to PAC. This reduction translates to decreased total support payments for consumers and heightened economic efficiency, further underscoring the practical advantages of PAB in renewable energy-integrated markets.
Extensive research [
15,
16,
17,
18,
19,
20,
21] has investigated the strengths and weaknesses of PAC and PAB auction mechanisms, particularly in electricity markets with high DER penetration [
18,
19,
20,
21]. However, several critical limitations persist. Notably, the role of imbalance penalty structures in shaping VPP bidding behavior under these mechanisms has not been comprehensively examined. Given that imbalance penalties significantly influence market dynamics, a deeper understanding of their interaction with auction mechanisms is essential for accurately assessing market efficiency.
Furthermore, previous studies have largely neglected segment-based bidding strategies, such as stepwise bidding, which provide a more realistic representation of market participation. Another underexplored aspect is the volatility of awarded bid prices across different auction schemes despite its fundamental impact on market stability and profitability. To bridge these research gaps, this study systematically evaluates diverse imbalance penalty frameworks and assesses their implications for PAC and PAB mechanisms in evolving electricity markets characterized by high renewable penetration and complex bidding behaviors.
2.2. Imbalance Penalties and Market Behavior
Electricity markets use auction mechanisms, where power producers submit bids by selecting their desired price and generation quantity. Once bids are accepted, producers are obligated to generate the awarded amount of electricity. However, RESs, such as wind and solar, inherently suffer from generation uncertainty due to their dependency on variable weather conditions. This intermittency makes it nearly impossible for producers to perfectly match their actual generation with the bid quantity in the market. As a result, deviations between the bid quantity (or committed generation) and the actual output are unavoidable.
Therefore, electricity markets have adopted imbalance penalty settlements to mitigate the risks posed by these deviations and ensure stable market operations [
22,
23]. These penalties are financial disincentives for discrepancies between scheduled and actual generation or consumption, encouraging market participants to improve forecasting accuracy and engage in responsible market behavior [
24,
25]. Consequently, designing an effective and market-specific imbalance penalty structure is essential for maintaining market stability and operational efficiency [
26,
27,
28].
Imbalance penalties, based on the direction of deviation, can be categorized into three types:
Upward imbalance: penalties apply only when actual generation exceeds the bid quantity.
Downward imbalance: penalties apply only when actual generation falls short of the bid quantity.
Bi-directional imbalance: penalties apply to both upward and downward imbalances.
The design of imbalance penalties directly influences the strategic bidding behavior of VPPs. Markets that employ asymmetrical penalties—where upward or downward deviations are penalized more heavily—tend to incentivize risk-averse or aggressive bidding strategies [
29,
30,
31]. For example, if a market imposes higher penalties on upward imbalances, VPPs might overbid their generation capacity to avoid excess production penalties, potentially leading to supply shortages. Conversely, heavier downward penalties might drive producers to underbid, risking overgeneration and system inefficiencies.
In contrast, markets with bi-directional penalties encourage VPPs to adopt more balanced bidding strategies [
32]. While this approach reduces the likelihood of extreme deviations and improves market stability, it may also reduce VPP revenues and lower renewable energy utilization. This trade-off is particularly evident in markets with high renewable energy penetration, where the inherent volatility of generation outputs necessitates strategic and adaptive bidding.
Given the financial implications of imbalance penalties, ongoing research focuses on improving penalty management strategies. Lei et al. [
33] proposed a pseudo-local reserve market between the distribution system operator (DSO) and electric vehicles (EVs), incorporating a bi-directional imbalance structure that allows the DSO to leverage EV flexibility within the broader electricity market framework. This mechanism consists of two stages: day-ahead market integration, where the EV reserve capacity is incorporated into the bidding process for improved forecasting, and real-time market adjustment, where dynamic modifications ensure the efficient dispatch of EVs. By integrating EV flexibility into market operations, this method enhances DSO decision making, minimizes deviation-related costs, and stabilizes market operations while compensating for imbalances in conventional loads. Similarly, Yang et al. [
34] introduce a two-stage optimization model that determines the optimal energy storage utilization strategy, effectively minimizing imbalance penalties by integrating shared energy storage systems. A deviation penalty mechanism is introduced, incorporating upward and downward imbalances, where the cost of storage services is distributed among participating wind farms based on their respective reductions in penalty expenses. Such strategies demonstrate the potential for advanced penalty management frameworks to enhance market efficiency, optimize resource allocation, and support a more stable and sustainable electricity market.
2.3. Comparison of Auction Mechanisms and Penalty Structures
Electricity markets in each country adopt varying combinations of auction mechanisms and imbalance penalty structures to suit regional operational requirements.
Table 1 outlines the different mechanisms used across global markets. Most wholesale electricity markets, including those in Europe, China, and the United States, primarily utilize the PAC mechanism due to its efficiency and transparency. However, notable exceptions exist. For example, Spain’s OMIE applies the PAB mechanism in its energy and capacity markets. Spain’s Renewable Energy Economic Regime operates as a contract for difference, requiring generators to either receive or pay the difference between the fixed PAB and market prices. Balancing and reserve markets tend to prefer the PAB mechanism due to its effectiveness in managing short-term operational risks.
While auction mechanisms shape market operations, imbalance penalties are key in maintaining grid stability and guiding participant behavior. In Europe, balancing responsibilities fall on individual market participants, requiring them to manage their positions within wholesale markets as accurately as possible. However, penalty structures vary across countries. For example, Spain applies downward imbalance penalties, whereas Portugal enforces bi-directional penalties within the same Iberian electricity market [
44]. Similarly, countries like the UK [
45], Italy [
46], Germany [
47], and Finland [
48] predominantly use bi-directional penalties to promote balanced and stable market behavior. In Asia, China’s Gansu Province implements bi-directional penalties with a 5% tolerance for wind and solar generation deviations [
49], while Japan applies a similar 3% bi-directional penalty [
50]. Conversely, due to its isolation from the mainland grid and high renewable energy penetration, South Korea’s Jeju Island imposes upward imbalance penalties in pilot programs to ensure grid stability [
51,
52].
3. Optimization Model for VPP Bidding Strategy
3.1. Classification of Imbalance Penalty Structures
According to the structural design study by Song et al. [
32], imbalance penalty structures can be classified based on three key factors: direction, price, and coefficient. Among these, the penalty direction has the most significant influence on VPP bidding strategies. In contrast, the other two factors—penalty price and penalty coefficient—primarily affect revenue variation without directly altering bidding behavior. However, these factors cannot be entirely disregarded, as their impact becomes more pronounced when the penalty price is linked to the system marginal price (SMP) and the penalty coefficient is linear, compared to cases where they are fixed values. Therefore, this study focuses on a scenario where the penalty price is SMP based, and the penalty coefficient is linear, while only the penalty direction is varied to classify different penalty structures.
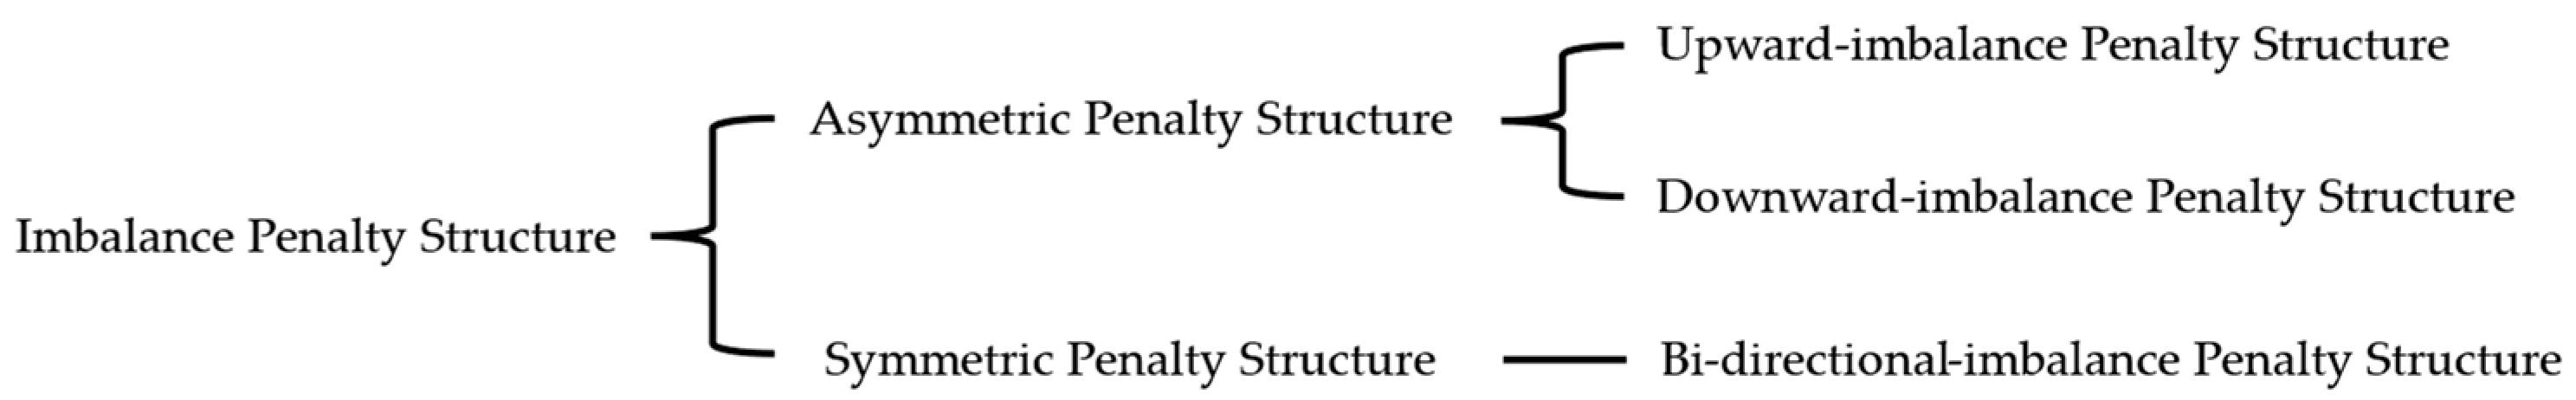
Based on the direction of penalties, the imbalance penalty structure can be categorized into two types: the asymmetric penalty structure (APS) and the symmetric penalty structure (SPS), as shown in
Figure 2. Each structure has distinct characteristics that influence VPP bidding strategies.
The APS imposes penalties on deviations in only one direction: overproduction or underproduction. This structure has two forms:
The upward-imbalance penalty structure (APS-UPS) penalizes VPPs when actual generation exceeds the awarded quantity in the day-ahead market. The power deviation at time
, denoted as
, is calculated as Equation (1), where
is the real-time generated power, and
is the awarded quantity in the day-ahead market at time
. This structure discourages overproduction by penalizing excess generation.
The downward-imbalance penalty structure (APS-DPS) penalizes VPPs when actual generation falls short of the awarded quantity in the day-ahead market. The power deviation is calculated as Equation (2). This structure discourages underproduction and encourages VPPs to fulfill their awarded quantities.
In contrast, the SPS applies penalties to upward and downward deviations, promoting balanced and cautious bidding behavior. The power deviation for this structure is expressed using Equation (3). This bi-directional-imbalance penalty structure (SPS-BPS) incentivizes VPPs to minimize overproduction and underproduction, contributing to market stability and reliability.
A tolerance threshold is introduced to ensure that minor deviations do not result in penalties. The actual penalized deviation at time
, denoted as
, is calculated as Equation (4). This formulation ensures that only deviations exceeding the tolerance level result in positive penalty costs. The tolerance level
is determined by the real-time generation capacity
and a tolerance factor
, expressed as Equation (5).
As penalty coefficient at time
,
, is linear with respect to
, it is calculated by incorporating the penalty pricing factor,
, as shown in Equation (6). Here,
represents the coefficient applied to the actual penalized deviation, determining the financial impact of imbalance penalties on the VPP. This quadratic relationship ensures that higher deviations from the awarded quantity result in proportionally higher imbalance penalty costs.
3.2. Optimal VPP Bidding Strategy Model
Stochastic programming, which can be efficiently solved using a scenario-based optimization approach, has been widely adopted in research to derive optimal bidding strategies for VPPs [
53,
54,
55]. In this study, a three-stage scenario-based stochastic programming model is developed to determine the optimal VPP bidding strategy, maximizing the expected VPP profit by incorporating the probability of each scenario. This model accounts for uncertainties in the day-ahead SMP, real-time SMP, and generation output.
3.2.1. Scenario Generation for Stochastic Optimization
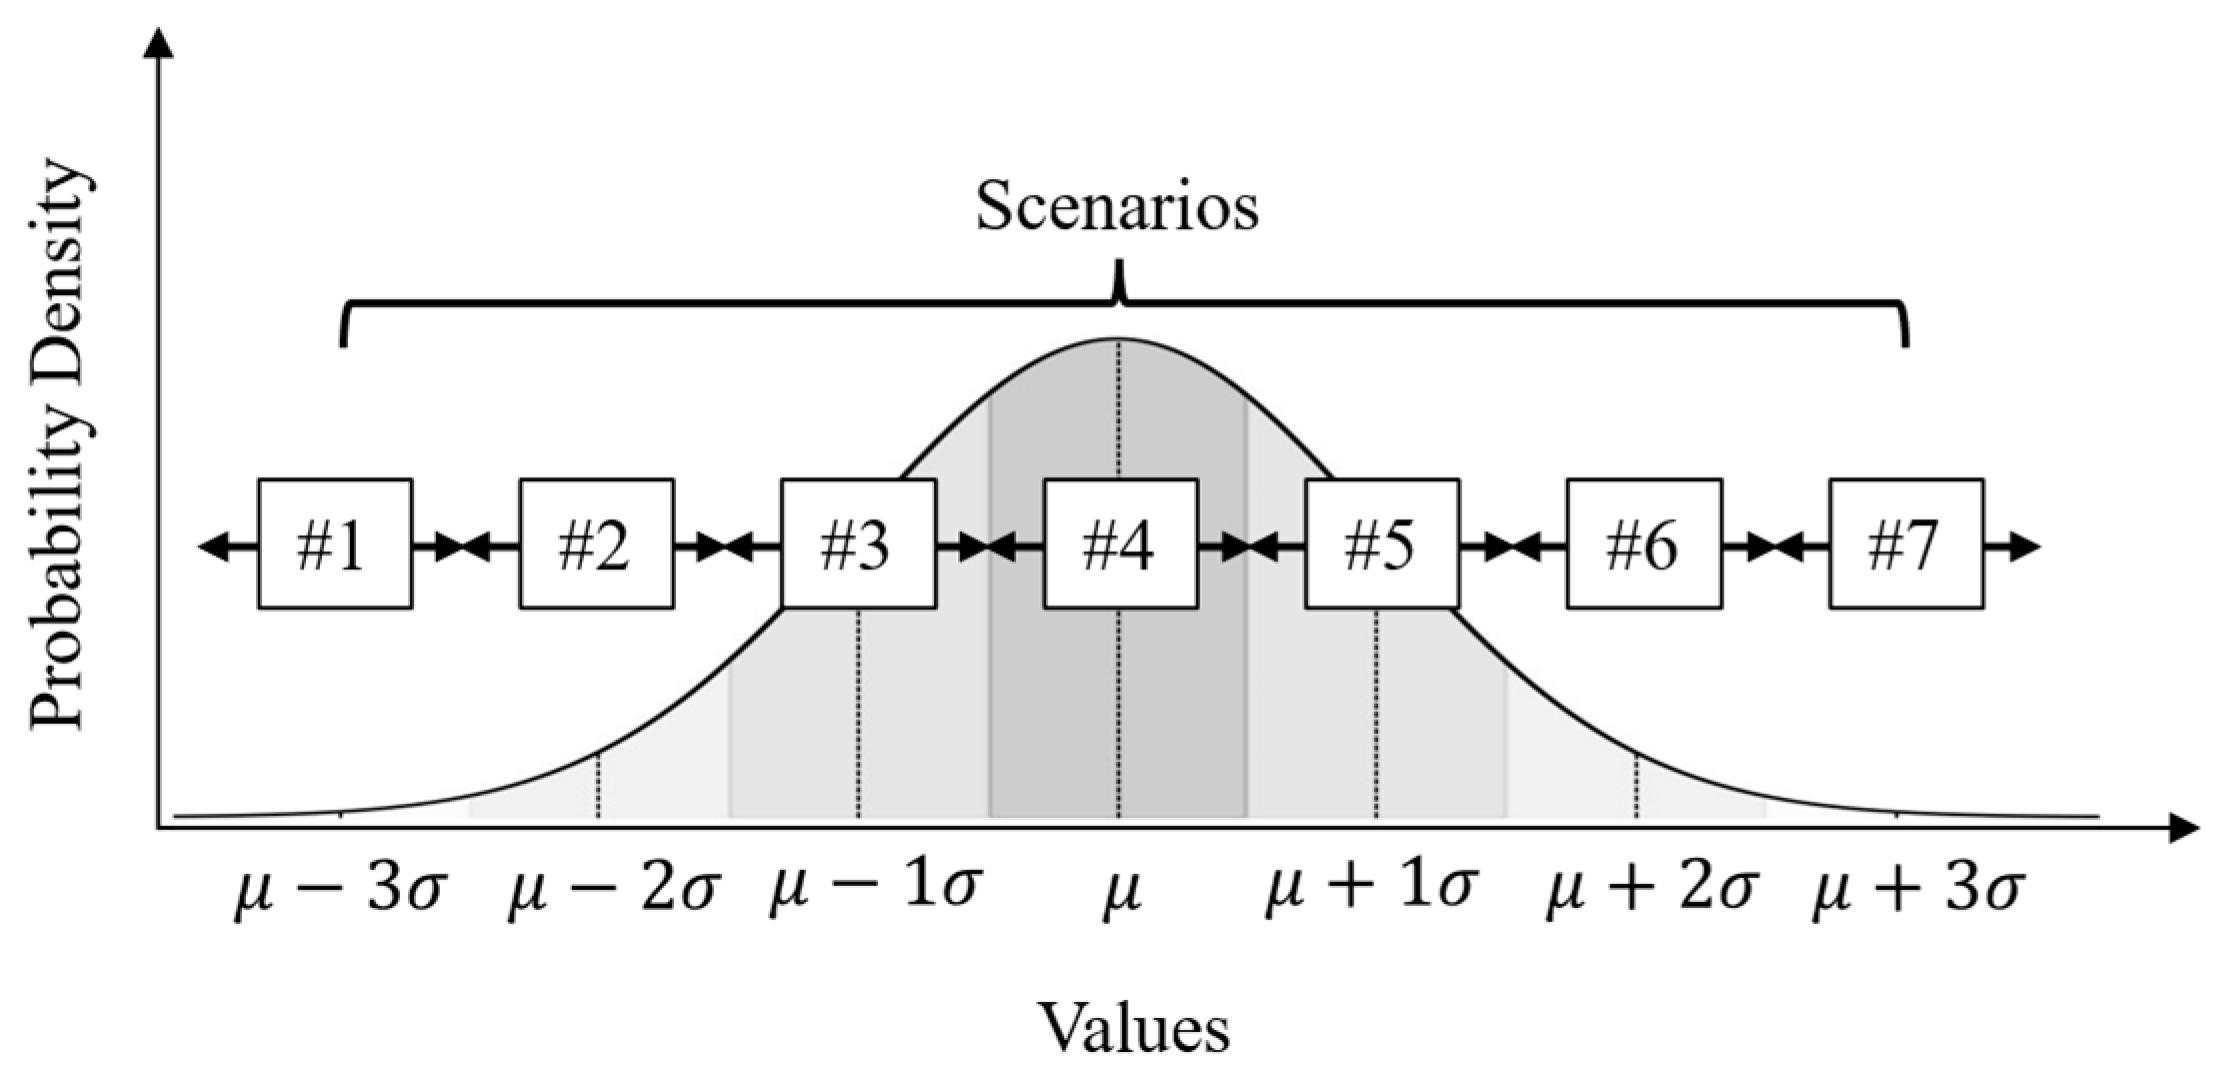
The proposed model generates scenarios by combining three stochastic variables across different stages: the day-ahead SMP, real-time SMP, and generated power. Each variable is modeled as a normal distribution to reflect realistic market and generation uncertainties. The day-ahead and real-time SMPs are represented by Equation (7), and the generated power is represented by Equation (8).
To account for variations in the volatile electricity market and the VPP’s generation output, scenarios were discretized using the Z-score method applied to the normal distributions. This method divides the continuous probability distribution into representative scenarios, effectively capturing deviations from the predicted values. Z-scores for scenario generation are selected from a set of seven integers, ranging from −3 to 3, covering approximately 99.7% of the potential deviations in a standard normal distribution, as shown in
Figure 3. The scenarios for the day-ahead SMP,
, and the real-time SMP,
, at time
are calculated using Equation (9).
For the generated power scenario, the values are constrained within the physical limits of the VPP to ensure realistic outputs. The power generation scenario,
, at time
is calculated using Equation (10).
where
,
and
represent the scenario indices for the day-ahead SMP, real-time SMP, and generated power, respectively.
The probability of each scenario is calculated using the cumulative distribution function (CDF) of the normal distribution in Equation (11). This calculates the probability of a given Z-score by evaluating the difference in CDF values around it. The probability
, at time
for the day-ahead SMP, real-time SMP, and generated power is calculated as Equation (12).
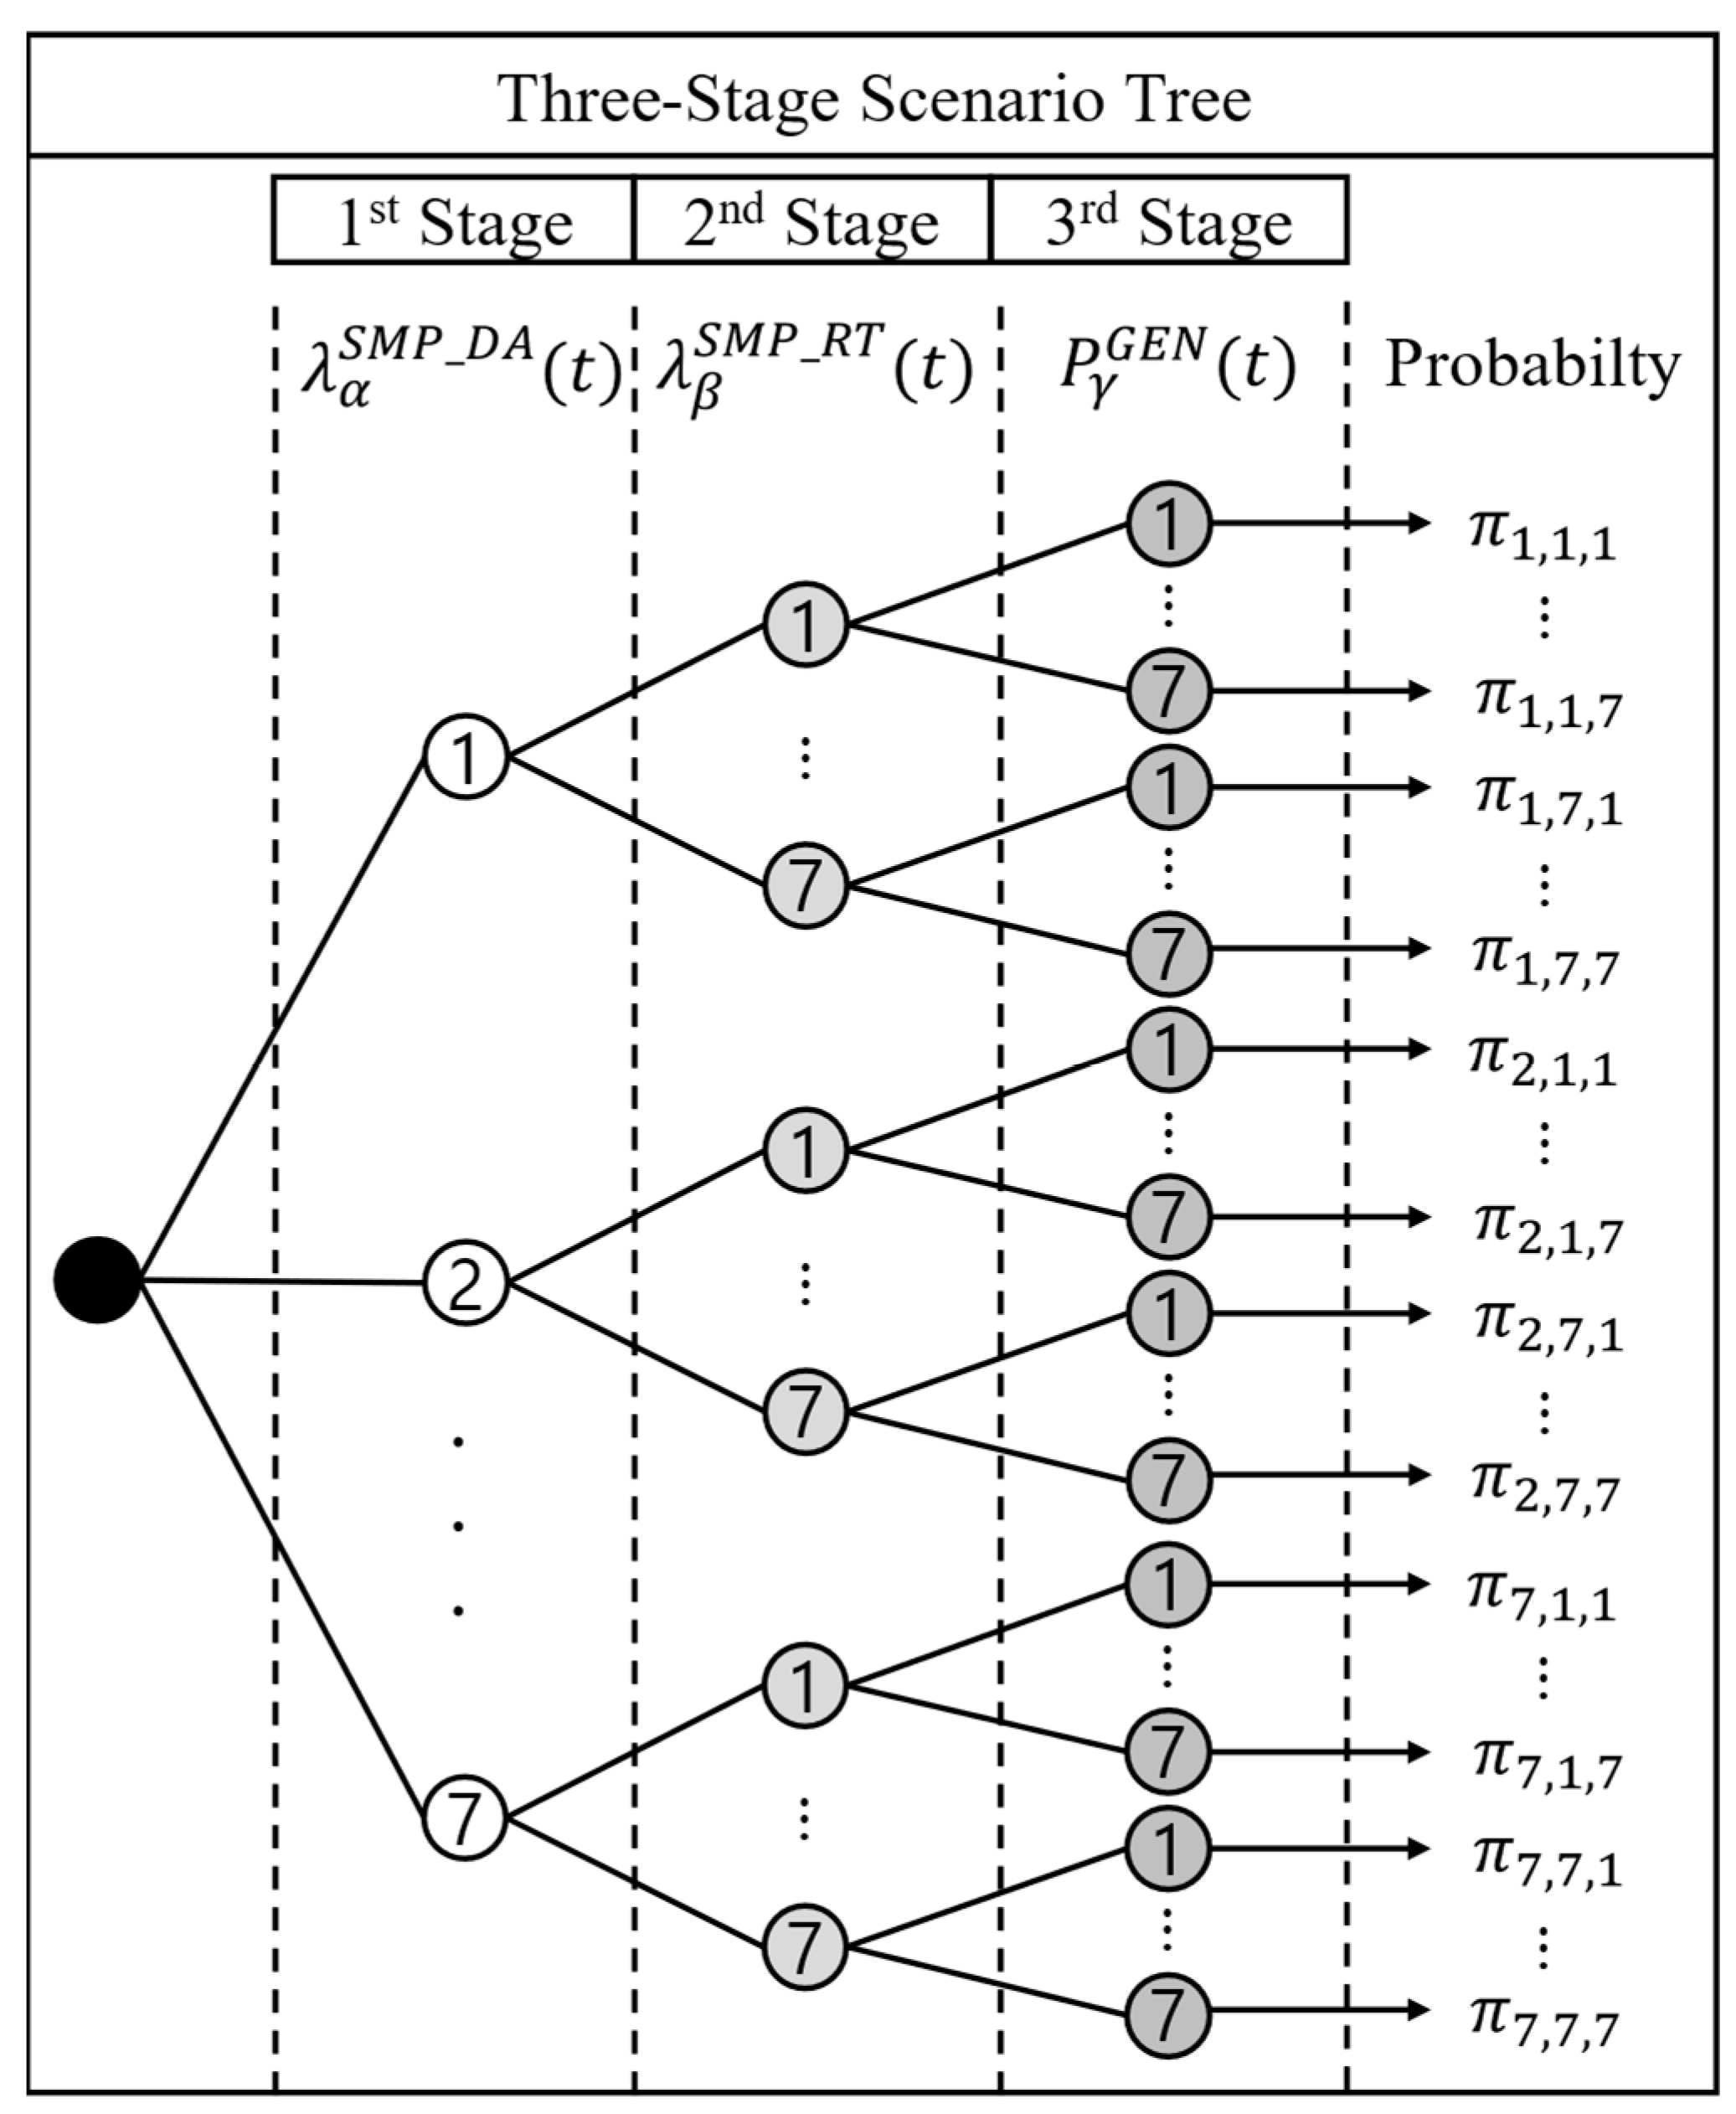
To obtain the joint probability of a combined scenario,
, involving all three stochastic variables—the day-ahead SMP, real-time SMP, and generated power—the individual probabilities are aggregated as Equation (13).
The three-stage scenario tree, illustrated in
Figure 4, comprehensively represents 343 scenarios derived from combining seven Z-score levels for each stochastic variable. Each branch of the tree corresponds to a specific value of one of the variables, starting with the day-ahead SMP, then the real-time SMP, and, finally, the generated power. The joint probability is assigned to each complete path through the tree, ensuring that the probabilities accurately represent the distribution of possible outcomes.
3.2.2. Objective Function
VPPs can be categorized into technical VPPs (TVPPs) and commercial VPPs (CVPPs), each with distinct objectives [
5]. While TVPPs prioritize grid stability and operational constraints, CVPPs focus on maximizing economic returns by aggregating DERs. As this study investigates the influence of bidding strategies on imbalance penalties and market operations, it adopts the CVPP model to focus on financial optimization and its broader impact on market operations.
The objective function is formulated as Equation (14), where
denotes the revenue generated under scenario (
) occurring at time
.
In this model, the VPP bids exclusively in the day-ahead market to maximize its expected revenue. This revenue comprises income from day-ahead market participation, real-time market adjustments, renewable energy certificate (REC) sales, and deductions for imbalance penalties. Given that RESs have zero operating costs, generation costs are excluded from the objective function. The revenue for each scenario is defined as Equation (15). The first term represents the revenue from selling electricity in the day-ahead market, where
is the day-ahead settlement price at time
. The second term accounts for the profit or loss from deviations between the actual real-time generation and awarded quantity in the day-ahead market, with
representing the real-time SMP at time
. The third term reflects the revenue from selling RECs based on the amount of renewable energy generated on REC price
. The last term represents the imbalance penalty cost at time
, where
is the imbalance penalty price.
3.2.3. Bidding and Generation Constraints
To ensure a practical bidding strategy, the VPP must satisfy several bid price and quantity constraints. The non-decreasing constraint on bid prices ensures that the bid prices are ordered logically, reflecting standard market behavior. The constraint is expressed as Equation (16). Similarly, the non-decreasing constraint on bid quantities ensures that the submitted quantities increase or remain constant across bidding segments as Equation (17). The VPP is allowed to submit up to 10 bid segments to handle stochastic market conditions effectively.
Submitting identical bid prices for different bid quantities, or vice versa, can lead to ambiguity in determining the awarded price and quantity. The model enforces a constraint to avoid such issues and ensures a clear and practical bidding strategy, as formulated in Equation (18).
Additionally, the model imposes upper and lower bounds on bidding prices and quantities to reflect market limitations. The lower bound for bid prices is defined in Equation (19), while the upper bound is specified in Equation (20). Similarly, the bid quantities must respect the VPP’s physical generation capacity. The lower bound is expressed in Equation (21), and the upper bound is given in Equation (22).
The clearing condition for the day-ahead market is based on the relationship between the bid price and the SMP. A bid is accepted if its price is lower than or equal to the SMP. Among these accepted bids, the highest bid price becomes the awarded price, and the corresponding bid quantity is awarded. To formalize this, the index
is defined as the index of the bid price that satisfies the following conditions, as shown in Equation (23). If no bid satisfies this condition (i.e., all bid prices exceed the SMP), the clearing price and the awarded quantity are set to zero. The awarded day-ahead market price is defined as Equations (24). The corresponding awarded quantity is defined as Equation (25).
The settlement mechanism in the day-ahead market differs depending on the auction mechanism employed. In PAC markets, the settlement price is the market-clearing price, shown as Equation (26), whereas in PAB markets, it is the bid price itself, shown as Equation (27).
The actual real-time generation of the VPP in each scenario is determined by subtracting the curtailment amount,
, from the initially available generation output as Equations (28) and (29). This adjustment reflects the VPP’s operational flexibility to reduce generation in response to market conditions, mainly to avoid imbalance penalties. This constraint ensures that the VPP cannot curtail more power than it can generate and reflects the unidirectional curtailment characteristic of renewable energy.
The actual penalized deviation of the VPP is calculated differently depending on the imbalance penalty structure defined in
Section 3.1. This calculation varies depending on whether the market applies an APS-UPS, APS-DPA, or SPS-BPS, directly influencing how deviations between awarded and actual generation are penalized. Similarly, the penalty coefficient is applied across all scenarios. Regarding the imbalance penalty price, as discussed in
Section 3.1, this price dynamically adapts the day-ahead SMP by incorporating an imbalance penalty factor,
. Since imbalance penalties typically exceed the SMP due to additional system operating costs, this adjustment ensures that deviation-related penalties accurately reflect real-time market conditions. The penalty price is defined as Equation (30).
3.2.4. Linearization
The optimization problem formulated in this study involves several non-linear equations, specifically Equations (15), (18) and (23). These non-linear components are linearized to ensure the problem can be solved efficiently and yield a globally optimal solution.
In Equation (15), the imbalance penalty term
introduces a quadratic term, resulting in non-linearity. A piecewise linear approximation is applied to linearize this term. This method is effective in market models due to its simplicity and computational efficiency [
56]. Additionally, the first term in Equation (15) under the PAB mechanism introduces a bilinear term due to the product of the awarded quantity and price. The McCormick envelope method is employed to linearize this term. By introducing linear constraints that tightly bind the product of two variables with well-defined upper and lower bounds, the McCormick method ensures accuracy while maintaining computational efficiency [
57].
Equations (18) and (23) incorporate logical conditions, such as the relationship between adjacent bid segments or the awarded price and quantity selection based on comparing the bid and the market-clearing prices. These conditions are represented using if-then structures, which are inherently non-linear. The Big-M relaxation method linearizes these conditional statements [
58].
All non-linear components in the model are linearized by applying the piecewise linear approximation, the McCormick envelope method, and the Big-M relaxation method. As a result, the original non-linear stochastic optimization problem is reformulated into an LP problem.
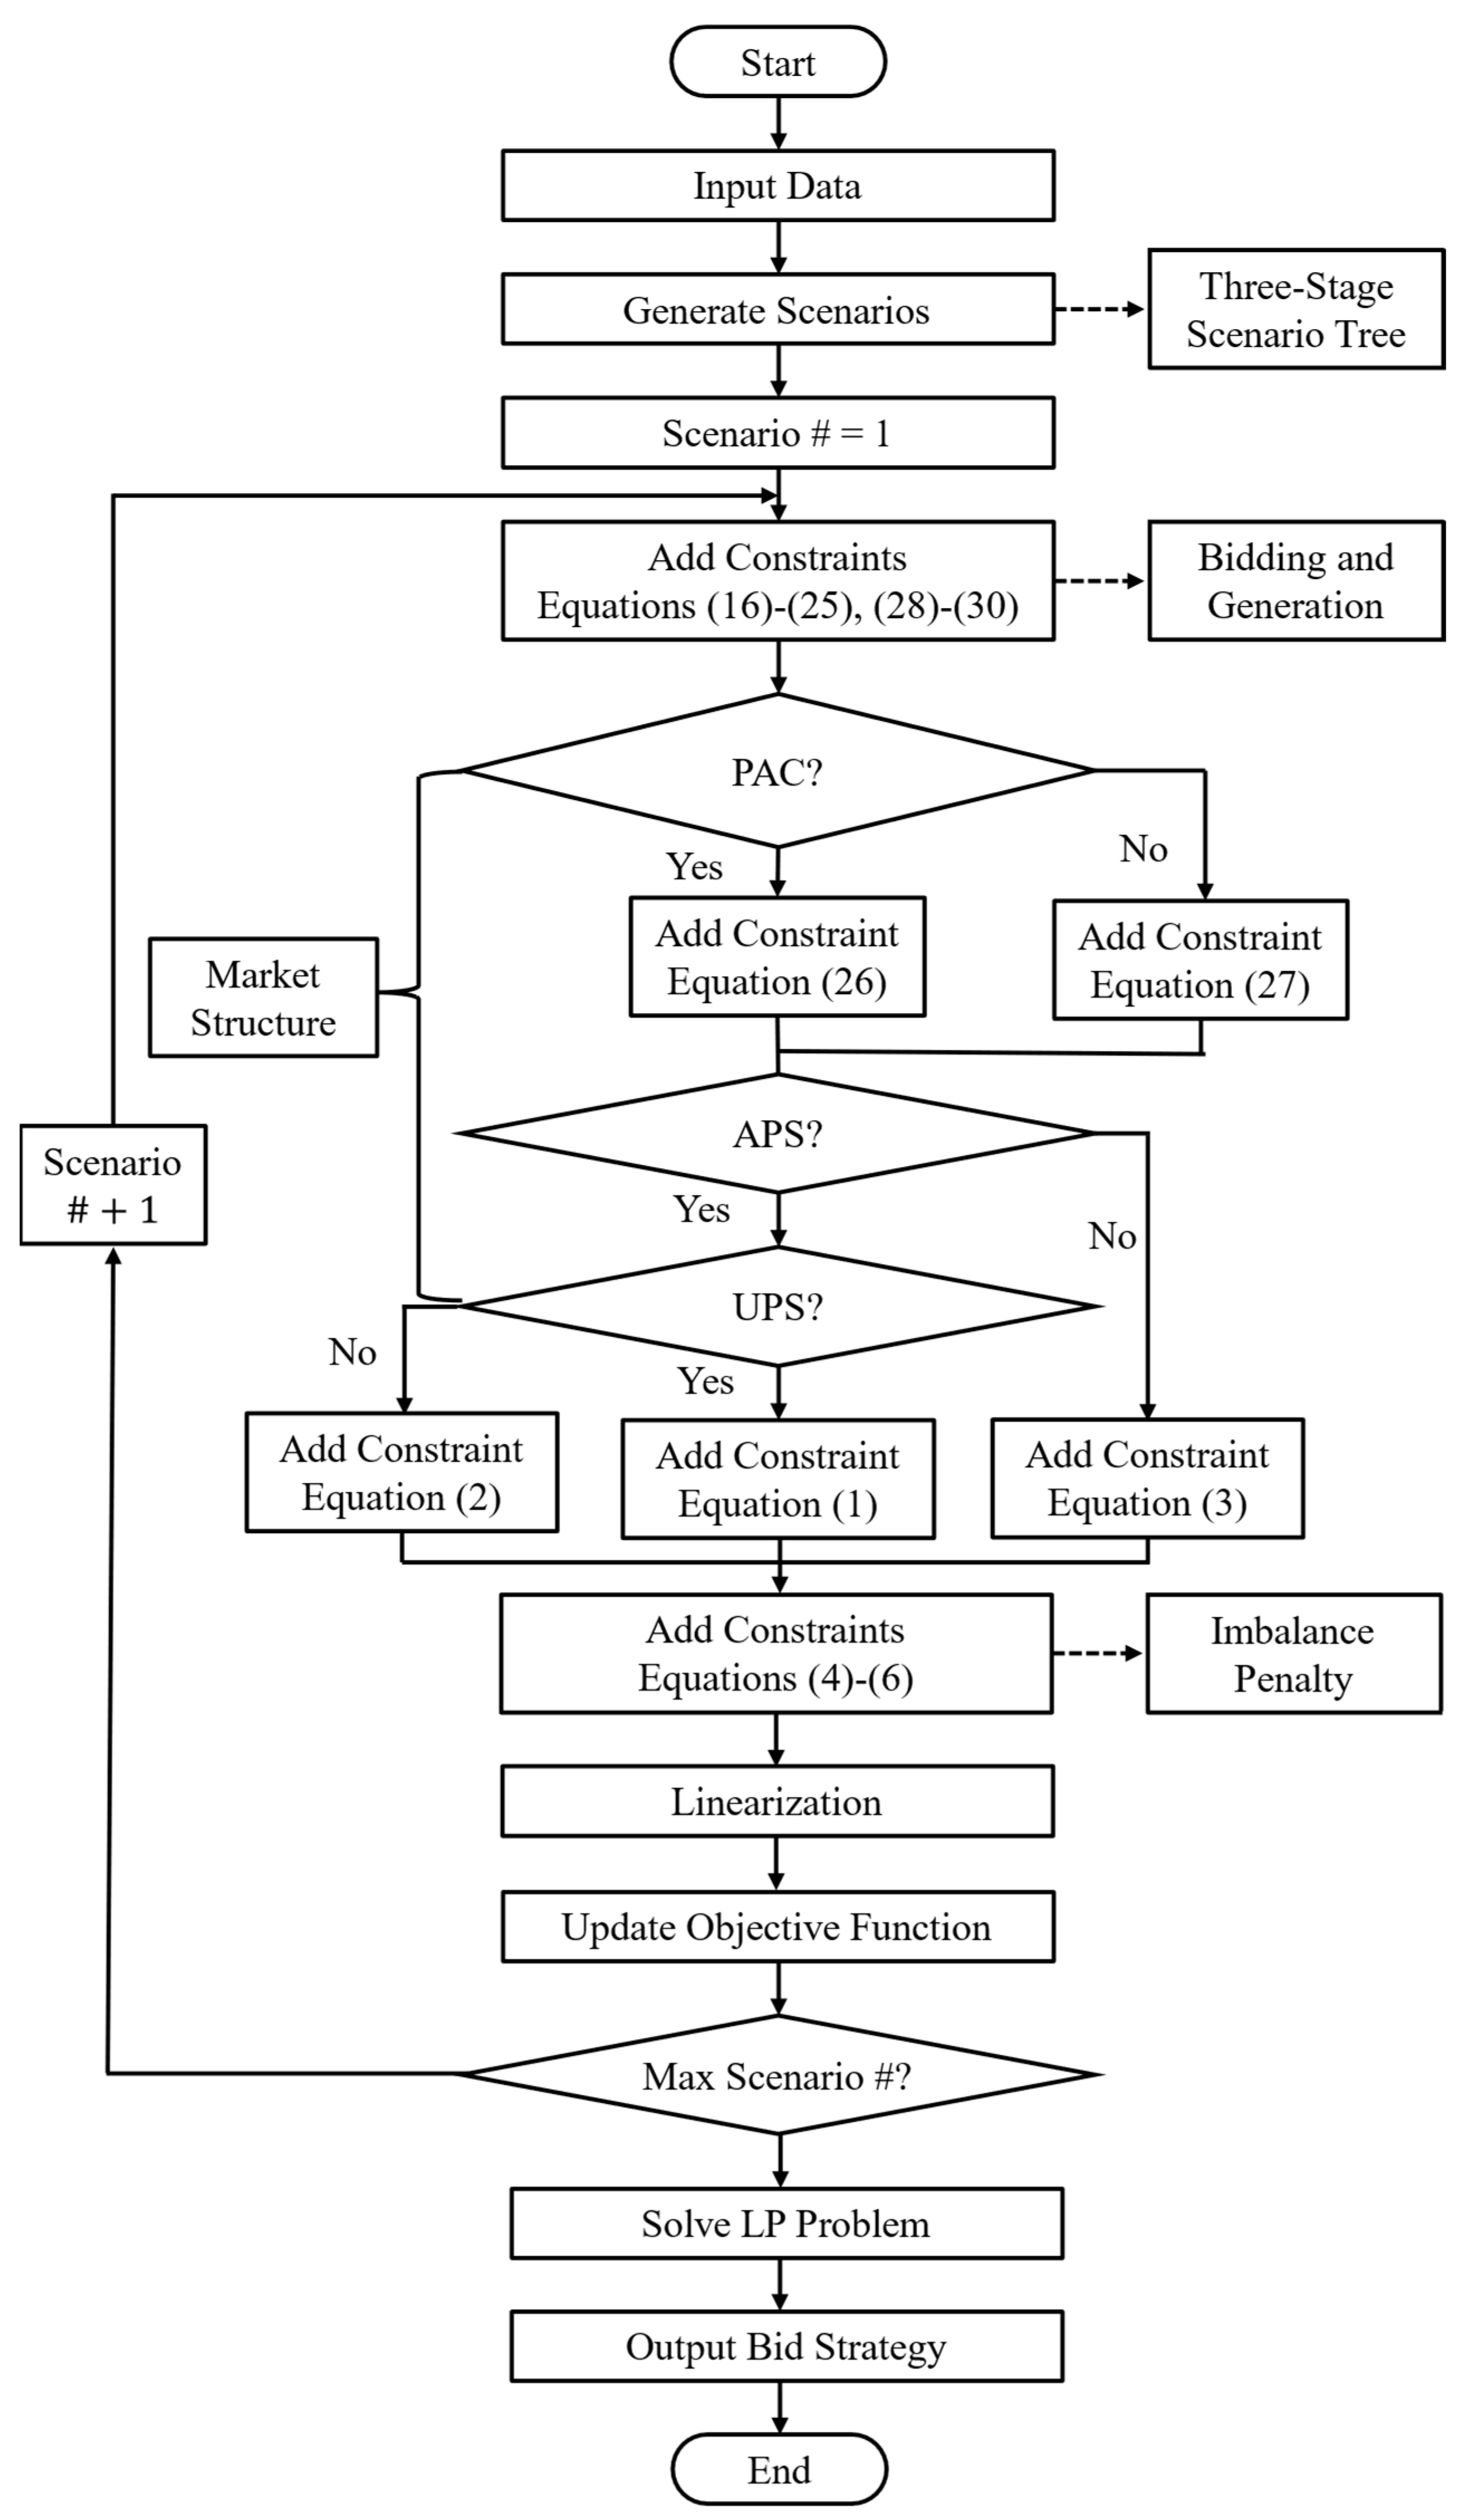
3.2.5. Overall Optimization Model
Figure 5 depicts the complete flowchart of the optimization model. This model integrates constraints related to market structure—which includes auction mechanisms and imbalance penalty structures—within a stochastic programming framework to derive the optimal bidding strategy for the VPP.
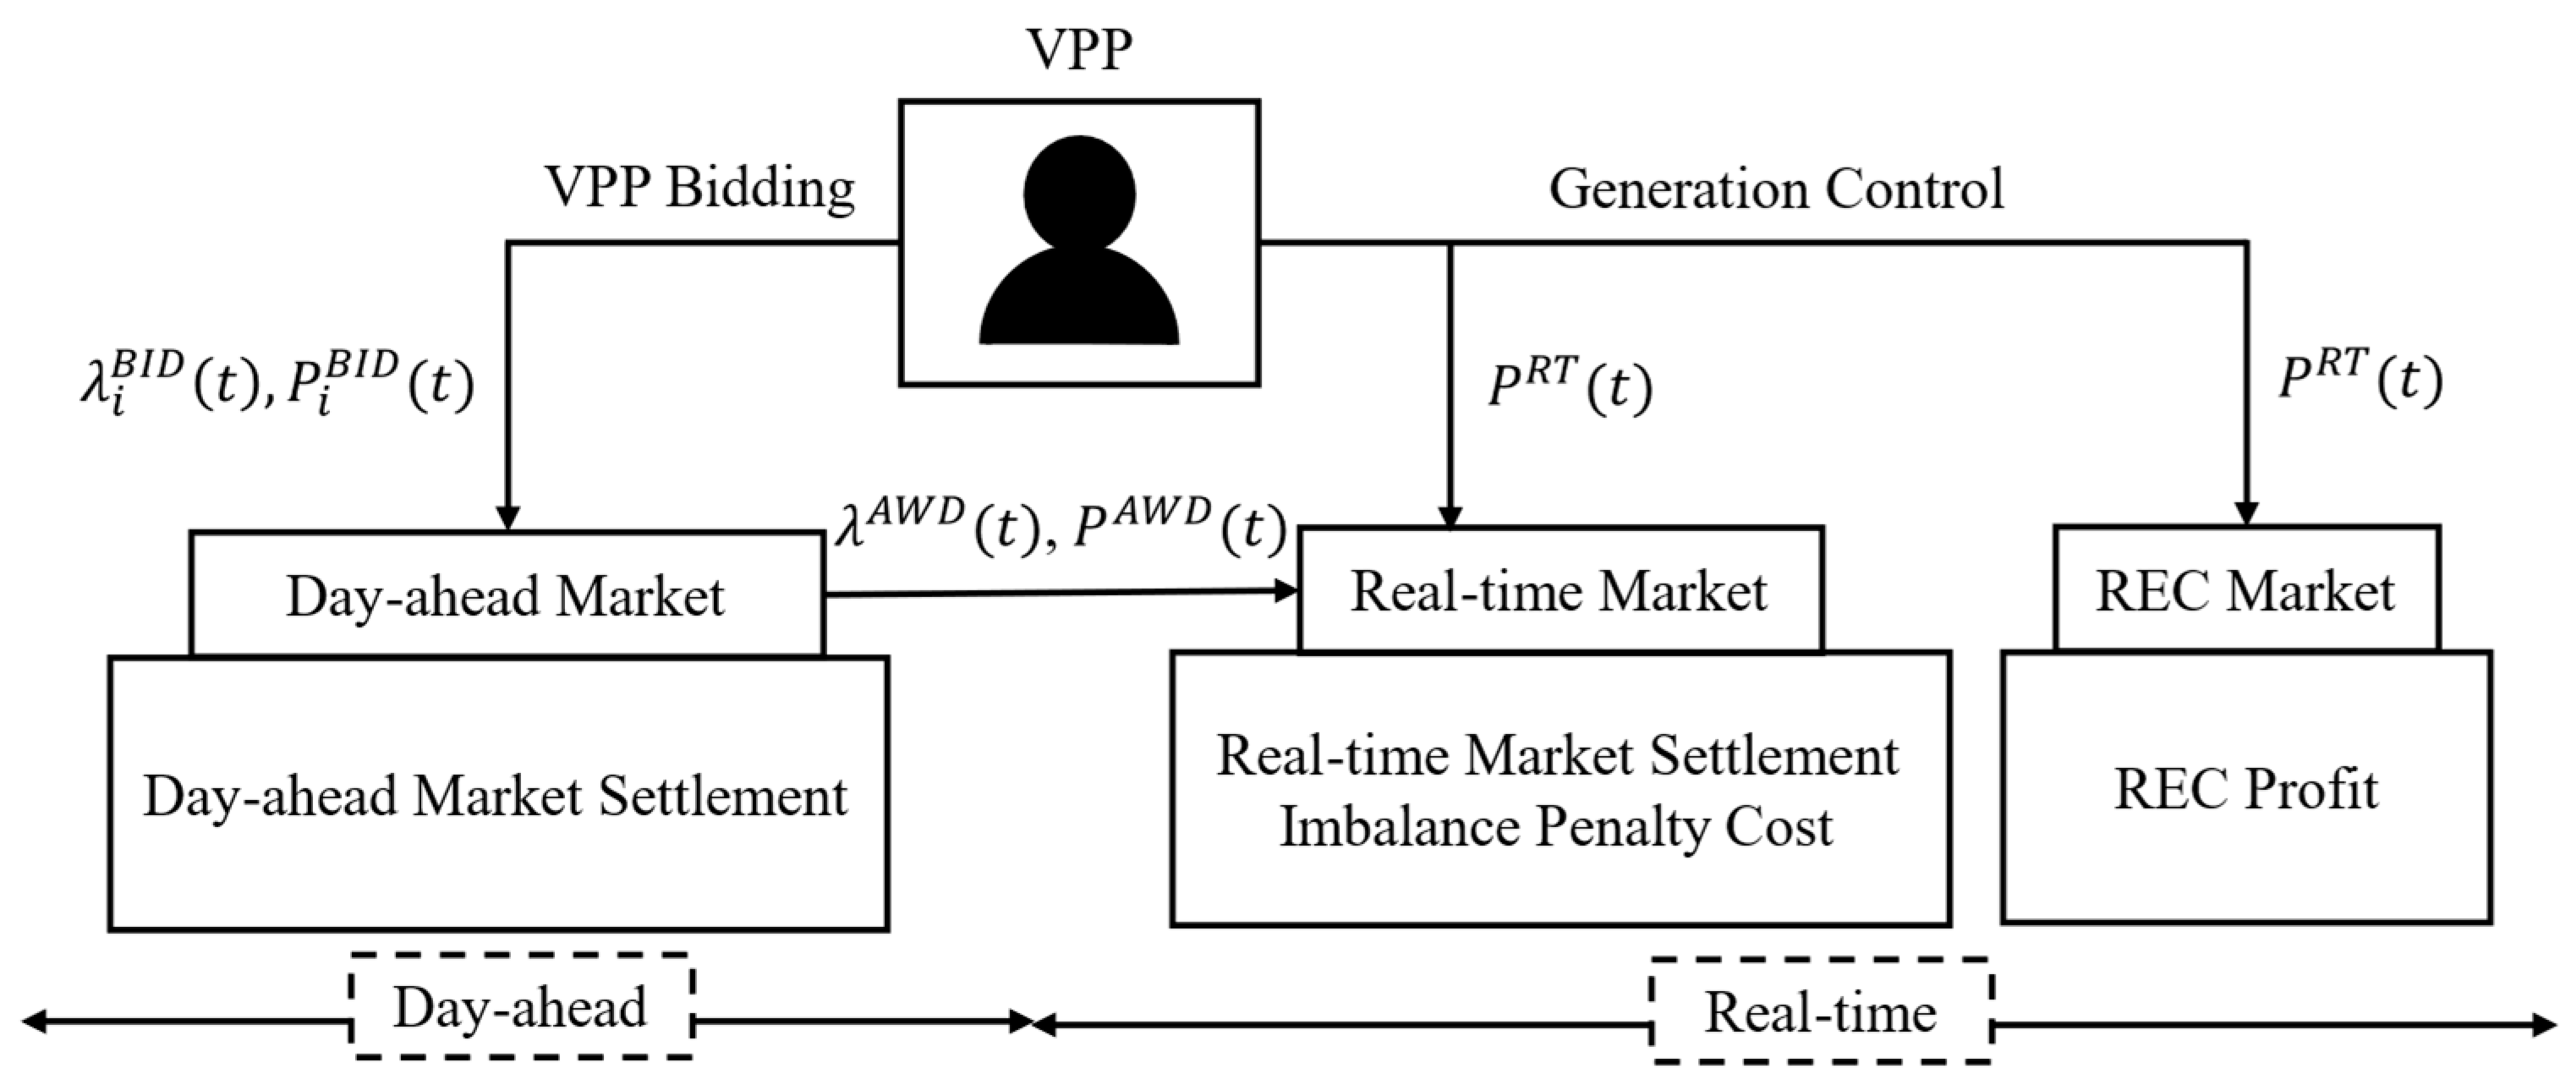
Figure 6 presents the operational framework of the proposed optimal VPP bidding strategy. Initially, the VPP submits bids to the day-ahead market, specifying both price and quantity. Once the market clears, the awarded bids determine the VPP’s day-ahead settlement.
Following this, the VPP engages in generation control, adjusting electricity production based on its available resources and operational decisions. The actual real-time generation is then allocated to both the real-time electricity market and the REC market. In the real-time market, settlement is conducted with reference to the awarded day-ahead bids, with any deviations leading to imbalance penalties. Concurrently, the REC market determines additional revenue based on actual generation.
4. Case Study
4.1. Simulation Environment
A comprehensive case study has been conducted to analyze the VPP’s bidding behavior and its impact on market operations under different auction mechanisms, while also considering the effects of imbalance penalty structures. The model design and subsequent LP problem solving were implemented using the IBM ILOG CPLEX. This study utilizes market data to simulate realistic conditions and assess the properties of the VPP’s optimized bidding strategy.
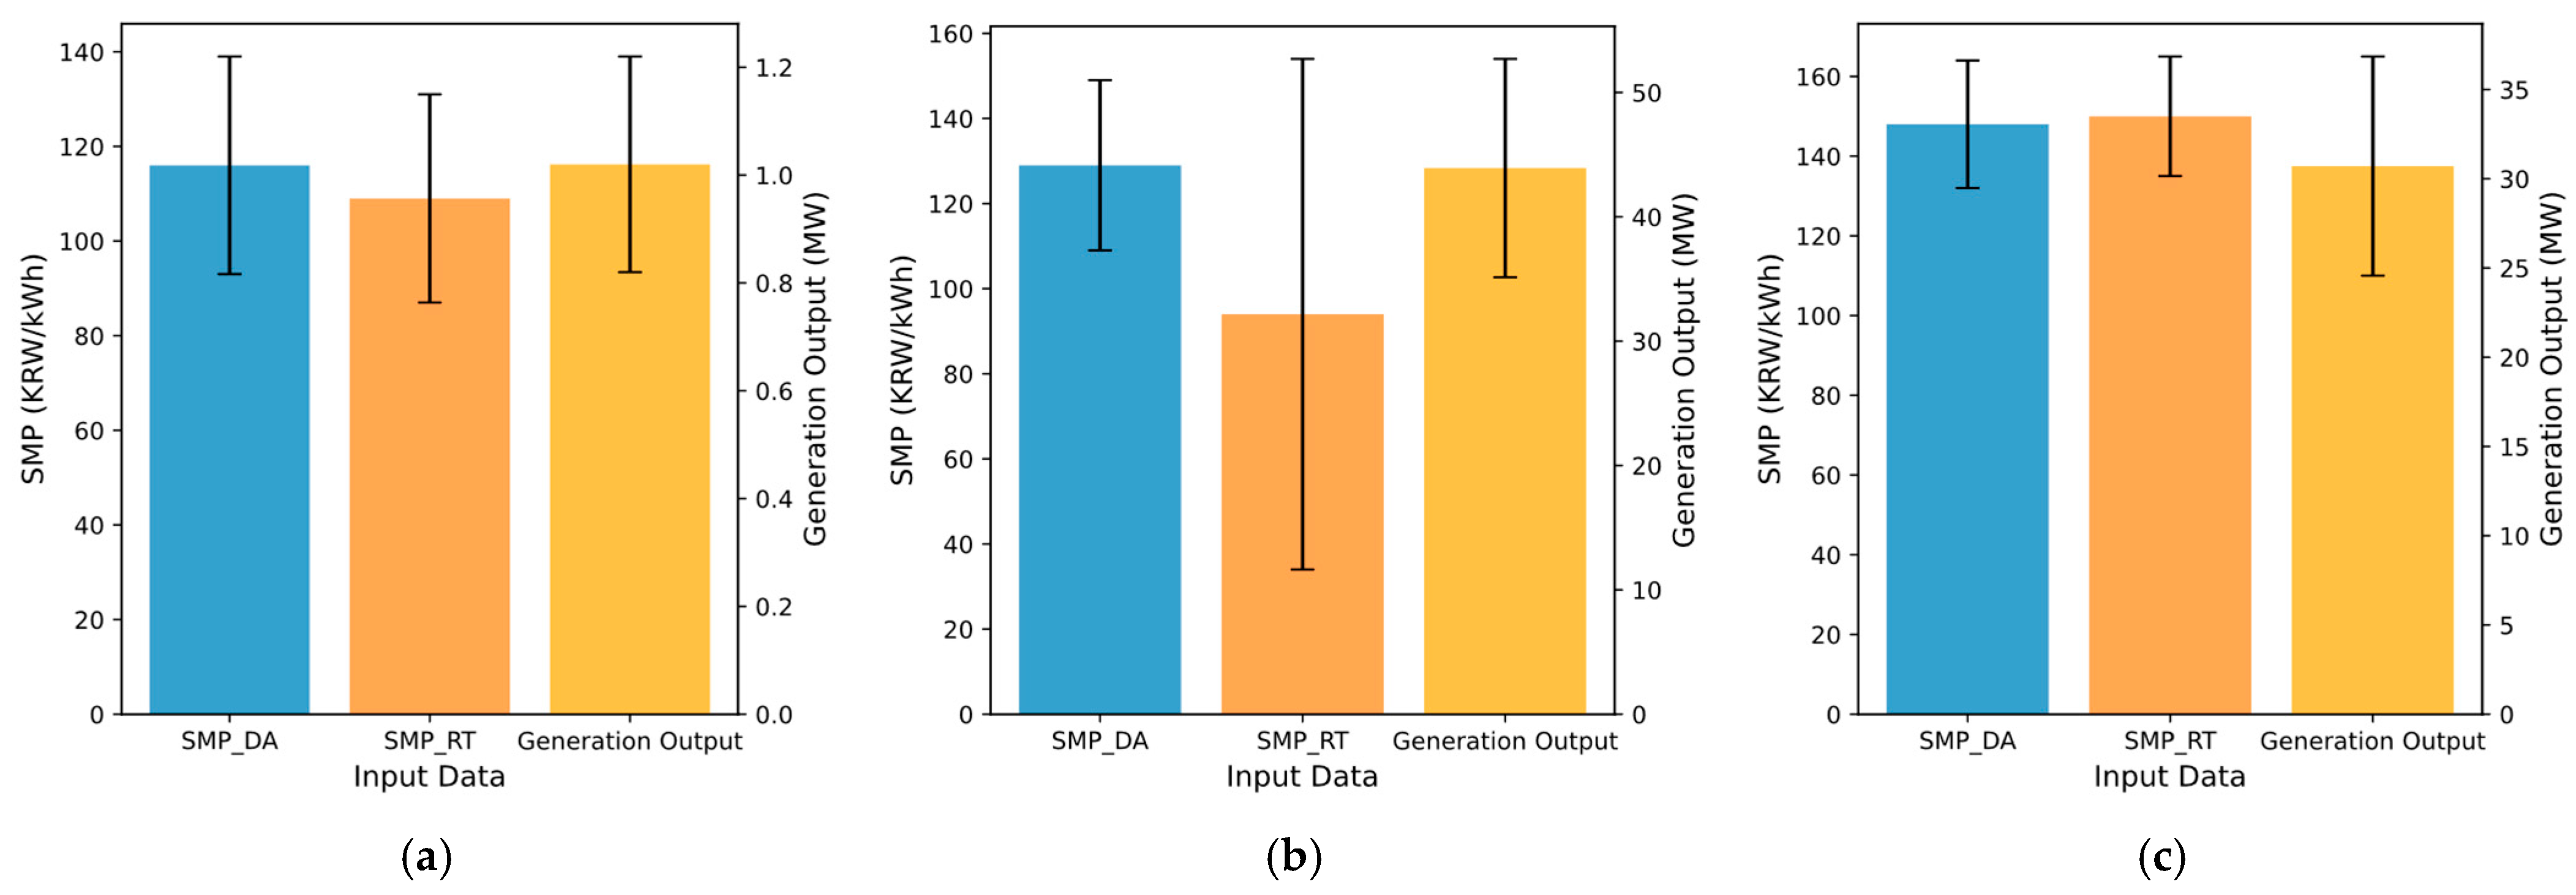
The input data for scenario generation, including the average values and error margins of the day-ahead SMP, real-time SMP, and generation output, are illustrated in
Figure 7. The SMP data for both the day-ahead and real-time markets were sourced from the Korea Power Exchange database, covering the period from March to June 2024. The REC price data for the same period and other model parameters for simulation are summarized in
Table 2. Since the REC price exhibits minimal fluctuations over time, it is treated as a constant variable in this study. The generation profile of a VPP located in Jeju, Korea, from 17 March 2024, was also used. Details regarding the VPP’s generation capacity are also provided in
Table 2.
4.2. Simulation Results
4.2.1. VPP’s Bidding Behavior
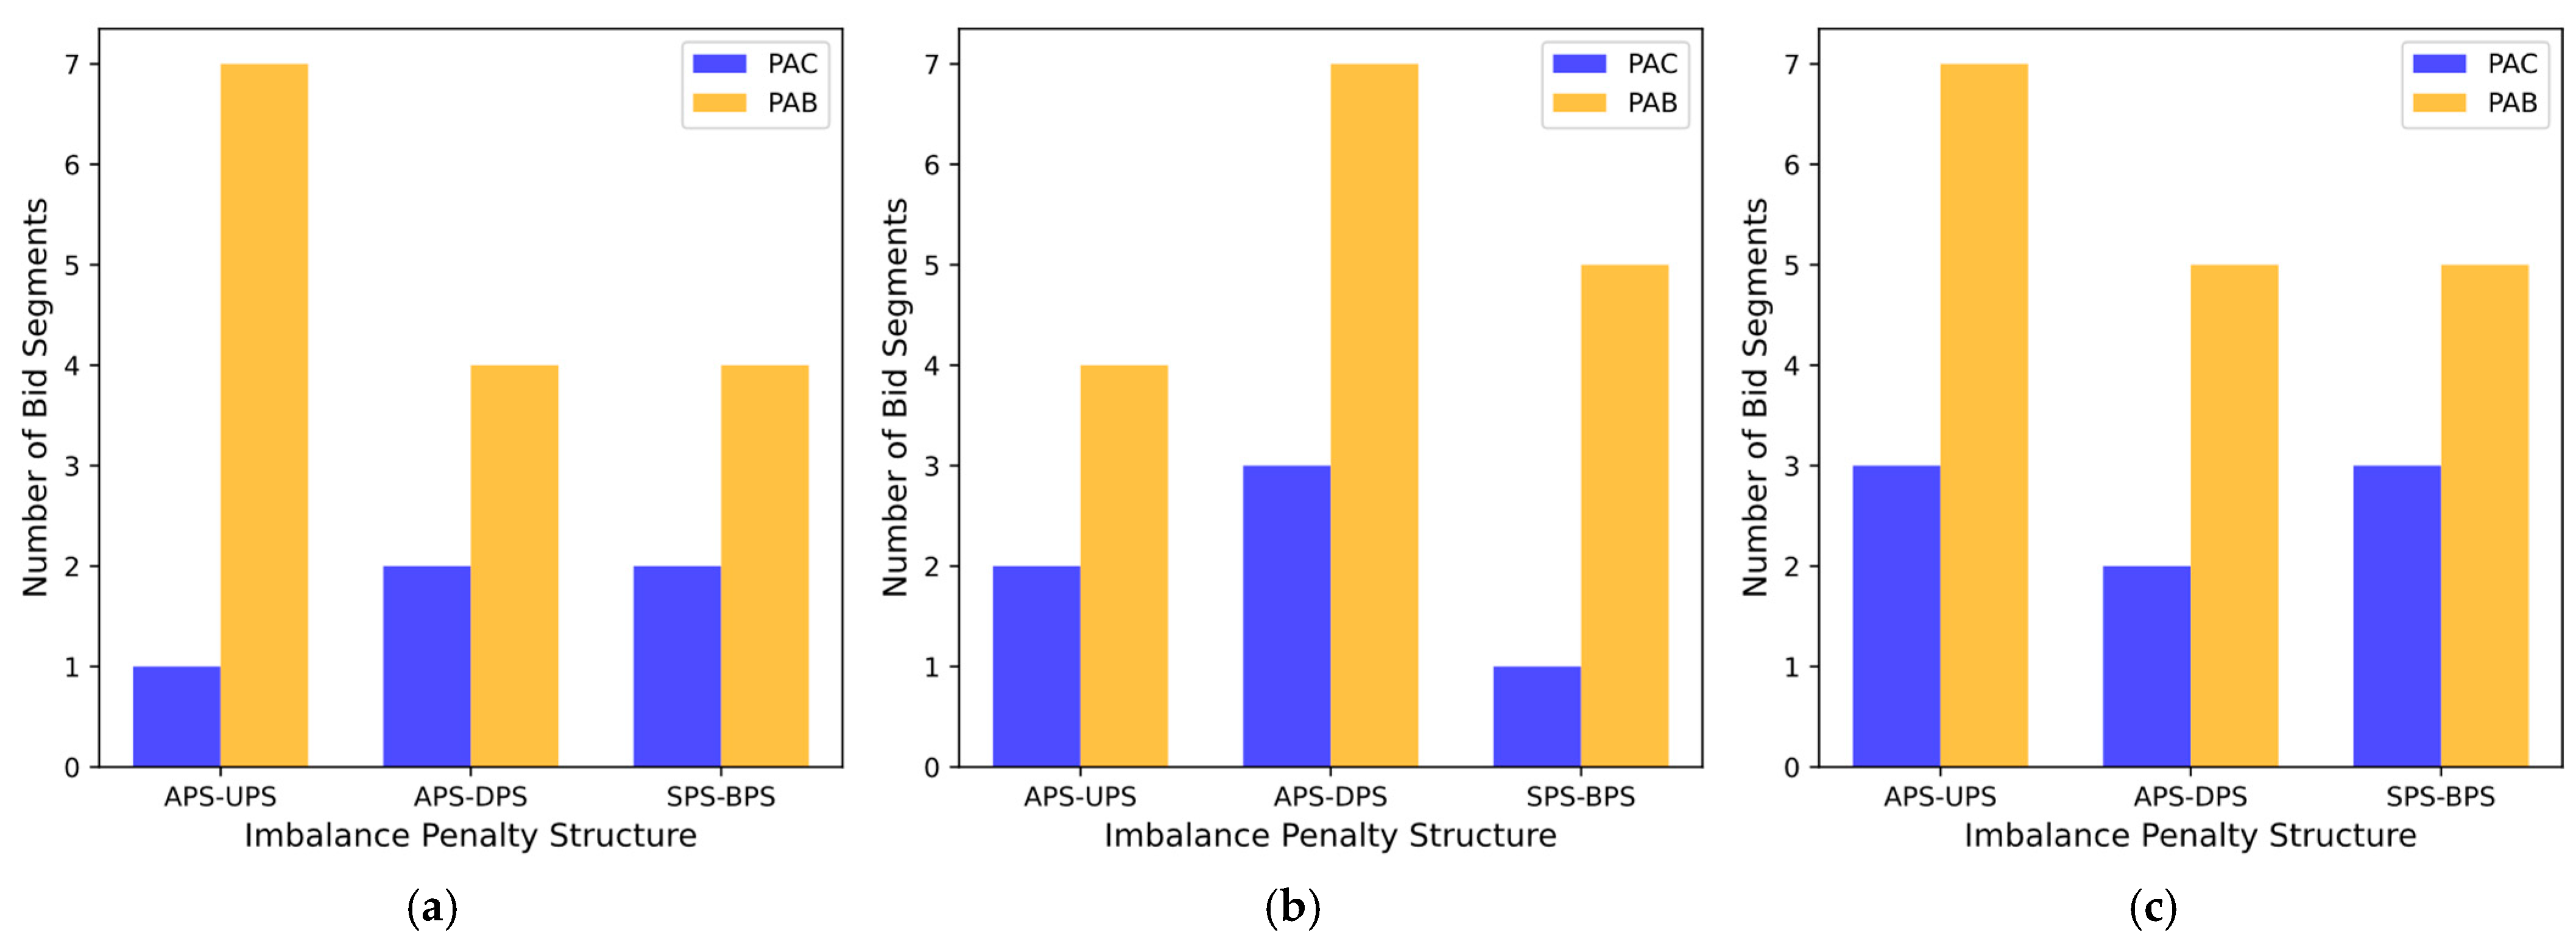
The VPP’s bidding strategy under the PAB and PAC markets was analyzed by comparing bid segments and prices. As illustrated in
Figure 8, the number of bid segments submitted in the PAB market was consistently higher than in the PAC market. The number of bid segments in the PAC market ranged from a minimum of 1 to a maximum of 4, whereas in the PAB market, it varied between 4 and 7.
In the PAB market, the VPP is settled at the exact price it bids. This incentivizes a more refined bidding strategy to better manage the volatile market. As a result, the VPP adopts a more stable stepwise (staircase-like) bidding strategy, which effectively reduces the influence of the stochastic environment by distributing bids across multiple segments.
In contrast, due to its uniform pricing structure, the PAC market leads to a more simplified bidding strategy. Since the settlement price in the PAC market is determined by the market-clearing price, the VPP’s bid price only affects whether a bid is accepted, not the price at which it is settled. This often results in more aggressive or conservative bidding strategies, depending on the imbalance penalty structure. This difference is particularly noticeable during the morning period under APS-UPS cases, where the gap in bid segments between PAB and PAC is significant, as shown in
Figure 9.
The difference in bidding strategies between PAC and PAB also results in distinct distributions of awarded prices, as depicted in
Figure 10. In the PAC market, the awarded price varies unpredictably depending on the penalty structure and time of day. Conversely, the awarded price remains relatively stable in the PAB market regardless of the penalty structure or time. This stability provides a more reliable indicator for market operations, making PAB an advantageous mechanism for reducing uncertainty. It also enhances revenue predictability for VPPs and strengthens overall market stability, benefiting both market operators and participants through a more transparent market environment.
4.2.2. Power Deviation
Figure 11 illustrates the average power deviation results under two imbalance penalty structures: APS-UPS and APS-DPS. These penalty structures significantly influence the VPP’s bidding behavior, penalizing deviations in a single direction.
In PAC markets, the uniform settlement price fails to discourage extreme bidding strategies effectively. This results in significant power deviations in the direction opposite to the applied penalty, as shown in
Figure 11. Specifically, when upward penalties are enforced (APS-UPS), the VPP tends to overbid to avoid penalties, leading to negative deviations. In this case, power deviations in the PAC market were, on average, 23.24% higher than in the PAB market. Conversely, under downward penalties (APS-DPS), the VPP underbids, resulting in positive deviations. For APS-DPS, the PAC market exhibited power deviations that were, on average, 52.60% higher than in the PAB market. These behaviors produce large upward and downward deviations, demonstrating that the PAC market fails to prevent manipulative or extreme bidding strategies, which disrupt electricity market operations.
In contrast, the PAB market effectively minimizes excessive and insufficient bidding. Since market participants are paid according to their bid prices, the PAB mechanism discourages extreme bidding and incentivizes an accurate bidding process. This leads to more stable and reliable bidding behavior with minimal power deviations. The reduced deviation between the awarded market quantities and actual generation output underscores the PAB mechanism’s ability to align market bids with real-time operations, effectively enhancing market stability.
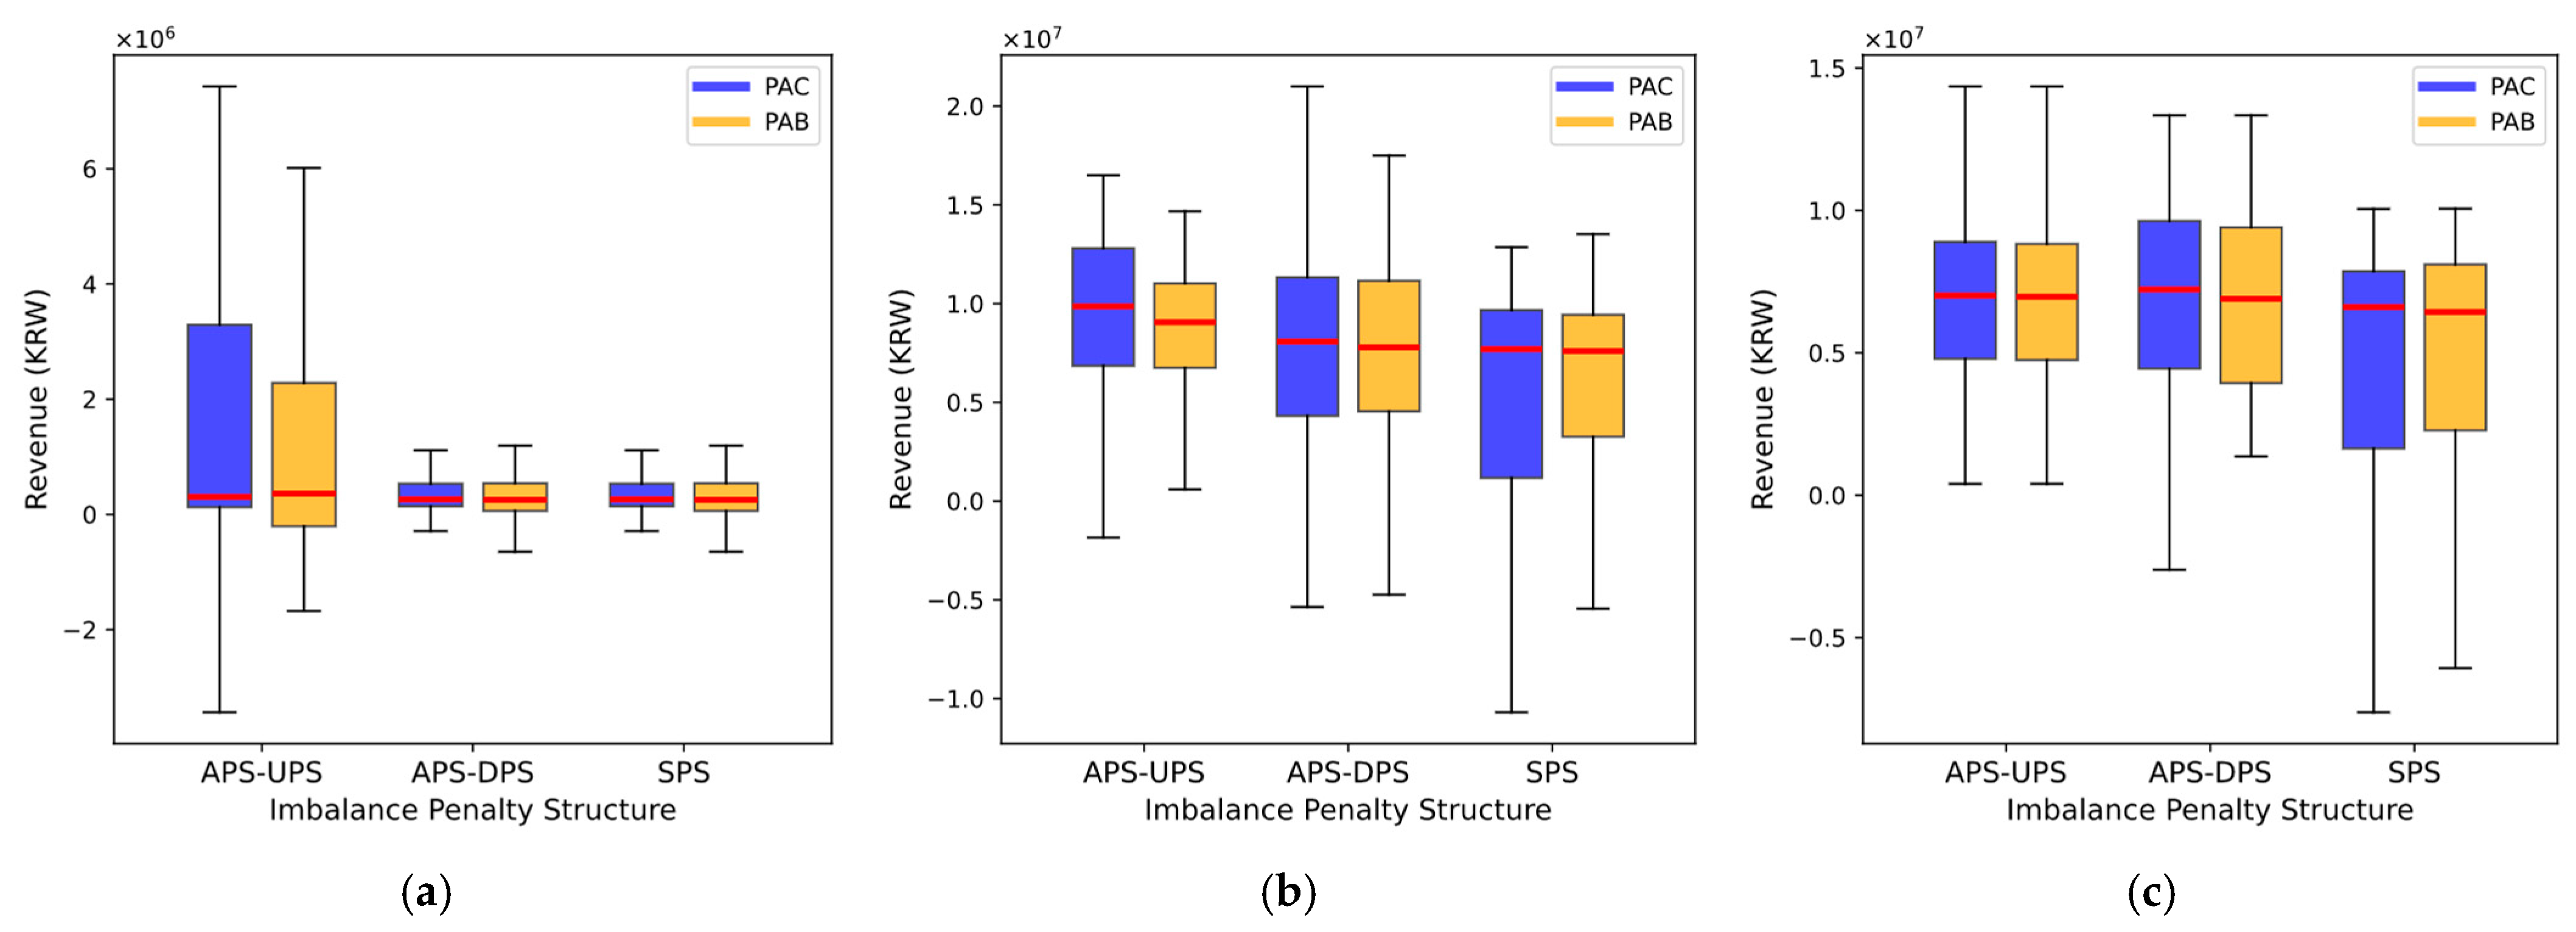
4.2.3. Revenue and Power Generation
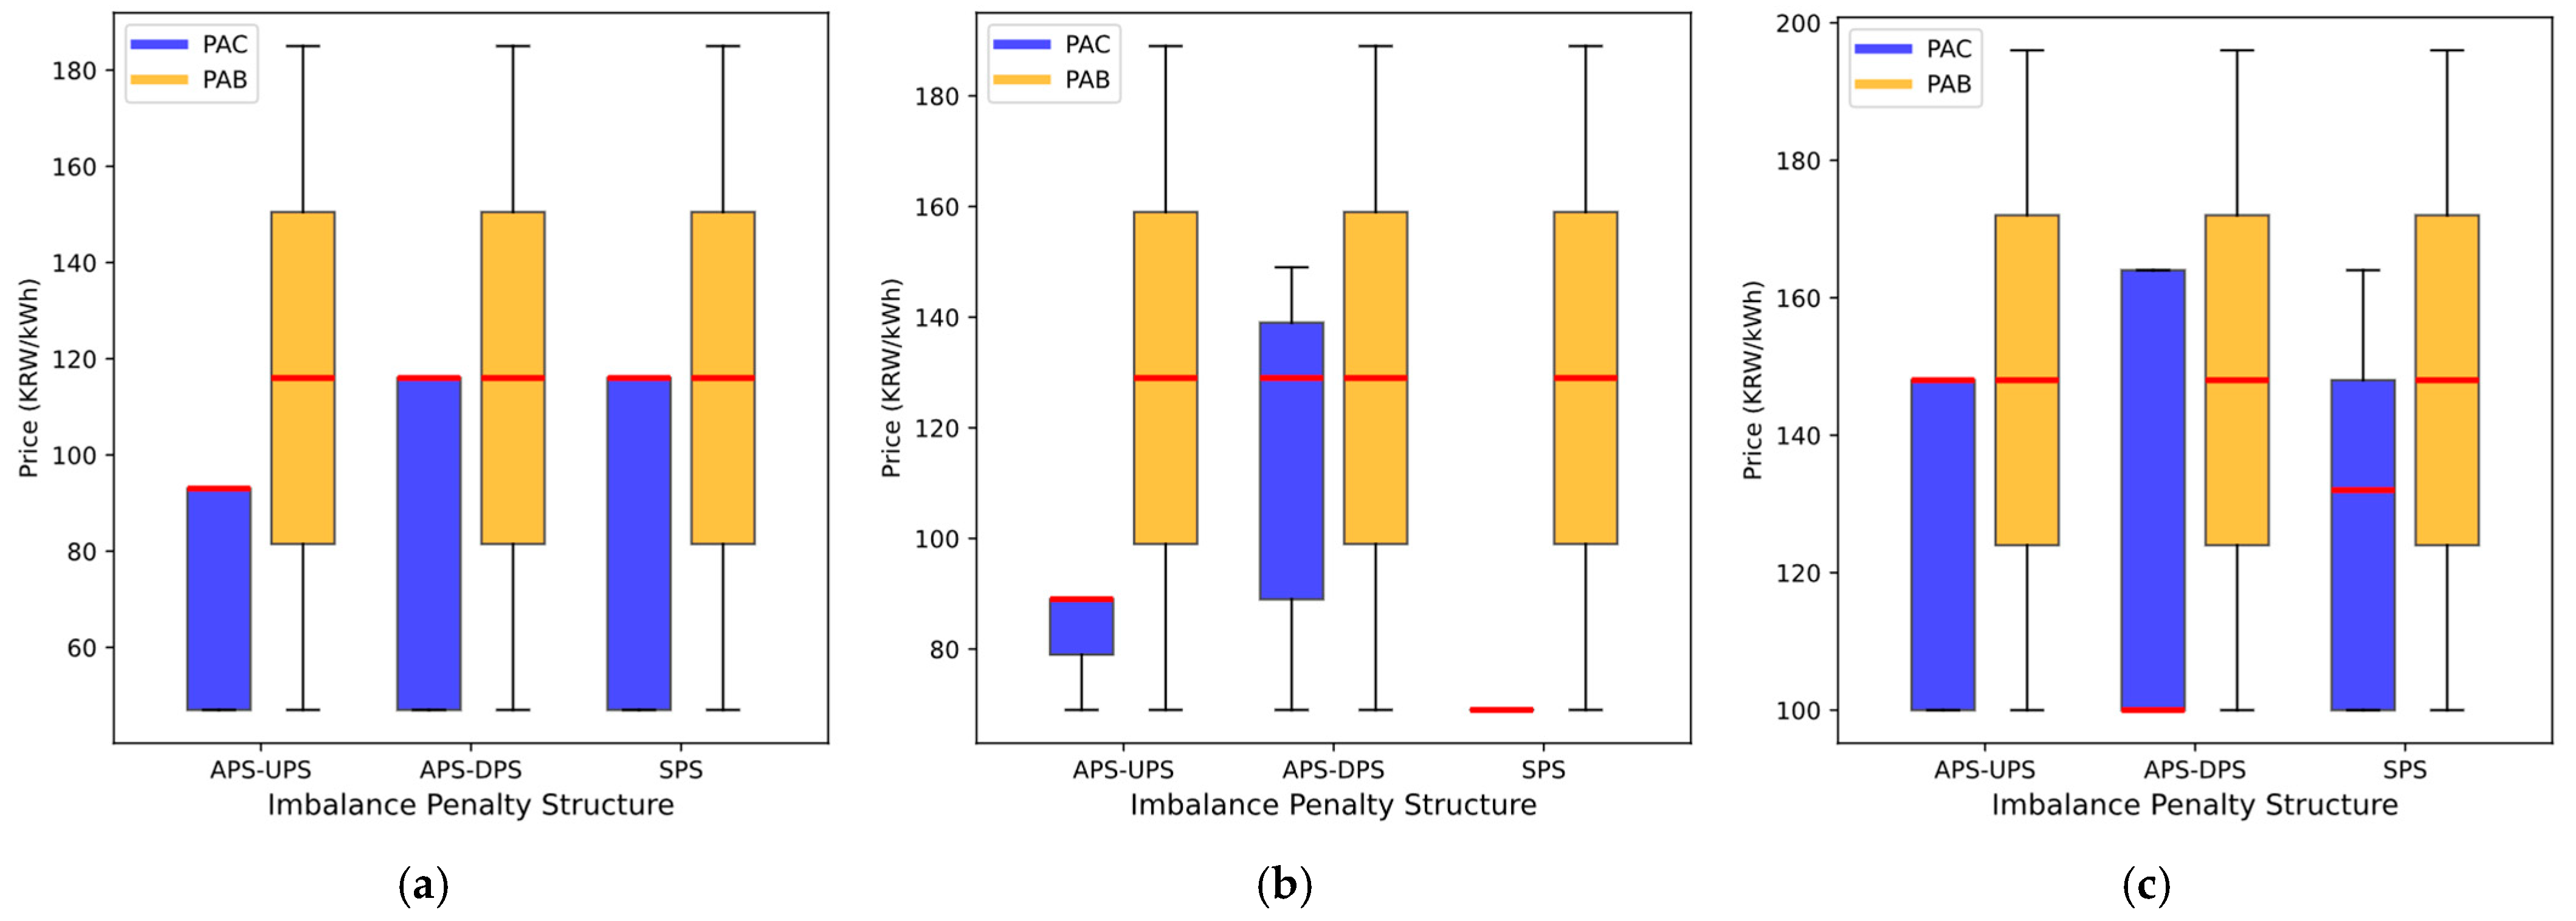
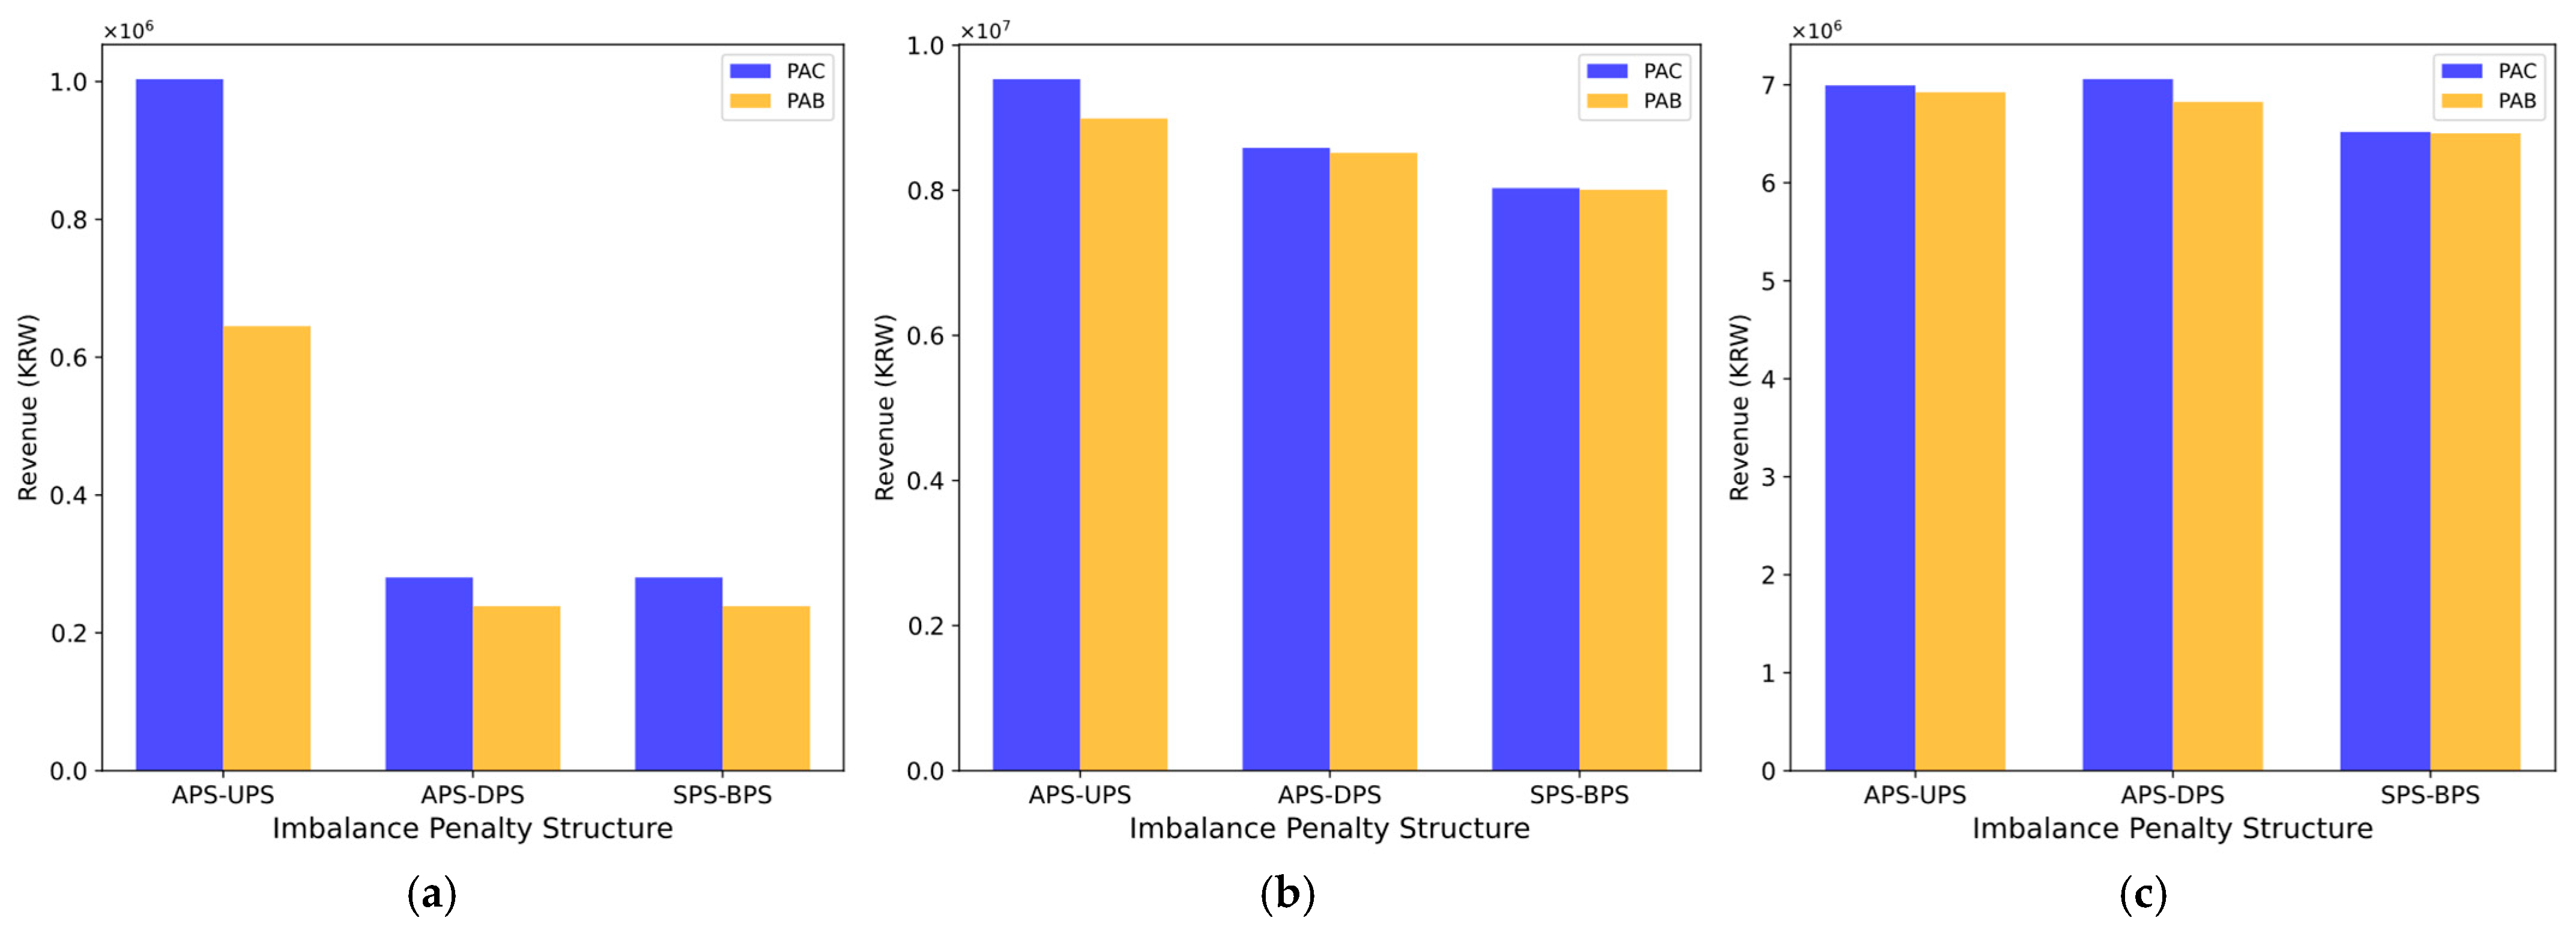
The PAC mechanism typically results in higher or equal revenue in electricity markets than the PAB mechanism. PAC market participants are permanently settled at the SMP, while PAB participants are settled based on their bid prices, which are generally lower than the SMP. As illustrated in
Figure 12, the average revenue generated in the PAC market is consistently higher than that in the PAB market across all operational scenarios. On average, the revenue differences between the PAC and PAB markets were 21.82% in the morning, 2.26% at noon, and 1.50% at night.
However, as shown in
Figure 13, the revenue distribution under the PAB mechanism exhibits significantly smaller variability, leading to more stable and predictable financial outcomes. This stability is particularly crucial during high- and moderate-generation output periods, where the PAC market often experiences greater revenue volatility. Such volatility arises from aggressive or conservative bidding strategies influenced by imbalance penalty structures. In contrast, the structured, stepwise bidding strategy employed in PAB markets reduces revenue variability, effectively mitigating the risks associated with market fluctuations.
An exception to this trend occurs during periods of low generation, such as morning hours, when the revenue distribution in the PAC market narrows due to reduced variability in generation output. Nevertheless, the PAB mechanism demonstrates its ability to achieve comparable revenue levels during higher-generation scenarios while offering more stable revenue streams. In these scenarios, the time-averaged revenue range in the PAB market was 23.21% smaller under APS-UPS, 15.62% smaller under APS-DPS, and 19.46% smaller under SPS-BPS compared to the PAC market. This reduction highlights the trade-off between slightly lower revenues in the PAB market and the substantial benefits of reduced volatility and greater financial predictability.
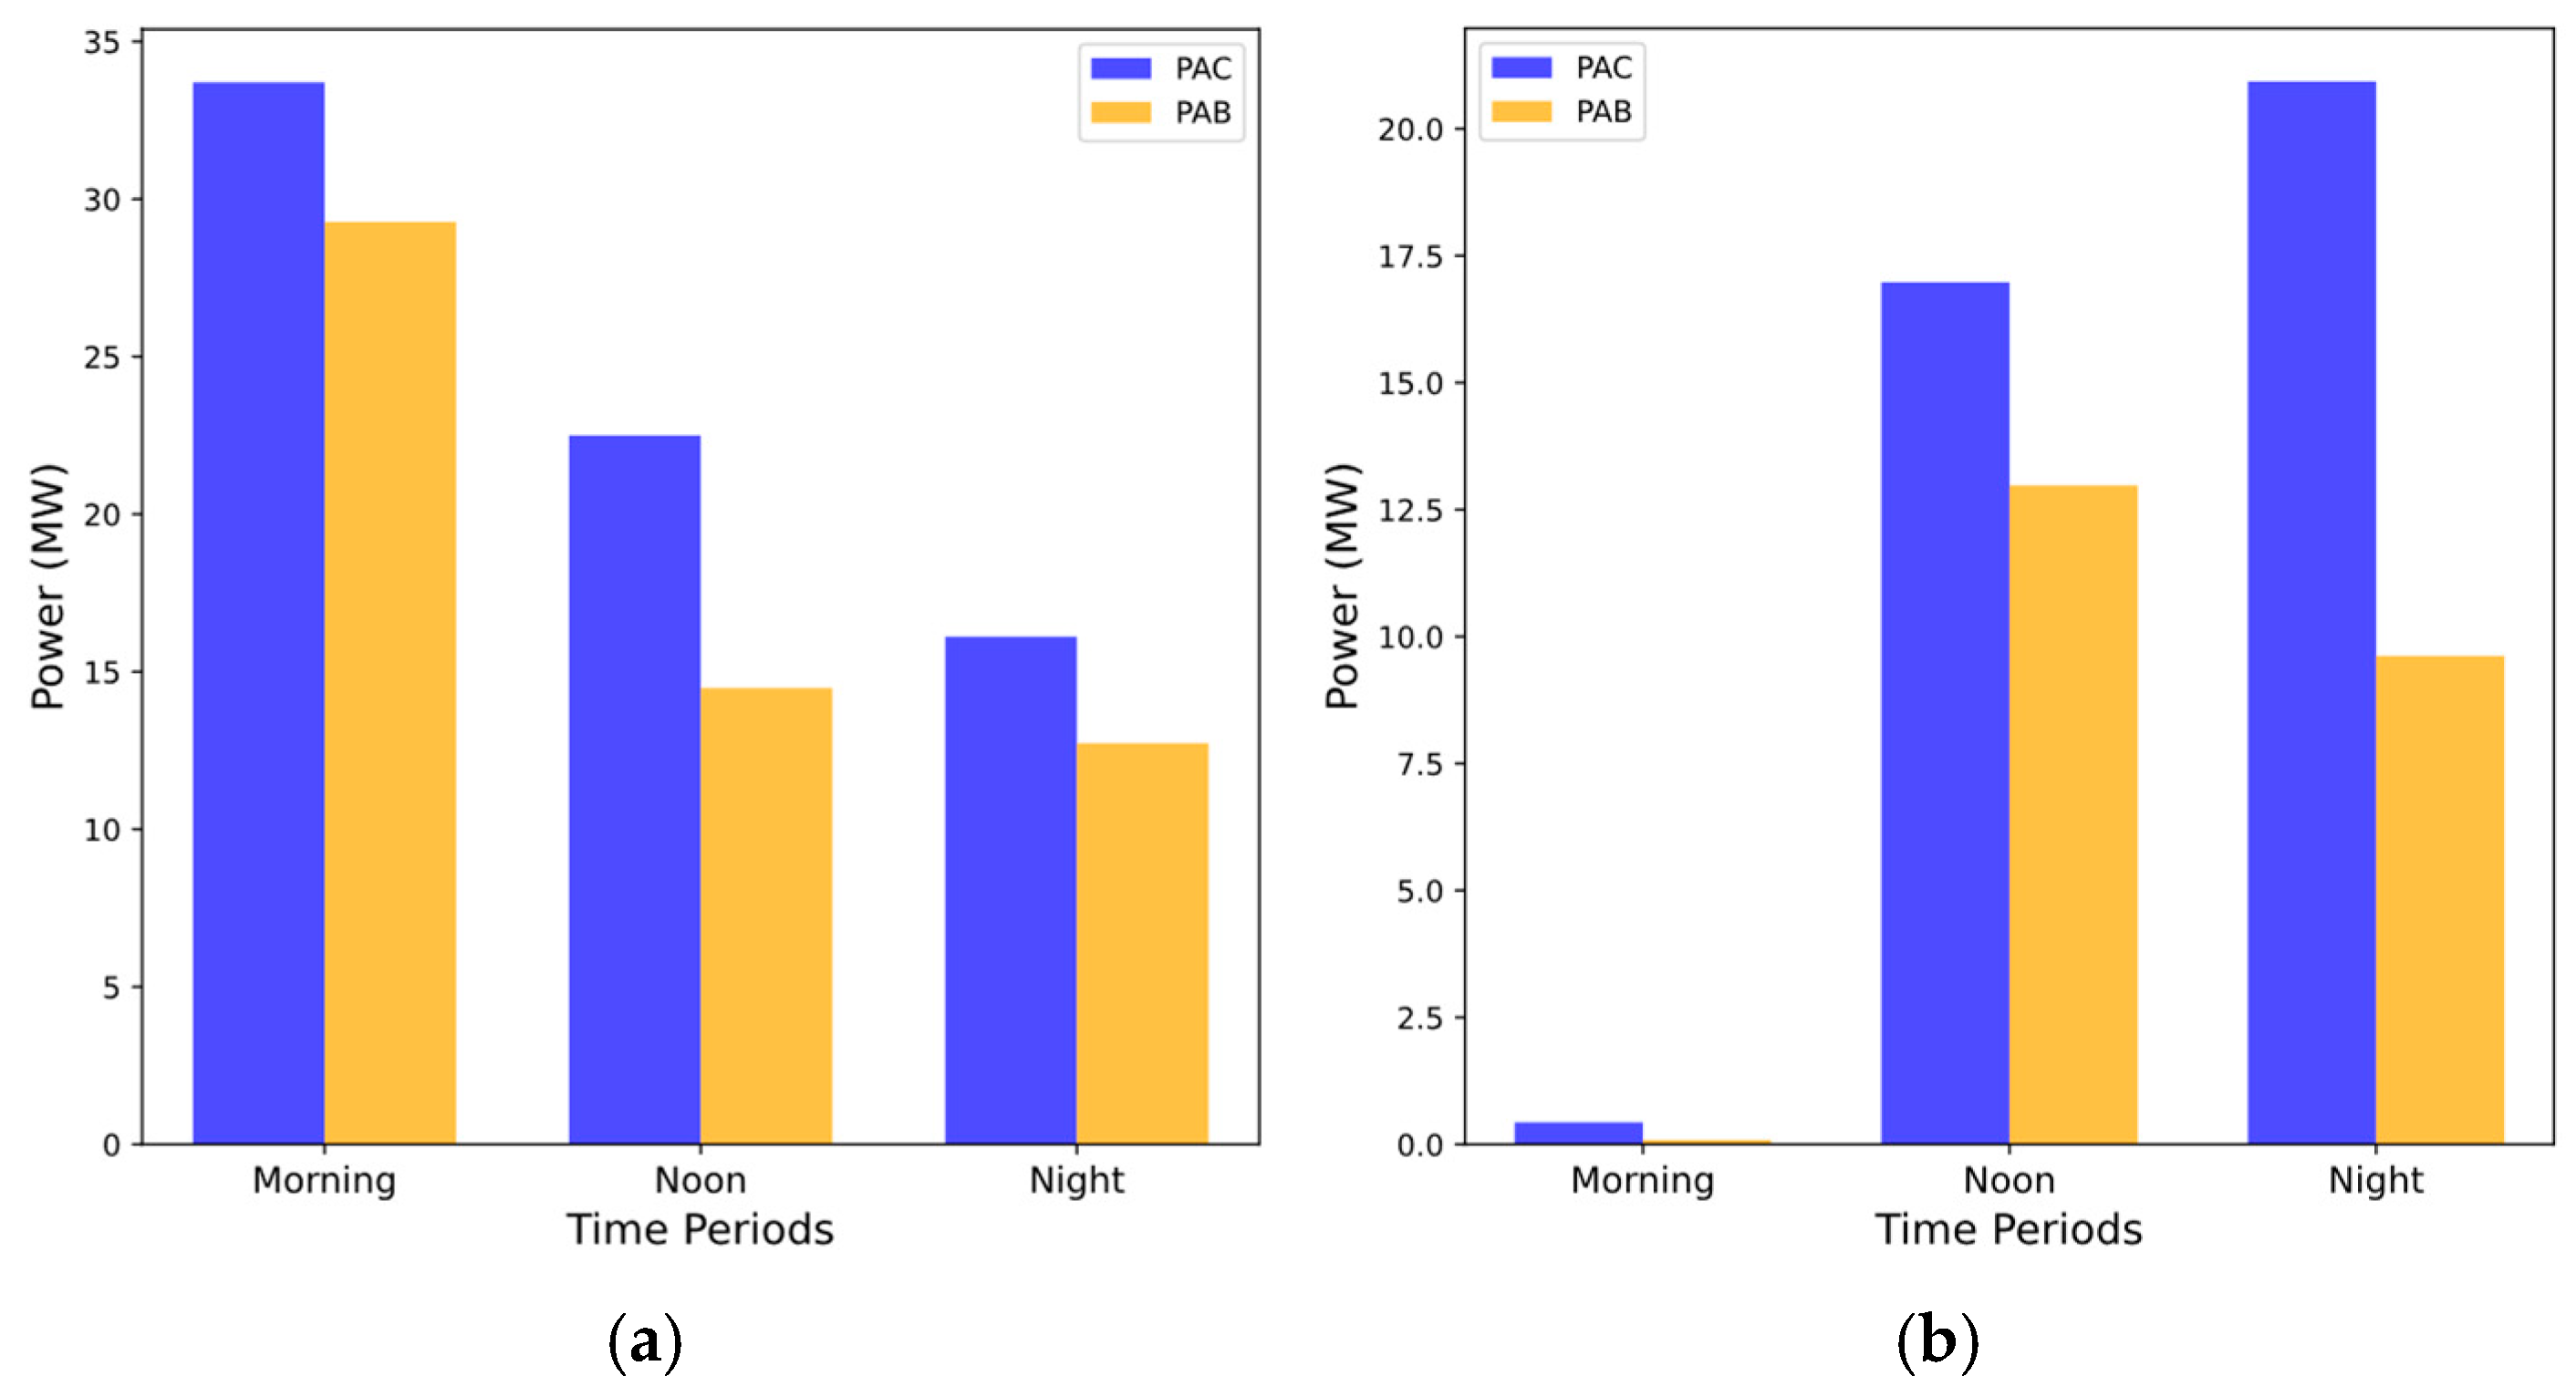
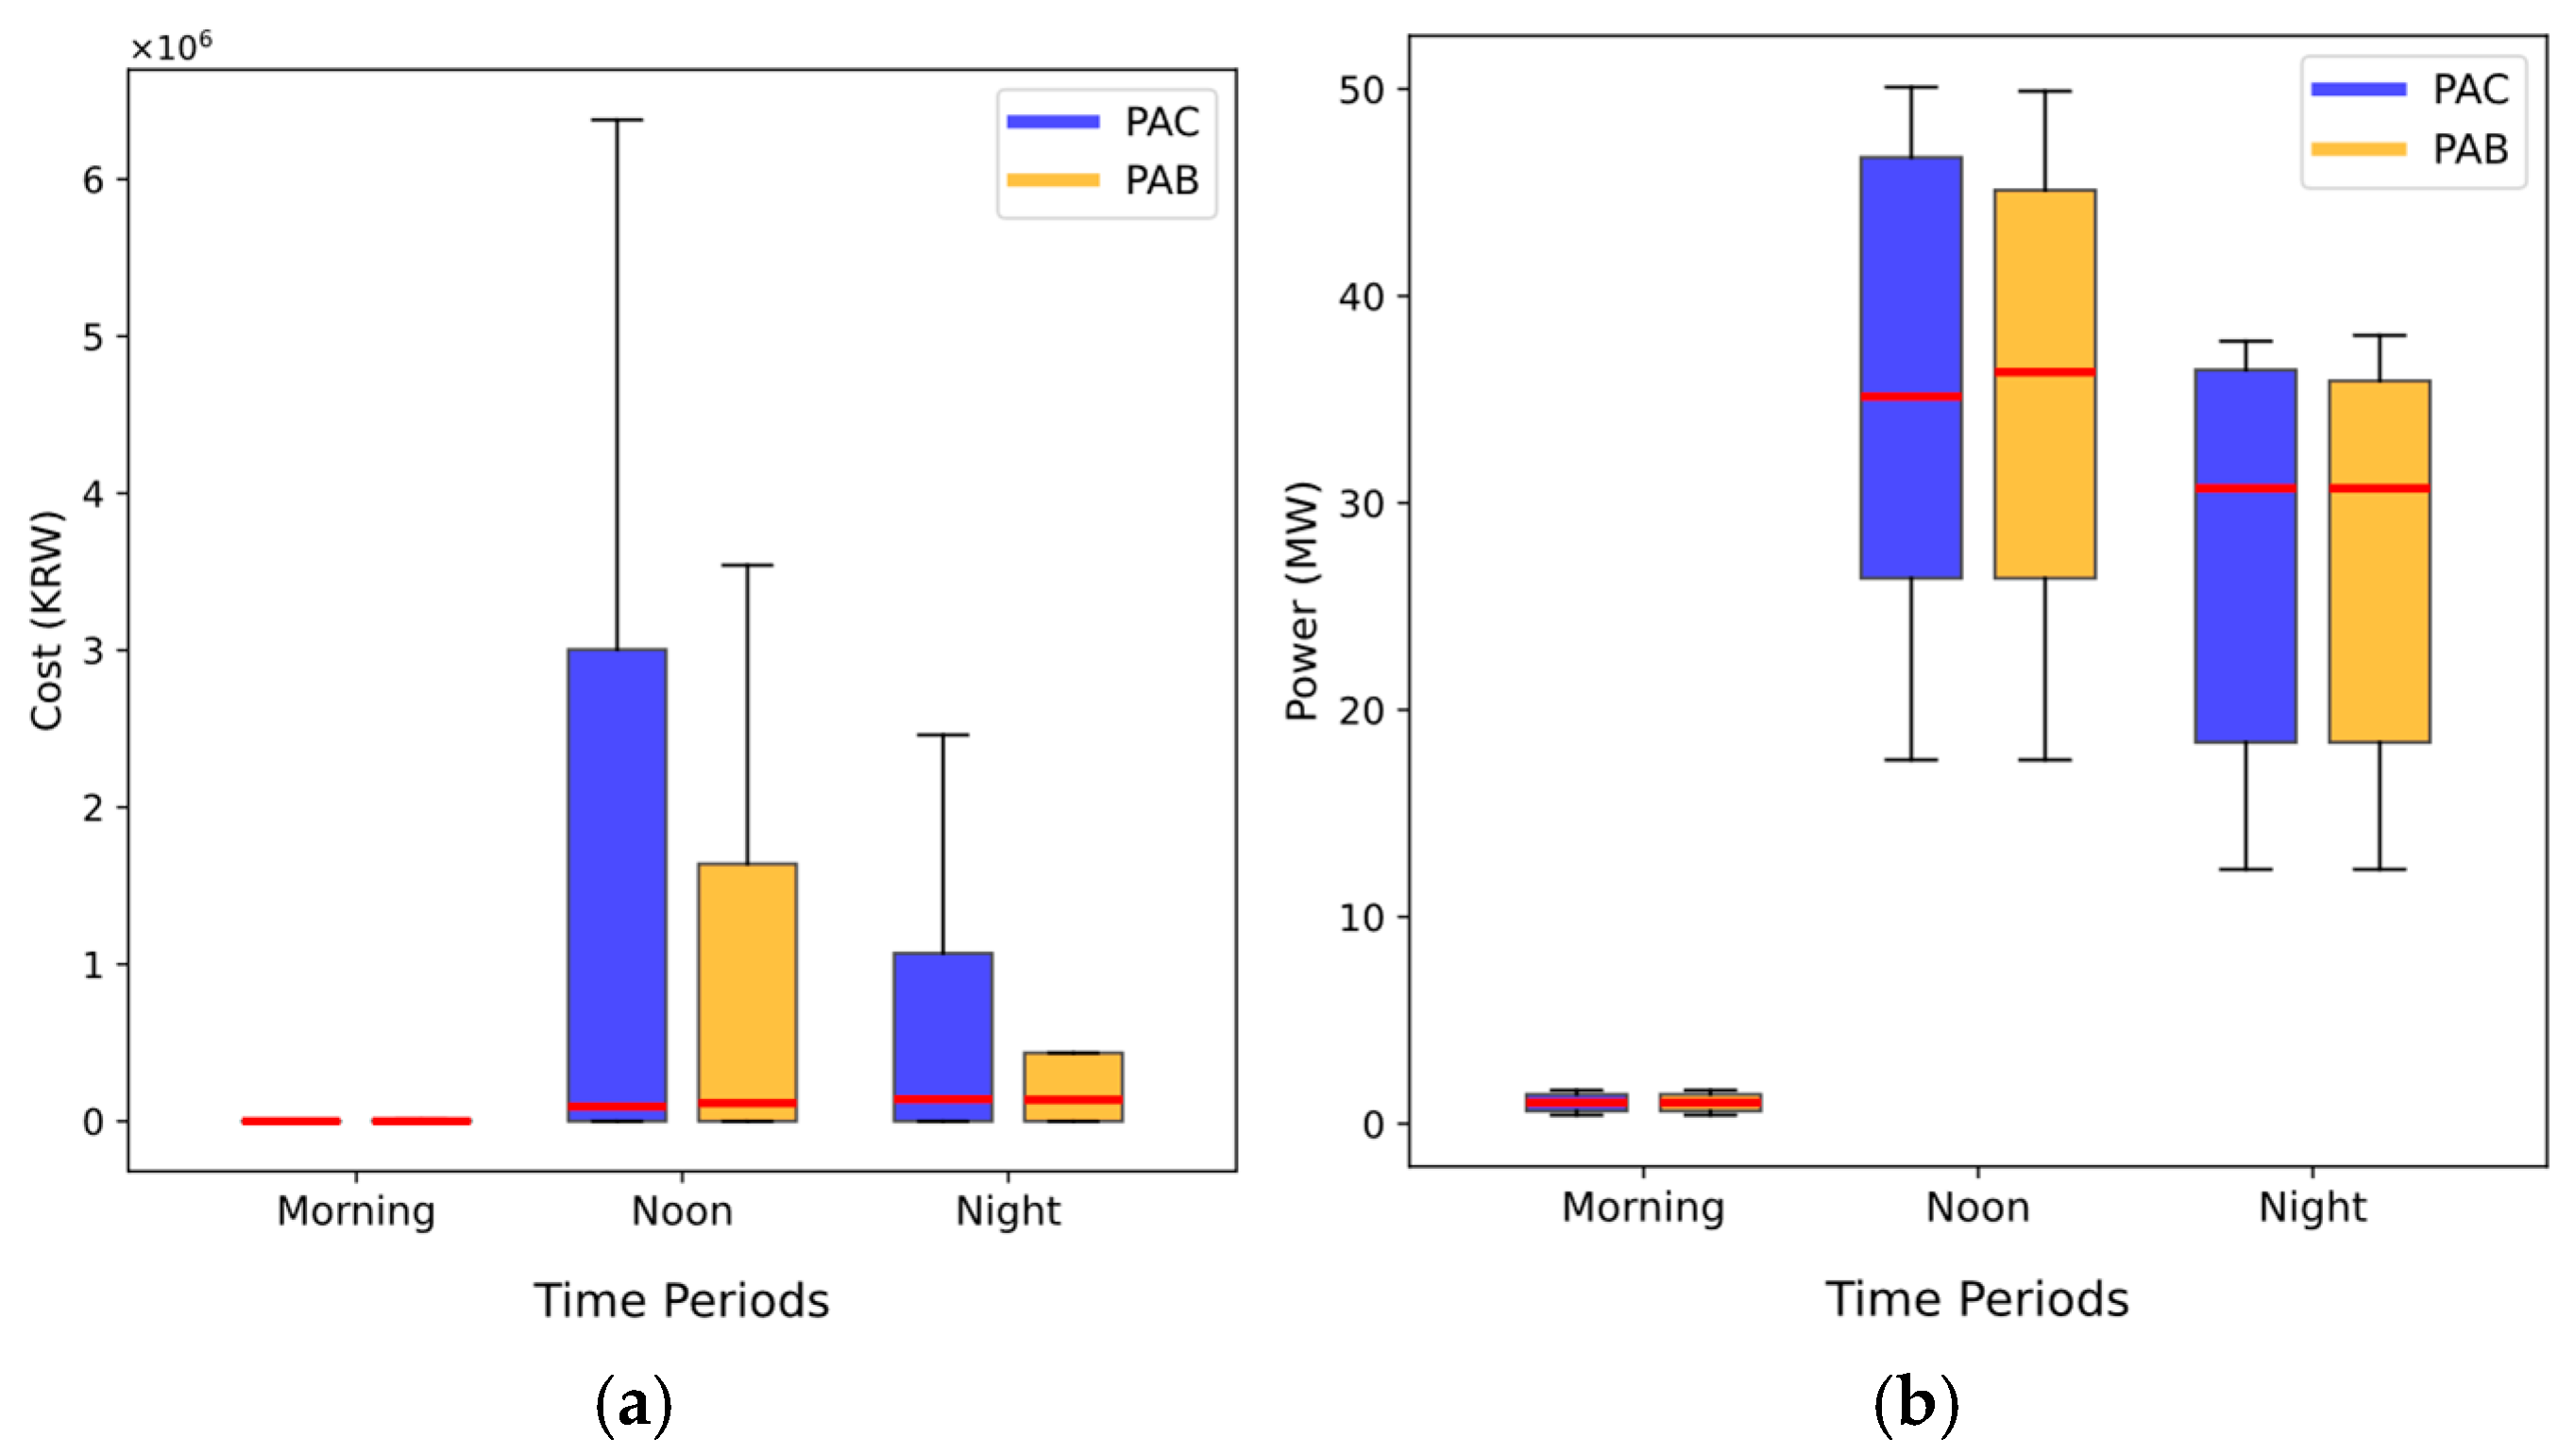
Additionally, when the SPS-BPS is applied—particularly during high- and moderate-generation periods—the PAB market effectively incurs lower imbalance penalty costs than the PAC market. As shown in
Figure 14a, the penalty cost range in the PAB market is smaller, being, on average, 44.48% lower at noon and 82.32% lower at night compared to the PAC market. This demonstrates that the penalty costs are generally lower in the PAB market, resulting in more efficient and stable market operations.
The PAB mechanism reduces penalty costs and promotes stable renewable energy utilization by enabling the VPP to operate more consistently at higher generation levels. This trend is evident in
Figure 14b, where the smaller generation range in the PAB market indicates a more stable power output. Furthermore, during periods of high generation, such as noon, the median power generation in the PAB market was 1.18 MW higher than in the PAC market. Notably, this suggests that the PAB market achieves these outcomes without relying on increased curtailment to reduce penalties, thereby enhancing the effective and consistent utilization of renewable energy resources.
5. Discussion
Selecting an auction mechanism has been a key focus in electricity market design, particularly as markets adapt to increasing shares of DERs. Previous studies [
15,
16,
17,
18,
19,
20,
21] have extensively debated the relative advantages and disadvantages of PAC and PAB mechanisms, with differing conclusions depending on market conditions. However, in markets with high penetrations of DERs, recent analyses [
18,
19,
20,
21] increasingly support PAB as a more effective mechanism than PAC, particularly in mitigating market price volatility, minimizing manipulation risks, and reducing support costs. The findings of this study align with these perspectives, reinforcing the argument that PAB offers greater stability and efficiency in renewable-integrated electricity markets.
RESs, such as wind and solar, inherently introduce significant variability and uncertainty into power generation due to their dependence on weather conditions. The PAB mechanism effectively addresses these challenges by incentivizing a more refined and disciplined bidding strategy. By encouraging the VPP to submit more bid segments, the PAB mechanism fosters a stepwise bidding structure, stabilizing the awarded price and ensuring closer alignment with the market-clearing price. This structured approach enhances predictability, providing market operators with a more reliable indicator for market operations. By reducing uncertainty, the PAB mechanism benefits market operators and participants through a more transparent market environment.
The analysis of power deviations further underscores the advantages of the PAB mechanism in supporting VPP participation through bidding behavior that prevents market disruptions. Unlike the PAC mechanism, where the uniform settlement price often fails to discourage extreme or speculative bidding strategies, the PAB mechanism promotes a more accurate and balanced bidding behavior. This leads to more minor power deviations under APS-UPS and APS-DPS penalty structures. The reduced deviations between market bids and real-time generation improve overall market stability, ensuring that generation schedules are feasible and consistent, even under variable operating conditions.
The revenue results highlight the PAB mechanism’s critical role in enhancing revenue stability. While the PAC mechanism can achieve higher revenues in some scenarios due to settlement at the clearing price, this comes at the cost of substantial revenue volatility. Such volatility arises from the PAC mechanism’s reliance on the clearing price, combined with bid strategies that are less adaptive to market operations. In contrast, the PAB mechanism demonstrates more stable revenue distributions, offering VPPs more excellent financial stability.
Moreover, the PAB mechanism can reduce imbalance penalties, with penalty cost ranges being consistently smaller than those observed in PAC mechanism. This reduction is achieved without relying on increased curtailment, optimizing renewable energy utilization. The PAB mechanism enables VPPs to sustain consistent generation levels, particularly in high- and moderate-generation scenarios. In these cases, revenue differences between PAC and PAB markets are minimal, demonstrating the PAB mechanism’s ability to balance power efficiency with financial performance.
By promoting price predictability, market stability, revenue stability, and the efficient integration of RESs, the PAB mechanism is a superior choice for electricity markets with high renewable energy penetration. Its ability to reduce power deviations, stabilize market operations, and support sustainable financial outcomes makes it a suitable choice for renewable-focused energy systems.
Furthermore, this study has accounted for the diverse imbalance penalty structures implemented across different electricity markets, ensuring that the analysis reflects the broad scalability of the PAB mechanism. By incorporating these variations, this study demonstrates that PAB remains an effective and adaptable mechanism across different regulatory and market conditions, further strengthening its applicability in real-world electricity markets.
6. Conclusions
The discussion surrounding the PAC and PAB auction mechanisms in electricity markets remains ongoing. The PAC mechanism is widely adopted due to its computational simplicity and pricing transparency. However, in markets with high penetration of renewable energy, this study suggests that the PAB mechanism may offer significant advantages. Specifically, we examined the optimal bidding strategies of VPPs under PAC and PAB markets to analyze VPP bidding behavior, focusing on the effects of various imbalance penalty structures on market operations.
The results revealed that while the PAC market typically yields higher average revenue for VPPs due to its settlement at the market-clearing price, this benefit has significant drawbacks. The PAC mechanism introduced higher volatility in bidding behavior and greater exposure to power deviations, particularly under the APS. Aggressive or conservative bidding strategies often observed in the PAC market resulted in more significant power deviations and unpredictable revenue outcomes, challenging the market’s stability. Conversely, the PAB market encouraged more stable and disciplined bidding behavior through its stepwise bidding strategy. This approach effectively mitigated the impact of imbalance penalties, discouraged speculative bidding, and reduced market volatility. The PAB mechanism consistently led to lower imbalance penalties and more consistent power generation schedules, especially in high- and moderate-power-generation periods, enabling better utilization of renewable energy resources.
In conclusion, the findings suggest that while the PAC mechanism may provide slightly higher revenue opportunities, the PAB market offers substantial advantages in promoting market stability, supporting renewable energy integration, and fostering disciplined bidding behavior. These insights highlight the importance of designing and implementing appropriate auction mechanisms and penalty structures to enhance the effectiveness and reliability of electricity markets with high renewable energy shares.
Author Contributions
Conceptualization, Y.S. and Y.J.; methodology, Y.S. and Y.J.; formal analysis, Y.S. and Y.J.; writing—original draft preparation, Y.S., Y.C. and Y.J.; writing—review and editing, Y.Y.; visualization, Y.S.; supervision, Y.J.; funding acquisition, Y.J. All authors have read and agreed to the published version of the manuscript.
Funding
This work was supported by the Korea Institute of Energy Technology Evaluation and Planning (KETEP) grant funded by the Korean government (MOTIE) through Virtual Power Plant Integrated Platform for System Flexible Resource Service, Development ISO-DSO Cooperative System Operating System under No. RS-2023-00237679.
Data Availability Statement
Conflicts of Interest
The authors declare no conflicts of interest. The funders had no role in the design of the study; in the collection, analyses, or interpretation of data; in the writing of the manuscript; or in the decision to publish the results.
References
- International Energy Agency. Net Zero by 2050: A Roadmap for the Global Energy Sector; Revised Version, October 2021; International Energy Agency: Paris, France, 2021; Available online: https://www.iea.org/reports/net-zero-by-2050 (accessed on 14 January 2025).
- Ministry of Justice. Net Zero Carbon Strategy 2024. Ministry of Justice; 2024. Available online: https://www.gov.uk/guidance/ministry-of-justice-climate-change-and-sustainability (accessed on 14 January 2025).
- Naval, N.; Yusta, J.M. Virtual power plant models and electricity markets-A review. Renew. Sustain. Energy Rev. 2021, 149, 111393. [Google Scholar] [CrossRef]
- Roozbehani, M.M.; Heydarian-Forushani, E.; Hasanzadeh, S.; Elghali, S.B. Virtual power plant operational strategies: Models, markets, optimization, challenges, and opportunities. Sustainability 2022, 14, 12486. [Google Scholar] [CrossRef]
- Saboori, H.; Mohammadi, M.; Taghe, R. Virtual power plant (VPP), definition, concept, components and types. In Proceedings of the 2011 Asia-Pacific Power and Energy Engineering Conference, Wuhan, China, 25–28 March 2011. [Google Scholar] [CrossRef]
- Wang, Y.; Gao, W.; Qian, F.; Li, Y. Evaluation of economic benefits of virtual power plant between demand and plant sides based on cooperative game theory. Energy Convers. Manag. 2021, 238, 114180. [Google Scholar] [CrossRef]
- Borisoot, K.; Liemthong, R.; Srithapon, C.; Chatthaworn, R. Optimal energy management for virtual power plant considering operation and degradation costs of energy storage system and generators. Energies 2023, 16, 2862. [Google Scholar] [CrossRef]
- Abdelwahab, M.A.; ElAdany, M.M.; Elfar, M.H.; ElDesouky, A.A. Optimal Energy Management of VPP-Based Energy Storage Considering Renewable Energy Integration and EV Charging. In Proceedings of the 2024 25th International Middle East Power System Conference (MEPCON), Cairo, Egypt, 17–19 December 2024. [Google Scholar] [CrossRef]
- Wang, H.; Jia, Y.; Lai, C.S.; Li, K. Optimal virtual power plant operational regime under reserve uncertainty. IEEE Trans. Smart Grid 2022, 13, 2973–2985. [Google Scholar] [CrossRef]
- Wang, Q.; Wu, W.; Wang, B.; Wang, G.; Xi, Y.; Liu, H.; Wang, S.; Zhang, J. Asynchronous decomposition method for the coordinated operation of virtual power plants. IEEE Trans. Power Syst. 2022, 38, 767–782. [Google Scholar] [CrossRef]
- Minai, A.F.; Khan, A.A.; Bahn, K.; Ndiaye, M.F.; Alam, T.; Khargotra, R.; Singh, T. Evolution and role of virtual power plants: Market strategy with integration of renewable based microgrids. Energy Strategy Rev. 2024, 53, 101390. [Google Scholar] [CrossRef]
- Li, W. The Virtual Power Plant Bidding Strategy Model based on Multi-stage Semi-anticipativity Distributionally Robust Optimization. Electr. Power Syst. Res. 2024, 237, 111015. [Google Scholar] [CrossRef]
- Dimitriadis, C.N.; Tsimopoulos, E.G.; Georgiadis, M.C. A review on the complementarity modelling in competitive electricity markets. Energies 2021, 14, 7133. [Google Scholar] [CrossRef]
- Klyve, Ø.S.; Klæboe, G.; Nygård, M.M.; Marstein, E.S. Limiting imbalance settlement costs from variable renewable energy sources in the Nordics: Internal balancing vs. balancing market participation. Appl. Energy 2023, 350, 121696. [Google Scholar] [CrossRef]
- Ahlqvist, V.; Holmberg, P.; Tangerås, T. A survey comparing centralized and decentralized electricity markets. Energy Strategy Rev. 2022, 40, 100812. [Google Scholar] [CrossRef]
- Guerci, E.; Rastegar, M.A. Comparing system-marginal-price versus pay-as-bid auctions in a realistic electricity market scenario. In Managing Market Complexity: The Approach of Artificial Economics; Springer: Berlin/Heidelberg, Germany, 2012; Volume 1, pp. 141–153. [Google Scholar] [CrossRef]
- Cramton, P.; Stoft, S. Why we need to stick with uniform-price auctions in electricity markets. Electr. J. 2007, 20, 26–37. [Google Scholar] [CrossRef]
- Zhao, D.; Botterud, A.; Ilic, M. Uniform Pricing vs Pay as Bid in 100%-Renewables Electricity Markets: A Game-theoretical Analysis. In Proceedings of the 14th ACM International Conference on Future Energy Systems, Orlando, FL, USA, 20–23 June 2023. [Google Scholar] [CrossRef]
- Banaei, M.; Raouf-Sheybani, H.; Oloomi-Buygi, M.; Boudjadar, J. Impacts of large-scale penetration of wind power on day-ahead electricity markets and forward contracts. Int. J. Electr. Power Energy Syst. 2021, 125, 106450. [Google Scholar] [CrossRef]
- Fabra, N. Reforming European electricity markets: Lessons from the energy crisis. Energy Econ. 2023, 126, 106963. [Google Scholar] [CrossRef]
- Anatolitis, V.; Welisch, M. Putting renewable energy auctions into action—An agent-based model of onshore wind power auctions in Germany. Energy Policy 2017, 110, 394–402. [Google Scholar] [CrossRef]
- Díaz-González, F.; Sumper, A.; Gomis-Bellmunt, O.; Villafáfila-Robles, R. A review of energy storage technologies for wind power applications. Renew. Sustain. Energy Rev. 2012, 16, 2154–2171. [Google Scholar] [CrossRef]
- Matthäus, D. Designing effective auctions for renewable energy support. Energy Policy 2020, 142, 111462. [Google Scholar] [CrossRef]
- Anıl, H.; Kar, G. Reducing the Imbalance Penalty through Artificial Intelligence Methods Geothermal Production Forecasting: A Case Study for Turkey. Int. J. Energy Power Eng. 2023, 17, 205–216. [Google Scholar] [CrossRef]
- Kaur, A.; Nonnenmacher, L.; Pedro, H.T.; Coimbra, C.F. Benefits of solar forecasting for energy imbalance markets. Renew. Energy 2016, 86, 819–830. [Google Scholar] [CrossRef]
- Wan, Y.H.; Milligan, M.; Kirby, B. Impact of Energy Imbalance Tariff on Wind Energy; No. NREL/CP-500-40663; National Renewable Energy Lab. (NREL): Golden, CO, USA, 2007. [Google Scholar]
- Gupta, A.K.; Kiran, D.; Abhyankar, A.R. Towards efficient real-time deviation settlement mechanism for the Indian grid. IET Gener. Transm. Distrib. 2020, 14, 308–315. [Google Scholar] [CrossRef]
- Zhang, Q.; Wu, X.; Deng, X.; Huang, Y.; Li, C.; Wu, J. Bidding strategy for wind power and Large-scale electric vehicles participating in Day-ahead energy and frequency regulation market. Appl. Energy 2023, 341, 121063. [Google Scholar] [CrossRef]
- Xie, X.; Zhang, S. Game-theoretic Model of Day-ahead Electricity Market Considering Penalties for Retailers’ Bid Deviations. In Proceedings of the 2022 IEEE 5th International Electrical and Energy Conference, Nangjing, China, 27–29 May 2022. [Google Scholar] [CrossRef]
- Kakimoto, M.; Endoh, Y.; Shin, H.; Ikeda, R.; Kusaka, H. Probabilistic solar irradiance forecasting by conditioning joint probability method and its application to electric power trading. IEEE Trans. Sustain. Energy 2018, 10, 983–993. [Google Scholar] [CrossRef]
- Zhang, Z.; Wang, X.; Zhang, S. Equilibrium Analysis of the Electricity Market Considering Strategic Bidding by Coalition of Renewable Energy and Energy Storage. In Proceedings of the 2023 8th International Conference on Power and Renewable Energy, Shanghai, China, 22–25 September 2023. [Google Scholar] [CrossRef]
- Song, Y.; Chae, M.; Chu, Y.; Yoon, Y.; Jin, Y. Impact of Penalty Structures on Virtual Power Plants in a Day-Ahead Electricity Market. Energies 2024, 17, 6042. [Google Scholar] [CrossRef]
- Lei, X.; Yu, H.; Zhong, J.; Jia, Y.; Shao, Z.; Jian, L. Exploring electric vehicle’s potential as capacity reservation through V2G operation to compensate load deviation in distribution systems. J. Clean. Prod. 2024, 451, 141997. [Google Scholar] [CrossRef]
- Yang, X.; Fan, L.; Li, X.; Meng, L. Day-ahead and real-time market bidding and scheduling strategy for wind power participation based on shared energy storage. Electr. Power Syst. Res. 2023, 214, 108903. [Google Scholar] [CrossRef]
- NESO. Electricity Markets Explained. Available online: https://www.neso.energy/what-we-do/energy-markets/electricity-markets-explained (accessed on 14 January 2025).
- Mercato Elettrico. Electricity and Green Certificates. Available online: https://www.mercatoelettrico.org/en-us/Home/Consultations/Markets/ElectricMarket/ElectricityAndGreenCertificates (accessed on 14 January 2025).
- Bassy Navarro, Á. Viability and Participation Model in Balancing Markets with Wind Assets in Germany. Master’s Thesis, Comillas Pontifical University, Madrid, Spain, July 2024. [Google Scholar]
- Scrocca, A.; Bovera, F.; Rancilio, G.; Delfanti, M. Exploring the True Potential of Battery Revenues Stacking in Europe: A Comparison of Italian and German Electricity Spot Markets. SSRN 2024. [Google Scholar] [CrossRef]
- Raihan, M.T. Energy policy, Technical and Economic Assessment of a 20 MW CSP project in Sevilla, Spain. Authorea 2024. [Google Scholar] [CrossRef]
- Holttinen, H.; Miettinen, J.J.; Couto, A.; Algarvio, H.; Rodrigues, L.; Estanqueiro, A. Wind power producers in shorter gate closure markets and balancing markets. In Proceedings of the 2016 13th International Conference on the European Energy Market, Porto, Portugal, 6–9 June 2016. [Google Scholar] [CrossRef]
- Khodadadi, A.; Herre, L.; Shinde, P.; Eriksson, R.; Söder, L.; Amelin, M. Nordic balancing markets: Overview of market rules. In Proceedings of the 2020 17th International Conference on the European Energy Market, Stockholm, Sweden, 16–18 September 2020. [Google Scholar] [CrossRef]
- Lei, X.; Yu, H.; Shao, Z.; Jian, L. Optimal bidding and coordinating strategy for maximal marginal revenue due to V2G operation: Distribution system operator as a key player in China’s uncertain electricity markets. Energy 2023, 283, 128354. [Google Scholar] [CrossRef]
- PJM. PJM Manual 11: Energy & Ancillary Services Market Operations. Available online: https://www.pjm.com/library/manuals (accessed on 14 January 2025).
- Algarvio, H.; Couto, A.; Estanqueiro, A. A Double Pricing and Penalties “Separated” Imbalance Settlement Mechanism to Incentive Self Balancing of Market Parties. In Proceedings of the 2024 20th International Conference on the European Energy Market, Istanbul, Türkiye, 10–12 June 2024. [Google Scholar] [CrossRef]
- Capper, T.; Kuriakose, J.; Sharmina, M. Impact of energy imbalance on financial rewards in peer-to-peer electricity markets. IEEE Access 2022, 10, 55235–55254. [Google Scholar] [CrossRef]
- Clò, S.; Fumagalli, E. The effect of price regulation on energy imbalances: A Difference in Differences design. Energy Econ. 2019, 81, 754–764. [Google Scholar] [CrossRef]
- Narajewski, M. Probabilistic forecasting of German electricity imbalance prices. Energies 2022, 15, 4976. [Google Scholar] [CrossRef]
- Nieminen, S. The Effect from Wind Power Forecast Error on Short-Term Electricity Market. Master’s Thesis, Aalto University, Espoo, Finland, November 2023. [Google Scholar]
- Wu, Z.; Zhou, M.; Zhang, T.; Li, G.; Zhang, Y.; Liu, X. Imbalance settlement evaluation for China’s balancing market design via an agent-based model with a multiple criteria decision analysis method. Energy Policy 2020, 139, 111297. [Google Scholar] [CrossRef]
- Matsumoto, T.; Bunn, D.; Yamada, Y. Mitigation of the inefficiency in imbalance settlement designs using day-ahead prices. IEEE Trans. Power Syst. 2021, 37, 3333–3345. [Google Scholar] [CrossRef]
- Hyun, S.; Kim, G.; Park, J.; Choi, Y. Optimal Virtual Power Plant Control Algorithm Considering the Electrical Characteristics of Distributed Energy Resources. Appl. Sci. 2024, 15, 127. [Google Scholar] [CrossRef]
- Korea Power Exchange. Renewable Energy Curtailment Statistics. Available online: https://www.kpx.or.kr (accessed on 14 January 2025).
- Shinde, P.; Kouveliotis-Lysikatos, I.; Amelin, M. Multistage stochastic programming for vpp trading in continuous intraday electricity markets. IEEE Trans. Sustain. Energy 2022, 13, 1037–1048. [Google Scholar] [CrossRef]
- Nguyen, H.T.; Le, L.B.; Wang, Z. A bidding strategy for virtual power plants with the intraday demand response exchange market using the stochastic programming. IEEE Trans. Ind. Appl. 2018, 54, 3044–3055. [Google Scholar] [CrossRef]
- Wozabal, D.; Rameseder, G. Optimal bidding of a virtual power plant on the Spanish day-ahead and intraday market for electricity. Eur. J. Oper. Res. 2020, 280, 639–655. [Google Scholar] [CrossRef]
- Yang, Z.; Lin, W.; Qiu, F.; Yu, J.; Yang, G. Correct the piecewise linearization error of quadratic objective function in DC OPF model. IEEE Trans. Power Syst. 2019, 34, 5083–5086. [Google Scholar] [CrossRef]
- Mitsos, A.; Chachuat, B.; Barton, P.I. McCormick-based relaxations of algorithms. SIAM J. Optim. 2009, 20, 573–601. [Google Scholar] [CrossRef]
- He, M.; Soltani, Z.; Ghaljehei, M.; Esmaili, M.; Ma, S.; Chen, M.; Khorsand, M.; Ayyanar, R.; Vittal, V. A SOCP-based ACOPF for operational scheduling of three-phase unbalanced distribution systems and coordination of PV smart inverters. IEEE Trans. Power Syst. 2023, 39, 229–244. [Google Scholar] [CrossRef]
| Disclaimer/Publisher’s Note: The statements, opinions and data contained in all publications are solely those of the individual author(s) and contributor(s) and not of MDPI and/or the editor(s). MDPI and/or the editor(s) disclaim responsibility for any injury to people or property resulting from any ideas, methods, instructions or products referred to in the content. |
© 2025 by the authors. Licensee MDPI, Basel, Switzerland. This article is an open access article distributed under the terms and conditions of the Creative Commons Attribution (CC BY) license (https://creativecommons.org/licenses/by/4.0/).


