Article

Study on the Deflagration Characteristics of Methane–Air Premixed Gas in Sudden Expansion Pipelines

1
School of Petroleum and Natural Gas Engineering, Changzhou University, Changzhou 213164, China
2
Jiangsu Key Laboratory of Oil-Gas & New-Energy Storage and Transportation Technology, Changzhou University, Changzhou 213164, China
3
Institute of Industrial Safety, China Academy of Safety Science and Technology, Beijing 100012, China
4
School of Overseas Education, Changzhou University, Changzhou 213164, China
5
School of Materials Engineering, Changshu Institute of Technology, Suzhou 215500, China
6
Tianjin Fire Research Institute of MEM, Tianjin 300381, China
*
Author to whom correspondence should be addressed.
Energies 2025, 18(5), 1301; https://doi.org/10.3390/en18051301
Submission received: 15 February 2025 / Revised: 1 March 2025 / Accepted: 4 March 2025 / Published: 6 March 2025
(This article belongs to the Section K: State-of-the-Art Energy Related Technologies)

Abstract

:
This study employs both experimental and numerical simulation methods to systematically investigate the influence of sudden expansion diameter ratios on methane–air premixed flame propagation, explosion overpressure, and the evolution of turbulent structures. The results show that with the increase in the diameter ratio, the flame propagation velocity and explosion overpressure present a nonlinear trend of first increasing, then decreasing, and then increasing. Specifically, when the diameter ratio is 1.5, an optimal balance between turbulence enhancement and energy dissipation is achieved, and the overpressure attenuation rate is 47.61%. However, when the diameter ratio increases to 2.0, the turbulence intensity significantly escalates, the peak flame propagation speed increases by 81%, the peak explosion overpressure increases by 69%, and the overpressure attenuation efficiency decreases, which brings greater safety challenges. Moreover, when the diameter ratio is between 1.5 and 2.0, the turbulence intensity of the premixed gas explosion flow field is significantly increased, and the stable “tulip flame” propagation velocity range is extended from 16~35 m/s to 16~42 m/s. When the diameter ratio is 2.0, a distinctive four-vortex structure is formed, with strong turbulent mixing and fast energy dissipation. The vortex structure evolves with the diameter ratio, transitioning from a symmetric and stable double-vortex form to a complex multi-vortex system. The research results provide theoretical support for the prevention of explosions.

1. Introduction

As the global economy continues to expand, the demand for fossil fuels is rising, leading to increased risks of fire and explosion hazards. By 2024, China’s natural gas consumption is projected to exceed 400 billion cubic meters, posing significant safety concerns. [1]. According to the National Gas Accident Analysis Annual Report, in the first half of 2024, there were 181 gas explosion accidents in China, of which 85 were determined to be methane explosions, accounting for 46.96% of the total explosion accidents [2]. Therefore, in order to mitigate and prevent natural gas explosions [3,4], it is crucial to investigate flame propagation behavior in complex pipeline systems.
In practical scenarios, pipeline configurations are often highly intricate. Understanding how variations in pipeline structure affect combustion and explosion processes is essential for developing preventive measures and controlling gas spread. Early investigations by Kuznetsov et al. [5] explored the effects of cross-sectional variations on flame acceleration. They revealed that, under variable cross-sectional conditions—compared to fixed-diameter pipelines—the critical mixture for strong flame acceleration shifts toward lower-energy mixtures, increasing the risk of gas explosions. Fan and Lu [6] conducted numerical simulations on the detonation process in variable cross-section hydrogen–air-reactive flows. Their results indicated that cross-sectional variations induce complex wave behaviors, with area changes and wave reflections producing extreme parameter values. Similarly, Zheng et al. [7], employing the high-precision Weighted Essentially Non-Oscillatory (WENO) method, demonstrated that gas explosions in variable cross-section pipelines exhibit greater intensity than those in pipelines with fixed cross-sections.
Building on these findings, Liu Ju bao et al. [8] performed numerical simulations to develop methods for calculating blast pressure drops in convergent–divergent circular pipes, proposing a pressure drop formula for variable cross-section structures. Wang et al. [9] examined the propagation of H2-CH4–air premixed flames in variable cross-section pipelines, observing that when the flame encounters a sudden pipeline change, the smooth flame front twists and folds. Higher cross-sectional change rates amplify flame disturbances and turbulence. Variable cross-section pipelines can both promote and inhibit flame propagation. Zhou Ning et al. [10] reported that vortex cluster formation and evolution in such pipelines play an excitatory role in flame propagation. Both protruding and continuous protruding pipes were shown to increase the peak flame propagation speed. Finally, Du et al. [11] concluded that compared to pipelines with constant cross-sections, variable cross-section pipelines require significantly lower minimum pressure for autoignition and substantially enhance the autoignition processes.
Initial conditions, including temperature, pressure, fuel composition, and concentration, play a fundamental role in shaping the explosion characteristics of premixed gasses and therefore remain a central topic of interest in combustion and explosion studies [12,13,14]. Li et al. [15] reported that an elevated initial temperature lowers the lower explosion limit of ventilation air methane, thereby significantly expanding the explosion hazard range, indicating that temperature enhances the chemical reactivity of premixed gasses. Yang et al. [16], in their study on confined methane–air explosions, found that increasing the initial pressure not only intensifies flame front wrinkling but also enhances the coupling between the propagating flame and pressure waves, leading to a substantial increase in both peak overpressure and pressure oscillations. This highlights the profound influence of initial pressure on flame propagation behavior and the evolution of the pressure field. Faghih et al. [17] further demonstrated that in methane–hydrogen mixtures, once the hydrogen volume fraction exceeds 70%, the maximum rate of pressure rise exhibits exponential growth, underscoring the critical role of fuel composition and concentration in controlling reaction intensity and explosion severity. Figueroa-Labastida et al. [18] observed that when the initial temperature increases from 550 K to 860 K, the laminar flame speed of methane–hydrogen mixtures increases significantly, further confirming that temperature, as a key initial condition, directly promotes the combustion dynamics of premixed gasses. Cui et al. [19] showed that the flammability limits of methane–air mixtures contract at low temperatures and expand significantly under higher pressures, revealing the coupled regulatory effect of temperature and pressure on flammability boundaries. Li et al. [20] further demonstrated that the combined effect of hydrogen addition and elevated initial pressure substantially enhances flame front instability and amplifies perturbations, ultimately accelerating flame propagation and significantly increasing explosion pressure. Collectively, these studies demonstrate that initial temperature, pressure, fuel composition, and concentration not only directly determine the explosion limits, flame propagation characteristics, and explosion intensity of premixed gasses, but also collectively influence flame instability and flame–pressure wave coupling processes, thereby systematically governing the overall dynamics of explosion propagation.
The behavior of premixed flames and their combustion–explosion characteristics in pipelines has been extensively studied. Clanet et al. [21] investigated the evolution of explosions and identified four typical stages of flame development in a half-open pipeline: a hemispherical flame, a finger flame, a long flame with the flame skirt touching the side walls, and a classic “tulip flame”. Xiao et al. [22] proposed a fifth stage—a distorted “tulip flame”—arising from the interaction between the flame and pressure waves. The formation mechanism of the “tulip flame” is highly complex, and considerable research has been devoted to understanding it. Markstein [23] demonstrated that the inversion of the flame front results from the interaction between the flame and pressure waves. However, subsequent experiments showed that pressure waves exert minimal influence on flame speed and are not decisive. Furthermore, numerous researchers [24,25,26] have introduced concepts such as flame instability, radial velocity gradients, and T-S waves, but no unified conclusion has been reached. Ponizy et al. [27], using PIV techniques, verified that the “tulip flame” is purely a hydrodynamic phenomenon, concluding that the intrinsic instabilities of the flame front (Rayleigh–Taylor, Richtmyer–Meshkov, or Darrieus–Landau) are unrelated to flame inversion.
During the deflagration of methane–air premixed gas in pipelines, several key risk factors are involved. First, explosion overpressure is a significant risk factor. During deflagration, pressure waves rapidly cause a sharp increase in the pressure inside the pipeline, especially when there are abrupt changes in the pipeline geometry. This overpressure effect can lead to pipeline structural failure, posing a severe threat to the safety of the pipeline system. Secondly, changes in flame propagation speed are also a critical risk factor. The speed of flame propagation within the pipeline is influenced by fuel concentration and pipeline geometry. In particular, in sudden expansion structures, the flame speed can change significantly, increasing the risk of flame instability and local extinction. Moreover, turbulence and vortex effects play a crucial role in the flame propagation process. A large diameter ratio or structural changes can induce strong turbulence, which not only intensifies the interaction between the flame and the flow field but may also lead to local overheating and unstable flame propagation.
Significant progress has been made in understanding gas cloud explosions, particularly in pipelines with uniform cross-sections. However, most existing studies primarily focus on single expansion ratios or simplified geometries, neglecting the systematic influence of sudden expansion structures with varying diameter ratios on flame propagation, overpressure evolution, and turbulence development in confined pipelines. The transition between flow separation, turbulence enhancement, and flame instability remains inadequately explored, despite its critical implications for explosion dynamics. Given the prevalence of sudden expansion structures in practical pipeline systems—such as natural gas transportation, underground gas storage, and chemical processing—where diameter variations frequently occur at pipe joints, reducers, and variable-diameter connections, a comprehensive investigation is urgently needed to bridge this gap. Understanding how these diameter ratios affect explosion dynamics is crucial for developing effective explosion mitigation strategies, optimizing pipeline design, and ensuring the safe operation of industrial facilities.
This study systematically examines the influence of sudden expansion structures with different diameter ratios (1.25, 1.5, 1.75, 2.0) on methane–air premixed gas deflagration, focusing on flame structure evolution, flame propagation characteristics, and explosion overpressure. These diameter ratios were selected based on their practical relevance in industrial pipeline systems, particularly in natural gas transmission, underground gas storage, chemical processing, and explosion safety engineering. Expansion sections in compressor stations, valve junctions, reactor pipelines, and venting ducts frequently feature sudden diameter changes, affecting local turbulence, pressure fluctuations, and combustion stability. Understanding these effects is crucial for mitigating explosion hazards in confined spaces, optimizing reactor pipeline designs, and improving explosion venting strategies. The findings reveal that sudden expansion structures induce a dual effect on the combustion process, initially suppressing it before subsequently enhancing it. Furthermore, the study highlights the significant role of sudden expansion structures in shaping “tulip flame” formation and turbulence characteristics. These insights advance the fundamental understanding of explosion dynamics in confined environments while providing theoretical guidance and practical directives for mitigating explosion hazards and optimizing industrial combustion systems. Ultimately, this research contributes to the safety, reliability, and operational efficiency of gas pipeline networks and industrial combustion facilities.

2. Experimental Setup and Methods

2.1. Experimental Setup

As shown in Figure 1, the experimental platform in this study consists of an experimental pipeline, a gas distribution system, a high-frequency dynamic data acquisition system, a vacuum pump, and a high-voltage ignition device. The explosion tube structure is 3 m long and consists of two transparent acrylic tubes. Each tube is 1500 mm long, with a wall thickness of 20 mm, and the cross-sectional dimensions are 120 × 120 mm and 80 × 80 mm, respectively. A T-series back-illuminated CMOS high-speed camera from York Technologies Inc., York, PA, USA was used, which was capable of recording up to 38,040 frames per second. The actual running speed is 3000 fps and the resolution is 800 × 600, meeting the experimental requirements. The data acquisition system primarily consists of a TST3406 dynamic test analyzer, a TST2107 ultra-dynamic resistance strain gauge, both from Chengdu Test Electronics Information Co., Ltd. (Chengdu, China) and a signal amplifier. In this experiment, the ignition occurs on the millisecond scale, with a sampling rate of 200 kHz, a data length of 2000 k, and a sampling delay of −100 k.
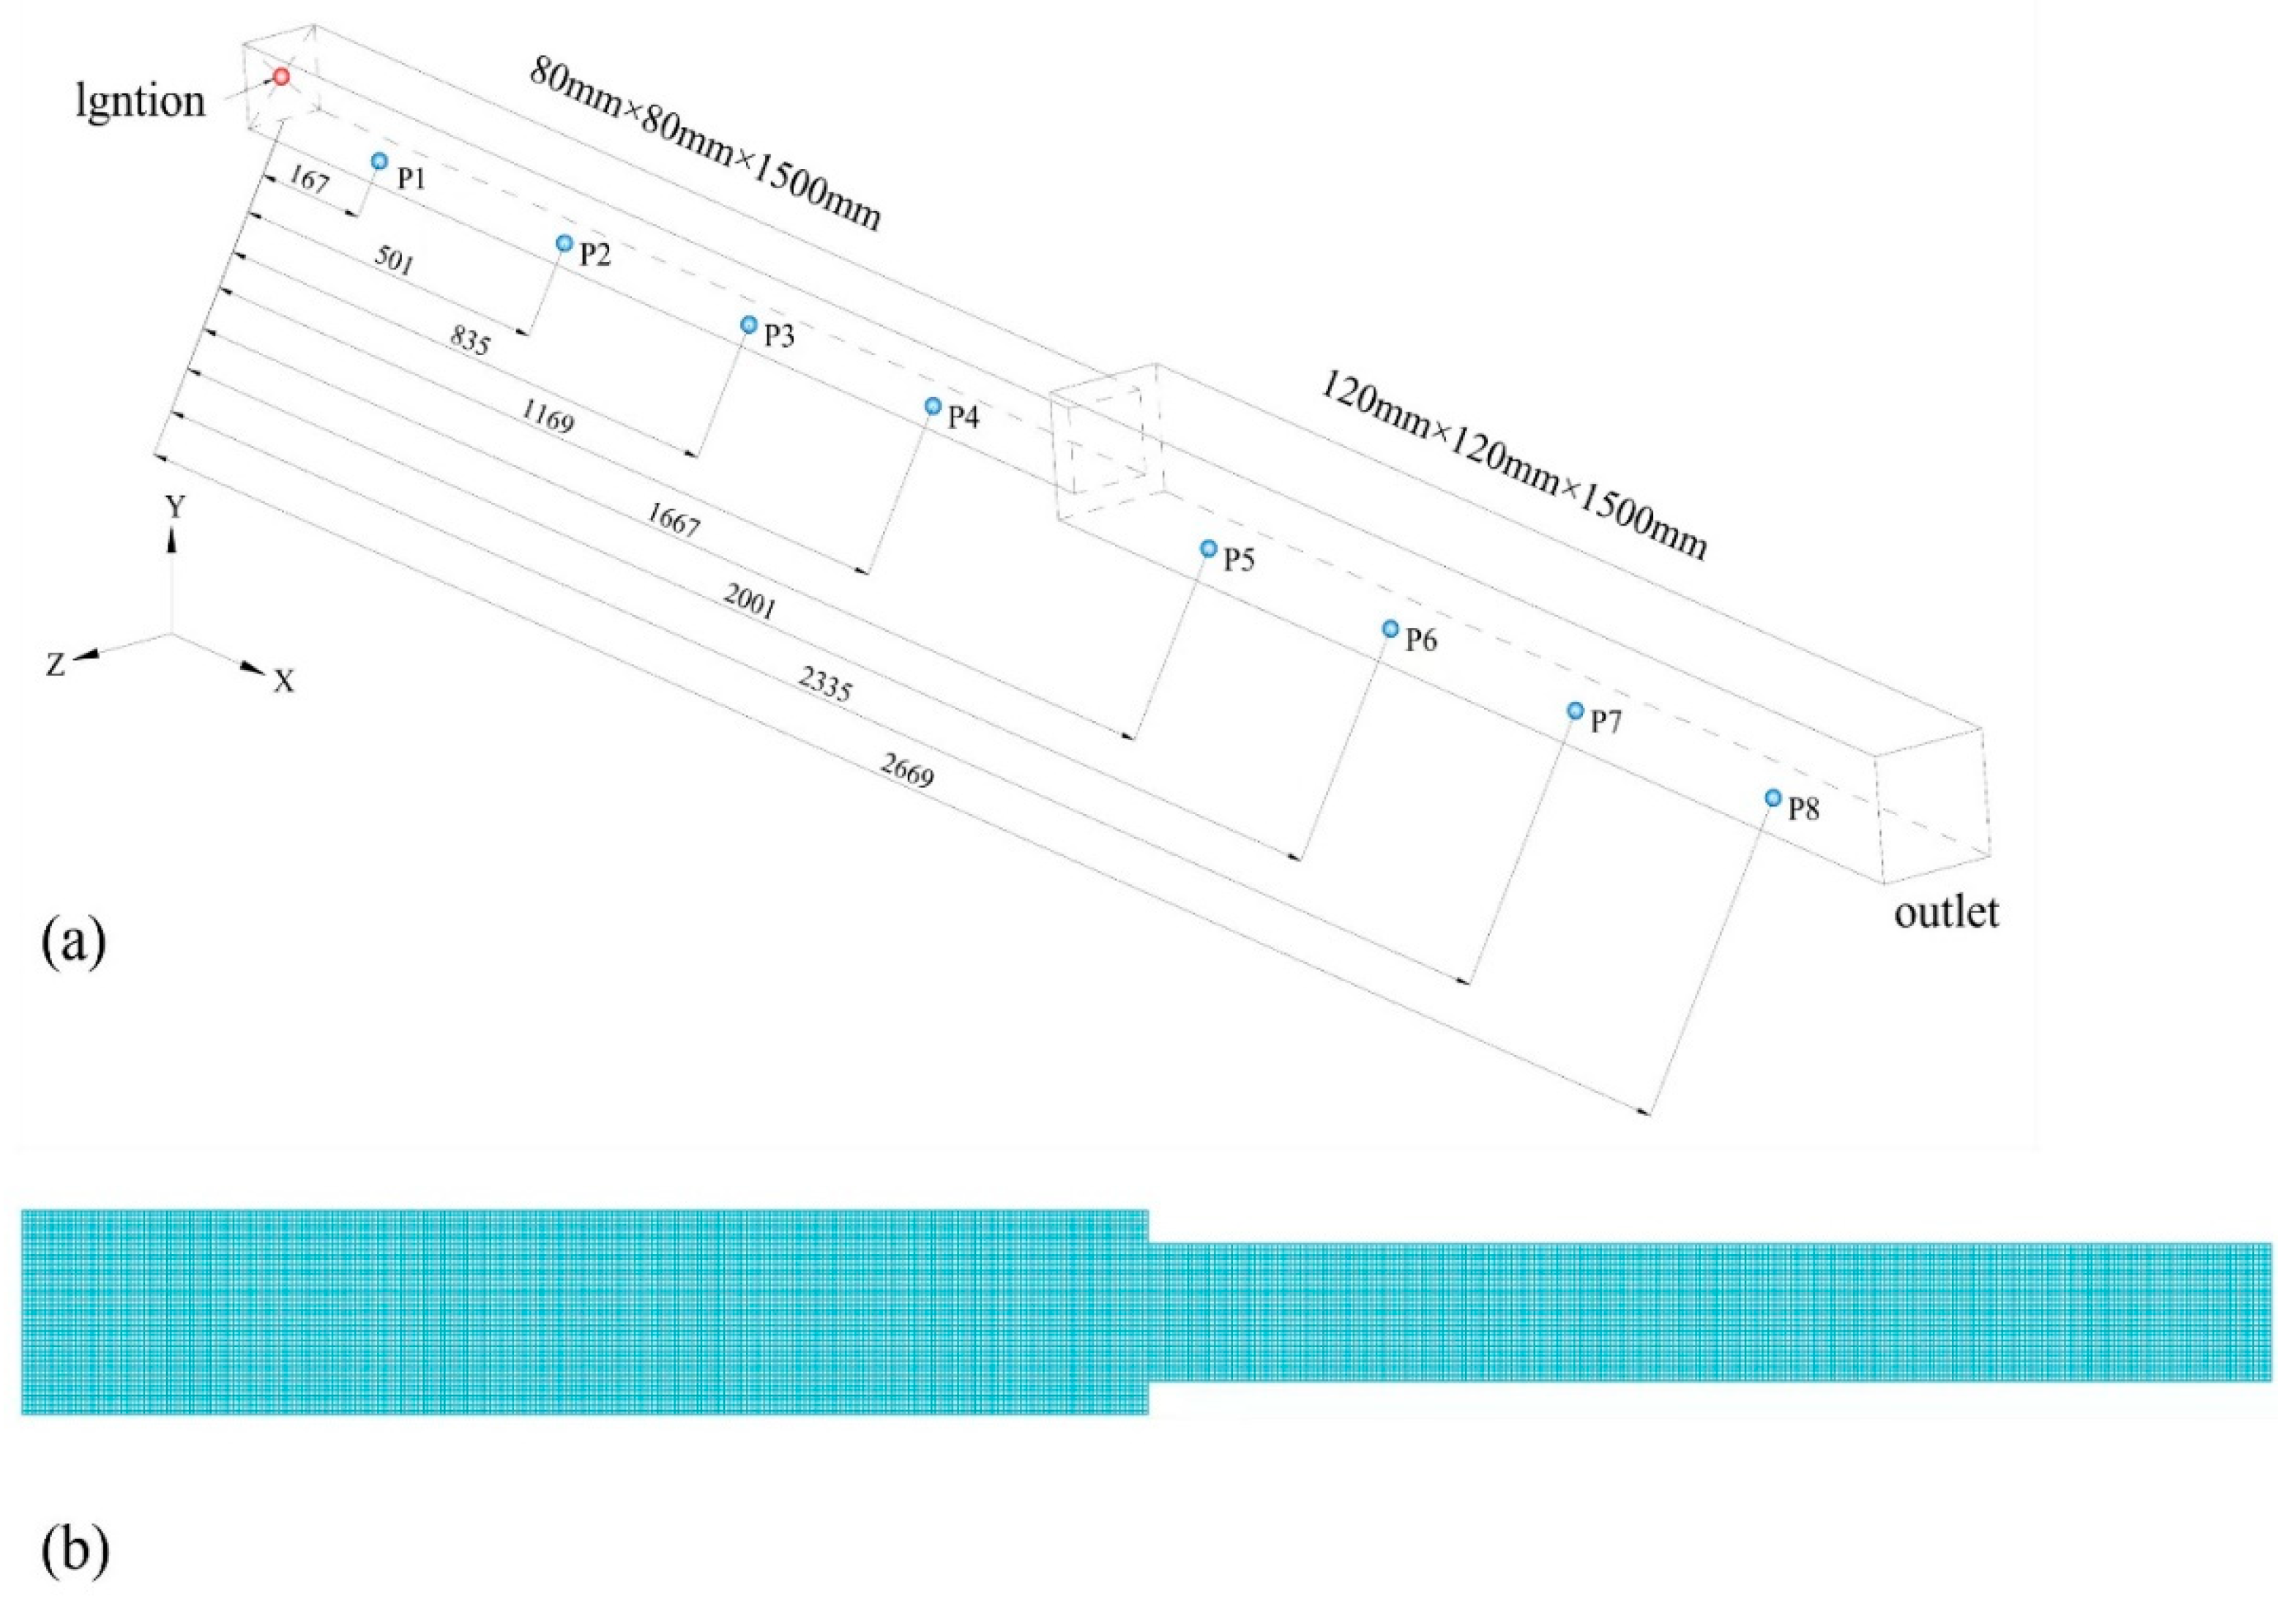
To achieve pipeline sealing, rubber gaskets are applied at the pipe connections, while the pipe openings are sealed with polyvinyl chloride (PVC) film. Sensors are positioned beneath the pipeline, as indicated in Table 1.

2.2. Experimental Methods

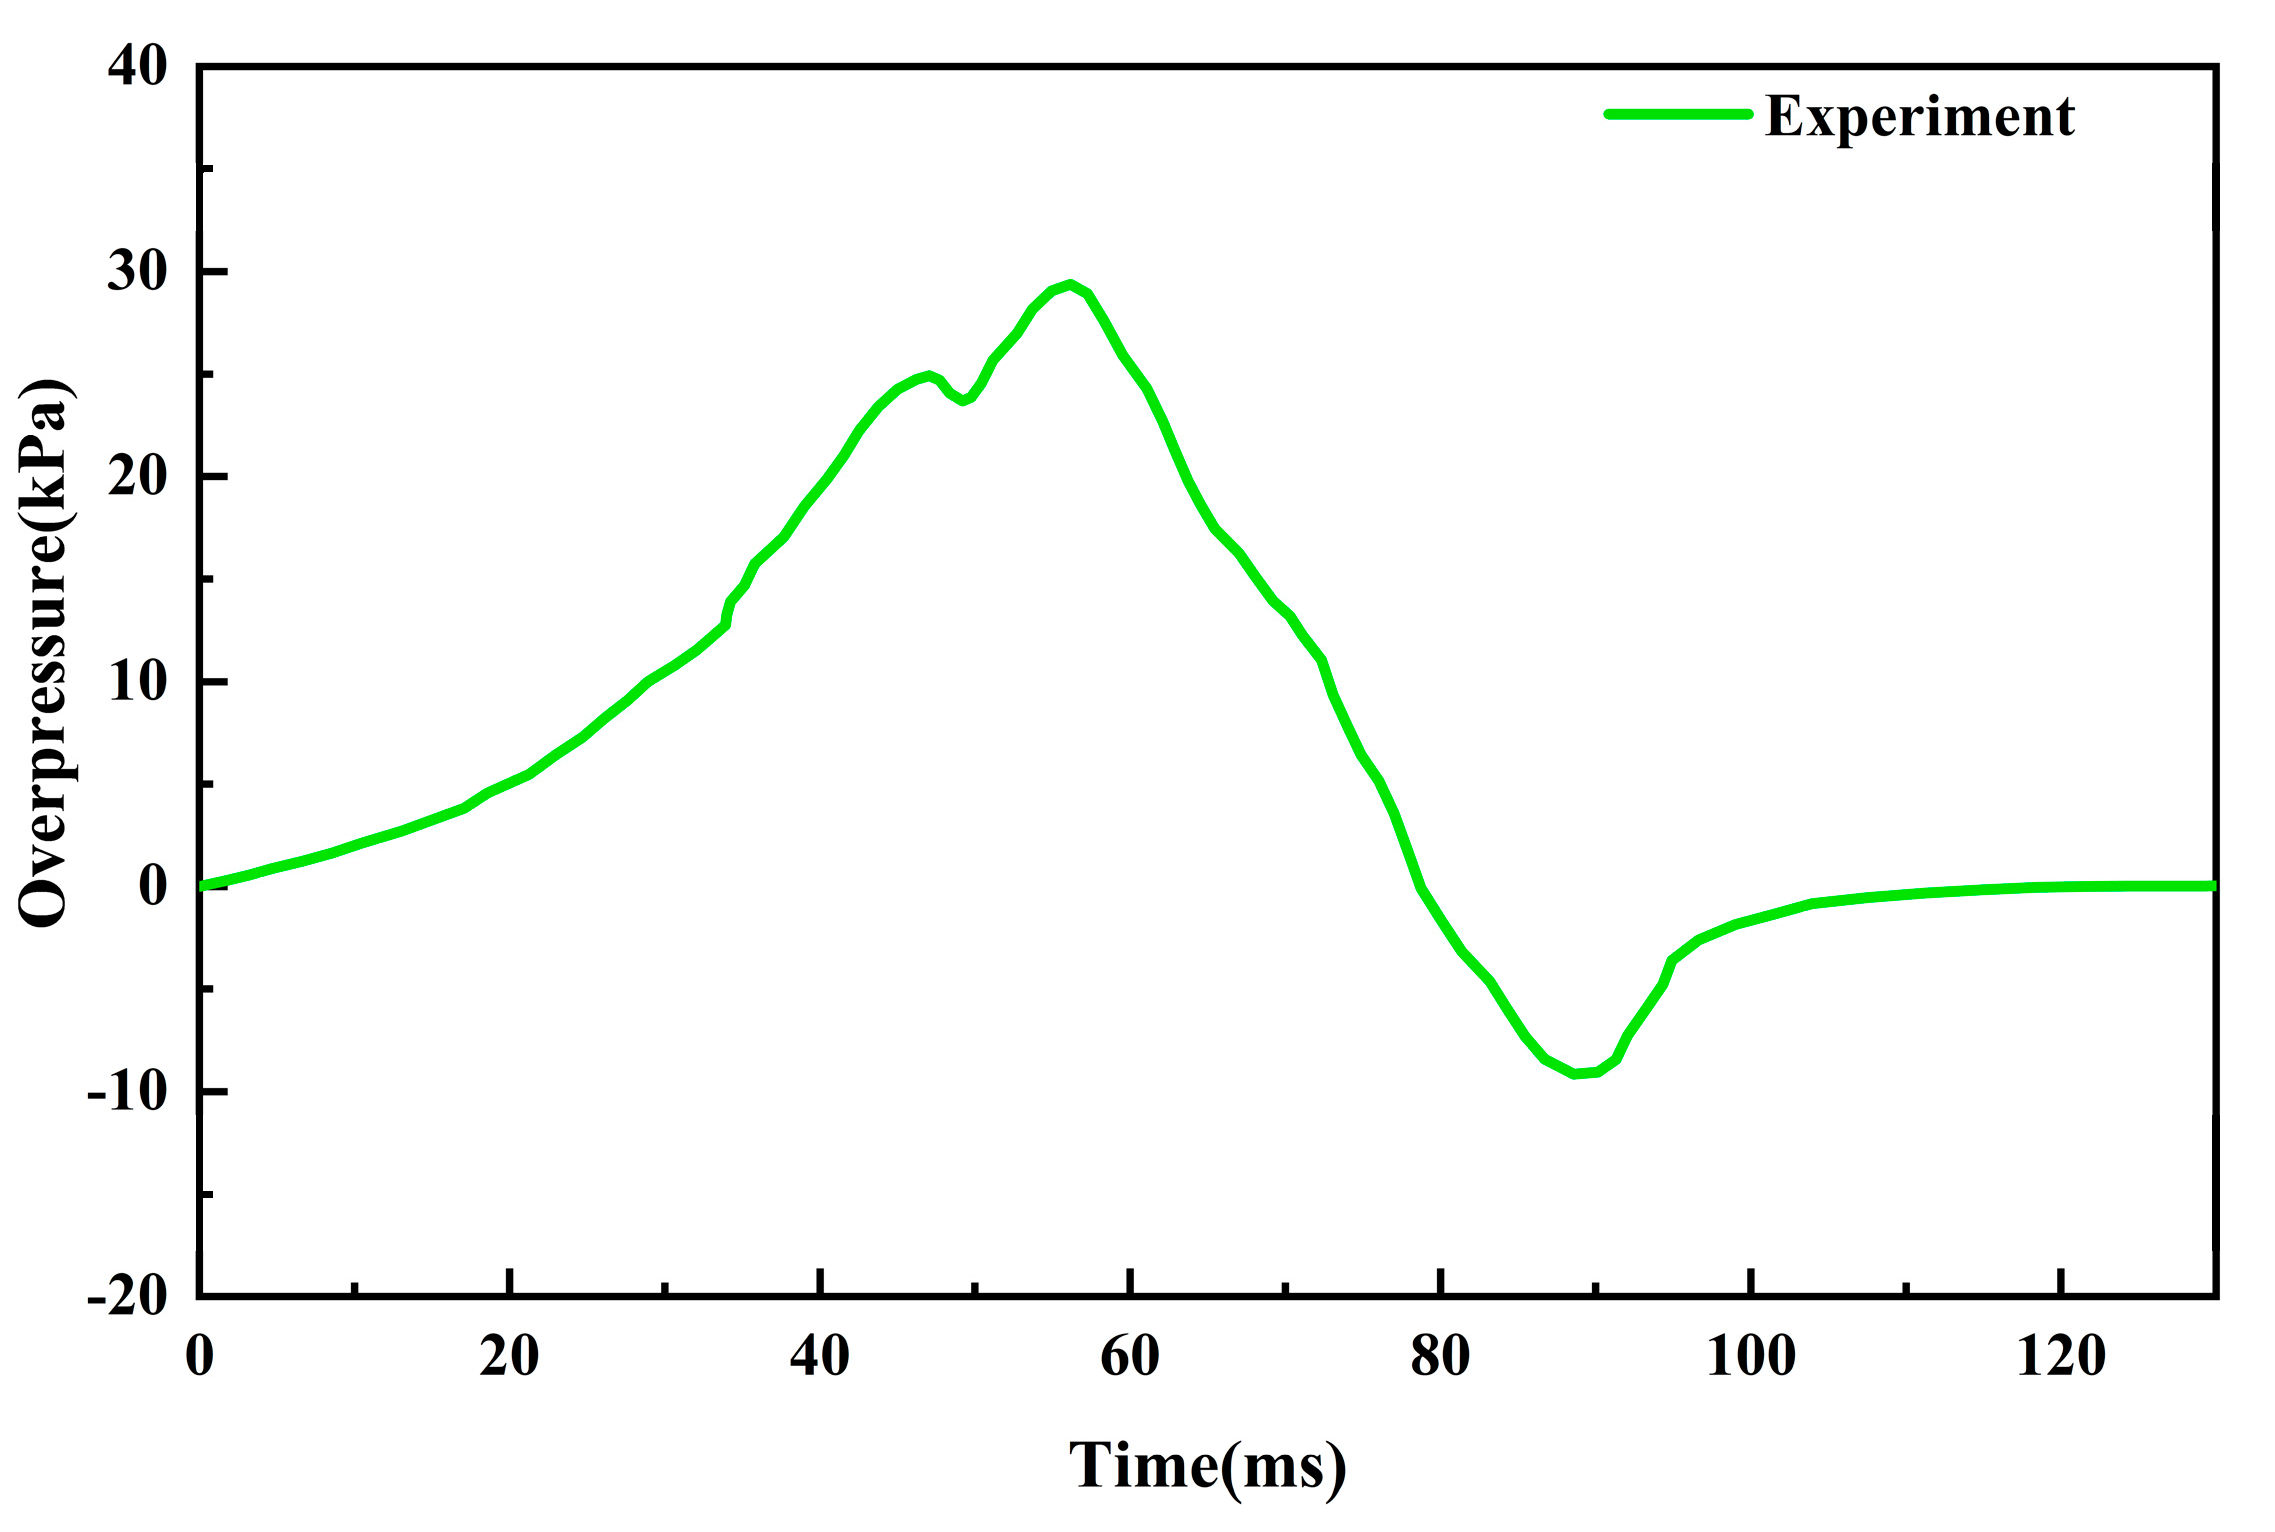
The experiment begins by adjusting the methane flow rate and preparing the required concentration of premixed gas according to Dalton’s law of partial pressures, ensuring uniform gas mixing. Then, the computer, ignition system, high-speed camera, and data acquisition system are checked and calibrated, adjusting any errors to ensure the proper functioning of the equipment. Next, the pipeline undergoes an airtightness check and is evacuated to ensure that only the methane–air mixture is present. After the premixed gas is injected into the pipeline, it is left to stand for 10 min to ensure uniform gas distribution. At the start of the experiment, the data acquisition system is activated, and the gas is ignited, with the high-speed camera recording the flame propagation process. Measurement uncertainty for the gas concentration was considered, with an estimated error of ±0.5% for the methane–air mixture. The opening of the pipe is sealed with plastic film and then further secured with a closed acrylic plate. The tightness of the entire pipeline is checked to prevent the leakage of the premixed gas. The leakage rate is monitored to ensure the pipeline’s integrity, with an acceptable leakage threshold of less than 1%. Once the pipeline is confirmed to be airtight, the pipeline is evacuated and then filled with the premixed gas. After standing for 10 min to evenly distribute the premixed gas in the tube cavity, the closed acrylic plate is replaced at the outlet with a 100% open acrylic plate. Finally, the high-speed camera, data acquisition system, and ignition system are activated simultaneously. The ignition energy is 1 J, and the experimental data are recorded by the data acquisition system. The calibration of the high-speed camera and pressure sensors is conducted prior to each experiment, ensuring the accuracy of data collection. The calibration of the high-speed camera was performed using a known set of motion sequences, and the pressure sensors were calibrated using a reference pressure chamber. To ensure the accuracy of the data, the experiment was repeated at least three times under normal pressure and at an initial temperature of 300 K. Using a diameter ratio of 1.5 and a methane concentration of 12%, the overpressure at P1, varying over time, was obtained through the above experimental method, as shown in Figure 2.

3. Numerical Models and Details

3.1. Governing Equations

In this study, the numerical simulations were primarily conducted in Ansys Fluent 19.2 based on the LES approach, with the Zimont premixed combustion model [28] adopted.
The LES governing equations are as follows:
ρ ¯ t + ρ ¯ u ˜ i x i = 0
ρ ¯ u ˜ i t + ρ ¯ u ˜ i u ˜ j + p ¯ δ i j τ ˜ i j + τ i j s g s x j = 0
ρ h ˜ s t + ρ u ˜ i h ˜ s x i p ¯ t u j ¯ p ¯ x i x i λ T ˜ x i = x j ρ u i h s ˜ u ˜ i h ˜ s
where the overbar and the tilde superscripts, respectively, denote LES filtering and mass-weighted filtering parameters; ρ is the density; p is the pressure; and u i and u j are the velocity components.
For premixed combustion, this paper uses the Zimont subgrid flame front model, taking c = 0.1 as the flame front during simulation.
t ρ c ~ + x j ρ u ~ j c ~ = x j μ t S c t c ~ x j + S c
where u j j = 1 , 2 , 3 denotes the velocity in the x , y , and z directions; S c is the source term of the process variable; μ t is the subgrid viscosity; and c is the process variable for the reaction.
S c = A u 3 / 4 ρ u U 1 1 / 2 α 1 / 4 c ~ l t 1 / 4
c = i = 1 n Y i / i = 1 n Y i , e q
where n is the number of combustion products; Y i , e q represents the mass fraction of the ith equilibrium product; the model constant A = 0.52; u’ is the subgrid turbulent fluctuation velocity; ρ u denotes the density of the unburned gas mixture; U 1 is the laminar burning velocity; α is the molecular heat transfer coefficient of the reactants; and l t is the turbulent characteristic length scale.

3.2. Geometric Models and Numerical Details

Figure 3a illustrates the simulated pipeline, consisting of two square abrupt expansion pipes with dimensions of 80 × 80 × 1500 mm and 120 × 120 × 1500 mm. The ignition source is positioned at the center of the pipeline inlet. Since the outlet cannot be modeled with a PVC membrane, the pipeline is configured as a semi-enclosed system. A geometric model was created using Autodesk AutoCAD 2019 and subsequently imported into Ansys Fluent 19.2 for mesh generation. The grid size is 3 mm × 3 mm × 3 mm, resulting in approximately 1,164,300 cells, with a mesh quality exceeding 0.99 (Figure 3b).
Boundary conditions were set as no slip and adiabatic with an open outlet. The initial temperature was 300 K, pressure was zero, and flame speed was zero. The ignition source was a 10 mm hemispherical region (reaction variable = 1). The methane–air combination, with a methane volume fraction of 9.5% under stoichiometric conditions (equivalence ratio = 1), was treated as an ideal gas. Large Eddy Simulation and the Zimont premixed combustion model were employed, using a double-precision finite volume scheme with PISO for velocity–pressure coupling. The time step was 1 × 10⁻⁵ s, each step was repeated 20 times, and residuals remained below 1 × 10⁻³.

3.3. Model Validation

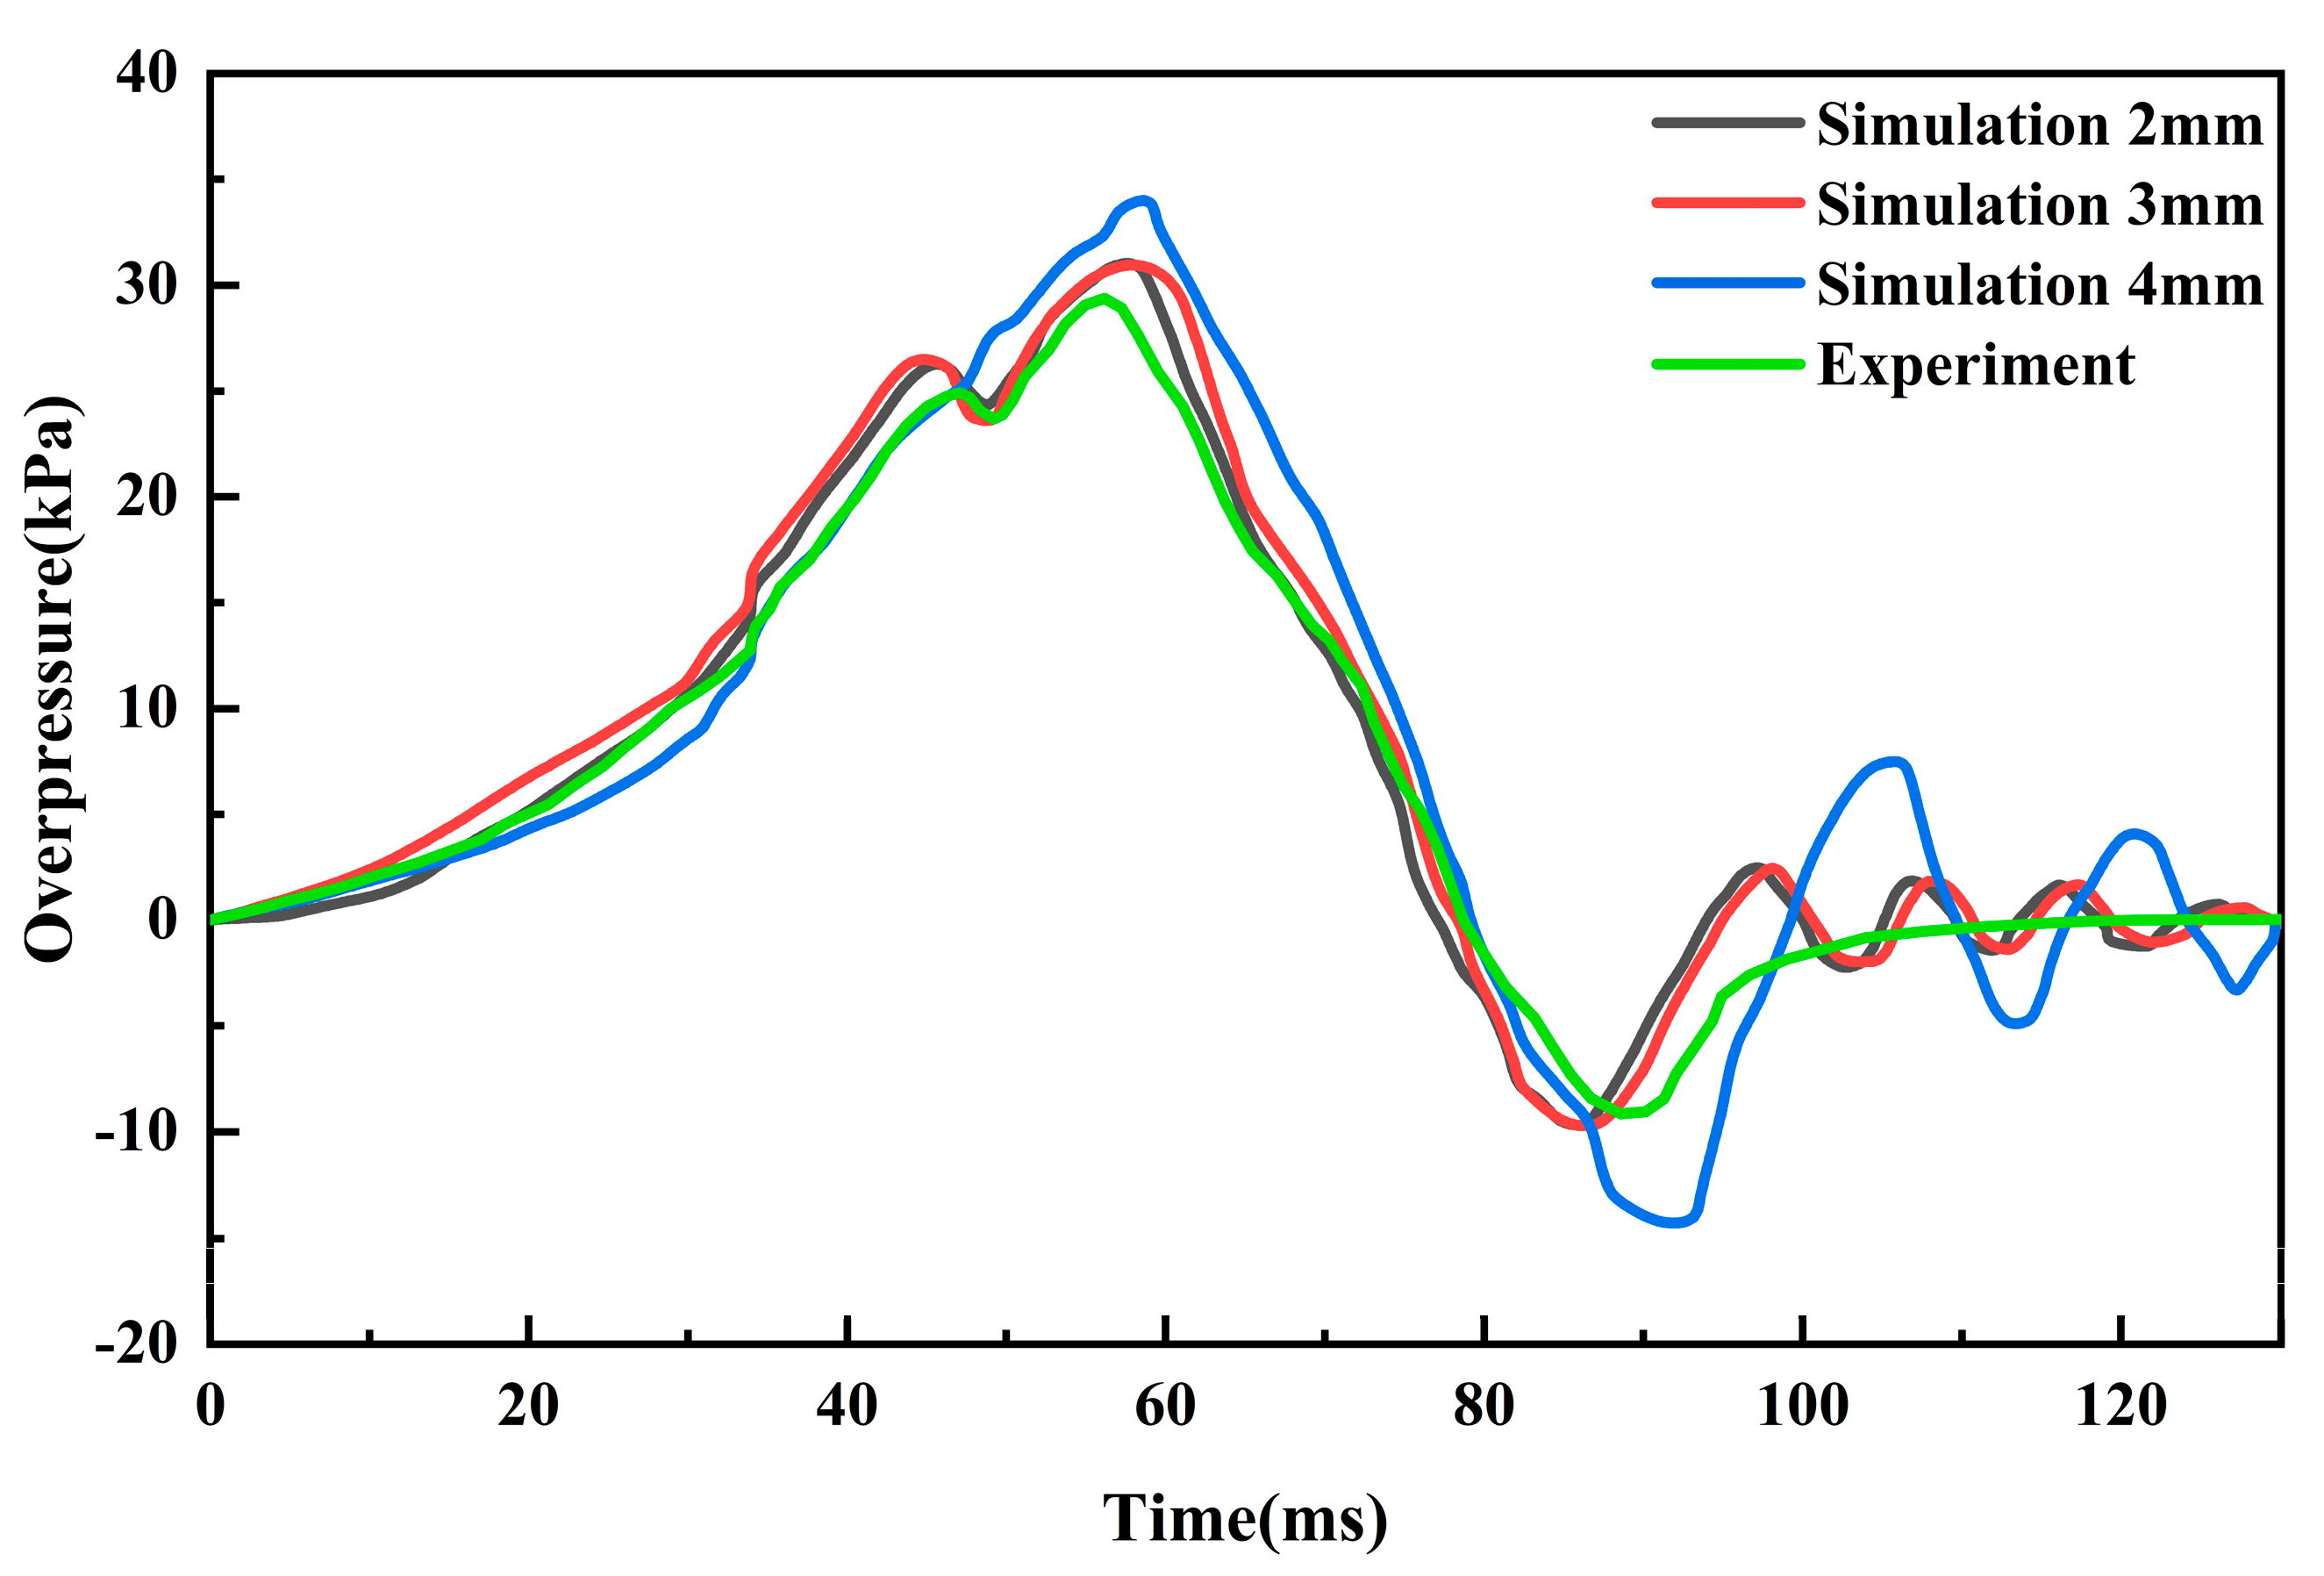
Figure 4 illustrates the variation in overpressure within the pipeline over time under different mesh sizes, showing that finer grids yield results that align more closely with experimental data. Overpressure curves obtained with mesh sizes smaller than 4 mm × 4 mm × 4 mm demonstrate better agreement with experimental measurements due to increased cell resolution, which enhances simulation accuracy. However, excessive mesh refinement significantly increases computational time and hardware demands. Among the tested mesh sizes, the 3 mm × 3 mm × 3 mm grid achieves an optimal balance, accurately reproducing experimental overpressure variations while effectively reducing computational cost. To ensure numerical reliability, grid independence was verified using a refinement factor of 1.2, confirming that further refinement had negligible effects. Grid convergence analysis, based on flame propagation speed and peak overpressure, showed that refining the grid from 4 mm to 3 mm and from 3 mm to 2 mm resulted in relative errors below 2%, ensuring both numerical accuracy and computational efficiency. Therefore, considering both simulation precision and computational feasibility, this study adopts the 3 mm × 3 mm × 3 mm mesh for subsequent simulations.
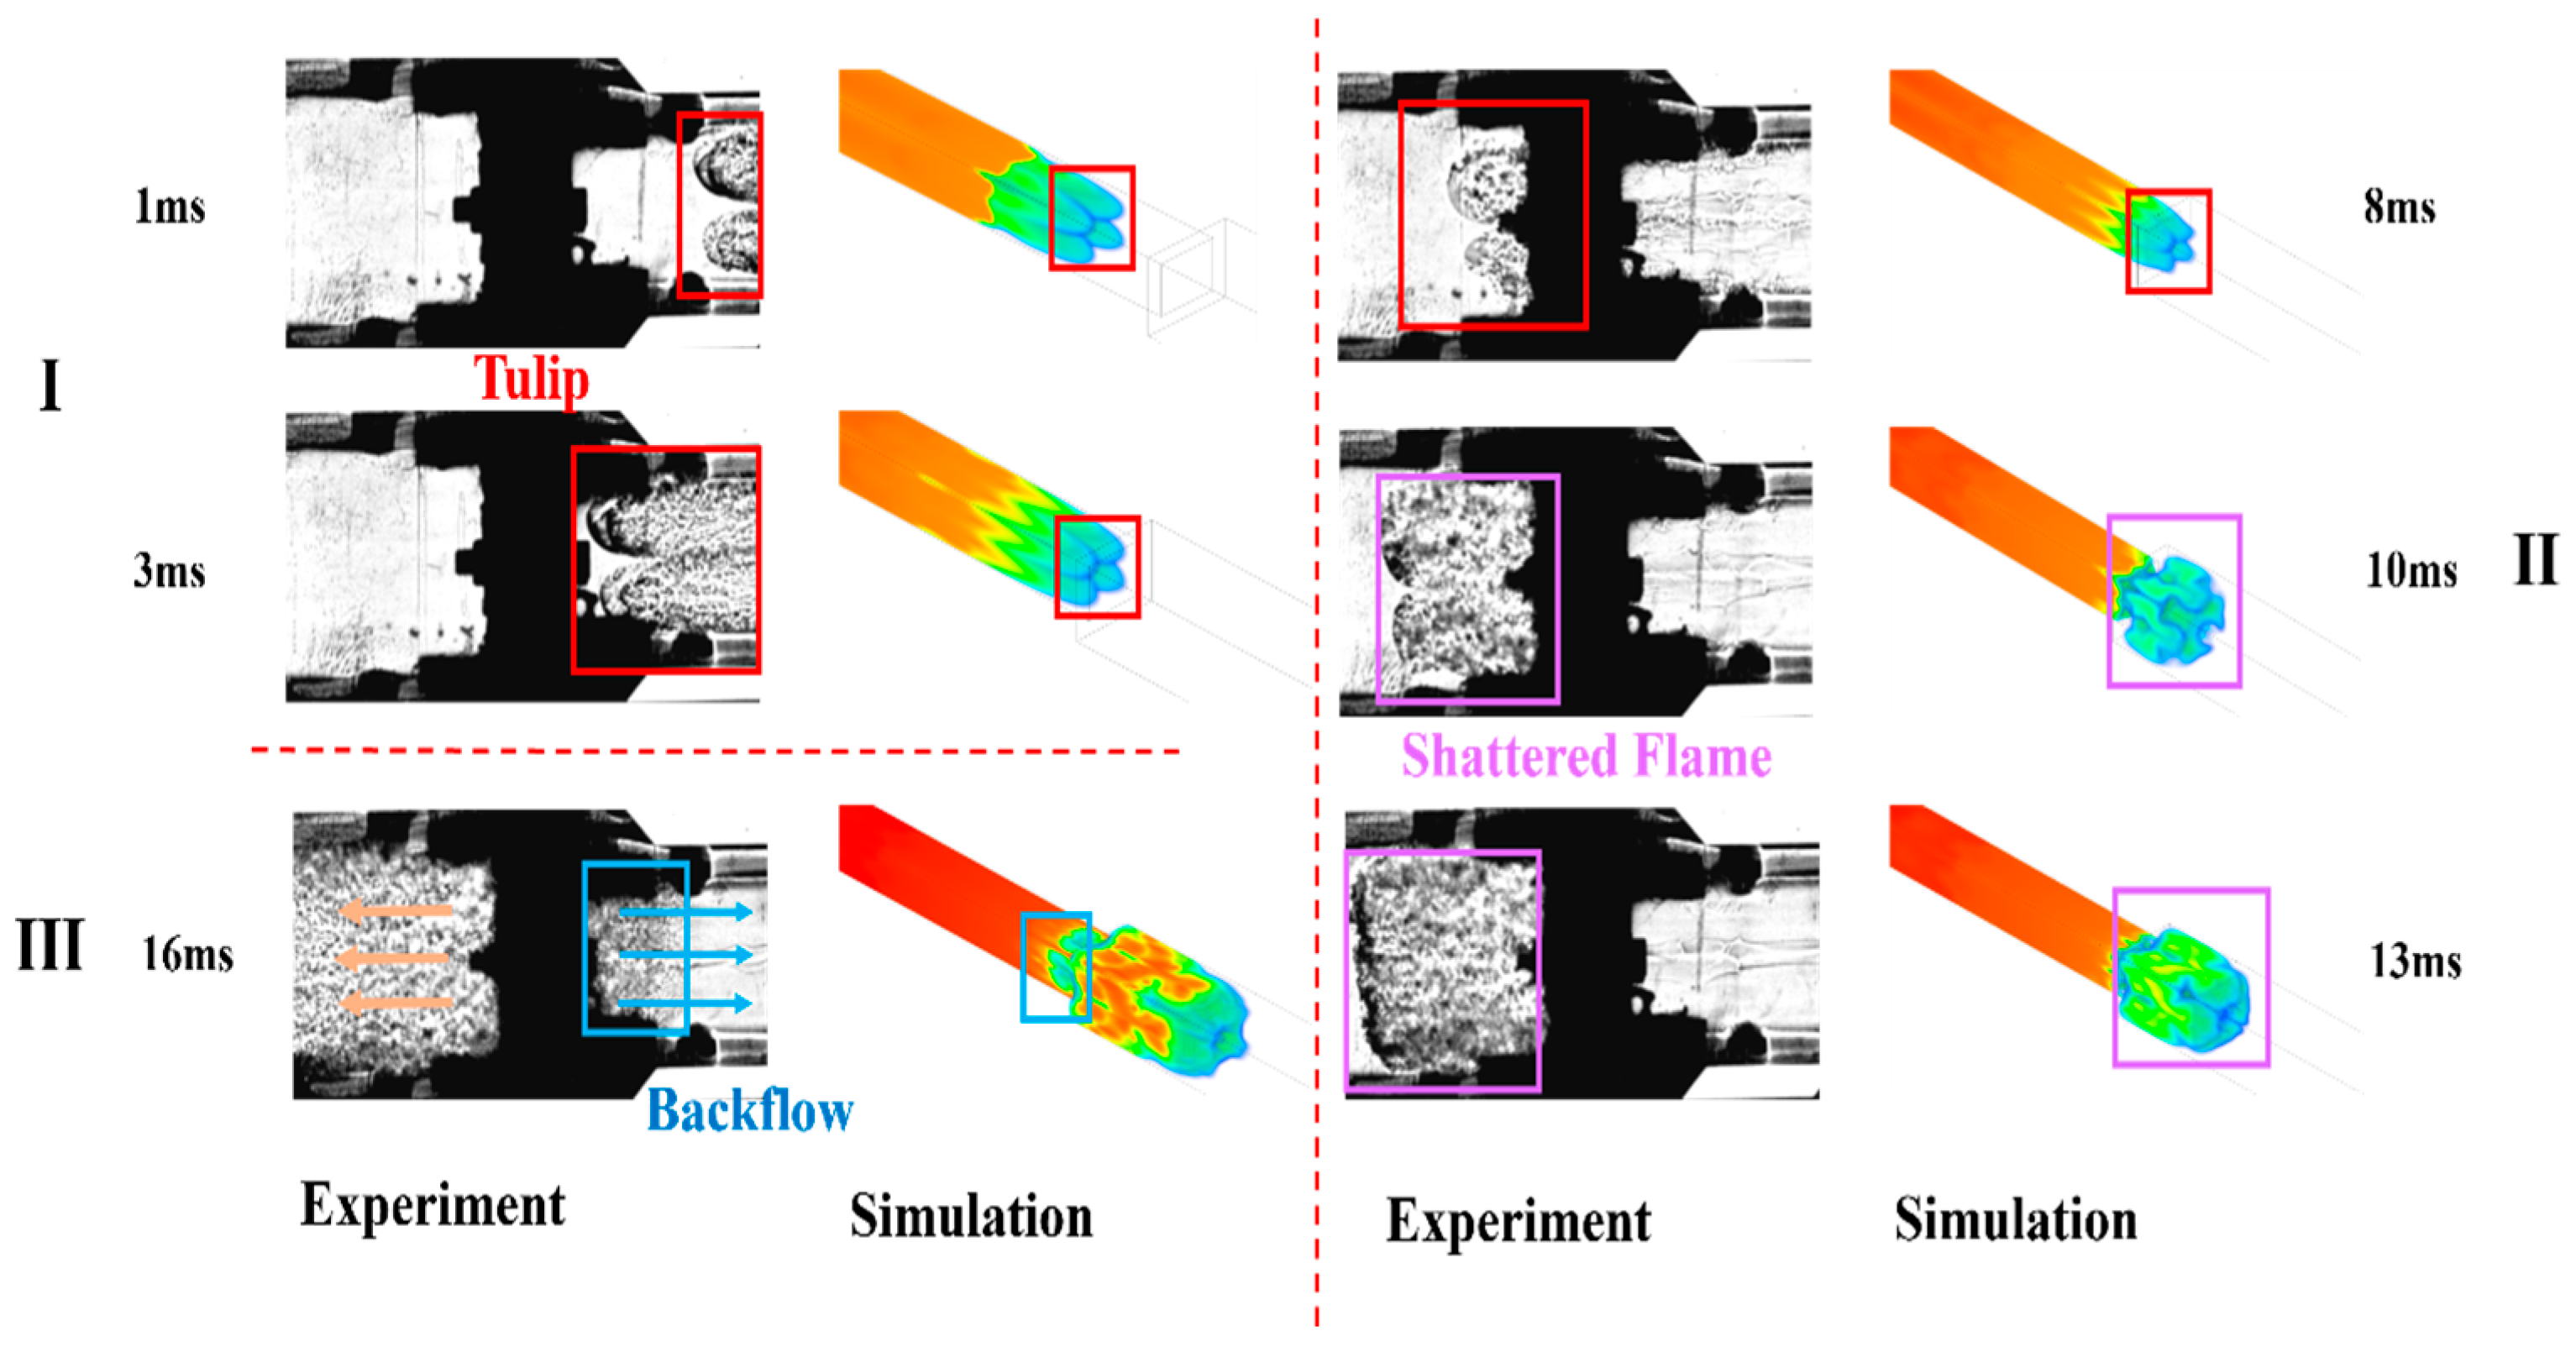
Figure 5 compares the temporal evolution of flame structures between the experiment and simulation. The simulation assumes adiabatic conditions, while the actual pipeline is non-adiabatic, leading to a slight temperature difference that results in marginally faster flame propagation in the experiment. However, this discrepancy is negligible. The experimental (left) and simulated (right) results exhibit high consistency across three stages (I, II, III).
In Stage I, the flame gradually develops a “tulip” shape, with both experiment and simulation capturing the evolution of the flame front’s shape and position. In Stage II, a shattered flame structure emerges as an irregular expansion in both cases. In Stage III, the formation of the reflux region, as well as the spatial distribution and intensity of the flame, remain consistent between experiment and simulation. Overall, the simulated flame propagation closely aligns with experimental observations.
Comparisons of flame structures and overpressure curves confirm that the established model reliably reproduces experimental results, with errors remaining within a controllable range, validating its accuracy. Based on this model, the deflagration characteristics of methane–air premixed gas in sudden expansion pipelines with varying diameter ratios are further analyzed. Table 2 presents the four diameter ratio configurations examined.

4. Results and Discussion

4.1. Impact of Sudden Pipeline Expansion on Flame Propagation Dynamics

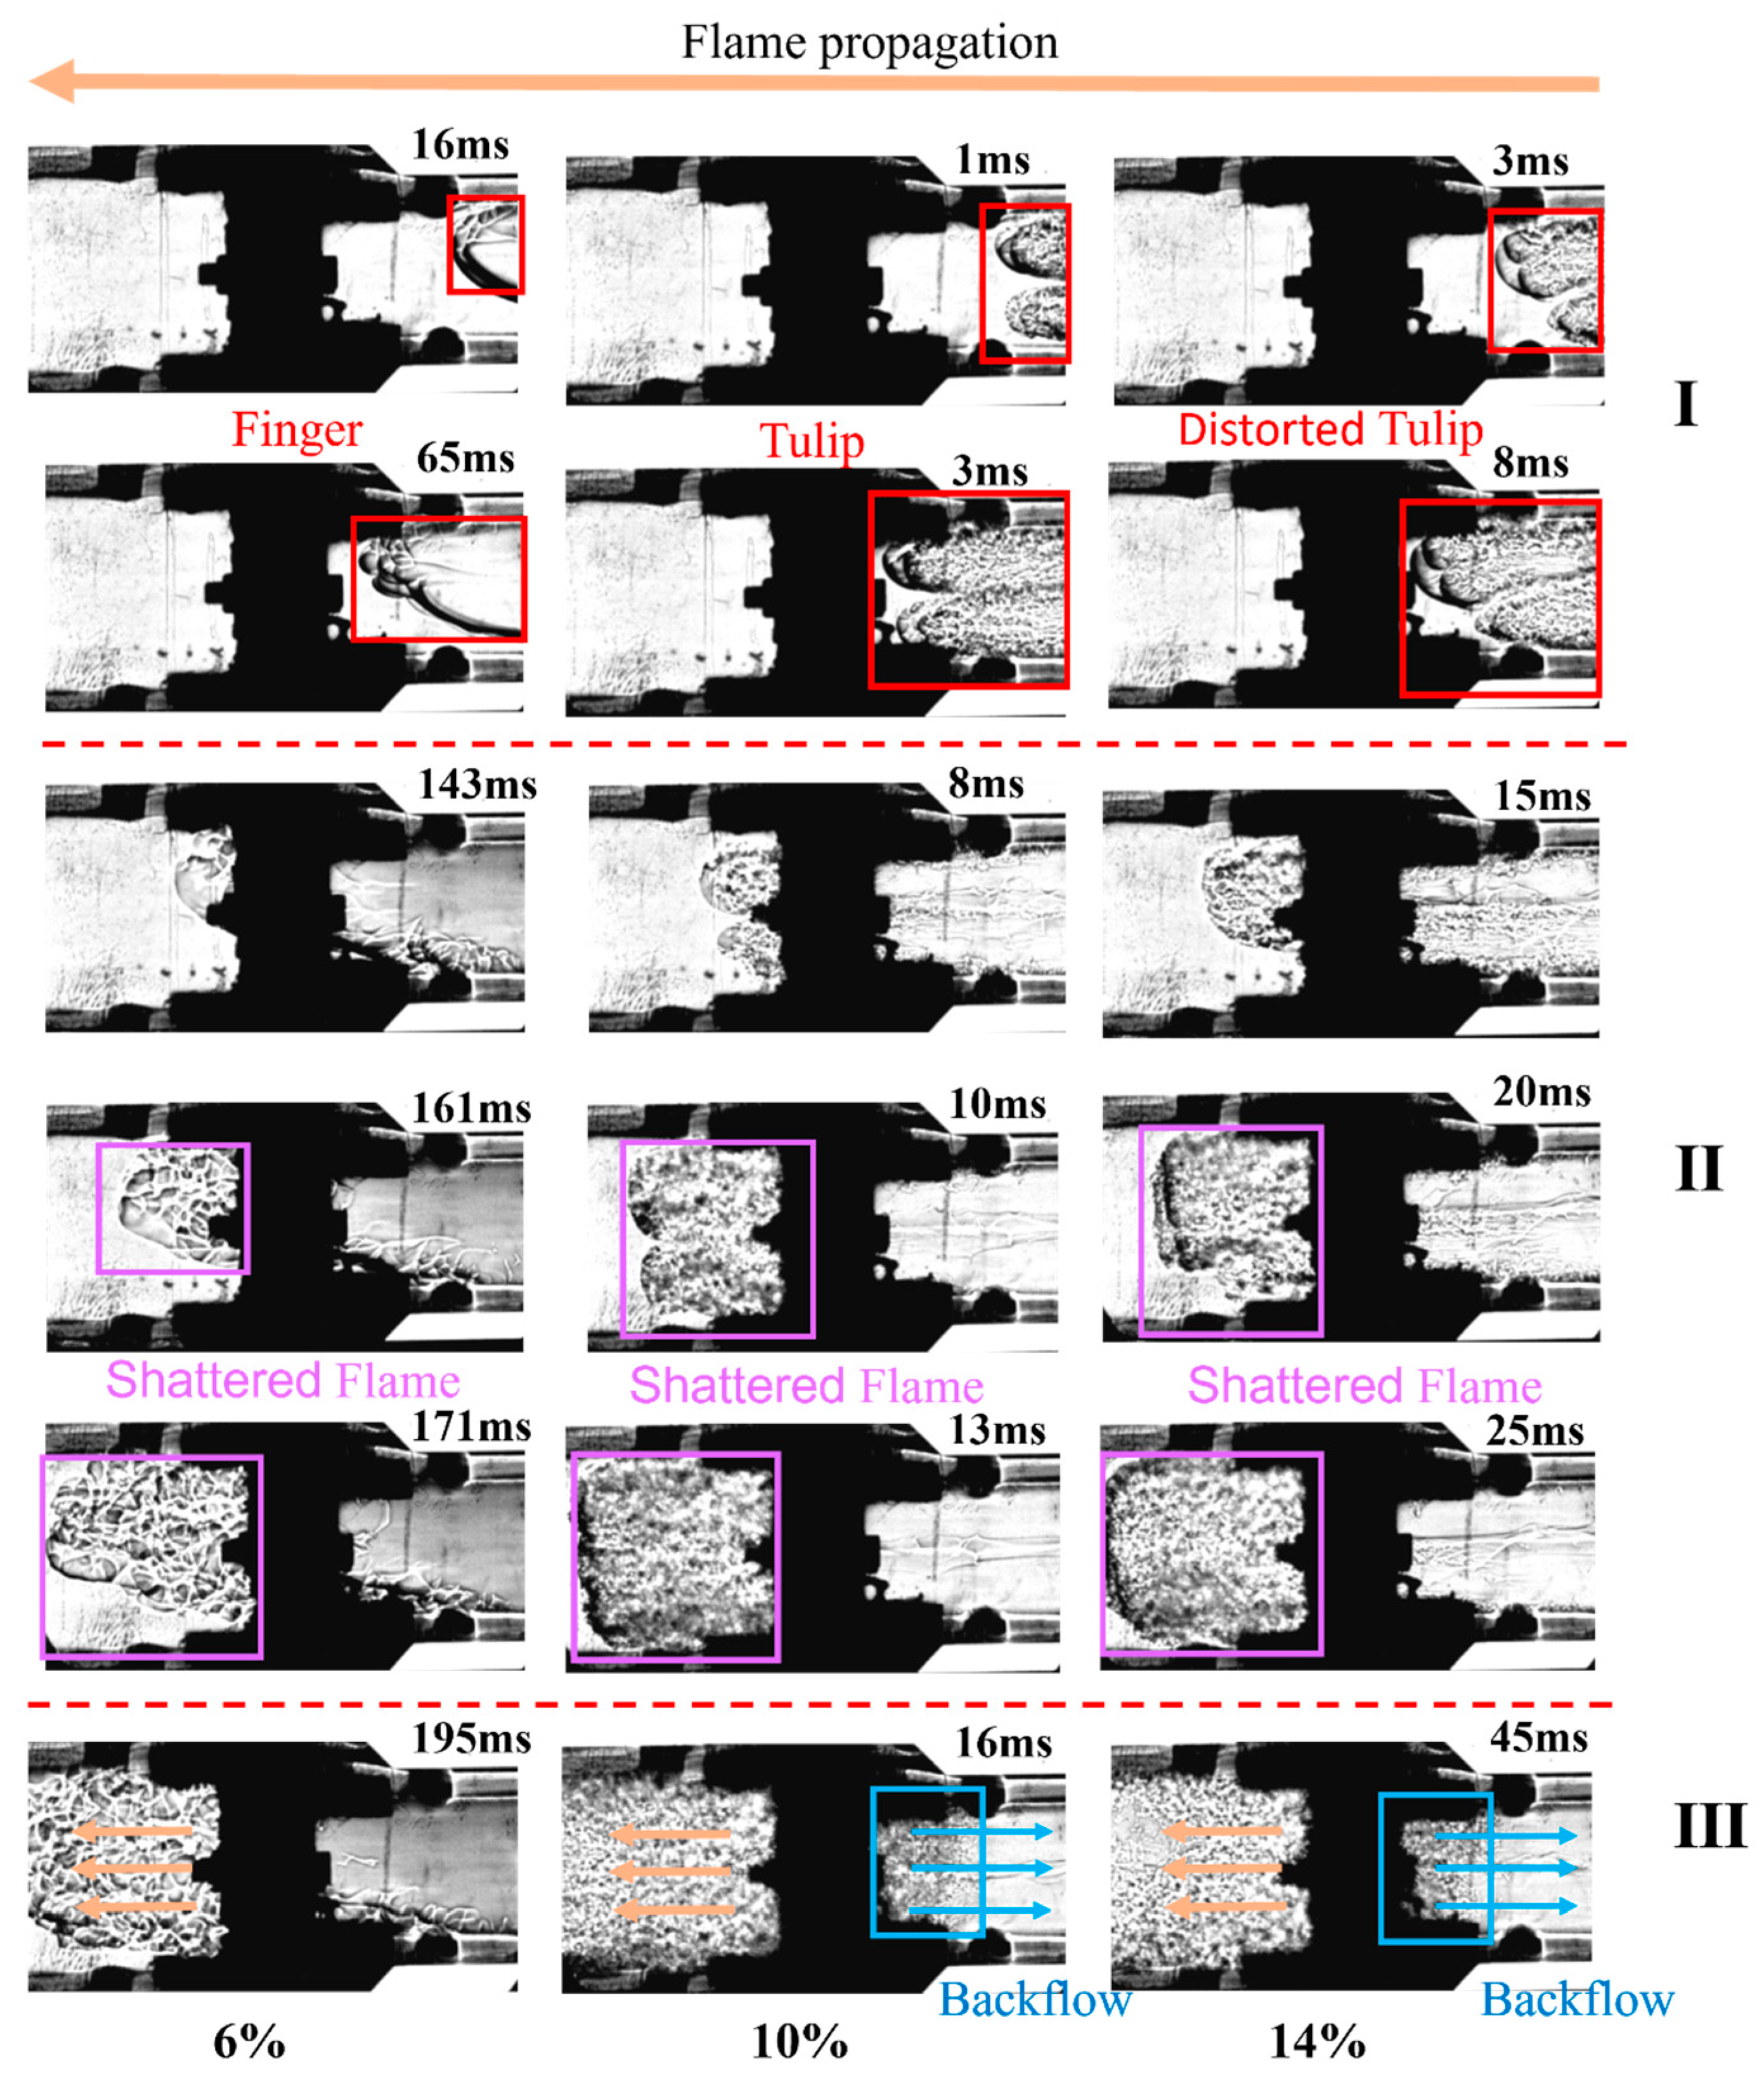
Figure 6 presents Schlieren photographs illustrating the propagation of the methane–air premixed flame in the sudden expansion structure with a diameter ratio of 1.5. Under lean conditions (6% methane concentration), the flame gradually expands in a “finger-like” shape. Buoyancy and wall constraints produce an asymmetric velocity gradient, resulting in arc-shaped propagation and slight flame wrinkling. When the methane concentration is 10%, the flame propagates through the sudden expansion structure in a “tulip” shape, with a relatively uniform propagation speed along both the top and bottom walls, and the propagation time is significantly reduced. When the methane concentration increases to 14%, the flame transitions into a distorted “tulip” shape, accompanied by a broken front end, indicating higher reactivity and a higher rate of heat release. The sudden expansion structure significantly changes the interaction between the flame and the flow field. When the flame enters the larger pipeline, the increased cross-sectional area expands the combustion region and separates it from the shock wave. The influence of vortices and flow separation reduces the flame propagation speed, ultimately leading to the fragmentation of the flame structure. According to the Kutta–Joukowski theorem, vortices generated as the fluid flows past the sudden expansion obstacle disrupt flame propagation, intensifying flame structure fragmentation and instability. This process eventually results in flame decoupling and potentially flame extinction.
Figure 7 illustrates the impact of sudden expansion structures on flame propagation and temperature distribution at varying diameter ratios. As the diameter ratio increases from 1.25 to 2.0, the flame transitions from a stable, symmetric structure to a highly irregular, multi-vortex system.
At 1.25, the turbulence is weak, with a concentrated high-temperature core and smooth flame boundaries. At 1.5, axial flame stretching intensifies, the boundary layer expands, and turbulence enhances mixing and combustion efficiency. At 1.75 and 2.0, turbulence and vortex interactions significantly expand the high-temperature region, increasing flame asymmetry and fluctuations. At 2.0, the vortex system becomes highly complex, maximizing turbulent mixing but also inducing greater instability and localized overheating. Overall, the diameter ratio regulates turbulence intensity and energy dissipation, critically influencing combustion efficiency and flame stability.
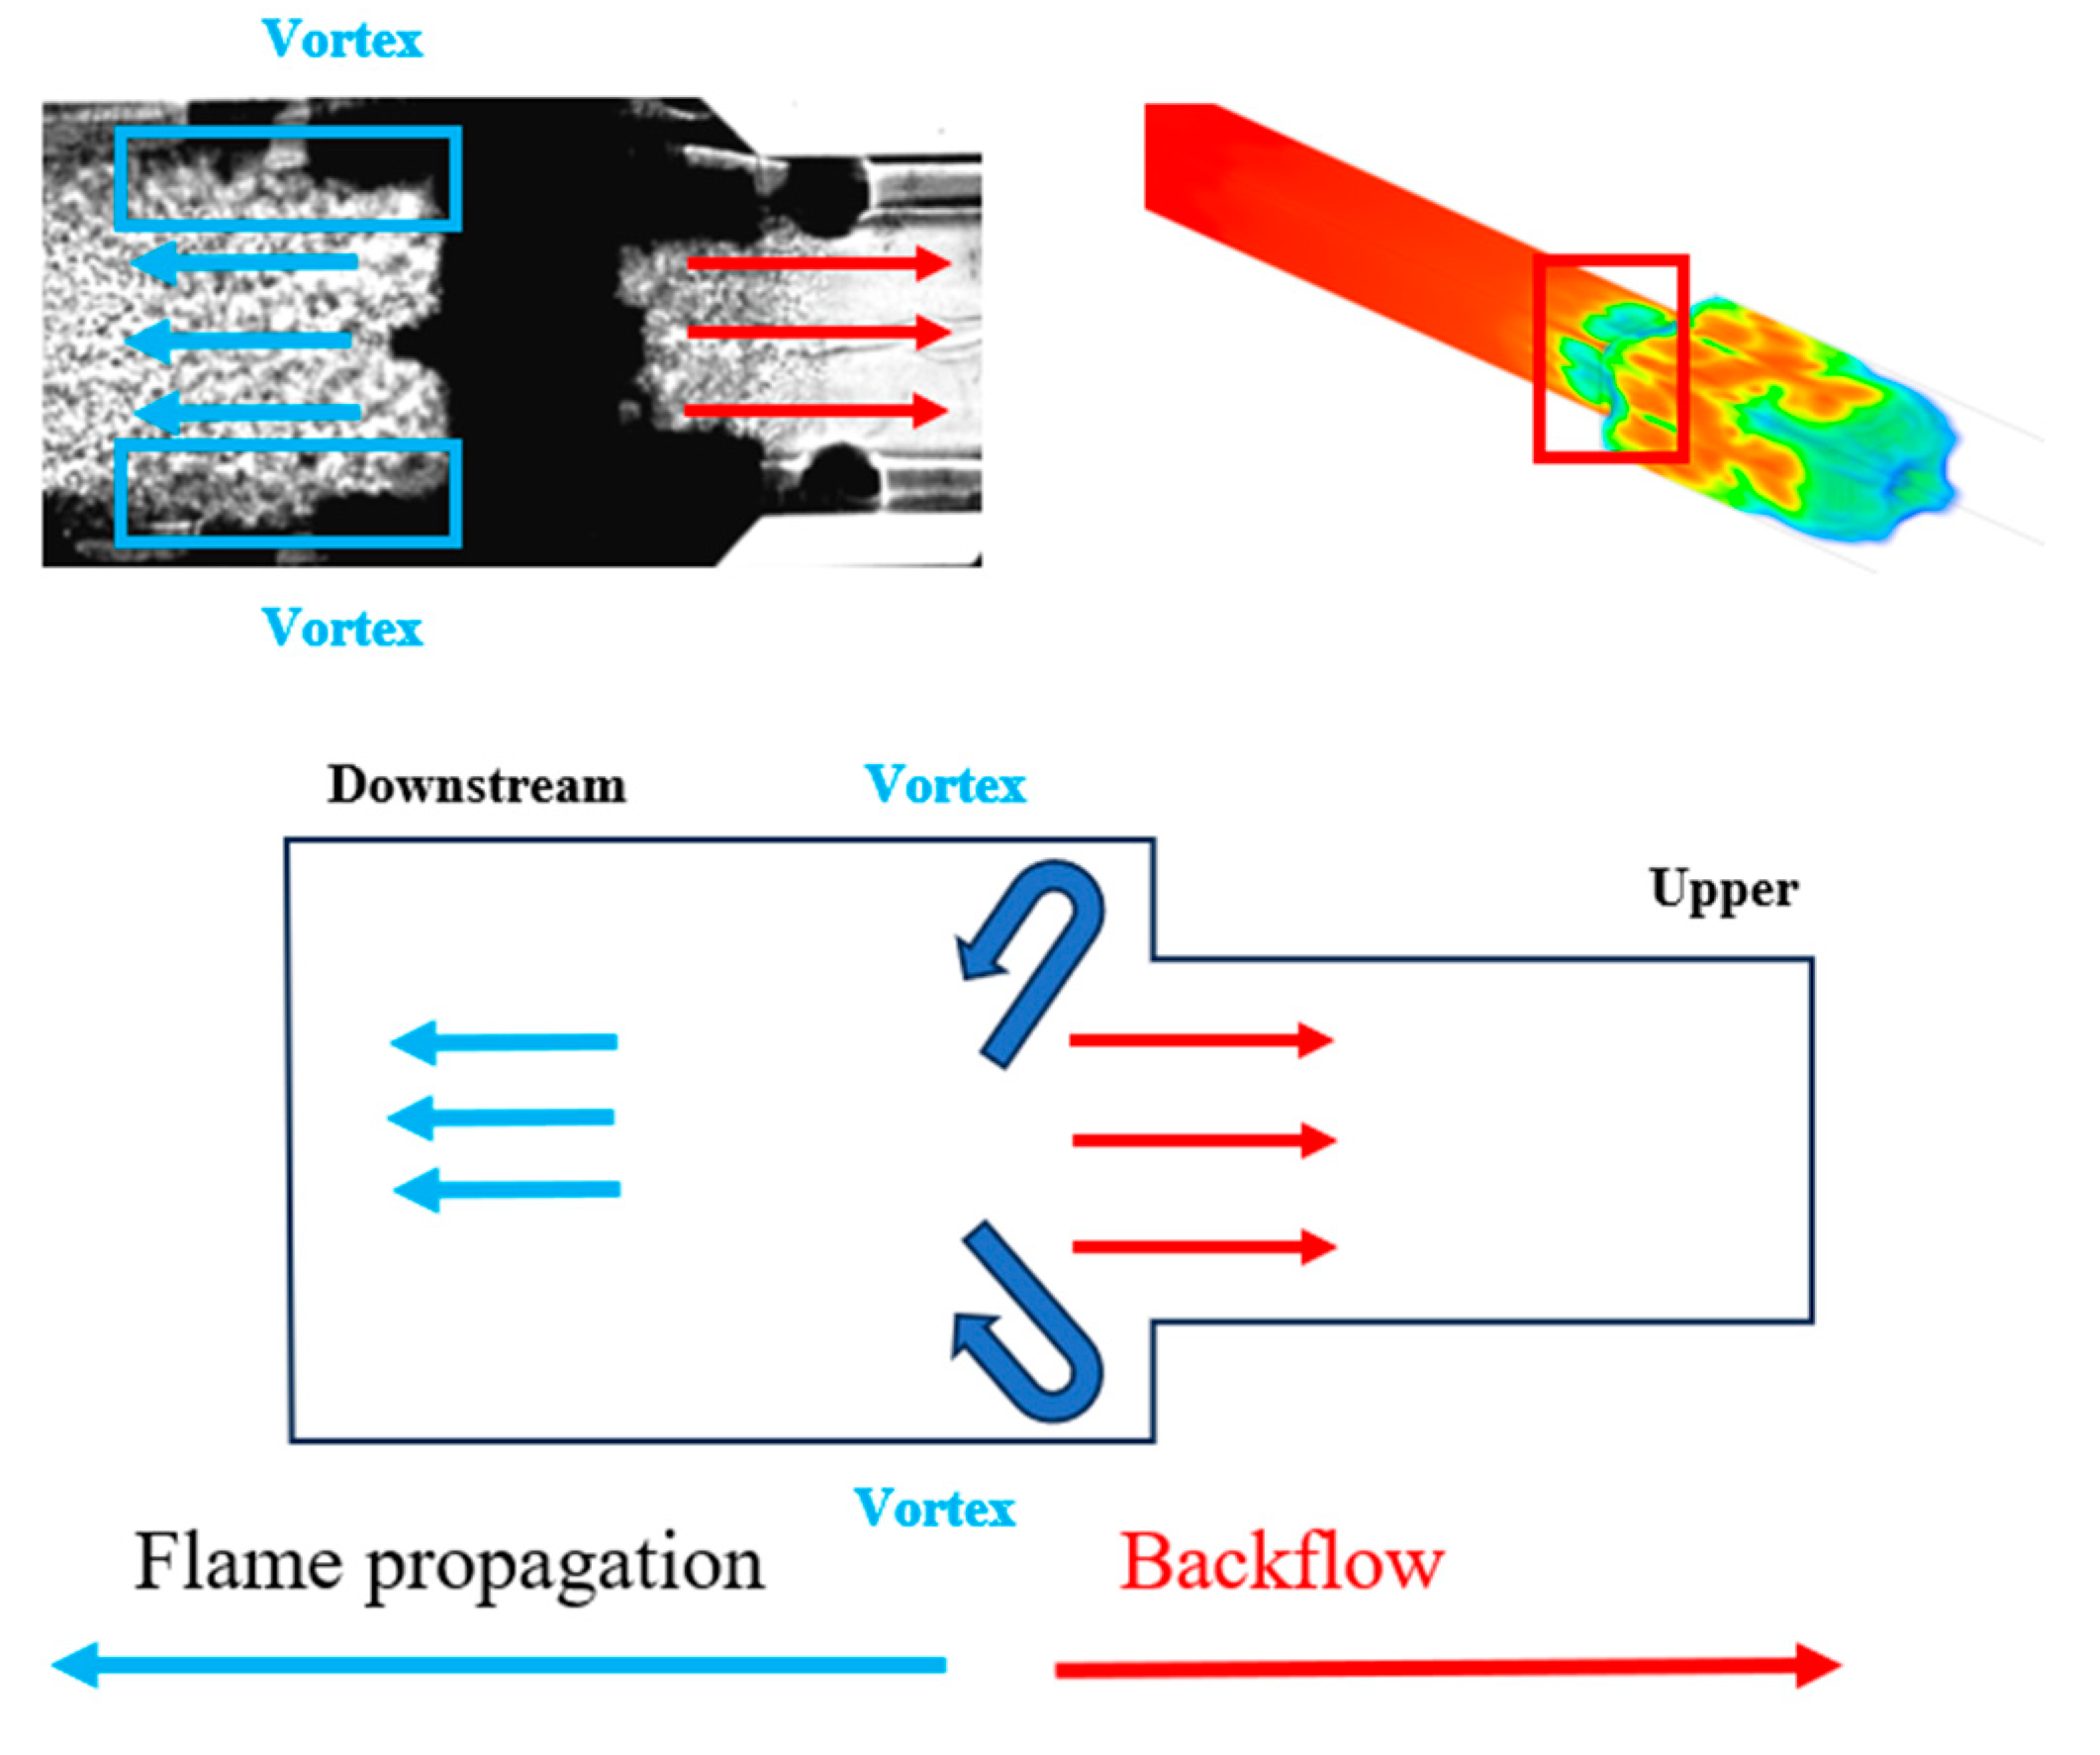
The high-speed Schlieren image in Figure 8 shows a significant flame backflow in sudden expansion structures with methane concentrations of 10% or more. This phenomenon is closely associated with turbulent vortex motion. In the upper and lower corner regions of the sudden expansion zone, vortices are formed by the airflow. Simultaneously, the guided airflow at the pipeline front triggers Kelvin–Helmholtz instability [29]. Under the combined influence of these vortical motions and Kelvin–Helmholtz instability, the flame is driven by the flow expansion, producing localized turbulent vortex motion at higher speeds [30]. This process enhances local mass and energy transfer efficiency within the combustion zone. Consequently, the flame front undergoes intense turbulent combustion and secondary acceleration, and then the front of the flame undergoes a decrease in flame velocity and pressure, accompanied by pressure and density gradients. The rear flame is reflected and compressed by the front, propagating toward regions of lower pressure and density gradients, resulting in a flame backflow phenomenon.
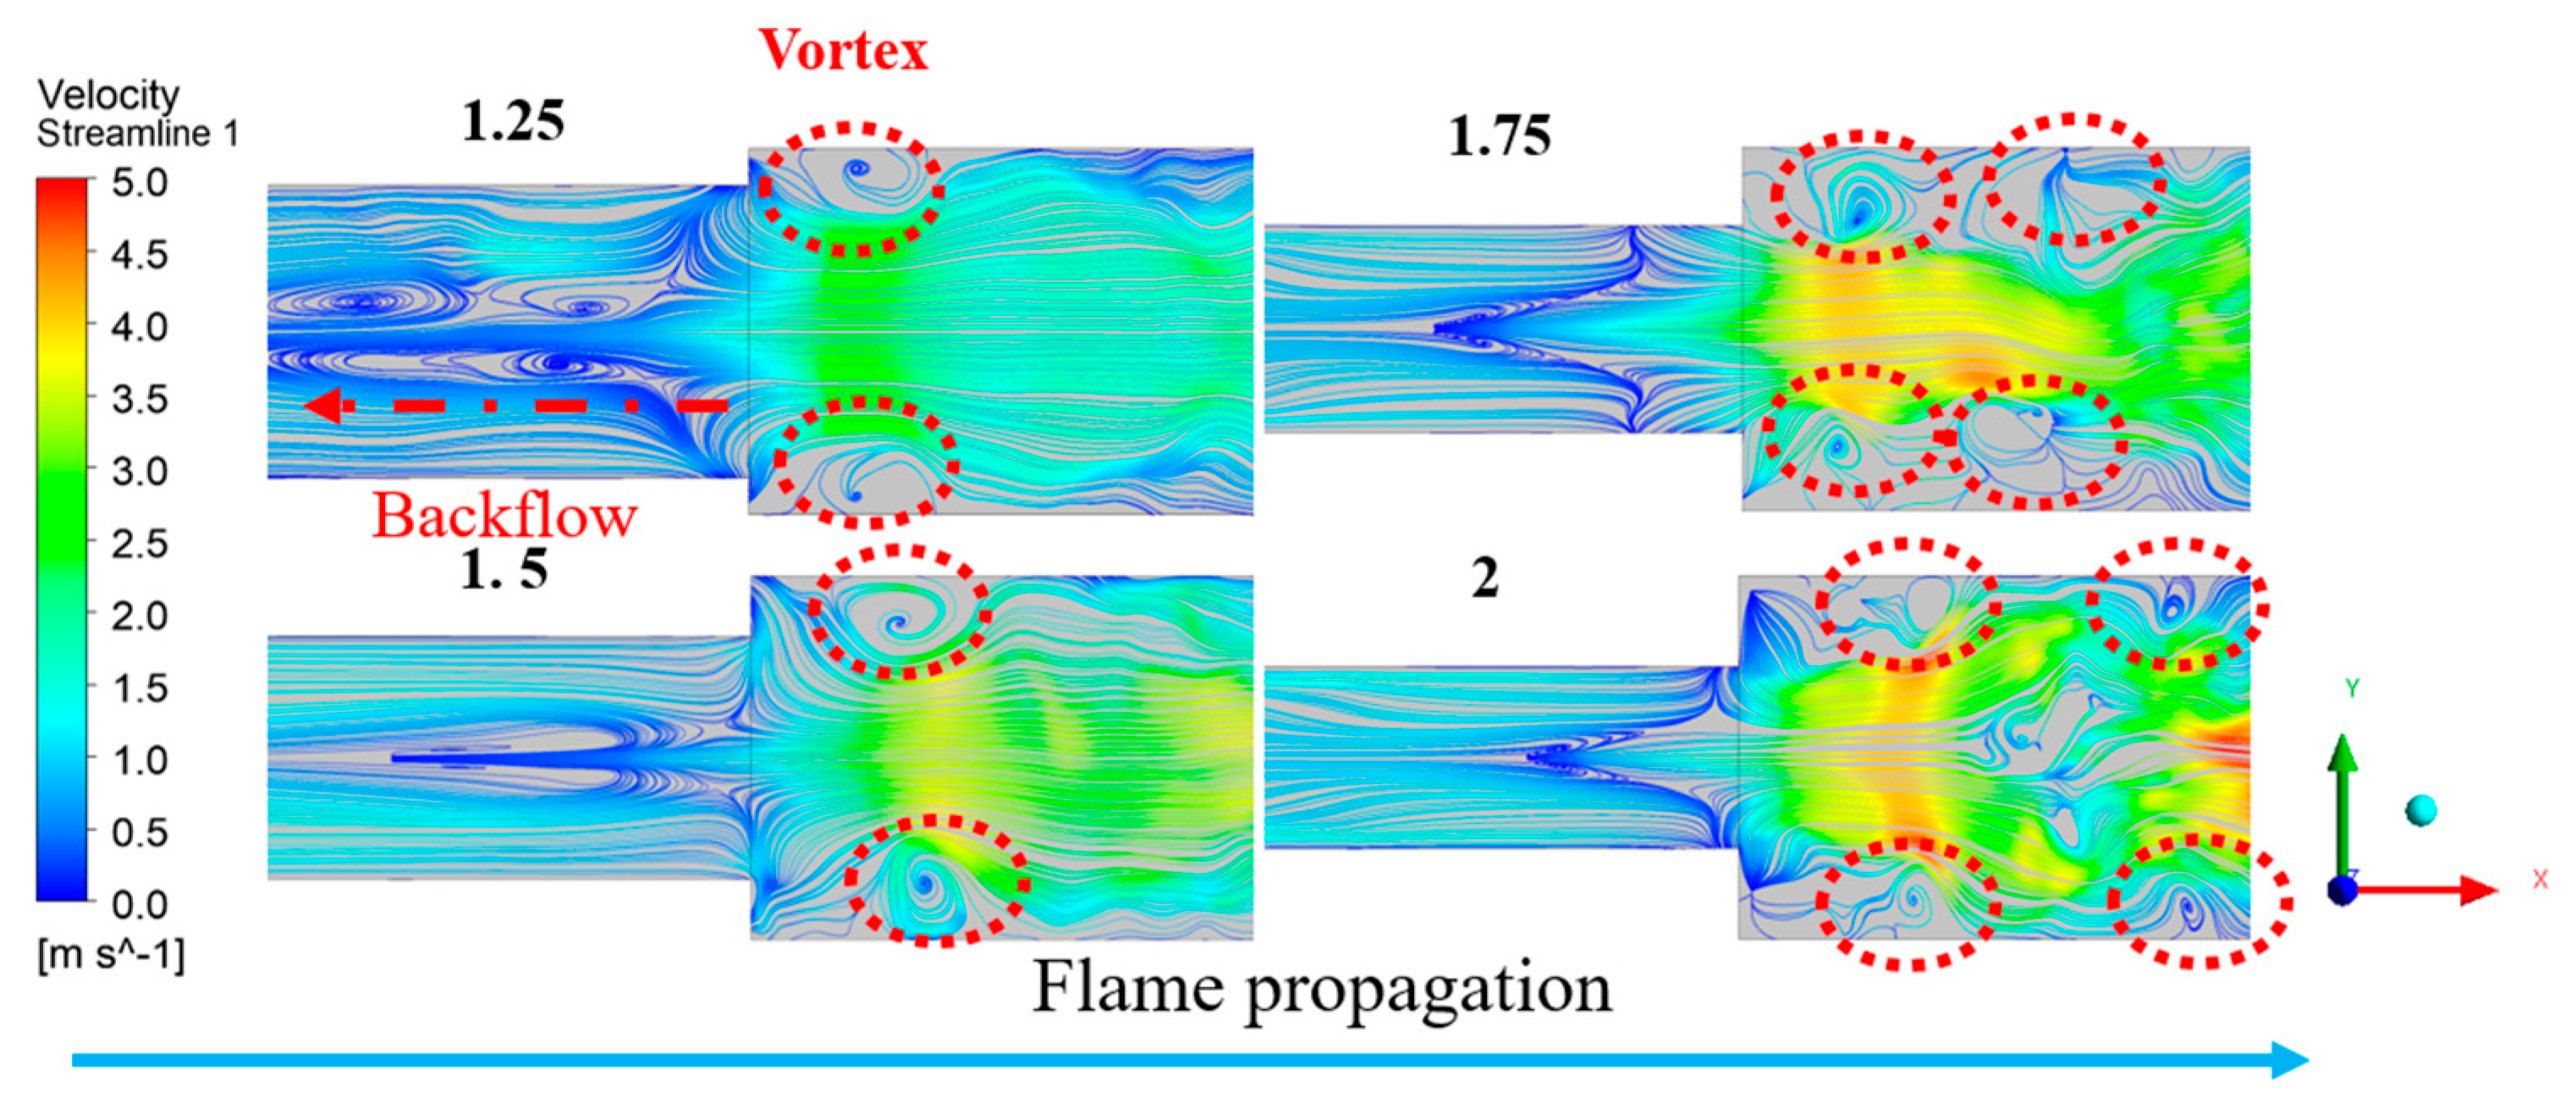
Figure 9 illustrates the evolution of vortex structures under varying diameter ratios and their significant regulatory effects on flame propagation. As the diameter ratio increases from 1.25 to 2.0, the vortex structure changes from stable symmetry to complex irregularity, and the turbulence intensity is greatly enhanced, which affects the speed and shape of flame propagation. When the diameter ratio is 1.25, the lower turbulence intensity and moderate pressure gradient result in a stable, symmetrical double-vortex structure with minimal flow disturbance. The combustion reaction is primarily confined to the high-temperature core region, and the flame propagation speed is limited, exhibiting predominantly laminar characteristics. As the diameter ratio increases to 1.5, boundary layer separation and turbulent mixing are intensified significantly, causing vortex clusters to migrate downstream and expand, thereby increasing the flame propagation speed. The flame morphology begins to fluctuate, and the combustion reaction region broadens.
When the diameter ratio increases to 1.75 and 2.0, the vortex structures become increasingly complex, gradually forming an asymmetrical multi-vortex system accompanied by evident vortex core splitting and entrainment phenomena. The turbulence intensity rises significantly, accelerating flame propagation. However, the intensified turbulent disturbances also induce irregularities in the flame boundary, manifesting as localized fragmentation, and complex entrainment characteristics, thereby exacerbating flame propagation instability. Particularly at a diameter ratio of 2.0, the vortex structure becomes highly intricate, forming a characteristic four-vortex system. The formation of the four-vortex structure is primarily driven by flow separation, increased turbulence intensity, and the development of shear layers. When the flame propagates to the sudden expansion region, the flow field undergoes dramatic changes: after the high-pressure fluid from the upstream flame front enters the expansion zone, the inertia of the flow causes vortex pairs to form at the expansion rear wall. At this point, two main vortices are formed above and below the expansion wall. Meanwhile, due to fluid instability and the thermal expansion of high-temperature combustion gasses, two additional secondary vortices are generated in the low-pressure region after the expansion. These secondary vortices interact with the main vortices, resulting in a complex four-vortex structure at the flame front. As the diameter ratio increases (1.75 → 2.0), the scale of the main vortices enlarges, the strength of the secondary vortices increases, and this ultimately intensifies turbulence disturbances, which in turn affects the flame propagation mode, making the flame shape more irregular and fragmented. The turbulence–combustion coupling reaches its peak, which greatly improves the combustion efficiency. However, local overheating and high-energy dissipation increase the nonlinearity of flame propagation, making control more difficult.
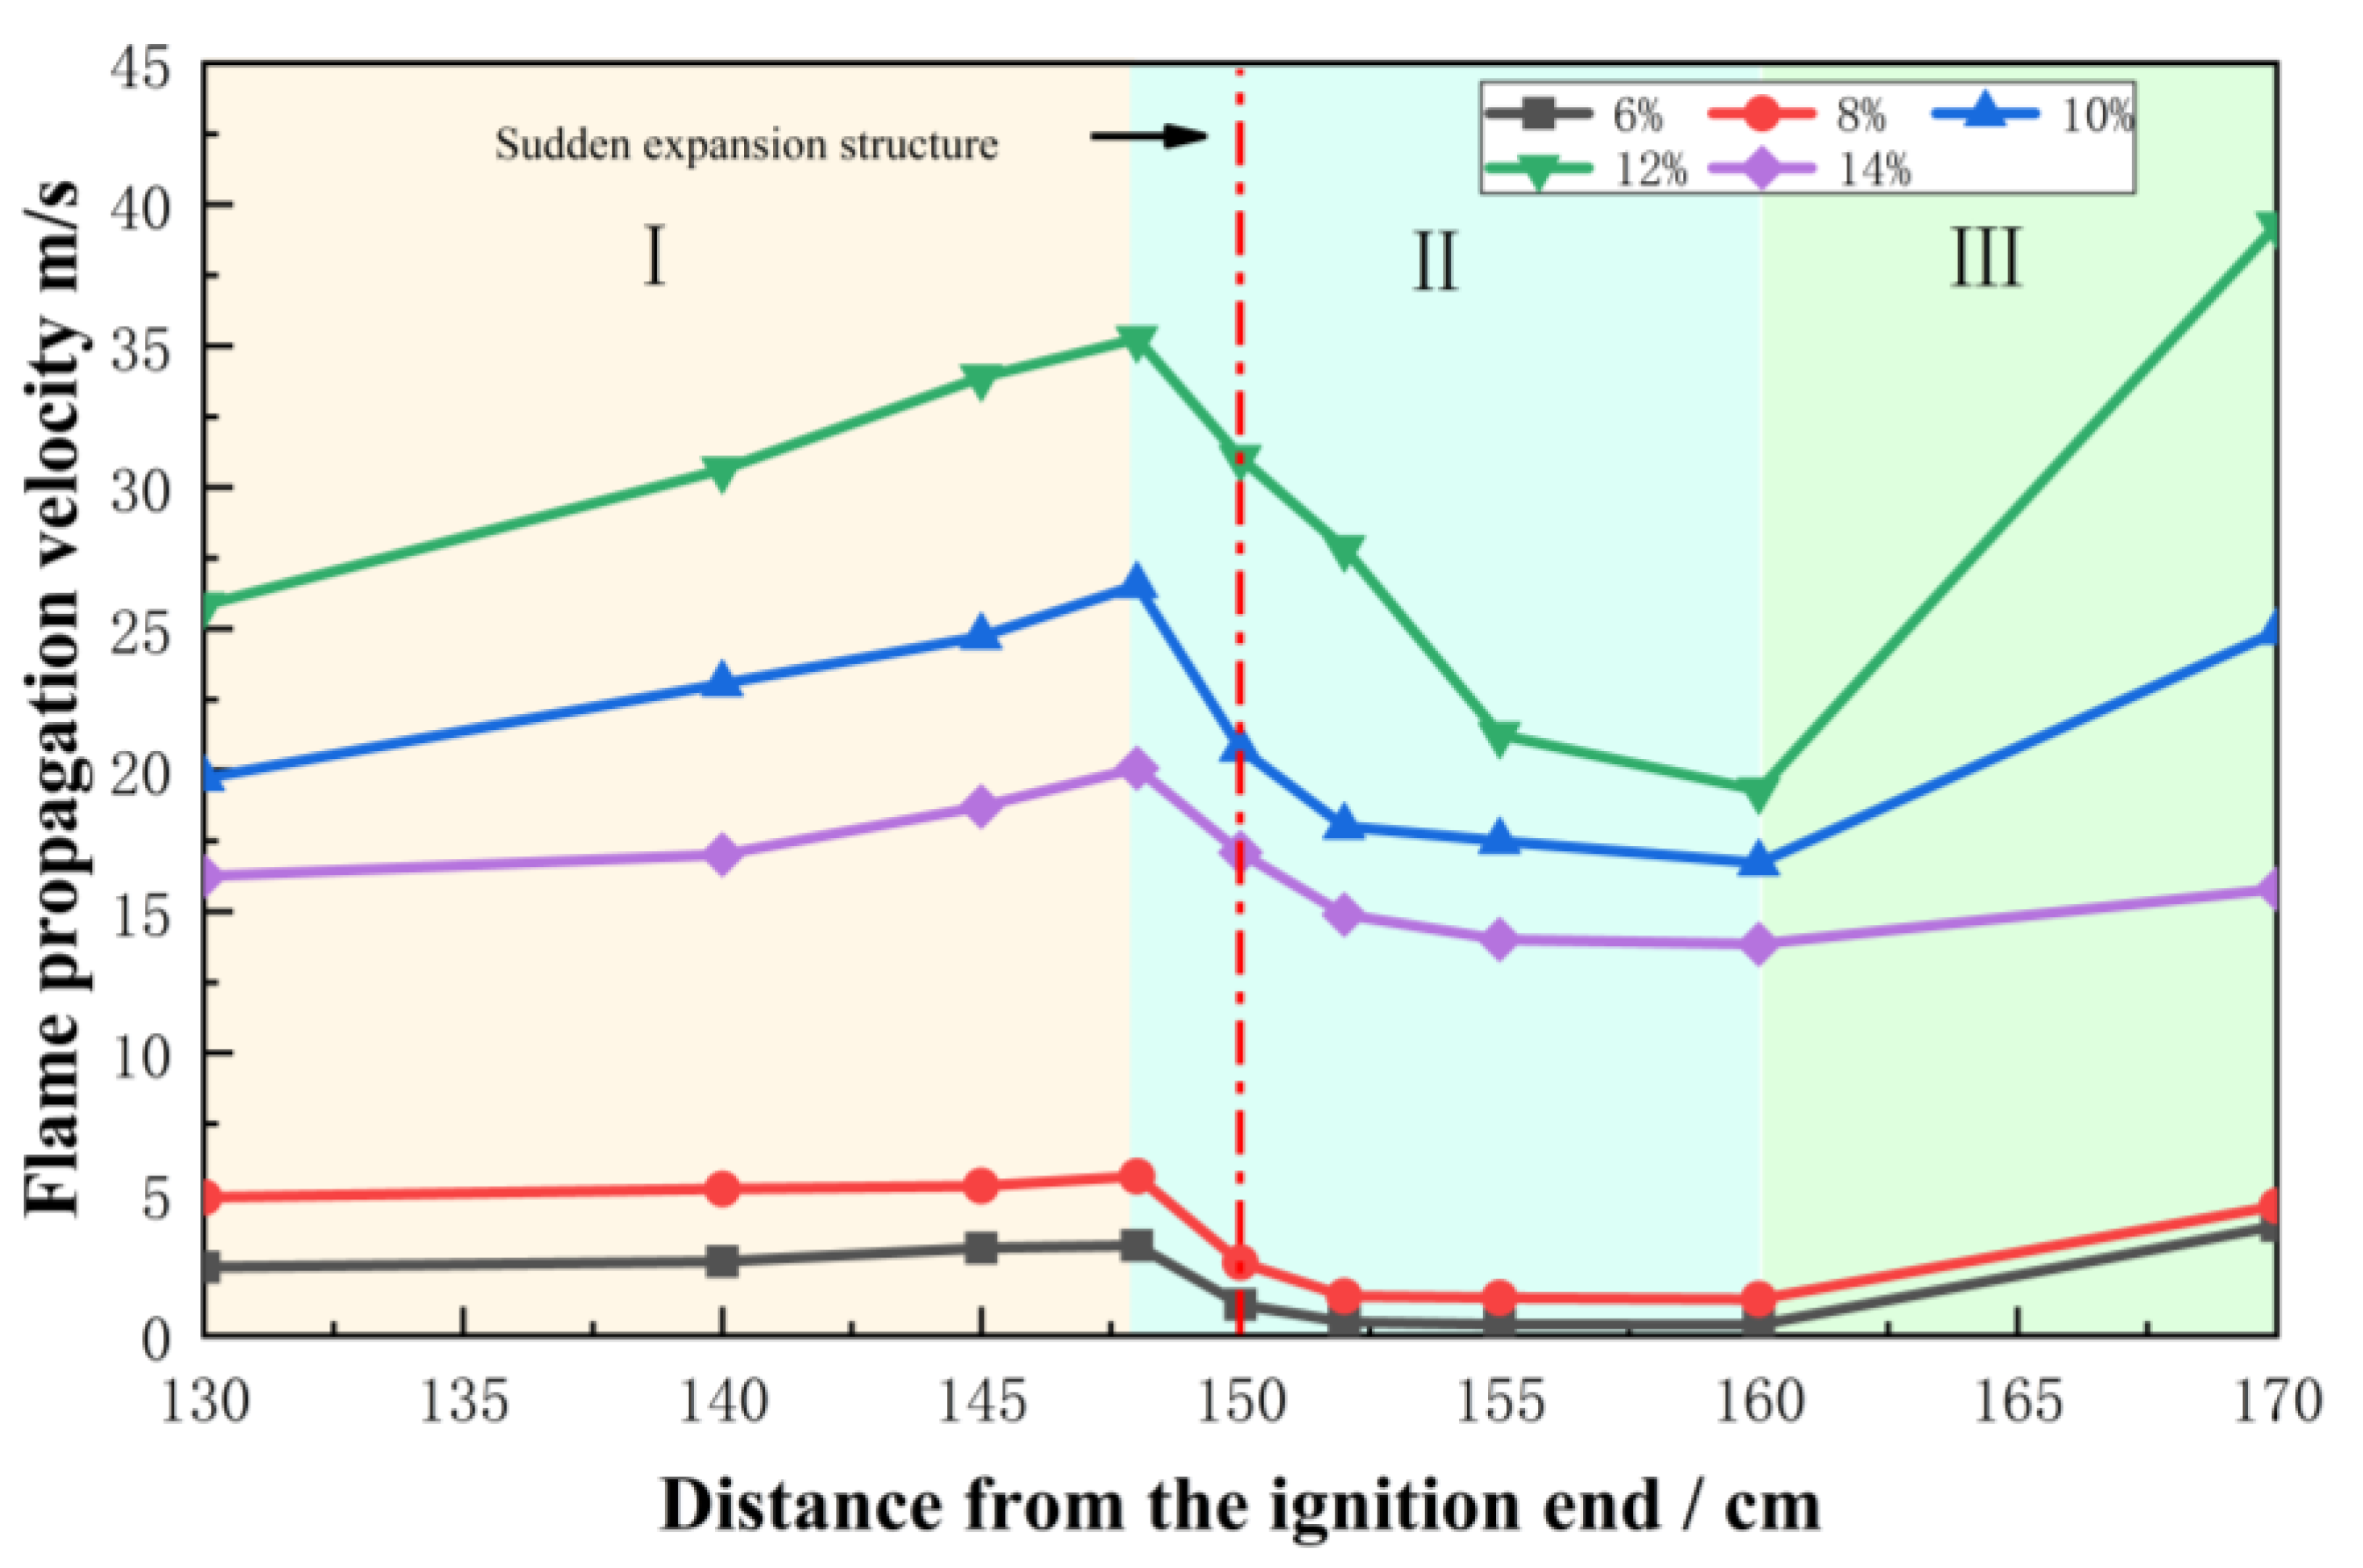
Figure 10 illustrates the change in flame front propagation speed at sudden expansion structures for methane–air premixed gas under initial room temperature, atmospheric pressure, 1 J ignition energy, and methane volume fractions of 6%, 8%, 10%, 12%, and 14%. Under all conditions, the flame front propagation speed, including three stages: a rapid increase, a rapid decrease, and a secondary increase caused by the sudden expansion of the pipeline structure. These stages are categorized as an acceleration phase (I), a deceleration phase (II), and a secondary acceleration phase (III).
In the first phase, influenced by the high-temperature and high-pressure precursor shock wave [31], the unburned gas ahead of the shock is rapidly ignited, causing a continuous increase in flame speed and reaching a peak before the sudden expansion (Figure 10I). In the second phase, as the flame front passes through the sudden expansion structures, its propagation speed decreases sharply to a minimum. The sudden increase in the flow cross-section triggers the expansion of the fluid domain, causing the flame front to propagate at a reduced speed within a certain distance due to the inertia effect. Once the flame front passes the sudden expansion section, the increase in cross-sectional area leads to a sharp rise in flame contact area, creating a significant discrepancy between the shock wave speed and the flame front speed. According to flow separation theory and the Kutt–Joukowski theorem, this causes decoupling of the shock wave from the flame front, resulting in flame quenching (extinction). The decoupling phenomenon reduces the chemical reaction rate for forward flame propagation, providing insufficient energy for flame spread and causing a rapid drop in flame speed.
When the shock wave reaches the sudden expansion section, the longitudinal expansion of the flame front collides with the pipeline walls, resulting in reflected and shear waves, which may trigger a secondary explosion. According to wave theory and shock wave interaction theory, these reflected and shear waves can destroy the flame structure, making it unable to maintain its traditional shape during propagation. The flame structure transitions into a “shattered form” and continues downstream in this irregular configuration (Figure 10II).
In the third stage (Figure 10III), the flame propagation speed undergoes a secondary acceleration. Under the combined influence of vortex motions and Kelvin–Helmholtz instability, the flame is driven by flow expansion to form localized turbulent vortex motion at a higher speed, thus improving the local mass and energy transfer efficiency in the reaction zone. Consequently, the flame front undergoes intense turbulent combustion and experiences secondary acceleration.
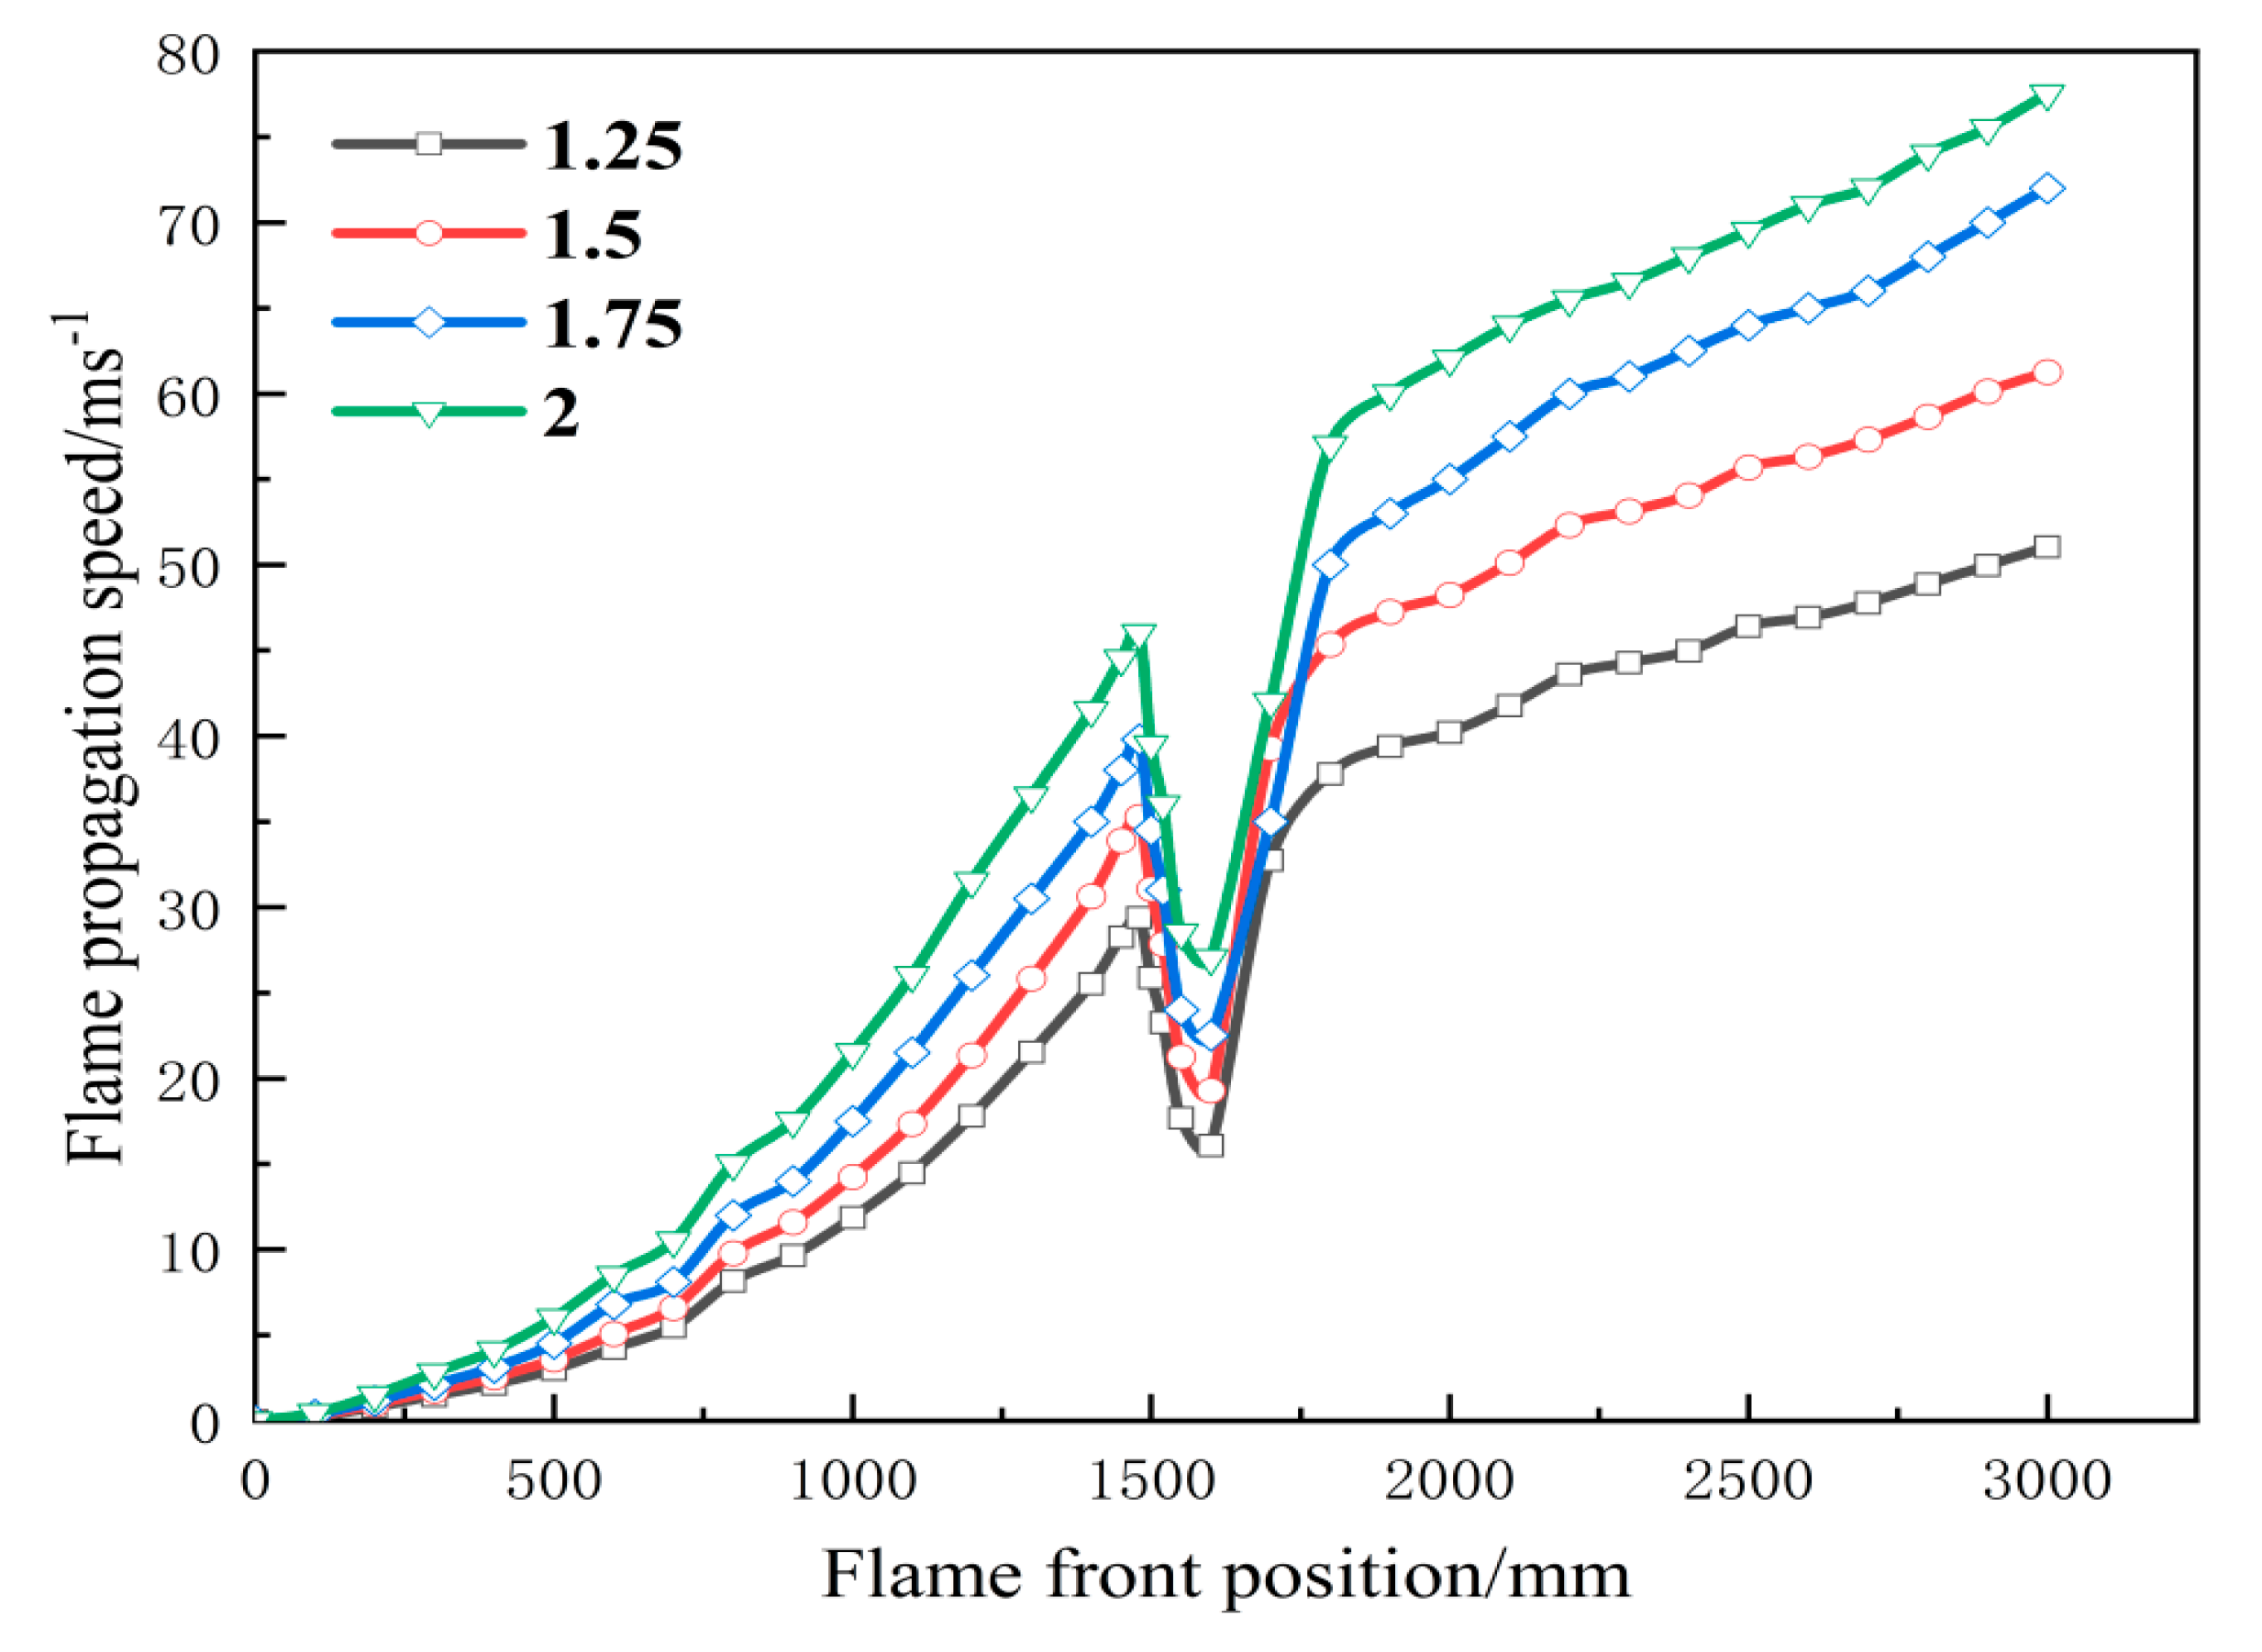
Figure 11 shows the change in flame propagation speed with flame front position in the suddenly expanded pipelines under different diameter ratios (1.25, 1.5, 1.75, 2.0). Before the sudden expansion location (1500 mm), the flame velocity increases almost linearly with distance and accelerates more significantly at larger diameter ratios. For instance, at 1000 mm, the flame speed at a diameter ratio of 2.0 is 1.81 times that at 1.25. This is because larger diameter ratios induce local disturbances earlier, reducing the critical Reynolds number for turbulence generation. At the sudden expansion location, the flame propagation speed reaches a local peak due to intensified turbulence.
After the sudden expansion, turbulence energy dissipation intensifies, resulting in a significant drop in flame speed between 1500 and 1600 mm. This decline is caused by energy transfer from large-scale to small-scale vortices and the shrinkage of the recirculation zone, which reduces turbulent flame wrinkling. In the subsequent turbulence redevelopment phase (1600–1800 mm), the flame propagation velocity undergoes a significant increase due to changes in turbulence characteristics. For instance, with a diameter ratio of 2.0, the flame propagation velocity rises from 28.5 m/s to 42 m/s, an increase of approximately 47.4%. This change indicates that the redevelopment of turbulence significantly accelerates the flame propagation speed. Beyond the sudden expansion location (>1800 mm), the flame propagation speed stabilizes, though the residual effects of enhanced turbulence persist. This highlights the complex coupling between geometric sudden expansion and turbulence characteristics, which significantly influences the entire flame propagation process.
When the premixed gas is ignited, the flame front initially appears as a “hemispherical” flame during the early propagation phase, primarily governed by the laminar burning velocity [32] and expansion rate [33]. At the methane concentrations of 10%, 12%, and 14% (close to or slightly above the stoichiometric ratio), the radial growth of the flame is constrained, and the propagation speed in the central axis region increases sharply. The higher propagation speed strengthens deflagration, allowing the flame to overcome the Kelvin–Helmholtz and Rayleigh–Taylor instabilities and expand into the tube in a fingertip shape. The flame propagation speeds reach 26.53 m/s, 35.26 m/s, and 20.28 m/s, respectively, leading to the formation of a “tulip” flame structure.
After passing through the sudden expansion structure, the propagation speed decreases significantly. When the methane concentrations are 10% and 12%, the flame speeds drop to 16.71 m/s and 19.28 m/s, respectively, but the “tulip” flame remains unchanged. However, at 14% concentration, the flame speed decreases to 13.85 m/s, causing the flame to fragment and the “tulip” structure to disappear. This indicates that the “tulip” flame structure is closely associated with flame propagation speed. When the flame propagation speed is between 16 m/s and 35 m/s and approaches the sudden expansion structure, the combined effects of turbulence intensification and flow-field instability gradually develop the flame front into a typical “tulip” flame structure.
As the propagation speed decreases, the wall shear forces the flame to stretch and deform, causing the unburned regions to bend toward the burning area. Additionally, the flame is influenced by Kelvin–Helmholtz and Rayleigh–Taylor instabilities [34], transforming it into an unstable flame. This instability generates a large-scale reverse wake flow toward the flame front, increasing the curvature of the flame and inverting its structure. The middle section of the flame front begins to form a concave shape, with small-scale turbulence causing wrinkling and distortion. With the deepening of the concavity, a symmetrical concave flame structure appears, and the flame transitions to a turbulent state, forming a “tulip flame” structure. When the methane concentrations are 6% and 8%, the flame propagation speed decreases further. When the flame front reaches the sudden expansion structure, it closely adheres to the pipeline wall as it moves forward. In this process, buoyancy [35] plays a relatively larger role in influencing flame propagation at lower speeds.
The larger diameter ratio significantly broadens the velocity range over which the “tulip flame” can exist by intensifying turbulent effects. At a diameter ratio of 2.0, the severe geometric mutation at the sudden expansion amplifies shear layer instabilities, such as Kelvin–Helmholtz instability, generating larger-scale vortices and higher turbulent fluctuation velocities (u’). Consequently, the turbulent Reynolds number (ReT) increases significantly, enhancing the turbulent combustion rate. Under these conditions, the flame propagation speed remains between 16 and 42 m/s, delaying post-expansion speed decay and stabilizing the “tulip flame” structure. In contrast, at a diameter ratio of 1.25, the insufficient turbulence generation causes the flame propagation speed to rapidly decline below 15 m/s, resulting in the disappearance of the “tulip flame”.

4.2. Impact of Sudden Pipeline Expansion on Explosion Overpressure Characteristics

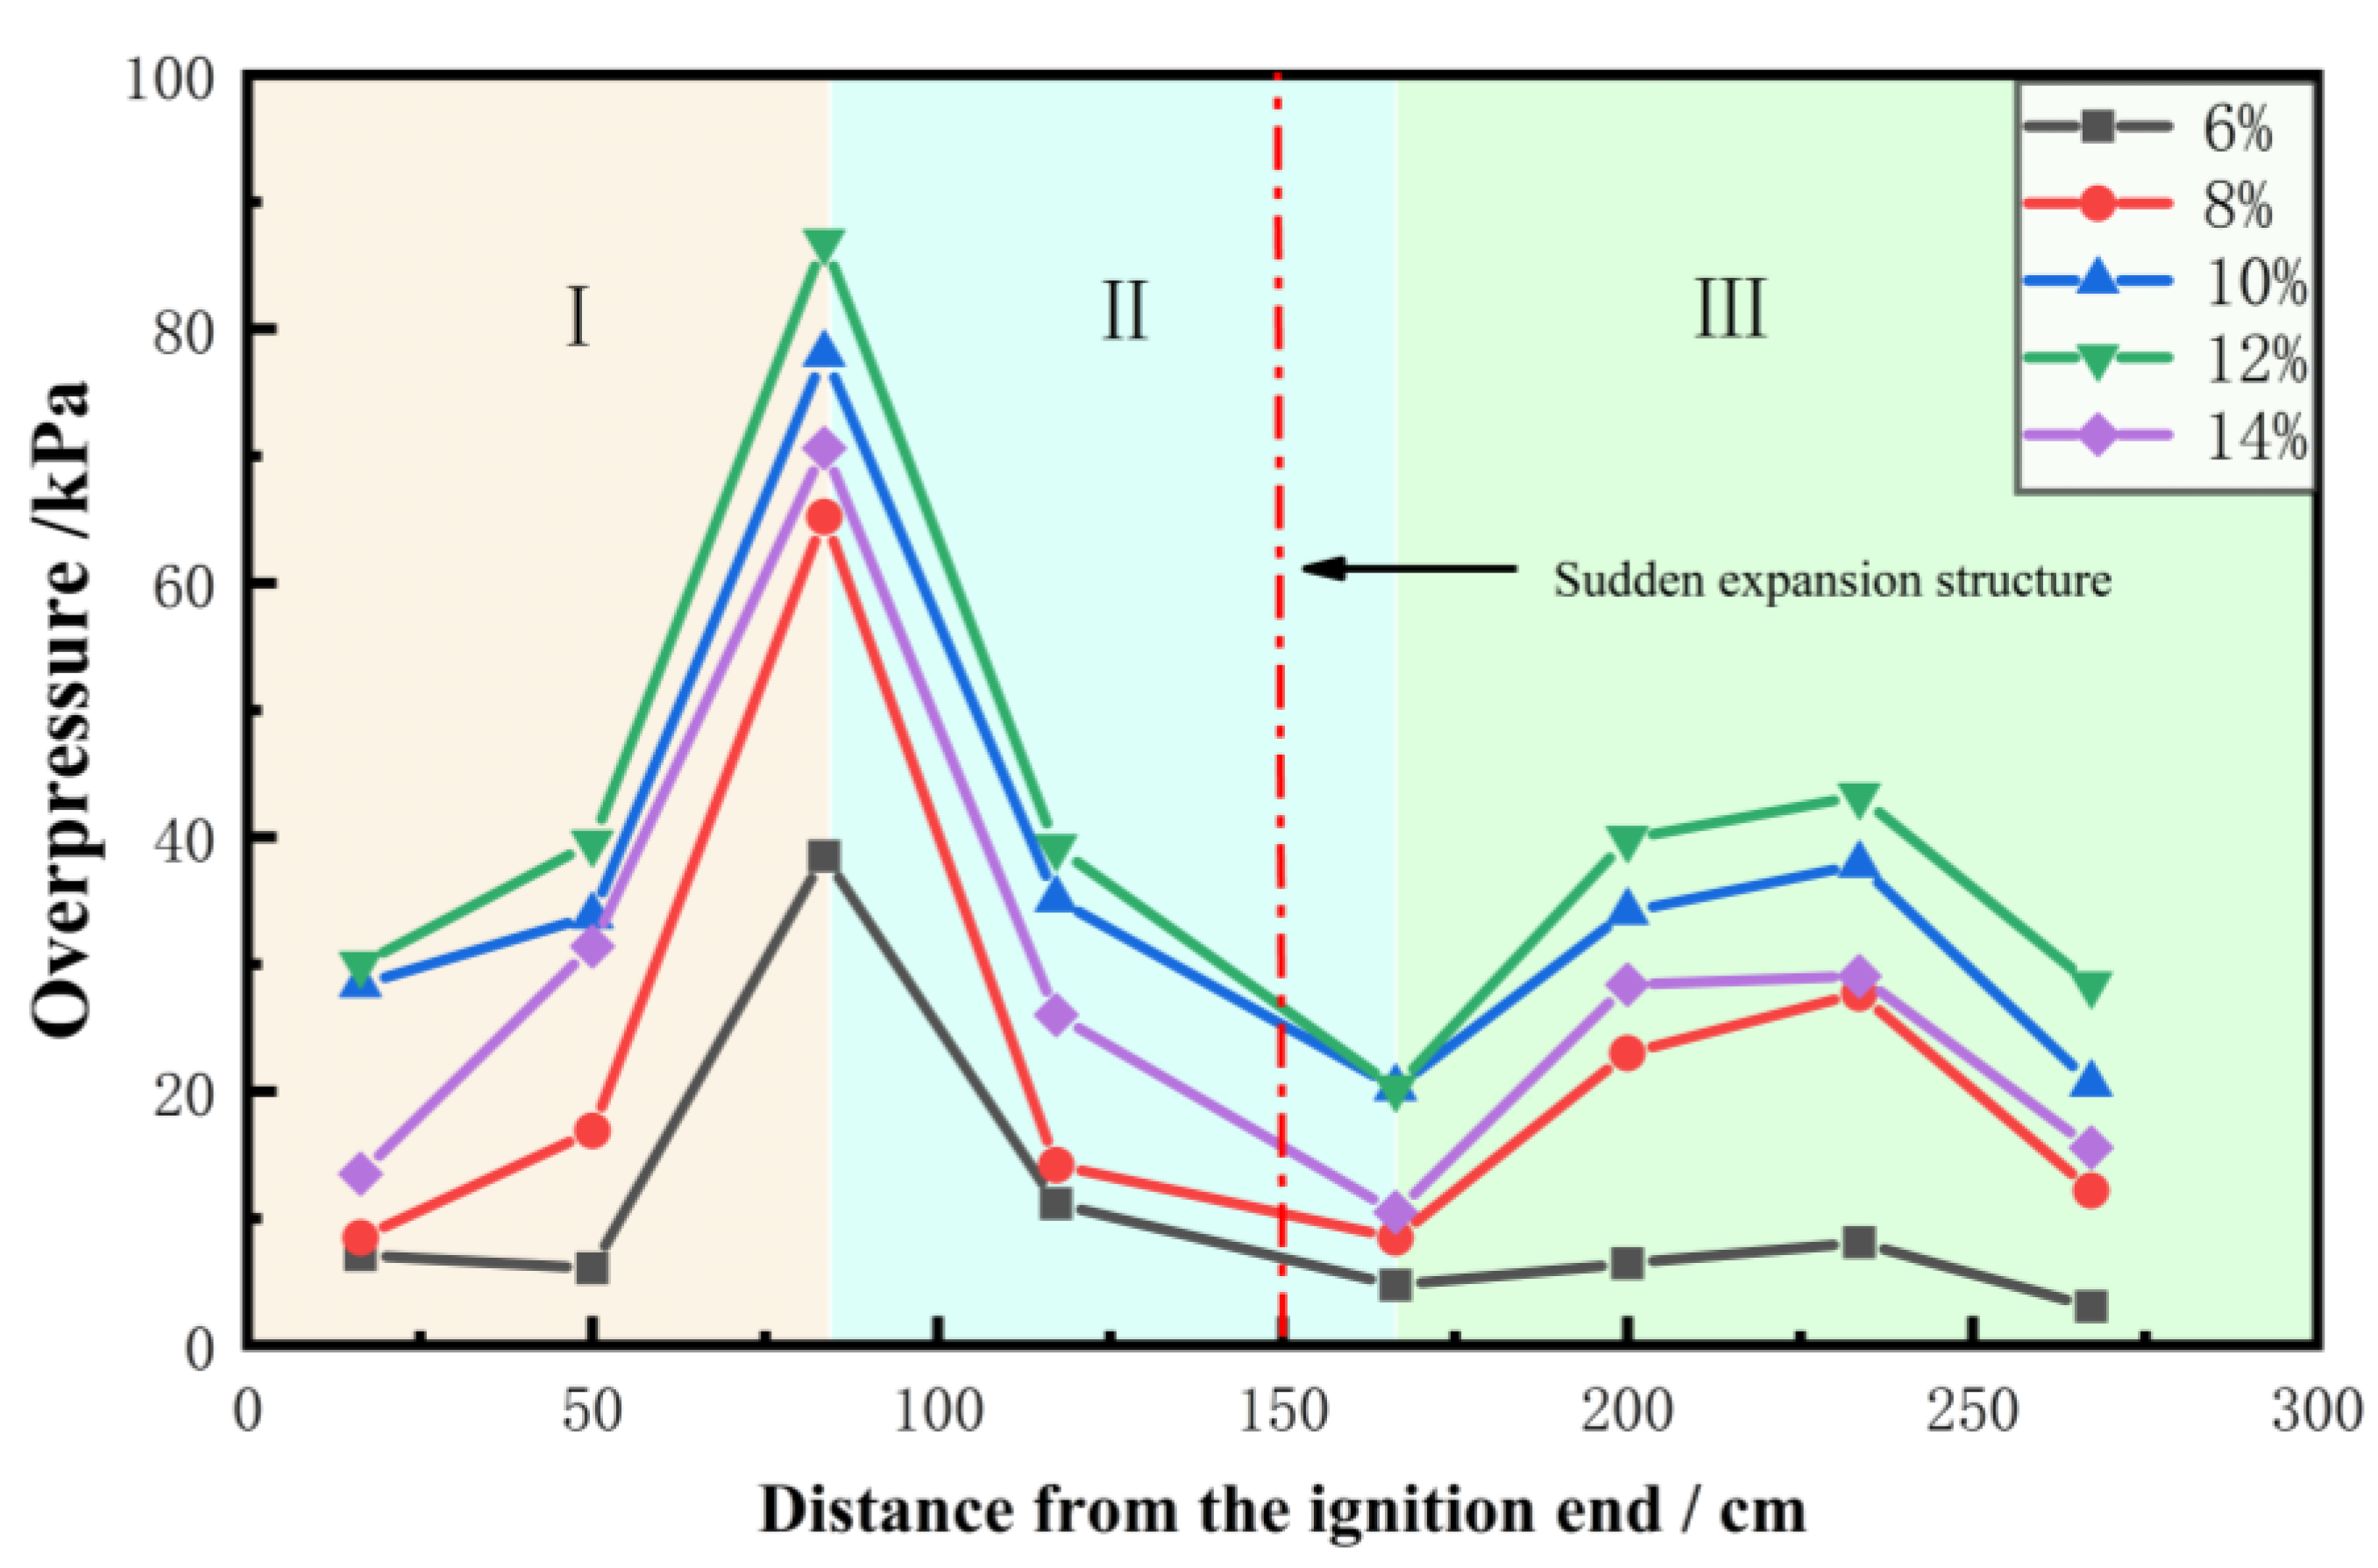
Figure 12 illustrates that the experimental results reveal the pressure variation of the explosion wave can be divided into three principal phases: the initial explosion phase (Figure 12I), the rapid decay phase (Figure 12II), and the secondary ignition and quenching phase (Figure 12III). During the initial phase, the methane–air premixed gas undergoes rapid combustion under a high-pressure pulse, with the released heat causing a sharp pressure rise and forming a precursor shock wave. Overlapping reflected waves result in the first pressure peak [36].
In the second phase, the interaction between compression waves, rarefaction waves, and reflected waves significantly decelerates flame propagation and induces a rapid pressure decline. The minimum pressure occurs approximately 25 cm downstream of the sudden expansion structures.
In the third phase, as the explosion wave transitions into the larger-diameter pipeline through the sudden expansion structures, the pressure rises again but remains lower than the maximum pressure observed in the smaller upstream pipeline. During this phase, the separation of the shock wave from the flame front, combined with wave reflection and refraction, generates a complex wave system structure, which significantly reduces the local explosion overpressure. In the later stages of the explosion, although reignition occurs in the larger pipeline and accelerates flame propagation, the explosion intensity is lower than that in the smaller pipeline due to the increased pipeline volume and partial consumption of combustible gas. As a result, the maximum explosion overpressure in the larger pipeline remains lower than that in the smaller pipeline.
Figure 13 illustrates the relationship between the peak overpressure during the deflagration process under different methane concentrations, the overpressure downstream of the sudden expansion structures, and the corresponding attenuation rate [37]. At a methane concentration of 6%, the attenuation rate reaches its highest value (68.8%) due to the lower explosion energy, which generates weaker pressure waves. In this scenario, the diffusion effect and energy dissipation mechanism within the sudden expansion pipeline significantly reduce the intensity of downstream pressure waves. After passing through the sudden expansion structures, a portion of the pressure wave energy is reflected upstream, while another portion dissipates into the surrounding fluid through turbulence, leading to significant attenuation of the downstream pressure wave.
As the methane concentration increases to 8–12%, the attenuation rate decreases significantly (40.5%, 45.1%, and 36.8%, respectively). This trend is attributed to the increase in explosion energy. When the concentration approaches the stoichiometric ratio, the combustion reaction intensifies, releasing significantly more energy and thereby strengthening the pressure waves. Under the influence of strong pressure waves, the energy dissipation capacity of the sudden expansion structures becomes relatively insufficient, resulting in lower pressure reduction efficiency. At this stage, pressure wave propagation is dominated by energy concentration and shock wave reinforcement, while the buffering effect of the sudden expansion is diminished.
When the methane concentration is 14%, the attenuation rate increases again to 44.5%. This phenomenon suggests that although the initial peak pressure decreases slightly, the buffering effect of the sudden expansion structures is relatively enhanced.
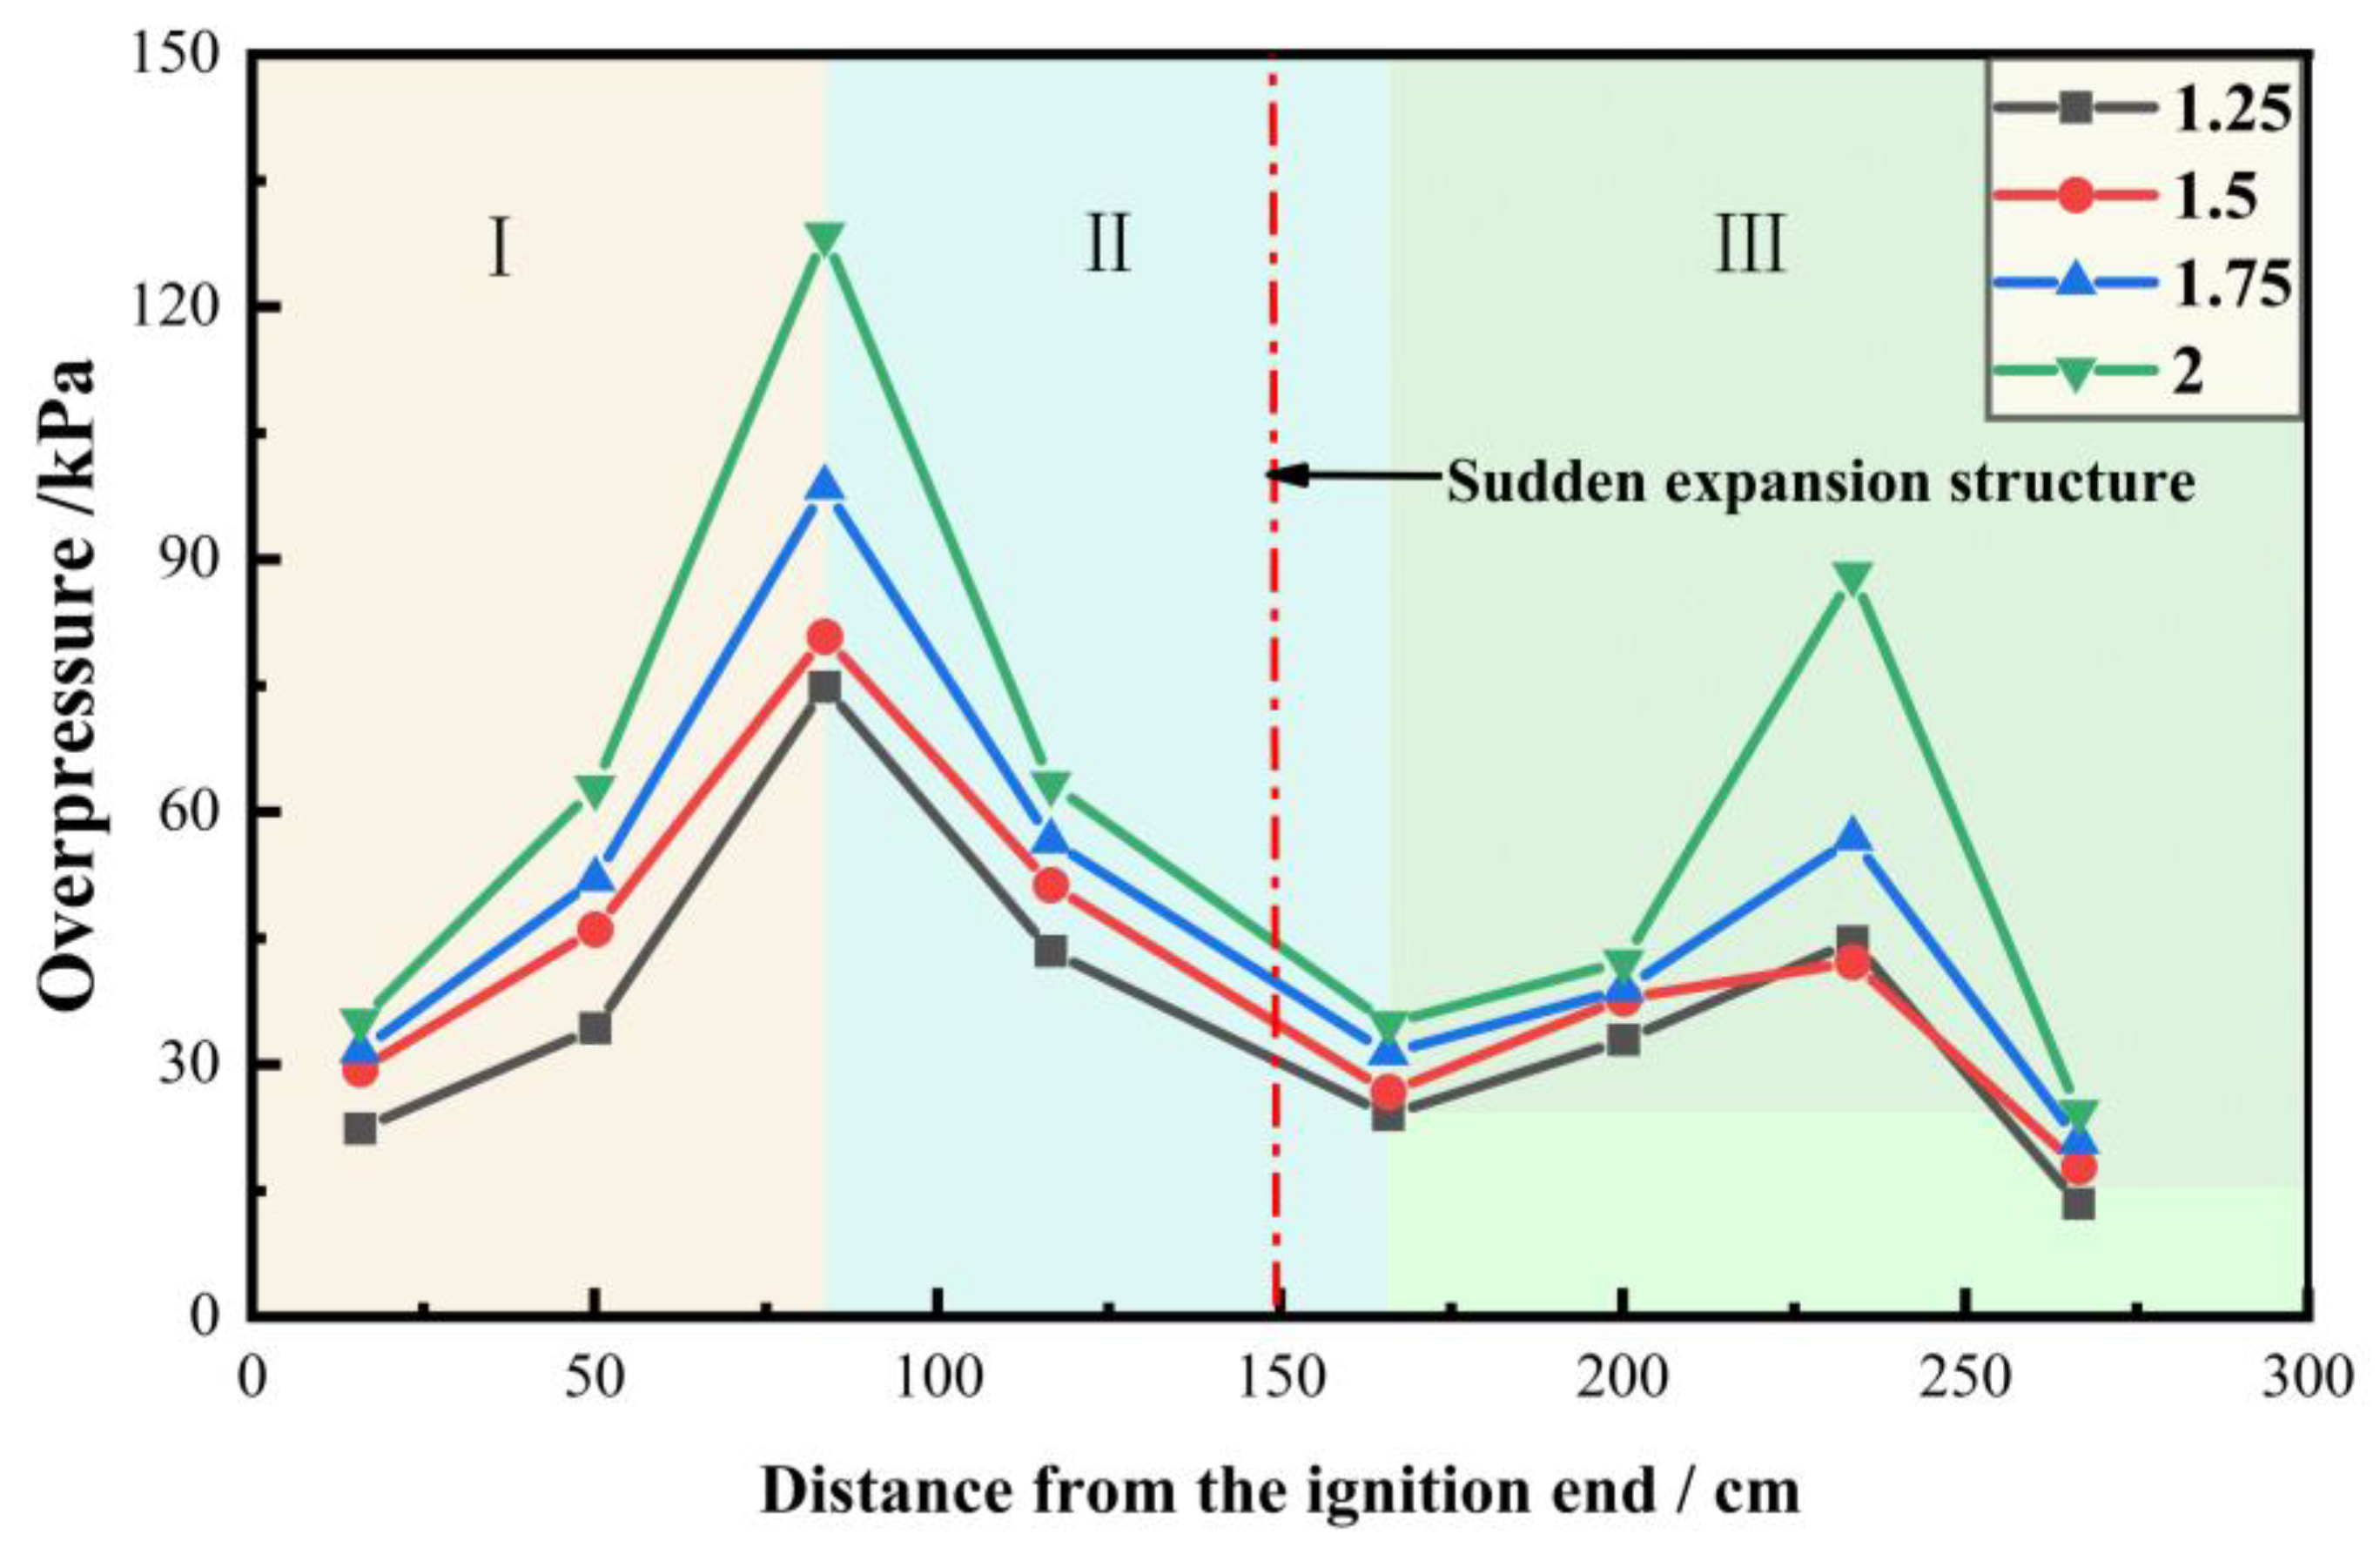
Figure 14 illustrates the regulating mechanism of flame propagation and overpressure distribution with respect to the diameter ratio. In Region I, a larger diameter ratio results in more pronounced turbulence disturbances and higher heat release rates, leading to higher overpressure peaks. In Region II, the sudden expansion structure reduces the intensity of pressure waves through flow separation and energy dissipation, with the overpressure reaching its minimum point at the expansion for all diameter ratios. In Region III, larger diameter ratios (e.g., 1.75 and 2.0) exhibit significant secondary overpressure peaks downstream, driven by turbulence redevelopment and the superposition of reflected waves, which further amplify the pressure wave intensity.
Overall, larger diameter ratios increase combustion intensity and turbulence but also exacerbate system instability and pressure fluctuations. Although sudden expansion structures promote heat release, careful control is essential to achieve sufficient pressure wave attenuation and ensure system safety.
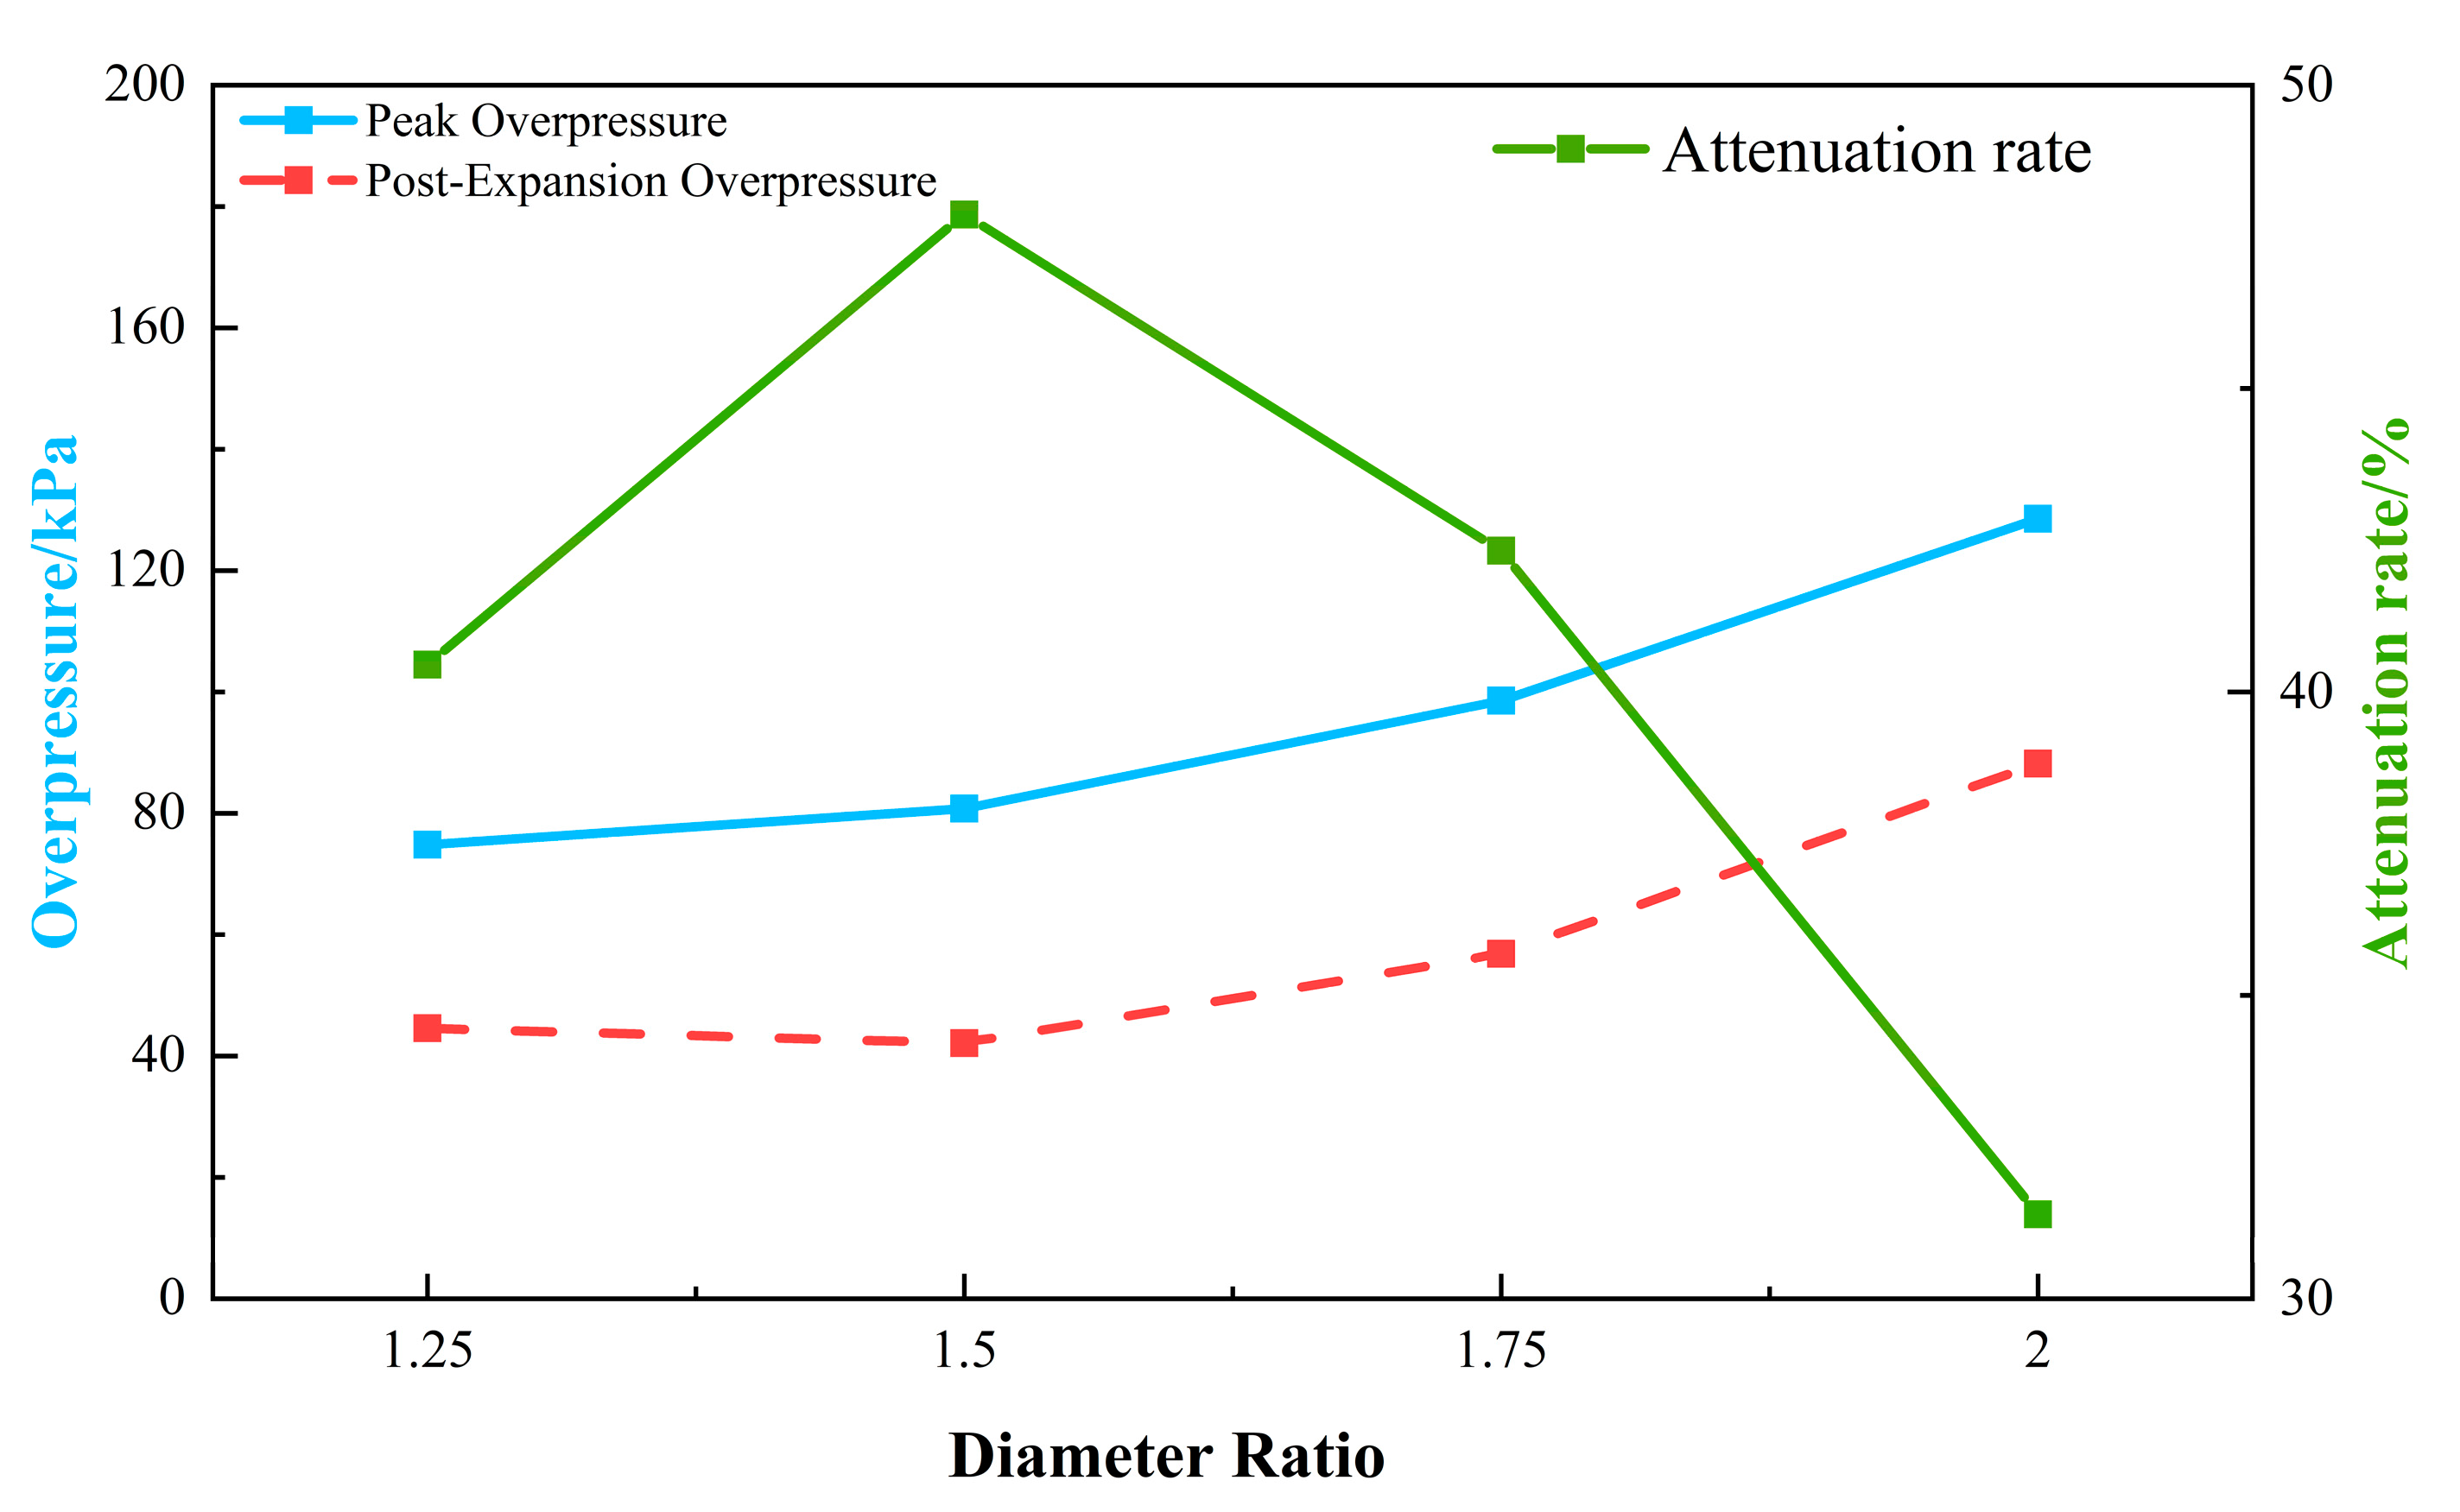
Figure 15 illustrates that as the diameter ratio increases from 1.25 to 2.0, the peak overpressure before the sudden expansion pipeline gradually rises from 75 kPa to 129 kPa, while the peak overpressure after the sudden expansion pipeline increases from 45 kPa to 89 kPa, corresponding to increases of 72% and 98%, respectively. Meanwhile, the attenuation rate exhibits a “first increase, then decrease” trend. At a diameter ratio of 1.5, the attenuation rate reaches a maximum of 47.61%, achieving optimal overpressure attenuation and the most effective pressure relief, thereby minimizing overpressure hazards during deflagration propagation.
However, as the diameter ratio further increases to 1.75 and 2.0, the excessive cross-sectional expansion intensifies the reflected waves and turbulence disturbances, causing the overpressure attenuation rate to decrease to 41.84% and 31.01%, respectively, while the residual pressure rises significantly, posing potential risks to system safety. Additionally, the data indicate that the increase in overpressure before the sudden expansion pipeline is greater than the increase after it, suggesting a more pronounced accumulation of reflected pressure upstream of the sudden expansion. Beyond the sudden expansion, dissipation by expansion waves and turbulence mixing exerts greater influence.

5. Conclusions

This research combines experimental and numerical simulation methods to investigate the influence of sudden expansion structures on methane–air premixed gas deflagration. The main findings are summarized as follows:
The sudden expansion structures impose both suppressive and facilitative effects on the combustion–explosion process of premixed gasses. The flame speed and explosion overpressure exhibit a consistent trend of increasing, decreasing, and then increasing again along the flow direction. When the diameter ratio is 2.0, the flame velocity and peak overpressure increase by 81% compared to 1.25 and 69%, respectively.
The diameter ratio plays a critical role in regulating overpressure attenuation in a sudden expansion pipeline. At 1.5 ratio, the pipeline overpressure attenuation reaches the best (47.61%). When the ratio is 1.25, the turbulence effect is weak, the energy dissipation is limited, and the attenuation rate is only 36.74%. When the ratio is further increased to 1.75 and 2.0, the attenuation efficiency decreases to 41.84% and 31.01%, respectively, due to excessive turbulence intensity and enhanced wave reflection. Therefore, a diameter ratio of 1.5 has significant advantages in optimizing overpressure attenuation and improving system safety.
The synergistic regulation of sudden expansion structures and diameter ratios has a substantial impact on turbulence intensity, flame propagation speed, and the evolution of vortex structures, shedding light on their coupling mechanisms in “tulip flame” formations and their turbulence characteristics. A larger diameter ratio enhances turbulence intensity and decelerates the decay of flame propagation speed, thereby significantly extending the stable range of the “tulip flame” to 16–42 m/s. Furthermore, as the diameter ratio increases, the vortex structure transitions from a symmetric, stable double-vortex system near the expansion inlet to an asymmetric multi-vortex system, culminating in a characteristic four-vortex configuration at a ratio of 2.0.
This study has some limitations that warrant further exploration in future work. First, although experimental and numerical simulation methods have been used to analyze the behavior of gas explosions, the experimental pipeline size is relatively small, and the study focuses solely on methane–air mixtures. These conditions may not fully represent the complexity of large-scale pipeline systems. Therefore, future research could expand the experimental scale and validate the applicability of the results from small-scale experiments in larger pipeline systems, examining the effects of flame propagation, turbulence, and temperature variations in larger configurations. Second, the combustion behavior of different gas types (such as hydrogen and liquefied petroleum gas) may differ from that of methane, and future studies could explore the generalizability of these findings by investigating additional gas species. Furthermore, this study primarily focuses on the impact of pipeline geometry and flame propagation. Future research could consider the coupling effects between pipeline structures (e.g., bends, valves) and flame propagation, optimizing pipeline design accordingly. Lastly, future research could combine advanced numerical simulation techniques to improve the predictive accuracy of gas explosion processes and strengthen the integration of experimental and simulated data, providing more data support and theoretical guidance for the design and safety of industrial pipeline systems.

Author Contributions

N.Z., reviewing and editing; Z.S., writing—original draft preparation; X.L. (Xue Li), reviewing and editing; B.C. and Y.L., investigation; Z.L. and C.Y.: data curation; X.L. (Xuanya Liu) and W.H.: validation; X.Y., Software. All authors have read and agreed to the published version of the manuscript.

Funding

This study was funded by the National Key R&D Plan “Internet of Things and Smart City Key Technologies and Demonstration” Key Special Project (No. 2020YFB2103504) funded by the Ministry of Science and Technology of China; the National Key R&D Program of China (No. 2017YFC0805100) funded by the Ministry of Science and Technology of China; the Natural Science Research Project of Higher Education Institutions of Jiangsu Province (No. 20KJB620004) funded by Jiangsu Provincial Department of Education; the Open Project of Jiangsu Key Laboratory of Oil and Gas Storage and Transportation Technology (No. CDYQCY202104) funded by Changzhou University; the Jiangsu Graduate Research and Practice Innovation Project (No. SJCX23_1566; No. SJCX22_1399; SJCX22_1400; SJCX22_1402; SJCX22_1403; SJCX24_1679; KYCX22_3102) funded by Jiangsu Provincial Department of Education; and the Research on Teaching Reform and Innovation of Graduate Education in Changzhou University (No. YJK2022011) funded by Changzhou University.

Data Availability Statement

The original contributions presented in this study are included in the article. Further inquiries can be directed to the corresponding author.

Conflicts of Interest

The authors declare no conflicts of interest. The funders had no role in the design of the study; in the collection, analyses, or interpretation of data; in the writing of the manuscript; or in the decision to publish the results.

Abbreviations

D1, D2Diameter of the pipeline at the initial and expanded sections
DDiameter difference between the two sections of the pipeline
LLength of the pipeline
PPressure
ΔPPressure difference
PmaxMaximum overpressure
PminMinimum overpressure
TKelvin
VfFlame propagation velocity
ΦEquivalence ratio of the methane–air mixture
ρDensity of the gas mixture
u’Subgrid turbulent fluctuation velocity
vViscosity of the gas mixture
ReTTurbulent Reynolds number
αThermal diffusivity
λTurbulent characteristic length scale
λLLaminar burning velocity
CpSpecific heat at constant pressure
βFlame stretch factor
KeffEffective turbulent kinetic energy
EEnergy
DrDiameter ratio of the sudden expansion

References

  1. Vo, D.H.; Vo, A.T.; Ho, C.M.; Nguyen, H.M. The role of renewable energy, alternative and nuclear energy in mitigating carbon emissions in the CPTPP countries. Renew. Energy 2020, 161, 278–292. [Google Scholar] [CrossRef]
  2. Li, L. National Gas Accident Analysis Report (2024, First Half Report)—Gas Safety Situation Continues to Improve. China Energy News 2024. Available online: http://paper.people.com.cn/zgnyb/pc/attachement/202410/14/8437e99a-3c63-43c8-9a5a-9a7b4924c136.pdf (accessed on 14 February 2025).
  3. Tang, C.; Zhang, S.; Si, Z.; Huang, Z.; Zhang, K.; Jin, Z. High methane natural gas/air explosion characteristics in confined vessel. J. Hazard. Mater. 2014, 278, 520–528. [Google Scholar] [CrossRef] [PubMed]
  4. Kundu, S.; Zanganeh, J.; Moghtaderi, B. A review on understanding explosions from methane–air mixture. J. Loss Prev. Process Ind. 2016, 40, 507–523. [Google Scholar] [CrossRef]
  5. Kuznetsov, M.S.; Alekseev, V.I.; Yankin, Y.G.; Dorofeev, S.B. Flame acceleration in a tube with variable cross-section. J. Phys. IV 2002, 12, 317–324. [Google Scholar] [CrossRef]
  6. Fan, H.Y.; Lu, F.K. Numerical simulation of detonation processes in a variable cross-section chamber. Proc. Inst. Mech. Eng. Part G J. Aerosp. Eng. 2008, 222, 673–686. [Google Scholar] [CrossRef]
  7. Zheng, Y.-S.; Wang, C. Numerical simulation for the influence of variable cross-section tube on explosion characteristics of methane. Trans. Beijing Inst. Technol. 2009, 11, 947–949. [Google Scholar]
  8. Liu, J.; Yao, L.; Zhang, Y.; Chen, J. Study on the Calculation Method of Local Pressure Drop for Variable Cross-Section Structure of Circular Pipe. J. Mech. Des. Manuf. 2016, 83–87. [Google Scholar] [CrossRef]
  9. Wang, J.; Wu, Y.; Zheng, L.; Yu, M.; Pan, R.; Shan, W. Study on the propagation characteristics of hydrogen/methane/air premixed flames in variable cross-section ducts. Process Saf. Environ. Prot. 2020, 135, 135–143. [Google Scholar] [CrossRef]
  10. Zhou, N.; Dai, Y.; Chen, B.; Li, X.; Zhao, H.; Huang, W. Research on the Propagation of Explosion in Gas Cloud in Variable Cross-Section Pipeline. J. Saf. Environ. 2021, 21, 599–606. [Google Scholar]
  11. Du, Q.; Zhu, Y.; Liu, P.; Liu, Z.; Liu, W. Thermo-hydraulic characteristic investigation of a circular tube inserted with constructal bifurcation semi-pipes by numerical simulation and PIV experiments. Int. J. Heat Mass Transf. 2024, 221, 125059. [Google Scholar] [CrossRef]
  12. Zhao, K.; Wang, Z.; Ma, C.; Cao, X.; Guo, P.; Guo, W.; Lu, Y. Experimental study on the domino effect in explosions caused by vertically distributed methane/air vapor clouds. Fuel 2021, 290, 120014. [Google Scholar] [CrossRef]
  13. Kanoshima, R.; Hayakawa, A.; Kudo, T.; Okafor, E.C.; Colson, S.; Ichikawa, A.; Kudo, T.; Kobayashi, H. Effects of initial mixture temperature and pressure on laminar burning velocity and Markstein length of ammonia/air premixed laminar flames. Fuel 2022, 310, 122149. [Google Scholar]
  14. Mao, R.; Wang, J.; Lin, W.; Han, W.; Zhang, W.; Huang, Z. Effects of flow–flame interactions on the stabilization of ultra-lean swirling CH4/H2/air flames. Fuel 2022, 319, 123619. [Google Scholar] [CrossRef]
  15. Li, G.; Gao, W.; Jiang, H.; Wang, W.; Zhao, F.; Huang, Z.; Si, R.; Wen, G. On the lower explosion limit of ventilation air methane under high temperatures. Int. J. Hydrogen Energy 2024, 77, 1457–1466. [Google Scholar] [CrossRef]
  16. Yang, K.; Liu, G.; Ji, H.; Xing, Z.; Jiang, J.; Yin, Y. The effects of different equivalence ratios and initial pressures on the explosion of methane/air premixed gas in closed space. Energy 2024, 297, 131213. [Google Scholar] [CrossRef]
  17. Faghih, M.; Gou, X.; Chen, Z. The explosion characteristics of methane, hydrogen and their mixtures: A computational study. J. Loss Prev. Process Ind. 2016, 40, 131–138. [Google Scholar]
  18. Figueroa-Labastida, M.; Zheng, L.; Streicher, J.W.; Hanson, R.K. Effect of elevated temperatures (550–860 K) on the laminar flame speeds of methane/hydrogen blends. Fuel 2024, 372, 132219. [Google Scholar] [CrossRef]
  19. Cui, G.; Li, Z.; Yang, C. Experimental study of flammability limits of methane/air mixtures at low temperatures and elevated pressures. Fuel 2016, 181, 1074–1080. [Google Scholar] [CrossRef]
  20. Li, Y.; Bi, M.; Li, B.; Zhou, Y.; Gao, W. Effects of hydrogen and initial pressure on flame characteristics and explosion pressure of methane/hydrogen fuels. Fuel 2018, 233, 269–282. [Google Scholar] [CrossRef]
  21. Clanet, C.; Searby, G. On the “tulip flame” phenomenon. Combust. Flame 1996, 105, 225–238. [Google Scholar] [CrossRef]
  22. Xiao, H.; Wang, Q.; Shen, X.; Guo, S.; Sun, J. An experimental study of distorted tulip flame formation in a closed duct. Combust. Flame 2013, 160, 1725–1728. [Google Scholar] [CrossRef]
  23. Markstein, G.H. A shock-tube study of flame front-pressure wave interaction. Symp. (Int.) Combust. 1957, 6, 387–398. [Google Scholar] [CrossRef]
  24. Dunn-Rankin, D.; Barr, P.K.; Sawyer, R.F. Numerical and experimental study of “tulip” flame formation in a closed vessel. Symp. (Int.) Combust. 1988, 21, 1291–1301. [Google Scholar] [CrossRef]
  25. Gonzalez, M.; Borghi, R.; Saouab, A. Interaction of a flame front with its self-generated flow in an enclosure: The “tulip flame” phenomenon. Combust. Flame 1992, 88, 201–220. [Google Scholar] [CrossRef]
  26. Bychkov, V.; Akkerman, V.y.; Fru, G.; Petchenko, A.; Eriksson, L.-E. Flame acceleration in the early stages of burning in tubes. Combust. Flame 2007, 150, 263–276. [Google Scholar] [CrossRef]
  27. Ponizy, B.; Claverie, A.; Veyssière, B. Tulip flame—The mechanism of flame front inversion. Combust. Flame 2014, 161, 3051–3062. [Google Scholar] [CrossRef]
  28. Zhou, N.; Xu, Y.; Chen, B.; Li, X.; Qiao, S.; Yuan, X.; Liu, J.; Huang, W.; Zhao, H. Numerical Simulation of the Influence of Venting Conditions on the Combustion Characteristics of Premixed H2/Air Explosions. Chem. Eng. Prog. 2021, 40, 3656–3663. [Google Scholar]
  29. Tricco, T.S. The Kelvin–Helmholtz instability and smoothed particle hydrodynamics. Mon. Not. R. Astron. Soc. 2019, 488, 5210–5224. [Google Scholar] [CrossRef]
  30. Zhao, H.; Yuan, C.; Li, G.; Tian, F. The Propagation Characteristics of Turbulent Expanding Flames of Methane/Hydrogen Blending Gas. Energies 2024, 17, 5997. [Google Scholar] [CrossRef]
  31. Xiao, H.; Wang, Q.; He, X.; Sun, J.; Shen, X. Experimental study on the behaviors and shape changes of premixed hydrogen–air flames propagating in horizontal duct. Int. J. Hydrogen Energy 2011, 36, 6325–6336. [Google Scholar] [CrossRef]
  32. Duva, B.C.; Chance, L.E.; Toulson, E. Dilution effect of different combustion residuals on laminar burning velocities and burned gas Markstein lengths of premixed methane/air mixtures at elevated temperature. Fuel 2020, 267, 117153. [Google Scholar] [CrossRef]
  33. Sabelnikov, V.A.; Lipatnikov, A.N.; Nishiki, S.; Dave, H.L.; Hernández Pérez, F.E.; Song, W.; Im, H.G. Dissipation and dilatation rates in premixed turbulent flames. Phys. Fluids 2021, 33. [Google Scholar] [CrossRef]
  34. Kagan, L.; Gordon, P.V.; Sivashinsky, G. A reduced model for a self-accelerating expanding flame subjected to the Darrieus-Landau and Rayleigh-Taylor instabilities: Transition to detonation. Combust. Flame 2022, 245, 112333. [Google Scholar] [CrossRef]
  35. Shen, X.; Zhang, Z.; Dou, Z.; Zhang, C. Premixed CO/air combustion in a closed duct with inhibition. Energy 2021, 230, 120782. [Google Scholar] [CrossRef]
  36. Klopov, B.A.; Meshkov, E.E. Behavior of a perturbed rarefaction wave. Combust. Explos. Shock. Waves 1982, 18, 472–475. [Google Scholar] [CrossRef]
  37. Liu, F.; Huang, C.-Y.; Xin, K.; Gao, Y.-H.; Yan, M.-H.; Zhang, Y.-Y.; Zhou, L.-Q. Study on the Propagation Law of Explosion Shock Waves in Closed Variable-Section Tube Under High-Pressure Environment. J. Vib. Eng. Technol. 2023, 12, 7249–7264. [Google Scholar] [CrossRef]
Figure 1. A schematic diagram of the experimental platform.
Energies 18 01301 g001
Figure 2. Overpressure curve analysis under experimental conditions of 1.5 diameter ratio and 12% methane concentration.
Energies 18 01301 g002
Figure 3. Schematic diagrams of the geometric and grid models of the experimental setup. (a) Schematic of the pipe setup; (b) Grid model.
Energies 18 01301 g003
Figure 4. Curves of simulated and experimental overpressure with time for different grid resolutions.
Energies 18 01301 g004
Figure 5. The evolution of the flame propagation process with time in the experiment (left) and simulation (right).
Energies 18 01301 g005
Figure 6. A schematic diagram of the methane air premixed gas flame passing through a sudden expansion structure. (I) Finger-like, tulip, and distorted tulip shapes; (II) Shattered flame and flame fragmentation; (III) Backflow behavior and flame decoupling process.
Energies 18 01301 g006
Figure 7. A schematic diagram of the sudden expansion structure of the flame of the premixed gas under different reducer ratios.
Energies 18 01301 g007
Figure 8. Flame backflow phenomenon.
Energies 18 01301 g008
Figure 9. Vortex structures under different expansion ratio conditions.
Energies 18 01301 g009
Figure 10. The flame propagation process of methane–air explosion at the sudden expansion structure.
Energies 18 01301 g010
Figure 11. Methane–air deflagration flame propagation process with different diameter reduction.
Energies 18 01301 g011
Figure 12. Pressure variation diagram in sudden expansion pipeline at different methane concentrations.
Energies 18 01301 g012
Figure 13. Overpressure and attenuation rate at different methane concentrations.
Energies 18 01301 g013
Figure 14. Pressure variation diagram in sudden expansion pipeline at different diameter ratio.
Energies 18 01301 g014
Figure 15. Overpressure and attenuation rate at different diameter ratios.
Energies 18 01301 g015
Table 1. Sensor locations.
NumberingDistance From the Ignition End/cmNumberingDistance From the Ignition End/cm
P116.7P5166.7
P250.1P6200.1
P383.5P7233.5
P4116.9P8266.9
Table 2. Different diameter ratio configurations.
Diameter RatioDimensions
1.2580 mm × 80 mm × 1500 mm–100 mm × 100 mm × 1500 mm
1.580 mm × 80 mm × 1500 mm–120 mm × 120 mm × 1500 mm
1.7580 mm × 80 mm × 1500 mm–140 mm × 140 mm × 1500 mm
2.080 mm × 80 mm × 1500 mm–160 mm × 160 mm × 1500 mm
Disclaimer/Publisher’s Note: The statements, opinions and data contained in all publications are solely those of the individual author(s) and contributor(s) and not of MDPI and/or the editor(s). MDPI and/or the editor(s) disclaim responsibility for any injury to people or property resulting from any ideas, methods, instructions or products referred to in the content.