Article

An Analysis of the Increase in Energy Efficiency of Photovoltaic Installations by Using Bifacial Modules

1
Institute of Electrical Engineering and Electronics, Faculty of Automatic, Robotics and Electrical Engineering, Poznań University of Technology, St. Piotrowo 3A, 60-965 Poznań, Poland
2
Department of Renewable Energy Engineering, Faculty of Environmental Engineering and Energy, Lublin University of Technology, St. Nadbystrzycka 40B, 20-618 Lublin, Poland
3
Institute of Materials and Biomedical Engineering, University of Zielona Gora, St. Licealna 9, 65-417 Zielona Gora, Poland
4
Institute of Mechanical Engineering, University of Zielona Gora, St. Licealna 9, 65-417 Zielona Gora, Poland
5
Department of Production Management, Faculty of Engineering Management, Bialystok University of Technology, Wiejska Street 45A, 15-351 Bialystok, Poland
6
Department of Production Engineering, Institute of Mechanical Engineering, Warsaw University of Life Sciences, Nowoursynowska Street 164, 02-787 Warsaw, Poland
7
Faculty of Engineering Management, Institute of Logistics, Poznań University of Technology, St. J. Rychlewskiego 2, 60-965 Poznań, Poland
*
Authors to whom correspondence should be addressed.
Energies 2025, 18(5), 1296; https://doi.org/10.3390/en18051296
Submission received: 11 February 2025 / Revised: 24 February 2025 / Accepted: 4 March 2025 / Published: 6 March 2025

Abstract

:
This work concerns the experimental verification of changes in the energy efficiency of photovoltaic installations through the use of bifacial modules. For this purpose, an experimental stand was designed and built for the comparative analysis of the efficiency of two types of photovoltaic panels: bifacial (bPV) and monofacial (mPV). The tests consisted of placing the panels at different heights above the ground surface and at different angles. During the tests, three substrates with different albedo were taken into account: green grass, gray concrete (fabric), and white snow (polystyrene). The tests for both types of panels were carried out simultaneously (in parallel), which guaranteed the same environmental conditions (temperature and solar radiation intensity). Based on the results of the voltage and current measurements for different angles of PV module inclination and, for bPV panels, different heights above the ground surface and different types of substrate, a series of current–voltage characteristics and power characteristics were plotted. The “additional” energy efficiency of bifacial panels compared to monofacial panels was also determined. It was shown that under favorable conditions, using bifacial panels instead of monofacial panels can increase the production of electricity by more than 56% from structures of the same dimensions. The research results can be of great value when designing photovoltaic installations.

1. Introduction

Nowadays, there is a growing concern about climate change, the depletion of fossil fuels, and their harmful combustion effect on the environment. These factors have caused considerable efforts in reducing greenhouse gas (GHG) emissions through decarbonization and an energy transition process. However, more than 80% of global final energy demand is still fulfilled using fossil fuels [1]. What is more, taking into consideration current economic growth, it is predicted that energy consumption will increase by about 25% by 2050 and even double by 2100 [2]. Therefore, the implementation of renewable energy sources (RES) and increasing their share in the electricity mix is imperative [3]. Among all renewable energy sources, photovoltaics (PVs) are considered the most promising energy supply to meet present and future generations’ needs [4]. Undoubtedly, an important stimulant for developing PV in Europa will be the Energy Performance of Buildings Directive (EU/2024/1275) [5] entered into force in all EU countries on 28 May 2024. Minimum energy performance standards for non-residential buildings and trajectories for progressive renovation of the residential building stock are outlined in Article 9 of the EPBD. The obligation to install photovoltaic panels will first apply to new commercial and public buildings. For households, the key year will be 2029, when the installation of PV systems or solar panels on residential buildings put into use will be mandatory.
Photovoltaic systems can be divided into three main generations, each defined by different materials, production technology, and thus photoelectric conversion efficiencies [6]. According to the Fraunhofer Institute Report [7], monocrystalline technology dominates the photovoltaic market, obtaining the highest efficiency equal to 24.4%. Recent enhancements in photovoltaic technologies have led to the development of innovative and promising approaches to solar cell designs, such as perovskite [8] or dye-sensitized solar cells [9]. Among them, bifacial solar cells have gained the attention of numerous researchers due to the possibility of improving energy conversion efficiency, reducing the levelized cost of energy (LCOE) and production costs, and expanding the range of potential applications [10]. Bifacial PV technology can be successfully integrated into the building to create Building-Integrated Photovoltaic (BIPV) systems, such as facades [11], roofs [12], retractable roofs [13], and shading devices [14,15]. The bifacial modules’ market share rose significantly from about 3% in 2017 [16] to 35% in 2023 [17]. It is predicted to further increase, with the potential to even triple its worldwide PV market share in the short-term perspective [17]. Bifacial photovoltaic modules are characterized by two-sided light sensitivity, which means the capability to absorb the sunlight on both the front and rear, sides. The direct irradiation is captured by the front of the module, while the reflected one is captured by the rear side [18]. This enhances the current density [19,20] and thus power output compared to traditional, monofacial PV technology [21,22,23]. Olczak et al. [24] analyzed the work of two photovoltaic systems located in Poland: a 5.04 kW rooftop composed of monofacial modules and a 6.1 kW free-standing installation that includes bifacial modules. Their study revealed that in comparable weather conditions, the bifacial PV system energy yield is higher in the range of 10% to 28% for high and low insulation, respectively. In turn, in the investigation conducted by Gulkowski [25], the work of nine photovoltaic systems, one of which was bifacial, located in Lublin Voivodeship, Poland, was analyzed. The bifacial PV installation with a power capacity of 11.84 kW oriented toward the south-east obtained the highest annual final yield, equal to 1102.9 kWh·kW−1. In a study by Khan et al. [26], energy, economic, and environmental analyses were carried out based on simulations of monofacial and bifacial monocrystalline modules located in Sweden. The influence of various tilt angles of the roof (15°, 30°, and 45°) was taken into consideration. Their findings indicate that bifacial panels were characterized by higher energy production compared to monofacial ones. In turn, Muehleisen et al. [27] conducted a comparison experiment of monofacial and various bifacial modules with 70% and 92% bifaciality, black and transparent backsheet, oriented toward the east–west. They observed up to a 20% increase in energy yield with the use of bPV with 70% bifaciality compared with monofaciality.
One of the biggest challenges in the field of bifacial modules (bPVs) that needs to be addressed is the lack of measurement standards and, hence, the ability to model the irradiance harvested by the backside of bPV. The various models used to perform simulations differ in their complexity and may have varying degrees of accuracy. The potential for an increase in power output of bifacial modules through simulations and modeling was analyzed in various research papers. In the work of Sahu et al. [28], the backside irradiance model that takes into consideration the influence of the various tilt angles and azimuths was depicted. The validation of the model was conducted using photovoltaic systems installed in the Indian climate. In contrast, Cha et al. [29] proposed the model to estimate the energy yield obtained from the rear side of bPV module for four albedos of different grounds. In turn, Fajuke and Raji [30] presented the model using Firefly Algorithm created with the use of Matlab/Simulink software to optimize the parameters, namely, the mounting height, tilt angle, and albedo, in order to calculate the extra energy yield obtained from the rear side of the module. Furthermore, the adaptation of monofacial photovoltaic models for bifacial systems for various albedos was presented in the work of Bouchakour et al. [31]. The obtained values were compared with measured data from photovoltaic systems located in Barcelona, Spain. The implemented models showed a high degree of alignment. In addition, the study conducted by Rodriguez-Pastor et al. [32] included the implementation of an analytical model considering different factors, such as an electrical model of PV modules, and various albedos of the ground. Then, the proposed model was tested and verified with the working parameters of the bPV power plant located in Seville, Spain.
However, the performance of bifacial modules is strongly influenced by the environmental conditions of their installation, including the mounting height and ground surface albedo. In the work of Dobrzycki et al. [19], various tilt angles (15°, 45°, and 75°) and types of ground substrates with different albedo coefficients (grass, white substrate, and foil) were analyzed. In the case of Poland, it has been determined that the best inclination for bPV modules is 60–75°, which is a much greater angle than the optimal one (35°) for the monofacial module at this latitude. In the study by Abdallah et al. [33], both indoor and outdoor I-V measurements of the 22° tilt-angle bifacial and monofacial modules were conducted. The external analysis was carried out within 3 years (2017–2019) of operation in Doha, Qatar, with an albedo ground of 0.43, while the indoor tests were carried out under standard test conditions (STC) but with various module temperatures in the range of 15–75 °C. The study reported that bPV modules achieved a 15% higher energy yield than monofacial ones due to the absorption of reflected irradiance by the rear side. In the paper by Jang and Lee [34], comprehensive analyses of bPV module performance were carried out, including the evaluation of the influence of reflective material and its size on the energy yield. The bifacial module was installed 1.4 m high toward the south with a tilt angle of 37°, while the ground albedo was 0.55. It was determined that doubling the size of the material compared to the unshaded boundary at noon in the winter resulted in a 1.6% enhancement in the power performance of the bifacial module. In turn, Alam et al. [35] investigated the impact of varying albedos on the performance of a build with a bPV off-grid system within 12 months of operation. Both the bifacial and monofacial module, which was used as a reference, were located in Edinburgh, Great Britain. The research depicted that the highest yearly rear irradiance gain was identified for white pebbles and white tiles ground surface, with the lowest values obtained for soil surface and concrete. The examination of the impact of different albedo conditions (e.g., 0.50–0.57, 0.37, and 0.42) on bifacial gain was presented in the work of Ganesan et al. [36]. The highest bifacial gain of 21.4% was achieved using a reflective aluminum surface, which had the greatest albedo value, closely followed by white reflective grounds, with an albedo of 0.37 and 0.42, resulting in an 18.9% bifacial gain. The lowest values were obtained for cement, sand, and grass surfaces.
According to the Solar Power Europe forecast [37], in the medium projected scenario, the total installed PV capacity in European Union countries will increase from 325 GW in 2024 and reach 890 GW by 2030. In Poland, among all RESs, the share of PV is the most significant and amounts to over 14 GW, which is over 55% of RESs and over 21% of the capacity of the entire energy system in the country [5]. Therefore, the intensive development of PV installations requires more efficient bifacial PV systems and an extensive and adapted transmission infrastructure. The necessary condition is the continuous modernization of the power grid toward smart grids by implementing support programs and subsidies for the development of the national network infrastructure. Moreover, it is necessary to increase the flexibility of the power system, which is becoming a critical factor in maintaining the stability of its operation and reducing energy losses. At the same time, the dependence of solar power plants on atmospheric conditions and the increasingly frequent occurrence of extreme weather phenomena pose significant challenges to transmission network operators.
Alternatively, attention should be paid to the limitations of the development of the photovoltaic industry in Poland, resulting from inappropriate parameters of the power grid or negative energy prices during peak hours of photovoltaic production, which may reduce the attractiveness of the rate of return on RES investments. Therefore, it is necessary to conduct research to identify and analyze the environmental factors that influence the development of PV in Poland while considering the specific weather conditions in different regions of the country.
The motivation for this study is the lack of detailed research regarding a comparison group of selected parameters between mono- and bifacial modules in the same climate condition, especially in Poland, where bifacial modules are becoming more and more popular. The above reason and the desire to find correlation between climate conditions and installing parameters indicated that the main objective of this work is to demonstrate and empirically confirm greater energy yields from bifacial panels compared to monofacial panels. Important elements affecting the values of generated power are, apart from the angle of inclination of the panel (as in the case of monofacial panels), the installation height on the ground surface and its reflection coefficient. Studies carried out aimed at indicating the relationship between the generated power and the reflection coefficient of the substrate, the angle of inclination of the module, and the height of its installation. The results of the research will undoubtedly be of great value in designing and estimating energy yields from photovoltaic systems based on bifacial panels. Thanks to the data obtained, it is possible to better estimate yields, which will also translate into a faster payback time of the investment.

2. Materials and Methods

Test stand allowing a comparison of the power generated by two photovoltaic panels—bifacial (bPV) and monofacial (mPV)—was designed. For this comparison, two LG NeON® 2 BiFacial panels were used, where the back of one of them was tightly covered with foil, preventing the light reflected from the surface of the substrate from reaching it, which allowed it to be treated as mPV. The technical parameters of the panels used in the tests are listed in Table 1.
The structure on which the panels were placed allowed conduct measurements at specific heights and inclination angles. During the development of the rack design, special attention was paid to the fact that the structural elements should limit the inflow of solar radiation to the rear PV cells of the bPV panel as little as possible in order to minimize shading. After taking measurements for possible assembly configurations, the substrate was changed. Three types of substrate were used: green grass, gray fabric, and white polystyrene. Grass has an albedo reflectance in the range of 0.15–0.26. The white material imitates white stone or snow, the albedo of which is 0.55–0.6, respectively (up to 0.98 for snow), while the gray material imitating concrete has an albedo coefficient of 0.2–0.4 [39]. The design of the frame is shown in Figure 1. For the mPV panel, a structure was developed on which only the angle of inclination was possible, because the installation height above the ground and its reflectivity did not affect the measurement results.
The measurements were carried out in the vicinity of Poznań (52°05′ N, 16°54′ E) in July and August 2022. The average insolation at the research site is about 1080 kWh/year/m2 [40]. The research focused on determining the influence of the angle of inclination of the PV module, its installation height above the ground surface, and the type of substrate (with different albedo coefficient) on the value of the power generated by the bPV.
Measurements were also conducted as quickly as possible to avoid significant changes in panel temperature; tests were conducted around noon, when temperature of the panels was stable (they were already heated by sun). To make test as fast as possible, readings of ammeters (with accuracy 0.5%) and voltmeters (with accuracy 0.03%) were recorded, and after, the measurement were copied to spreadsheet and analyzed. In this study, as is typical, representative set of measurements is presented.
For each combination of substrate, inclination angle and mounting height measurements were conducted at least three times. The number of tests was related to weather conditions; if there was unexpected change of shading (because of clouds), the number of tests was higher (we added another set). In a few seconds, the entire current–voltage characteristic of the bPV and mPV panels tested at the same time, in the same weather conditions, was taken to compare the generated instantaneous power outputs. The irradiance value and the temperature of the panels were also continuously recorded so that they did not change by more than 2 ÷ 3 °C throughout the test. The obtained results were compared with the values achieved by the mPV module, and the additional energy yield generated by the rear cells of the double-sided module was determined.
The tests carried out were aimed at determining the current–voltage and power characteristics of the LG 390N2T-A5 bPV panel with a nominal power of 390 W, along with parameters specific to bPV. When determining the parameters of the bPV, it should be assumed that the short-circuit current of the front and rear part of the module depends linearly on the irradiance reaching a given part of the module. In addition, the total short-circuit current of a bPV is assumed to be the sum of the currents associated with the front and back of the panel. Parameters characterizing bPV can be determined from the following dependencies [19]:
  • Power generated by the P module:
    P = U · I   [ W ]
  • The photovoltaic module fill factor—FF determines the maximum value ratio achieved by a power module vs. the theoretical maximum power of a module:
    F F = I M P P · U M P P I S C · U O C · 100   [ % ]
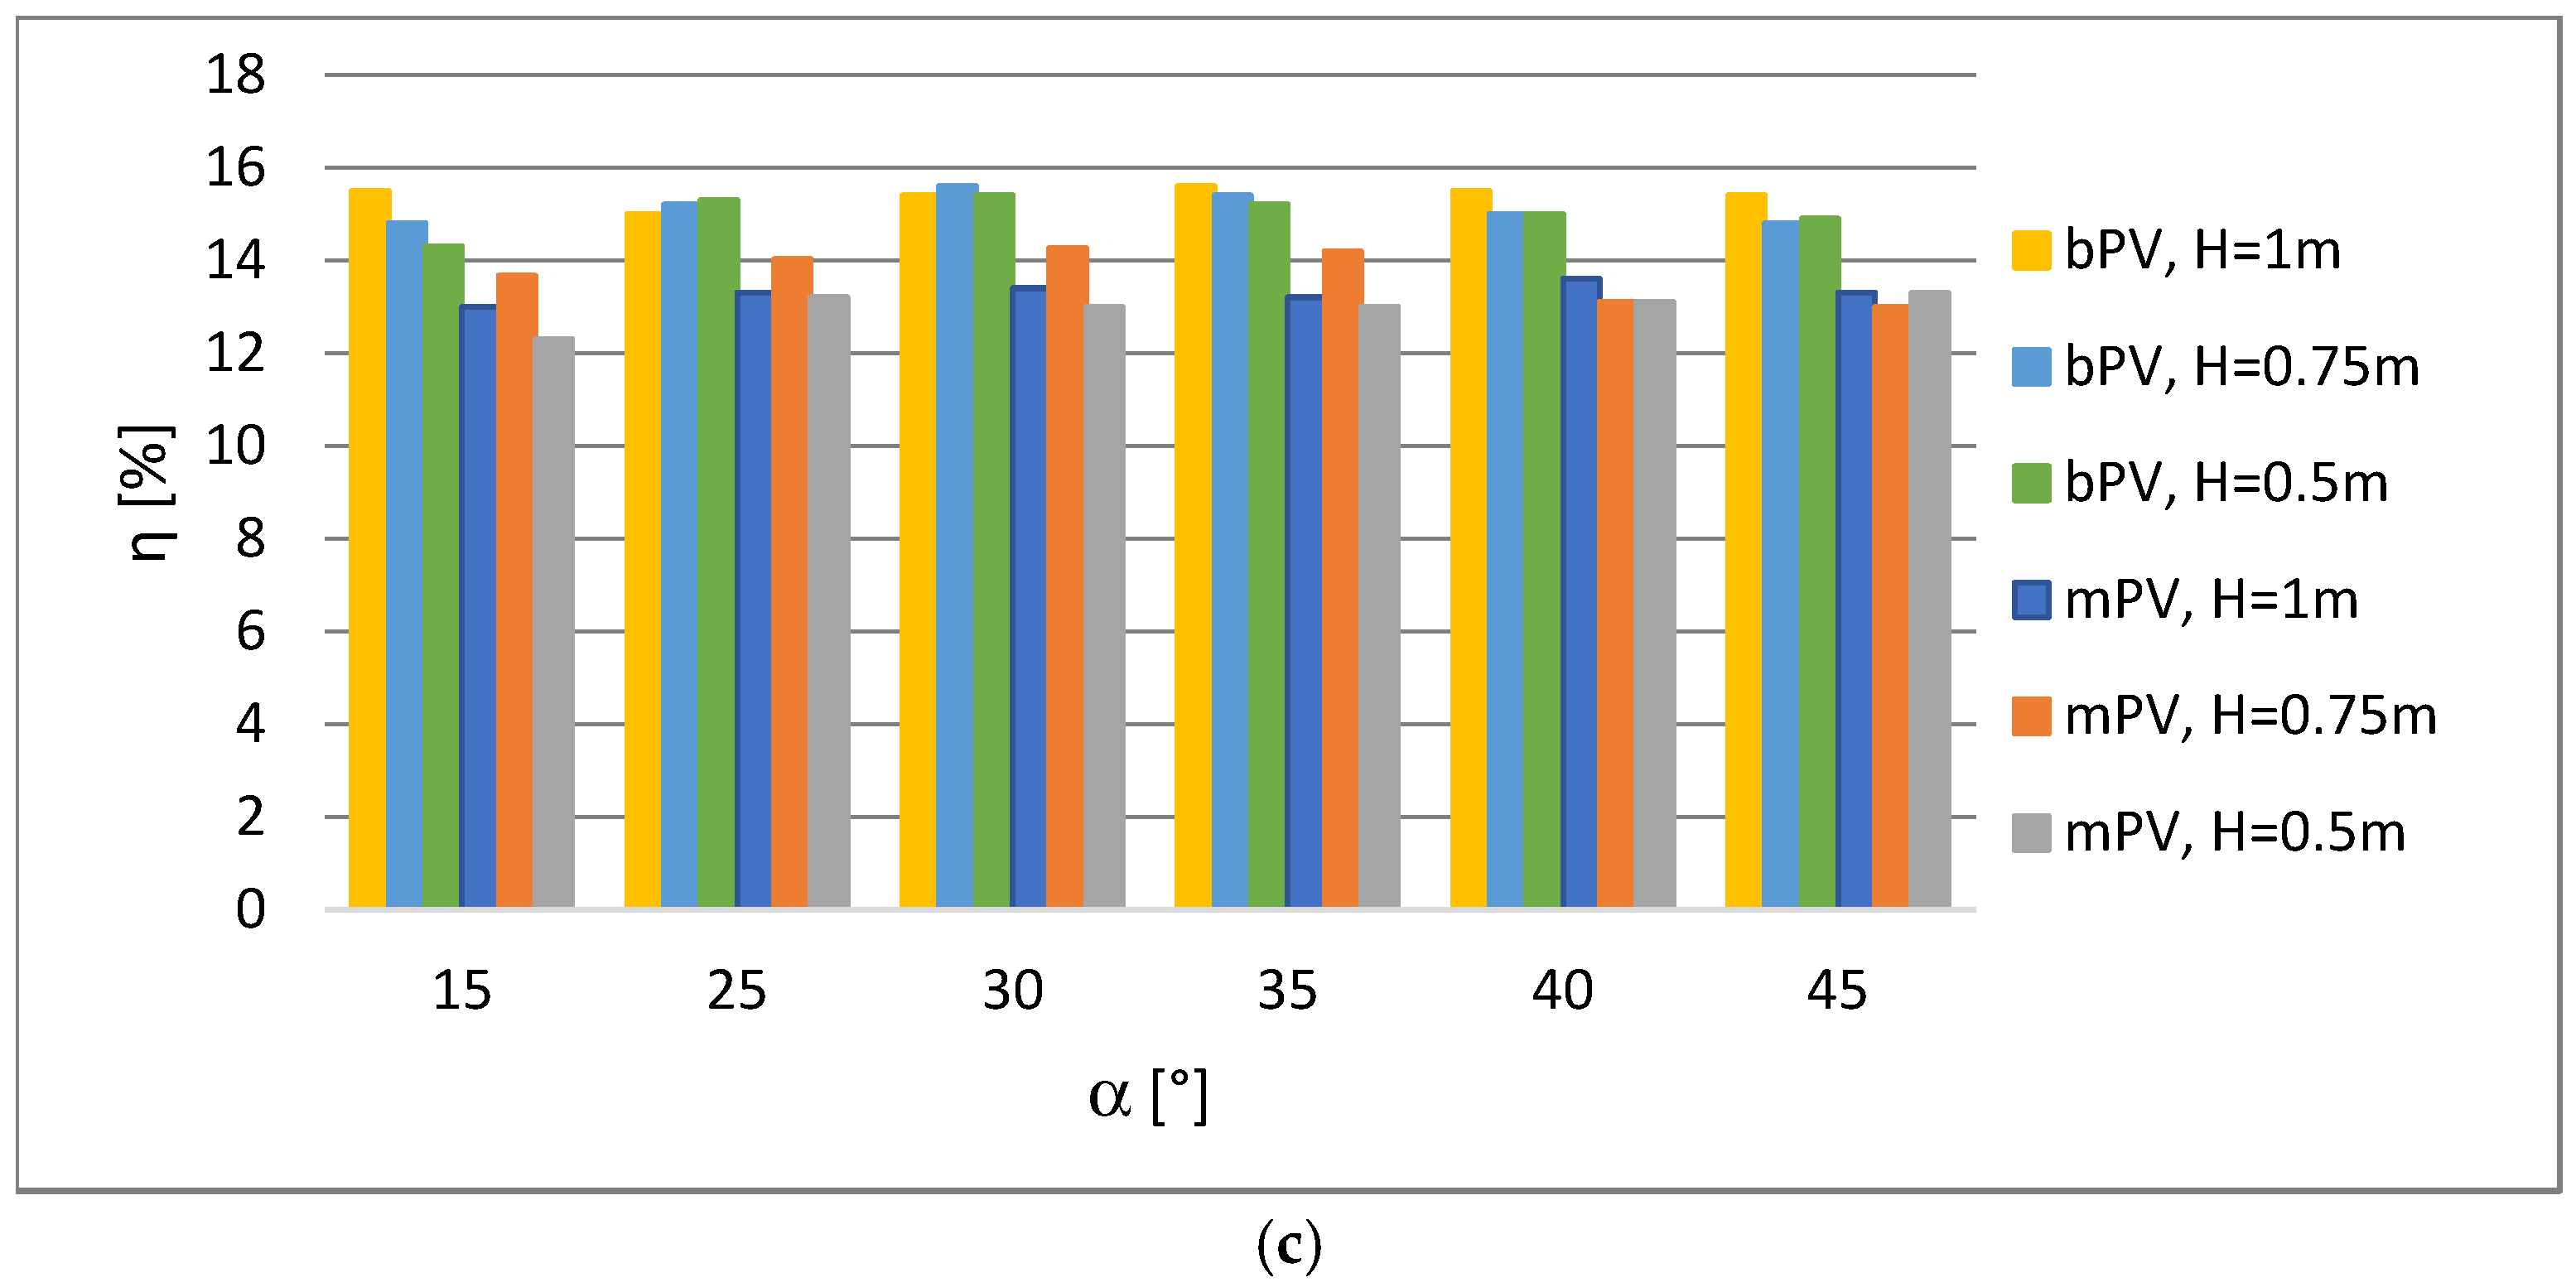
  • The module efficiency η, i.e., the module’s generated power ratio vs. the energy that reaches the module:
    η = I M P P · U M P P E · S = I S C · U O C · F F E · S   [ % ]
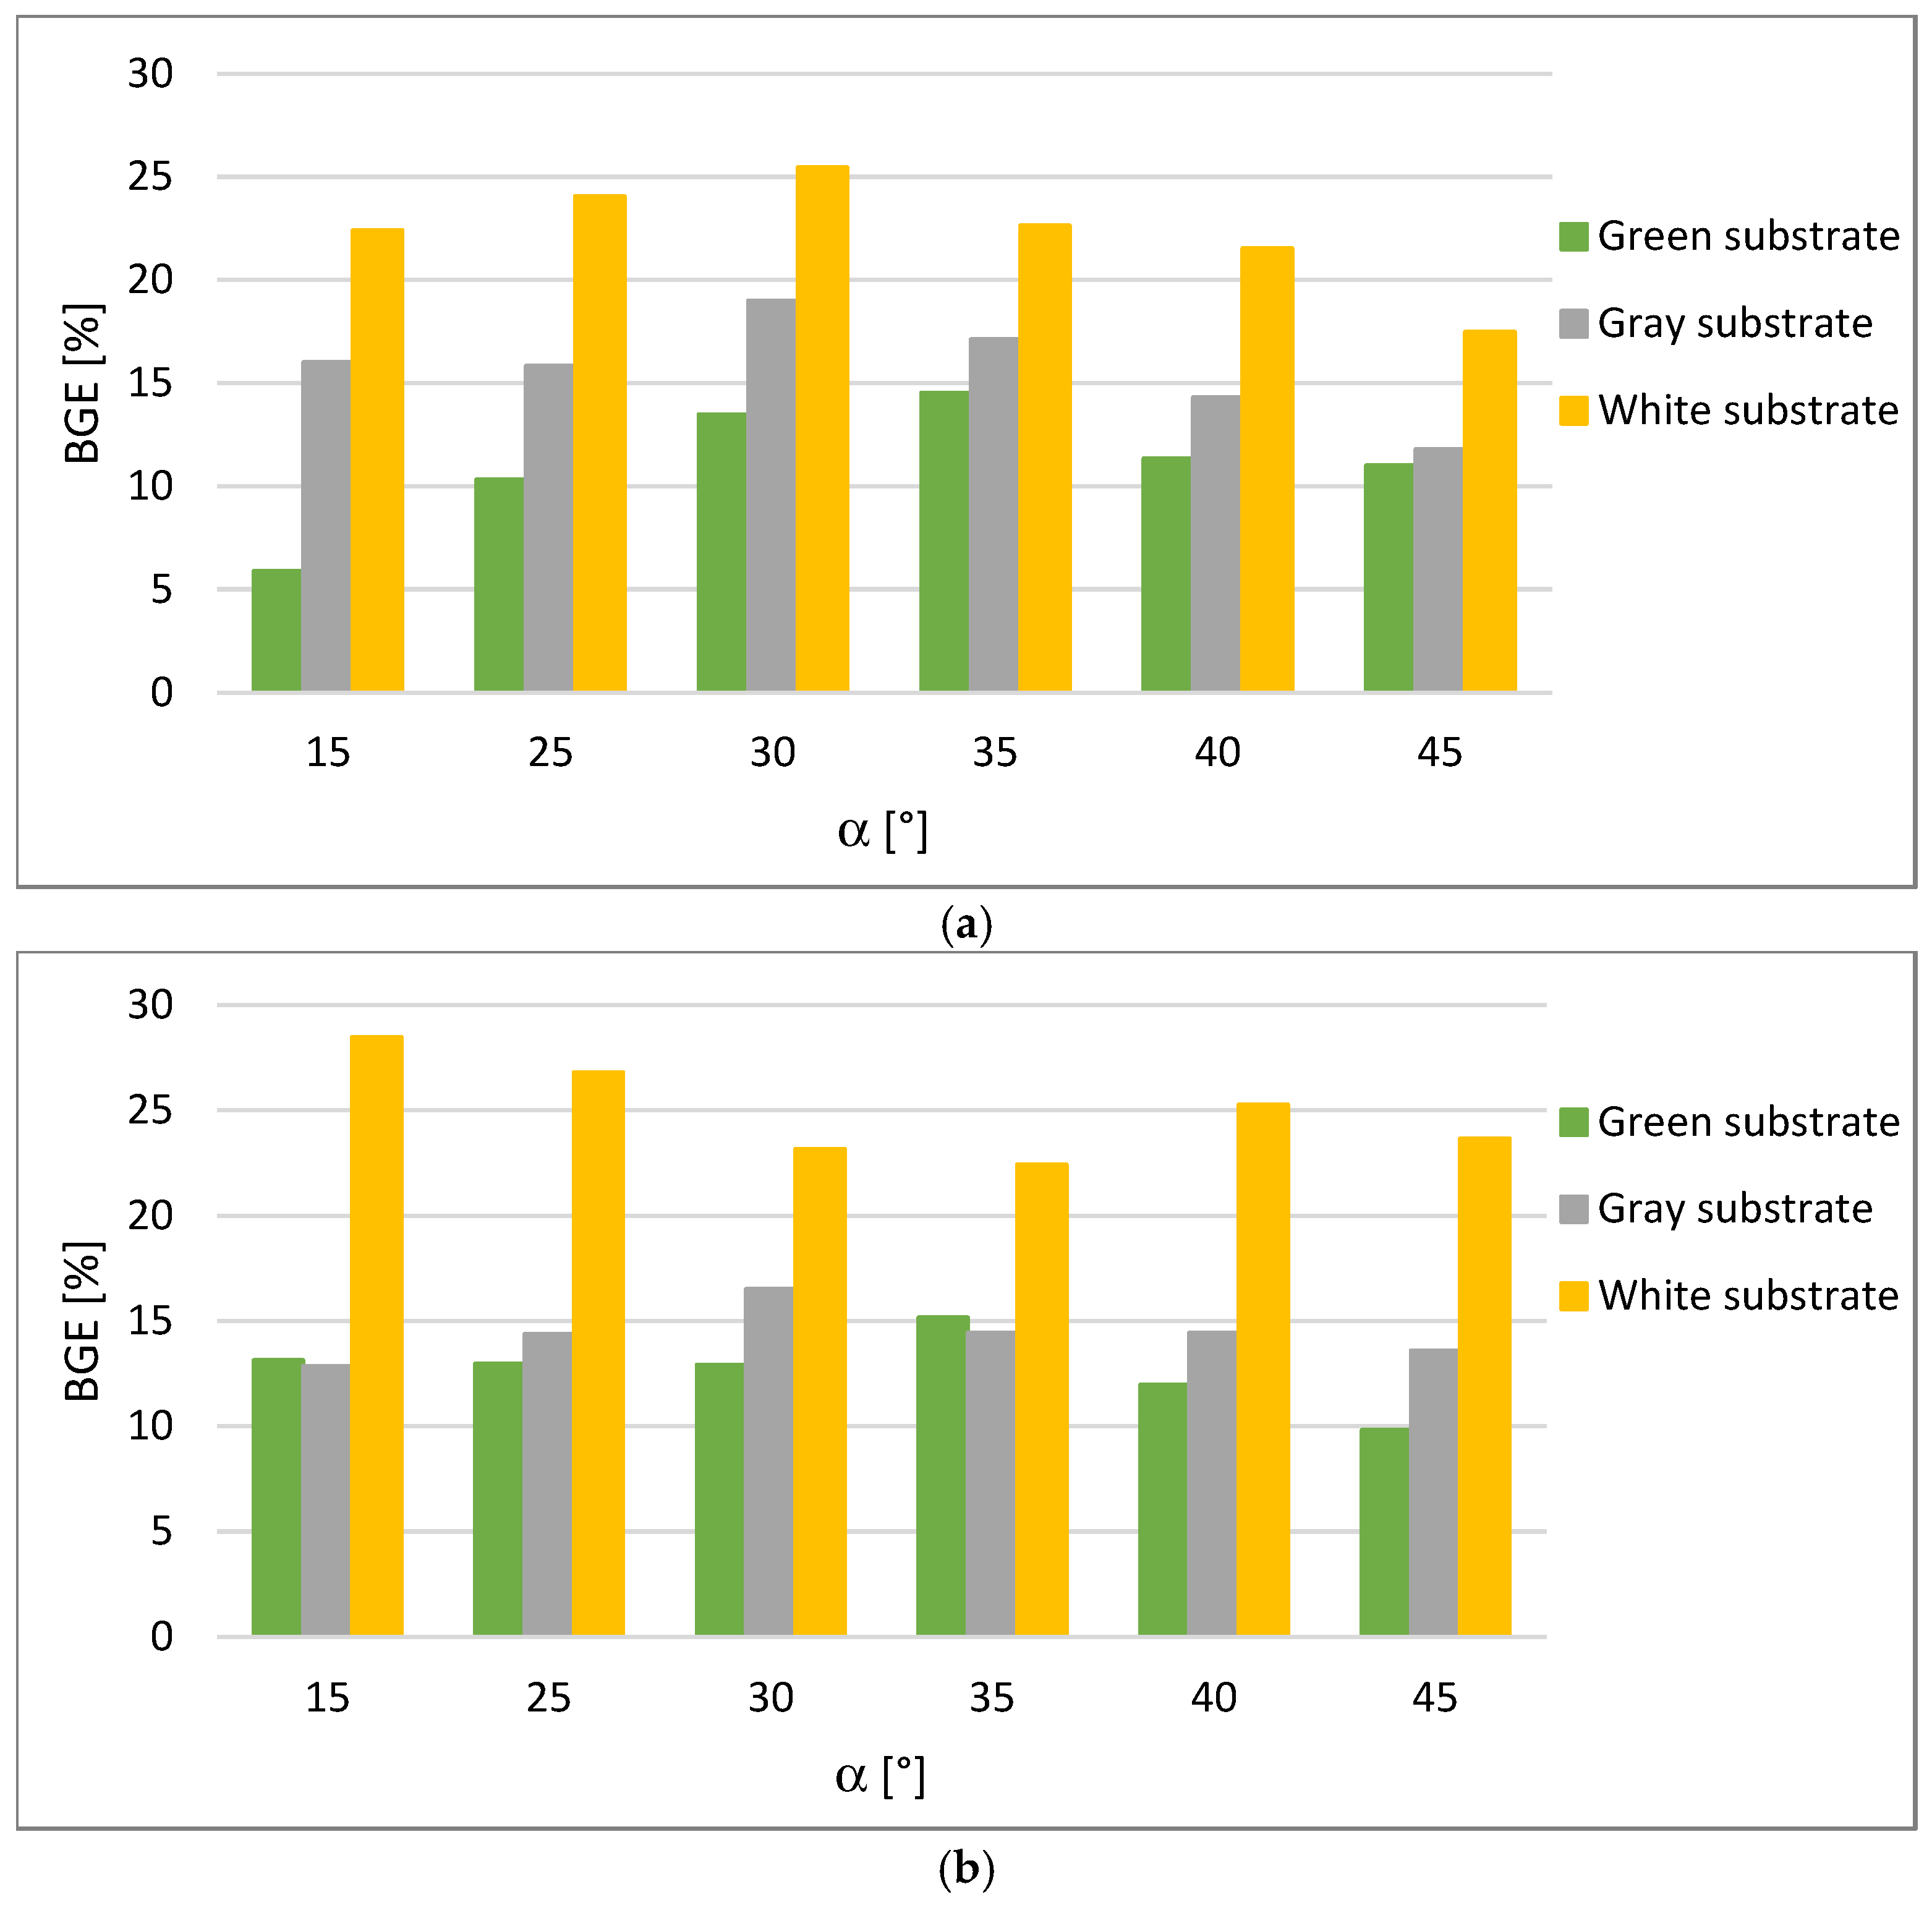
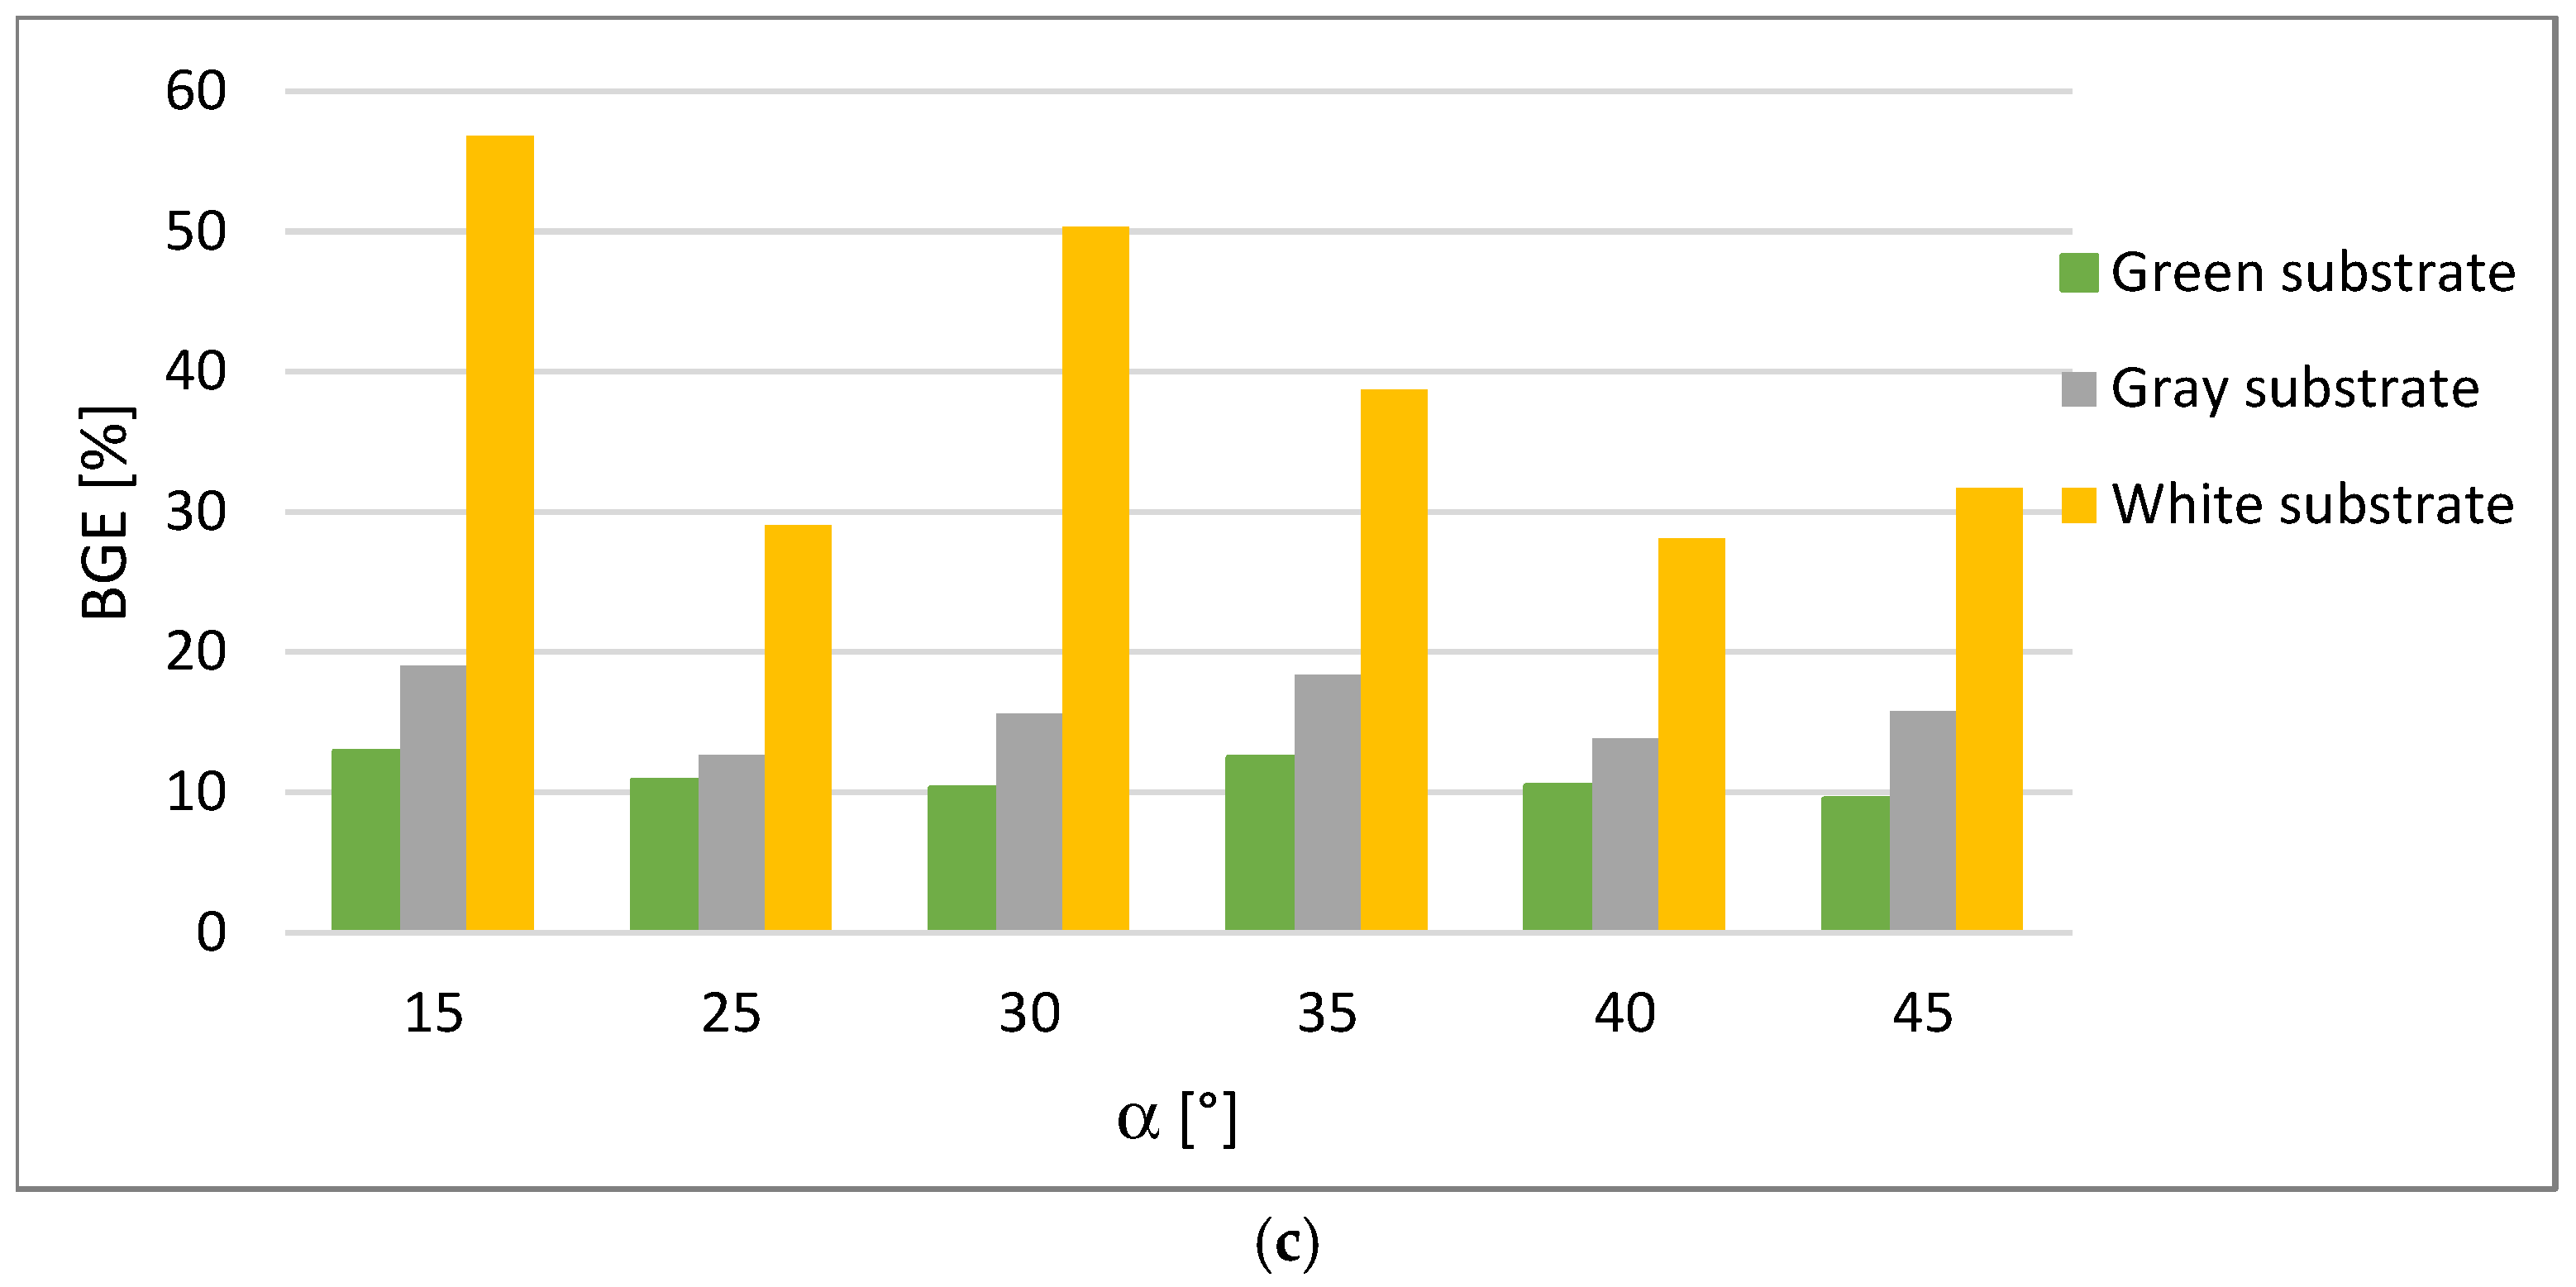
  • BGE index indicates the additional power generated by the rear side of the module related to that produced at the front side of the module:
    B G E = P M P P , r e a r P M P P , f r o n t · 100   [ % ]
  • BGEIsc index determines the current efficiency ratio of the rear side of the module to the current efficiency of the front side:
    B G E I s c = I s c , r e a r I s c , f r o n t   [ ]
  • The total value of irradiance that reached the module EE:
    E E = E f r o n t + B G E I s c · E r e a r   [ W / m 2 ]
  • Short-circuit current of the bifacial module Isc,bi:
    I s c , b i = E E E f r o n t · I s c , f r o n t   [ A ]
  • The open-circuit voltage of the bifacial module Uoc,bi:
    U o c , b i = U o c , f r o n t + U o c , r e a r U o c , f r o n t · l n   E E E f r o n t   l n   I s c , r e a r I s c , f r o n t     [ V ]
  • Pseudo fill factor pFF, which does not take into account the losses generated by series resistance:
    p F F = U o c · q n · k · T l n   U o c · q n · k · T 0.72   U o c · q n · k · T + 1   [ ]
  • The fill factor of the bifacial module FFbi:
    F F b i = p F F E E E f r o n t · U o c , f r o n t U o c , b i · p F F F F f r o n t   [ ]

3. Measurement Results

3.1. Influence of the Module Inclination Angle and Mounting Height Above the Green Ground on Power Generation

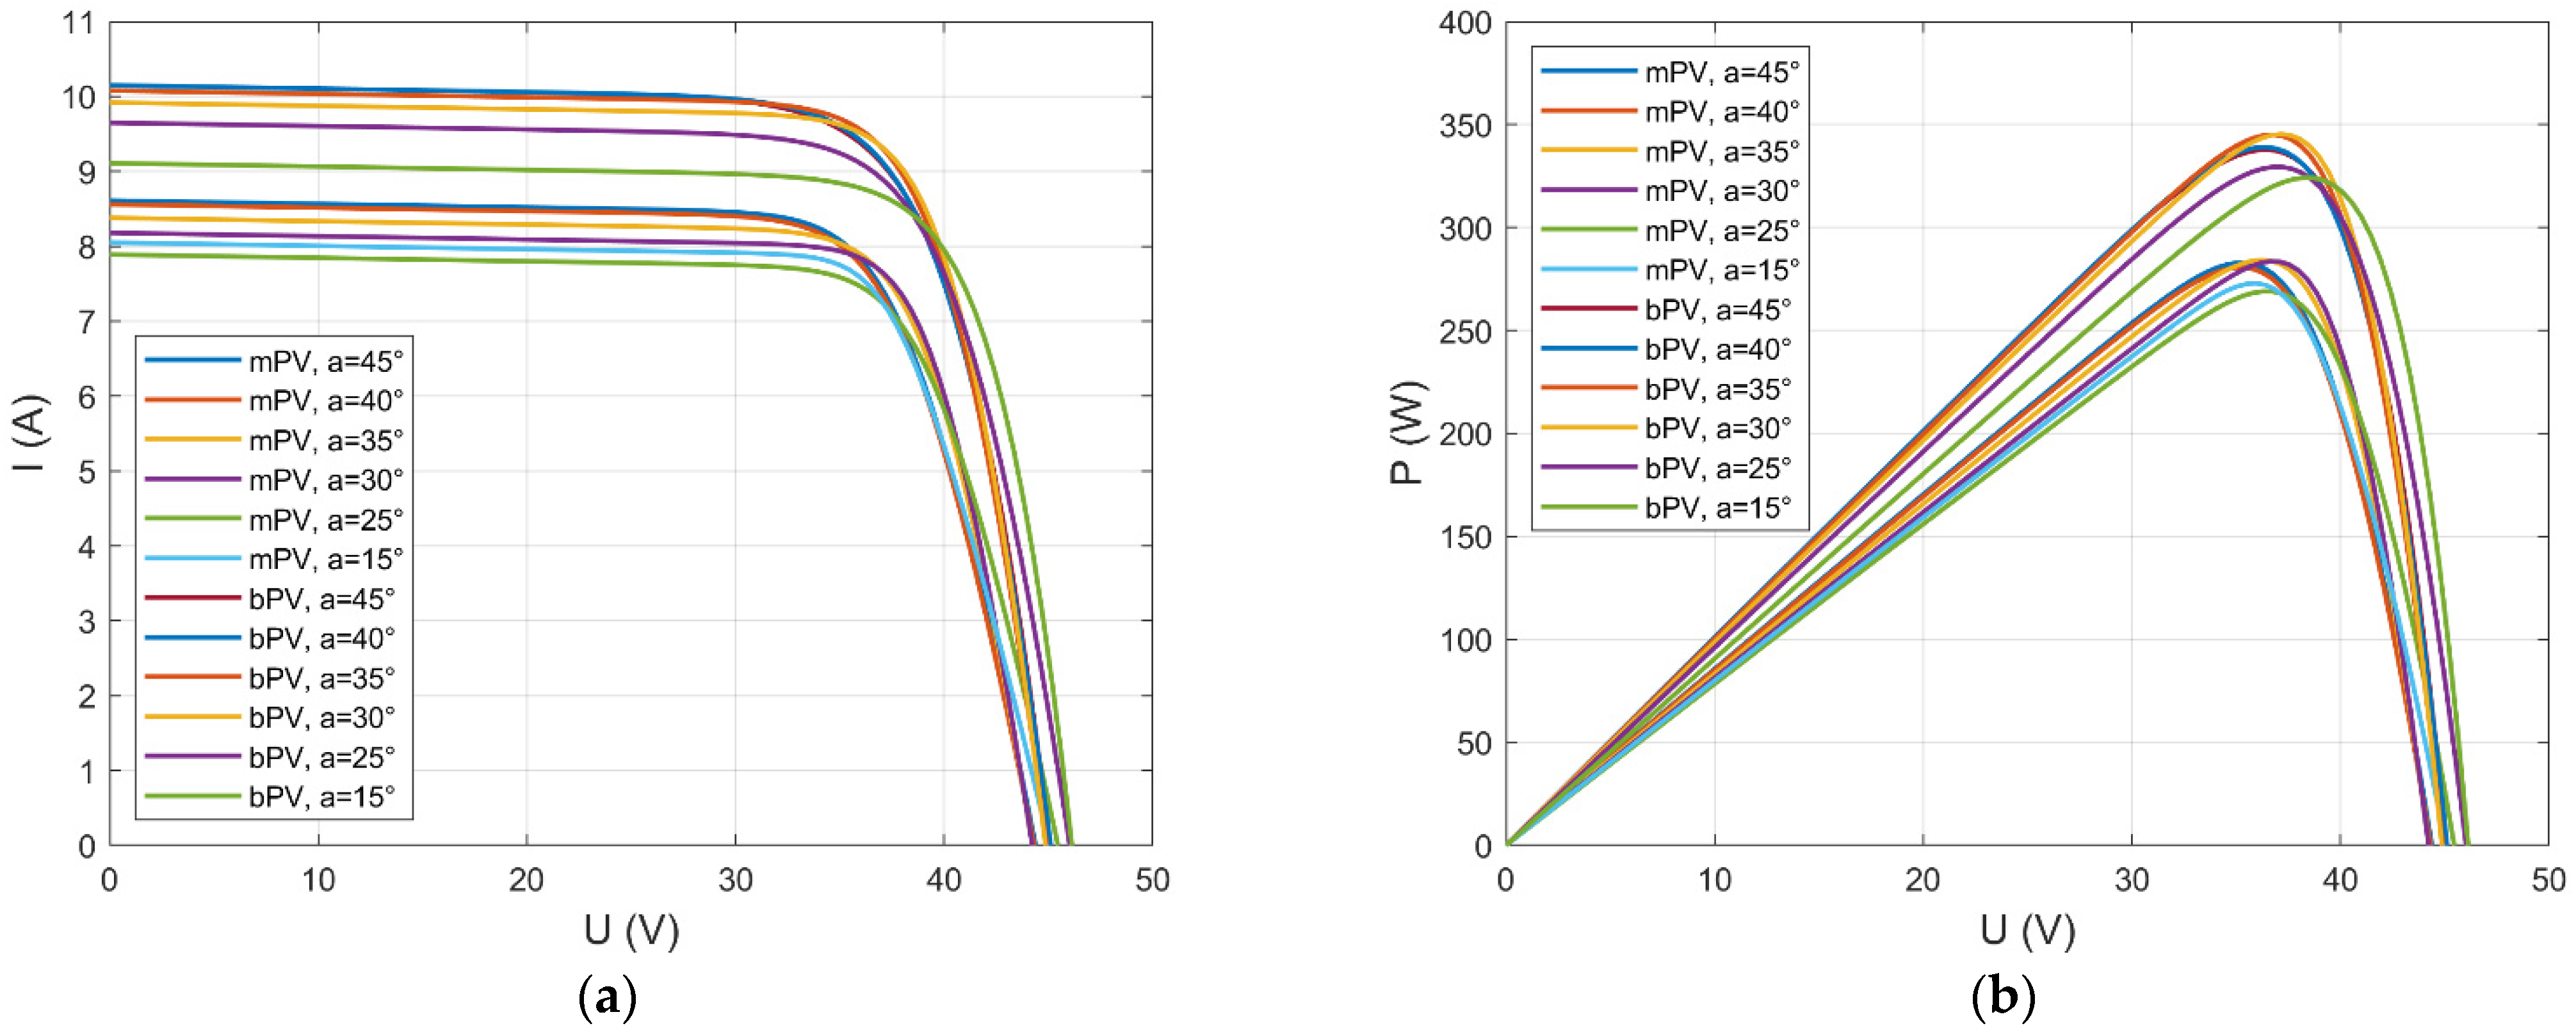
3.1.1. Study of the Influence of the Angle of Inclination of the Module on the Generation of Electricity When Placed Above the Green Ground at a Height of 0.5 m

The measurements were made in the summer for the angles of inclination of the module to the ground surface from 15 to 45 degrees with a step of 5°. In turn, the installation height was 0.5, 0.75, or 1 m. Such parameter values are taken into consideration during the installation of photovoltaic farms due to the variability of solar and atmospheric conditions in the analyzed area throughout the year. The conditions prevailing during the measurement and the determined values of parameters characteristic for the measurement test performed are presented in Table 2, and the obtained current–voltage and power–voltage characteristics are shown on Figure 2.
The results of measurements carried out for the green substrate indicate the differences resulting from the construction of the panels. The double-sided panel generated 6% to 15% more power than the single-sided panel, depending on the angle of inclination.
The highest power of the bPV, equal to 307 W, was obtained when it was set at an angle of 35° and the irradiance was 869 W/m2. The mPV, on the other hand, generated the highest power of 272 W at an inclination of 40° and an irradiance of 880 W/m2.
The bPV was also characterized by higher values of short-circuit current and no-load voltage for the same inclination angles.
For all configurations of the mPV, the efficiency was similar and amounted to approx. 13.3%, and in the case of the bPV, this parameter was more varied and ranged from 14.8 for the angle of 15° to 16.7% at the angle of 35°.

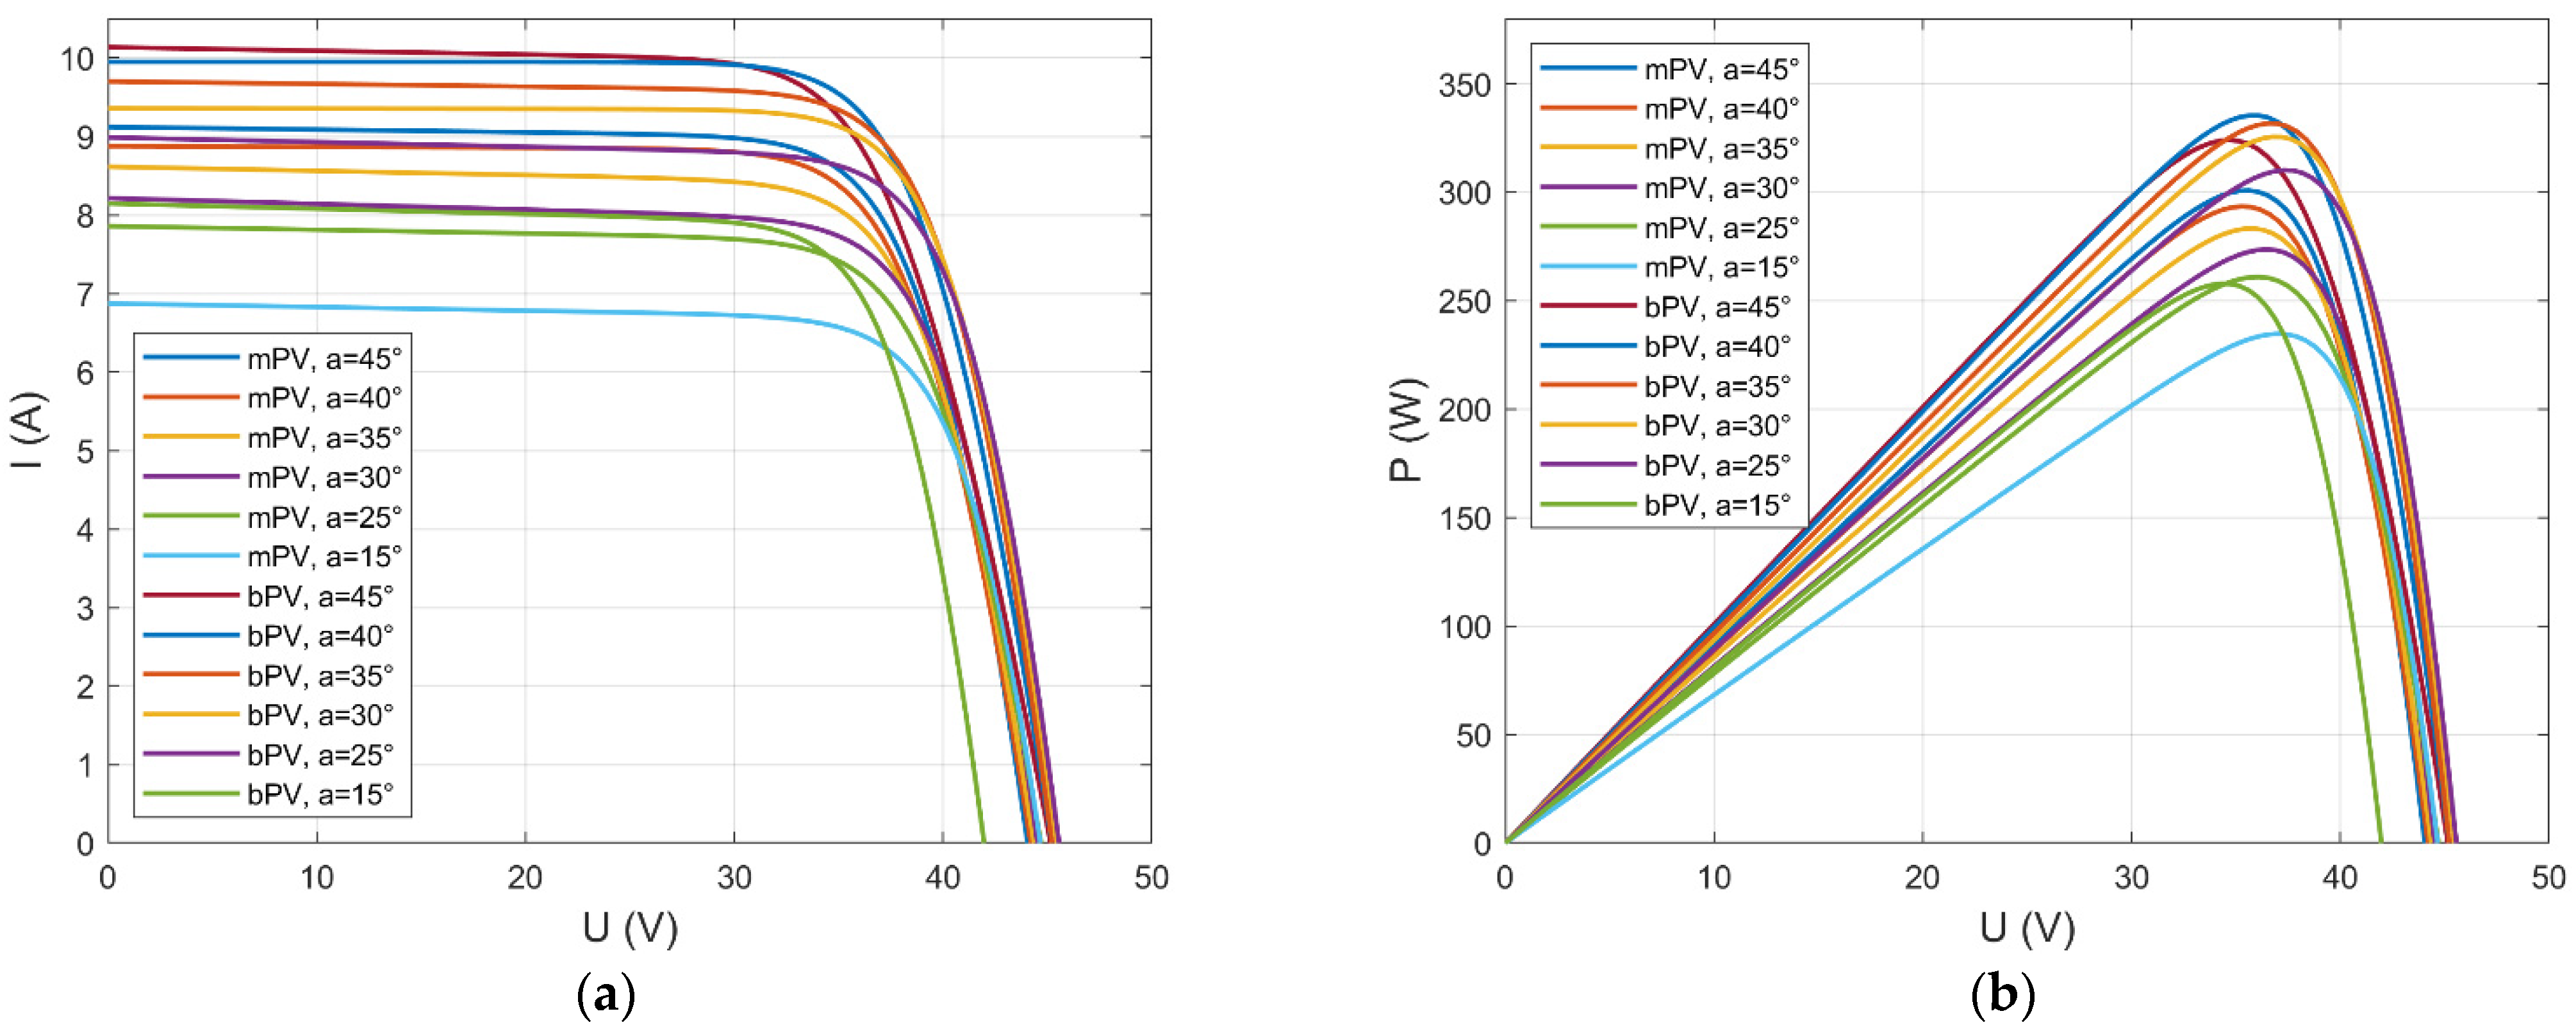
3.1.2. Study of the Influence of the Angle of Inclination of the Module on the Generation of Electricity When Placed Above the Green Ground at a Height of 0.75 m

Atmospheric conditions prevailing during the measurement and the determined values of parameters characteristic for the performed measurement test are presented in Table 3, and the obtained current–voltage and power–voltage characteristics are shown in Figure 3.
Changing the installation height—an increase of 0.25 m—does not affect the ratio of individual values for mPV and bPV panels. The powers, currents, and voltages obtained by the bPV module are higher. In turn, the percentage increase in generated power is significant, i.e., the bPV panel generated 10% to 15% more power than mPV.
The highest power of the bPV panel of 310 W was measured at an inclination angle of 30° and irradiance of 894 W/m2; for the mPV panel, the highest power of 275 W was obtained at the same angle and irradiance value.
For all configurations of the mPV panel, the efficiency was similar and amounted to about 13.3%; in the case of the bPV panel, the efficiency was higher, and the angle of inclination had a greater impact on this parameter. The efficiency ranged from 15.7% for the angle of 15° to 17% for the angle of 35°.

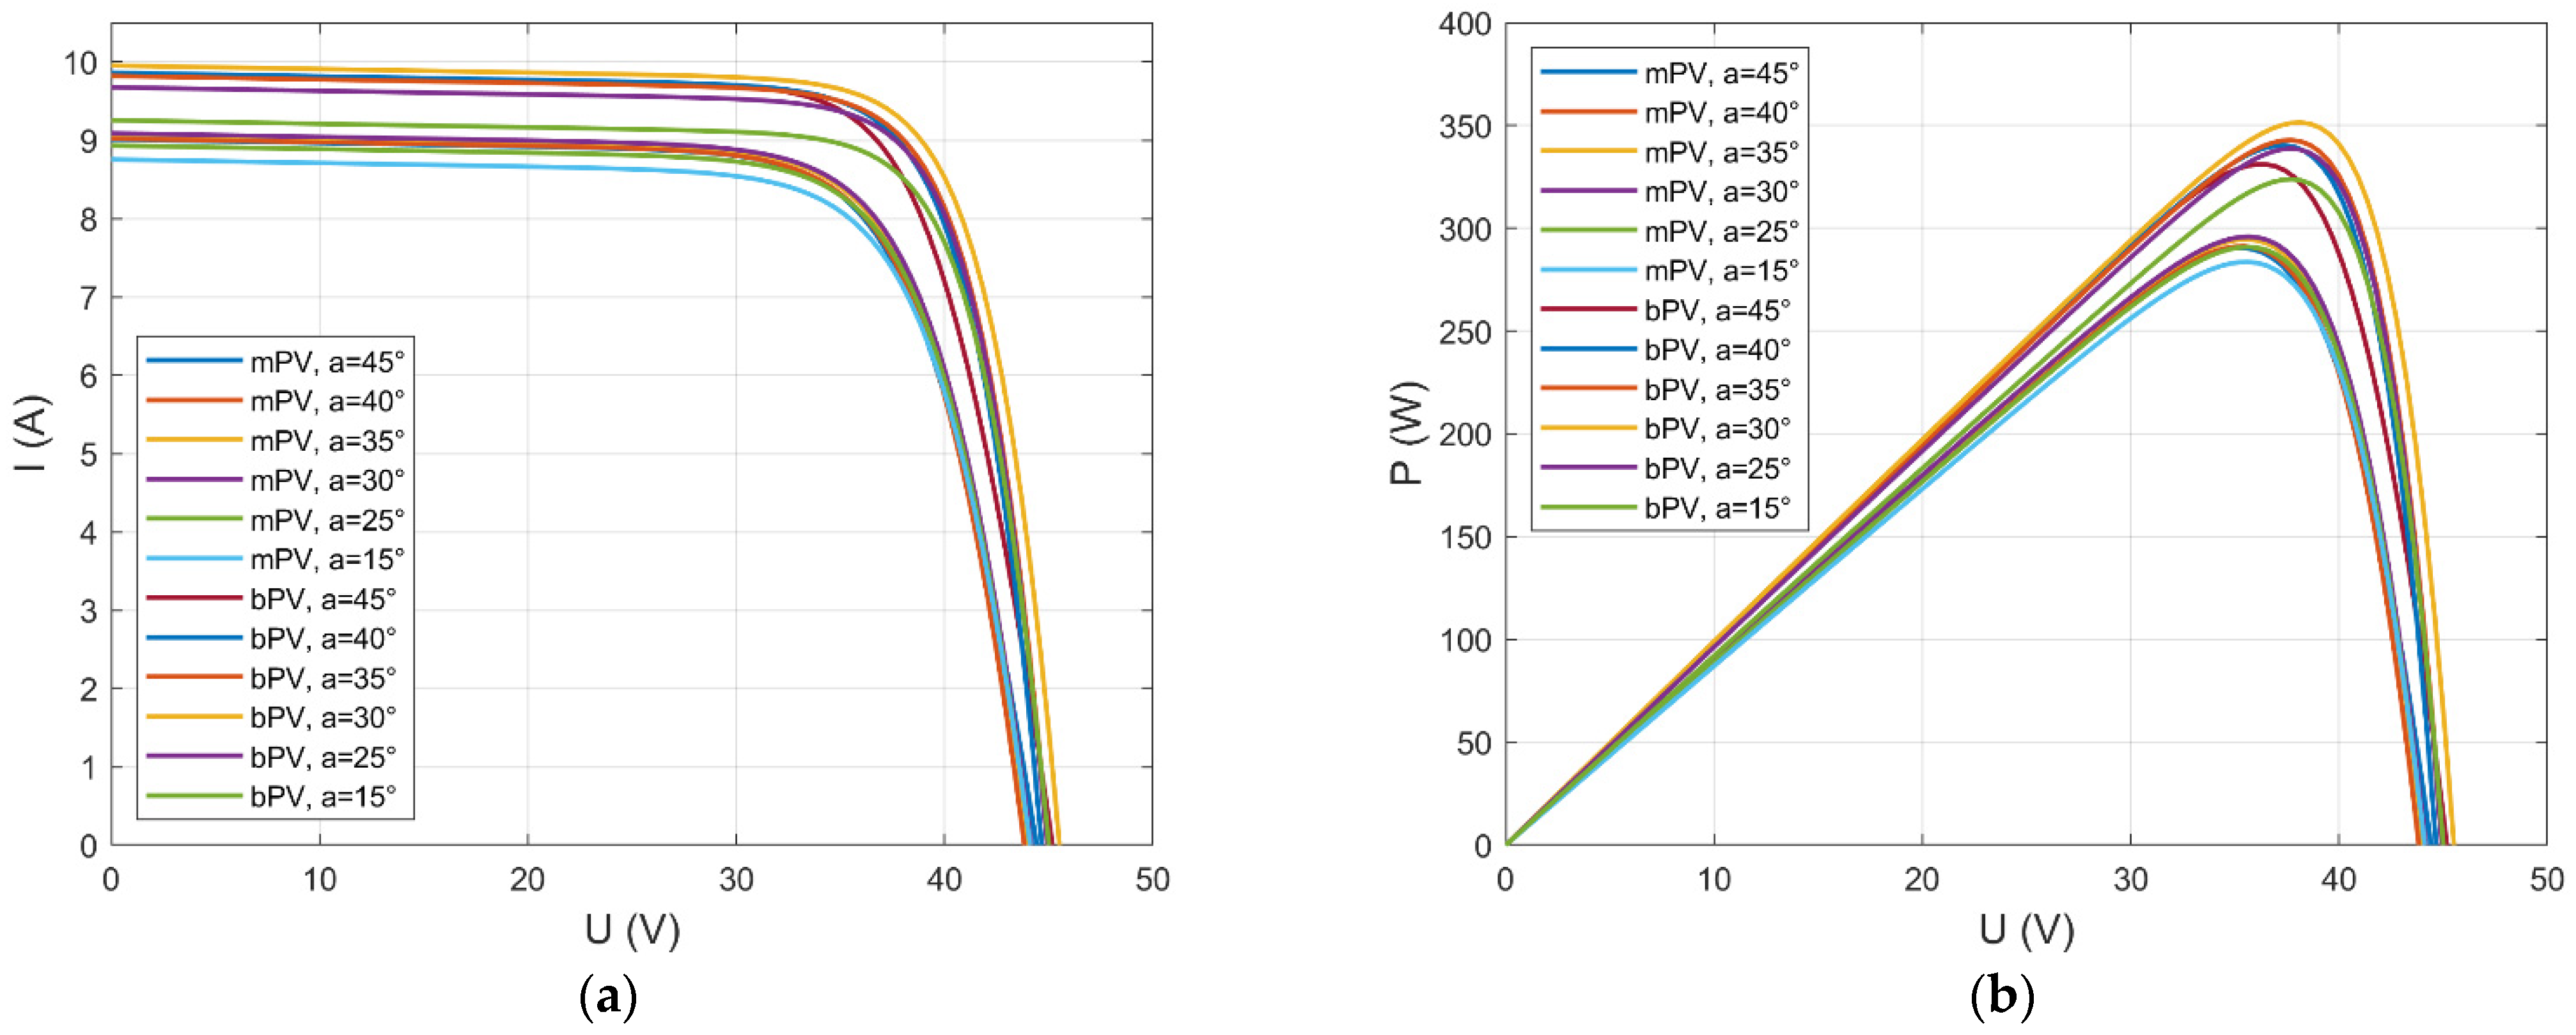
3.1.3. Study of the Influence of the Angle of Inclination of the Module on the Generation of Electricity When Placed Above the Green Ground at a Height of 1.0 m

Atmospheric conditions prevailing during the measurement and the determined values of parameters characteristic for the performed measurement test are presented in Table 4, and the obtained current–voltage and power–voltage characteristics are shown in Figure 4.
For the highest of the tested installation heights, another increase in the power obtained by the panels was recorded; one of the factors of this increase was also the increase in irradiance. Thus, for the bPV panel, the maximum power was 326 W at an inclination of 35° and irradiance of 955 W/m2, while for mPV, it was 293 W at an angle of 45° and the same irradiance value. In the presented sample, the bPV panel produced 10% to 13% more electricity than the mPV panel. Compared to the two previous configurations, this difference is smaller and may be related to a higher value of irradiance than in previous measurements. Better lighting conditions increase the yield from both cells, but the low albedo of the substrate does not allow using the potential of the double-sided cell.
As in the previous cases, the values of currents and voltages are higher for bPV panels. An important piece of information is the identification of distortions in the characteristics of the mPV panel for the angle of 15° and 25°, which occurred as a result of shading related to the presence of an electric pole casting a shadow on the panel.

3.2. Influence of the Module Inclination Angle and Mounting Height Above the White Substrate on Power Generation

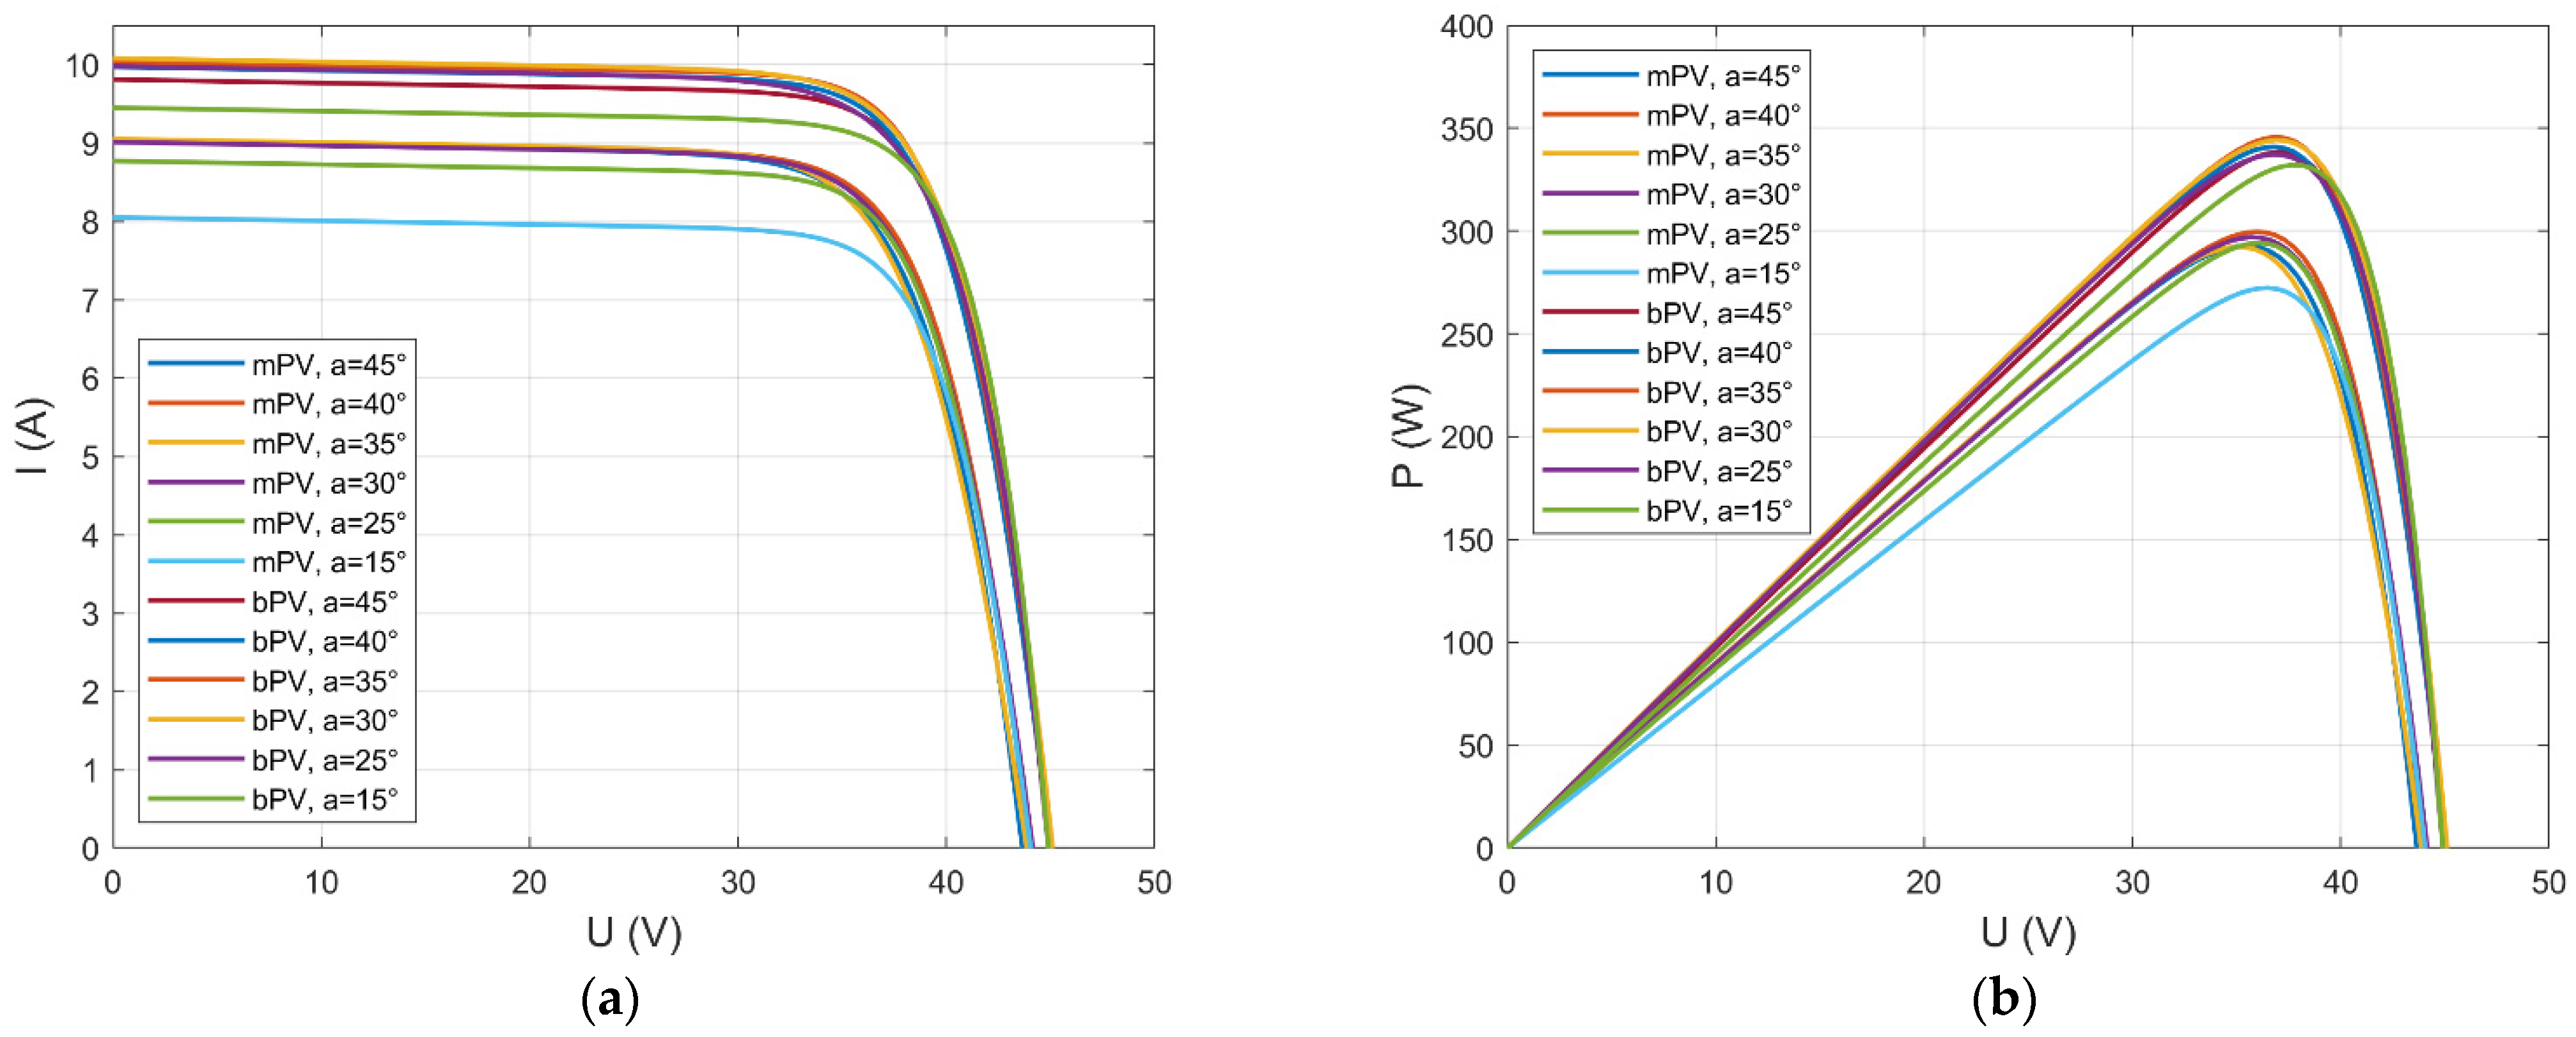
3.2.1. Study of the Influence of the Angle of Inclination of the Module on the Generation of Electricity When Placed Above the White Substrate at a Height of 0.5 m

The tests for the white substrate were carried out in the same way as for the green substrate, i.e., the angle of inclination of the module to the ground surface was from 15° to 45° in increments of 5°, and the mounting height was 0.5, 0.75, and 1 m.
Atmospheric conditions prevailing during the measurement and the determined values of parameters characteristic for individual measurement tests are shown in Table 5, and the obtained current–voltage and power–voltage characteristics are shown in Figure 5.
As was the case for the green substrate, in the case of the white substrate, for the lowest height, the differences are noticeable directly on the charts. Two groups of characteristics can be seen separately for the mPV and bPV modules. Analyzing the best cases, it can be seen that the bPV module generated the highest power of 345 W at an inclination angle of 35° and an irradiance of 1015 W/m2, while the mPV module generated the highest power of 282 W at an inclination angle of 45° and an irradiance of 1007 W/m2. In addition, the bPV panel generated from 17 to as much as 25% more power under similar lighting conditions. Analyzing the conversion efficiency of individual panels, it can be seen that for the mPV panel, it ranged from 12.7% to 13.3%, and in the case of the bifacial panel, this parameter ranged from 15.5% to 16.1% Other parameters, such as the short-circuit current or no-load voltage, were higher for the bPV panel. It should also be noted that these results were better than those obtained for the green substrate.

3.2.2. Study of the Influence of the Angle of Inclination of the Module on the Generation of Electricity When Placed Above the White Substrate at a Height of 0.75 m

Atmospheric conditions prevailing during the measurement and the determined values of parameters characteristic for individual measurement tests are shown in Table 6, and the obtained current–voltage and power–voltage characteristics are shown in Figure 6.
Increasing the mounting height to 0.75 m does not significantly change the ratio of power generation by both panels, i.e., the one generated by the bPV panel is much higher than that generated by the mPV panel. The differences range from 22 to 28%; such a big difference is related not only to the change in height, but also shows that in worse lighting conditions, the advantage of the bPV panel increases. The highest power of 344 W for the bPV panel was obtained for the angle of inclination of 30° and irradiance of 970 W/m2, while for the mPV panel, the highest power of 281 W was obtained for the angle of inclination of 35° and irradiance of 971 W/m2.
The voltages and currents measured during the tests were, as before, higher for the bPV panel. During the measurements for the bPV module for the angles of 15° and 35°, the irregularities visible in the graphs are related to the appearance of shading during the tests.

3.2.3. Study of the Influence of the Angle of Inclination of the Module on the Generation of Electricity When Placed Above the White Substrate at a Height of 1.0 m

Atmospheric conditions prevailing during the measurement and the determined values of parameters characteristic for individual measurement tests are shown in Table 7, and the obtained current–voltage and power–voltage characteristics are shown in Figure 7.
Measurements made for the highest mounting height of 1.0 m were carried out under the worst lighting conditions, which confirmed the previously observed advantage of the bPV panel over the mPV. The differences in generated power range from 28 to 56%, which is an important argument for considering this type of panels in places with weaker insolation and high albedo substrates. The highest power of 374 W for the bPV panel was obtained for the angle of inclination of 30° and irradiance of 970 W/m2, while for the mPV panel, the highest power of 274 W was obtained for the angle of inclination of 25° and the irradiance of 959 W/m2.
For the mPV panel, the efficiency ranged from 11.2% to 13.5%, and in the case of the bifacial panel, this parameter ranged from 16.9% to 18.3%.
The measured voltages and currents in individual tests were higher for the bPV panel. During these tests, there were temporary cloud cover, causing irregularities in the characteristics.

3.3. Influence of the Module Inclination Angle and Mounting Height Above the Gray Substrate on Power Generation

3.3.1. Study of the Influence of the Angle of Inclination of the Module on the Generation of Electricity When Placed Above the Gray Substrate at a Height of 0.5 m

As for the previous two substrates, the tests for the gray substrate were carried out for the angles of the module inclination to the ground surface from 15° to 45° degrees in increments of 5°, and the mounting height was 0.5, 0.75, or 1 m. Atmospheric conditions prevailing during the measurement and the determined values of parameters characteristic for individual measurement tests are shown in Table 8. The obtained current–voltage and power–voltage characteristics are shown in Figure 8.
Studies of a gray substrate, i.e., for one with an albedo coefficient greater than grass but lower than the white substrate, confirm that the use of double-sided panels increases power generation, and the profit is the greater the more the substrate reflects more light. For a distance from the ground of 0.5 m, the power generated by the bPV panel was 12 to 19% higher than the power generated by the mPV panel. The highest power of the bPV panel of 336 W was obtained with an inclination angle of 45° and an irradiance of 998 W/m2. For the mPV panel, the maximum power of 300 W was measured at a 45° inclination and an irradiance of 998 W/m2.
The conversion efficiency for the mPV panel was from 14.3% to 15.4%, while for the mPV panel, it was from 12.3% to 13.3%. Parameters such as currents and voltages were higher in the case of the bPV panel, as in the previous tests.

3.3.2. Study of the Influence of the Angle of Inclination of the Module on the Generation of Electricity When Placed Above the Gray Substrate at a Height of 0.75 m

Atmospheric conditions prevailing during the measurement and the determined values of parameters characteristic for individual measurement tests are shown in Table 9, and the obtained current–voltage and power–voltage characteristics are shown in Figure 9.
Increasing the installation height not only increases the energy yield, but, similarly to the white substrate, two groups of curves are clearly visible: one related to the bPV module and the other related to the mPV module. In the case of the bPV panel, the maximum power of 344 W was obtained at an angle of inclination of 30° with an irradiance of 975 W/m2, while for the mPV panel, the maximum power of 295 W was obtained at an angle of inclination of 30° with the same irradiance. The difference in generated power ranged from 13 to 17% in favor of the bPV panel. In turn, the conversion efficiency in this case ranged from 13 to 14.2% for the mPV panel and from 14.8 to 15.6% for the bPV panel. The relationship between the MPP current and voltage and short-circuit current and open-circuit voltage were again higher for the bPV panel.

3.3.3. Study of the Influence of the Angle of Inclination of the Module on the Generation of Electricity When Placed Above the Gray Substrate at a Height of 1.0 m

Atmospheric conditions prevailing during the measurement and the determined values of parameters characteristic for individual measurement tests are shown in Table 10, and the obtained current–voltage and power–voltage characteristics are shown in Figure 10.
Further increasing the mounting height confirms the advantage of the bPV panel at higher mounting heights. In this case, the bPV panel generates 13 to 19% more power than the mPV. The maximum power values obtained are 345 W for the bPV panel with an inclination of 35° and an irradiance of 973 W/m2 and 297 W for the mPV panel with an inclination of 30° and an irradiance of 982 W/m2.
For the mPV panel, the efficiency ranged from 13.0% to 13.6%, and for the bPV panel, this parameter ranged from 15.0% to 15.6%.
As in the previous cases, the values of individual currents and voltages are higher in the case of a bPV panel. During the tests of the bPV panel located at an angle of 15° and the mPV panel inclined at an angle of 40°, shading occurred, which is visible in the characteristics.

4. Discussion

4.1. Efficiency Analysis

After performing the experiments, parameters characterizing bifacial panels were determined and compared with the values obtained for mPV panels. The results of the calculations are summarized in Table 11 and presented in the form of graphs (Figure 11, Figure 12 and Figure 13).
A direct comparison of the generated power and efficiency of solar energy conversion into electricity shows that bPV panels for each analyzed substrate and each analyzed mounting height generate greater power and have higher efficiency. These differences are greater: the lower the irradiance, the higher the albedo of the substrate, and the morethe radiation can reach the back of the panels. This dependence is confirmed by the value of the BGE coefficient, reaching the highest values for a white substrate and an assembly height of 1 m.
A detailed analysis of BGE variability shows that the use of a low albedo substrate (grass and gray concrete) does not allow for exploiting the generation advantage of bPV panels. For grass, this coefficient ranges from 6% for an installation height of 0.5 m and an inclination angle of 15° to 15% for an installation height of 0.75 m and an inclination angle of 35°. On the other hand, for gray concrete, BGE ranges from 12% for an assembly height of 0.5 m and an inclination angle of 45° to 19% for an assembly height of 1 m and an inclination angle of 15°. In both of these cases, there is no single height for which this coefficient would assume the highest values, regardless of the angle of inclination. The situation is different in the case of a high-albedo (white) substrate. In this case, not only is the installation height important, but it is most advantageous to install the panels at a height of 1 m, and the BGE values are much higher than for other substrates. For a height of 1 m, this coefficient ranges from 28% for an angle of 40° to over 50% for angles of 30% and 56% for an angle of 15°.
Comparing the BGE values for various substrates and individual mounting heights, as shown in Figure 12, for low mounting heights, the angle of inclination is crucial—all substrates have this factor the highest for angles of 30–35°. Moreover, a substrate with a higher albedo has a higher BGE for each angle. Similar dependencies occur for higher assembly heights. The albedo is the dominant parameter here. The system with a white substrate has a much higher BGE, where in the remaining cases (green and gray substrates), these differences are definitely smaller, and in specific measurement conditions, the green substrate was characterized by a higher BGE than the gray one.
The analysis of the generation efficiency of bPV modules shows that bPV panels have a higher efficiency in all weather and assembly conditions. However, only for the white substrate, the use of which gives the highest efficiency, there is a relationship between the conversion efficiency and the mounting height—the most favorable conditions are for the highest tested height.

4.2. Energy Production and Emission Reduction

The application of bifacial photovoltaic (bPV) systems can complement the power supply for both residential and industrial consumers. As demonstrated above, these panels exhibit higher efficiency. To determine the combination of parameters yielding the highest energy output along with an estimated reduction in CO2 emissions, a simulation was conducted for a selected location in the Greater Poland Voivodship. The results are presented in Table 12. Conversely, Table 13 summarizes the simulation results for a reference mPV panel with the same power rating. All calculations were normalized and referenced to Annual Energy Production of 1 kW PV system installed power. The estimated reduction in CO2 emissions during energy production, according to emission indicators published by The National Centre for Emissions Management (KOBiZE) [41], was assumed to be 0.597 kg/kWh with Formula (11).
C O 2 ,   e m i s s i o n = E p . a . · 0.597
where Ep.a. is the annual production of energy from 1 kW of a solar power plant.
In the case of bifacial photovoltaic systems, several factors influence the amount of energy produced: the tilt angle, the surface albedo, and the mounting height. In contrast, for monofacial photovoltaic systems, the tilt angle is the sole decisive parameter. This angle depends on the installation’s location. By exploring optimal configurations for bifacial PV systems—those that maximize energy production—it is possible to achieve significantly higher outputs compared to monofacial PV systems. In most configurations, the use of bPV panels enhances annual energy production. However, for the smallest tested tilt angle of 15°, the mPV panel produces more energy annually.
In the best-case scenario, the annual energy production of bPV systems can be up to 13% greater than that of mPV panels. Additionally, this configuration avoids the emission of nearly 95 kg of CO2 per kW of installed capacity. For the studied location, this optimal scenario occurs with bright surfaces having an albedo of 80, height equal to 1 m, and tilt angles within the range of 40–45°.

5. Conclusions

The conducted research concerned the analysis of the impact of assembly conditions on the output parameters of bPV modules in the climatic conditions of Poland. Selected parameters were compared, particularly the generated power depending on the height of the panel assembly and its angle of inclination.
On the basis of the conducted research, conclusions can be formulated that are also guidelines for designers of PV systems on the ground.
  • Double-sided panels generate slightly more power in similar lighting conditions, while in worse conditions, their advantage is significant.
  • Bifacial panels are more efficient, which is up to 6 percentage points higher for bPV, especially at lower irradiance values.
  • The value of the power generated by the PV panels, in particular, the yield of the bottom part, is mainly affected by the installation height and the ground; the highest yields are obtained with a substrate with a high albedo coefficient and a higher installation height. This is provided by the values of the BGE indicator, which informs that even 1/3 of energy can be produced by the back side of the panel.
  • Two-sided panels require a smaller angle of inclination to the ground than one-sided panels; the difference is up to 10°.
  • The use of bifacial panels in installations is characterized by an increase in annual electricity production ranging from a few to over a dozen percent.

Author Contributions

Conceptualization, D.K., A.D., E.K., J.J., J.M., W.W., M.S., O.O. and K.T.; methodology, D.K., A.D., E.K., J.J., J.M., W.W., M.S., O.O. and K.T.; software, D.K., A.D., E.K., J.J., J.M., W.W., M.S., O.O. and K.T.; validation, D.K., A.D., E.K., J.J., J.M., W.W., M.S., O.O. and K.T.; formal analysis, D.K., A.D., E.K., J.J., J.M., W.W., M.S., O.O. and K.T.; investigation, D.K., A.D., E.K., J.J., J.M., W.W., M.S., O.O., K.T. and E.B.; resources, D.K., A.D., E.K., J.J., J.M., W.W., M.S., O.O. and K.T.; data curation, D.K., A.D., E.K., J.J., J.M., W.W., M.S., O.O., K.T. and E.B.; writing—original draft preparation, D.K., A.D., E.K., J.J., J.M., W.W., M.S., O.O. and K.T.; writing—review and editing, D.K., A.D., E.K., J.J., J.M., W.W., M.S., O.O., K.T. and E.B.; visualization, D.K., A.D., E.K., J.J., J.M., W.W., M.S., O.O. and K.T.; supervision, D.K., A.D., E.K., J.J., J.M., W.W., M.S., O.O. and K.T.; project administration, D.K., A.D., E.K., J.J., J.M., W.W., M.S., O.O., K.T. and E.B. All authors have read and agreed to the published version of the manuscript.

Funding

This research is funded by the project “Generation, storage and processing of energy using selected electrical systems” No. 0212/SBAD/0614 financed by the Polish Ministry of Education and Science. This study was financed in part by the Faculty of Engineering Management (WIZ) of Bialystok University of Technology under the project WZ/WIZ-INZ/2/2025 (Olga Orynycz) and by the Institute of Mechanical Engineering, Warsaw University of Life Sciences.

Data Availability Statement

The original contributions presented in the study are included in the article, further inquiries can be directed to the corresponding author.

Conflicts of Interest

The authors declare no conflicts of interest.

Nomenclature

mPVMonofacial photovoltaic panel.
bPVBifacial photovoltaic panel.
PPower generated by the PV module (W).
ICurrent of the PV module (A).
UVoltage of the PV module (V).
PMPPPower at the maximum power point (A).
IMPPCurrent intensity at the maximum power point (A).
UMPPVoltage at maximum power point (V).
UOCOpen-circuit voltage (V).
ISCShort-circuit current intensity (A).
ηEfficiency of the PV module (-).
FFFill factor of photovoltaic module (-).
pFFPseudo fill factor, which does not consider the losses generated by series resistance (-).
ESolar irradiance intensity, irradiance (W/m2).
EEThe total value of irradiance that reached the bifacial module (W/m2).
SModule’s surface area (m2).
BGEAdditional energy (power) ratio generated by the rear part of the module in relation to the energy (power) generated by the panel front part (%).
BGEIscCurrent efficiency ratio of the rear side of the module to the current efficiency of the front side (-).
nNumber of PV cells in the module (pcs.).
kBoltzmann constant (1.38 × 10⁻²³ J/K).
qElectric charge (q = 1.6 × 10⁻¹⁹ C).
TModule temperature (°C).
Subscript biRefers to the bifacial module.
Subscript rearRefers to the rear side of the bifacial module.
Subscript frontRefers to the front side of the bifacial module.

References

  1. Joint Research Centre (European Commission); Crippa, M.; Guizzardi, D.; Banja, M.; Solazzo, E.; Muntean, M.; Schaaf, E.; Pagani, F.; Monforti-Ferrario, F.; Olivier, J.G.J.; et al. CO2 Emissions of All World Countries: JRC/IEA/PBL 2022 Report; Publications Office of the European Union: Luxembourg, 2022. [Google Scholar]
  2. DNV. Energy Transition Outlook 2022. In A Global and Regional Forecast to 2050; DNV: Bærum, Norway, 2023. [Google Scholar]
  3. Chodakowska, E.; Nazarko, J.; Nazarko, Ł.; Rabayah, H.S. Solar Radiation Forecasting: A Systematic Meta-Review of Current Methods and Emerging Trends. Energies 2024, 17, 3156. [Google Scholar] [CrossRef]
  4. BP. Statistical Review of World Energy 2022; BP: London, UK, 2022. [Google Scholar]
  5. EU Solar Energy Strategy. Available online: https://energy.ec.europa.eu/topics/renewable-energy/solar-energy_en (accessed on 20 January 2025).
  6. Parida, B.; Iniyan, S.; Goic, R. A Review of Solar Photovoltaic Technologies. Renew. Sustain. Energy Rev. 2011, 15, 1625–1636. [Google Scholar] [CrossRef]
  7. Philipps, D.S.; Ise, F.; Warmuth, W.; GmbH, P.P. Photovoltaics Report 2022; Fraunhofer ISE: Freiburg, Germany, 2023. [Google Scholar]
  8. Ašmontas, S.; Mujahid, M. Recent Progress in Perovskite Tandem Solar Cells. Nanomaterials 2023, 13, 1886. [Google Scholar] [CrossRef] [PubMed]
  9. Gong, J.; Sumathy, K.; Qiao, Q.; Zhou, Z. Review on Dye-Sensitized Solar Cells (DSSCs): Advanced Techniques and Research Trends. Renew. Sustain. Energy Rev. 2017, 68, 234–246. [Google Scholar] [CrossRef]
  10. Hwang, S.; Lee, H.; Kang, Y. Energy Yield Comparison between Monofacial Photovoltaic Modules with Monofacial and Bifacial Cells in a Carport. Energy Rep. 2023, 9, 3148–3153. [Google Scholar] [CrossRef]
  11. Yu, G.; Yang, H.; Yan, Z.; Kyeredey Ansah, M. A Review of Designs and Performance of Façade-Based Building Integrated Photovoltaic-Thermal (BIPVT) Systems. Appl. Therm. Eng. 2021, 182, 116081. [Google Scholar] [CrossRef]
  12. Kaji Esfahani, S.; Tenorio, R.; Karrech, A.; Defendi, K.; Jerez, F. Analysing the Role of Roof Mounted BIPV System Optimization on Decreasing the Effect of Duck Curve in Perth, Western Australia: An Experimental Case Study. Sustain. Energy Technol. Assess. 2021, 47, 101328. [Google Scholar] [CrossRef]
  13. Pawlak-Jakubowska, A. Retractable Roof Module with Photovoltaic Panel as Small Solar Power Plant. Energy Build. 2023, 288, 112994. [Google Scholar] [CrossRef]
  14. Appelbaum, J.; Aronescu, A.; Maor, T. Shading by Overhang PV Collectors. Appl. Sci. 2019, 9, 4280. [Google Scholar] [CrossRef]
  15. Akbari Paydar, M. Optimum Design of Building Integrated PV Module as a Movable Shading Device. Sustain. Cities Soc. 2020, 62, 102368. [Google Scholar] [CrossRef]
  16. Metz, A.; Fischer, M.; Trube, J. International Technology Roadmap for Photovoltaic (ITRPV) Results 2017. In Proceedings of the PV Manufacturing in Europe Conference, Brussels, Belgium, 19 May 2017; Available online: https://etip-pv.eu/publications/etip-pv-publications/download/international-technology-roadmap-for-photovoltaics (accessed on 26 February 2025).
  17. Fischer, M.; Woodhouse, M.; Baliozian, P. International Technology Roadmap for Photovoltaic (ITRPV) Results 2023, VDMA e. V. Photovoltaics Equipment, May 2024. Available online: https://www.qualenergia.it/wp-content/uploads/2024/06/ITRPV-15th-Edition-2024-2.pdf (accessed on 26 February 2025).
  18. Krainer, D.M.; Rennhofer, M.; Mittal, A.; Ujvari, G.; Zamini, S.; Weihs, P.; Dorninger, M. Bifacial photovoltaic module performance in correlation to cloud conditions, sun spectrum and irradiance enhancement. Solar Energy 2025, 285, 113110. [Google Scholar] [CrossRef]
  19. Dobrzycki, A.; Kurz, D.; Maćkowiak, E. Influence of Selected Working Conditions on Electricity Generation in Bifacial Photovoltaic Modules in Polish Climatic Conditions. Energies 2021, 14, 4964. [Google Scholar] [CrossRef]
  20. Raina, G.; Sinha, S. A Simulation Study to Evaluate and Compare Monofacial Vs Bifacial PERC PV Cells and the Effect of Albedo on Bifacial Performance. Mater. Today Proc. 2021, 46, 5242–5247. [Google Scholar] [CrossRef]
  21. Dullweber, T.; Schmidt, J. Industrial Silicon Solar Cells Applying the Passivated Emitter and Rear Cell (PERC) Concept—A Review. IEEE J. Photovolt. 2016, 6, 1366–1381. [Google Scholar] [CrossRef]
  22. Appelbaum, J. Bifacial Photovoltaic Panels Field. Renew. Energy 2016, 85, 338–343. [Google Scholar] [CrossRef]
  23. Guo, S.; Walsh, T.M.; Peters, M. Vertically Mounted Bifacial Photovoltaic Modules: A Global Analysis. Energy 2013, 61, 447–454. [Google Scholar] [CrossRef]
  24. Olczak, P.; Olek, M.; Matuszewska, D.; Dyczko, A.; Mania, T. Monofacial and Bifacial Micro PV Installation as Element of Energy Transition—The Case of Poland. Energies 2021, 14, 499. [Google Scholar] [CrossRef]
  25. Gulkowski, S. Specific Yield Analysis of the Rooftop PV Systems Located in South-Eastern Poland. Energies 2022, 15, 3666. [Google Scholar] [CrossRef]
  26. Khan, S.; Sudhakar, K.; Yusof, M.H. bin Comparison of Mono and Bifacial Modules for Building Integration and Electric Vehicle Charging: A Case Study in Sweden. Energy Convers. Manag. X 2023, 20, 100420. [Google Scholar] [CrossRef]
  27. Muehleisen, W.; Loeschnig, J.; Feichtner, M.; Burgers, A.R.; Bende, E.E.; Zamini, S.; Yerasimou, Y.; Kosel, J.; Hirschl, C.; Georghiou, G.E. Energy Yield Measurement of an Elevated PV System on a White Flat Roof and a Performance Comparison of Monofacial and Bifacial Modules. Renew. Energy 2021, 170, 613–619. [Google Scholar] [CrossRef]
  28. Sahu, P.K.; Roy, J.N.; Chakraborty, C.; Sundaram, S. A New Model for Estimation of Energy Extraction from Bifacial Photovoltaic Modules. Energies 2021, 14, 5089. [Google Scholar] [CrossRef]
  29. Cha, H.L.; Bhang, B.G.; Park, S.Y.; Choi, J.H.; Ahn, H.K. Power Prediction of Bifacial Si PV Module with Different Reflection Conditions on Rooftop. Appl. Sci. 2018, 8, 1752. [Google Scholar] [CrossRef]
  30. Fajuke, I.D.; Raji, A.K. Firefly Algorithm-Based Optimization of the Additional Energy Yield of Bifacial PV Modules. Energies 2022, 15, 2651. [Google Scholar] [CrossRef]
  31. Bouchakour, S.; Valencia-Caballero, D.; Luna, A.; Roman, E.; Boudjelthia, E.A.K.; Rodríguez, P. Modelling and Simulation of Bifacial PV Production Using Monofacial Electrical Models. Energies 2021, 14, 4224. [Google Scholar] [CrossRef]
  32. Rodriguez-Pastor, D.A.; Ildefonso-Sanchez, A.F.; Soltero, V.M.; Peralta, M.E.; Chacartegui, R. A New Predictive Model for the Design and Evaluation of Bifacial Photovoltaic Plants under the Influence of Vegetation Soils. J. Clean. Prod. 2023, 385, 135701. [Google Scholar] [CrossRef]
  33. Abdallah, A.A.; Kivambe, M.; Aïssa, B.; Figgis, B.W. Performance of Monofacial and Bifacial Silicon Heterojunction Modules under Desert Conditions and the Impact of PV Soiling. Sustainability 2023, 15, 8436. [Google Scholar] [CrossRef]
  34. Jang, J.; Lee, K. Practical Performance Analysis of a Bifacial PV Module and System. Energies 2020, 13, 4389. [Google Scholar] [CrossRef]
  35. Alam, M.; Gul, M.S.; Muneer, T. Performance Analysis and Comparison between Bifacial and Monofacial Solar Photovoltaic at Various Ground Albedo Conditions. Renew. Energy Focus 2023, 44, 295–316. [Google Scholar] [CrossRef]
  36. Ganesan, K.; Winston, D.P.; Sugumar, S.; Jegan, S. Performance Analysis of N-Type PERT Bifacial Solar PV Module under Diverse Albedo Conditions. Sol. Energy 2023, 252, 81–90. [Google Scholar] [CrossRef]
  37. Solar Power Europe (2024): Global Market Outlook for Solar Power 2024–2028. Available online: https://www.solarpowereurope.org/insights/outlooks/global-market-outlook-for-solar-power-2024-2028/detail (accessed on 20 January 2025).
  38. Datasheet of Bifacial Module LG 390N2T-A5. Available online: https://www.lg.com/global/business/download/resources/solar/NeON%202%20BiFacial%2072cells.pdf (accessed on 27 May 2021).
  39. Marion, B. Ground Albedo Measurements and Modeling, Lakewood. 2018. Available online: https://www.nrel.gov/docs/fy20osti/72589.pdf (accessed on 26 June 2020).
  40. Data on Irradiance and Temperature in Poland, PVGIS. Available online: https://ec.europa.eu/jrc/en/pvgis (accessed on 14 December 2020).
  41. The National Centre for Emissions Management (KOBiZE). Available online: https://www.kobize.pl/ (accessed on 22 February 2025).
Figure 1. The 3D design of a rack for mounting PV panels.
Energies 18 01296 g001
Figure 2. Current–voltage (a) and power–voltage (b) characteristics for a green substrate with panel mounting height H = 0.5 m at a variable angle of inclination.
Energies 18 01296 g002
Figure 3. Current–voltage (a) and power–voltage (b) characteristics for a green substrate, with panel mounting height H = 0.75 m at a variable angle of inclination.
Energies 18 01296 g003
Figure 4. Current–voltage (a) and power–voltage (b) characteristics for a green substrate with panel mounting height H = 1.0 m at a variable angle of inclination.
Energies 18 01296 g004
Figure 5. Current–voltage (a) and power–voltage (b) characteristics for a white substrate with panel mounting height H = 0.5 m at a variable angle of inclination.
Energies 18 01296 g005
Figure 6. Current–voltage (a) and power–voltage (b) characteristics for a white substrate with panel mounting height H = 0.75 m at a variable angle of inclination.
Energies 18 01296 g006
Figure 7. Current–voltage (a) and power–voltage (b) characteristics for a white substrate with panel mounting height H = 1.0 m at a variable angle of inclination.
Energies 18 01296 g007
Figure 8. Current–voltage (a) and power–voltage (b) characteristics for a gray substrate with panel mounting height H = 0.5 m at a variable angle of inclination.
Energies 18 01296 g008
Figure 9. Current–voltage (a) and power–voltage (b) characteristics for a gray substrate with panel mounting height H = 0.75 m at a variable angle of inclination.
Energies 18 01296 g009
Figure 10. Current–voltage (a) and power–voltage (b) characteristics for a gray substrate with panel mounting height H = 1.0 m at a variable angle of inclination.
Energies 18 01296 g010
Figure 11. Dependence of the BGE indicator on the angle of inclination α and the installation height H of the bifacial panel above the ground: grass green (a), gray (b), and white (c).
Energies 18 01296 g011
Figure 12. Dependence of the BGE indicator on the angle of inclination α and the type of substrate under the bifacial panel for the installation height H: 0.5 m (a), 0.75 m (b), and 1 m (c).
Energies 18 01296 g012aEnergies 18 01296 g012b
Figure 13. Efficiency of the panels η as a function of the angle of inclination α for different heights H of the panels above the ground: green (a), white (b), and gray (c).
Energies 18 01296 g013aEnergies 18 01296 g013b
Table 1. Parameters of the LG 390-N2T-A5 bifacial module in STC [38].
ParameterValue
Isc [A]10.15
Uoc [V]49.2
PMPP [W]390
UMPP [V]41.4
IMPP [A]9.43
η [%]18.5
n [pcs.]72
PV cells typemonocrystaline/n-type
Dimensions L × W × H [mm]2064 × 1024 × 40
Table 2. Values of the calculated parameters based on measurements for a green substrate and an assembly height of 0.5 m.
Typeα
[°]
Efront
[W/m2]
T
[°C]
UMPP
[V]
IMPP
[A]
UOC
[V]
ISC
[A]
PMPP
[W]
FF
[-]
Monofacial4588755.038.6536.9045.0927.84266.7060.754
4088036.7307.4044.8957.99271.8020.758
3586937.5517.1444.7087.85268.1140.764
3087736.7277.3644.5957.82270.3110.775
2586836.8497.2244.6177.79266.0500.765
1587036.2697.0844.4447.34256.7850.787
Bifacial4588744.937.0038.0045.9388.37296.0240.919
4088038.1177.9445.9108.56302.6490.913
3586938.3808.0045.7198.57307.0400.896
3087737.2258.2445.7508.56306.7340.890
2586836.3268.0845.7708.37293.5140.907
1587038.5677.0545.5477.85271.8970.912
Table 3. Values of the calculated parameters based on measurements for a green substrate and an assembly height of 0.75 m.
Typeα
[°]
Efront
[W/m2]
T
[°C]
UMPP
[V]
IMPP
[A]
UOC
[V]
ISC
[A]
PMPP
[W]
FF
[-]
Monofacial4590554.936.6017.5744.4988.15277.070.764
4085537.0527.2644.9967.85268.9980.762
3586235.3947.5843.9957.95268.2870.767
3089434.9867.8543.7448.07274.640.778
2585736.7377.2845.0957.75267.4450.765
1584535.6996.9444.6167.21247.7510.770
Bifacial4590545.038.1287.9845.5218.58304.2610.929
4085538.2227.8845.9428.55301.1890.899
3586237.5888.2245.8198.64308.9730.884
3089436.4828.545.6178.96310.0970.864
2585738.1997.9146.1098.56302.1540.885
1584537.8257.4146.2978.3280.2830.837
Table 4. Values of the calculated parameters based on measurements for a green substrate and an assembly height of 1.0 m.
Typeα
[°]
Efront
[W/m2]
T
[°C]
UMPP
[V]
IMPP
[A]
UOC
[V]
ISC
[A]
PMPP
[W]
FF
[-]
Monofacial4596655.235.7758.1944.1288.77292.9970.757
4095435.2768.1244.0218.77286.4410.742
3595535.0768.2744.0958.83290.0780.745
3094337.3097.8244.0158.75291.7560.758
2591535.1287.9243.8158.47278.2140.750
1585036.8717.1543.0087.97263.6280.769
Bifacial4596646.134.5789.2844.8179.55320.8840.904
4095436.7448.6145.0899.47316.3660.904
3595537.4668.7145.2399.51326.3290.905
3094337.1938.6545.1599.41321.7200.906
2591537.0248.3345.0119.17308.4010.899
1585037.6747.9044.7818.65297.6250.885
Table 5. Values of the calculated parameters based on measurements for a white substrate and an assembly height of 0.5 m.
Typeα
[°]
Efront
[W/m2]
T
[°C]
UMPP
[V]
IMPP
[A]
UOC
[V]
ISC
[A]
PMPP
[W]
FF
[-]
Monofacial45100754.935.0488.0544.2778.56282.1360.760
40103637.8607.3744.2239.05279.0280.783
35101537.3037.5544.2279.09281.6380.743
30100638.7147.0544.1298.89272.9340.753
25100737.6237.2244.3688.77271.6380.734
1598237.4287.1944.2278.31269.1070.747
Bifacial45100749.036.2249.1545.1389.72331.450.864
40103636.7799.2245.12810.01339.1020.886
35101539.2038.8145.21810.25345.3780.867
30100637.0169.2544.97510.09342.4000.864
25100736.4319.2545.03810.04336.9870.861
1598235.6129.2544.9529.69329.4110.844
Table 6. Values of the calculated parameters based on measurements for a white substrate and an assembly height of 0.75 m.
Typeα
[°]
Efront
[W/m2]
T
[°C]
UMPP
[V]
IMPP
[A]
UOC
[V]
ISC
[A]
PMPP
[W]
FF
[-]
Monofacial4597955.232.5178.3744.3788.61272.1670.722
4097632.578.3144.3188.56270.6570.735
3597134.9118.0544.2248.38281.0340.747
3097035.4457.9044.2218.18280.0160.747
2595133.7507.6745.4517.89258.8630.739
1593531.6167.9045.0368.05249.7660.745
Bifacial4597951.237.1929.0545.07710.15336.5880.835
4097636.2599.3545.10710.15339.0220.829
3597136.0299.5544.89910.08344.0800.819
3097036.7319.3944.8599.92344.9040.813
2595136.1519.0846.0209.65328.2510.808
1593539.6168.1046.1259.11320.8890.863
Table 7. Values of the calculated parameters based on measurements for a white substrate and an assembly height of 1.0 m.
Typeα
[°]
Efront
[W/m2]
T
[°C]
UMPP
[V]
IMPP
[A]
UOC
[V]
ISC
[A]
PMPP
[W]
FF
[-]
Monofacial4596354.931.0988.4043.9448.4261.2230.743
4096633.7168.0843.9448.41272.4250.753
3595632.7018.0944.3068.30264.5510.734
3097030.0928.2844.2418.39249.1620.747
2595933.8158.1144.1878.34274.2400.760
1594328.4667.8744.0148.10224.0270.768
Bifacial4596352.035.4689.7045.01710.41344.0400.788
4096636.3469.6045.01710.74348.9220.764
3595636.30410.1145.79611.05367.0330.727
3097035.71110.4945.73011.01374.6080.737
2595936.1159.8045.02410.93353.9300.749
1594336.2479.6944.78310.44351.2330.763
Table 8. Values of the calculated parameters based on measurements for a gray substrate and an assembly height of 0.5 m.
Typeα
[°]
Efront
[W/m2]
T
[°C]
UMPP
[V]
IMPP
[A]
UOC
[V]
ISC
[A]
PMPP
[W]
FF
[-]
Monofacial4599855.135.3428.5144.0869.13300.7610.783
4098735.1368.3544.2158.88293.3860.760
3596035.5377.9744.4148.63283.2300.745
3092836.3347.5344.6128.23273.6000.739
2589135.8977.4644.7517.87267.7920.747
1585437.0266.5144.7236.88241.0390.747
Bifacial4599846.934.3119.845.19510.16336.2480.732
4098735.6389.4145.2189.95335.3540.745
3596036.5299.0845.2529.71331.6830.755
3092836.7848.8545.4629.36325.5380.765
2589137.2808.3245.6239.00310.1700.755
1585437.0867.5442.0398.16279.6280.742
Table 9. Values of the calculated parameters based on measurements for a gray substrate and an assembly height of 0.75 m.
Typeα
[°]
Efront
[W/m2]
T
[°C]
UMPP
[V]
IMPP
[A]
UOC
[V]
ISC
[A]
PMPP
[W]
FF
[-]
Monofacial4598256.134.2548.44044.4159.01289.1040.735
4097935.8918.10043.8319.02290.7170.722
3598036.0988.14444.0599.077293.9830.735
3097536.1638.16844.1619.087295.2620.736
2597236.1358.03844.1098.931290.4550.737
1596536.1487.82844.1188.754282.9800.733
Bifacial4598246.835.019.38045.1789.86328.3940.737
4097938.9598.54044.6619.86332.710.756
3598039.1698.58944.9869.820336.4040.762
3097539.7078.66845.5199.953344.1920.760
2597239.2218.47144.9289.675332.2440.764
1596539.0078.18645.0099.254319.3250.767
Table 10. Values of the calculated parameters based on measurements for a gray substrate and an assembly height of 1.0 m.
Typeα
[°]
Efront
[W/m2]
T
[°C]
UMPP
[V]
IMPP
[A]
UOC
[V]
ISC
[A]
PMPP
[W]
FF
[-]
Monofacial4597055.435.968.1343.6549.01292.3550.768
4097236.4778.2043.9849.03299.1110.760
3597334.2558.5043.8539.05291.1680.747
3098235.6978.3244.1539.01297.0000.734
2597235.6138.2544.0538.77293.8070.753
1591936.6897.4244.0538.05272.2320.743
Bifacial4597052.037.0269.1445.0509.81338.4180.766
4097236.2989.3845.0109.97340.4750.759
3597336.2889.545.10910.04344.740.761
3098237.6059.1345.10910.08343.3340.755
2597238.4868.6044.8999.98330.9800.739
1591939.5118.2044.8999.45323.9900.764
Table 11. Parameters determined based on the measurement data.
H [m]α
[°]
Green SubstrateWhite SubstrateGray Substrate
Efront
[W/m2]
Monofacial (mPV)Bifacial
(bPV)
Efront
[W/m2]
Monofacial (mPV)Bifacial
(bPV)
Efront
[W/m2]
Monofacial (mPV)Bifacial
(bPV)
PMPP
[W]
η
[%]
PMPP
[W]
η
[%]
BGE
[%]
PMPP
[W]
η
[%]
PMPP
[W]
η
[%]
BGE
[%]
PMPP
[W]
η
[%]
PMPP
[W]
η
[%]
BGE
[%]
0.545887266.7113.2296.0215.810.991007282.1413.3331.4515.617.48998300.7613.3336.2514.911.80
40880271.8013.5302.6516.311.351036279.0312.7339.1015.521.53987293.3913.1335.3515.014.31
35869268.1113.5307.0416.714.521015281.6413.1345.3816.122.63960283.2313.0331.6815.217.11
30877270.3113.5306.7316.613.471006272.9312.8342.4016.125.45928273.6013.0325.5415.418.98
25868266.0513.4293.5116.010.321007271.6412.8336.9915.824.06891267.7913.2310.1715.315.83
15870256.7912.9271.9014.85.89982269.1113.0329.4115.922.41854241.0412.3279.6314.316.01
0.7545905277.0713.4304.2615.99.81979272.1713.2336.5916.323.67982289.1013.0328.3914.813.59
40855268.9913.8301.1916.711.97976270.6613.1339.0216.425.26979290.7213.1332.7115.014.45
35862268.2913.6308.9717.015.17971281.0313.7344.0816.822.43980293.9814.2336.4015.414.43
30894274.6413.5310.1016.412.91970280.0213.7344.9016.823.17975295.2614.2344.1915.616.52
25857267.4513.7302.1516.712.98951258.8612.9328.2516.326.81972290.4614.0332.2415.214.39
15845247.7512.8280.2815.713.13935249.7712.6320.9016.228.48965282.9813.6319.3314.812.84
145966292.9913.4320.8815.79.52963261.2212.8344.0416.931.70970292.3613.3338.4215.415.76
40954286.4413.2316.3715.710.45966272.4313.3348.9217.128.08972299.1113.6340.4815.513.83
35955290.0813.4326.3316.212.50956264.5513.1367.0318.238.74973291.1713.2344.7415.618.40
30943291.7613.6321.7216.110.27970249.1612.2374.6118.350.35982297.0013.4343.3315.415.60
25915278.2113.4308.4016.010.85959274.2413.5353.9317.529.06972293.8113.3330.9815.012.65
15850263.6313.6297.6316.612.90943224.0311.2351.2317.656.78919272.2313.0323.9915.519.01
Table 12. Annual energy production and CO2 emission reduction for bPV systems.
H [m]α
[°]
Green Substrate
(Albedo 0.2)
Gray Substrate
(Albedo 0.4)
White Substrate
(Albedo 0.8)
Ep.a.
[kWh p.a.]
CO2
[kg p.a.]
Ep.a.
[kWh p.a.]
CO2
[kg p.a.]
Ep.a.
[kWh p.a.]
CO2
[kg p.a.]
0.5451258.60751.381296.07773.751370.27818.05
401257.29750.601289.02769.541352.03807.16
351250.78746.721277.27762.531329.98794.00
301237.83738.981259.64752.011303.10777.95
251217.53726.871235.19737.411270.38758.42
151157.32690.921167.61697.061188.17709.34
0.75451256.04749.861290.97770.711360.22812.05
401255.55749.561284.80767.031342.95801.74
351248.94745.621272.95759.951320.75788.49
301235.01737.301254.38748.861292.98771.91
251215.07725.401230.26734.471260.54752.54
151157.53691.051165.69695.921181.97705.64
1451254.01748.641287.39768.571353.60808.10
401254.35748.851282.02765.371337.06798.22
351245.71743.691268.07757.041312.62783.63
301231.85735.411249.56745.991284.87767.07
251213.90724.701227.44732.781254.45748.91
151155.37689.761162.12693.791175.61701.84
Table 13. Annual energy production and CO2 emission reduction for mPV systems.
α
[°]
Monofacial
Ep.a.
[kWh p.a.]
CO2
[kg p.a.]
451194.02712.83
401200.46716.67
351200.20716.52
301193.47712.50
251180.17704.56
151136.71678.62
Disclaimer/Publisher’s Note: The statements, opinions and data contained in all publications are solely those of the individual author(s) and contributor(s) and not of MDPI and/or the editor(s). MDPI and/or the editor(s) disclaim responsibility for any injury to people or property resulting from any ideas, methods, instructions or products referred to in the content.

