Article

Structural Feasibility of a Wind Turbine Blade Inspired by an Owl Airfoil

Department of Mechanical and Product Design Engineering, Swinburne University of Technology, Hawthorn, VIC 3122, Australia
*
Authors to whom correspondence should be addressed.
Energies 2025, 18(5), 1288; https://doi.org/10.3390/en18051288
Submission received: 22 January 2025 / Revised: 2 March 2025 / Accepted: 4 March 2025 / Published: 6 March 2025
(This article belongs to the Special Issue Advances in Fluid Dynamics and Wind Power Systems: 2nd Edition)

Abstract

:
Geometrical solutions for aerodynamic limitations comprise a major development towards improving the wind energy capture efficiency and aerodynamic performance of wind turbines. However, the implementation of some mechanisms such as considerably thin airfoils have been a hurdle due to the available manufacturing methods and cost effectiveness. Moreover, the analysis has been mostly focused on analyzing and optimizing the aerodynamic aspect of wind turbines, independently of the structural performance necessary to support the optimized aerodynamic performance. Therefore, this paper analyzes the fluid–structure interaction (FSI) of a wind turbine with a relatively thin airfoil section using computational fluid dynamics (CFD) and finite element analysis (FEA) to evaluate the total displacement as well as the stresses acting on the blade as the results of the aerodynamic pressure distribution. Using the structural design, geometrical scales, and material properties of baseline model, the structural performance reflected by the thin airfoil design is isolated. Not only did the thin airfoil reduce the volume of the material and, therefore, the weight of the modified blade, but it was also able to provide high rigidity, which is necessary to support better aerodynamic performance. This was found to be influenced by the structural shape of the turbine blade, resulting in a maximum total deformation of less than 5.9 × 10⁻⁷ m, which is very negligible in comparison to the scale of the turbine blade in this analysis.

1. Introduction

Inspired solutions with biological designs have been increasingly relied on to achieve better aerodynamic characteristics of small wind turbines. Whether it is to achieve a higher lift or to reduce emitted noise, some mechanisms have proven to be effective. In particular, the airfoil cross-section designs of birds such as seagulls and owls have helped achieve higher lift and lower noise levels, respectively [1,2,3,4,5,6]. However, the practicality in applying designs from a structural point of view has not been investigated. In our previous work, the effects of an owl airfoil design on the noise emitted by the National Renewable Energy Laboratory (NREL) Phase VI wind turbine blade were studied [7]. In this study, the generated noises by the baseline NREL Phase VI model and the modified model implementing the owl airfoil geometrical characteristics were analyzed using CFD simulations and compared for operational cases where torques generated by both models are of close values. This way, the work was able to determine and investigate the direct effects that the owl airfoil design inflected on the aerodynamics, and thus, the acoustics of the NREL Phase VI wind turbine. Nevertheless, the analysis assumed the turbine blades to be rigid bodies and did not take into account any deformation during operation that could alter the aerodynamic results of the modified model. However, we suspected that the considerably thin airfoil section of the owl could result in decreasing the rigidity of the baseline blade, which uses the relatively thick S809 airfoil profile. This is, of course, if both the baseline and the modified model implement the same material properties. For this reason, the prediction of the impacts reflected by the owl thin airfoil on the structural behavior of modified model is crucial.
In the meantime, the undertaking of three-dimensional FSI analysis of realistically flexible turbine blades is not a simple task, and the accuracy of such simulation is dependent on various factors since the interaction of flexible blades with relative airflow yields a range of phenomena, both aerodynamic and structural. For example, an analysis of a flexible horizontal-axis wind turbine (HAWT) blade using a finite-volume fluid–structure interaction solver revealed a drastic change in the surface pressure distribution due to the aeroelastic response, attributing the deflection to a lower suction pressure on the forward side of the blade [8]. Similarly, the FSI coupling investigation of the effect of blade pitch angle on the aerodynamic and structural characteristics of another HAWT faced difficulty in selecting a desirable pitch angle due to aeroelastic responses [9]. Moreover, aeroelastic simulations applied to large-scale turbines such as 1.5 and 2.3 MW wind turbines operating in standard and complex atmospheric flow conditions resulted in considerable differences in the solutions between the prediction of rigid and flexible blades using CFD-based FSI models [10]. The influence of gravity also, when considered, further affected the tangential displacement of three 50 m long turbine blades, as it reflected a significant effect on the loads experienced by the blades. Here, twisting deformation led to a change in the angle of attack (AoA) by 2.5°, causing a change in the tip speed and, thus, an unfavorable change in torque output. However, the total torque output remained relatively constant compared to the rigid blade case [11]. Also, a large mass was added when modeling the flow interaction with floating structures, such as offshore wind turbines, and with various assumptions for the interactions with the waves [12,13,14]. This requires a much-advanced FSI formulation which is outside the scope of this study.
In general, there is some increase in the loading of a flexible blade in comparison to a ridged one, although the flow characteristics in the wake of a flexible rotor are almost identical to a stiff one. Therefore, the inclusion of flexibility in FSI analysis was found to somewhat increase the forces experienced by the blade model due to the increase in the swept area of the rotor by deformation [15]. Nevertheless, the size of large wind turbines often led to increased flexibility in the structure, leading to an increase in aeroelastic effects, which could result in instabilities such as fluttering of turbine blades [16]. Therefore, the effects of structural flexibility on small wind turbine blades are much less considerable in FSI modeling. In fact, most of the vibrations in the NREL Phase VI wind turbine were found in its tower, not its blades [17,18]. Furthermore, the deformation was mostly caused by changes in the flow characteristics instead of the increase in velocity [19].
The goal of this paper is to mainly fill the missing gap in a previous work that successfully optimized the acoustics of the NREL Phase VI wind turbine using the airfoil profile characteristics of an owl. The previous work assumed complete rigidity of the turbine blades during operation, and thus, clarifying the practicality of this assumption is very crucial in order to validate the aerodynamic optimization that was achieved. Therefore, this paper aims to verify the rigidity of the modified NREL Phase VI wind turbine model. Here, the virtual model is first constructed in Section 2 based on the scale, geometry, and boundary conditions of the NREL Phase VI wind turbine implementing the airfoil of the owl. The resulting structural performance is then analyzed in Section 3 to clarify the rigidity of the modified model. In conclusion, the results mainly highlight the influence of the structural shape over the volume of the material. Besides providing an understanding of the important relationship between fluid dynamics and structural behavior at the beginner level, this work also provides a simplified approach in optimizing the structural characteristics of lifting surfaces for aerodynamic purposes.

2. Numerical Model

Virtual analysis, such as CFD and FEM analyses, has proven to be reliable in analyzing wind turbine performance. The use of virtual simulations can be much more cost-effective than the experimental setup, with equal and, in some cases, higher practicality. This is because virtual analysis provides a vaster range of realistic conditions, while experiments have limited operational conditions. Virtual simulation can also implement larger computational domains and are not limited to the laboratory-scale model [20]. However, the accuracy of CFD code can be affected by some errors such as modeling errors due to incorrect geometry, boundary conditions, and other data. Nevertheless, the less, an error is deemed stable if it does not propagate in the calculation. Meanwhile, the pressure distribution over the surfaces of the blade resulting from the calculated aerodynamic forces is imported by the FEM simulation in the FSI analysis. This introduces a major propagation of error through transfer rather than calculation. Hence, the validation of the CFD results in particular plays a crucial step in ensuring correct FSI analysis.

2.1. Model Geometry

The NREL Phase VI experimental wind turbine is a small horizontal axis wind turbine consisting of two blades with a rotor diameter of 10.058 m and a hub height of 12.192 m. Each blade was constructed using the S809 airfoil profile with the listed parameters in Table 1. Fewer span locations were used, however, to model the blade for simplification, as shown in Figure 1. The test section dimensions of 24.4 m high, 36.6 m wide, and 57.912 m long [21] were retained for the computational domain, with the wind turbine positioned so that the computational domain is larger in the wake of the turbine, as shown in Figure 2. However, the data show no considerable aerodynamic impact by the tower or the hub, and therefore, they are excluded from the virtual model.
To further ensure the accuracy of results, the thin airfoil employed in this analysis was defined through three-dimensional laser scanning along the span of an owl wing with approximately 0.041 mm accuracy [22]. The airfoil coordinate points were extracted using a semi-automated web-based tool [23]. The tool uses X and Y coordinates to select points on an image. The data were then imported in Autodesk Inventor to create the airfoil. Meanwhile, the D-spar structure shape supporting the mainframe of the NREL Phase VI wind turbine blade was applied to the thin airfoil model, as shown in Figure 3, with a surface thickness of 5 mm from the root to the tip of the blade.

2.2. Boundary Conditions

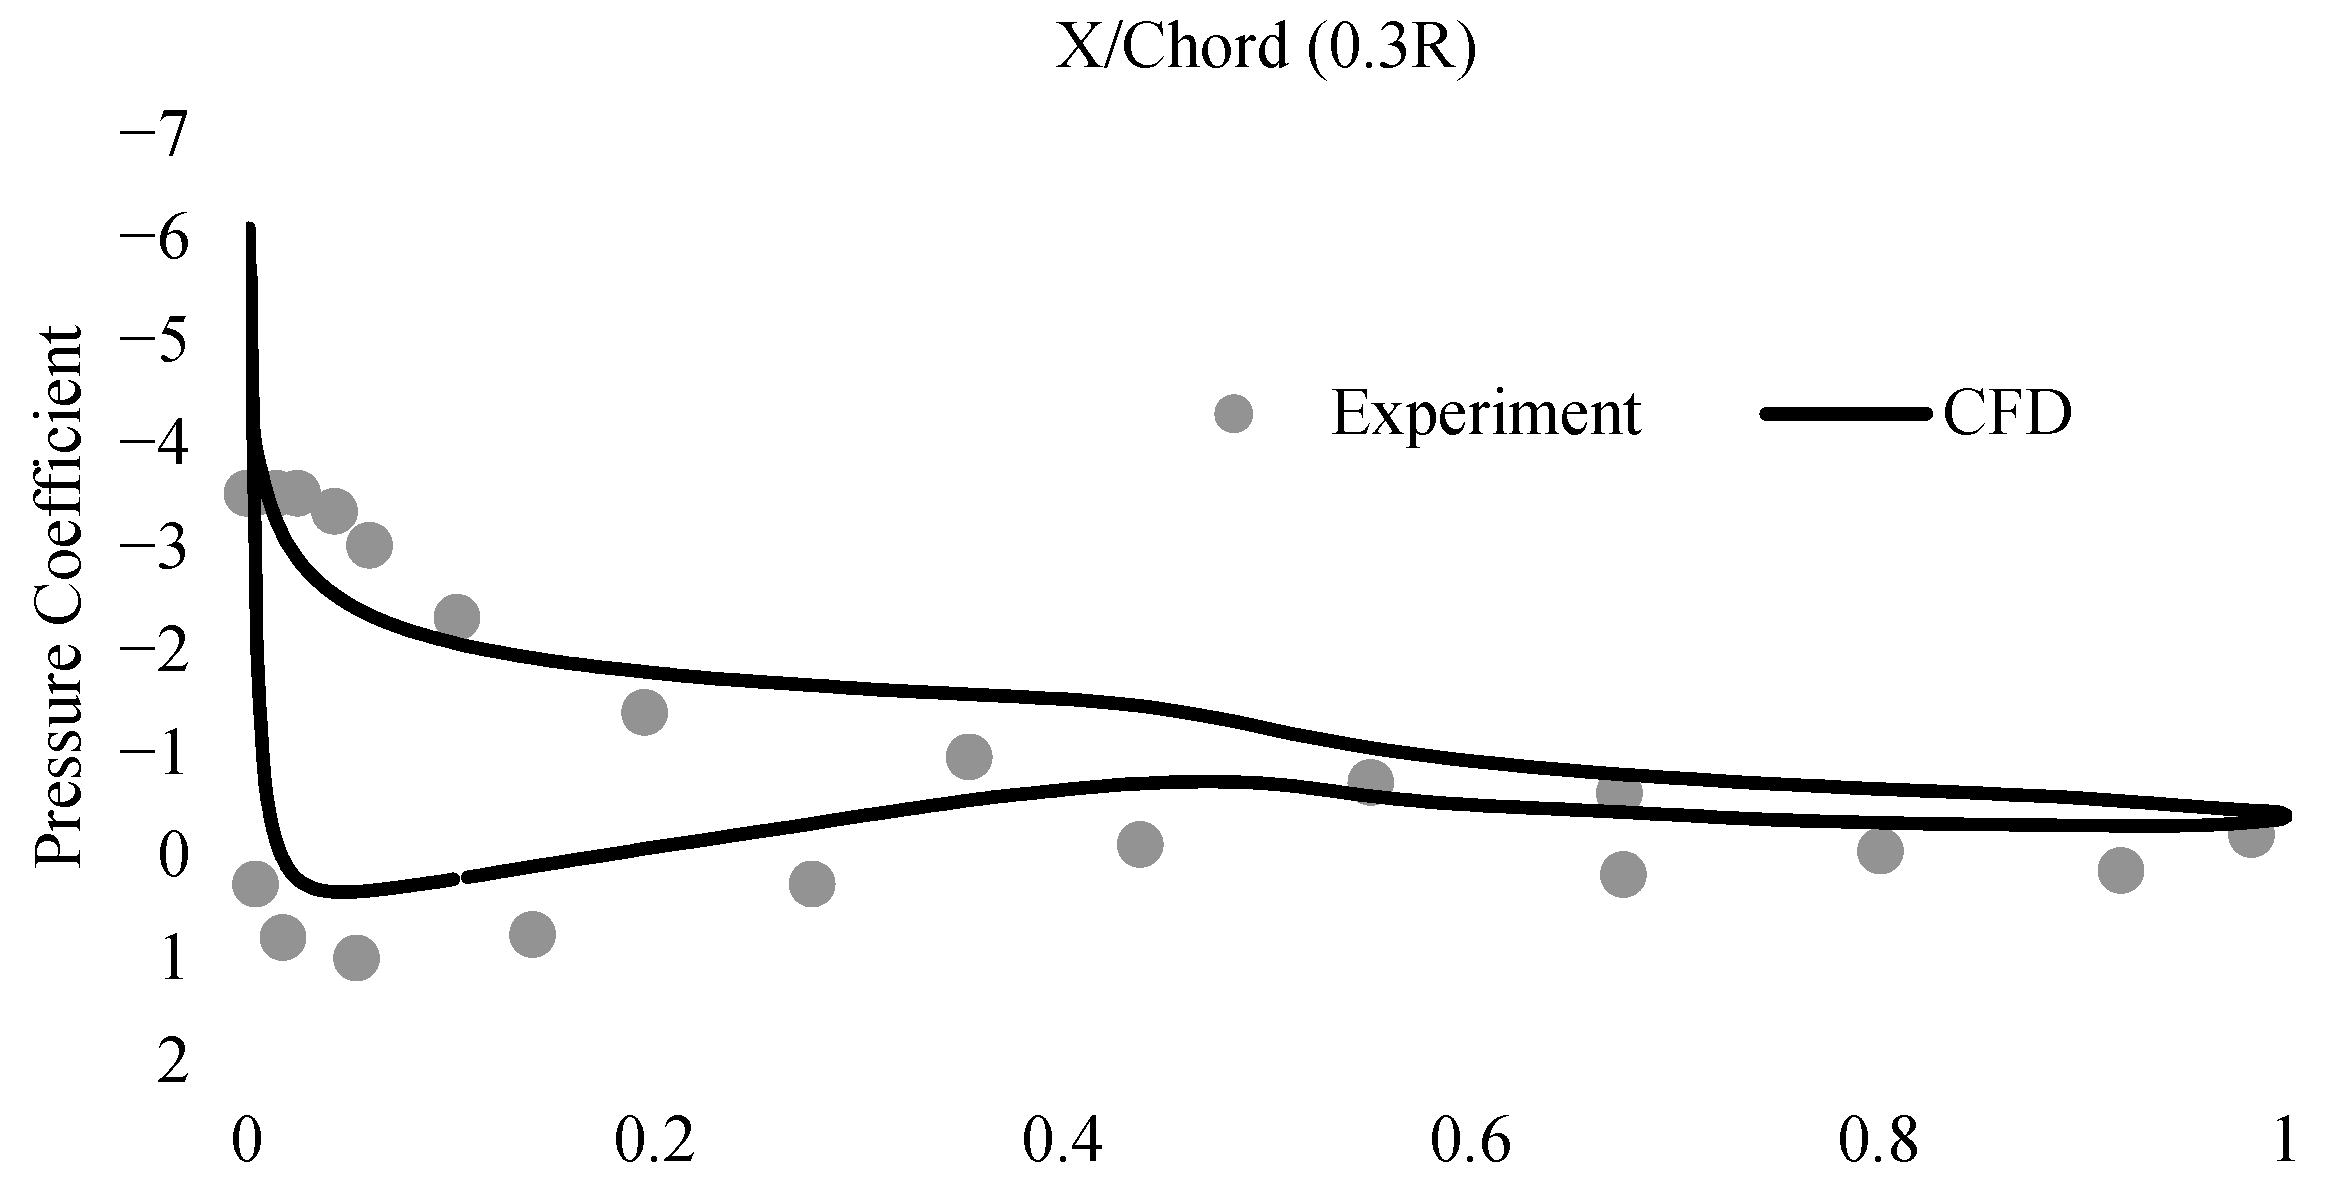
The least complex test configuration of the NREL Phase VI experiment implements rigid upwind turbine with no tip attachment, 0° tilt, yaw, and cone angles, 72 RPM constant rotational speed, and 3° constant pitch angle. The tests inlet velocities were also kept constant at 5, 10, 15, 20, and 25 m/s resampled steady flow conditions. The flow separation, however, was mostly developed during the 10 m/s case around the 30% span location of the blades. This created challenges in simulating the turbine at this condition, particularly near the mid-section of the blade [24,25,26,27,28,29,30,31]. The validation of this simulation is, therefore, based on this particular inlet velocity and span location using three-dimensional moving reference frame model of realistically rotating blades and the SST k-ω turbulence model in Ansys Fluent 2022 R2 to simulate important flow behavior such as the transition from laminar-to-turbulent and flow separation in order to obtain correct results of pressure distribution. The SST k-ω model has been reliable in modeling the NREL Phase VI experiment with effective trade-off between computational cost and precision [24,25,26,28,29,30,31]. This is because the model incorporates a blending function to activate the k-ω turbulence model near the surfaces before switching to the k-ε turbulence model at distance points from the surfaces to compensate for the sensitivity to shear flow, as well as the limitation of the k-ε near the surface. No-slip boundary condition is also used to simulate the thin boundary layers [22].

2.3. Mesh Refinement and Validation

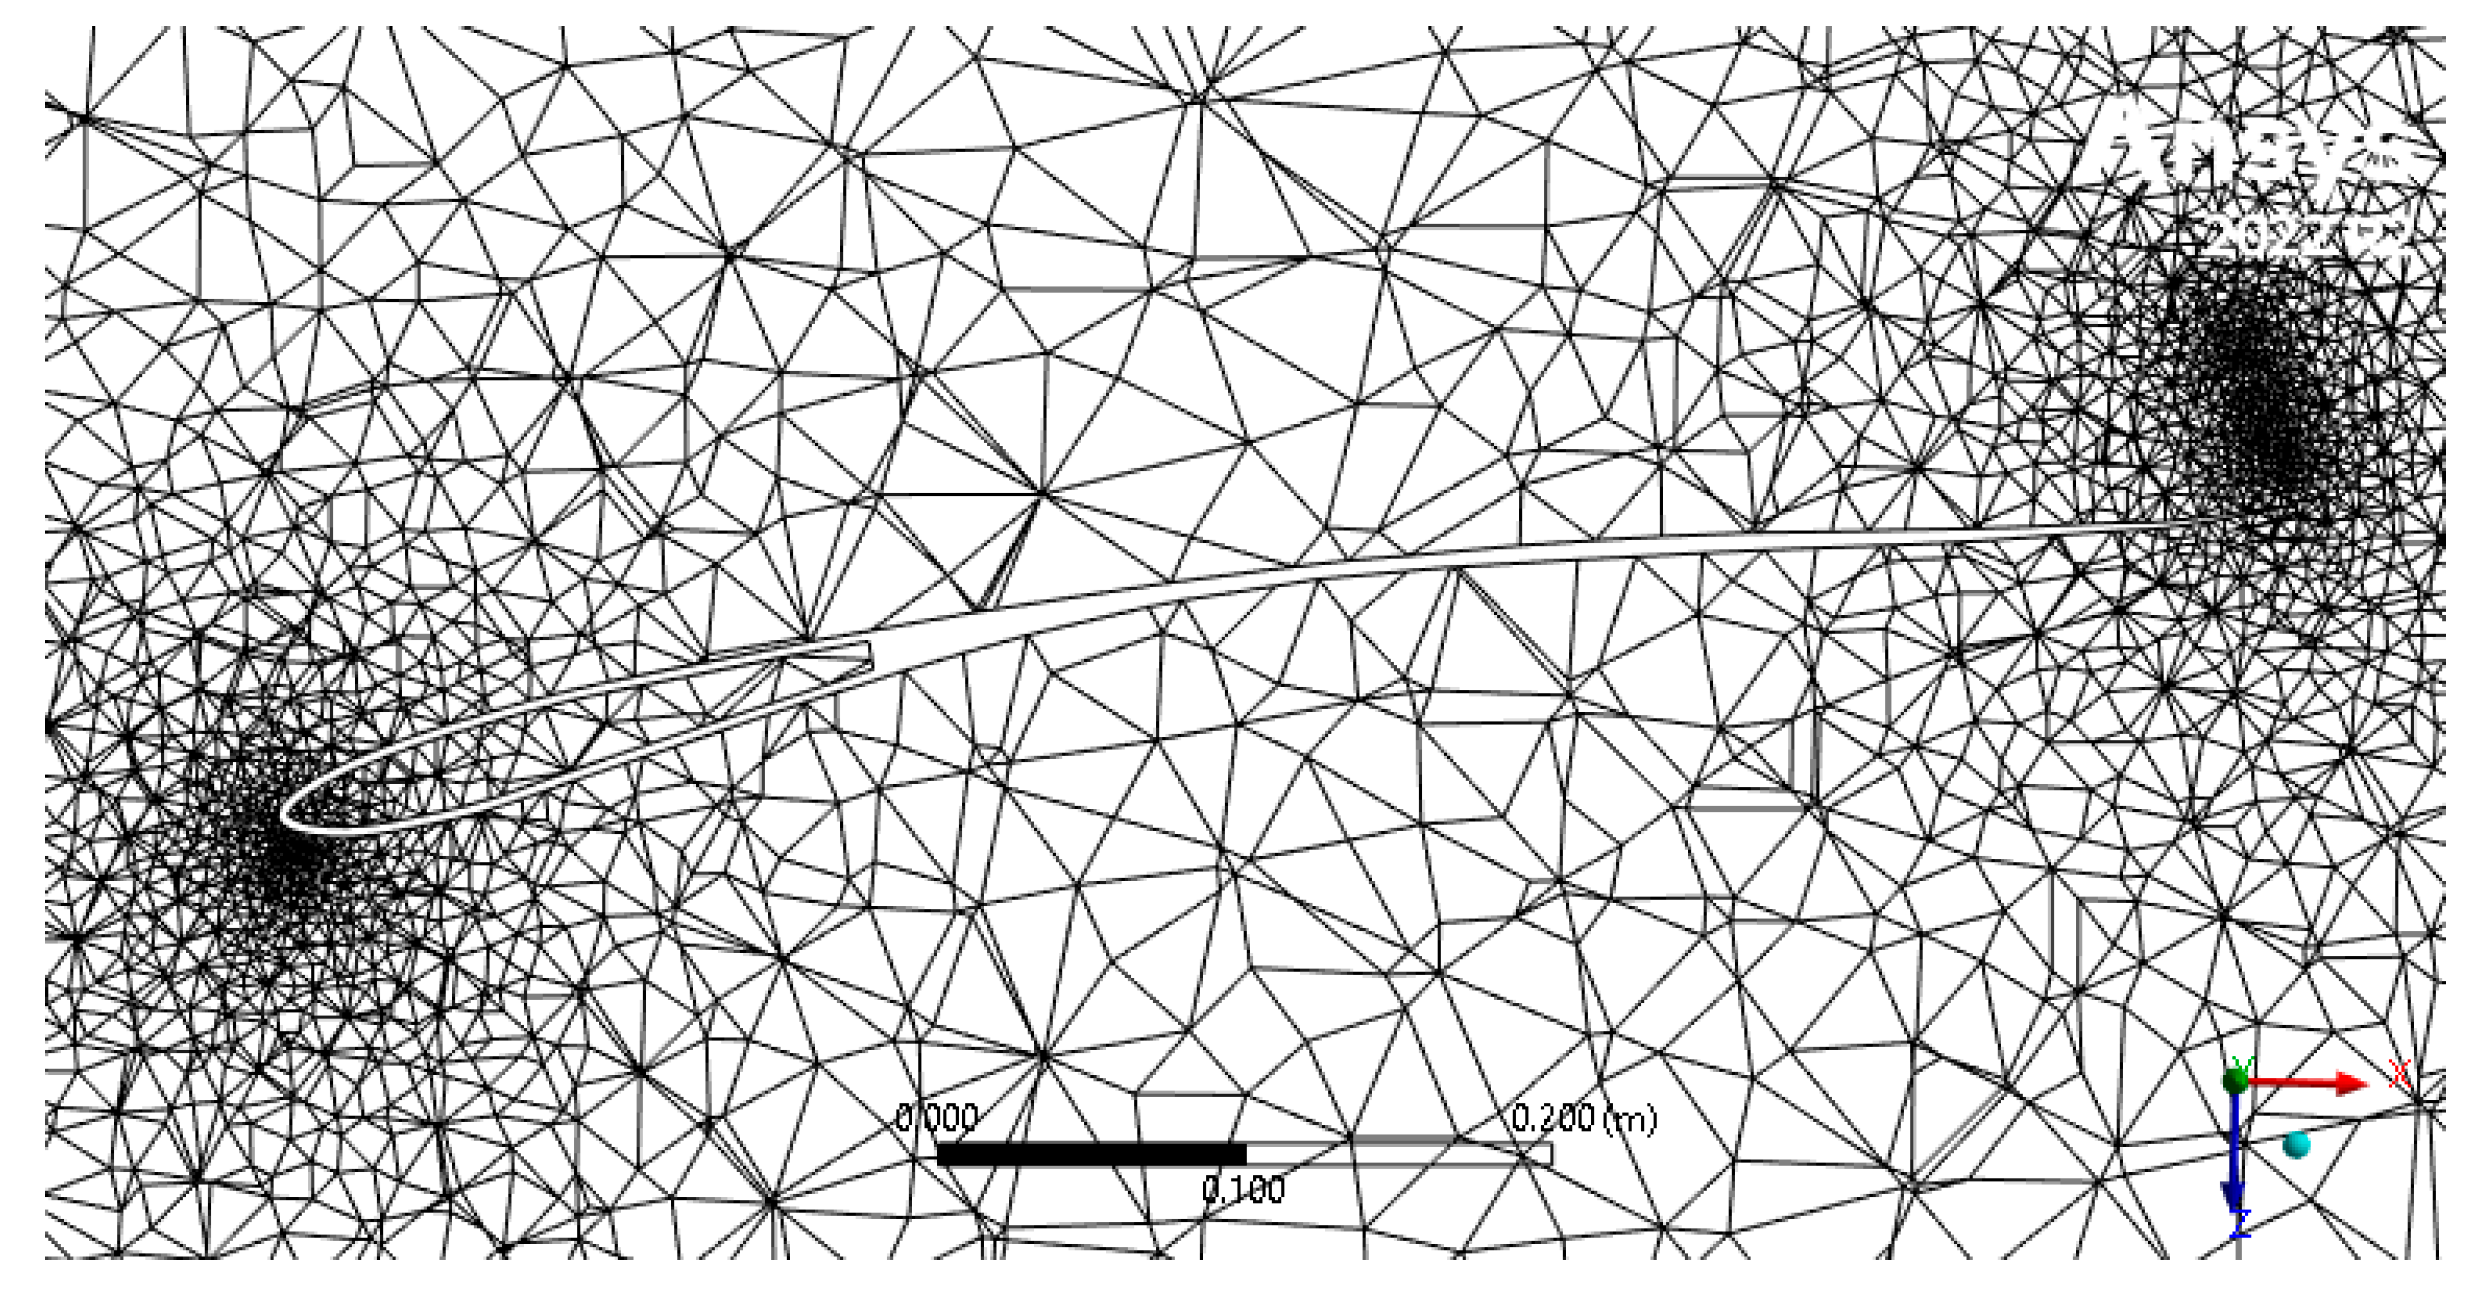
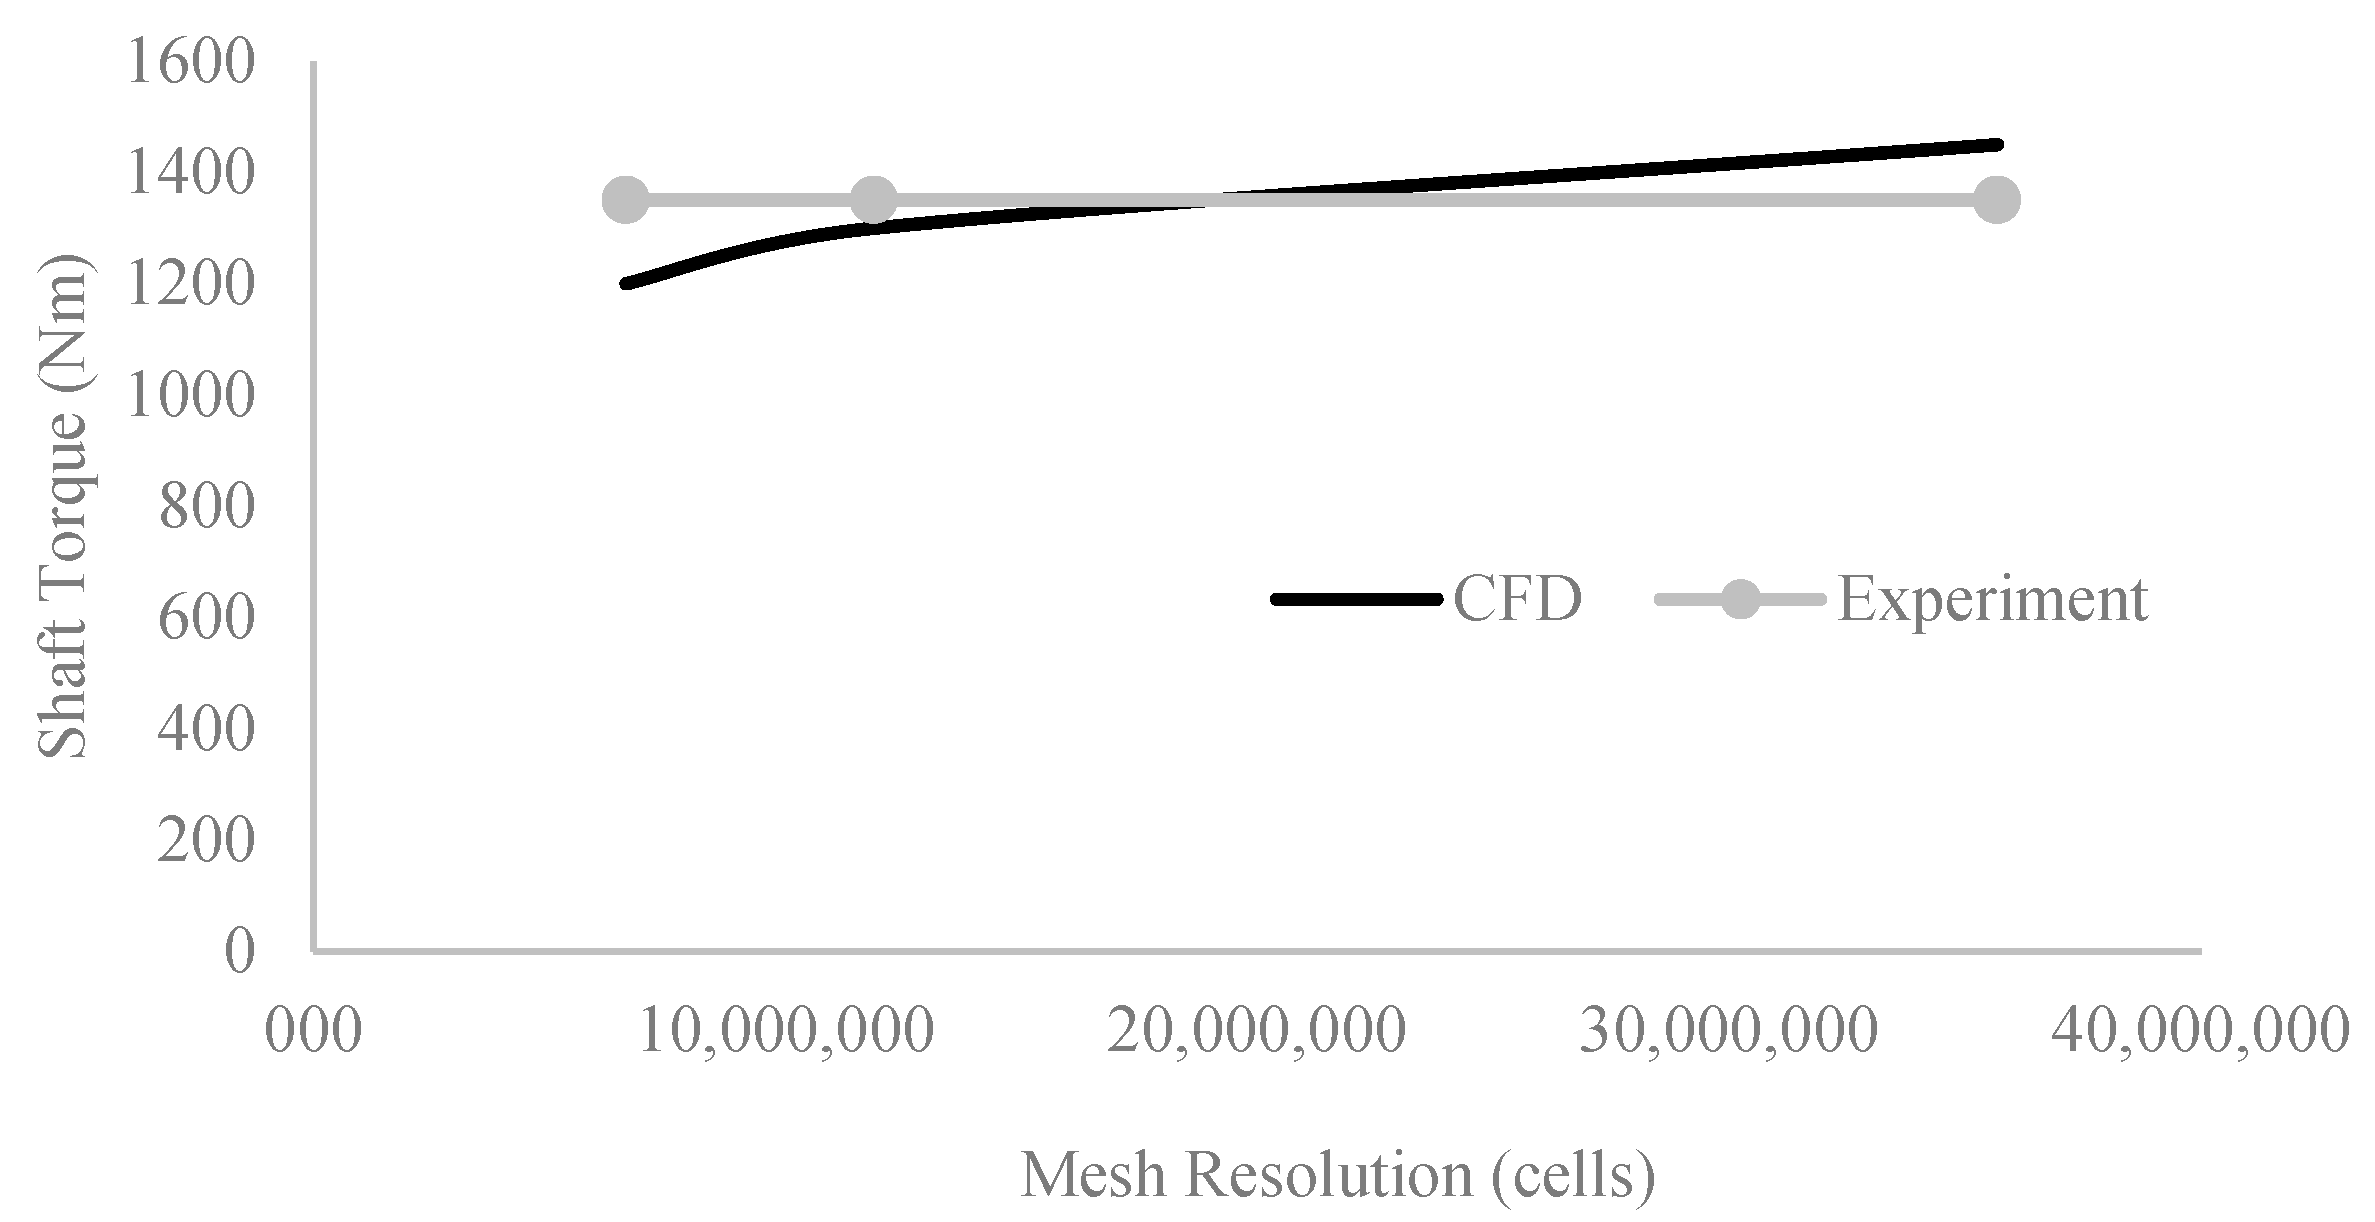
By controlling the curvature min size and the curvature normal angle in Ansys Mechanical, the refinement in regions of interest, such as regions of curvature, is localized, as shown in Figure 4, in the case of the thin airfoil section, thus reducing the mesh resolution and the computational cost. However, the results were found to be very sensitive to the resolution of the mesh, as shown in the mesh refinement study in Figure 5. Here, the curvature min sizes and the curvature normal angles of 3, 2, and 1 mm, and 3, 2, and 1 degrees, respectively, were selected to gradually refine the mesh. The mesh independence was then achieved using the intermediate mesh since a higher resolution did not yield more than 5% improvement in the measured result [22]. The pressure distribution results also confirmed the refinement, as shown in Figure 6. The convergence was achieved at 1462 iterations using the default −1000 minimum residuals convergence criterion in Ansys Fluent.

3. Structural Analysis

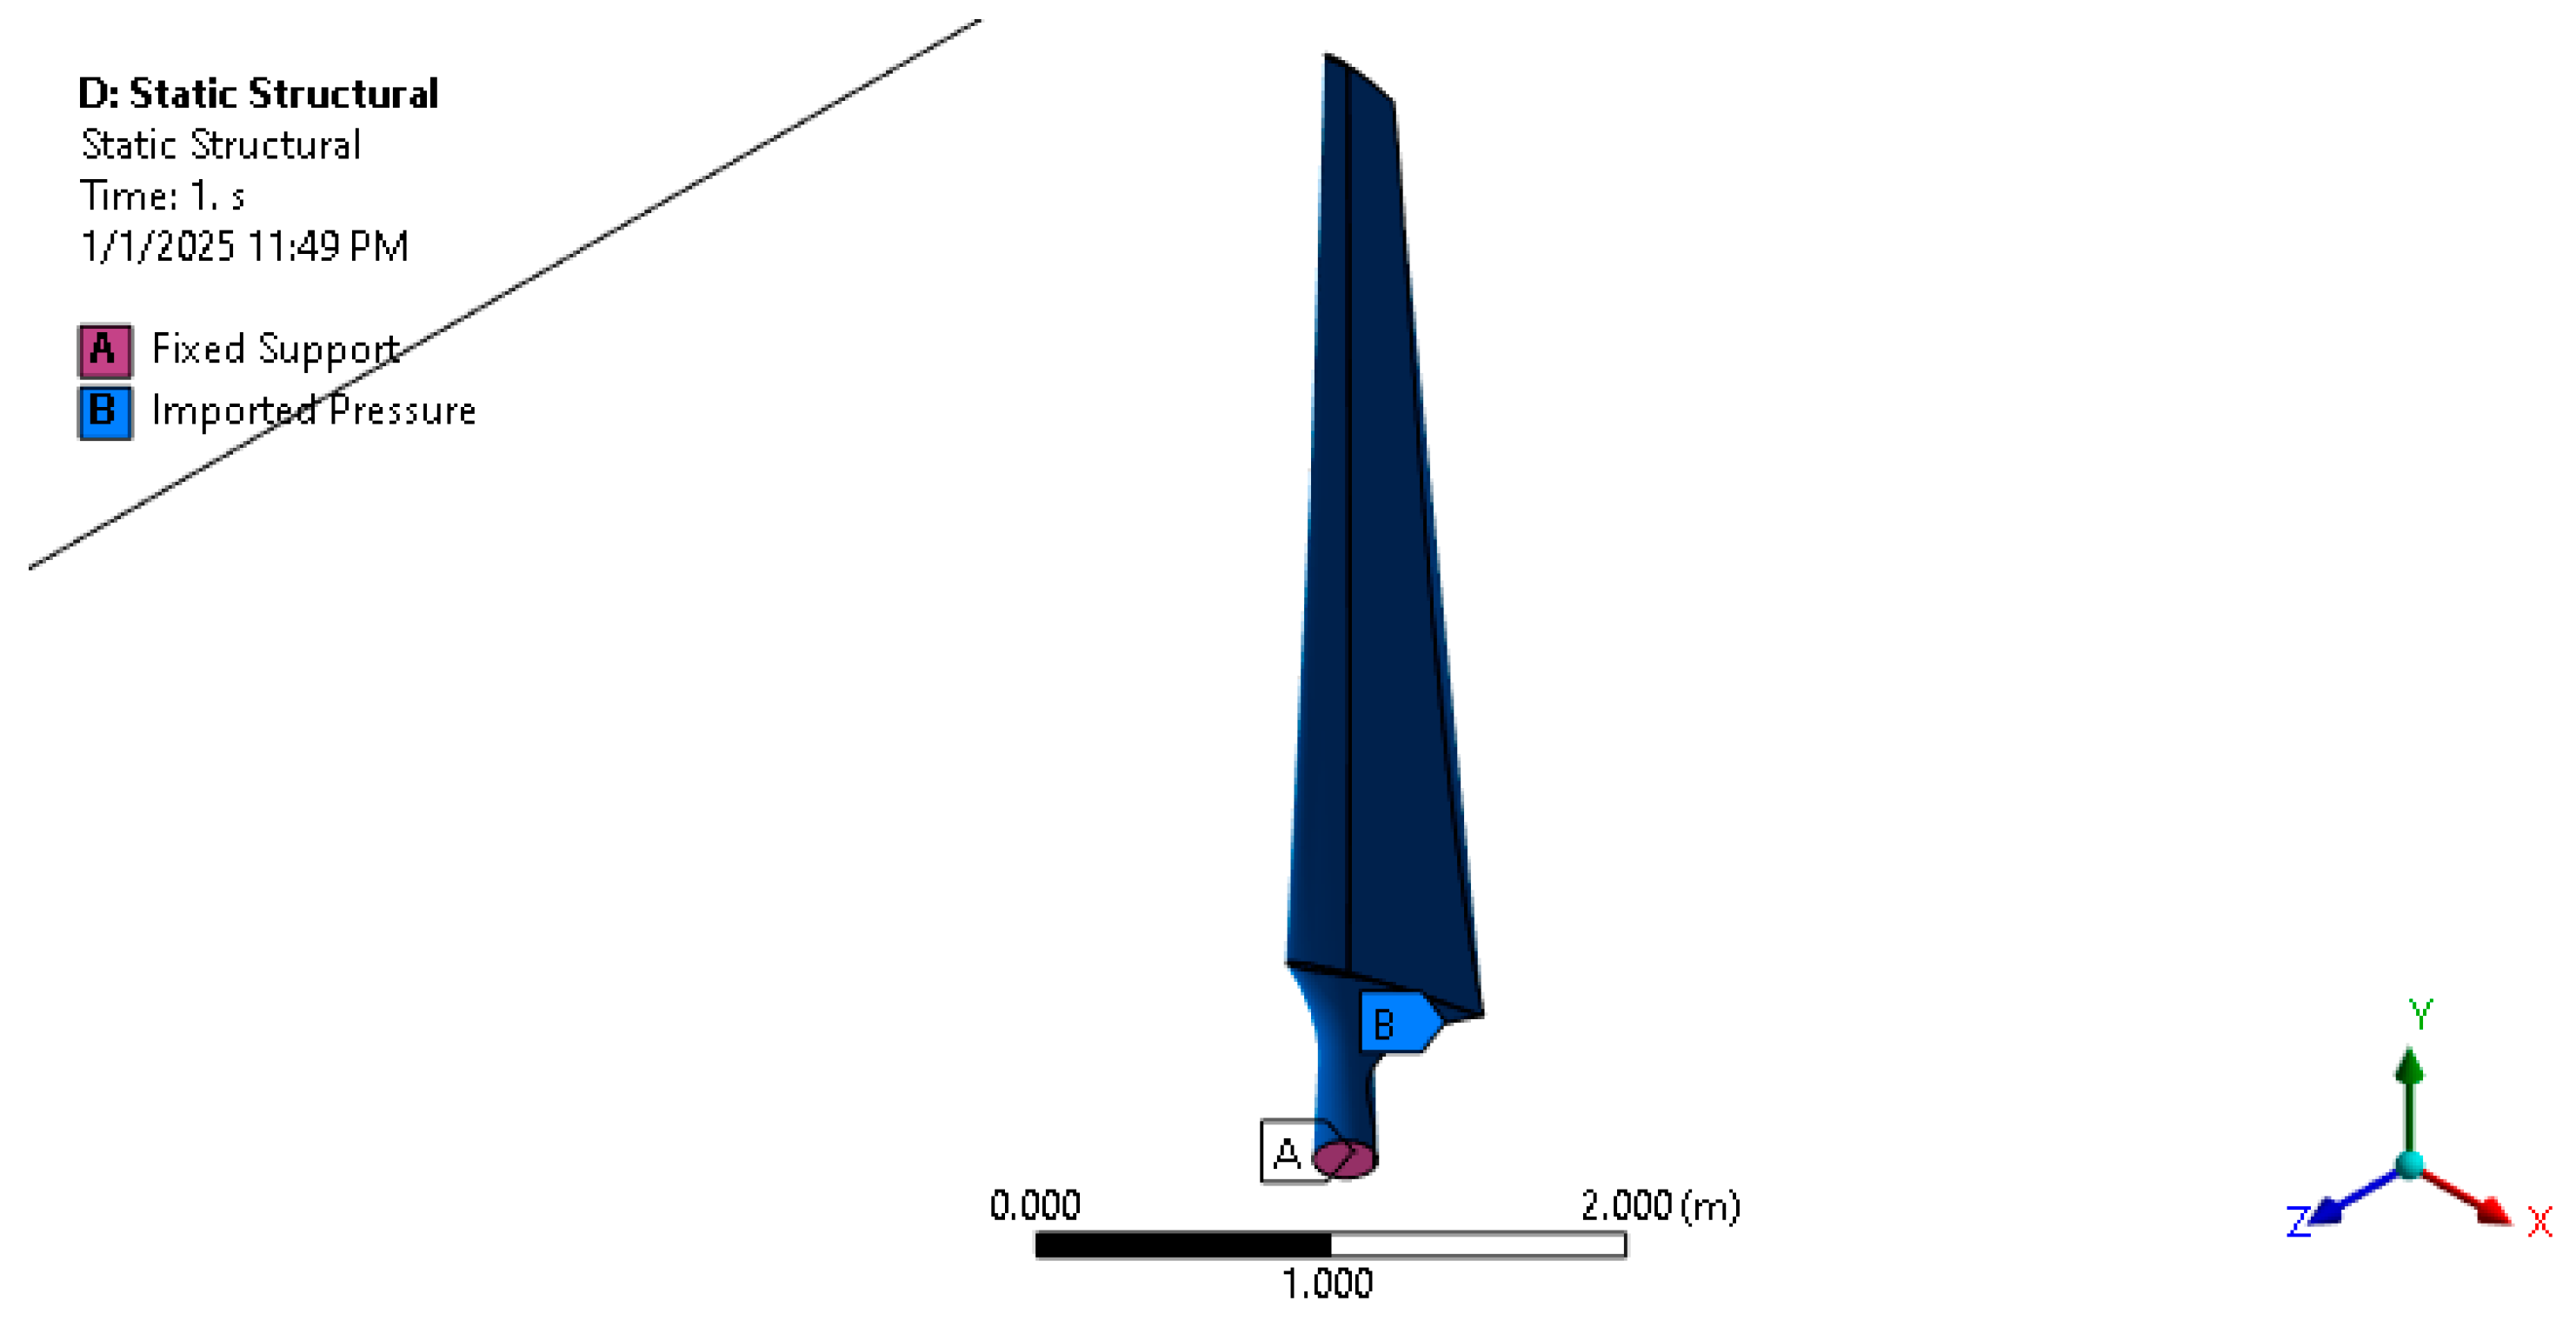
To ensure the feasibility of the solution, the carbon fiber properties listed in Table 2, which are of minimum carbon fiber tensile/compressive stiffness, are applied to the turbine blades in FEM analysis at standard ambient atmospheric conditions. Nevertheless, the carbon fiber material, in general, is very stiff and has high tensile strength for its weight. It is also slow to increase in length as the pressure increases and has good elastic deformation when the load is applied to it either in compression or tension due to its high linearity [32]. Moreover, the rigidity of a structure depends not only on the properties of the material but also the shape of the structure. Therefore, the geometric stiffness due to the high bending stiffness of the D-spar shape is expected to play a major role in supporting the rigidity of the turbine blades. To verify this, the fixed support points were allocated at each blade’s connections to the hub, and the aerodynamic load is applied to the entire surfaces of the blades.
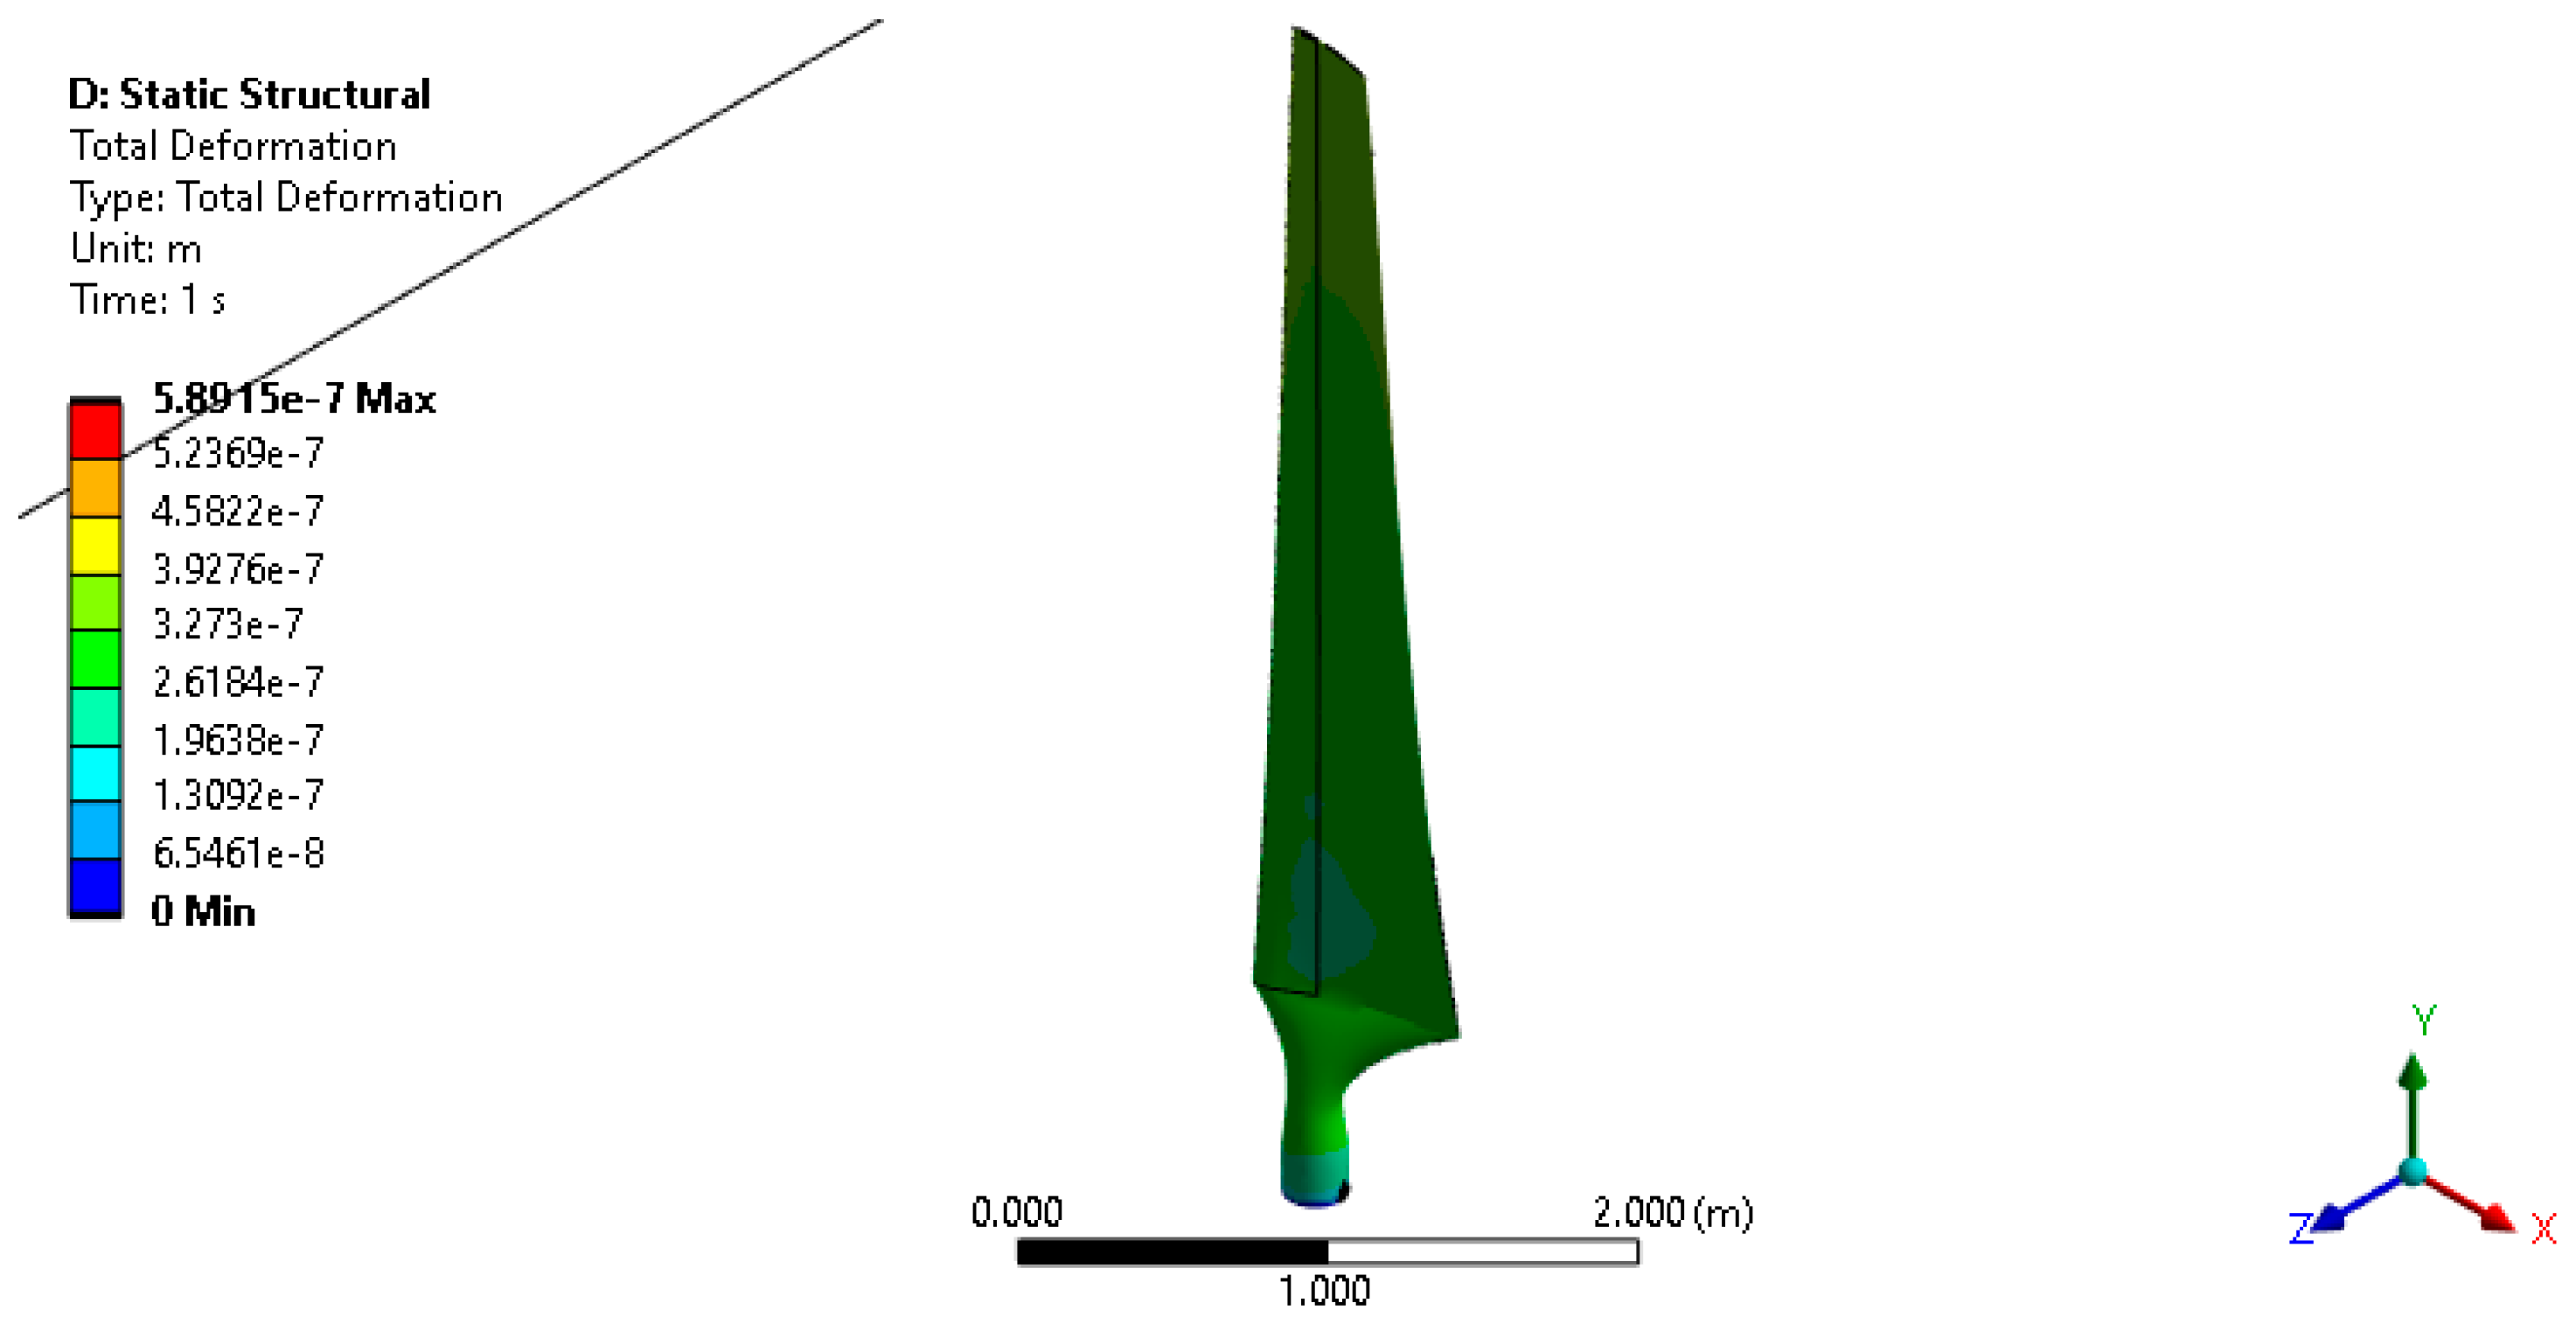
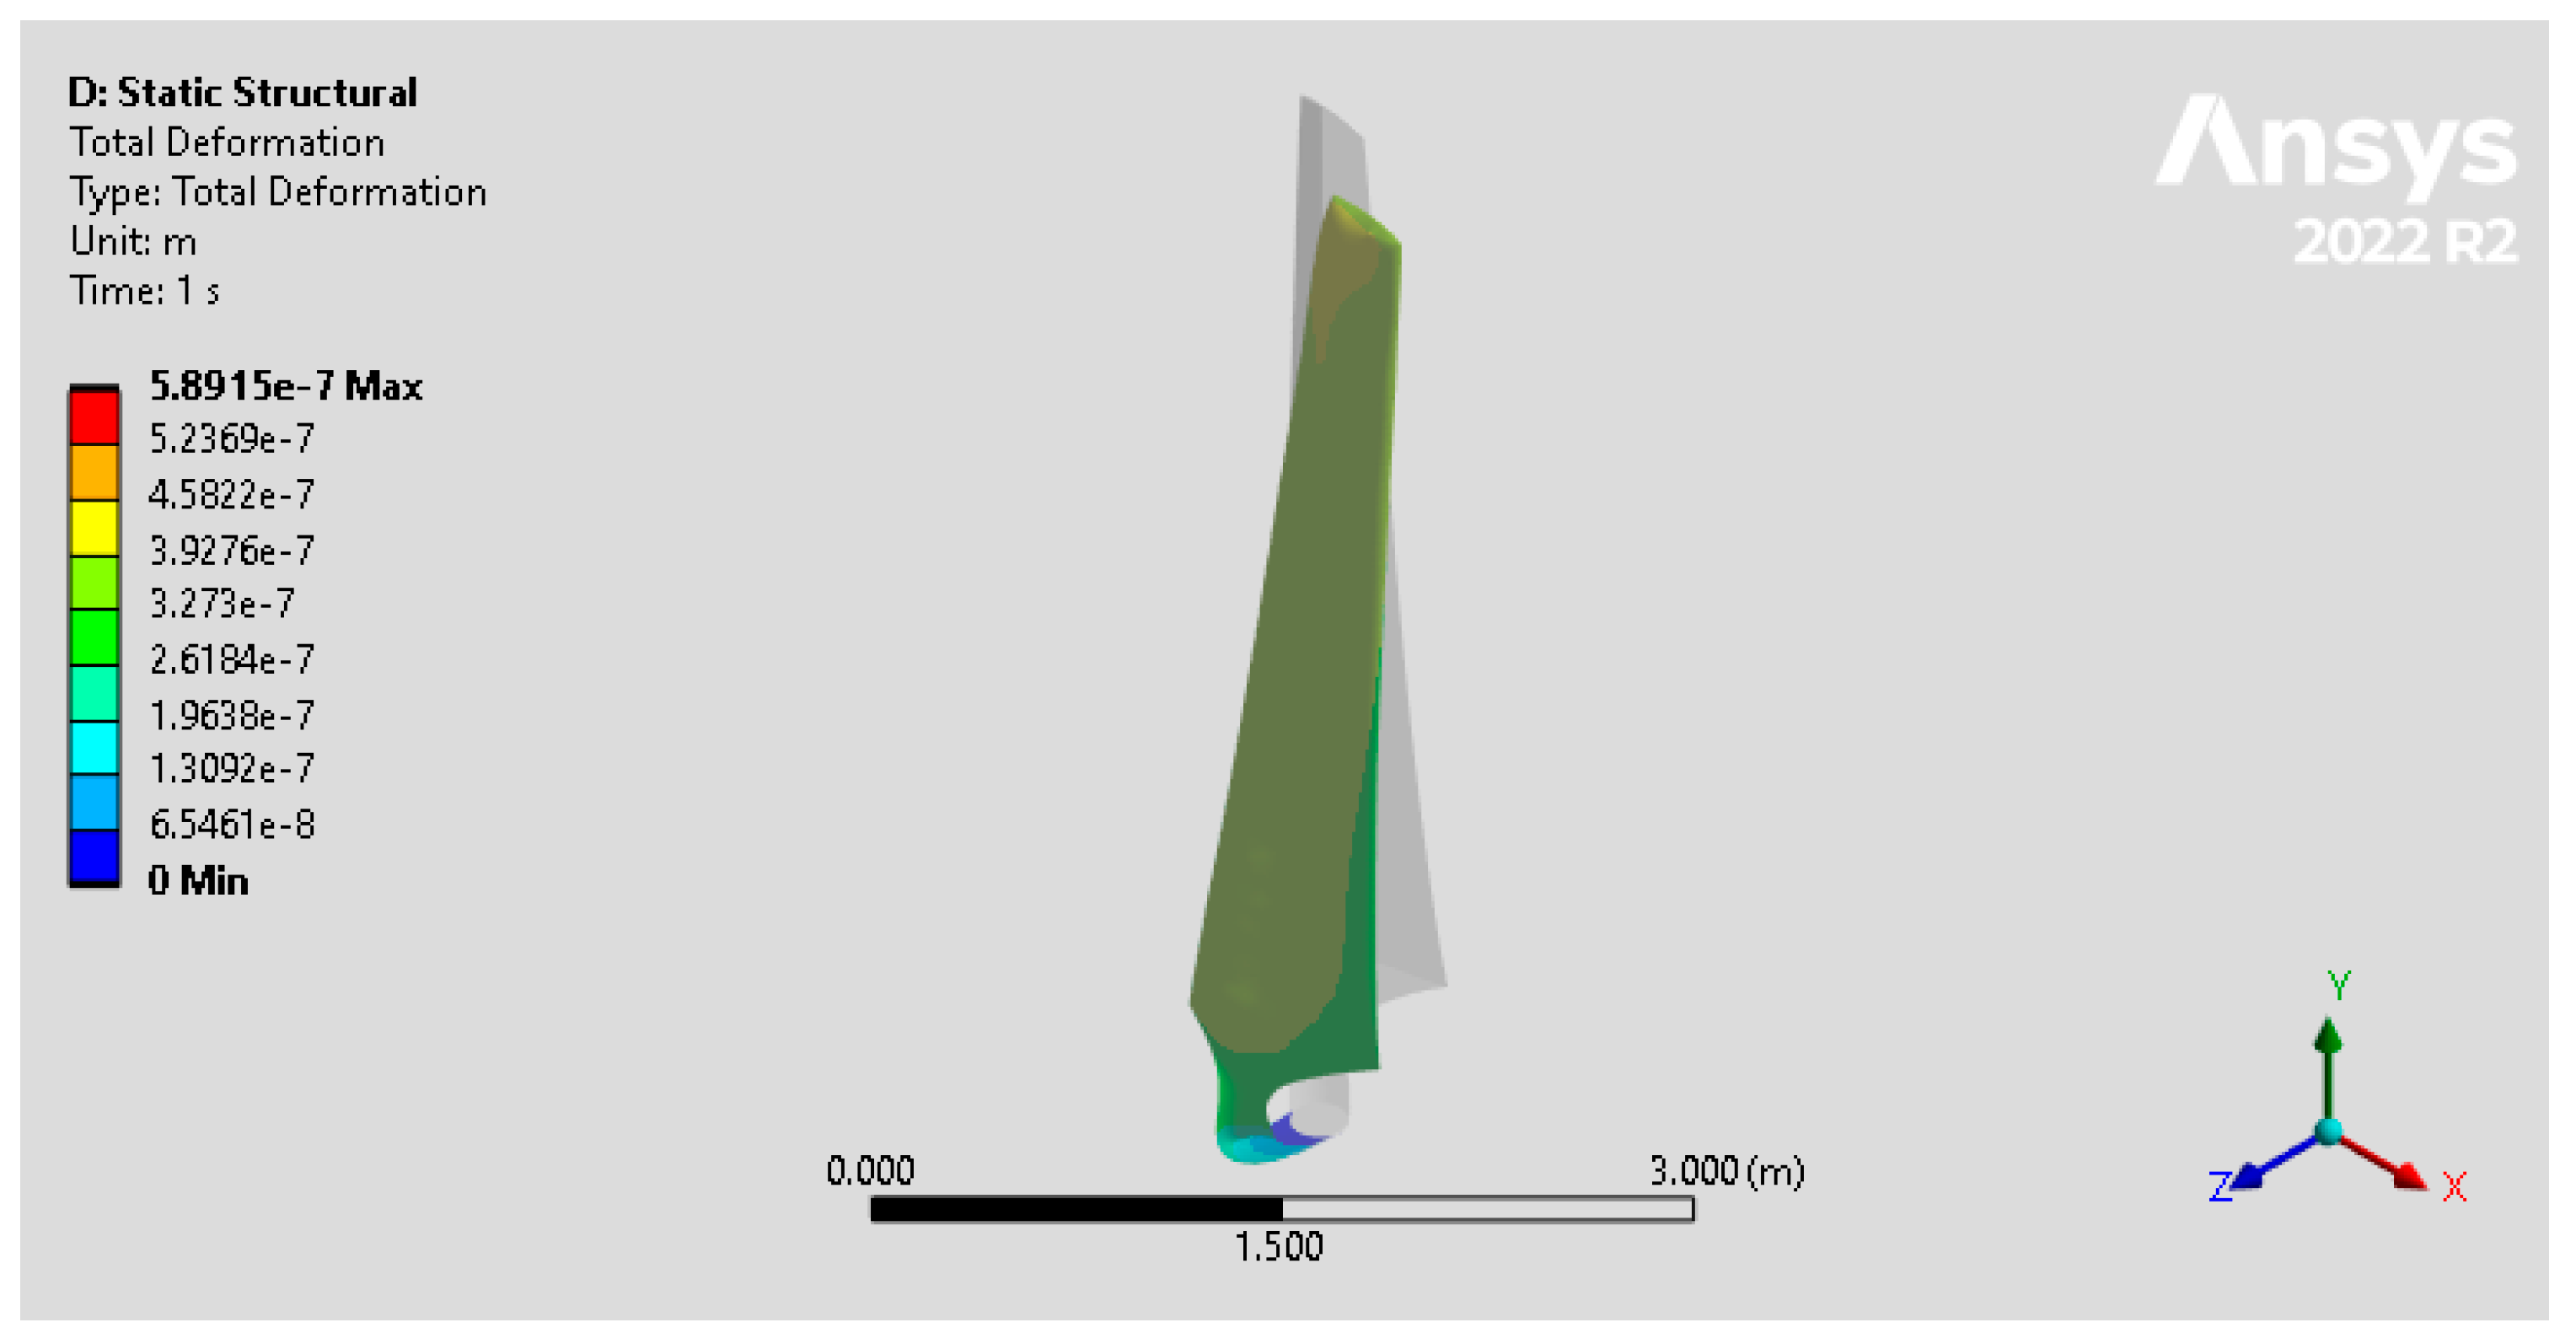
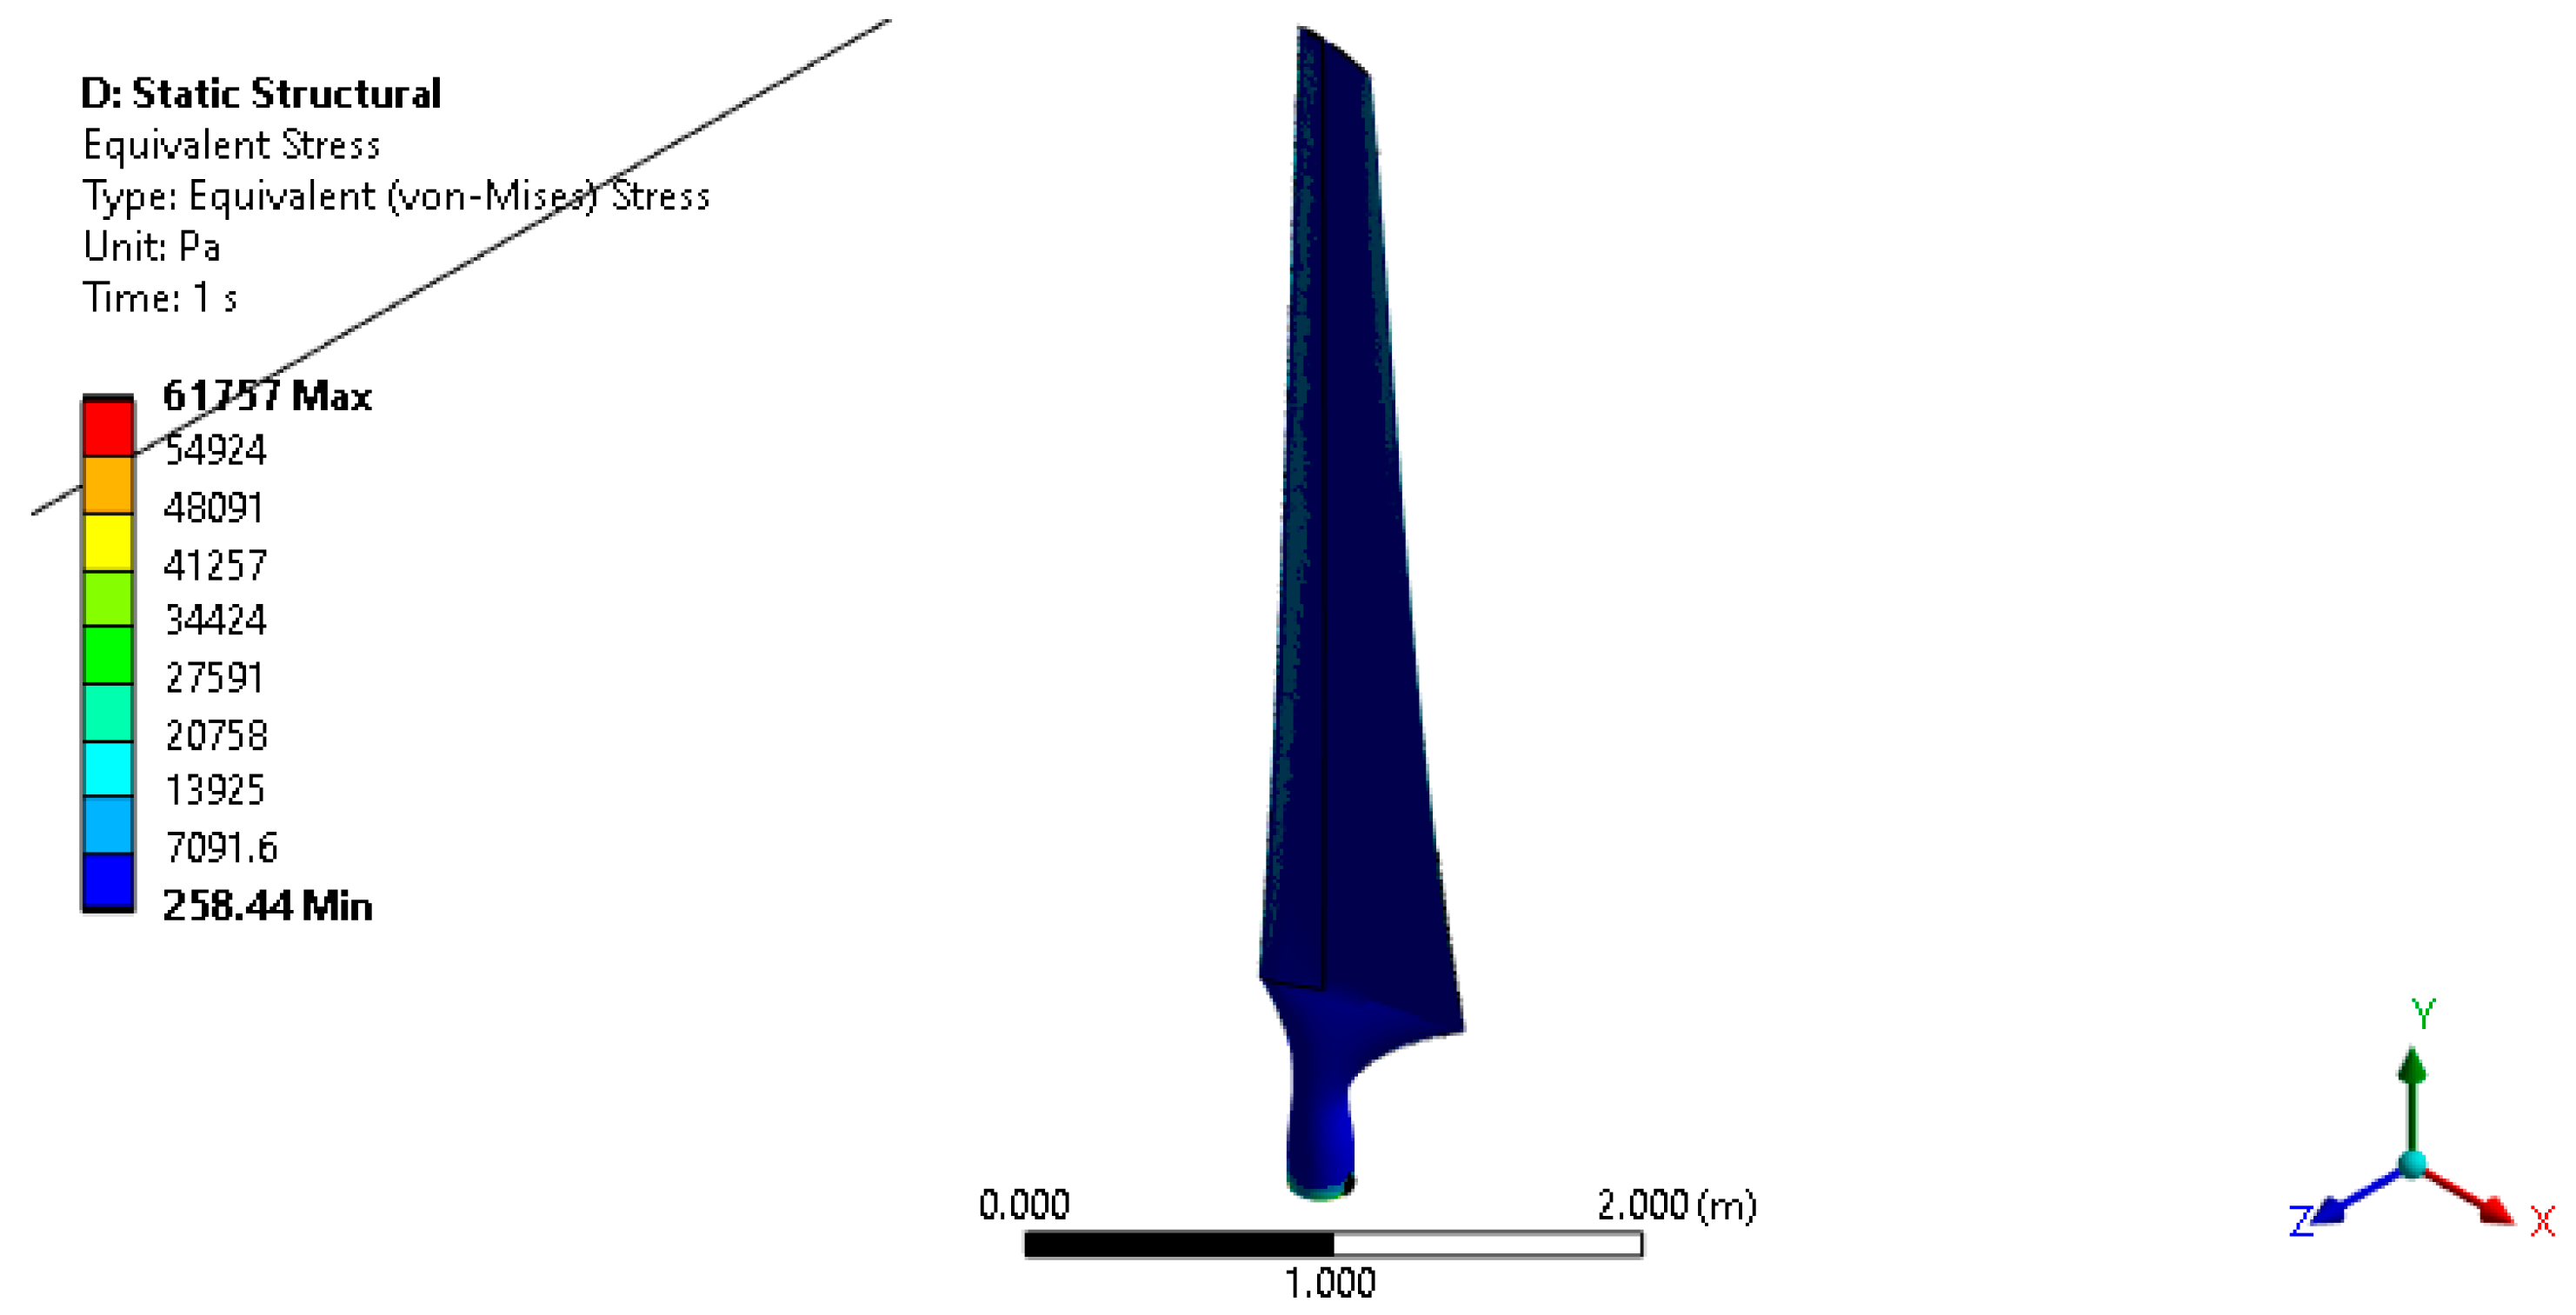
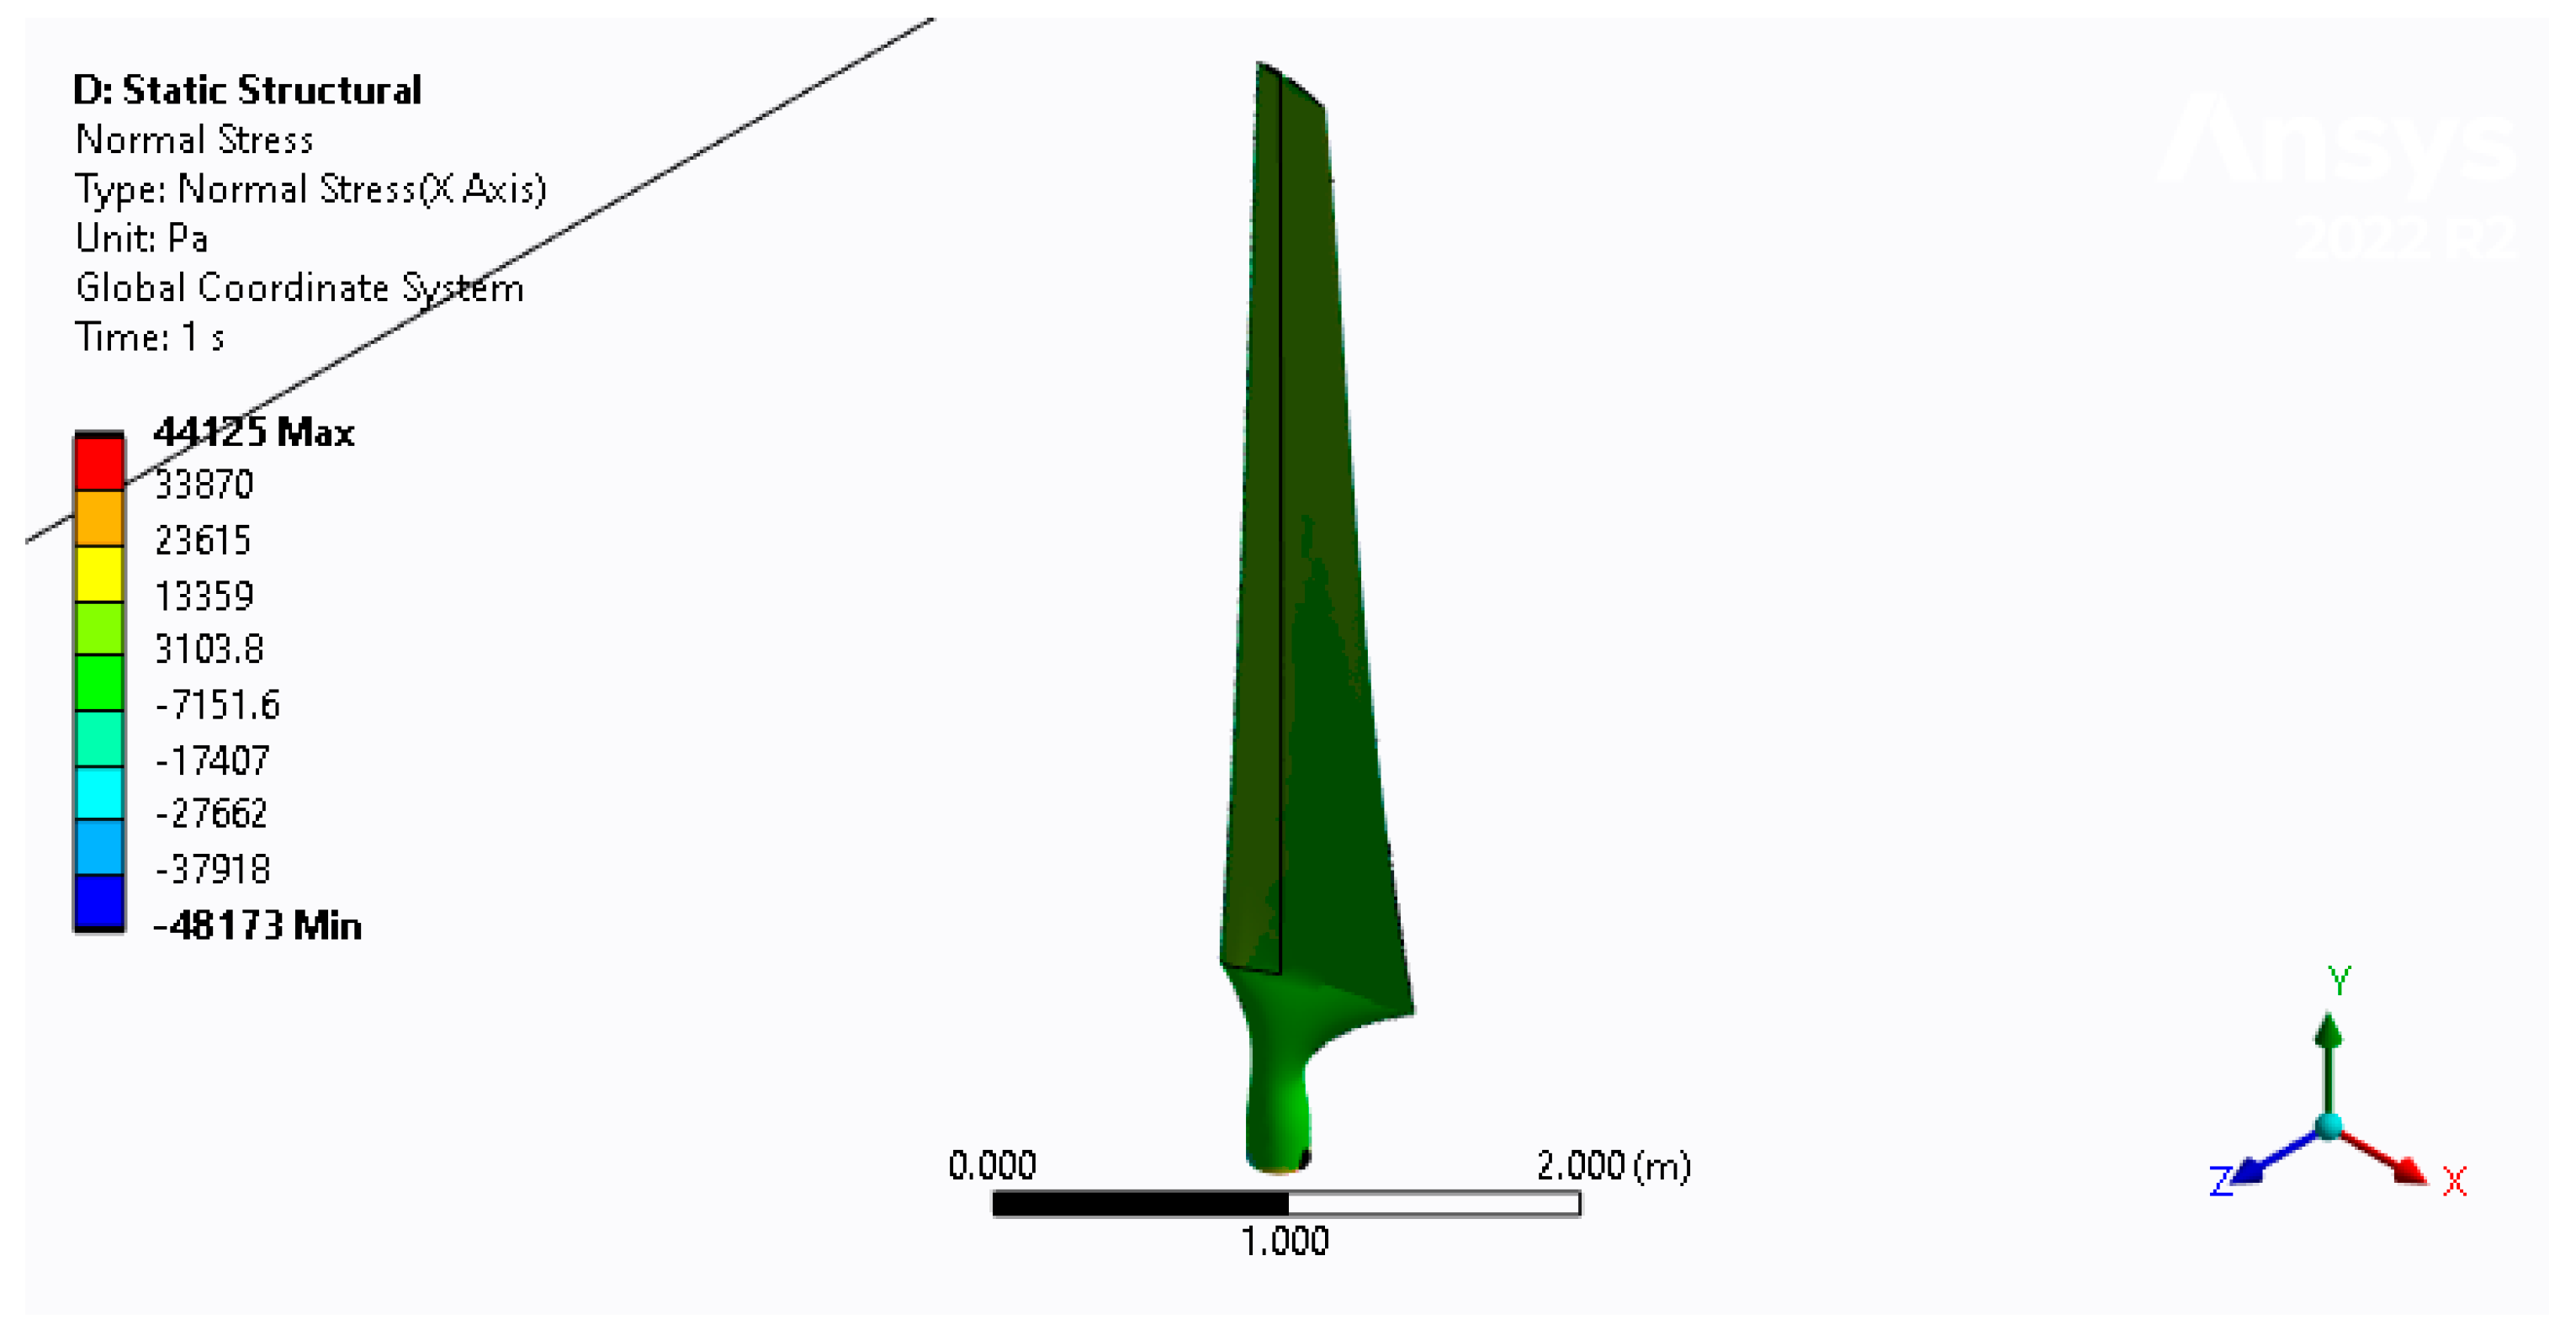
Meanwhile, the maximum load case resulting from the 25 m/s inlet speed is implemented to ensure a conclusion that applies to all the operating conditions. And since the aim of this analysis is limited to clarifying the rigidity of the turbine blades under the resulting aerodynamic load, one-way coupling is considered at this stage in order to determine whether the assumption of rigidity is a valid assumption. Here, the total deformation, the equivalent stress, the shear stress, and the strain are typically evaluated using the Ansys Static Structural FEA module by means of a quantitative evaluation of color shading, as shown in Figure 7, Figure 8, Figure 9, Figure 10, Figure 11, Figure 12, Figure 13, Figure 14 and Figure 15.

3.1. Deformation

The calculation of the blade’s deformation is enabled directly by Young’s modulus in the linear elastic region of the carbon fiber material under compressive and tensile loads to predict the extension and the compression of the material, including at points where the fixed supports are allocated. The resulting deformation is completely reversable, and no displacement is suspected, given the insignificant value of 5.8915 × 10 7 m of the maximum deformation shown in Figure 8. Therefore, the blade returns to its original shape as the applied load is decreased. Furthermore, almost all surfaces of the turbine blade are shaded with a green color, representing a deformation value of approximately 2.600 × 10 7 m. The deformation shown in Figure 9 is obviously exaggerated, but it helps view the location and direction of the maximum deformation. Here, the maximum deformation is concentrated near the tip of the blade, as shown with the orange shading, and is directed partly towards the direction of the inlet velocity and to the X-axis countering the direction of rotation. The resulting location and direction of deformation verifies the correctness of the simulation since the deformation was expected to increase along the span and towards the tip of the blade and directed by the maximum applied load at the lifting surfaces and by the drag of the leading-edge stagnation points.
However, the shape of the structure may have played the most important part in minimizing the deformation in this case and achieving near rigidity. This is because the value of Young’s modulus of this carbon fiber is high in all of the X, Y, and Z directions, as listed in Table 2. Despite this, the resulting deformation is mostly in the X direction. Typically, Young’s modulus is defined as follows:
E = σ ε
where σ is the stress defined as the ratio of the applied load to the cross-sectional area of the blade surfaces, and ε is the resulting axial strain or the deformation proportional to the stress. The change in shape or in the relative position of any point in the blade, including a whole translation or rotation of the blade. Therefore, the development of elastic deformation, or even plastic deformation, is dependent on the strain applied to the material, especially when the deformation is very small.

3.2. Sresses

The von Mises stress or comparable tensile stress is another way of formulating the von Mises yield criterion. In general, the elasticity of a material is maintained as long as its molecular bonds are not broken by the applied stress, which includes the linear and reversible relationship between the stress and the strain in the elastic deformation cases of this study. Hence, the maximum stress in the blades is subjected to the elastic region of the material, and this stress is insufficient in creating a noticeable amount of deformation due to the strength of the carbon fiber in use. The compressive and tensile stresses corresponding to the total deformation are multiaxial since the load is applied to the entire surface of the blade. It can be seen from the blue color shading in Figure 6 that the equivalent stress is acting almost uniformly over all surfaces of the blade. This is the minimum stress with a value of 258.44 Pa, which is much below the toughness of the carbon fiber in use. Hence, no degree of plastic deformation can be expected in this case.
However, true stress accounts for the shrinking of the area it is applied to, combining the development of the extension, in order to determine the true strain and, hence, the true deformation of the structure. It can be seen from the deformation in the reduced view, at the right side of Figure 10 with the applied stress, that bending loading has caused deformation mainly at the root of the blade where the total torque generated by the blade is acting, and the structural shape of the blade transforms from the D-spar shape to a cylindrical shape. Nevertheless, the deformation view is amplified, and the stress at the root of the blade is near minimum. Thus, the internal forces due to the applied load are much below the compressive and tensile strengths of the material, and the investigation of the failure mode is not considered. After all, internal stress and strain are generally approximated from the external forces and deformation of the structure and are disregarded in cases of no significant deformation. In this case, the true stress and the true strain can be derived from the deformation of the blade.
Generally, the true stress that the material is experiencing here should be larger than the equivalent stress since the blade is subjected to unequal opposite forces. But the difference between the true stress and the equivalent stress utilized to forecast material yields under complicated loading decreases with the increase in the elasticity of the deformation. If the possibility of unknown yield strength is added due to the effects of the structural characteristics, the material will not start deforming when the equivalent stress reaches the known value of the material’s yield strength. Therefore, it is crucial to use engineering reasoning when making the decision on the failure of a given structure with a given material property. Such a decision can be aided by further analysis of the stress and its components.
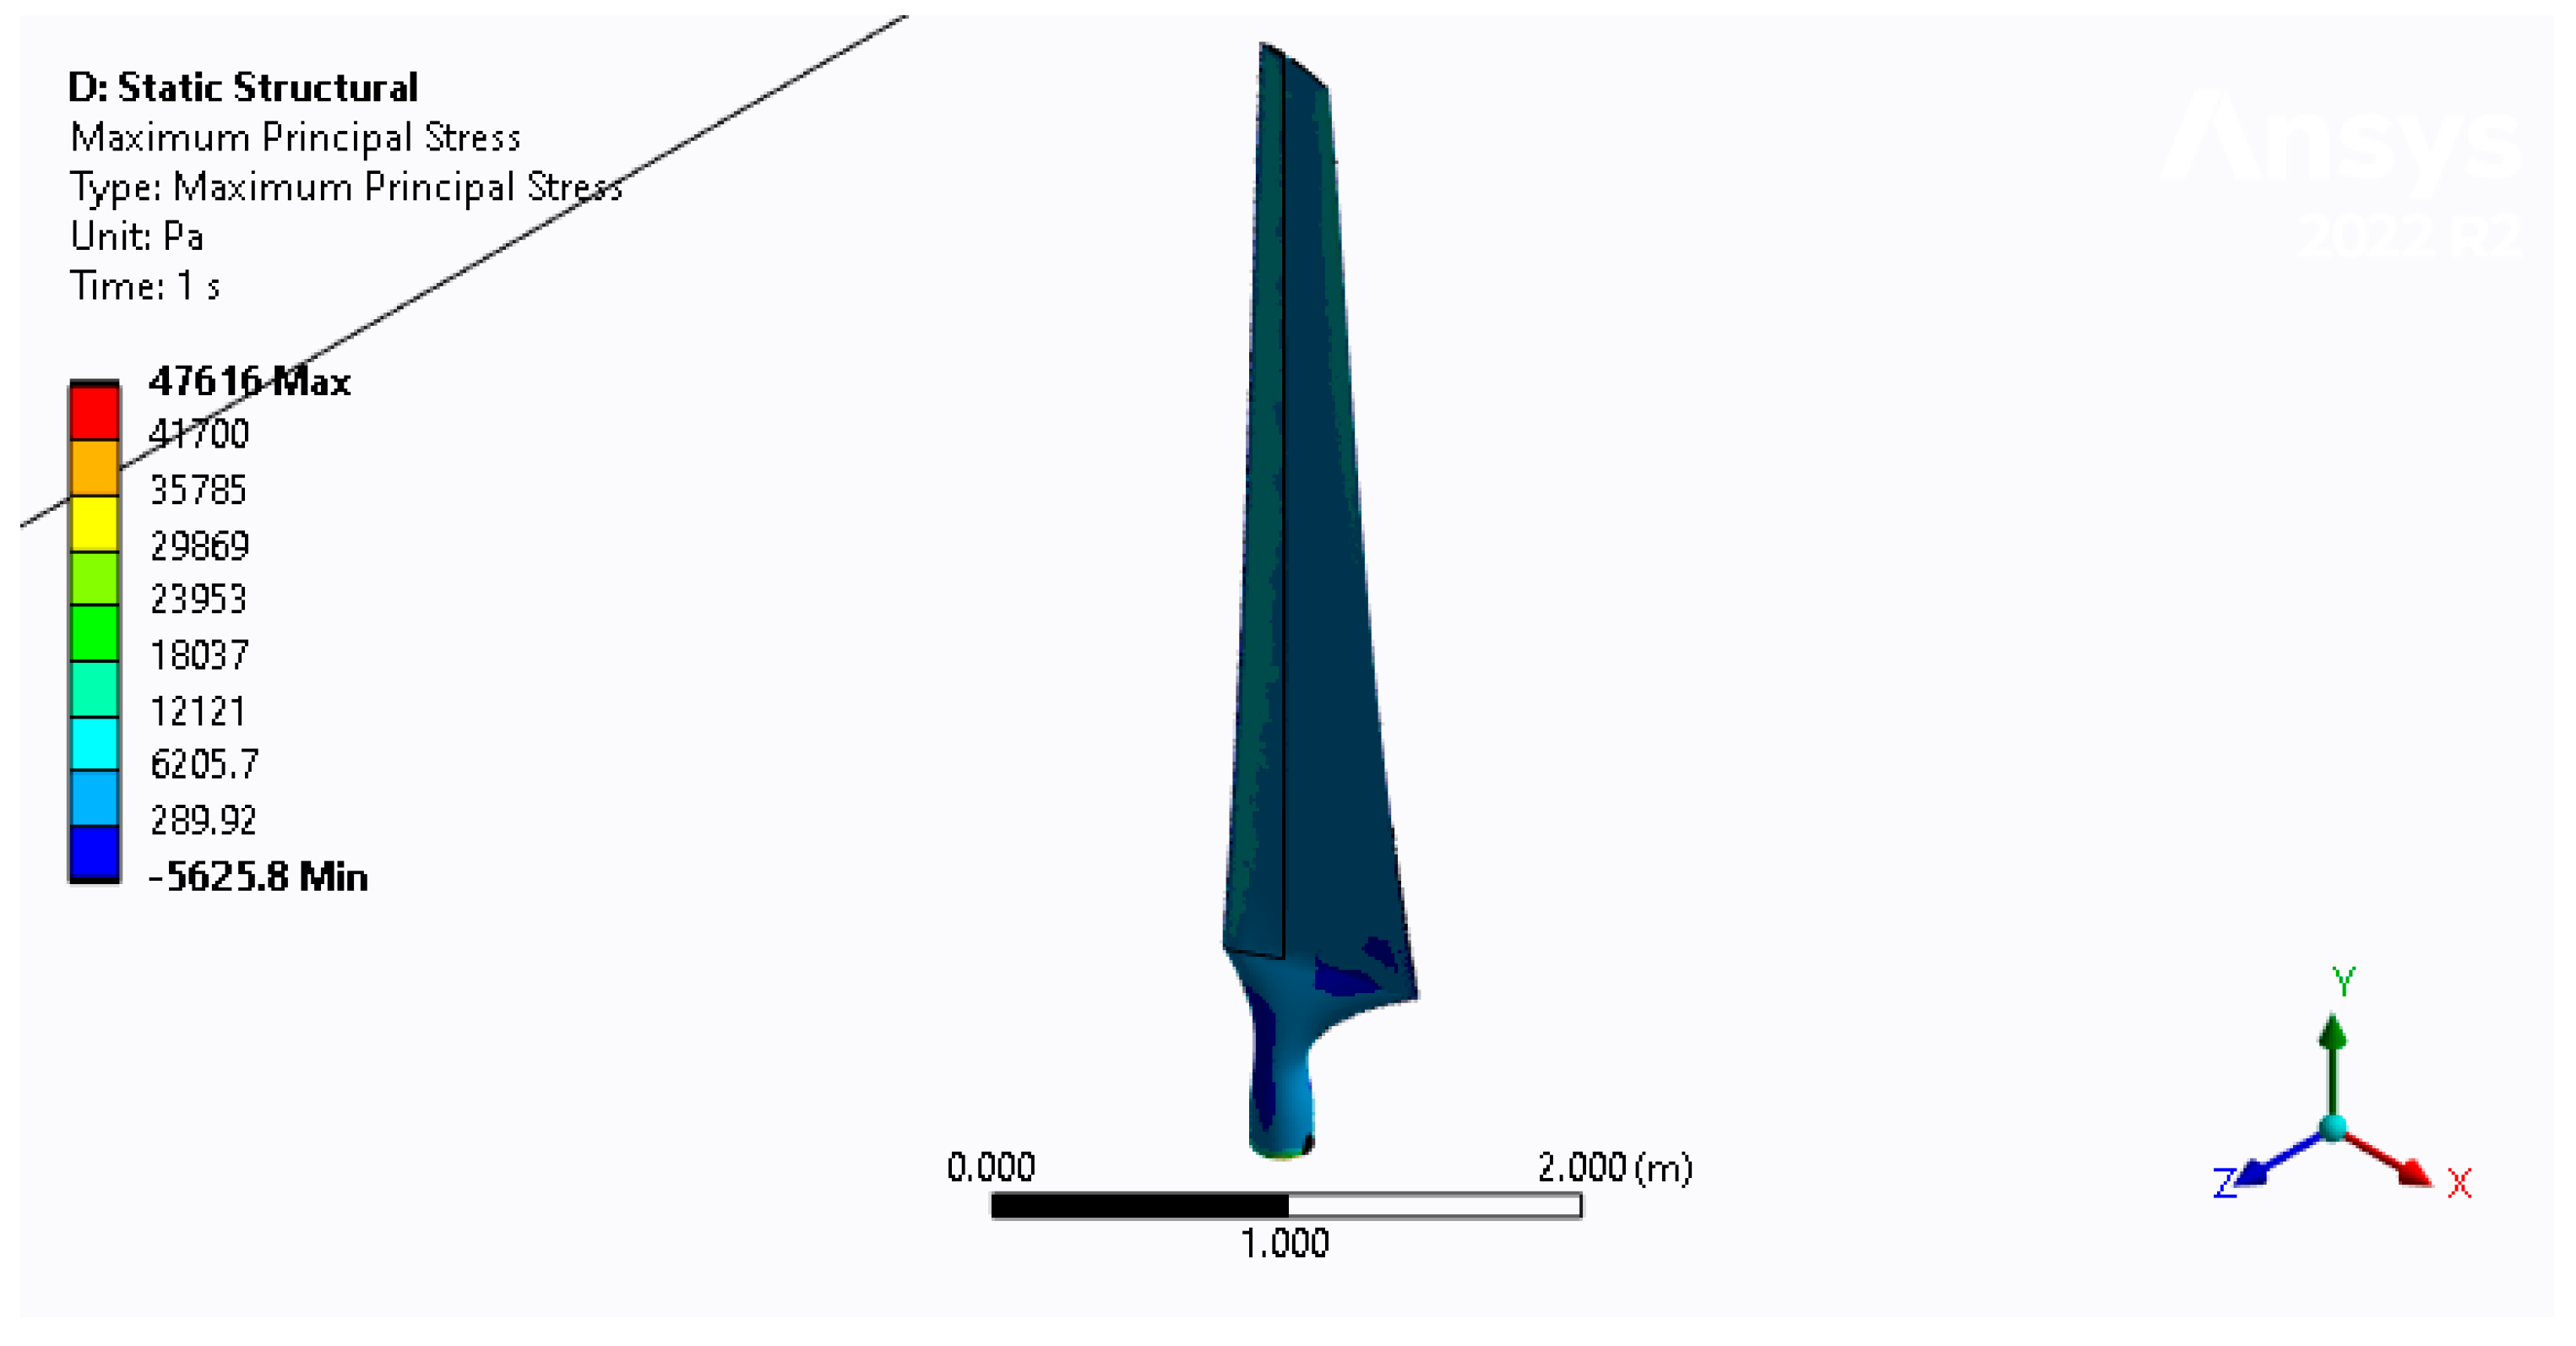
The normal stress resulting from the load acting perpendicular to each of the blade surface cross-sections can produce either compression or tension in the material, depending on the orientation of the surfaces. In our case, normal stress accounts for approximately 72% of the equivalent stress in the direction of the X-axis, given the maximum normal stress results in Figure 11. This indicates and explains the direction of the maximum deflection of the blade, as viewed in Figure 8 and Figure 9. However, true normal stress acts in principal perpendicular to the three planes at any point on the surface, in the direction of the normal vector, and in the upsent of shear stresses normal to the principal plane. Therefore, the principal stress shown in Figure 12 corresponds to the true normal stresses taking place within the material due to the complex load acting on the principal planes that are those stresses which are acting on the principal planes.
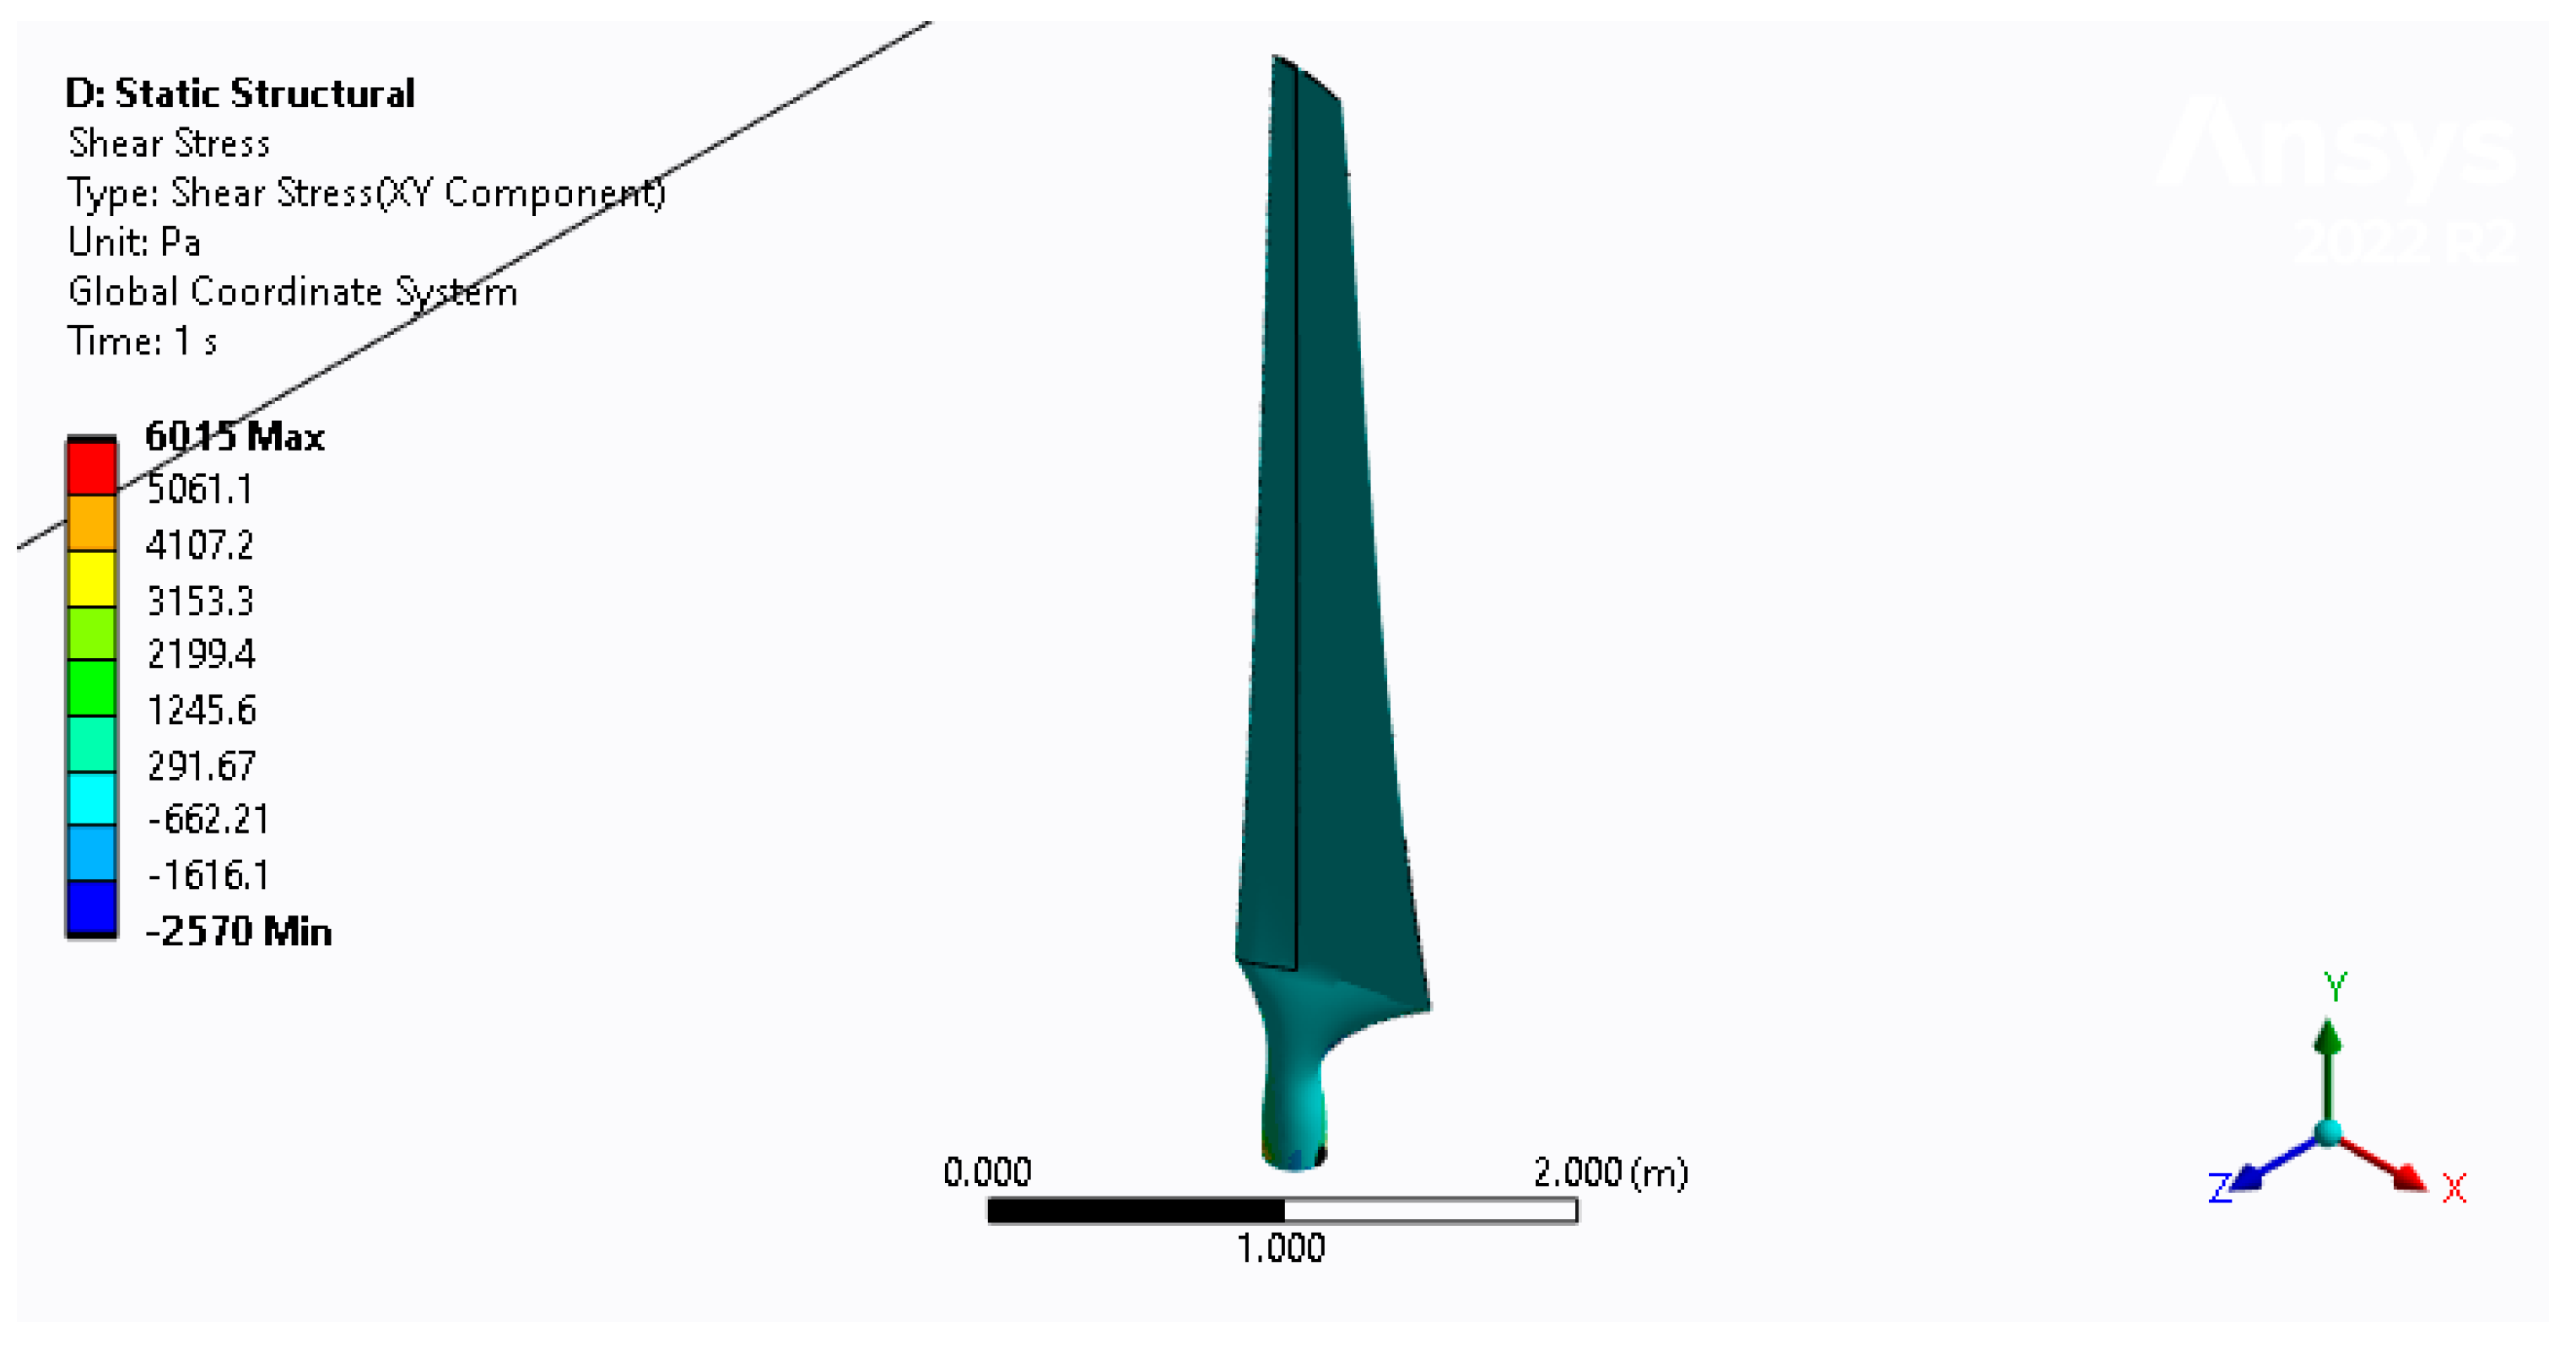
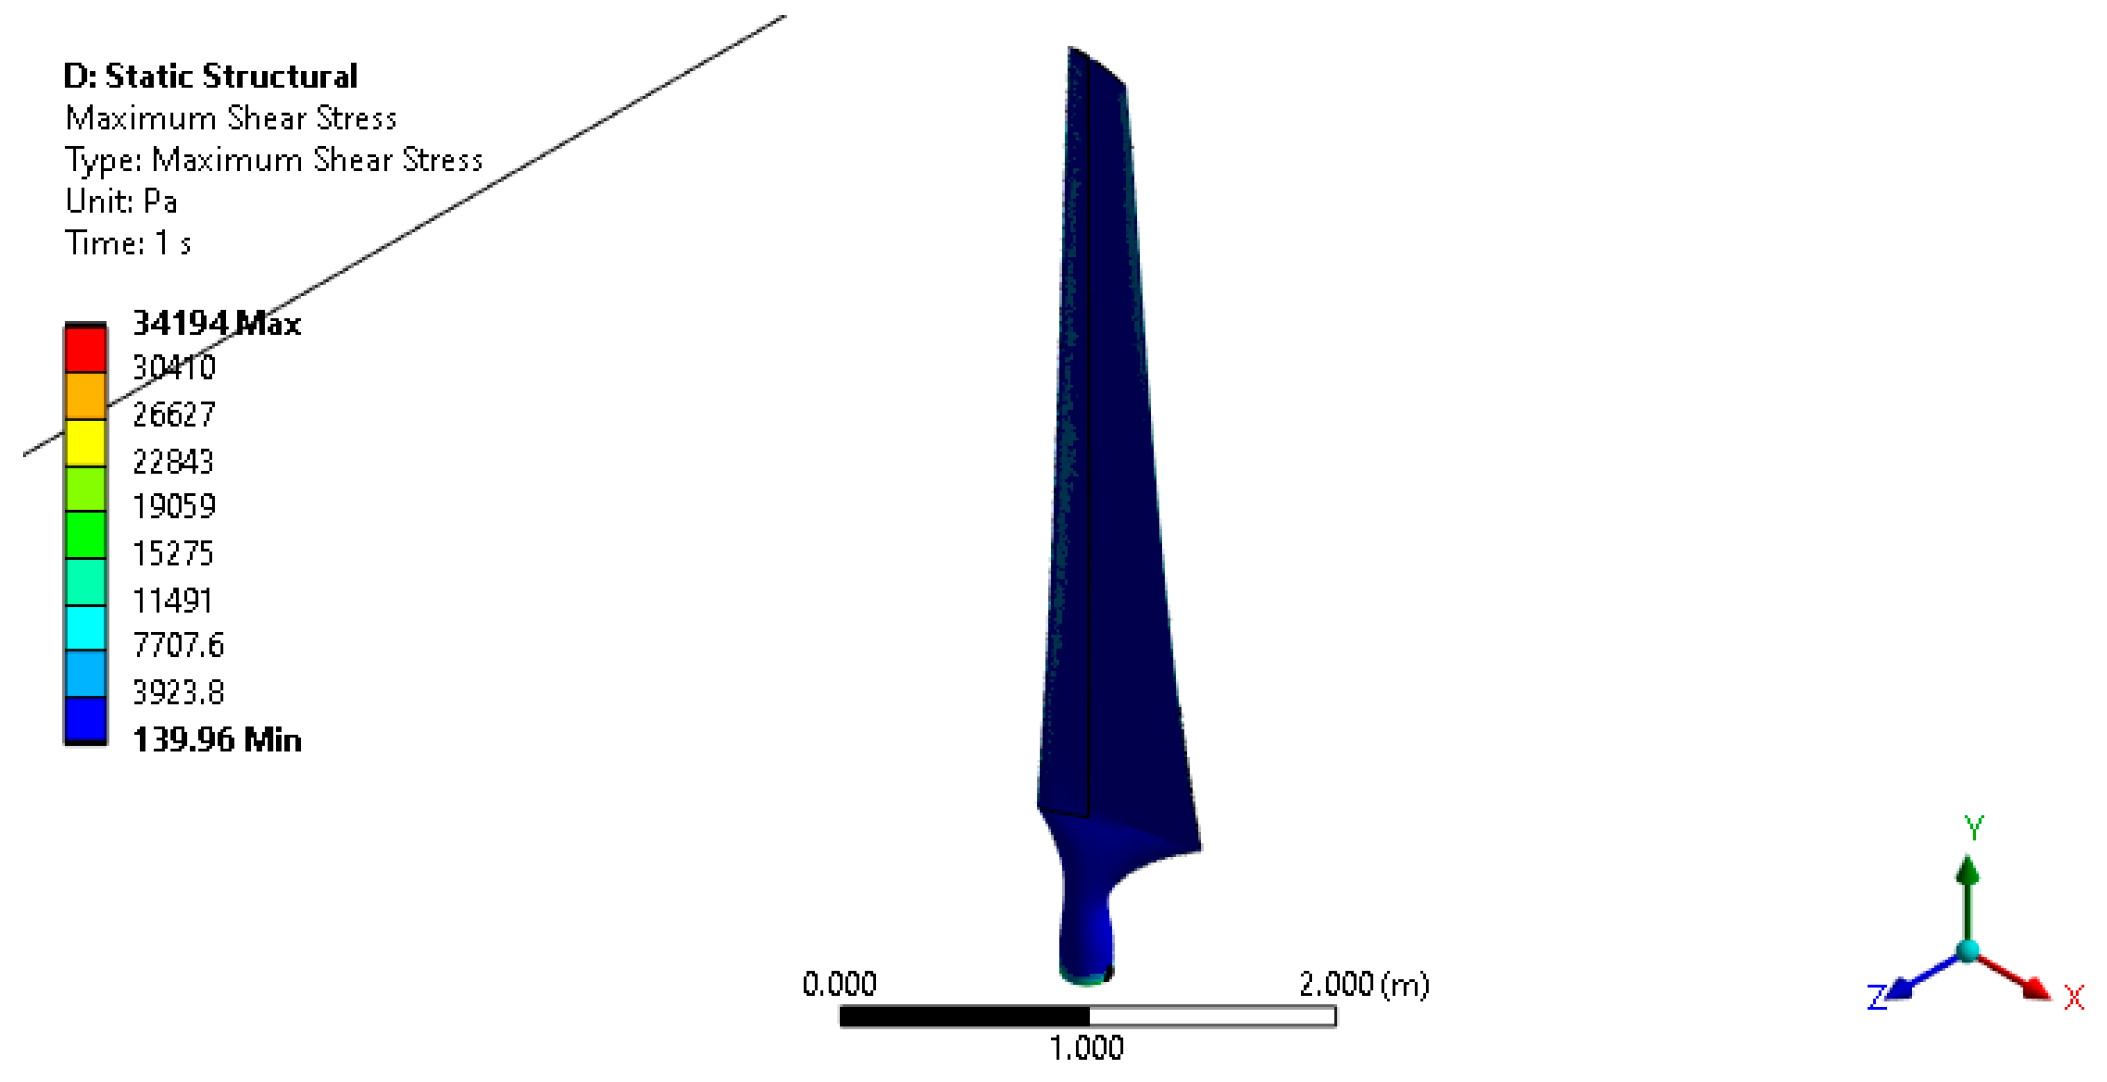
Yet, the shear stress that is parallel to the principal planes is present, as shown in Figure 9. Here, with the contribution of normal stress, the shear stress reaches a maximum of approximately 300 Pa, as shown in Figure 13, with the green shading on almost 99% of the blade surfaces. But this, on its own, does not result in more than 140 Pa on the same surfaces, as shown by the blue shading in Figure 14. This is the maximum shear stress that occurs where the material thickness is minimum or the shear force is maximum. Since the material thickness decreases as the chord and airfoil thickness decreases along the span of the blade, and although the flow of the shear force parallel to the surface cross-section is present, the shear force is less suspected for deformation. Meanwhile, a relationship between the average principal stress and the maximum shear stress is found here to be as follows:
A v g σ p r i n c τ m a x
where the plane on which the maximum shear stress acts on the intersects of the angle directions of the average principal stress.

3.3. Srain

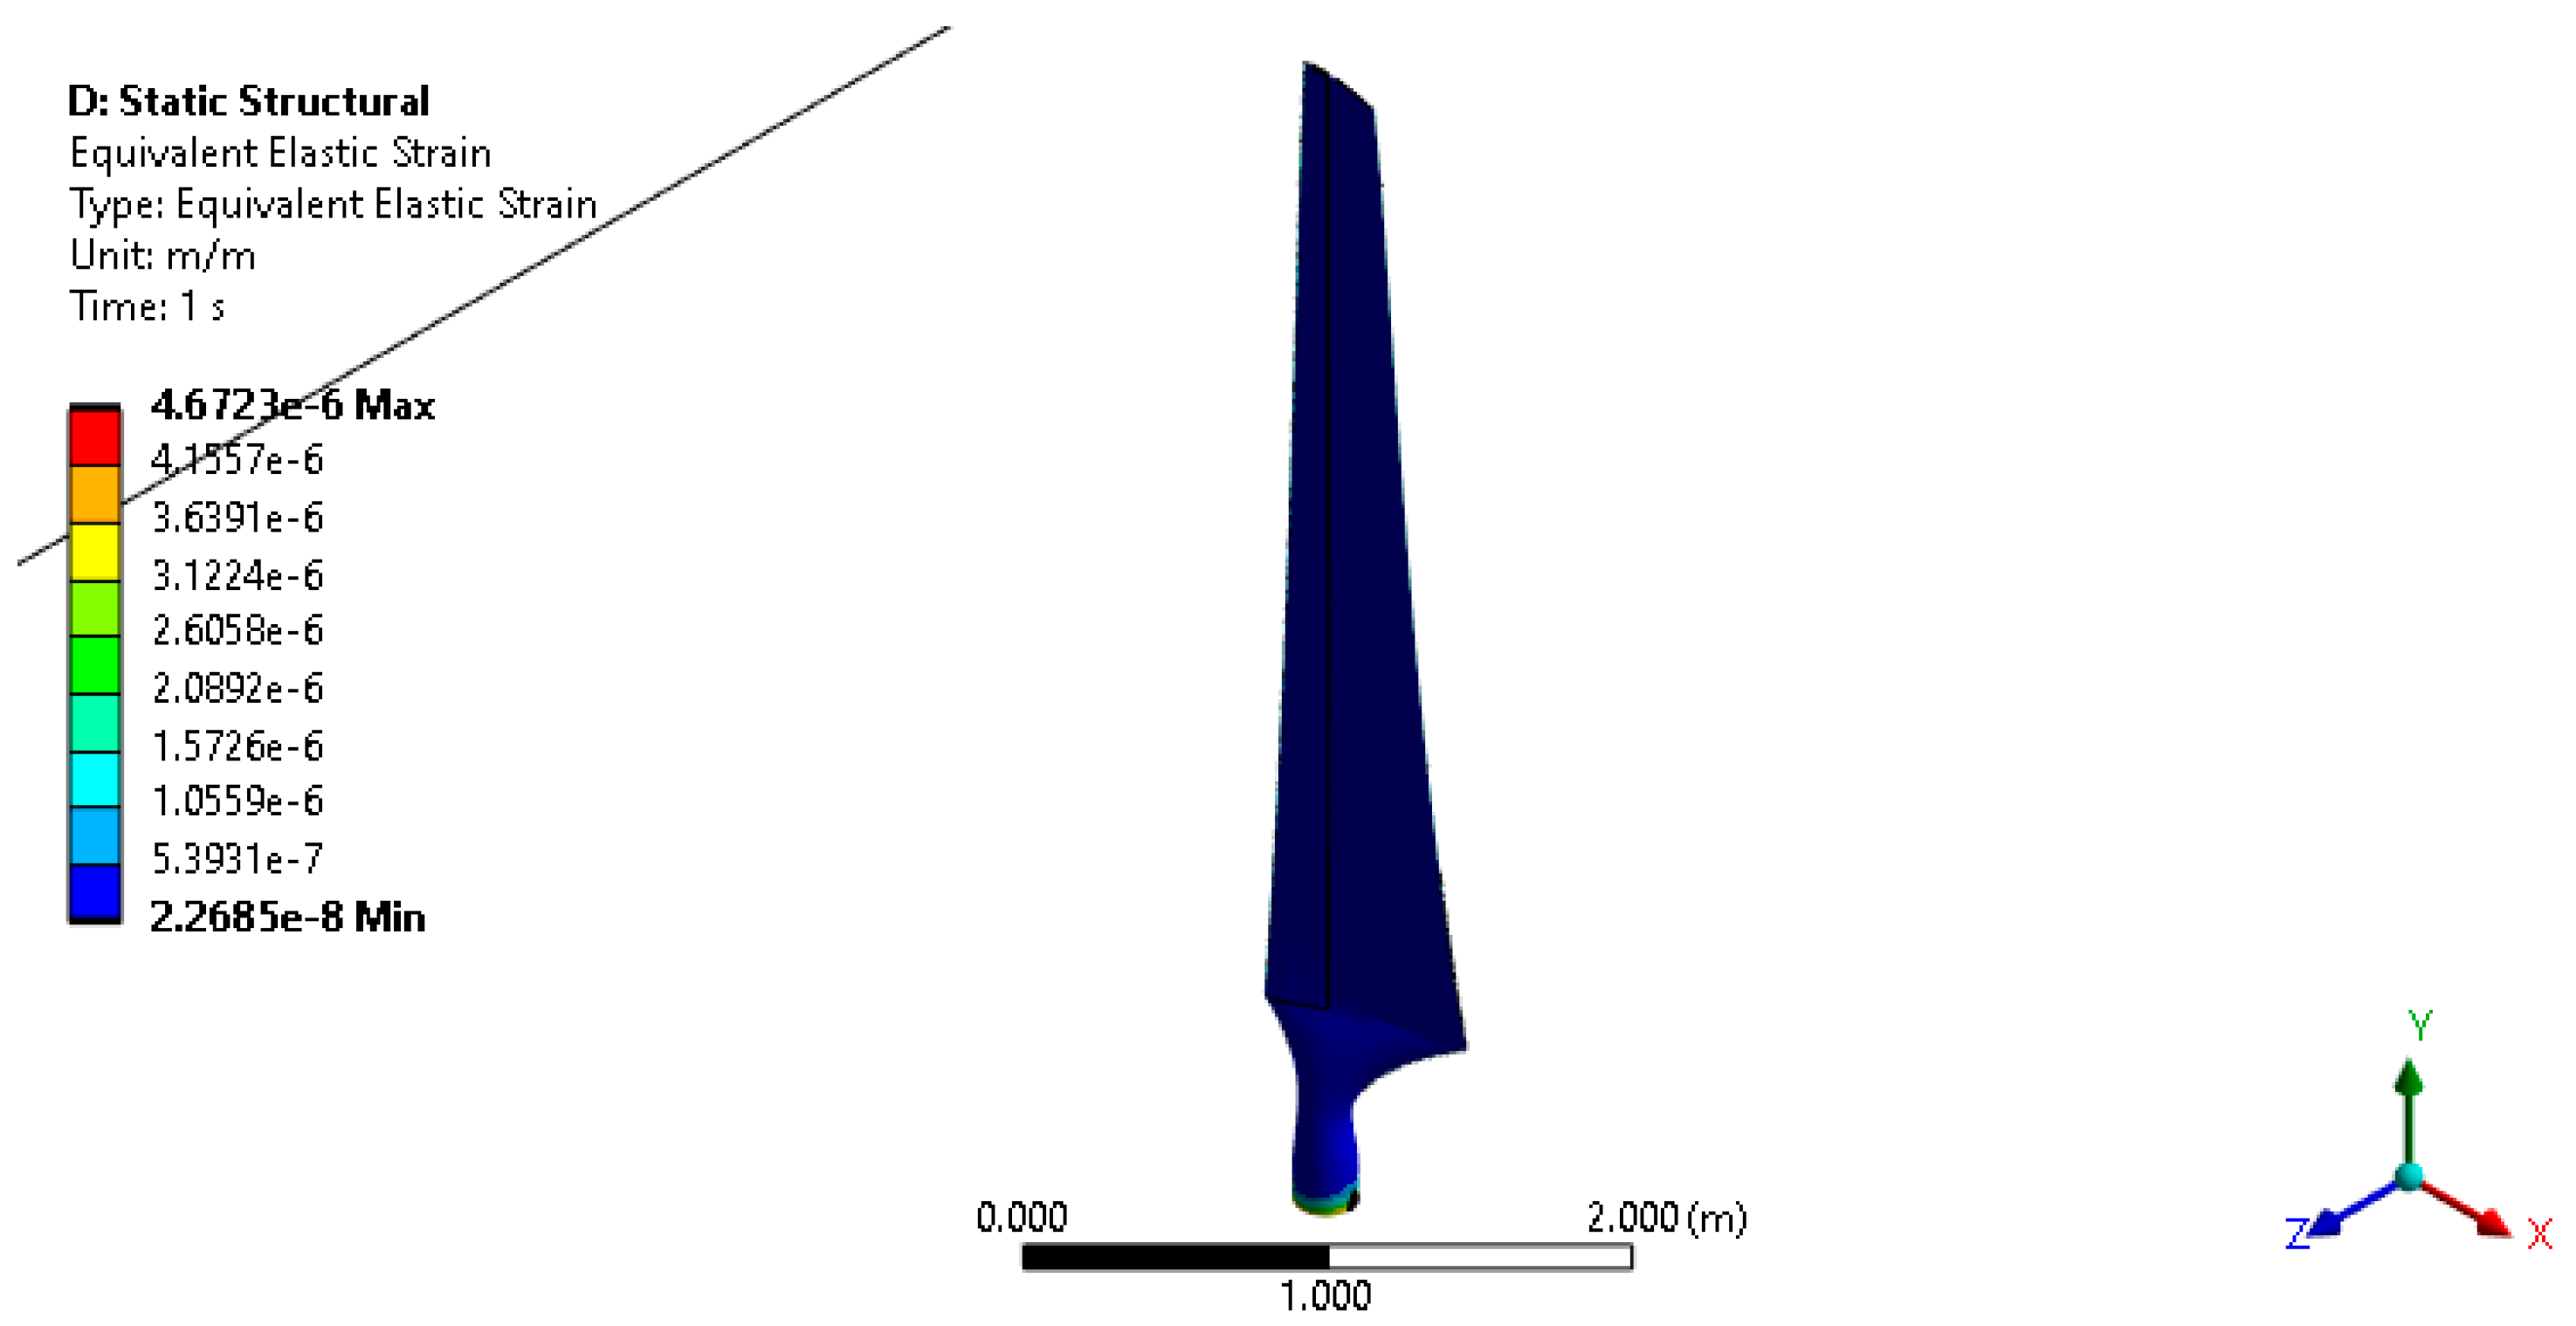
To verify the analysis of the stress components, the result from the combination of all the strain components is given in Figure 15. Here, the equivalent elastic strain quantifies the highest level of strain that the material of the turbine blade endures due to the complex aerodynamic loading. The equivalent elastic strain results express the true elastic behavior of the blade since it determines the limit at which the turbine blades recover and return to their original form as the load is lifted or shifts during the rotation of the rotor. Not only do the results confirm that the strain is elastic and the deformation is fully recoverable, but they also demonstrate that the maximum strain rate is very small, suggesting that the transformation is rigid. Furthermore, the difference between the true strain rate and the calculated rate in Figure 15 is negligible because of the entirely elastic deformation of the blade.

4. Conclusions

We conducted an FSI analysis of a relatively thin airfoil wind turbine at full scale to verify its rigidity. This is because, in a previous study, this airfoil was implemented in the NREL Phase VI wind turbine to optimize its acoustic performance, with the assumption of total rigidity of the blades. The CFD results for the aerodynamic loads were verified against the experimental data. Even though the operation case with the highest resulting aerodynamic load was selected for the FSI analysis, the simulation resulted in a negligible flap-wise elastic deformation of 5.8915 × 10 7 m mostly near the tip of the blade. The analysis of the stress and strain results supported the findings with almost the entire blade subjected to equivalent stress and equivalent elastic strain of approximately 258.44 Pa and 2.3 × 10 8 m/m, respectively.
The characteristics of the D-spar structural shape is what most likely contributed to the result over that of the carbon fiber material, as the considerable decrease in the volume of the material did not have a significant effect on the structural deformation. However, the reduction in aerodynamic loads through the implementation of thinner airfoil section may have significantly aided in the results. This does not suggest an ideal rigid structure because it will require an infinite Young’s modulus, but the resulting elastic deformation is less than observable. And although the toughness and strength of the carbon fiber material is high, the minimal property was selected for this analysis.
Further optimization to enhance the startup performance of the turbine can be undertaken by reducing the surface wall thickness of the blade and, thus, further reduce the mass of the blade. However, this will probably compromise the momentum of the turbine in near-steady wind conditions.

Author Contributions

Conceptualization, D.S.; methodology, D.S.; software, D.S.; validation, D.S. and J.N.; formal analysis, D.S.; investigation, D.S.; resources, D.S.; data curation, D.S.; writing—original draft preparation, D.S.; writing—review and editing, J.N.; visualization, D.S.; supervision, J.N.; project administration, D.S.; funding acquisition, J.N. All authors have read and agreed to the published version of the manuscript.

Funding

This research received no external funding.

Data Availability Statement

The original contributions presented in the study are included in the article, further inquiries can be directed to the corresponding author.

Conflicts of Interest

The authors declare no conflicts of interest.

References

  1. Sesalim, D.; Naser, J. The Effects of a Seagull Airfoil on the Aerodynamic Performance of a Small Wind Turbine. Energies 2024, 17, 2768. [Google Scholar] [CrossRef]
  2. Yossri, W.; Ayed, S.B.; Abdelkefi, A. Evaluation of the efficiency of bioinspired blade designs for low-speed small-scale wind turbines with the presence of inflow turbulence effects. Energy 2023, 273, 127210. [Google Scholar] [CrossRef]
  3. Coxworth, B. Seagull-Inspired Blades Could Give Small-Scale Wind Turbines a Power Boost. Energy, 24 June 2019. [Google Scholar]
  4. Seagull-Wing-Inspired Small-Scaled Wind Turbine to Deliver 15% More Power. TechNews, 5 July 2010.
  5. Qin, S.; Cheng, L.; He, Z. Bionic Fan Blade Shape Design Based on Owl Airfoil and Analysis of Its Effect on Noise. In Advances in Mechanical Design; Springer Nature Singapore Pte Ltd.: Singapore, 2022; pp. 665–672. [Google Scholar]
  6. Wang, M.; Liu, X. Numerical investigation of aerodynamic and acoustic characteristics of bionic airfoils inspired by bird wing. J. Aerosp. Eng. 2019, 233, 4004–4016. [Google Scholar] [CrossRef]
  7. Dean Sesalim, J.N. Effects of an Owl Airfoil on the Aeroacoustics of a Small Wind Turbine. Energies 2024, 17, 2254. [Google Scholar] [CrossRef]
  8. Beyene, D.W.M.A. Experimental and Fluid Structure Interaction analysis of a morphing wind turbine rotor. Energy 2015, 90, 1055–1065. [Google Scholar]
  9. Rajendra Roul, A.K. Fluid-Structure Interaction of Wind Turbine Blade Using Four Different Materials: Numerical Investigation. Symmetry 2020, 12, 1467. [Google Scholar] [CrossRef]
  10. Yassen El, S.Y.; Abdelhameed, A.S.; Elshorbagy, K.A. An examination of hub wind turbine utilizing fluid-structure interaction strategy. Alex. Eng. J. 2023, 64, 1–11. [Google Scholar] [CrossRef]
  11. Santo, G.; Peeters, M.; Van Paepegem, W.; Degroote, J. Dynamic load and stress analysis of a large horizontal axis wind turbine using full scale fluid-structure interaction simulation. Renew. Energy 2019, 140, 212–226. [Google Scholar] [CrossRef]
  12. Yan, J.; Korobenko, A.; Deng, X.; Bazilevs, Y. Computational free-surface fluid–structure interaction with application to floating offshore wind turbines. Comput. Fluids 2016, 141, 155–174. [Google Scholar] [CrossRef]
  13. Wiegard, B.; König, M.; Lund, J.; Radtke, L.; Netzband, S.; Abdel-Maksoud, M.; Düster, A. Fluid-structure interaction and stress analysis of a floating wind turbine. Mar. Struct. 2021, 78, 102970. [Google Scholar] [CrossRef]
  14. Adil Rasheeda, R.H.; Kvamsdala, T.; Åkervik, E. A Comprehensive Simulation Methodology for Fluid-Structure Interaction of Offshore Wind Turbines. Energy Procedia 2014, 53, 135–145. [Google Scholar] [CrossRef]
  15. Christian Grinderslev, S.G.H.; Sørensen, N.N. Fluid–structure interaction simulations of a wind turbine rotor in complex flows, validated through field experiments. Wind Energy 2021, 24, 1426–1442. [Google Scholar] [CrossRef]
  16. Wang, L.; Quant, R.; Kolios, A. Fluid structure interaction modelling of horizontal-axis wind turbine blades based on CFD and FEA. J. Wind. Eng. Ind. Aerodyn. 2016, 158, 11–25. [Google Scholar] [CrossRef]
  17. Lee, K.; Huque, Z.; Kommalapati, R.; Han, S.E. The Evaluation of Aerodynamic Interaction of Wind Blade Using Fluid Structure Interaction Method. J. Clean Energy Technol. 2015, 3, 270–275. [Google Scholar] [CrossRef]
  18. Bazilevs, Y.; Korobenko, A.; Deng, X.; Yan, J. Novel structural modeling and mesh moving techniques for advanced fluid–structure interaction simulation of wind turbines. Int. J. Numer. Methods Eng. 2015, 102, 766–783. [Google Scholar] [CrossRef]
  19. Lee, K.; Huque, Z.; Kommalapati, R.; Han, S.E. Fluid-structure interaction analysis of NREL phase VI wind turbine: Aerodynamic force evaluation and structural analysis using FSI analysis. Renew. Energy 2017, 113, 512–531. [Google Scholar] [CrossRef]
  20. Tu, J.; Yeoh, G.H.; Liu, C.; Tao, Y. Computational Fluid Dynamics: A Practical Approach; Butterworth-Heinemann: Oxford, UK, 2012. [Google Scholar]
  21. 40- BY 80-/80- BY 120-FOOT WIND TUNNELS. NASA Ames Research Center. Available online: https://rotorcraft.arc.nasa.gov/Research/Facilities/windtunnels.html (accessed on 25 November 2024).
  22. Hand, M.M.; Simms, D.A.; Fingersh, L.J.; Jager, D.W.; Cotrell, J.R.; Schreck, S.; Larwood, S.M. Unsteady Aerodynamics Experiment Phase VI: Wind Tunnel Test Configurations and Available Data Campaigns; National Renewable Energy Laboratory: Golden, CO, USA, 2001. [Google Scholar]
  23. WebPlotDigitizer. Available online: https://apps.automeris.io/wpd/ (accessed on 15 January 2023).
  24. Sørensen, N.N.; Michelsen, J.A.; Schreck, S. Navier–Stokes predictions of the NREL phase-VI rotor in the NASA Ames 80ft x 120ft wind tunnel. Wind Energy 2002, 5, 151–169. [Google Scholar] [CrossRef]
  25. Johansen, J.; Sørensen, N.N.; Michelsen, J.A.; Schreck, S. Detached-eddy simulation of flow around the NREL Phase VI blade. Wind Energy 2002, 5, 185–197. [Google Scholar] [CrossRef]
  26. Chao, D.D.; Van Dam, C.P. Computational aerodynamic analysis of a blunt trailing-edge airfoil modification to the NREL Phase VI rotor. Wind Energy 2007, 10, 529–550. [Google Scholar] [CrossRef]
  27. Zhang, R.K.; Wu, V.D. Aerodynamic characteristics of wind turbine blades with a sinusoidal leading edge. Wind Energy 2012, 15, 407–424. [Google Scholar] [CrossRef]
  28. Hsu, M.C.; Akkerman, I.; Bazilevs, Y. Finite element simulation of wind turbine aerodynamics: Validation study using NREL Phase VI experiment. Wind Energy 2014, 17, 461–481. [Google Scholar] [CrossRef]
  29. Elfarra, M.A.; Sezer-Uzol, N.; Akmandor, I.S. NREL VI rotor blade: Numerical investigation and winglet design and optimization using CFD. Wind Energy 2014, 17, 605–626. [Google Scholar] [CrossRef]
  30. Simms, D.; Schreck, S.; Hand, M.; Fingersh, L.J. NREL Unsteady Aerodynamics Experiment in the NASA-Ames Wind Tunnel: A Comparison of Predictions to Measurements; National Renewable Energy Laboratory: Golden, CO, USA, 2001. [Google Scholar]
  31. Spera, D.A. Wind Turbine Technology: Fundamental Concepts of Wind Turbine Engineering, 2nd ed.; ASME: Houston, TX, USA, 2009. [Google Scholar]
  32. Peijs, T.; Kirschbaum, R.; Lemstra, P.J. Chapter 5: A critical review of carbon fiber and related products from an industrial perspective. Adv. Ind. Eng. Polym. Res. 2022, 5, 90–106. [Google Scholar] [CrossRef]
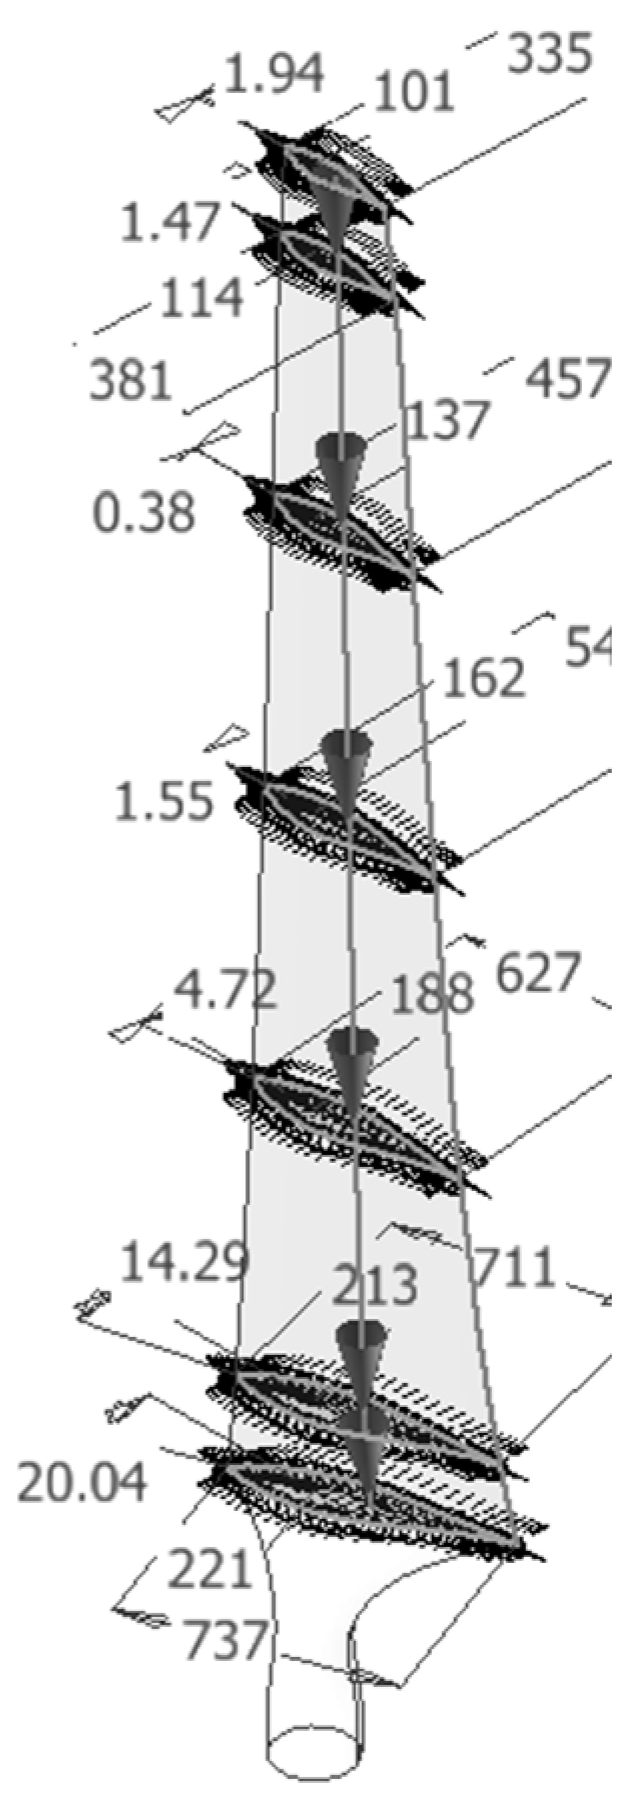
Figure 1. Modeled blade.
Energies 18 01288 g001
Figure 2. Computational domain.
Energies 18 01288 g002
Figure 3. Owl blade cross-section with D-spar structure at 0.25 span station.
Energies 18 01288 g003
Figure 4. Modeled airfoil cross-section mesh.
Energies 18 01288 g004
Figure 5. Mesh refinement study.
Energies 18 01288 g005
Figure 6. Pressure distribution result at 0.3R and 10 m/s.
Energies 18 01288 g006
Figure 7. Locations of the applied load and fixed support.
Energies 18 01288 g007
Figure 8. Total deformation.
Energies 18 01288 g008
Figure 9. Exaggerated view of deformation.
Energies 18 01288 g009
Figure 10. Equivalent stress.
Energies 18 01288 g010
Figure 11. Normal stress.
Energies 18 01288 g011
Figure 12. Maximum principal stress.
Energies 18 01288 g012
Figure 13. Shear stress.
Energies 18 01288 g013
Figure 14. Maximum shear stress.
Energies 18 01288 g014
Figure 15. Equivalent elastic strain.
Energies 18 01288 g015
Table 1. Airfoil distribution parameters [22].
Radial Distance R (m)Span Station (R/5.029)Chord Length (m)Twist (Degrees)Thickness (m) (20.95% Chord)Twist Axis (% Chord), (m)
0.00.0Hub center of rotationHub center of rotationHub center of rotationHub center of rotation
0.5080.101218 (root hub adapter)0.0 (root hub adapter)0.218 (root hub adapter)50 (root hub adapter)
0.6600.1310.2180.00.21850
0.8830.1760.1830.00.18350
1.2570.2500.73720.0400.15430, (0.221)
1.3430.2670.72818.0740.15230, (0.218)
1.5100.3000.71114.2920.14930, (0.213)
1.6480.3280.69711.9090.14630, (0.209)
1.9520.3880.6667.9790.13930, (0.199)
2.2570.4490.6365.3080.13330, (0.190)
2.3430.4660.6274.7150.13130, (0.188)
2.5620.5090.6053.4250.12630, (0.181)
2.8670.5700.5742.0830.12030, (0.172)
3.1720.6310.5431.1500.11330, (0.162)
3.1850.6330.5421.1150.11330, (0.162)
3.4760.6910.5120.4940.10730, (0.153)
3.7810.7520.482−0.0150.10030, (0.144)
4.0230.8000.457−0.3810.09530, (0.137)
4.0860.8120.451−0.4750.09430, (0.135)
4.3910.8730.420−0.9200.08830, (0.162)
4.6960.9340.389−1.3520.08130, (0.116)
4.7800.9500.381−1.4690.07930, (0.114)
5.0000.9940.358−1.7750.07530, (0.107)
5.02910.335−1.9440.07530, (0.101)
Table 2. Implemented material properties.
Carbon Fiber 230 GPa
Density 1800 kg/m3
Young’s Modulus X direction 2.3 × 10¹¹ Pa
Young’s Modulus Y direction 2.3 × 10¹⁰ Pa
Young’s Modulus Z direction 2.3 × 10¹⁰ Pa
Poisson’s Ratio XY0.2
Poisson’s Ratio YZ0.4
Poisson’s Ratio XZ0.2
Shear Modulus XY9 × 109
Shear Modulus YZ8.2143 × 109
Shear Modulus XZ9 × 109
Disclaimer/Publisher’s Note: The statements, opinions and data contained in all publications are solely those of the individual author(s) and contributor(s) and not of MDPI and/or the editor(s). MDPI and/or the editor(s) disclaim responsibility for any injury to people or property resulting from any ideas, methods, instructions or products referred to in the content.