Voltage Stability Estimation Considering Variability in Reactive Power Reserves Using Regression Trees †


Abstract
1. Introduction
- Reduction in the number of synchronous generators: Fewer operational generators reduce the total amount of reactive power that can be supplied during disturbances.
- Decreased reactive power supply capability per generator: To achieve efficient and economical operation, generators are often operated near their capacity limits, which restricts their ability to supply reactive power.
- Expansion of PV power generation: The large-scale integration of photovoltaic systems introduces significant reverse power flow and voltage fluctuations in the system [12]. Control methods, such as constant power factor operation for photovoltaic systems, have been proposed to prevent voltage deviations [13]. This method consumes reactive power by the photovoltaic system to mitigate voltage rises caused by reverse power flow, and thereby prevents voltage violations. However, such measures further reduce the RPRs, exacerbating voltage stability issues.
- demonstration of the relationship between system-wide RPRs and voltage stability in the system;
- clarification of the impact of RPRs variation on the accuracy of voltage stability estimation under reactive power supply limitations;
- development of a method to address changes in reactive power limitations to improve the estimation accuracy.
2. Relationship Between the VSM and RPRs
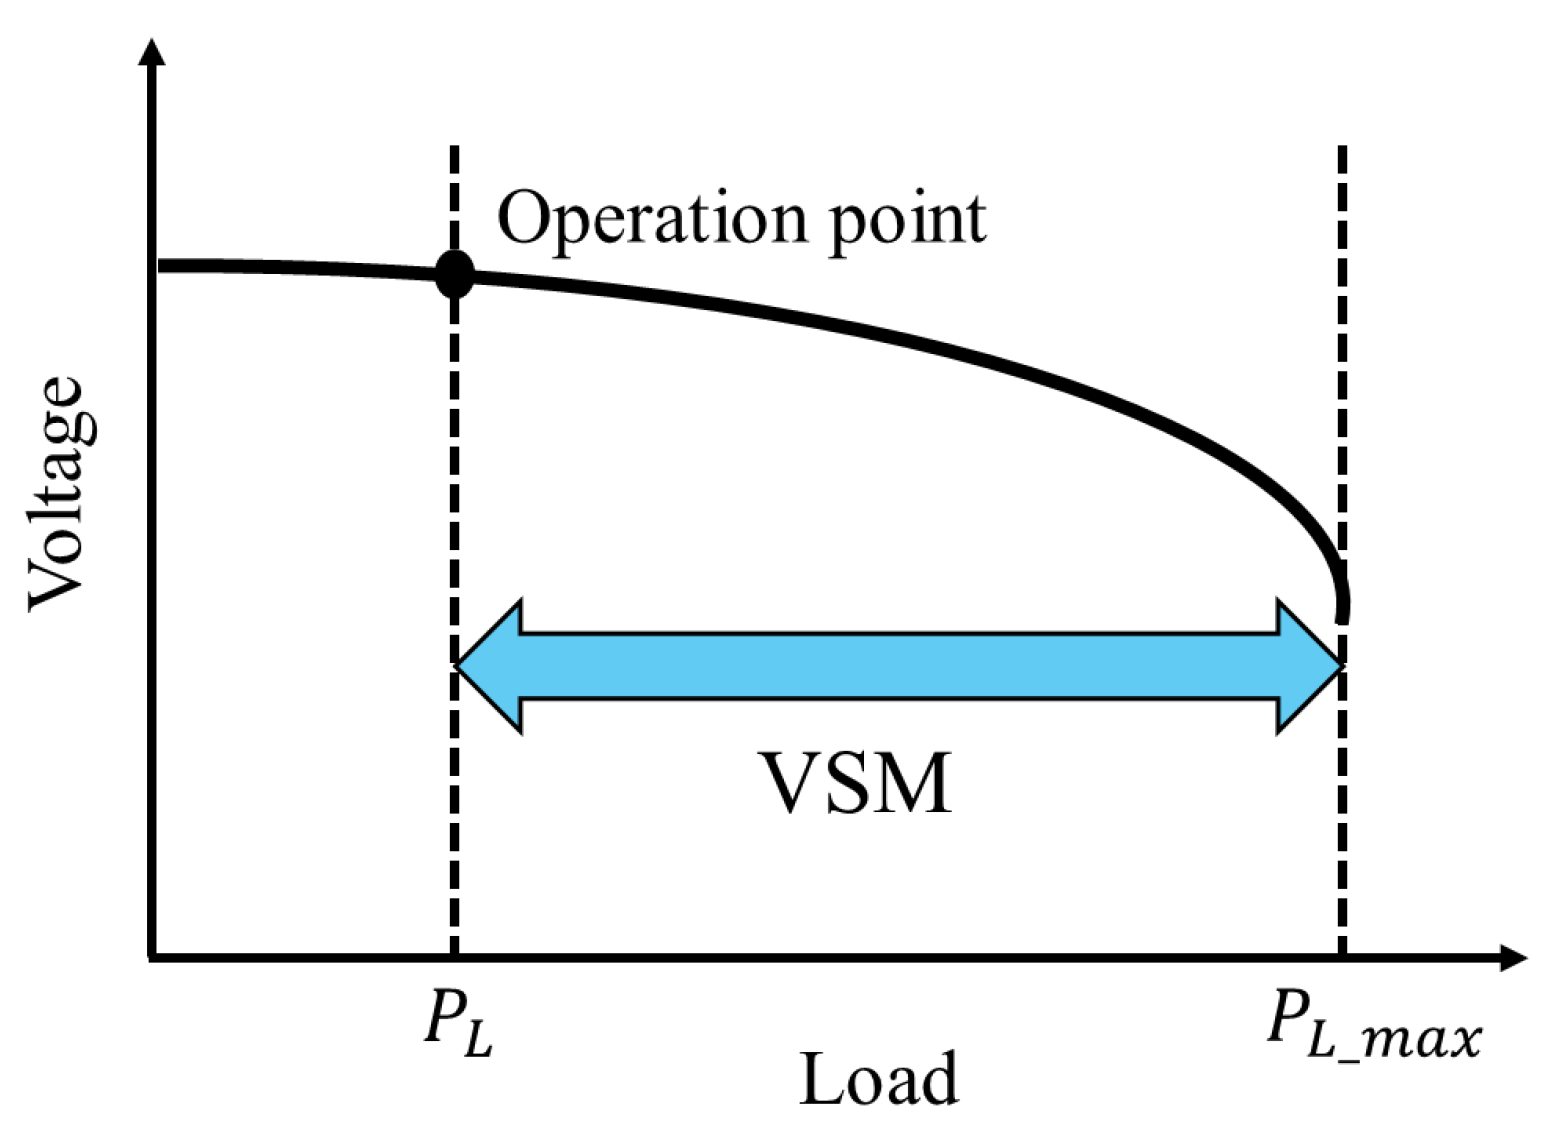
2.1. VSM
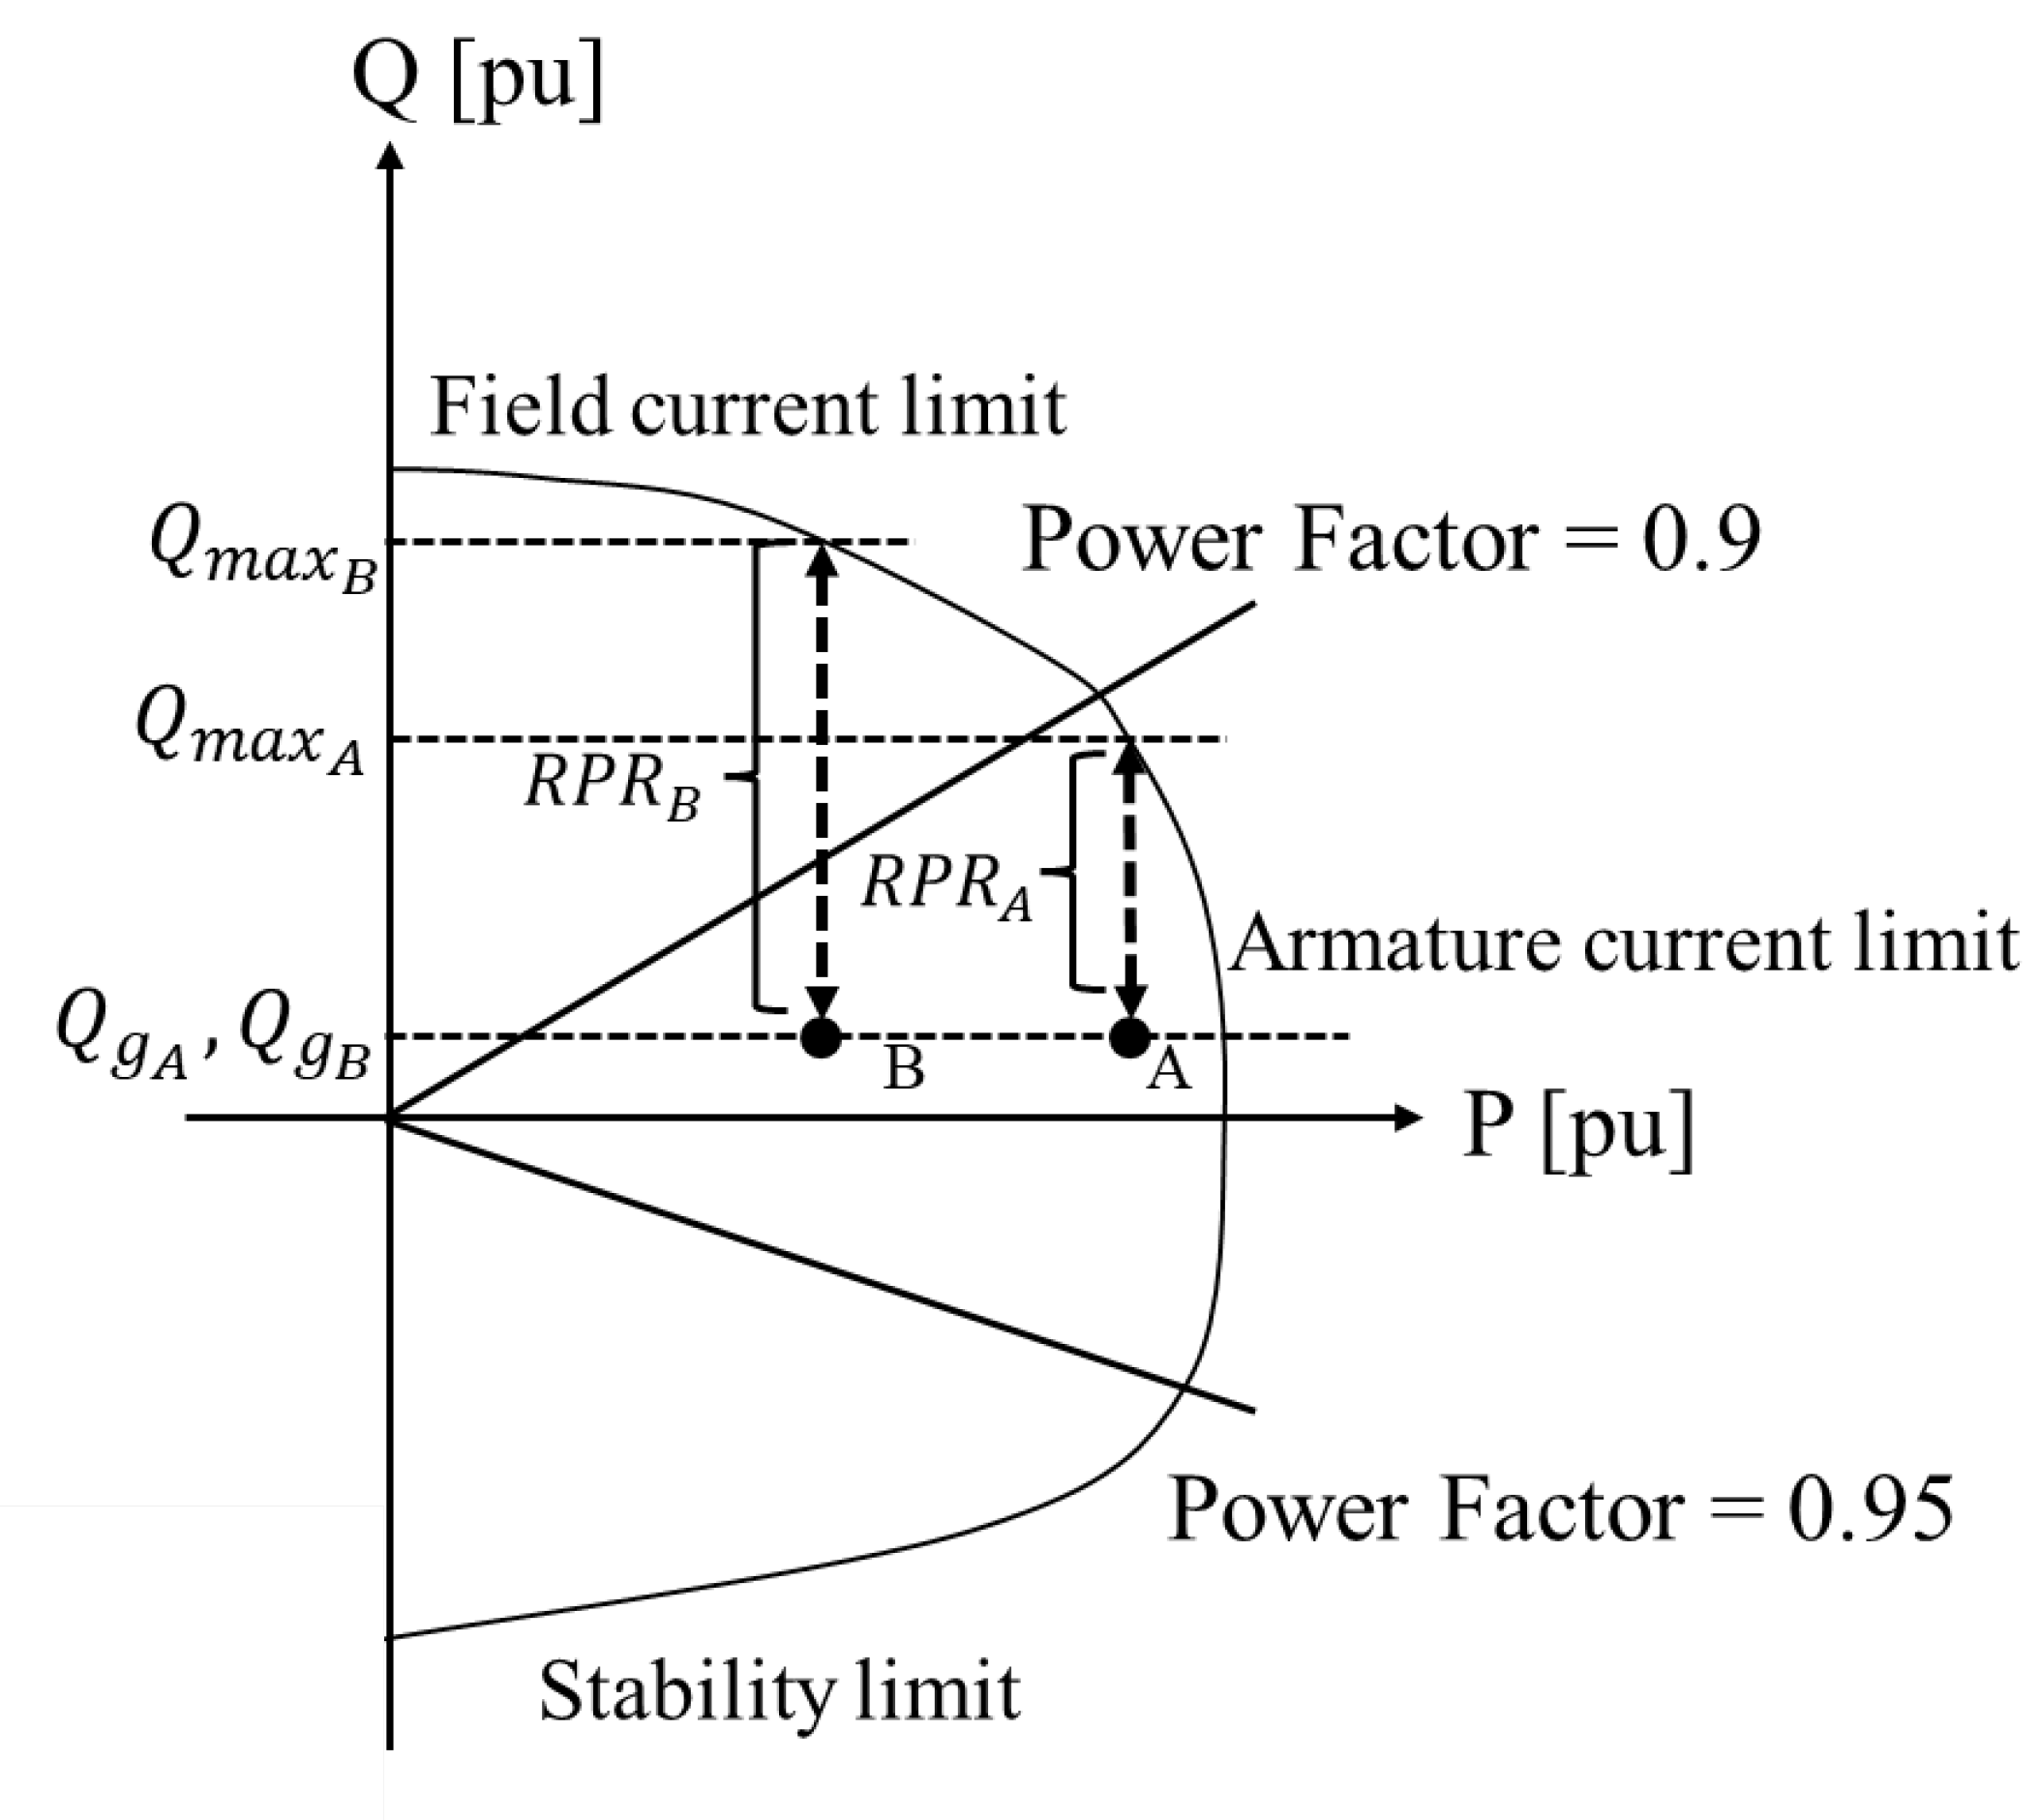
2.2. RPRs
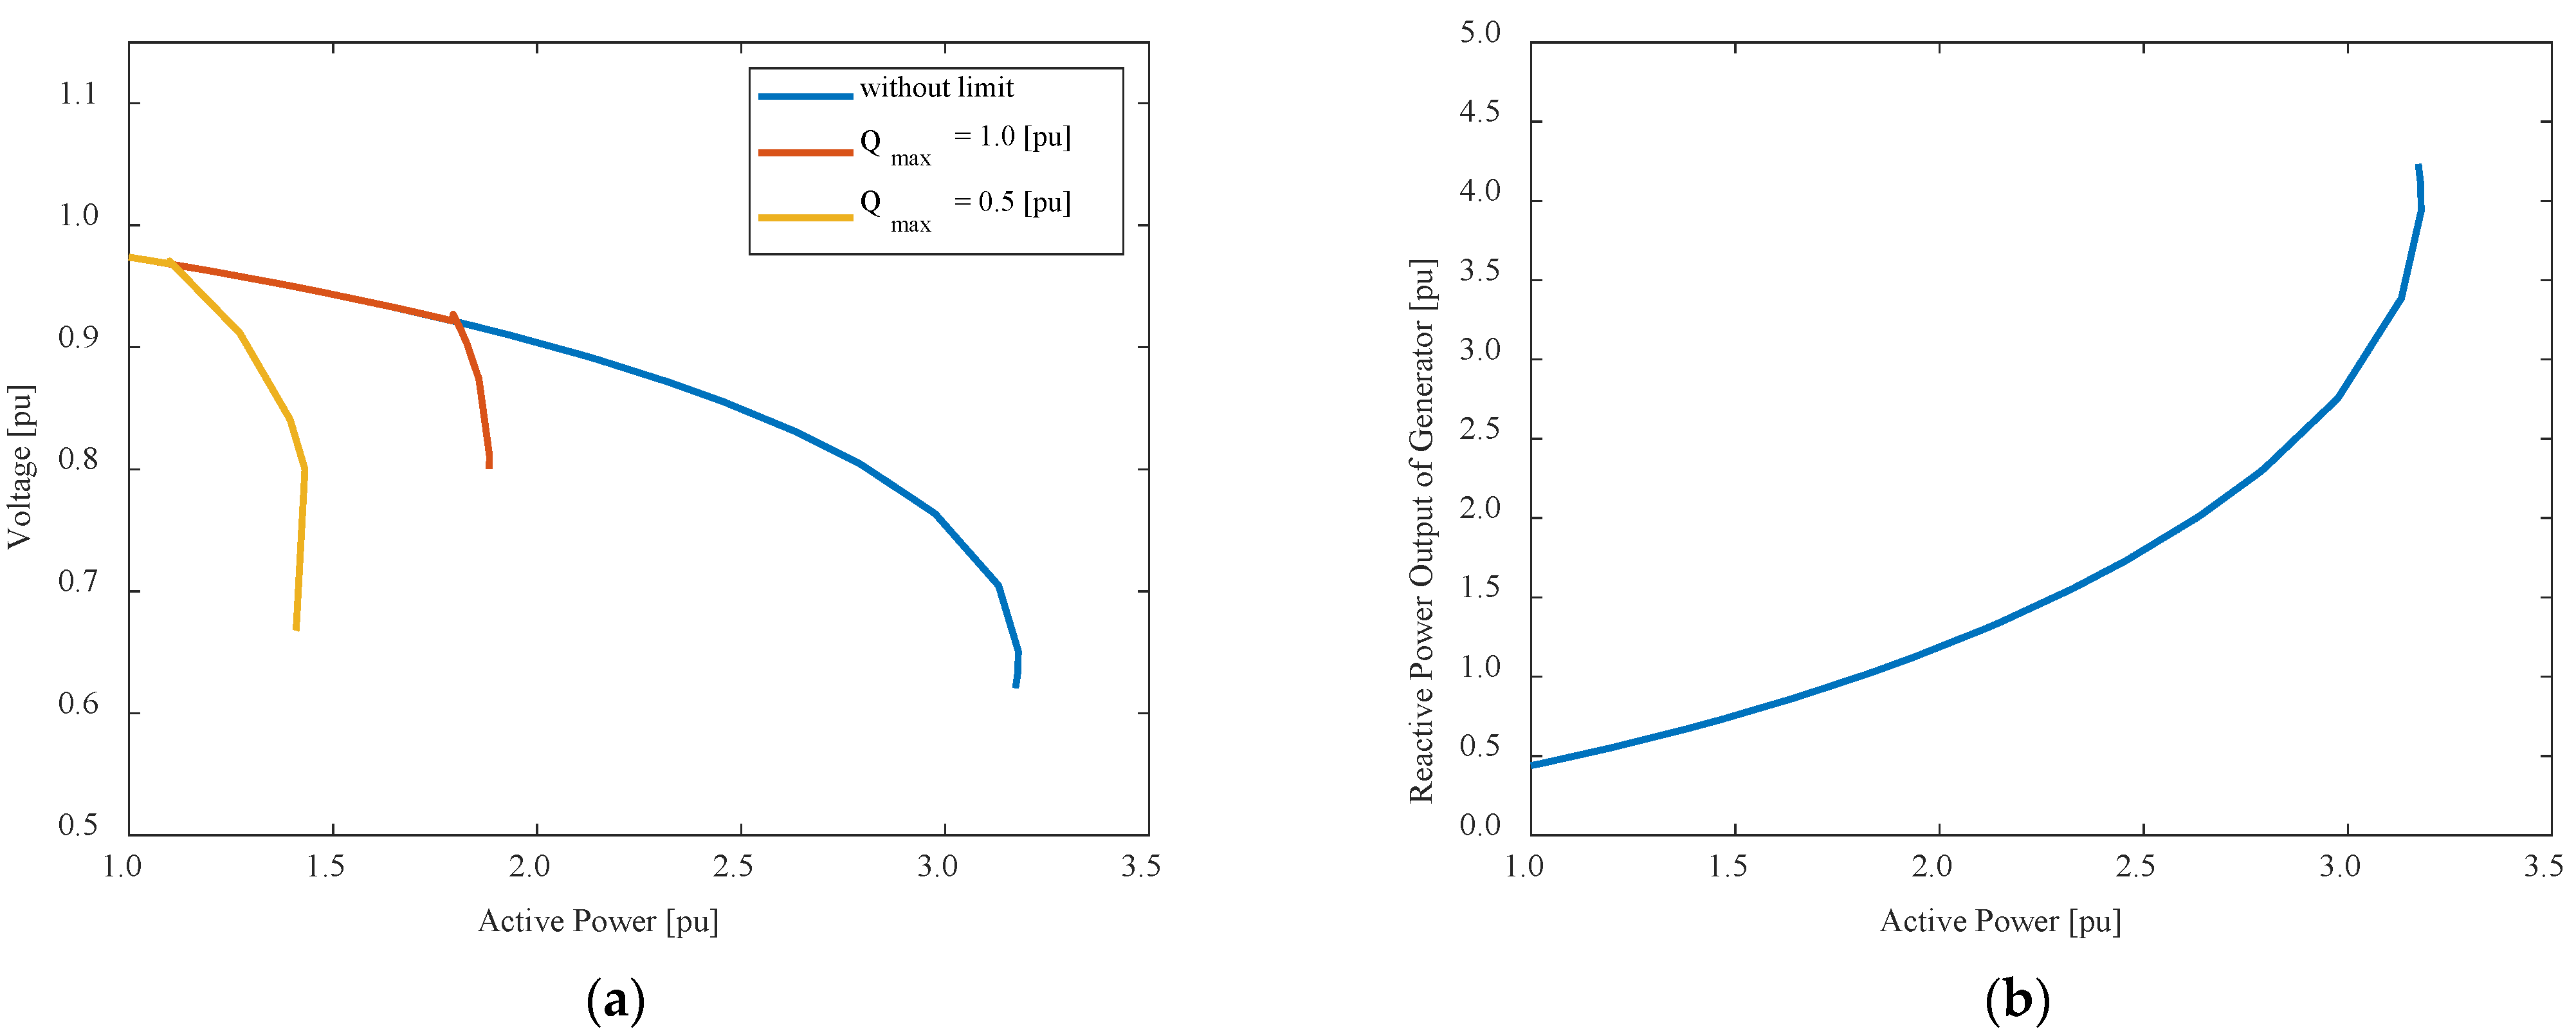
2.3. Impact of RPR Changes on the P–V Curve
- Case 1: Without Q limit;
- Case 2: With a Q limit (
- Case 3: With a Q limit (
3. Assessment of Voltage Stability Estimation by Conventional Methods
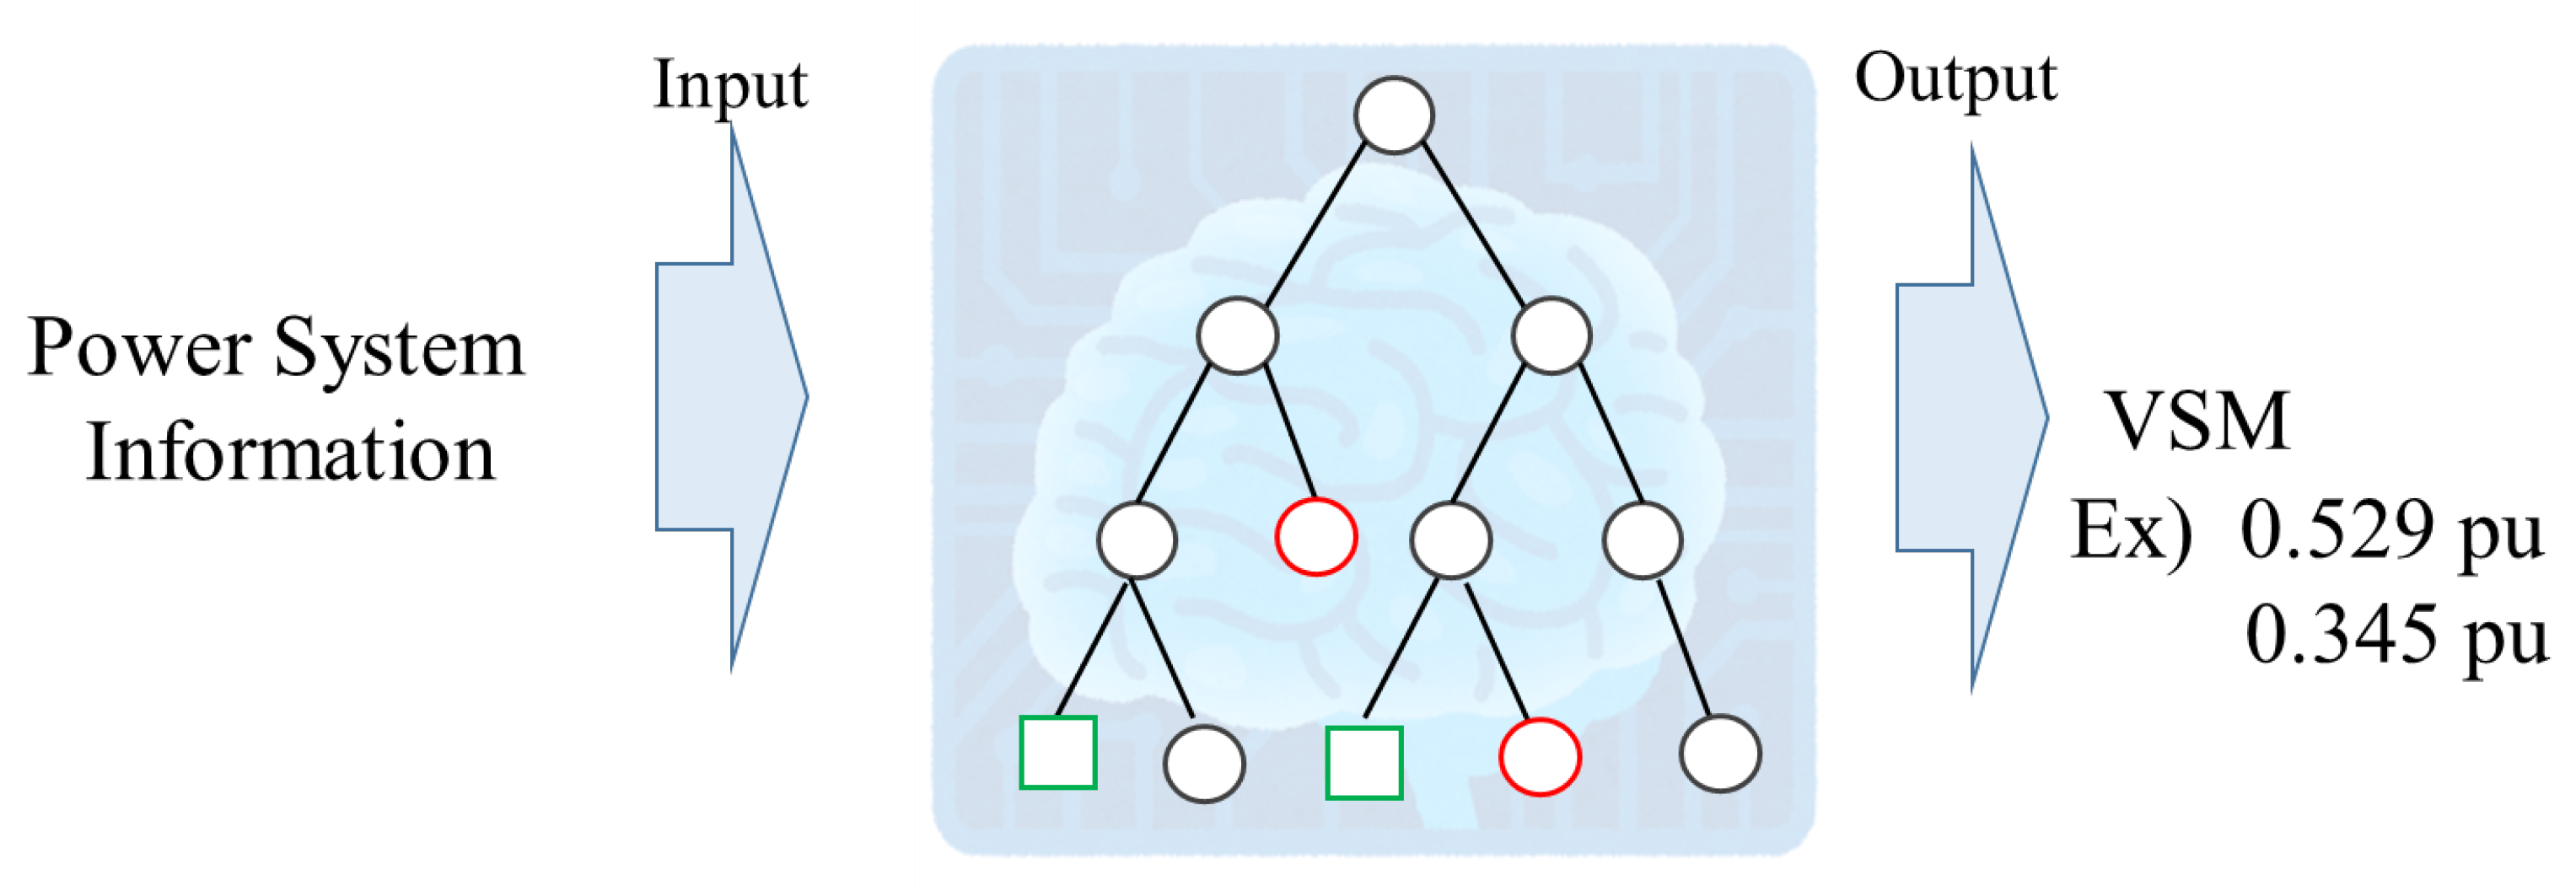
3.1. Regression Tree Overview
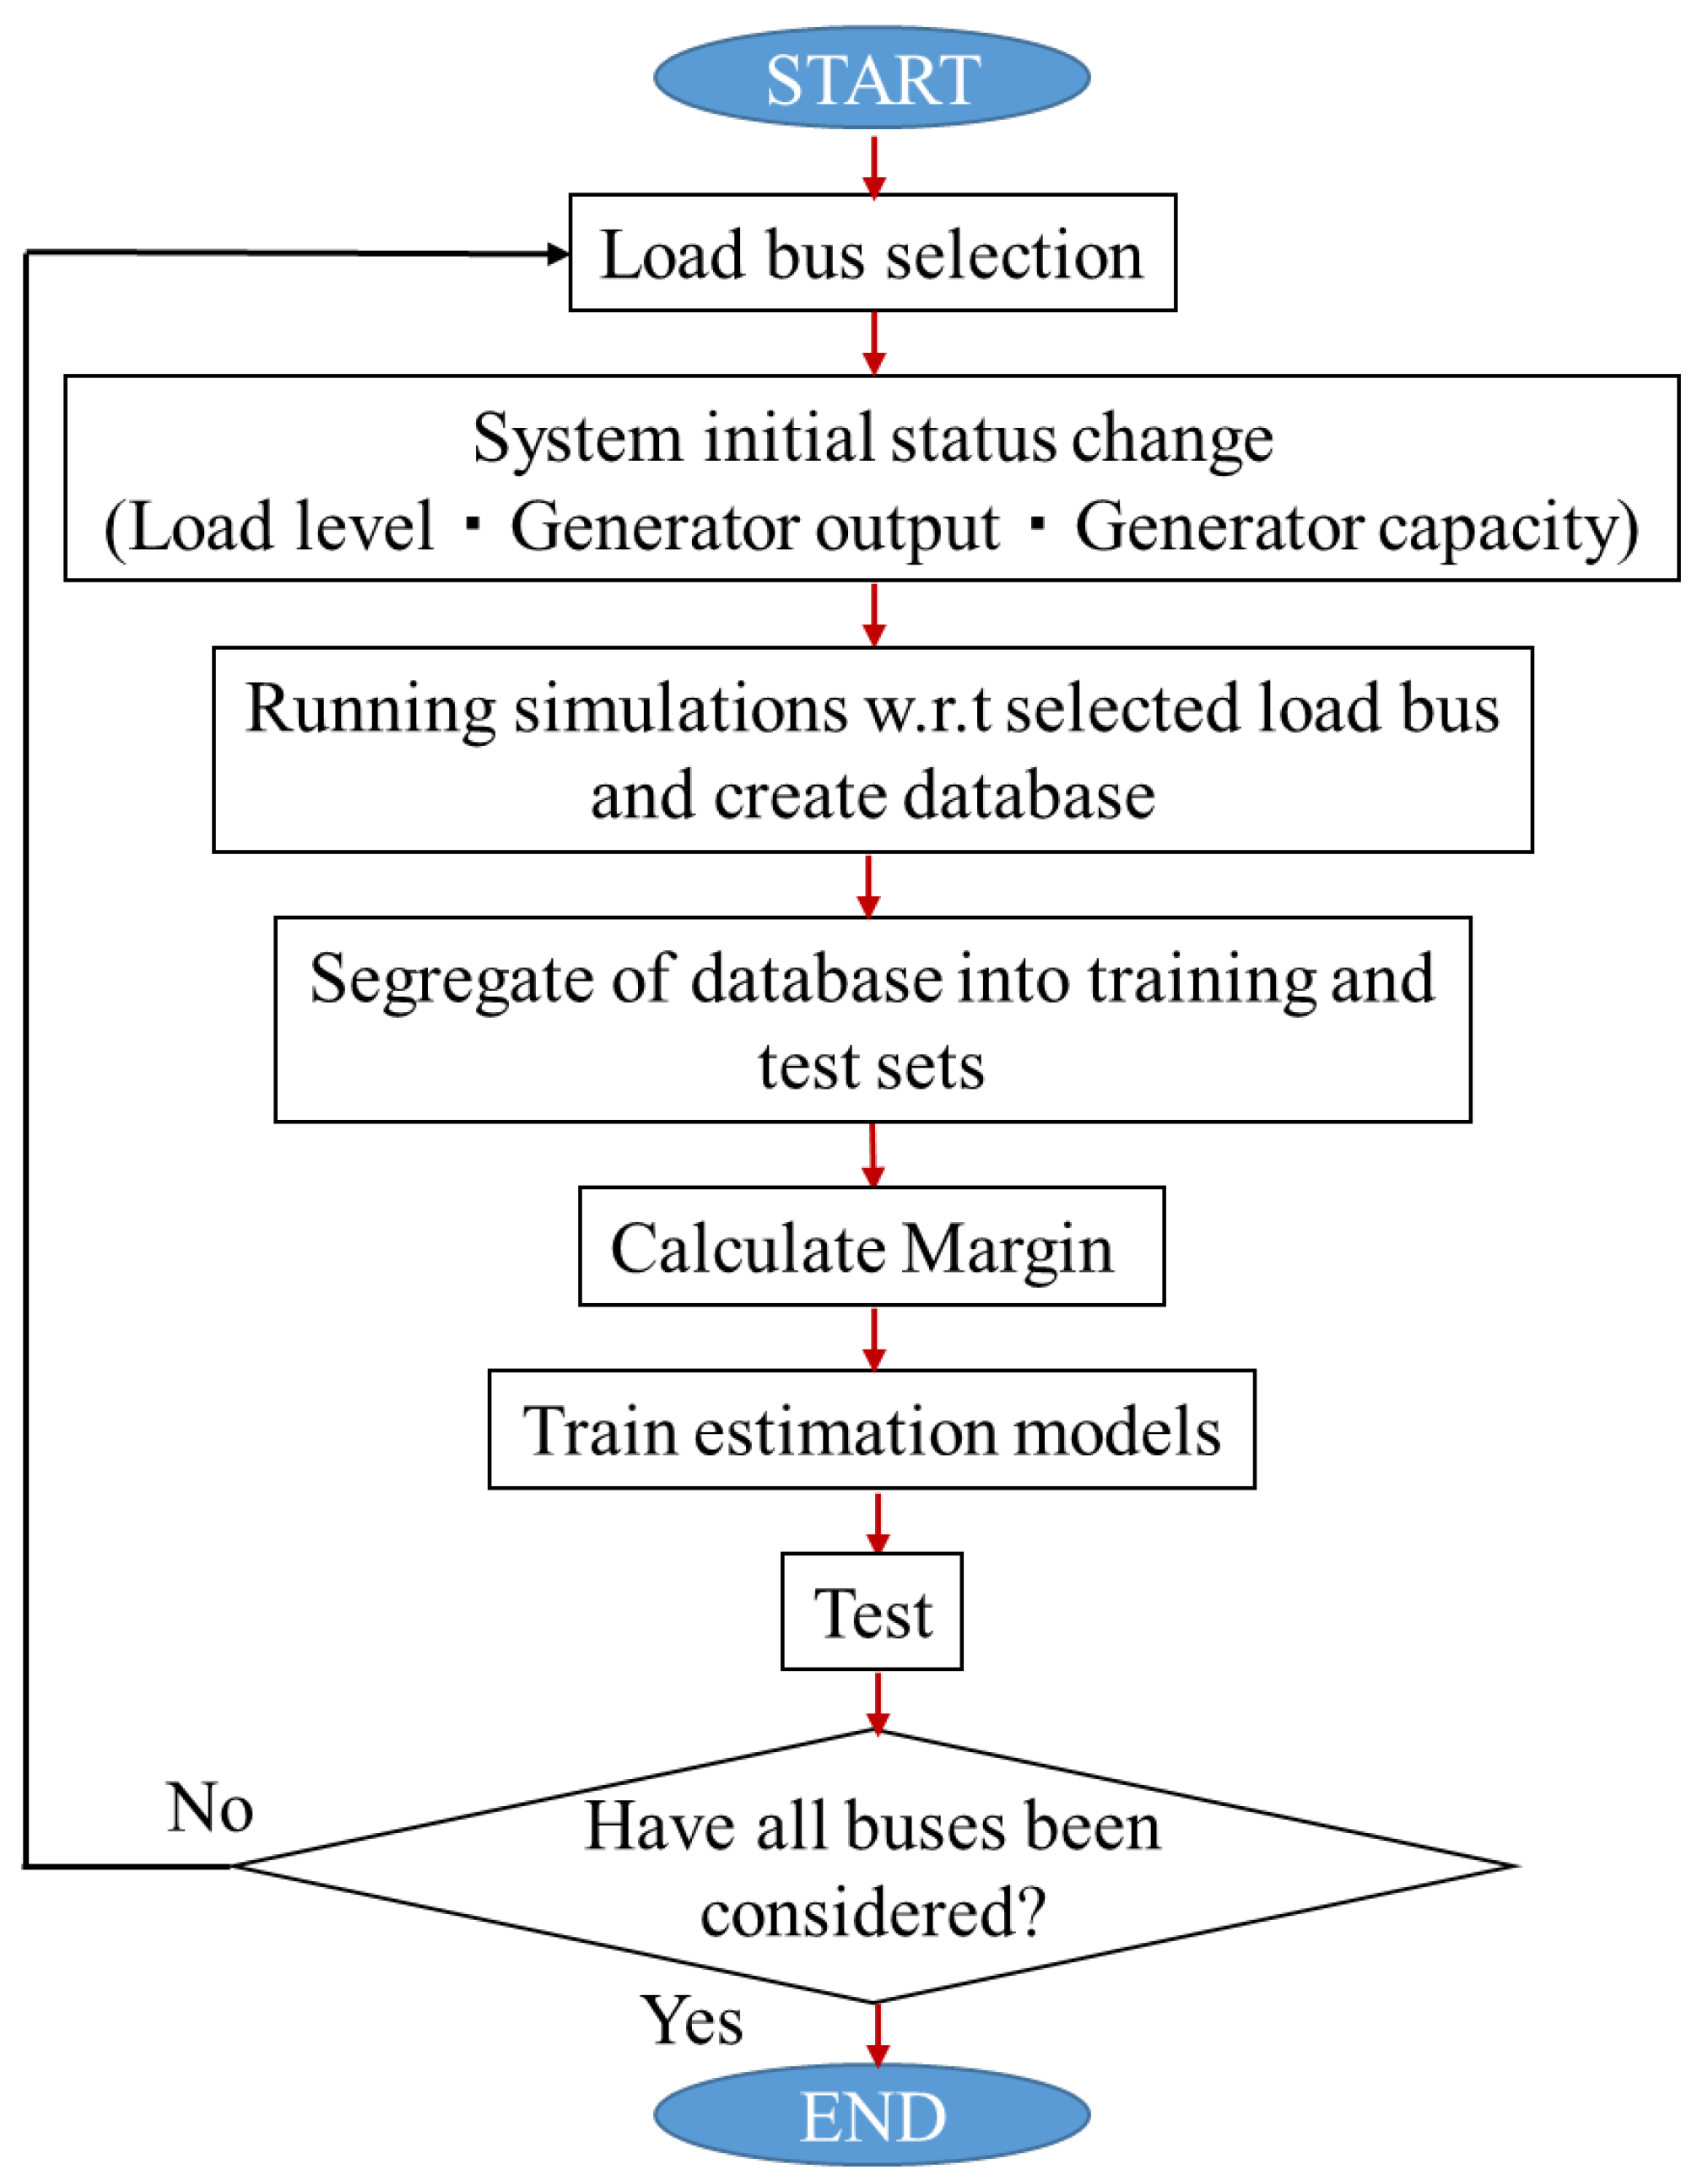
3.2. Flowchart
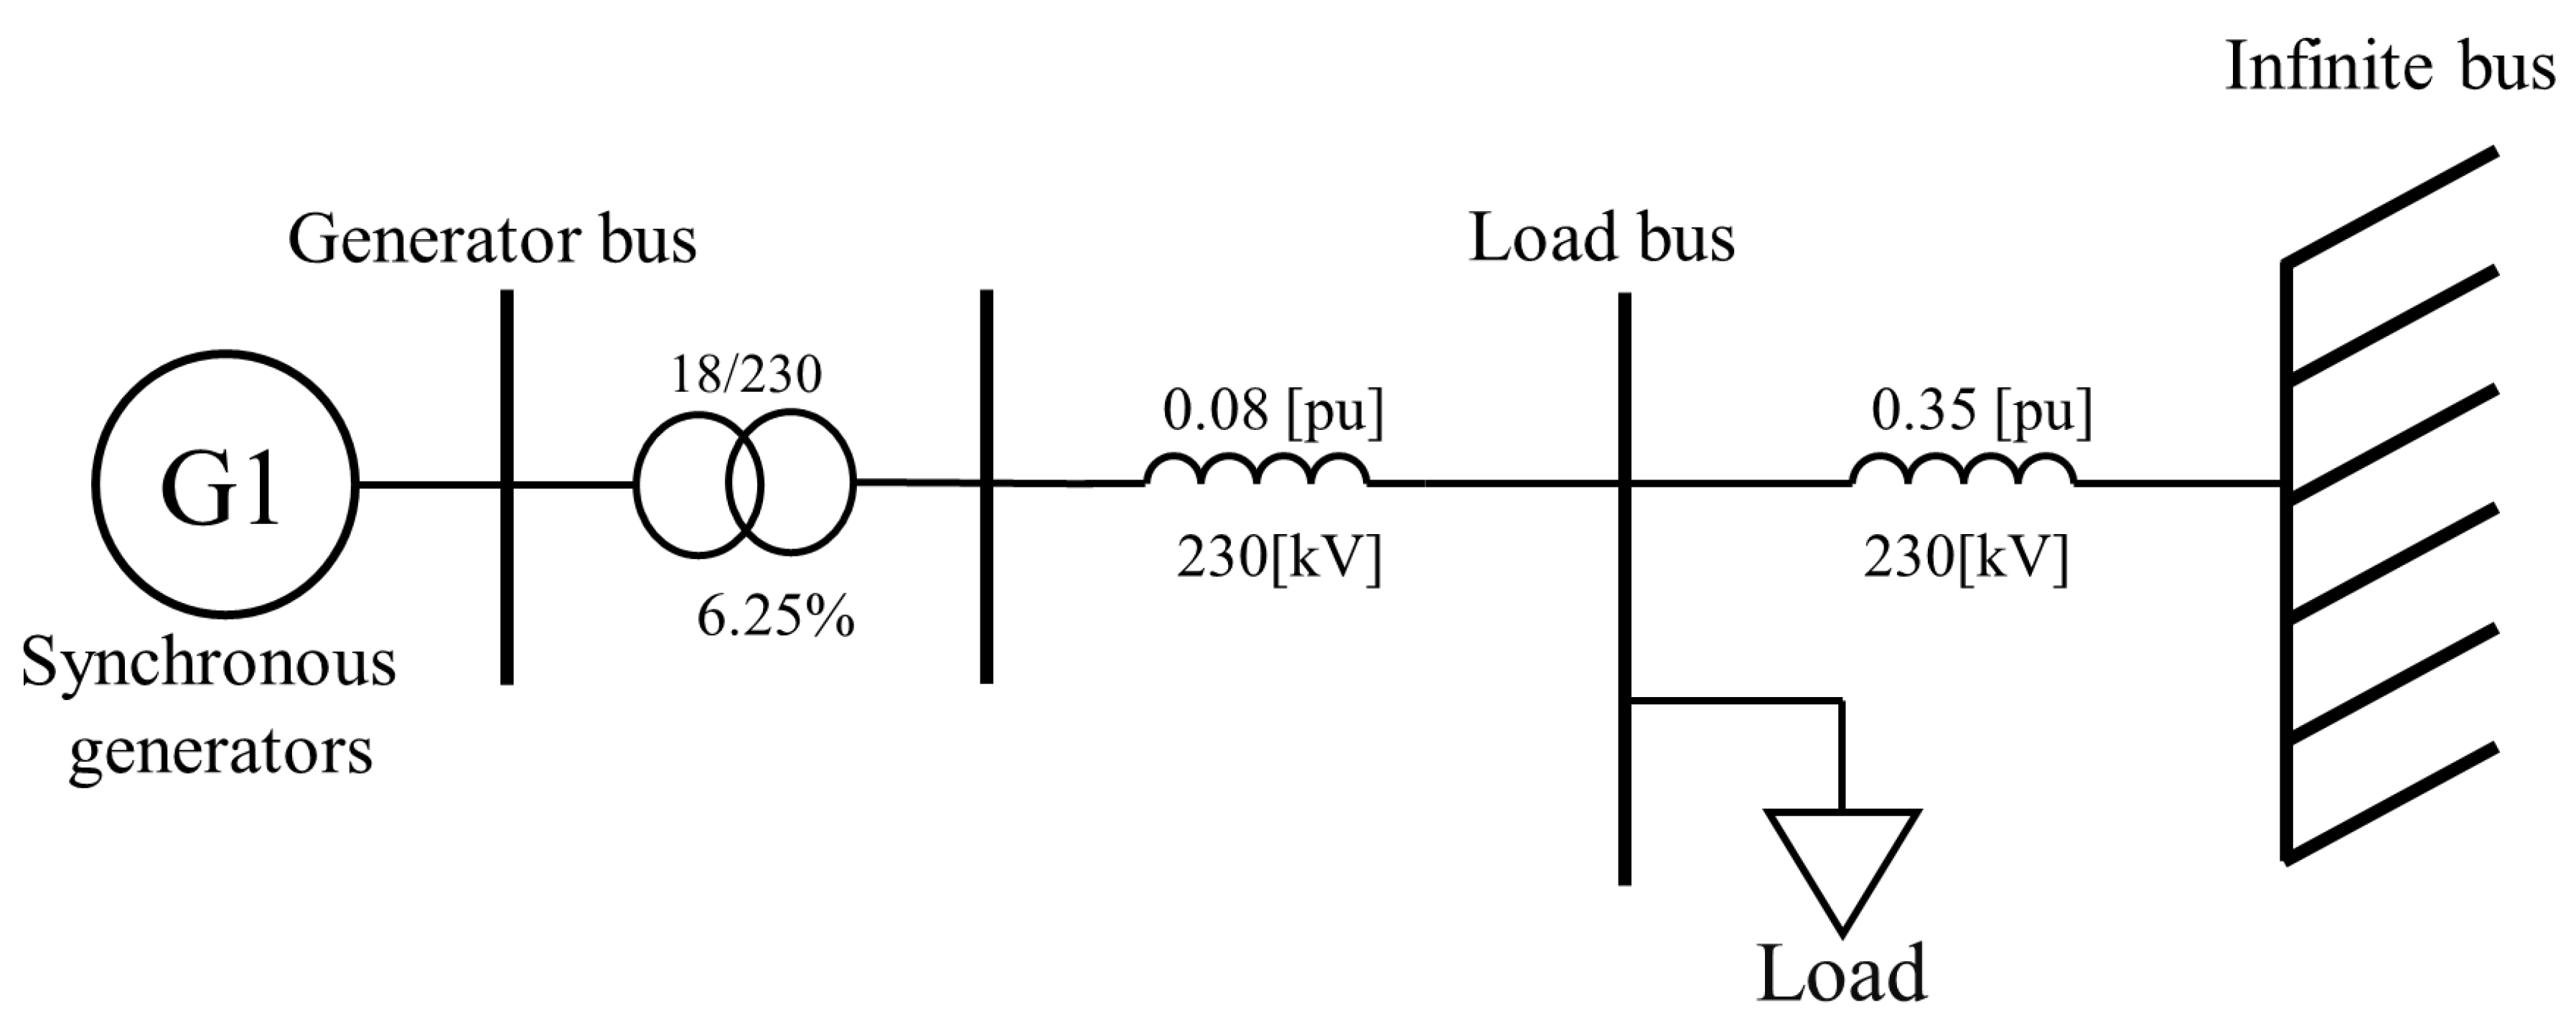
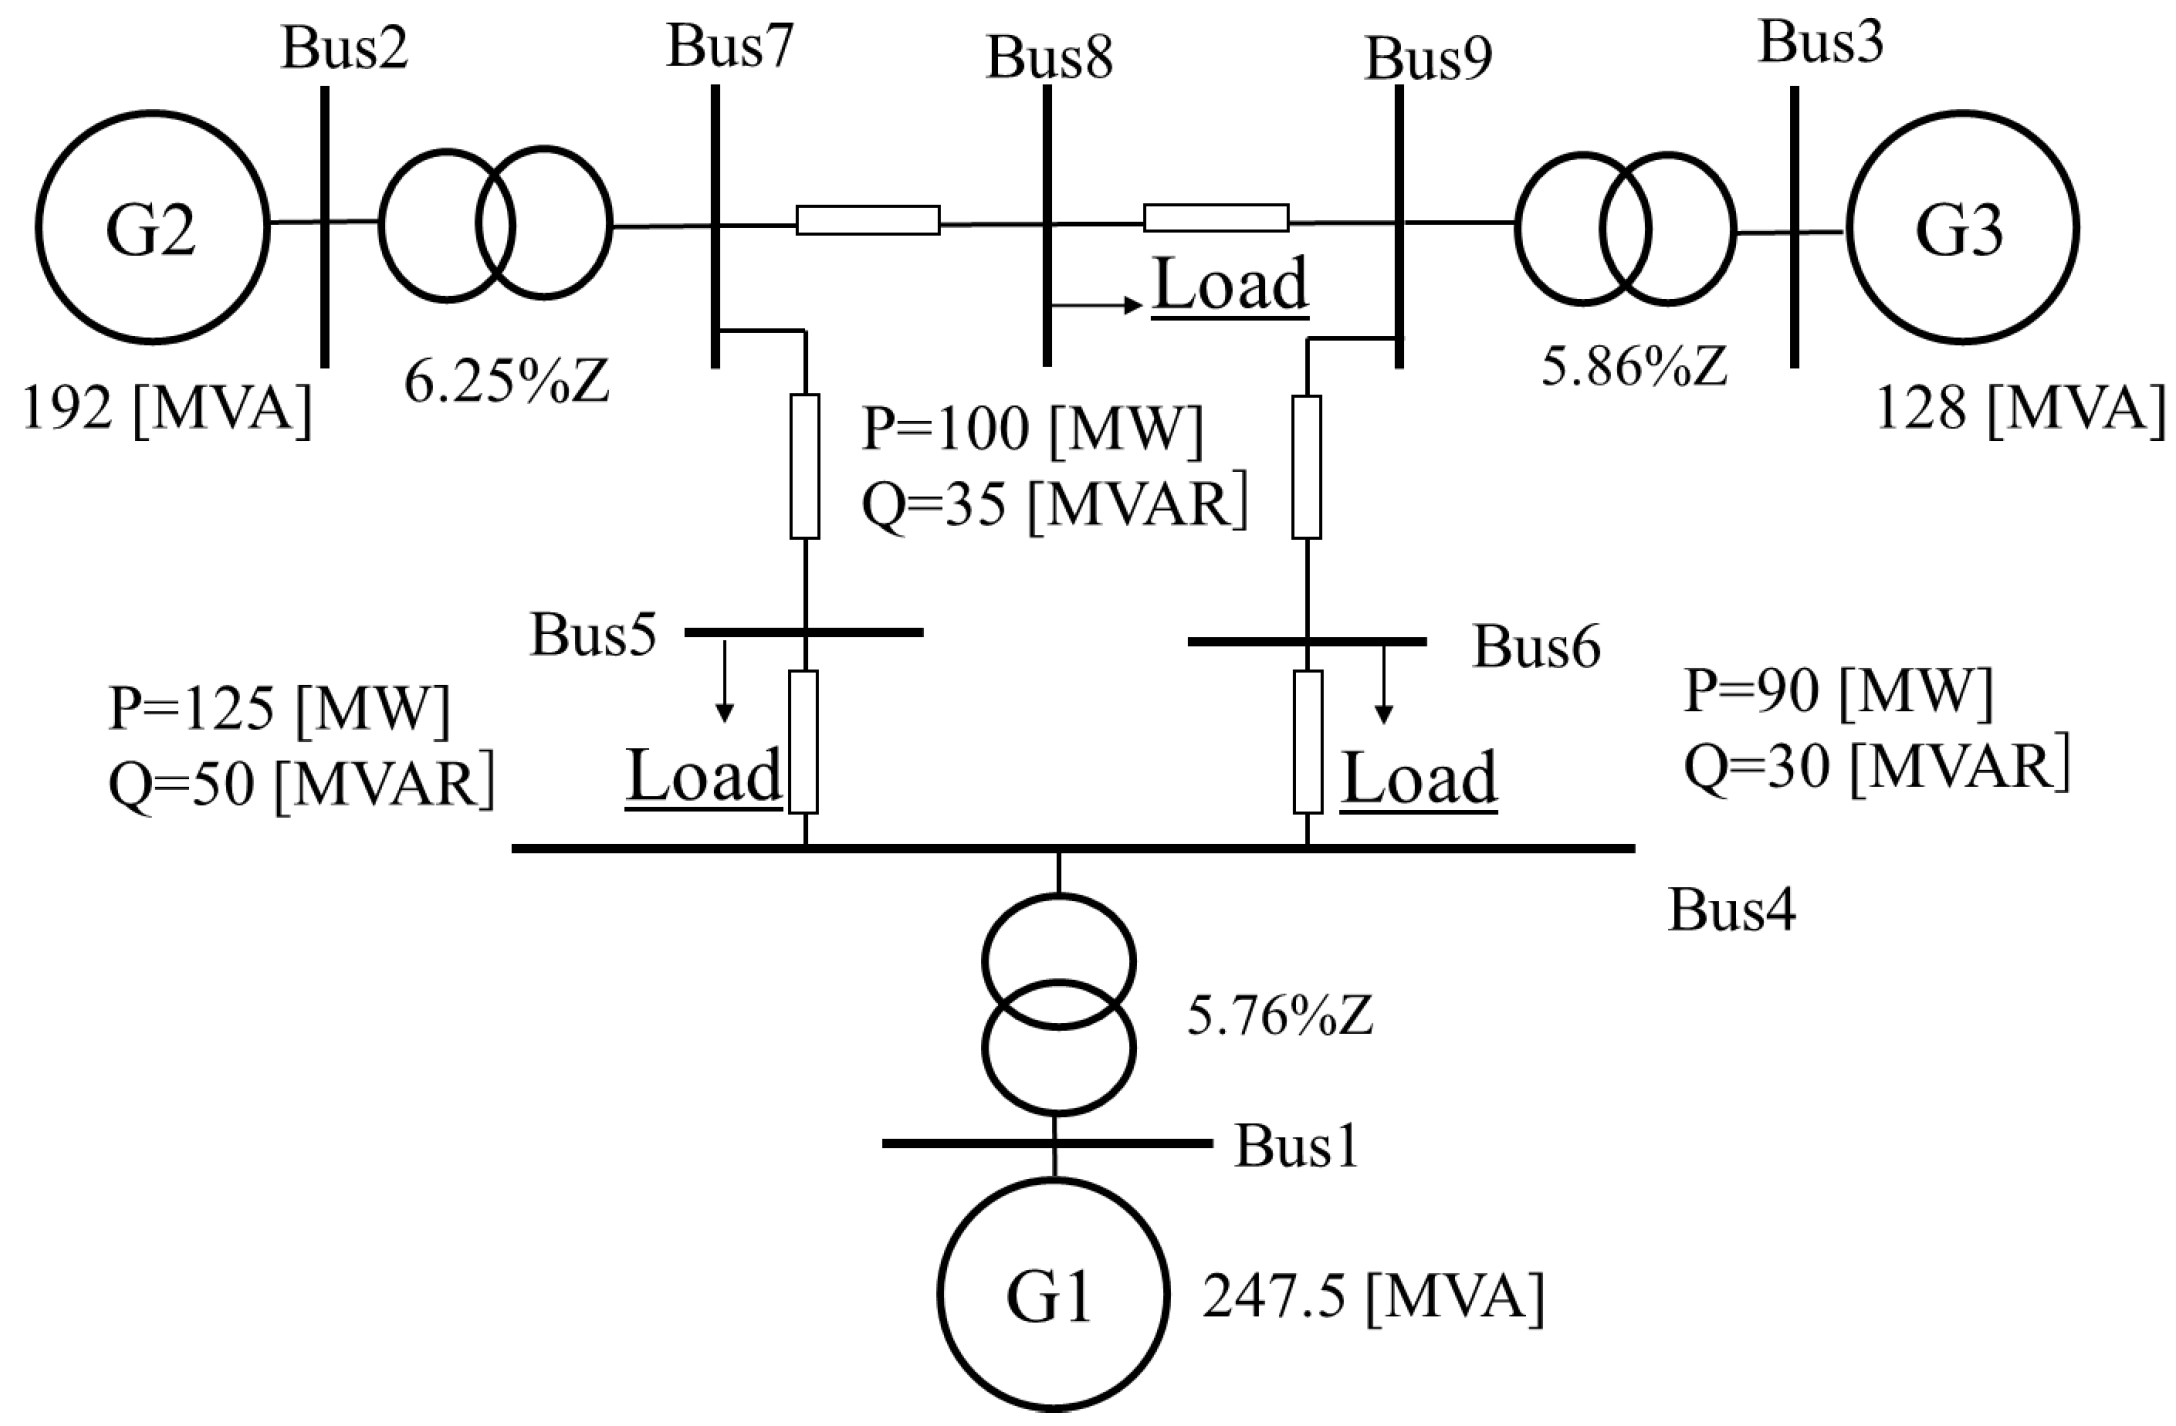
3.3. Test Power System
3.4. Data Generation Method
3.4.1. Initial Load Conditions
3.4.2. Initial Conditions of the Generator
3.4.3. Reactive Power Limit
3.5. Estimation Model Development Method (Conventional Method)
- Voltage magnitude at each bus;
- Phase at each bus (referenced to the swing bus);
- Active and reactive power output of each generator;
- Flow of active and reactive power on each transmission line;
- Active and reactive power at each load bus.
3.6. Estimation Results with the Conventional Method
4. Proposed Methods and Evaluation Results
4.1. Proposed Method
4.1.1. Addition of the RPR Information of the Generator
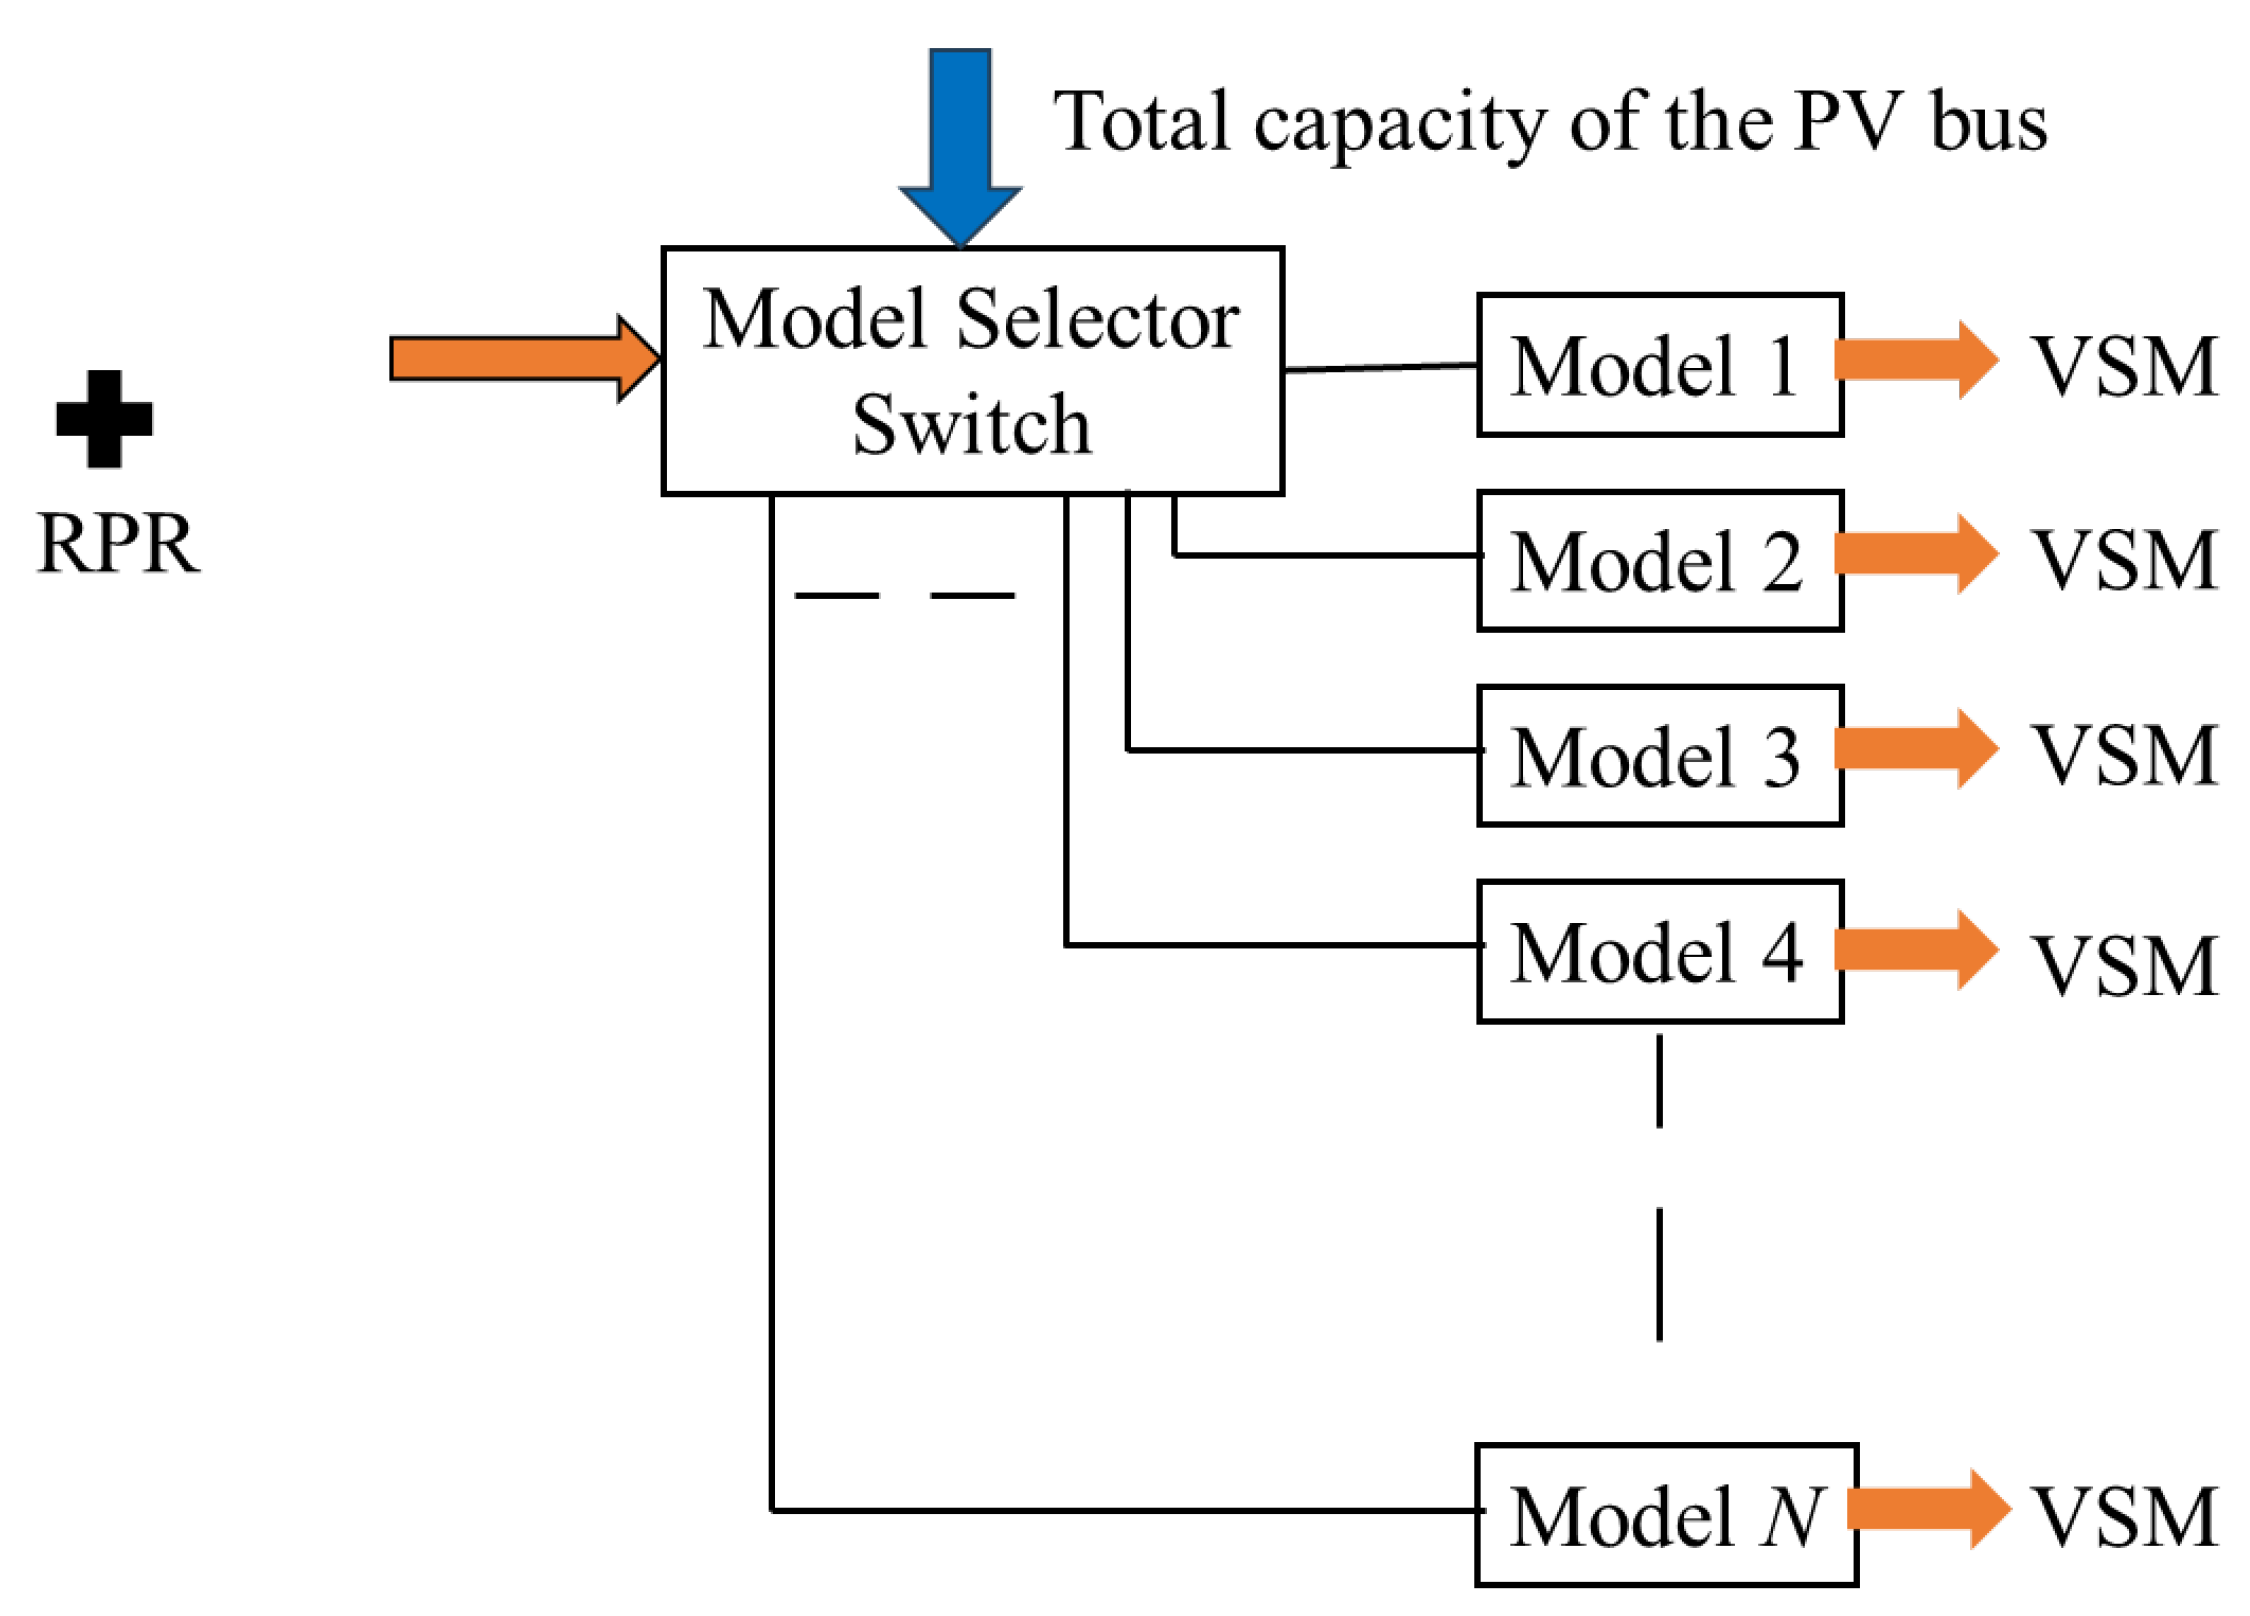
4.1.2. Multiple Estimation Models
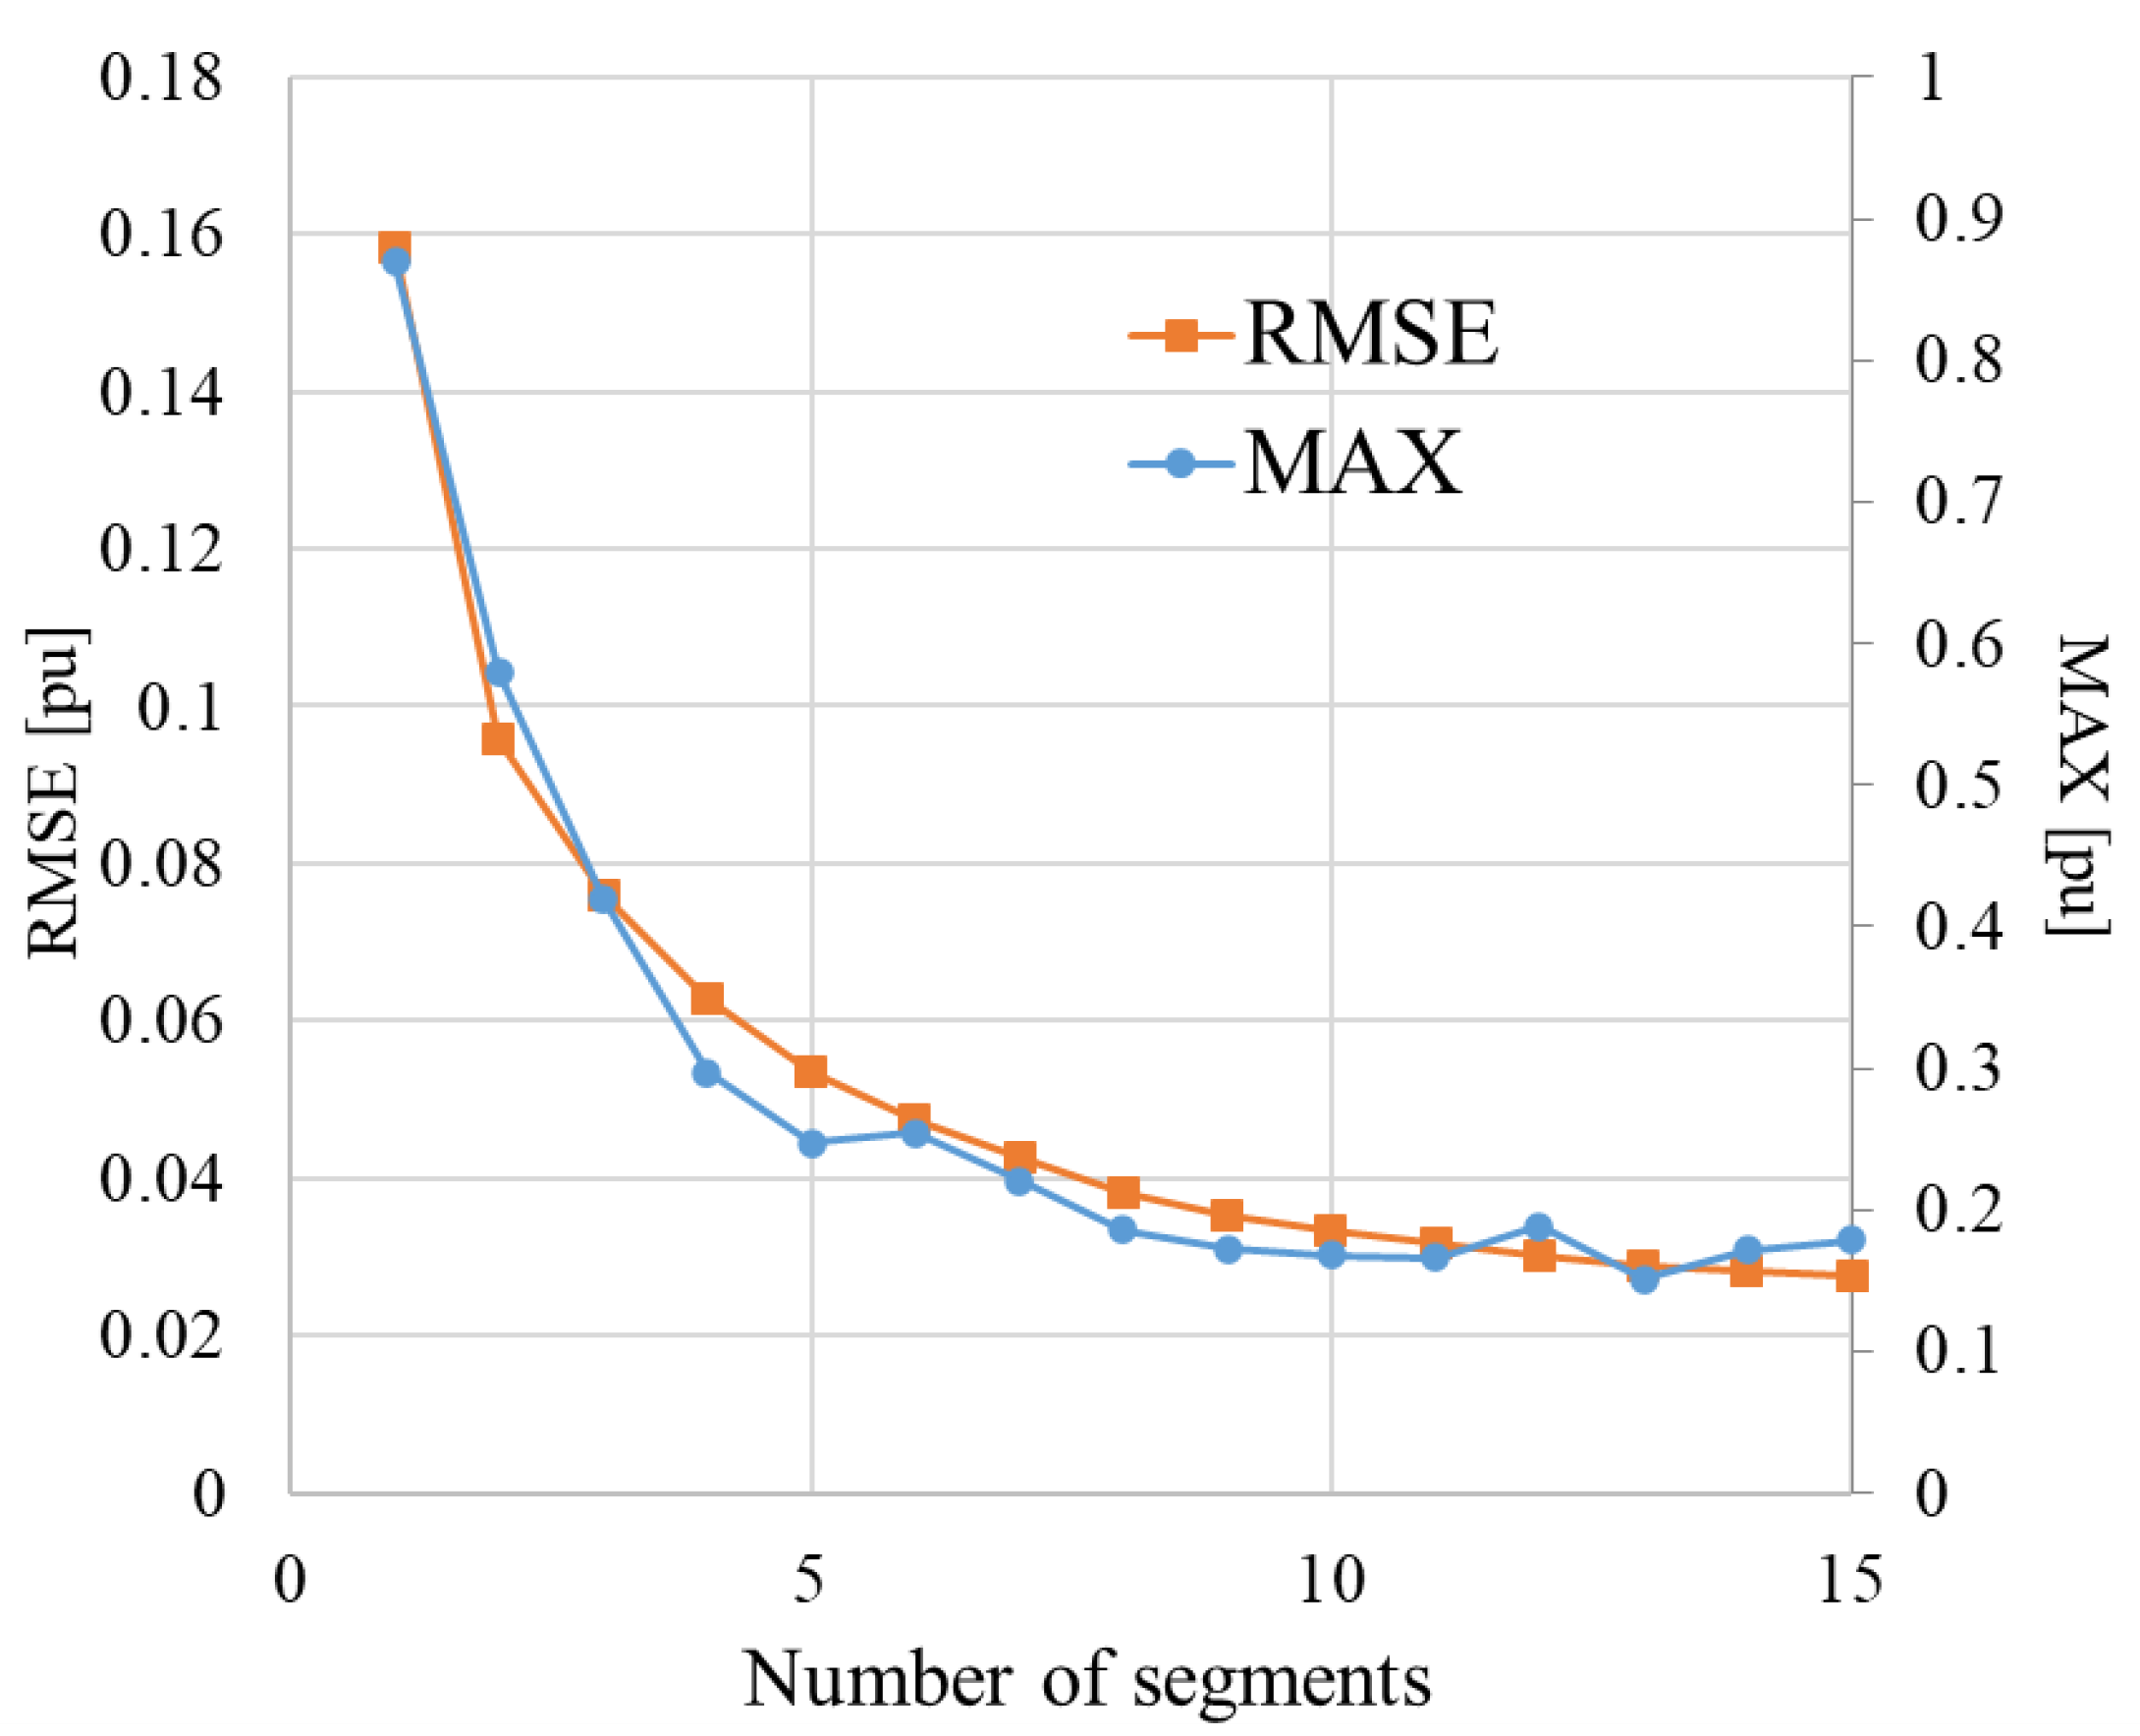
4.2. Optimal Number of Estimation Models
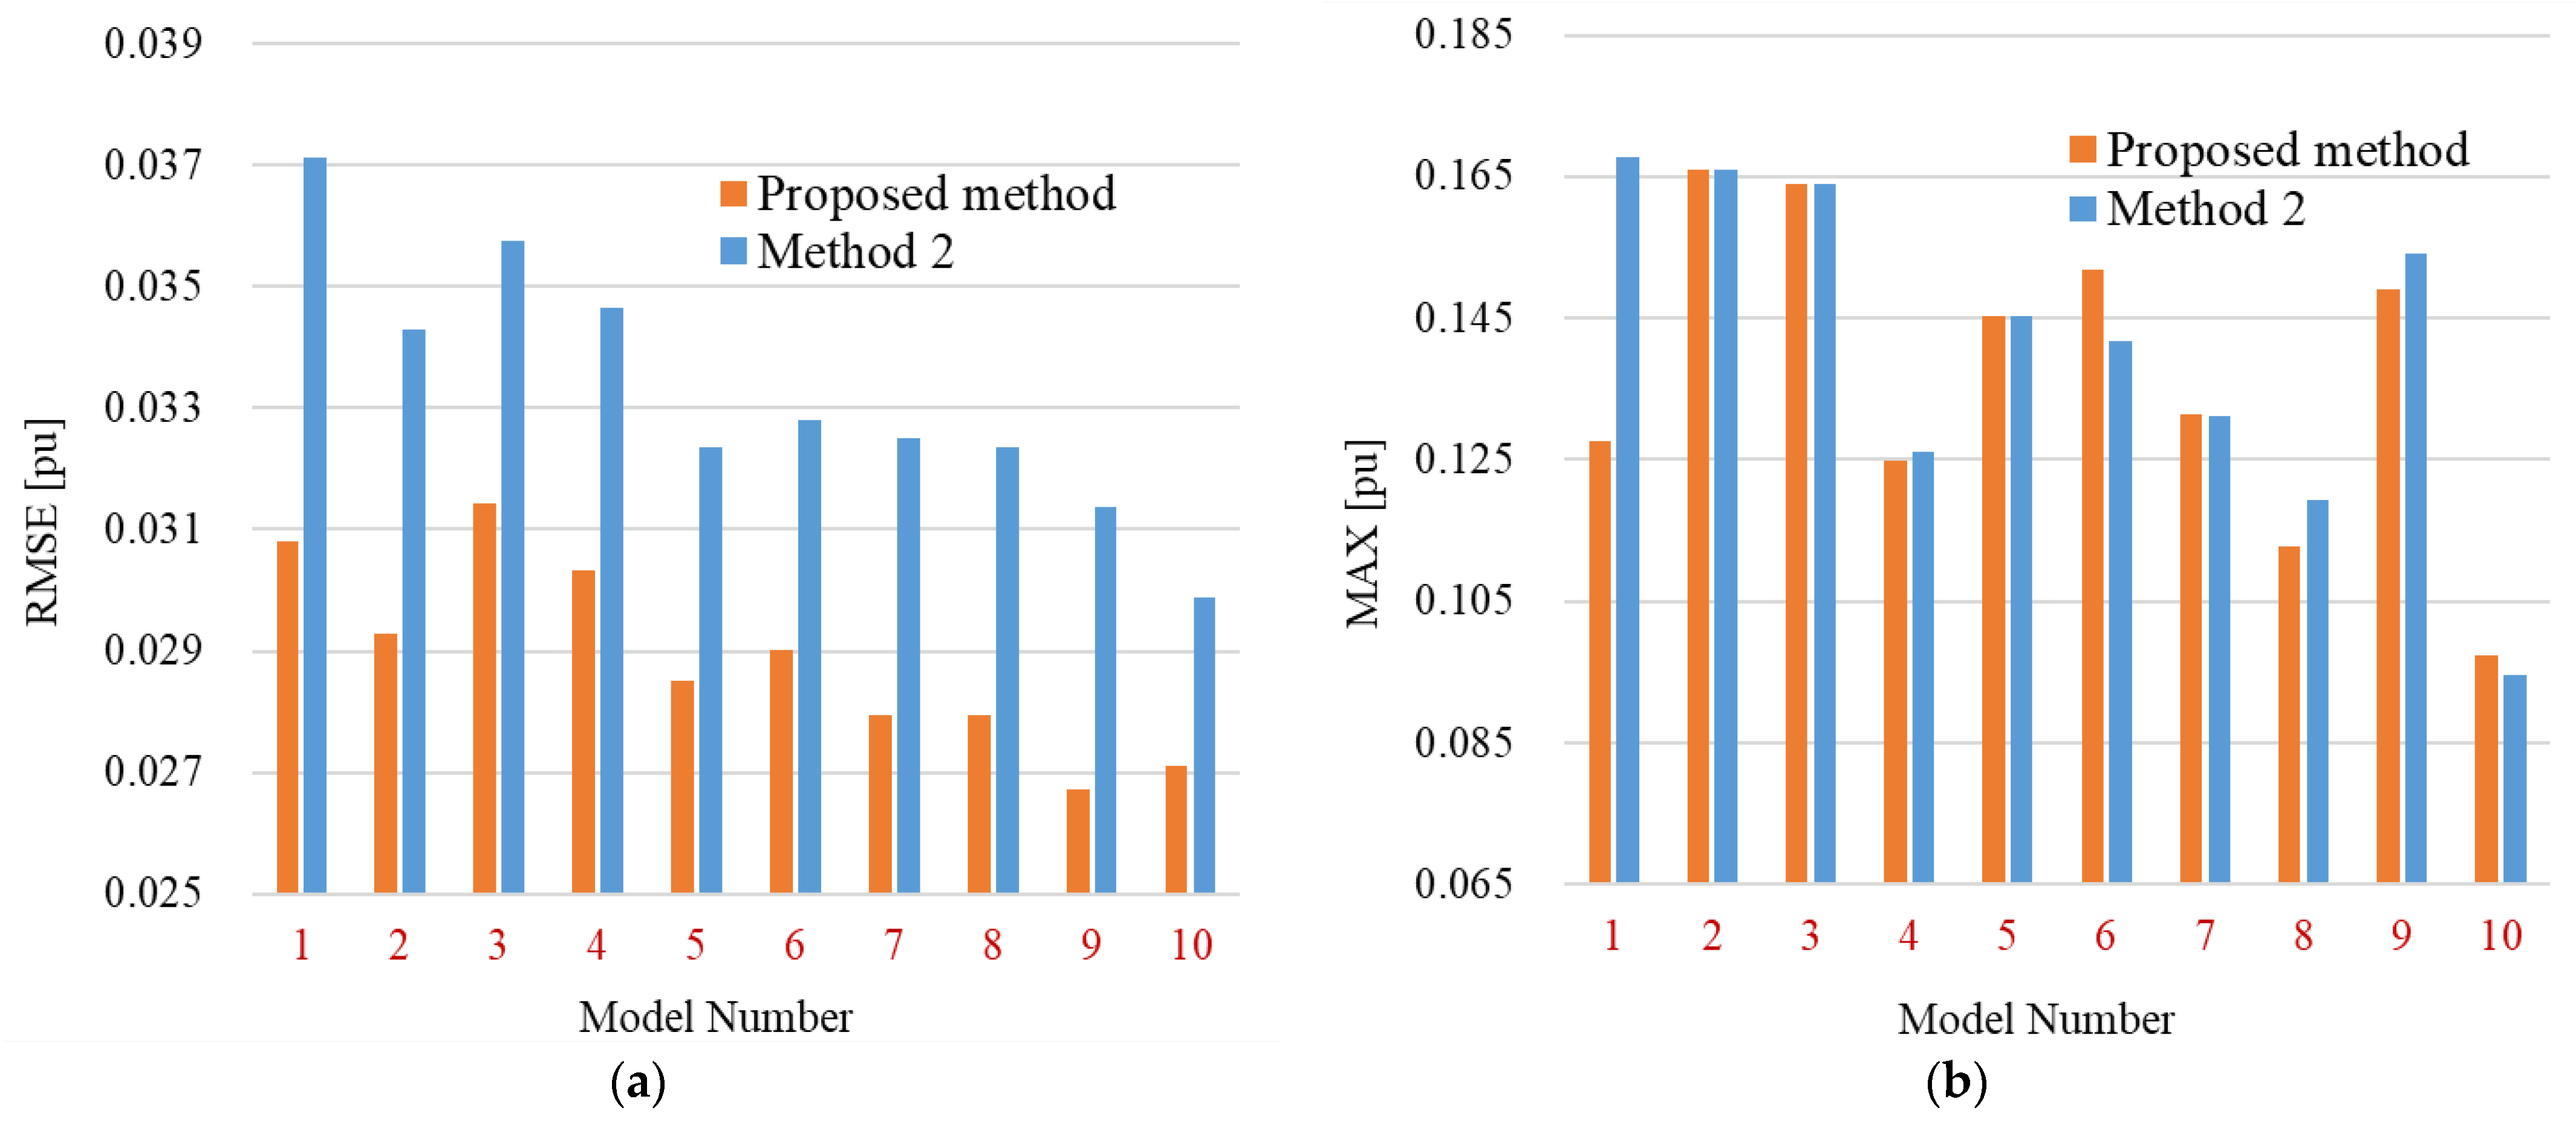
4.3. Evaluation Results
5. Conclusions
Author Contributions
Funding
Data Availability Statement
Conflicts of Interest
References
- Obi, M.; Bass, R. Trends and challenges of grid-connected photovoltaic systems—A review. Renew. Sustain. Energy Rev. 2016, 58, 1082–1094. [Google Scholar] [CrossRef]
- Lasseter, R.H.; Chen, Z.; Pattabiraman, D. Grid-Forming Inverters: A Critical Asset for the Power Grid. IEEE J. Emerg. Sel. Top. Power Electron. 2020, 8, 925–935. [Google Scholar] [CrossRef]
- Ulbige, A.; Botsche, T.S.; Anderson, G. Synchronized phasor measurement applications in power systems. IEEE Trans. Smart Grid 2010, 1, 20–27. [Google Scholar]
- Manousakis, N.M.; Korres, G.N. Optimal allocation of phasor measurement units considering various contingencies and measurement redundancy. IEEE Trans. Instrum. Meas. 2020, 69, 3403–3411. [Google Scholar] [CrossRef]
- Kumar, S.; Tyagi, B.; Kumar, V.; Chohan, S. Incremental PMU placement considering reliability of power system network using analytical hierarchical process. IET Gener. Transm. Distrib. 2018, 12, 3900–3909. [Google Scholar] [CrossRef]
- Kumar, S.; Tyagi, B.; Kumar, V.; Chohan, S. Optimization of phasor measurement units placement under contingency using reliability of network components. IEEE Trans. Instrum. Meas. 2020, 69, 9893–9906. [Google Scholar] [CrossRef]
- Rashidi, M.; Farjah, E. Lyapunov exponent-based optimal PMU placement approach with application to transient stability assessment. IET Sci. Meas. Technol. 2016, 10, 492–497. [Google Scholar] [CrossRef]
- Prasad, S.; Kumar, M.V.D. Trade-offs in PMU and IED deployment for active distribution state estimation using multi-objective evolutionary algorithm. IEEE Trans. Instrum. Meas. 2018, 67, 1298–1307. [Google Scholar] [CrossRef]
- Gao, Q.; Rovnyak, S.M. Decision trees using synchronized phasor measurements for wide-area response-based control. IEEE Trans. Power Syst. 2011, 26, 855–861. [Google Scholar] [CrossRef]
- Zhang, Y.; Xu, Y.; Dong, Z.Y. Robust ensemble data analytics for incomplete PMU measurements-based power system stability assessment. IEEE Trans. Power Syst. 2017, 33, 1124–1126. [Google Scholar] [CrossRef]
- Wei, S.; Yang, M.; Qi, J.; Wang, J.; Ma, S.; Han, X. Model-free MLE estimation for online rotor angle stability assessment with PMU data. IEEE Trans. Power Syst. 2018, 33, 2463–2476. [Google Scholar] [CrossRef]
- Chen, Q.; Bai, J.; Chen, X.; Wang, Y.; Wang, H.; Zhou, Y.; Wang, F.; Dong, N. Analysis of the impact of distributed photovoltaic grid integration on distribution network voltage. In Proceedings of the International Conference on Energy Power and Grid, Guangzhou, China, 22 September 2023. [Google Scholar]
- Iioka, D.; Fujii, T.; Tanaka, T.; Harimoto, T.; Motoyama, J. Voltage reduction in medium voltage distribution systems using constant power factor control of PV PCS. Energies 2020, 13, 5430. [Google Scholar] [CrossRef]
- Ajjarapu, V.; Lee, B. Bibliography on voltage stability. IEEE Trans. Power Syst. 1998, 13, 115–125. [Google Scholar] [CrossRef]
- Taylor, C.W. Power System Voltage Stability; McGraw Hill Education: New York, NY, USA, 1994. [Google Scholar]
- Kundur, P. Power System Stability and Control; McGraw-Hill: New York, NY, USA, 1994. [Google Scholar]
- Tiranuchit, A.; Thomas, R.J. A posturing strategy against voltage instabilities in electric power systems. IEEE Trans. Power Syst. 1988, 3, 87–93. [Google Scholar] [CrossRef]
- Gao, B.; Morison, G.K.; Kundur, P. Voltage stability evaluation using modal analysis. IEEE Trans. Power Syst. 1992, 7, 1529–1542. [Google Scholar] [CrossRef]
- Ajjarapu, V.; Christy, C. The continuation power flow: A tool for steady state voltage stability analysis. IEEE Trans. Power Syst. 1992, 7, 416–423. [Google Scholar] [CrossRef]
- Chiang, H.-D.; Flueck, A.J.; Shah, K.S.; Balu, N. CPFLOW: A practical tool for tracing power system steady-state stationary behavior due to load and generation variations. IEEE Trans. Power Syst. 1995, 10, 623–634. [Google Scholar] [CrossRef]
- Lee, C.-Y.; Tsai, S.-H.; Wu, Y.-K. A new approach to the assessment of steady-state voltage stability VSMs using the P–Q–V curve. Int. J. Electr. Power Energy Syst. 2010, 32, 1091–1098. [Google Scholar] [CrossRef]
- Kojima, T.; Mori, H. Continuation power flow with variable-step variable-order nonlinear predictor. IEEJ Trans. Power Energy 2006, 6, 611–618. [Google Scholar] [CrossRef]
- Su, H.-Y.; Liu, T.-Y. Enhanced-online-random-forest model for static voltage stability assessment using wide area measurements. IEEE Trans. Power Syst. 2018, 33, 6696–6704. [Google Scholar] [CrossRef]
- Dharmapal, K.D.; Rajapakse, A.; Narendra, K.; Zhang, Y. Machine learning based real-time monitoring of long-term voltage stability using voltage stability indices. IEEE Access 2020, 8, 222544–222555. [Google Scholar] [CrossRef]
- Sajan, K.S.; Kumar, V.; Tyagi, B. Genetic algorithm based support vector machine for on-line voltage stability monitoring. Int. J. Electr. Power Energy Syst. 2015, 73, 200–208. [Google Scholar] [CrossRef]
- Dinavahi, V.R.; Srivastava, S.C. ANN based voltage stability margin prediction. In Proceedings of the 2001 Poarengineering Society Summer Meeting, Conference Proceedings (Cat. No. 01CH37262), Vancouver, BC, Canada, 15–19 July 2001; pp. 1275–1280. [Google Scholar]
- Chakrabarti, S.; Jeyasurya, B. On-line voltage stability monitoring using artificial neural network. In Proceedings of the 2004 Large Engineering Systems Conference on Poarengineering (IEEE Cat. No. 04EX819), Halifax, NS, Canada, 28–30 July 2004; pp. 71–75. [Google Scholar]
- Zhou, D.Q.; Annakkage, U.D.; Rajapakse, A.D. Online monitoring of voltage stability margin using an artificial neural network. IEEE Trans. Power Syst. 2010, 25, 1566–1574. [Google Scholar]
- Ishibashi, N.; Mori, H. Estimating load margin saddle node point of voltage stability with hybrid intelligent system. IEEJ Trans. Power Energy 2009, 129, 1546–1552. [Google Scholar] [CrossRef]
- Hashemi, S.; Aghamohammadi, M.R. Wavelet based feature extraction of voltage profile for online voltage stability assessment using RBF neural network. Int. J. Electr. Power Energy Syst. 2013, 49, 86–94. [Google Scholar] [CrossRef]
- Kumar, S.; Tyagi, B.; Kumar, V.; Chohan, S. PMU-based voltage stability measurement under contingency using ANN. IEEE Trans. Instrum. Meas. 2022, 71, 1–11. [Google Scholar] [CrossRef]
- Gao, H.; Hong, H. Mechanism enhanced data-driven method for reliability improvement of load margin estimation. IEEE Trans. Power Syst. 2024, 39, 3715–3724. [Google Scholar] [CrossRef]
- Sue, H.; Wang, L. An Intelligent Data-Driven Learning Approach to Enhance Online Probabilistic Voltage Stability Margin Prediction. IEEE Trans. Power Syst. 2021, 36, 3790–3793. [Google Scholar] [CrossRef]
- Zheng, C.; Malbasa, V.; Kezunovic, M. Regression tree for stability margin prediction using synchrophasor measurements. IEEE Trans. Power Syst. 2013, 28, 1978–1987. [Google Scholar] [CrossRef]
- Jia, H.; Hou, Q.; Yong, P.; Liu, Y.; Zhang, N.; Liu, D.; Hou, M. Voltage stability constrained operation optimization: An ensemble sparse oblique regression tree method. IEEE Trans. Power Syst. 2024, 39, 160–171. [Google Scholar] [CrossRef]
- Vanfretti, L.; Arava, V.S.N. Decision tree-based classification of multiple operating conditions for power system voltage stability assessment. Int. J. Electr. Power Energy Syst. 2020, 123, 106251. [Google Scholar] [CrossRef]
- Cai, G.; Gao, H.; Yang, D.; Wang, L. Synchrophasor-Based Online Load Margin Estimation Using Incremental Learning Assisted LightGBM in Smart Grid. IEEE Syst. J. 2023, 17, 4660–4670. [Google Scholar] [CrossRef]
- Miyazaki, M.; Aoki, M.; Nakamura, Y.; Verma, S.C. A study of voltage stability estimation method system with low share of synchronous generators. In Proceedings of the International Council on Electrical Engineering, Kitakyushu, Japan, 30 June–4 July 2024; p. O-050. [Google Scholar]
- Leonardi, B.; Ajjarapu, V. An approach for real time voltage stability margin control via reactive power reserve sensitivities. IEEE Trans. Power Syst. 2013, 28, 615–625. [Google Scholar] [CrossRef]
- Capitanescu, F. Assessing reactive power reserves with respect to operating limitations and voltage stability. IEEE Trans. Power Syst. 2011, 26, 2224–2234. [Google Scholar] [CrossRef]
- Milano, F. An open source power system analysis toolbox. IEEE Trans. Power Syst. 2005, 20, 1199–1206. [Google Scholar] [CrossRef]


| X [MVA] | Y [MVA] | Z [MVA] | |
|---|---|---|---|
| Maximum value | 495.0 | 384.0 | 256.0 |
| Minimum value | 247.5 | 192.0 | 128.0 |
| Model Number | Range [MVA] | Model Number | Range [MVA] |
|---|---|---|---|
| Model 1 | 320–352 | Model 6 | 480–512 |
| Model 2 | 352–384 | Model 7 | 512–544 |
| Model 3 | 384–416 | Model 8 | 544–576 |
| Model 4 | 416–448 | Model 9 | 576–608 |
| Model 5 | 448–480 | Model 10 | 608–640 |
| Addition of RPR Information of Generator | Multiple Estimation Models | |
|---|---|---|
| Method 1 | Applied | Not applied |
| Method 2 | Not applied | Applied |
| Proposed method | Applied | Applied |
| CPU Time | |
|---|---|
| Proposed method | 0.13 μs |
| CPF | 0.361 s |
Disclaimer/Publisher’s Note: The statements, opinions and data contained in all publications are solely those of the individual author(s) and contributor(s) and not of MDPI and/or the editor(s). MDPI and/or the editor(s) disclaim responsibility for any injury to people or property resulting from any ideas, methods, instructions or products referred to in the content. |
© 2025 by the authors. Licensee MDPI, Basel, Switzerland. This article is an open access article distributed under the terms and conditions of the Creative Commons Attribution (CC BY) license (https://creativecommons.org/licenses/by/4.0/).
Share and Cite
Miyazaki, M.; Aoki, M.; Nakamura, Y. Voltage Stability Estimation Considering Variability in Reactive Power Reserves Using Regression Trees. Energies 2025, 18, 1260. https://doi.org/10.3390/en18051260
Miyazaki M, Aoki M, Nakamura Y. Voltage Stability Estimation Considering Variability in Reactive Power Reserves Using Regression Trees. Energies. 2025; 18(5):1260. https://doi.org/10.3390/en18051260
Chicago/Turabian StyleMiyazaki, Masato, Mutsumi Aoki, and Yuta Nakamura. 2025. "Voltage Stability Estimation Considering Variability in Reactive Power Reserves Using Regression Trees" Energies 18, no. 5: 1260. https://doi.org/10.3390/en18051260
APA StyleMiyazaki, M., Aoki, M., & Nakamura, Y. (2025). Voltage Stability Estimation Considering Variability in Reactive Power Reserves Using Regression Trees. Energies, 18(5), 1260. https://doi.org/10.3390/en18051260