1. Introduction
Photovoltaic (PV) solar energy is an increasingly prominent method of energy generation worldwide. According to the International Energy Agency (IEA), global renewable energy capacity increased by approximately 507 GW in 2023—nearly 50% higher than the previous year [
1]. In Brazil, this growth is evident through the rising number of PV modules installed across various regions.
A significant portion of this growth in Brazilian territory can be attributed to policies and incentives established through regulations overseen by the National Electric Energy Agency (ANEEL). The agency began this process with Normative Resolution (RN) No. 482 [
2], which has since undergone several updates, culminating in the current version, RN No. 1098, issued on 23 July 2024 [
3].
When deciding to install a PV system, consumers should consider factors beyond regulations and initial operational conditions. Environmental factors, which contribute to the natural electrical wear of the equipment [
4], are critical variables that affect the performance and longevity of any electrical component.
The module is a key component of a PV project, responsible for capturing solar radiation and converting it into electrical energy. Primarily made of semiconductor materials, the module features a multilayer structure [
5], organized as follows:
Front cover: made of resistant and transparent glass, it has the function of protecting against the external action of the environment;
Encapsulation: made of Ethylene-Vinyl Acetate (EVA), consisting of a double layer of insulation on the front and back, which coats and insulates the semiconductor material [
5];
PV cells: responsible for converting solar radiation into electricity through the photoelectric effect. Made of a semiconductor material, silicon, with monocrystalline, polycrystalline, or even a thin film structure, its terminals are interconnected by metallic conductors of copper, aluminum, or silver [
6];
Rear cover: lower layer of the modules with low thermal resistance for support purposes, made of polymer or acrylic;
Junction box: electrical connection point for PV cells for the purpose of connection or association with other electrical points in the system.
The estimated useful life of a PV module is typically around 25 years. By the end of this period, its efficiency is expected to decrease by approximately 15%, depending on the manufacturer and the specific technology used [
7,
8]. However, this level of energy conversion efficiency is achieved only under conditions favorable to energy production. The efficiency testing of PV modules adheres to the standards set by IEC 61730-2 [
9], which include evaluating electroluminescence (EL) to simulate conditions such as humidity and infrared (IR) exposure. These tests account for various temperature scenarios and assess factors like hot spots and light-induced degradation (LID).
The installation environment plays a crucial role in energy generation, and accurately assessing its impact on the PV module is essential for ensuring reliability, component integrity, safety during installation and use, as well as maximizing return on investment. Key environmental factors that contribute to losses and negatively affect productivity include variations in solar radiation, high operating temperatures of the modules, humidity, and the dust accumulation on the PV modules [
4,
10].
To illustrate the research data, the Tesla Experimental Photovoltaic Plant was used to demonstrate the effects of dirt, as the plant is strategically positioned for study due to its proximity to mining operations in neighboring cities and the urban nature of its own location. According to 2022 data from the Brazilian Institute of Geography and Statistics (IBGE) [
11], Belo Horizonte is the sixth most populous municipality in the country.
It is estimated that there are regions where dirt, either directly or indirectly, causes losses of approximately 4–5% in just the year 2023 [
12]. Therefore, given the initial context in which a photovoltaic module is tested and exposed to the environment throughout its useful life—often undergoing minimal maintenance—this study aims to investigate the impact of dirt and its effects on a system over the years. For this purpose, the Tesla Experimental Photovoltaic Plant, operational since 2016, was used as the object of study.
The main contributions of this paper are:
To use the TESLA Experimental Photovoltaic Plant as a case study to elucidate the effects that the environment, particularly dirt, can have on a photovoltaic system exposed over the years without proper maintenance.
To present a qualitative analysis of the photovoltaic modules studied to identify and validate the impact of dirt, thereby strengthening the reference literature for subsequent studies.
To demonstrate, through quantitative analysis, the large-scale benefits of cleaning, as well as to determine the appropriate intervals for periodic maintenance, aiming to ensure the optimal performance of the system.
This paper is organized into the following sections:
Section 2 provides a theoretical overview of loss factors, with a particular focus on dust accumulation, which is the main subject of this research and is further explored in the following section.
Section 3 discusses the system under study and the methodology used for analysis.
Section 4 presents the results obtained, followed by a discussion of these findings in
Section 5. Finally,
Section 6 offers the conclusion, summarizing the key takeaways from the study.
2. Analysis of Environmental Factors in PV Panels
In this paper, dirt is defined as the accumulation of particulate matter on PV modules, also referred to as dust accumulation. This buildup directly impacts electrical performance by continuously interfering with the absorption, scattering, and/or reflection of solar radiation. As a result, it reduces the amount of solar energy effectively absorbed by the PV module [
13,
14].
Research on this topic began in 1942 in the United States, when Hottel and Woertz linked the dust accumulation on solar collectors to a decrease in electrical performance. After three months of study, they estimated a performance drop of 4.7% due to soiling [
15].
The production of electrical energy from PV modules is primarily influenced by temperature and solar irradiation. Ideal operating conditions are defined by standards and manufacturers, typically set at a PV cell temperature of 25 °C, an air mass of 1.5 AM, and a solar irradiation of 1000 W/m
2 [
16]. However, due to environmental variability, maintaining these conditions consistently throughout the entire operational period is not possible.
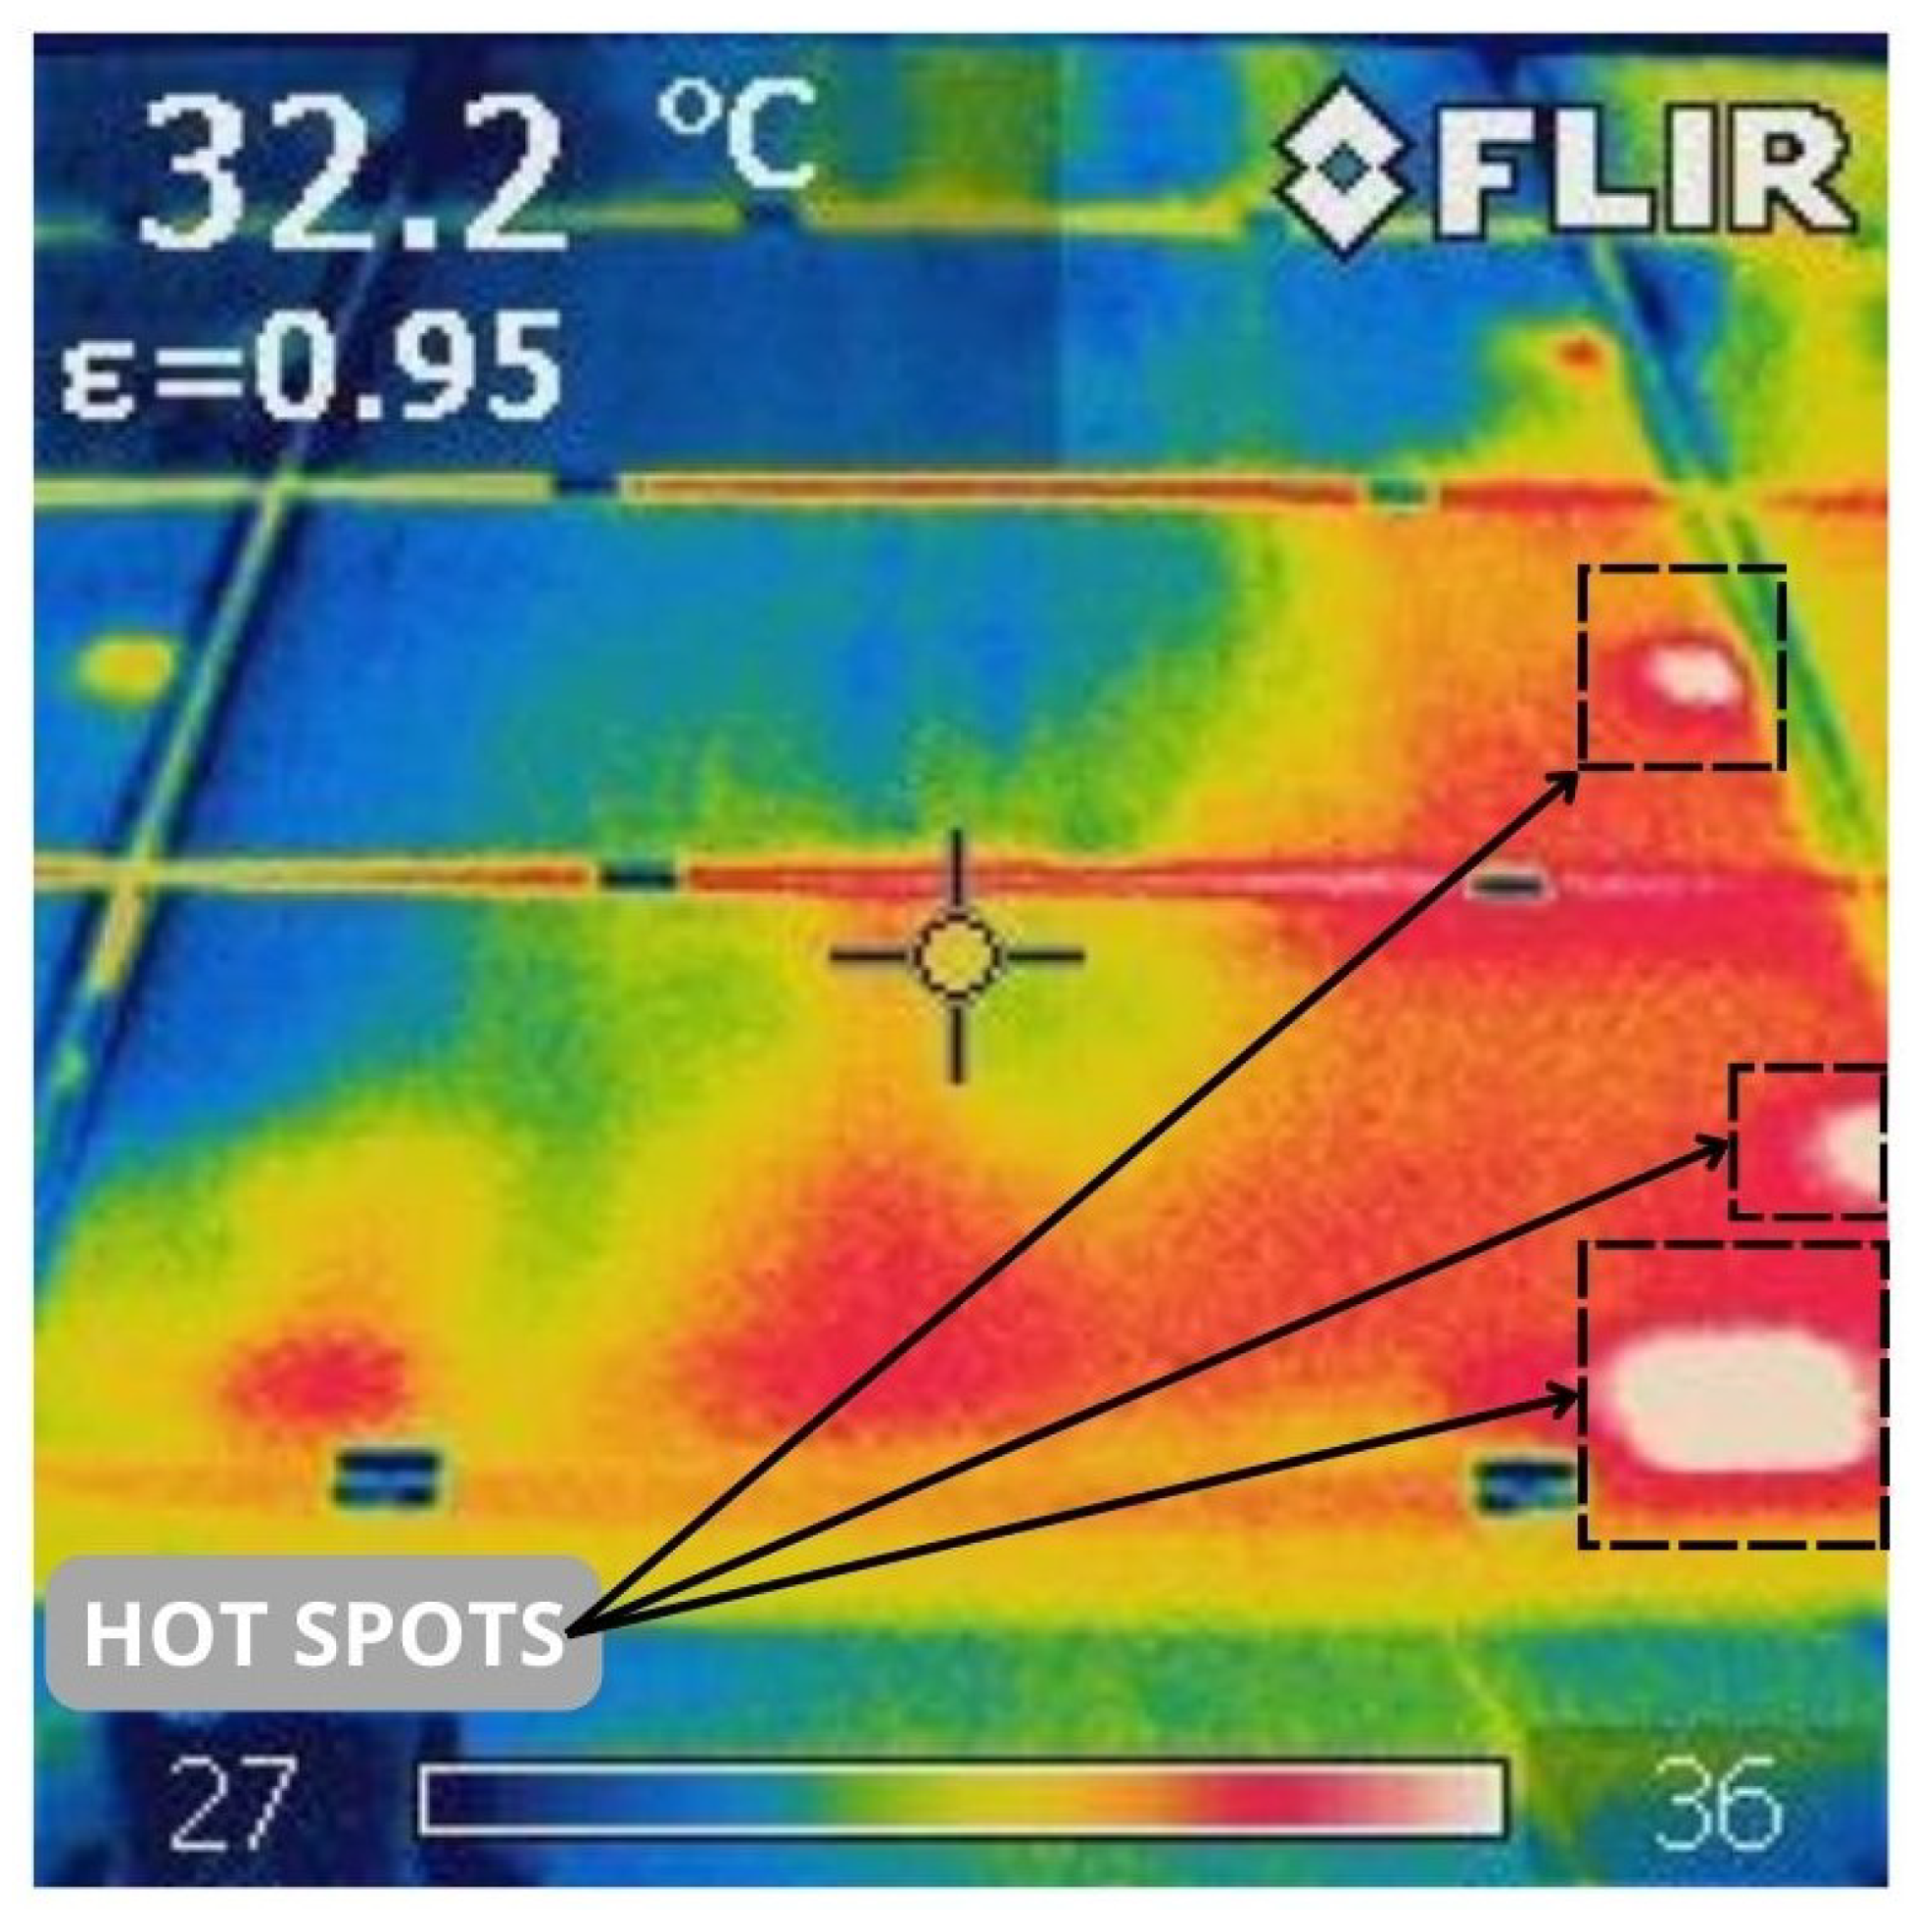
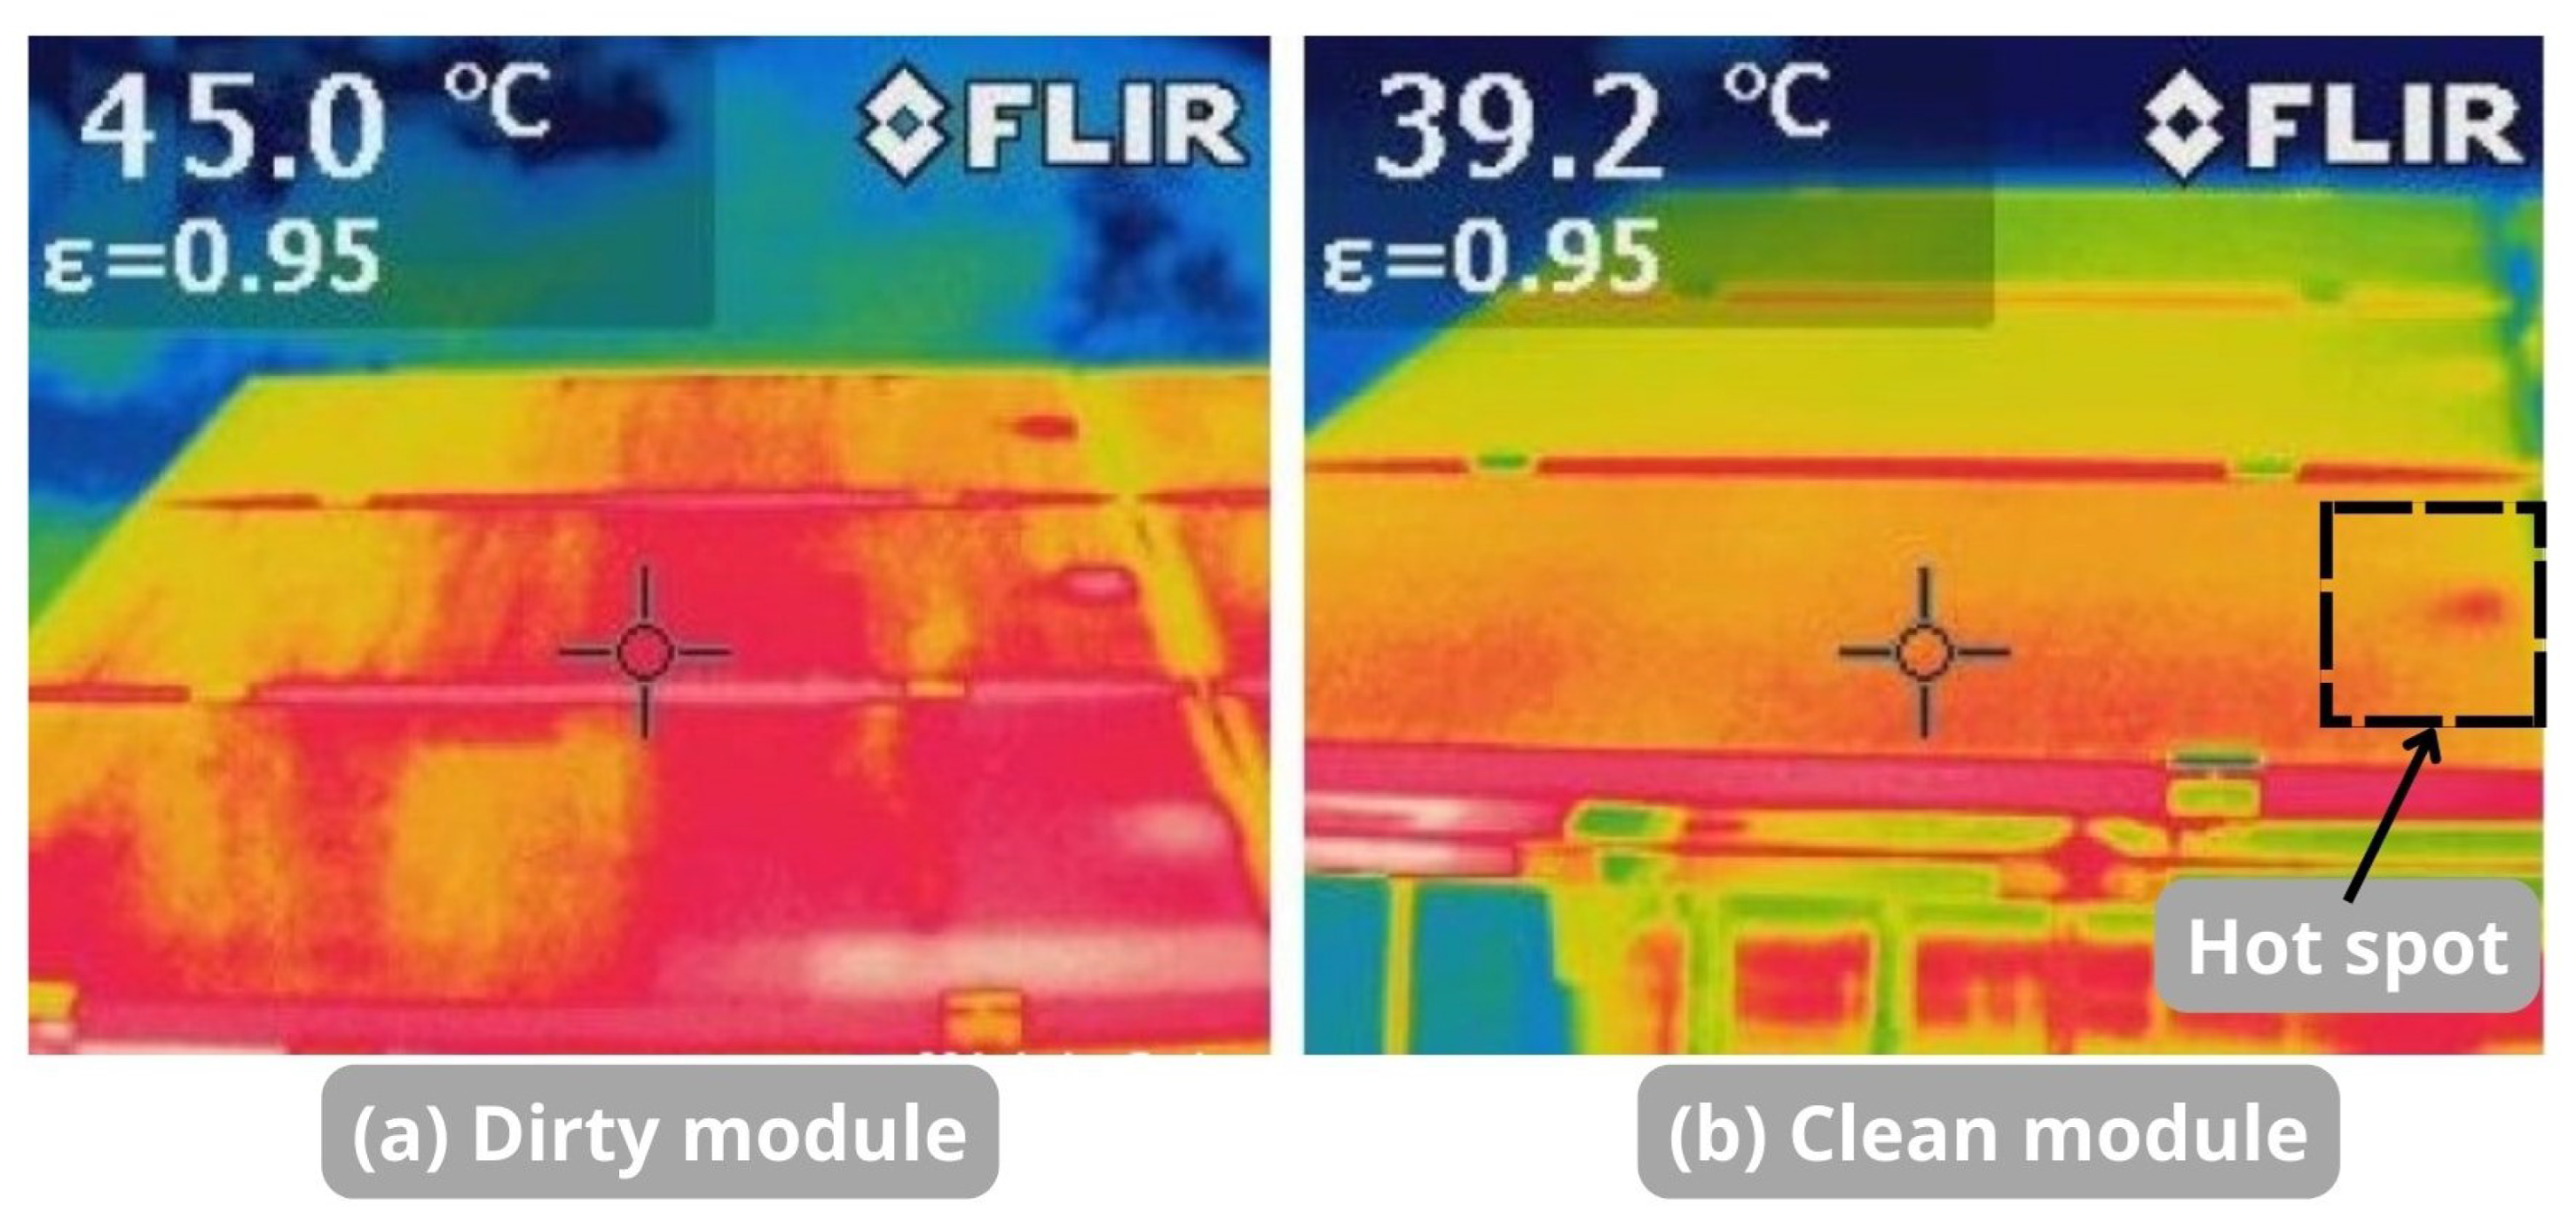
Dirt accumulation on the modules is a variable that progressively reduces the efficiency of the system’s electrical energy generation. This accumulation can also cause irreversible damage, such as accelerating the formation of hot spots, which may lead to the burning of internal module components [
17,
18]. An illustration of this effect is presented in
Figure 1, where the lighter areas highlight regions with higher temperatures compared to the cooler, darker areas in blue. These variations occur within a module exposed to identical irradiance conditions [
19]. Furthermore, the figure qualitatively demonstrates the distribution of dirt on the module. Prolonged exposure to rain and wind results in non-uniform dust accumulation, particularly concentrated at the right and lower edges.
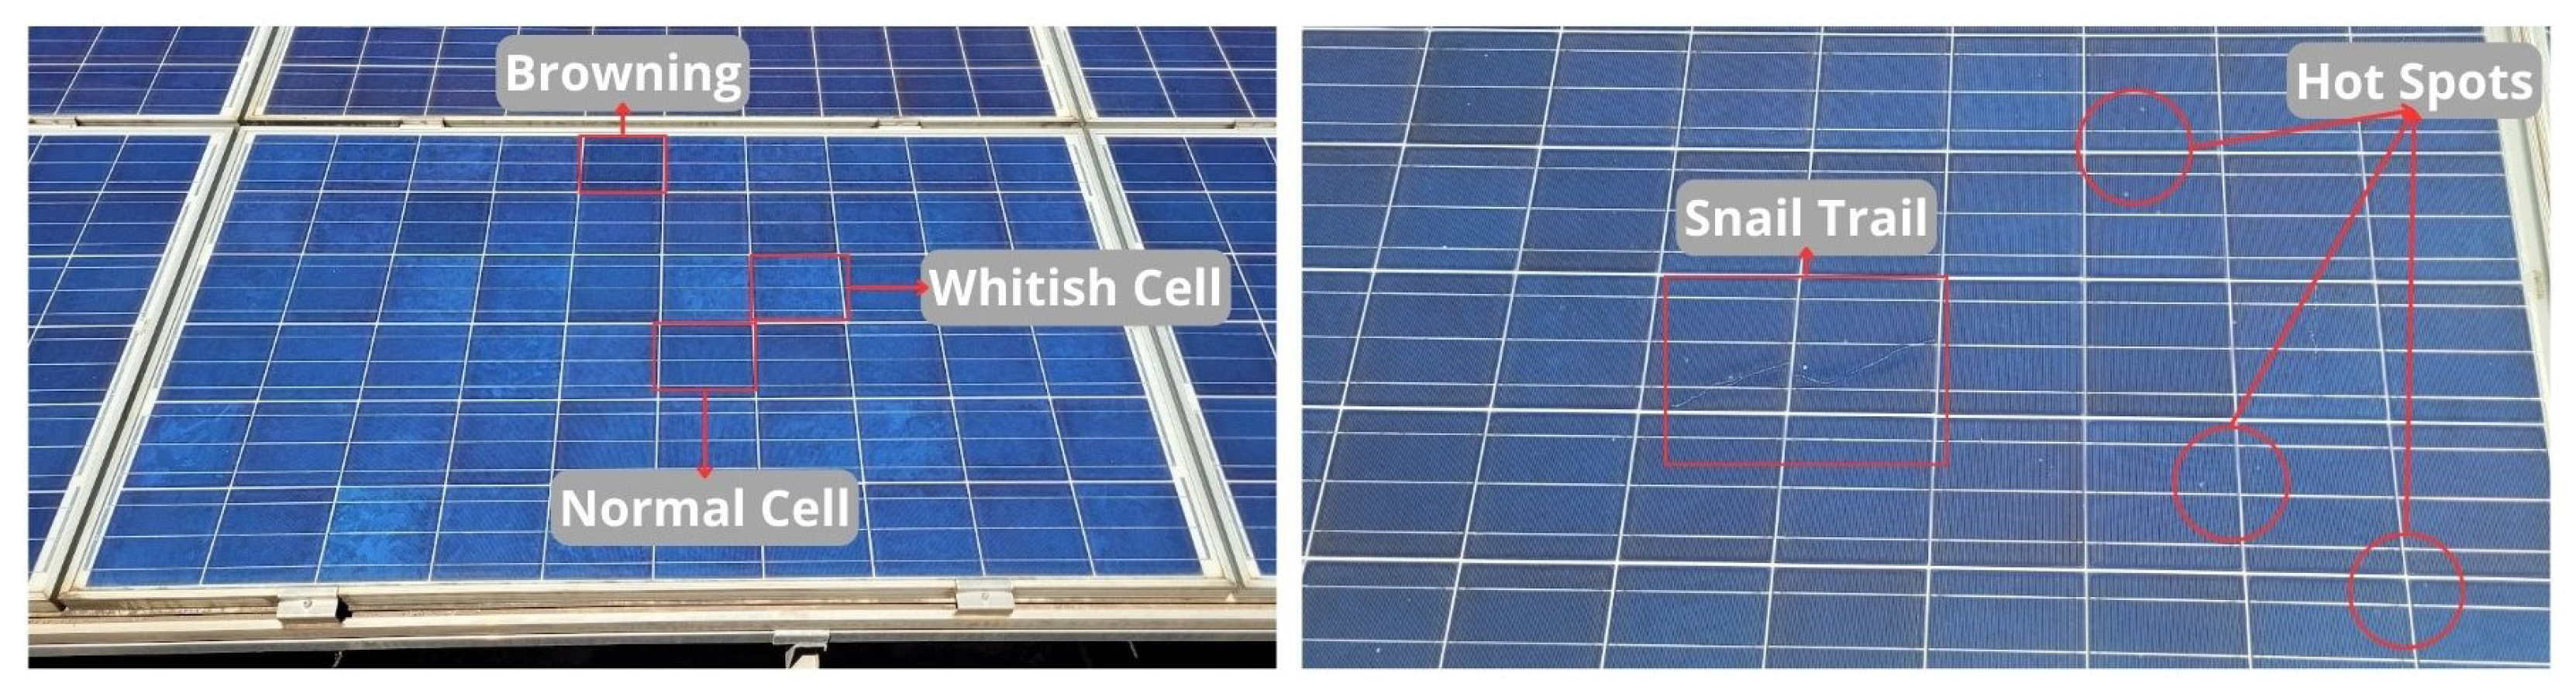
The years of operation of a PV system, coupled with lack of regular maintenance such as periodic cleaning, can lead to the appearance of several visible defects. These include darkening of the EVA resin (browning), discoloration along the edges, and the formation of darkened lines (snail trails). Additionally, there are less visible issues, such as electrical mismatch, which is associated with high temperatures and accumulated dirt on the modules [
20]. These defects and nonconformities are illustrated in
Figure 2, captured during a visit to the Tesla PV Experimental Plant, which will be detailed in the next section.
The influence of individual cells on the performance of a PV module is significant, as the cell that absorbs the least amount of radiation determines the overall generation current of the module. When a system contains multiple damaged cells across various modules, the power output of the entire system can be severely impacted, leading to a substantial reduction in the overall efficiency of the project.
Dirt-related losses can vary significantly depending on the location of the study and the period of the analysis. As such, estimated loss values can differ widely. Desert environments or areas with high levels of air pollution generally experience more substantial losses and greater cleaning requirements. The literature reports losses ranging from 0.3% [
21] to 1% [
22] per day, with annual losses reaching up to 14% [
14]. For a six-month period, a reduction of up to 80% is considered [
21]. Therefore, it is critical to thoroughly assess the environment to ensure optimal performance of a PV system.
Understanding the particulate matter that typically accumulates on PV modules is crucial to determine the optimal cleaning frequency for the system. A related study conducted semi-quantitative tests to identify the primary chemical components present on a Tesla PV experimental plant. The analysis revealed that the most prominent elements in the collected samples included magnetite, hematite, clinochlore, alabandite, and quartz [
23,
24].
The compounds present are characteristic of the local urban environment and originated primarily from activities such as mining in the vicinity, civil construction, and natural soil erosion [
23]. Magnetite and hematite, in particular, are materials known for their high emissivity, which means that they have a significant ability to emit energy through thermal radiation [
25,
26]. This characteristic suggests that these compounds contribute to heat retention in PV modules, potentially impacting their performance.
Urban environments and areas near mining zones have been previously studied and deserve attention for demonstrating a significant influence on the concentration of particulate matter suspended in the air, as well as requiring more frequent cleaning [
18]. In these regions, suspended materials with approximate sizes of PM10 and PM2.5 have been described.
The composition of these particles is a separate study due to their interaction with the module surface. Deposition depends on factors such as installation geometry, sedimentation velocity, particle size, relative humidity, and precipitation. The effects of smaller particles are more harmful due to their strong adhesion to surfaces, making them harder to remove using natural agents, and their ability to cover the affected surface more uniformly. Conversely, larger particles tend to absorb and reflect more sunlight [
18,
27,
28].
A study carried out on a PV plant located in a soccer stadium in Belo Horizonte, Brazil—just 1 km from the site of this research—examined not only the chemical compounds present in the modules but also the influence of rainfall on mitigating the impact of dirt. The study found that significant rainfall (≥5 mm) played a significant role in reducing dust accumulation. During dry periods, the maximum power output was reduced by 13.7%, while after rainfall, this reduction was only 6.5% [
24]. The inclination of the PV modules is another key factor that influences dust accumulation. Particulate materials tend to gather in specific areas of the modules, with the distribution largely determined by environmental factors such as wind, rain, and dew [
21].
The influence of anthropogenic factors was exemplified through a study conducted in an urban area, where, during road repair work near the analyzed system, generation losses increased to 2.59% per day compared to 0.32% prior to the repairs [
17].
A commonly used technique to identify issues caused by dust accumulation is the use of thermal or infrared imaging. Ref. [
29] analyzed a PV plant located in Betim, a city close to the case study of this paper, using thermal imaging. It was found that 12.7% of the modules exhibited overheating points. The losses attributed to dirt were estimated to be 22.25%.
In Brazil, two standards are recommended for thermographic evaluations: NBR 15424 [
30], which defines key terminology, and NBR 16292 [
31], which outlines the procedures for safely conducting measurements using thermal images. The use of this evaluation method can indicate not only hot spots but also the distribution of dust accumulation on the PV modules, which may be uniform or non-uniform.
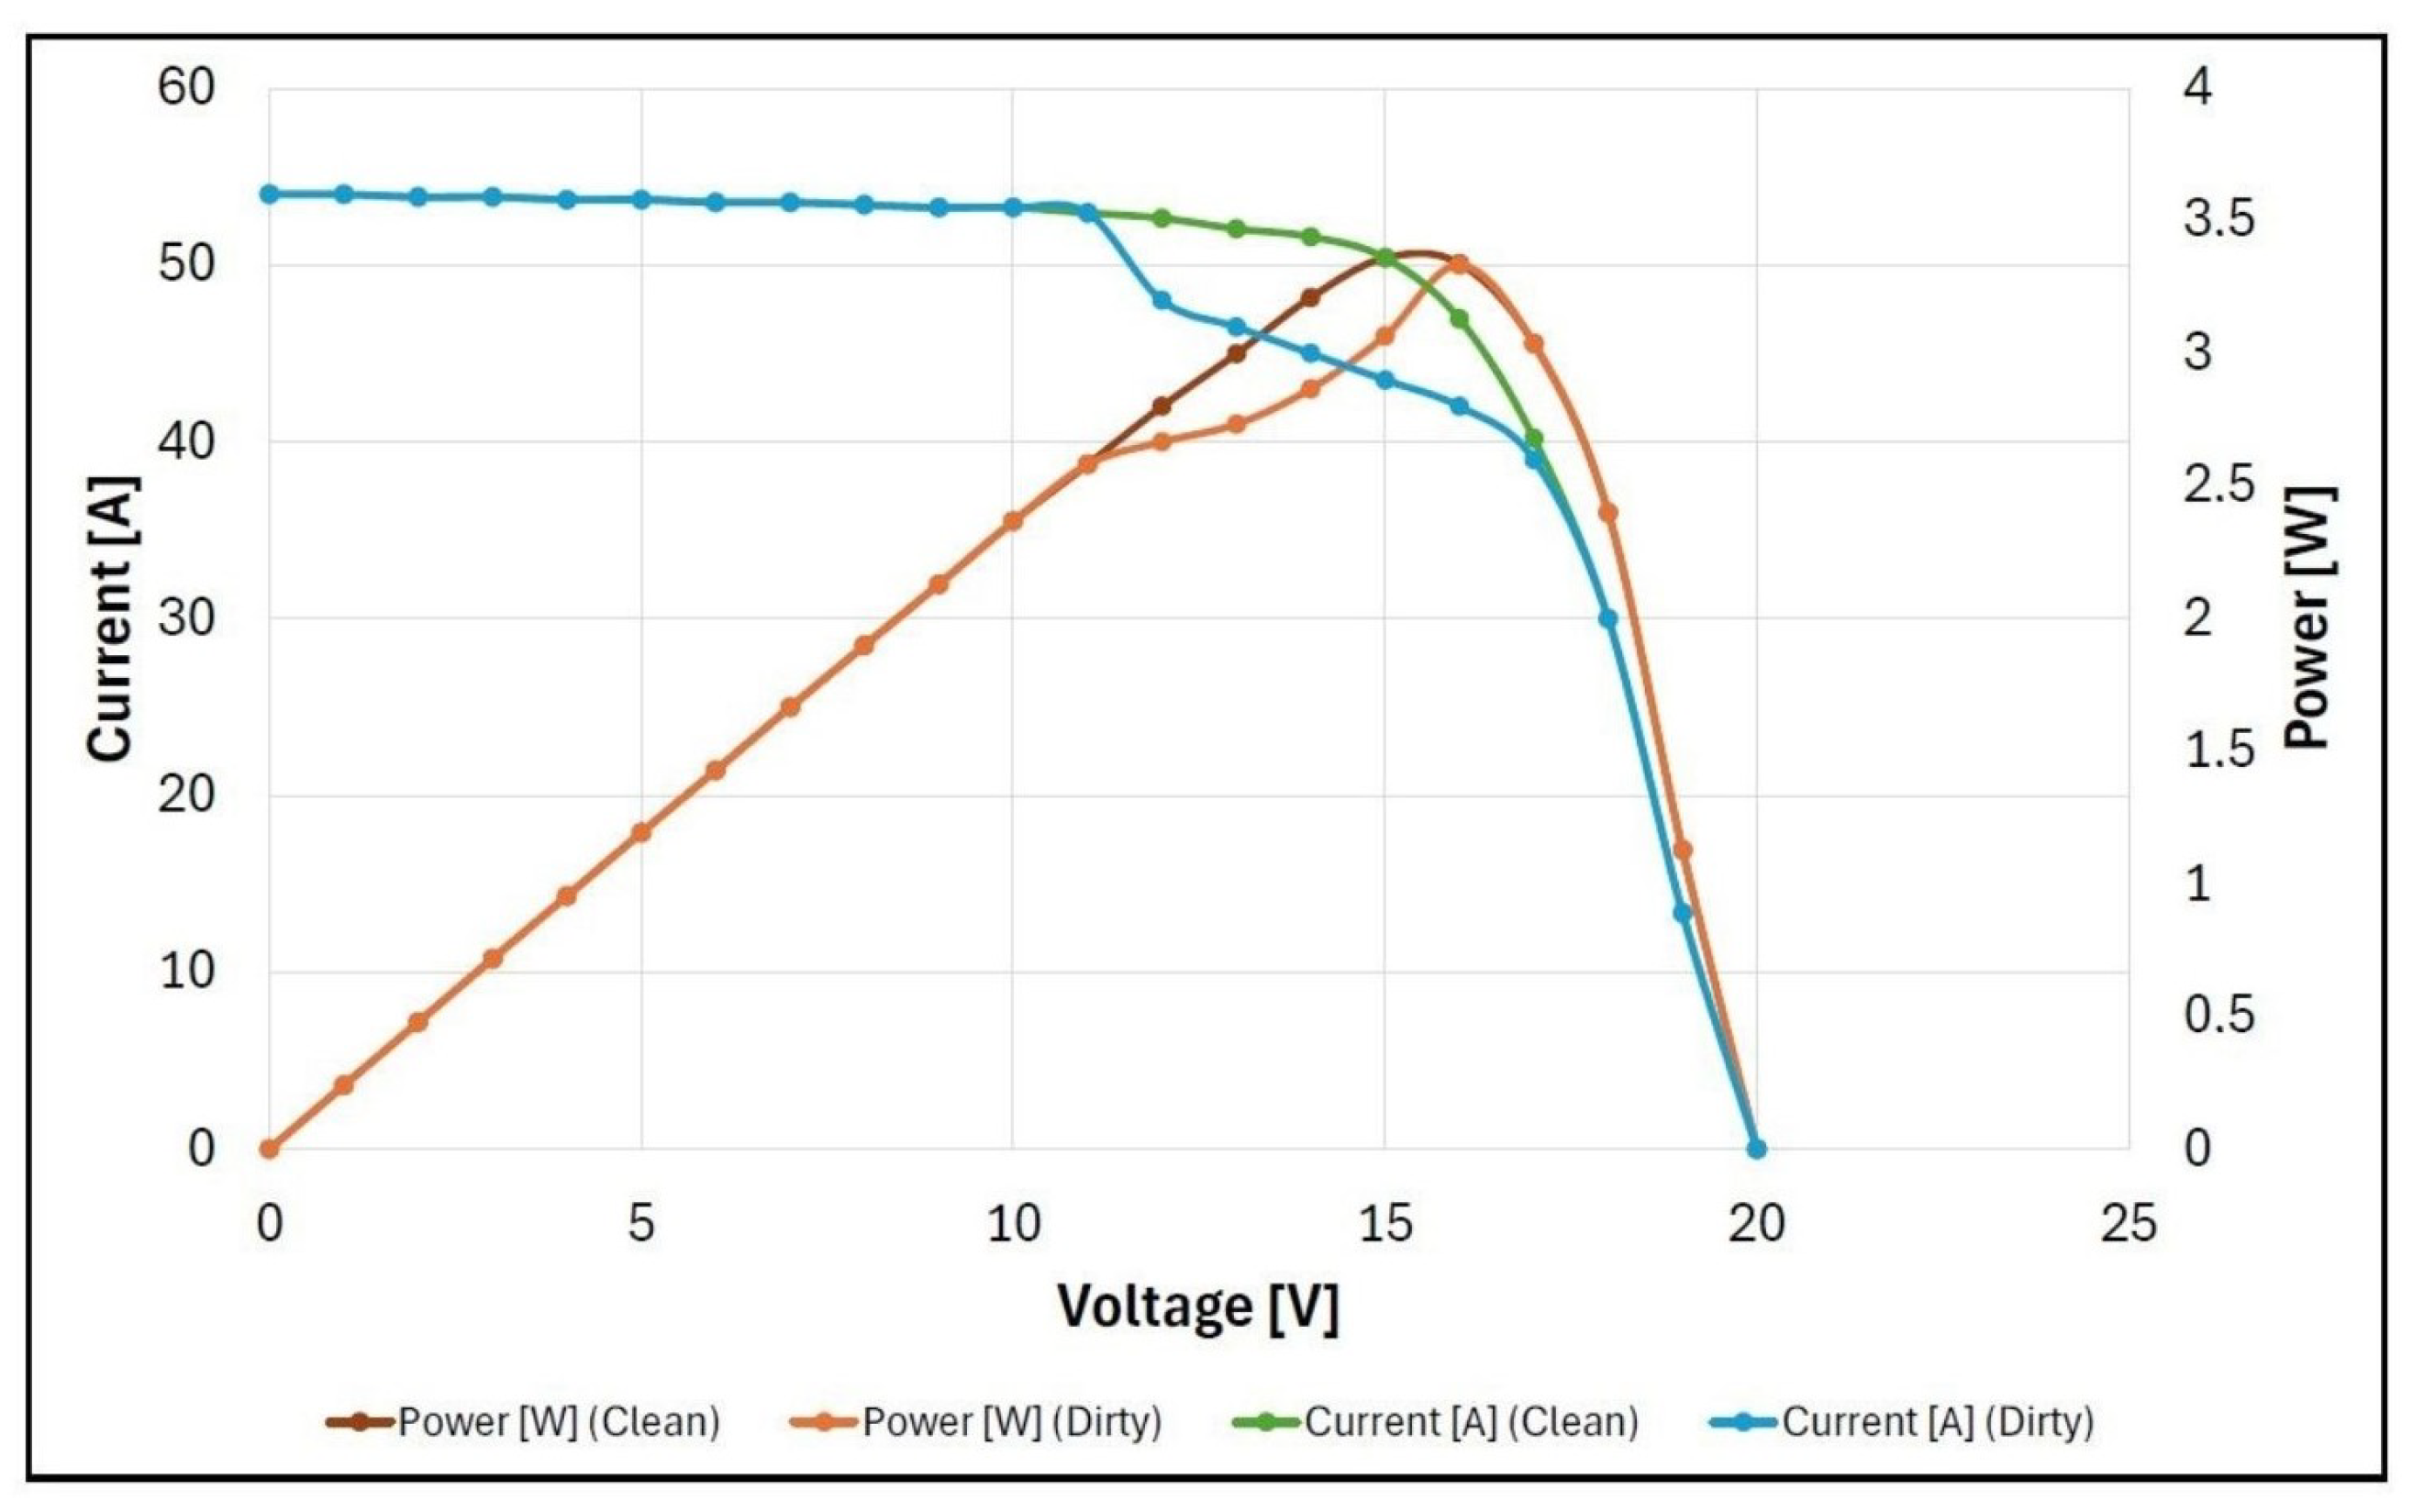
In addition to qualitative assessments, which include visual inspections and the use of thermal cameras, a quantitative analysis of the impact of dirt is essential to estimate system losses. It directly affects the module’s I–V (current vs. voltage) and P–V (power vs. voltage) curves, which are essential indicators of the system’s electrical performance.
These curves use PV module parameters such as maximum output power (
), maximum output current (
), maximum output voltage (
), open-circuit voltage (
), and short-circuit current (
).
Figure 3 utilizes the experimental data used in this paper to illustrate, through simulation, the impact of dirt on the referenced curves of a module. The clean module’s ideal operating condition is represented by the brown and green curves, where the maximum power point is achieved. In contrast, the curves in orange and blue represent the module’s performance when the modules are dirty. Here, it is evident that the maximum operating point is not reached, and the curves exhibit deformations due to the reduced ability of the module to capture irradiance effectively [
4].
3. Tesla Photovoltaic Plant and Analysis Methods
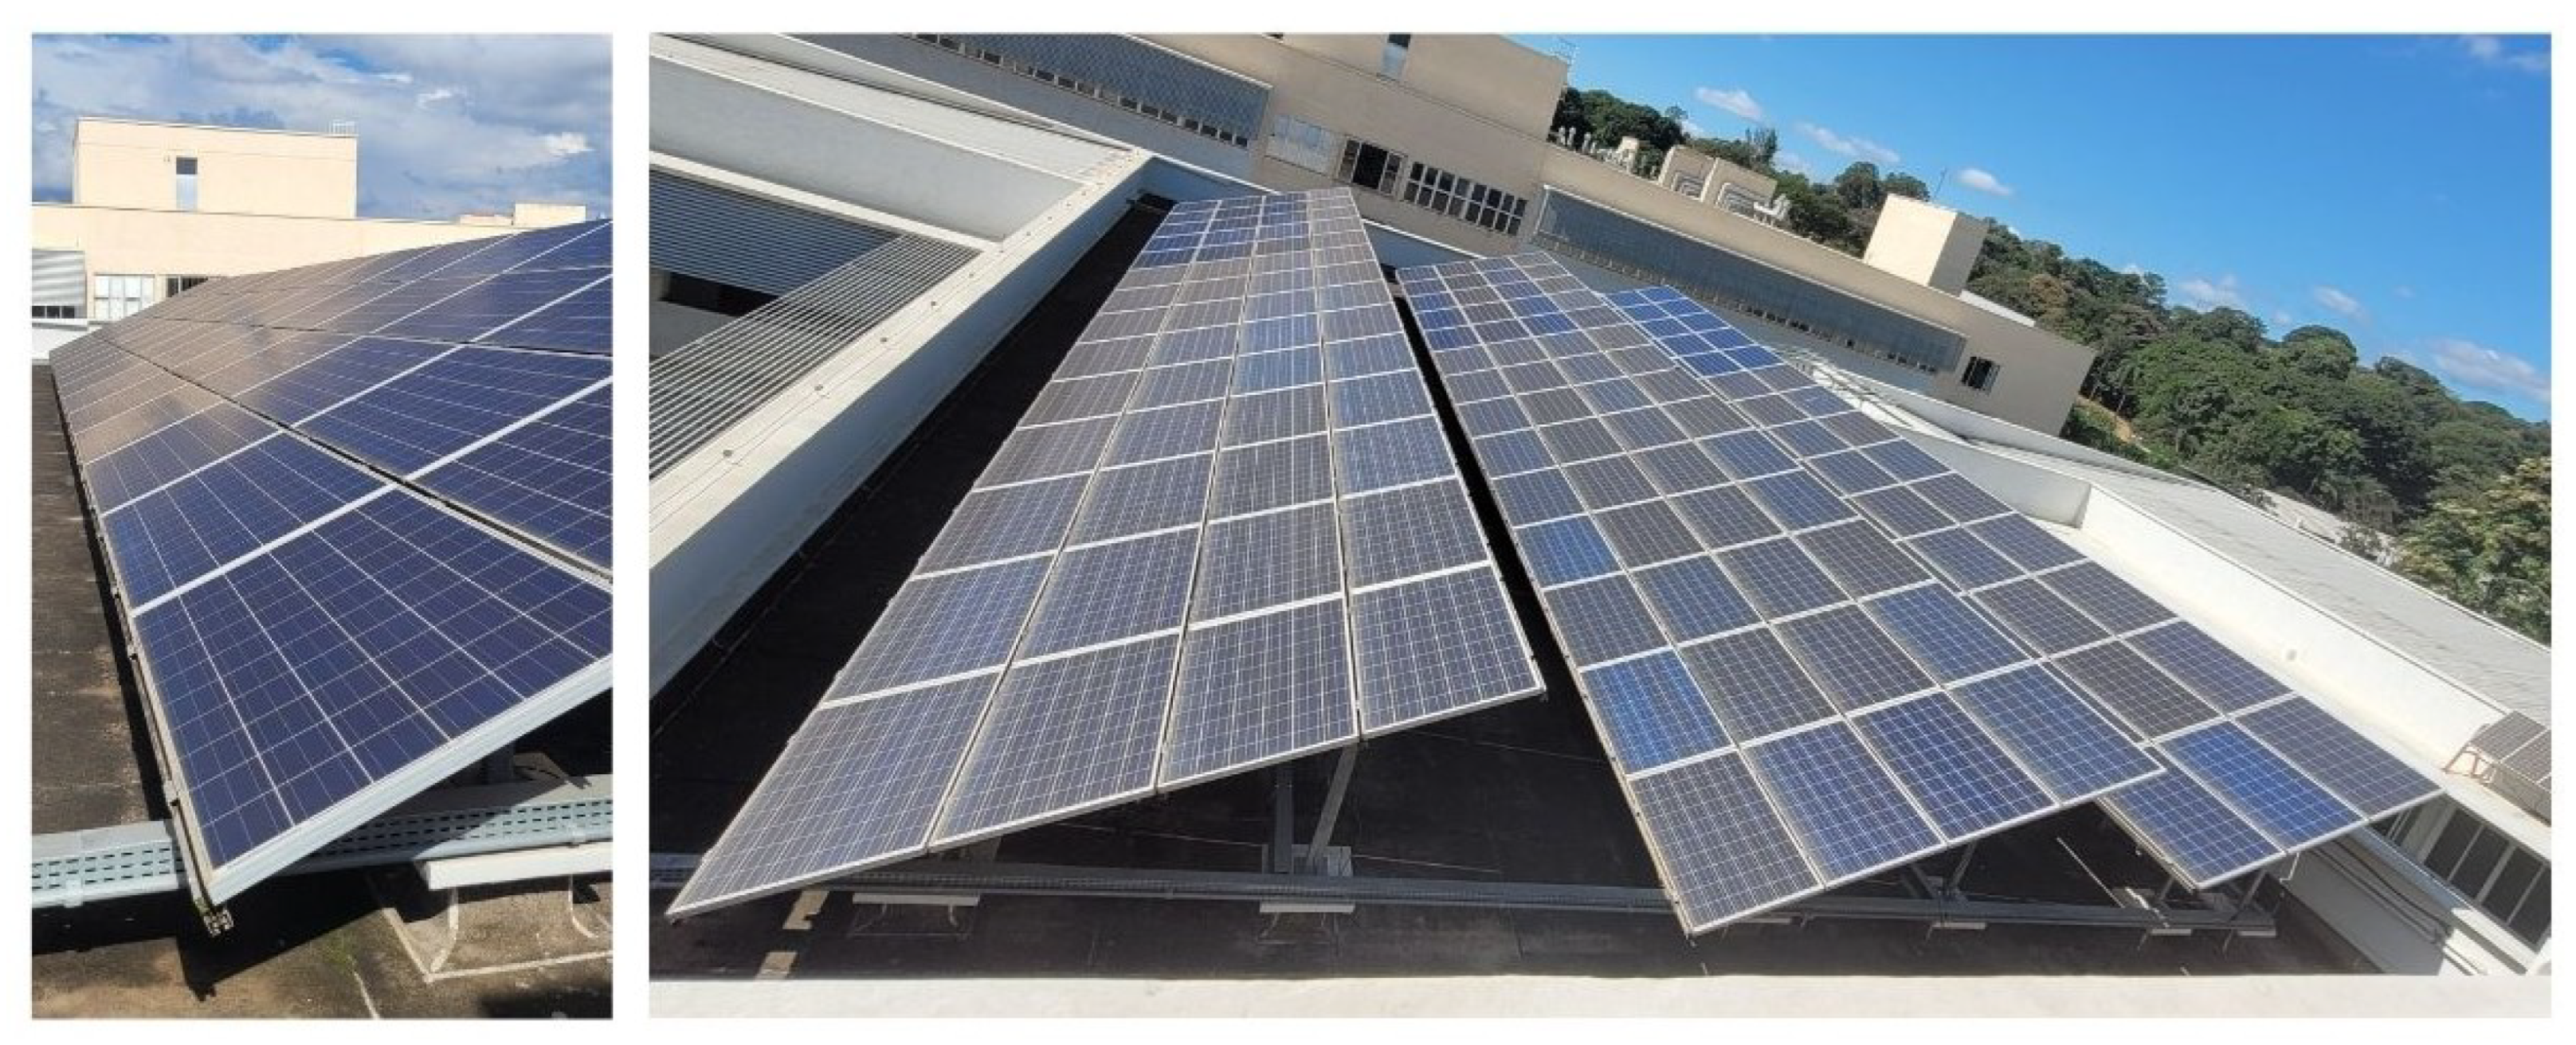
The TESLA Power Engineering PV Experimental Plant, shown in
Figure 4, was established as a key component of a research and development (R&D) project, a collaboration between the Federal University of Minas Gerais (UFMG) and the Bahia Electricity Company (COELBA). UFMG is located at Belo Horizonte, Brazil. This PV plant has been designed by the Tesla Power Engineering Laboratory, a research laboratory of the school of engineering of UFMG [
36]. The plant began its operation in June 2016 and has an installed capacity of 37 kWp.
The plant was installed on the roof of the UFMG’s School of Engineering, approximate location 19°52′10.81″ S 43°57′42.01″ W. The orientation of the building in relation to the geographic north, as well as that of the panels, is −7°, with a fixed inclination of the modules of 25° [
37]. The city of Belo Horizonte, Brazil, has a highland tropical climate, characterized by distinct dry periods (autumn–winter) and rainy periods (spring–summer) [
38]. In the southern hemisphere, summer occurs between December and March, while winter is concentrated between June and September.
The plant consists of 154 polycrystalline silicon panels, a technology distinguished, among other factors, by the inclusion of a bypass diode in the junction box for protection. The PV modules used in the plant are Yingli Solar model 245P-32b, with a power rating of 245 W.
Table 1 presents the electrical specifications based on the manufacturer’s data [
39].
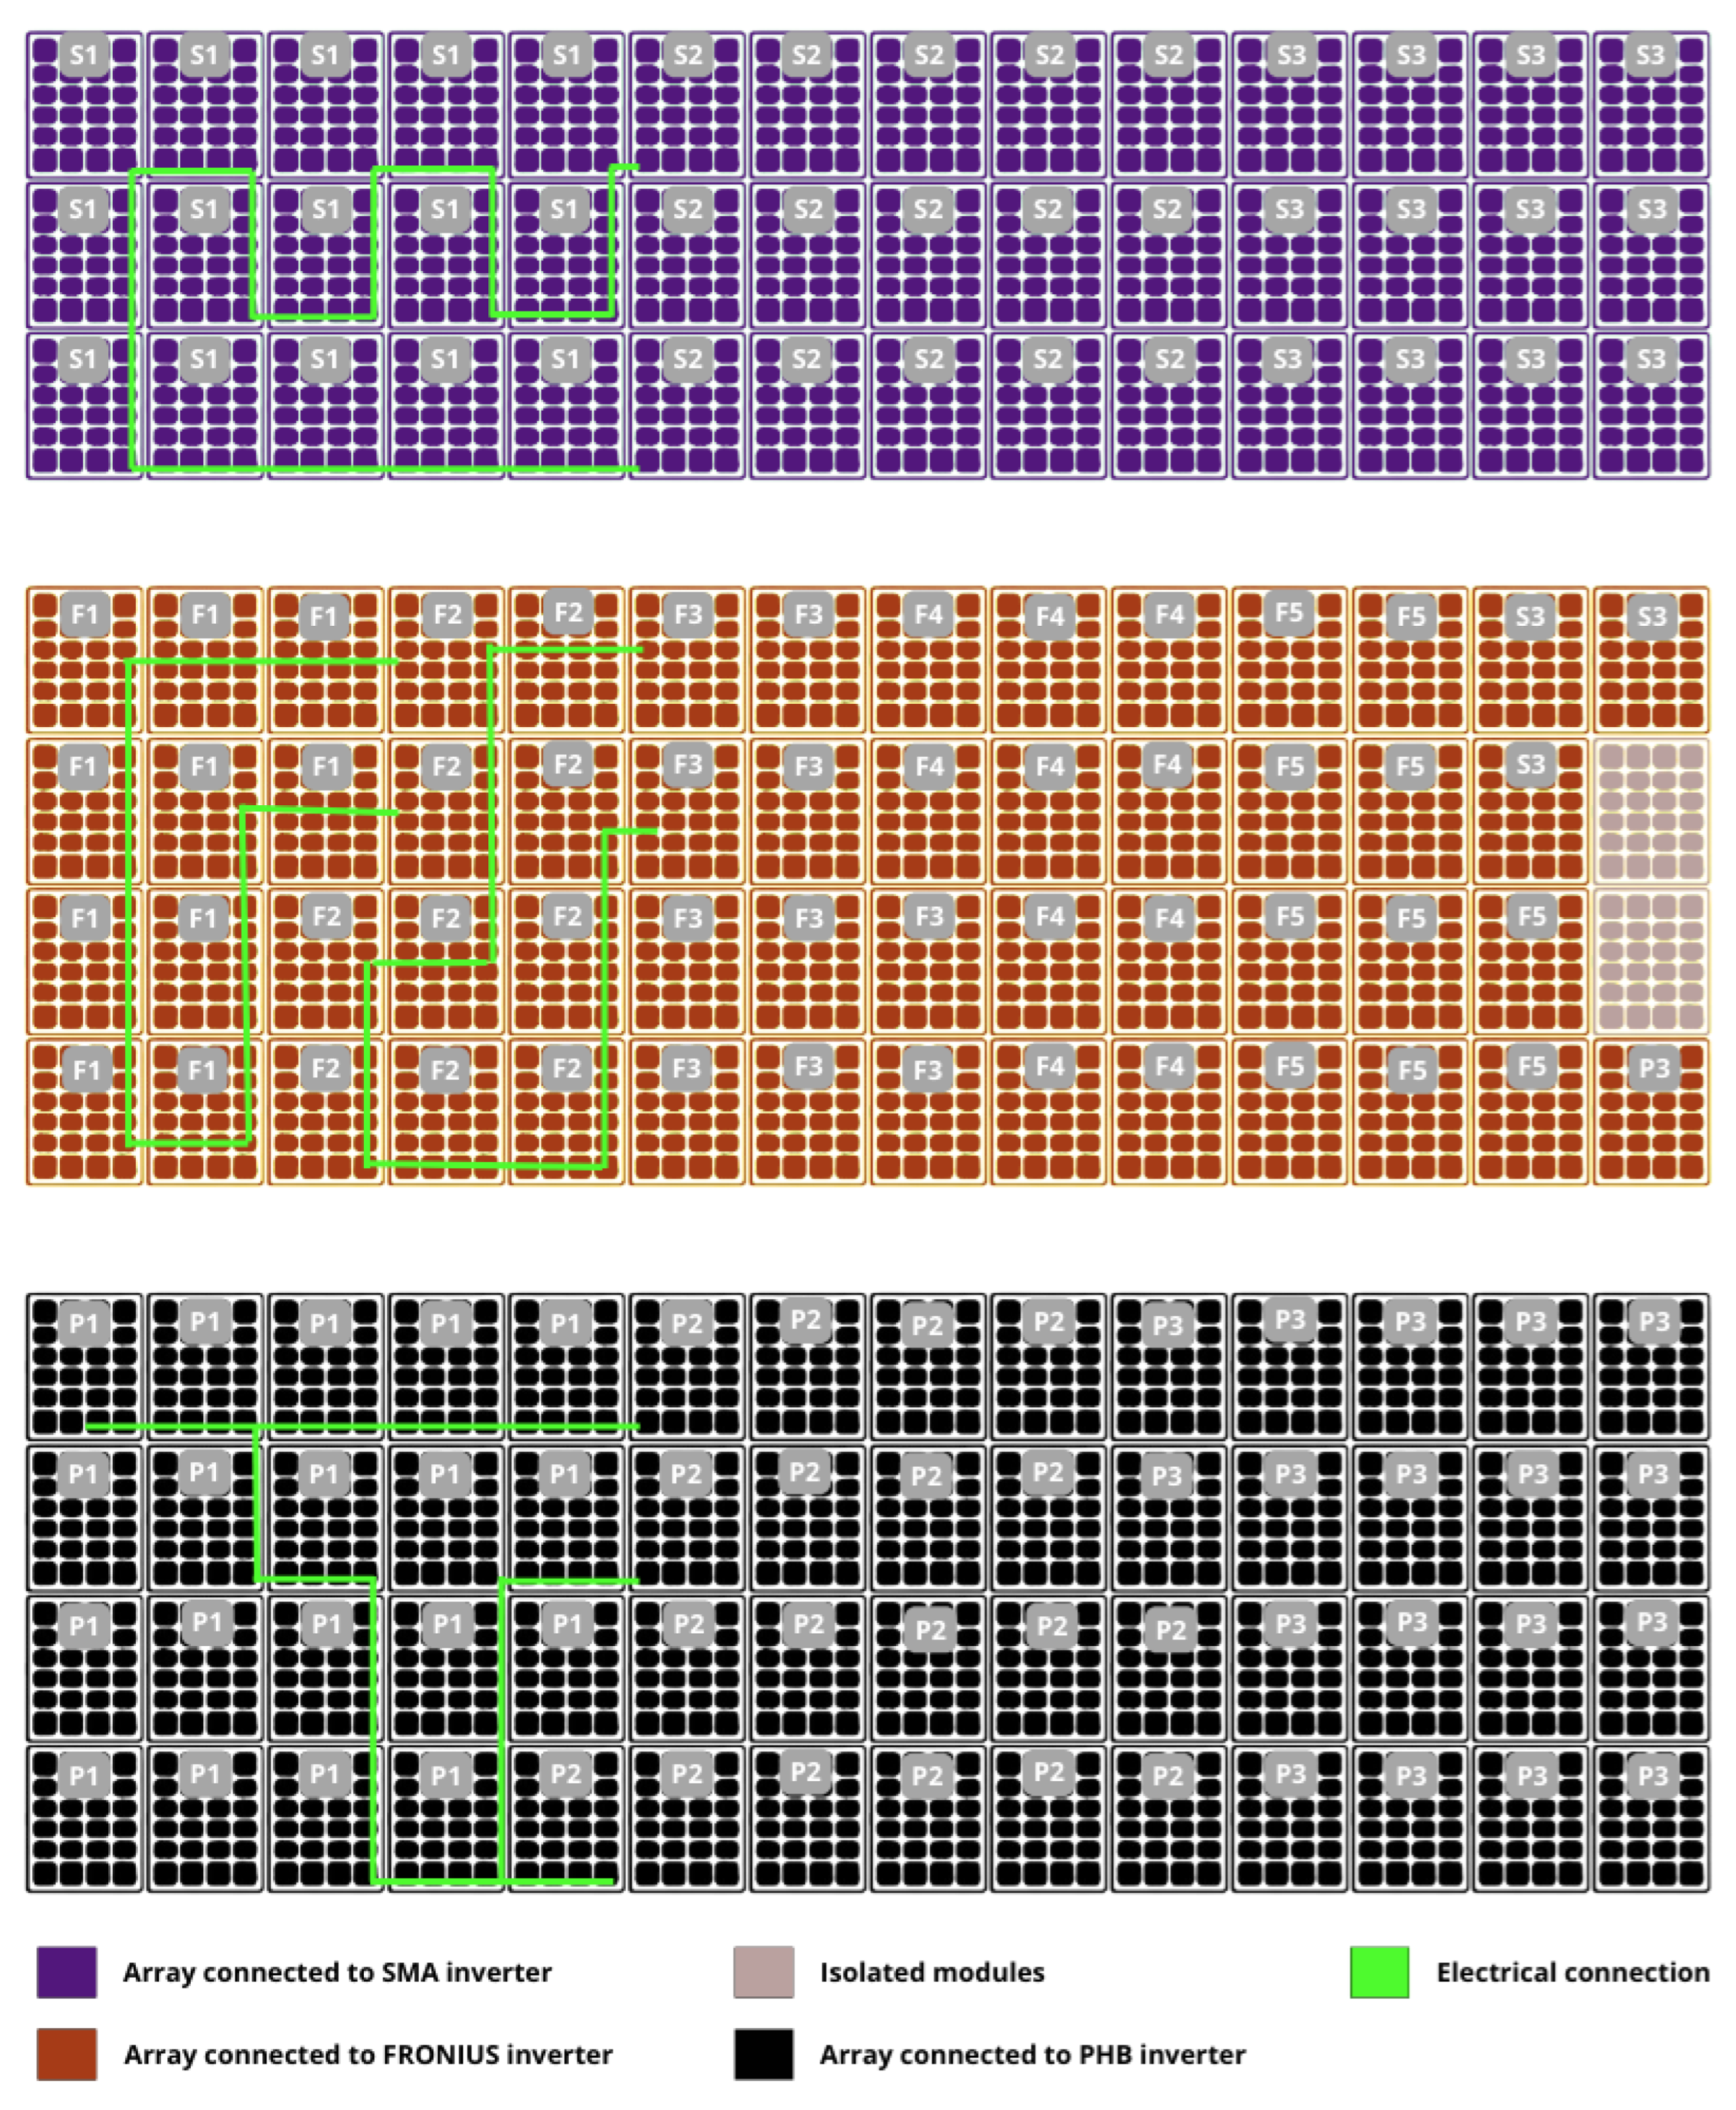
Since the plant was designed to meet academic scenarios, three different inverter models were chosen to investigate different performances. The panels are divided as shown in
Figure 5 [
40]. In this work, the impacts on the S1, F1, F2, and P2 arrangements are analyzed, whose connection diagrams are highlighted in green in
Figure 5.
The first array corresponds to SMA inverter model STP12000TL-20 [
41]. The second one is connected to Fronius inverter model IG Plus 150V-3 [
42], while the third array uses PHB inverter model PHB20KNDT [
43]. The respective electrical parameters, as provided by the manufacturers, are displayed in
Table 2. The arrays are divided as follows:
Array 1 (SMA inverter in purple): 45 panels, 3 parallel arrangements of 15 panels in series.
Array 2 (Fronius inverter in orange): 50 panels, 5 parallel arrangements of 10 panels in series.
Array 3 (PHP inverter in black): 57 panels, 3 parallel arrangements of 19 panels in series.
Non-listed panels: two isolated modules, not connected to any of the inverters, intended for specific studies.
The TESLA PV Plant is equipped with a meteorological station and a small reference cell. These instruments measure irradiance and ambient temperature to which the system is exposed. The data collected from these measurements were used to support this research. To estimate the performance of the TESLA PV Experimental Plant in its current state of operation, qualitative and quantitative evaluations were used.
3.1. Qualitative Analysis
The qualitative analysis of a PV plant relies on visual inspection to evaluate the impact of dirt on energy losses. This methodology uses thermal cameras to detect the presence of hot spots within the installation and to assess the distribution of dirt on the modules.
For this study, an infrared camera, model I60 from the manufacturer Flir [
44], was used. Measurements were taken in accordance with the previously presented standards, both before and after cleaning.
Table 3 presents the compiled camera data.
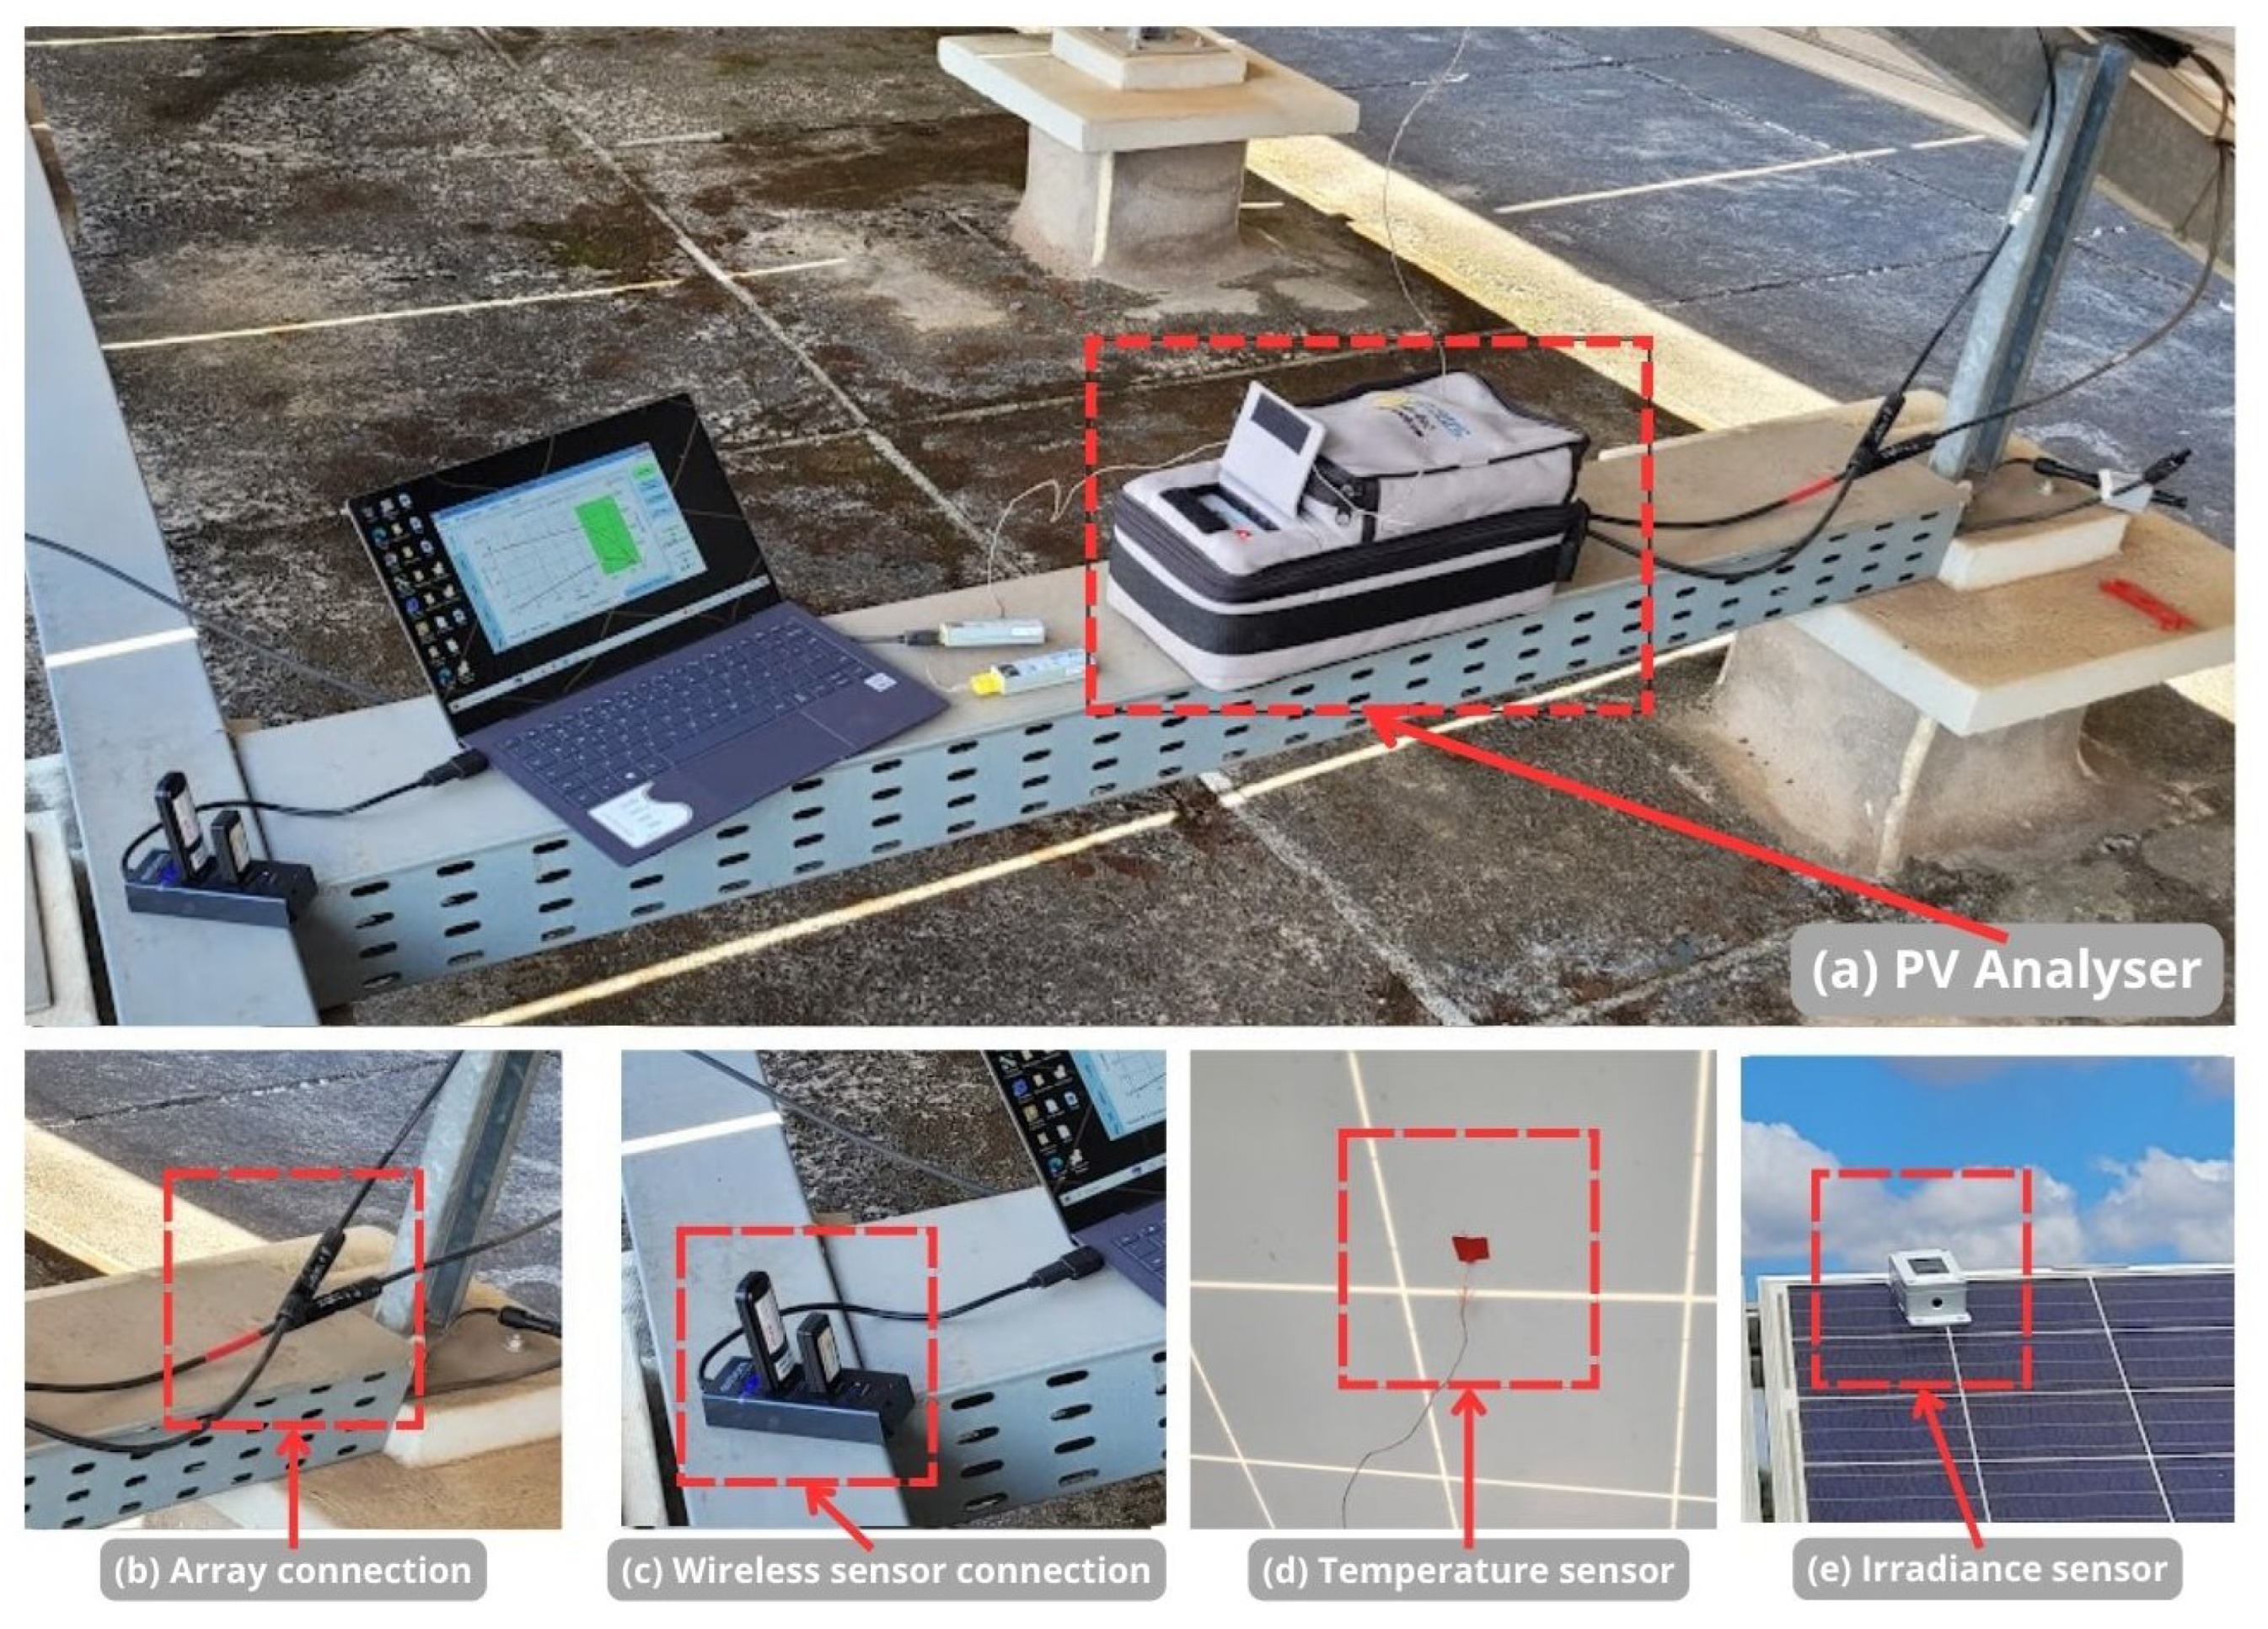
3.2. Quantitative Analysis
The quantitative analysis aims to numerically quantify the approximate losses of the plant. The data were recorded using an I–V and P–V curve tracer, model PVA 600 PV Analyser, manufactured by Solmetric [
45]. The parameters of the tracer are presented in
Table 4.
To use the equipment, a computer with the tracer software installed is required to enable wireless communication with the irradiance and temperature sensors. The PVA 600 PV Analyzer must be connected directly to the module, or in this case, to the array being analyzed, using MC4 connectors. The use of the device is exemplified in
Figure 6. It is possible to observe the direct connection of the equipment being made in
Figure 6b, the communication of the sensors in
Figure 6c, the temperature sensor fixed to the bottom of the module in
Figure 6d and the irradiance sensor in
Figure 6e in the module next to the arrangement being tested.
Data acquisition began in May 2024, after the local rainy season, to account for the reduced influence of humidity on the modules and the increased concentration of particulate matter. The plant had not undergone maintenance for at least 6 years. According to data from the Brazilian National Institute of Meteorology (INMET) [
46], the last significant rainfall in the region occurred on April 18, with 36 mm of rain. As a result, testing started on May 9 with visual inspections, and the first cleaning took place on May 13.
The data were collected both when the panels were dirty and after cleaning, always between 11 a.m. and 1 p.m. This time frame was chosen because it experiences less variation in temperature and irradiance, with levels concentrated between 900 and 1000 W/m2.
For data collection, the methodology involved site visits for visual inspection of the modules, infrared camera recording, and data measurement using a curve tracer. Measurements were conducted both before and after each cleaning session following this approach: prior to cleaning, hot spots were identified through qualitative assessment and quantitative data collection. After cleaning, new qualitative and quantitative measurements were performed to facilitate a comparative analysis of the results.
Among the various cleaning methods available in the literature, wet cleaning was selected, utilizing cloths and/or materials with soft bristles combined with water to remove and rinse the panels [
29]. Three rounds of cleaning were carried out to achieve better results, considering the long period of exposure and the lack of maintenance of the system. The cleanings took place at intervals of 6 to 8 days.
4. Results
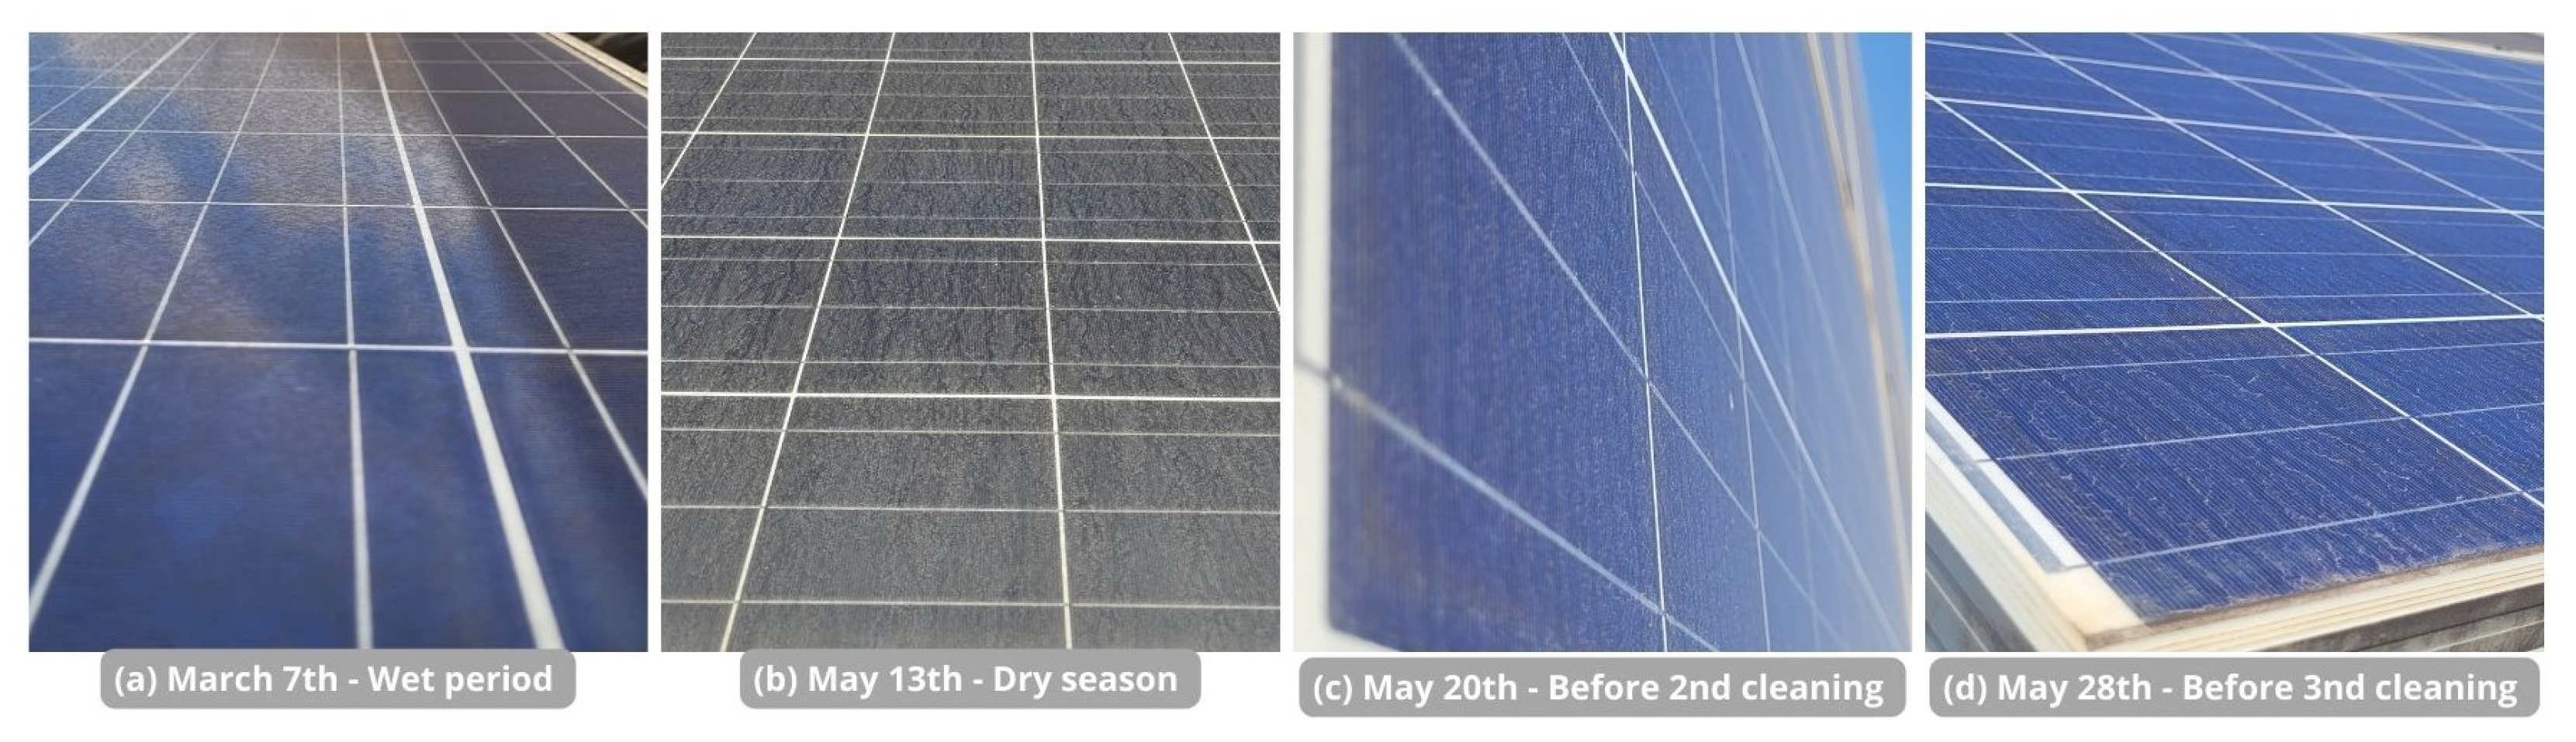
Figure 7 illustrates the various stages of dust accumulation on the panel belonging to the F1 arrangement. In the first stage, shown in
Figure 7a, the dirt exhibits strong adhesion and was recorded in March 2024 during an initial visit to the TESLA PV Experimental Plant following a period of heavy rainfall. By May 13 (
Figure 7b), the dirt had a dust-like appearance.
Figure 7c,d depict the stages of dust accumulation between cleanings, where gradual deposition and formation of dirt are visible, including traces of water caused by dew formation.
Another critical aspect relates to the integrity of the modules. While some issues were observed during the initial visits, the defects became more evident after maintenance, revealing how dirt exacerbates these imperfections.
Among the observed nonconformities, including hot spots, browning, snail trails, and discoloration, it was found that 26.7% of the modules in the arrangement connected to the SMA inverter exhibited some form of imperfection. The Fronius inverter arrangement showed a higher percentage, with 45% of its modules affected. Similarly, the arrangement connected to the PHB inverter had 42% of its modules exhibiting these defects. The analysis of the arrangements individually will be presented below so that the results can be better visualized.
4.1. Arrangement S1
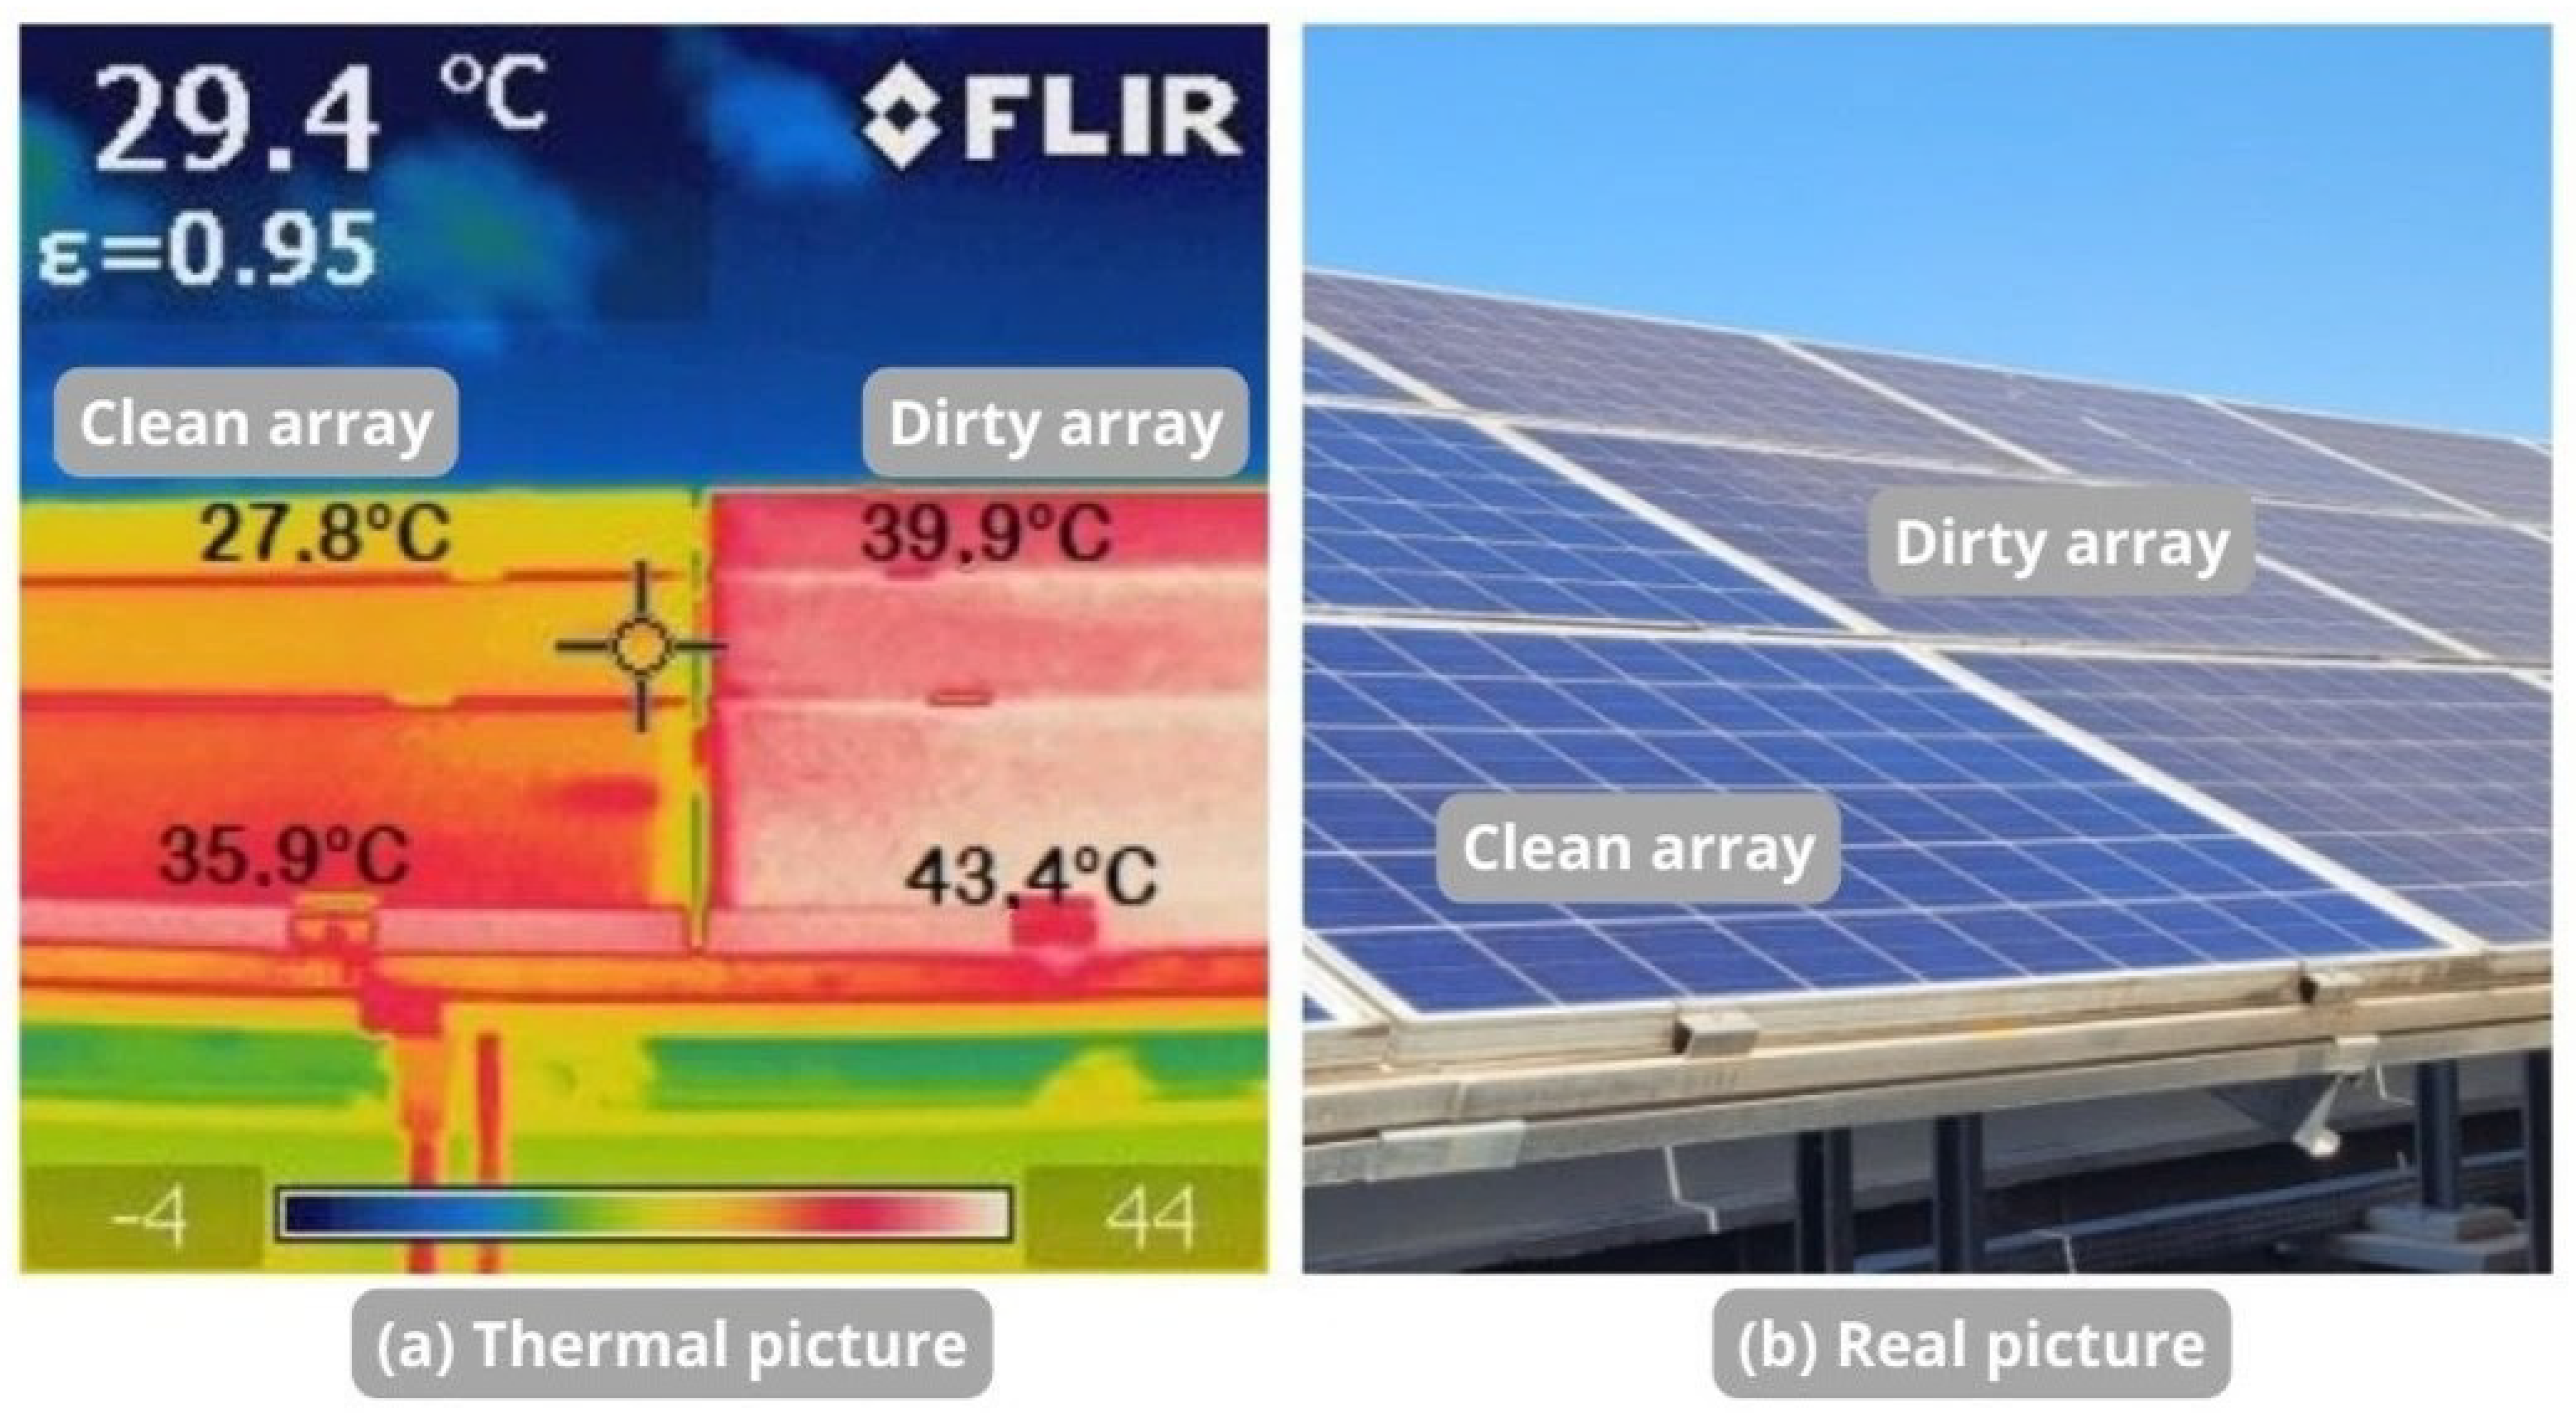
Using an infrared camera for qualitative analysis, the distribution of dirt on the PV modules in the S1 array, connected to the SMA inverter, was assessed.
Figure 8 provides a comparison, showing the modules before cleaning, on the left, and after three rounds of cleaning, on the right.
According to data from the plant’s meteorological station, the environmental conditions on May 9 and 28 at around 12:00 p.m. were relatively consistent, with temperatures averaging 27 °C. However, the qualitative assessment depicted in the
Figure 8 highlights the effectiveness of dirt removal from the modules. Despite this, some hot spots persisted, such as the one observed on the right side of the lower module. This indicates that while cleaning improves overall module performance, underlying defects remain unaffected.
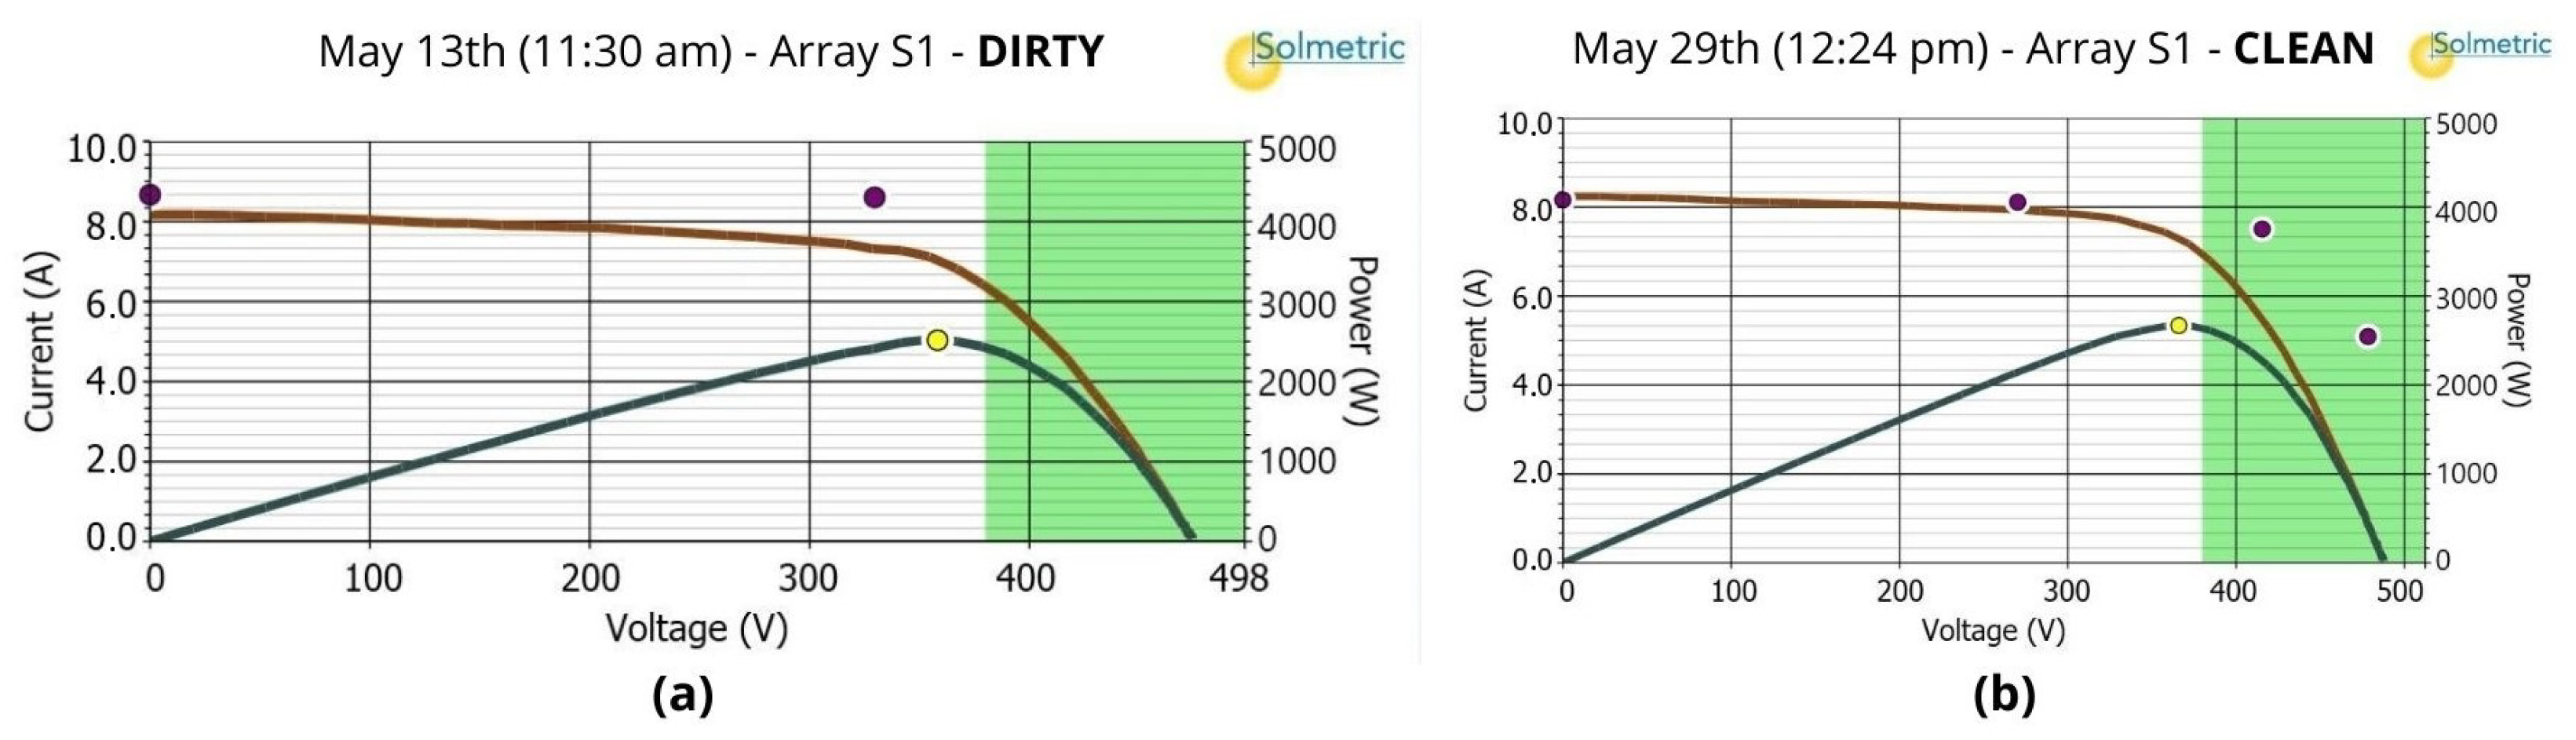
Regarding the quantitative analysis, supported by the numerical data obtained through the curve tracer, the resulting curves are illustrated in
Figure 9. This figure demonstrates the comparison of the S1 array’s performance before maintenance, shown on the left, and after three rounds of cleaning, shown on the right. The I–V curves, depicted in red, and the P–V curves in blue were generated using the tracer’s software, highlighting the impact of cleaning on the array’s electrical performance.
The software estimates an ideal performance by considering previously input system parameters, including module specifications, quantity, inverter details, and location characteristics. This estimate is depicted with purple points representing ideal current tracking and a green zone indicating the optimal power operation range, highlighted by a yellow point. After proper cleaning, an improvement and adjustment of the curve can be observed, remaining closer to 8.22 for a longer duration—a value specified by the manufacturer as the standard operating short-circuit current. The numerical values obtained by the tracer indicate that the maximum power of the arrangement increased from 2389 W to 2708 W and the short-circuit current varied from 8.25 A to 8.36 A.
When analyzing the Soiling Ratio (SR), the key metric for determining the dust accumulation on the modules, the calculated value for the dirty state was , and after the complete cleaning of the arrangement, the SR became 1.02, being within the values estimated according to the literature.
However, , despite showing an increase, going from 0.77 to 0.85, a relative gain of 11.28%, still remained below the estimated value, indicating that some modules may have suffered permanent damage to their physical structure.
4.2. F1 and F2 Arrangement
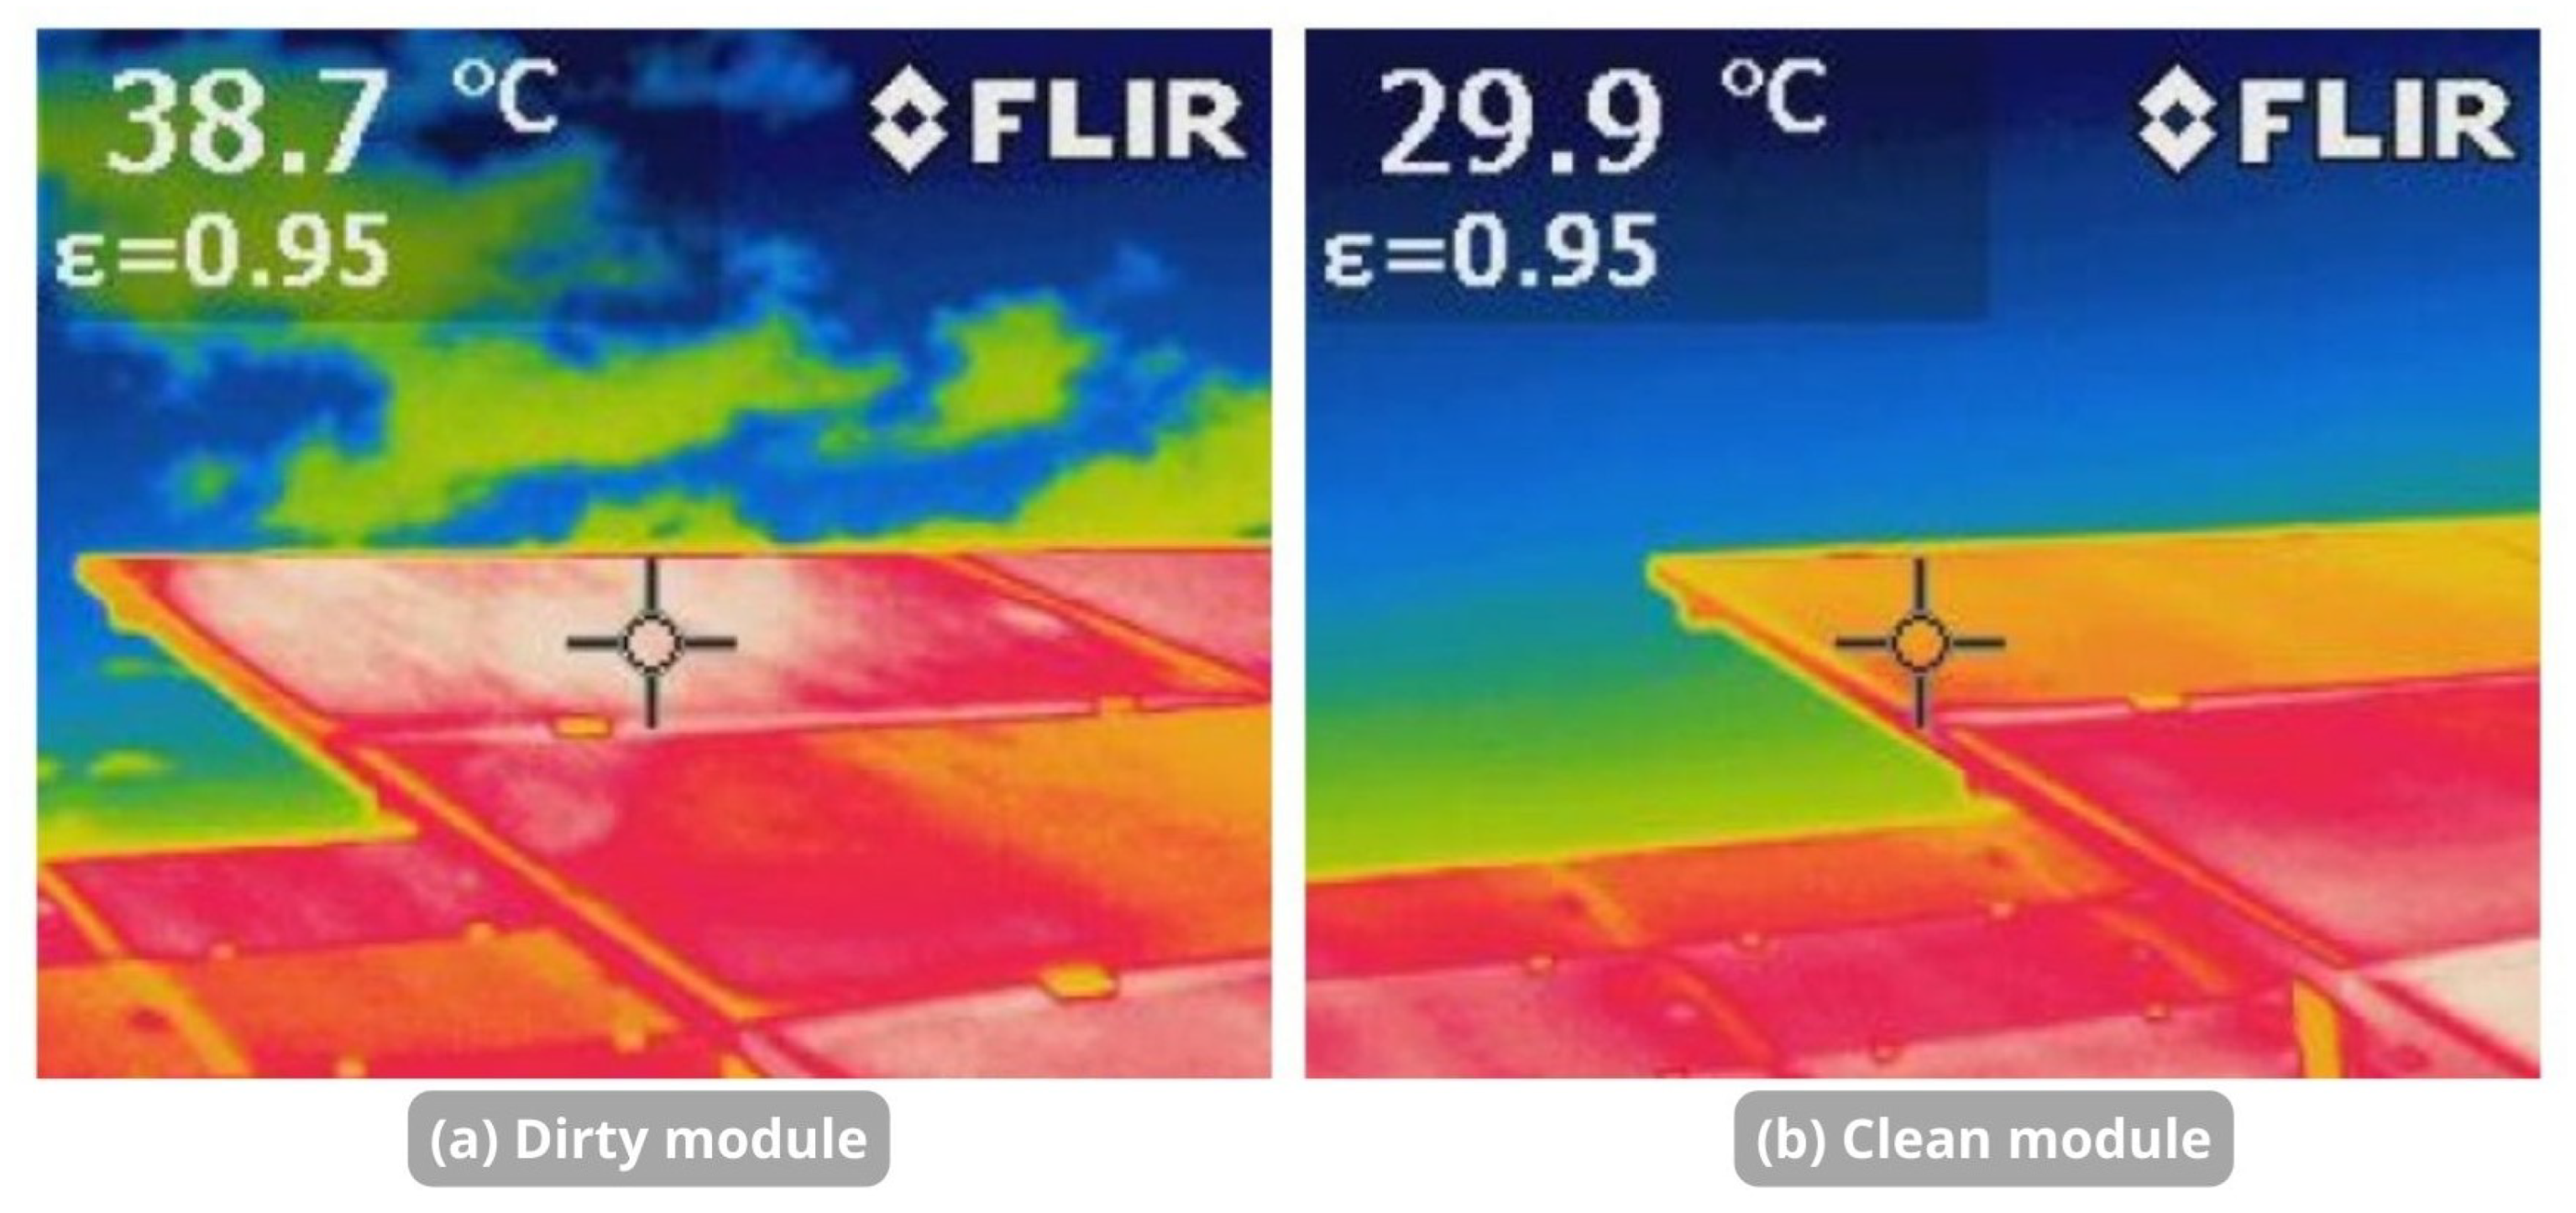
Similar to the previous arrangement, the qualitative inspection yielded promising results for arrangements F1 and F2, as illustrated in
Figure 10. A comparison was conducted between the modules that underwent the dirt removal process and those in arrangement F3, which remained consistently dirty. The results revealed a notable temperature difference of up to 7.5 °C at the panel’s base, along with a visible change in the coloration of its structure.
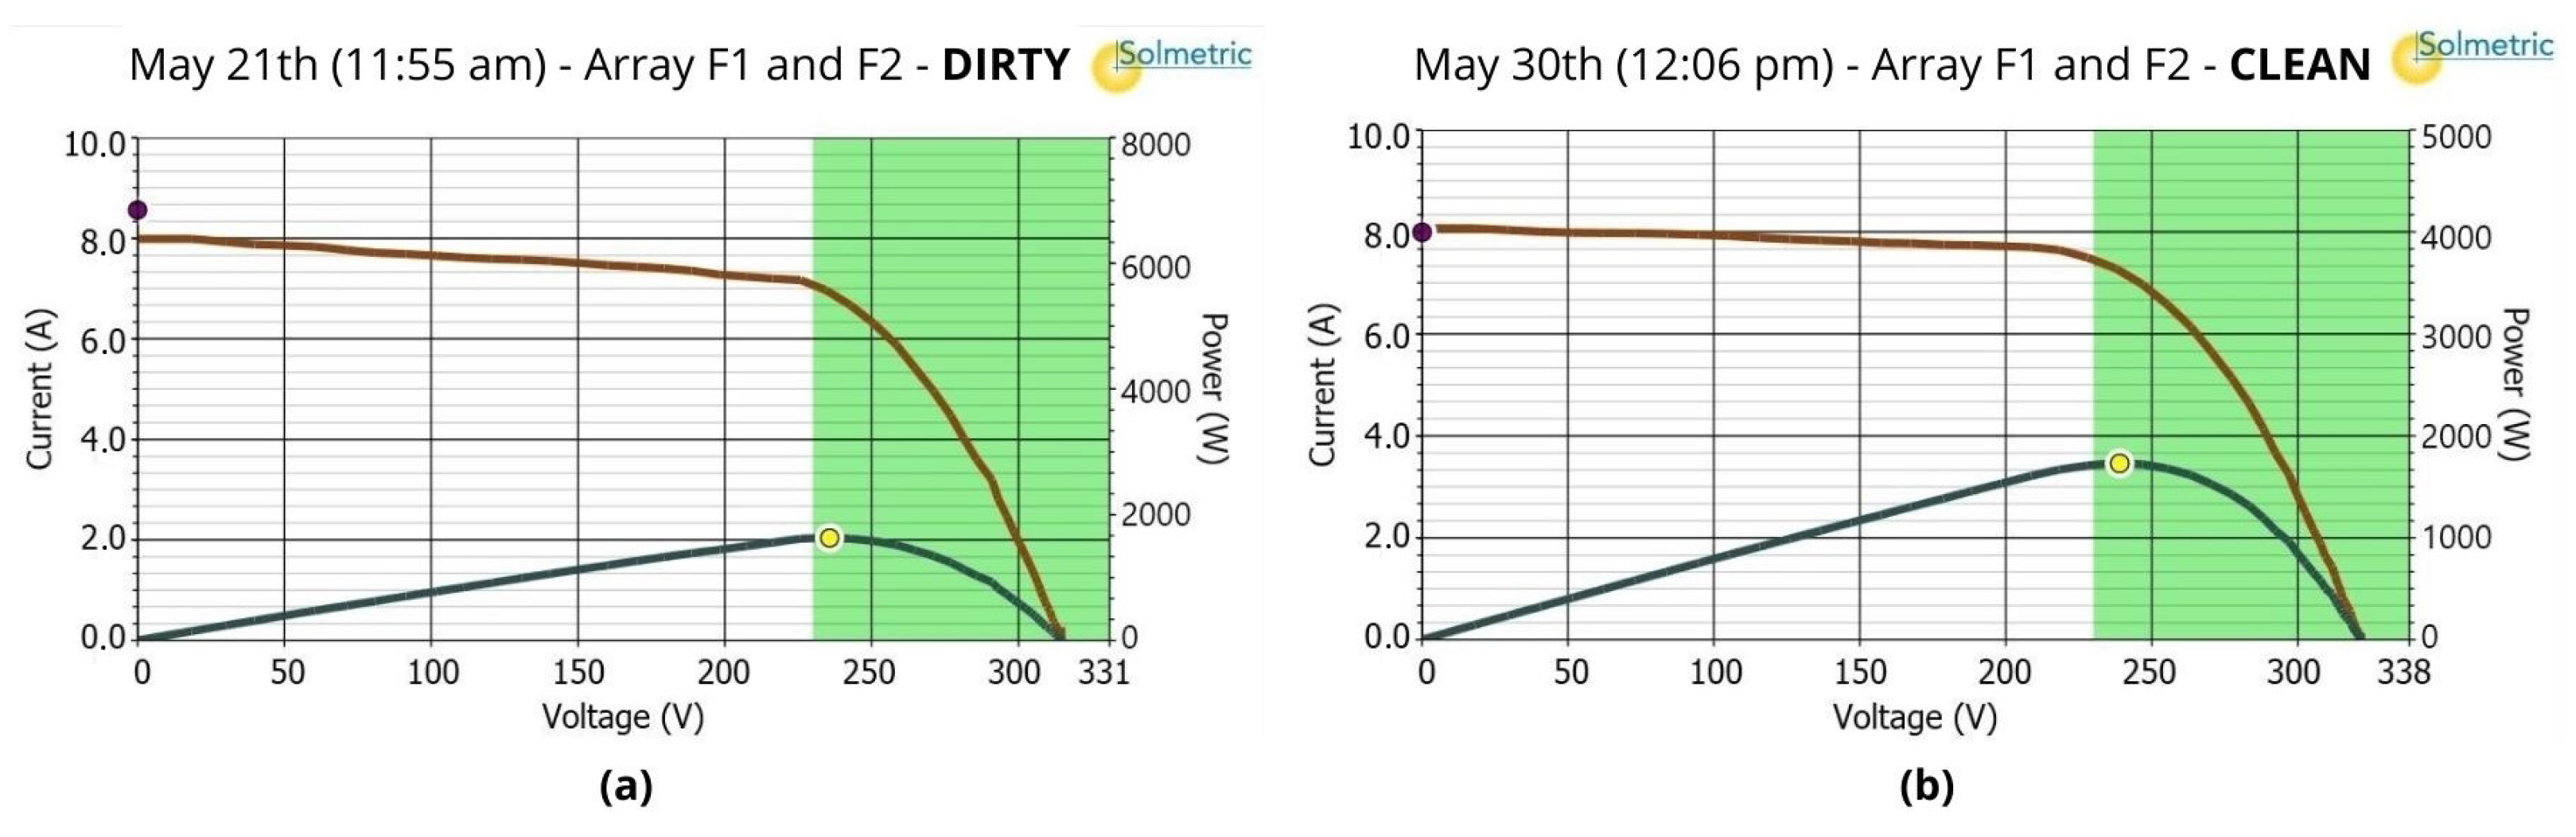
The curve analysis also shows a positive improvement, with measurements taken at irradiances of 1029 W/m
2 and 944 W/m
2, respectively.
Figure 11 displays the comparison between the clean and dirty systems. Initially, the current (shown in red) exhibited slight ripples, which improved after cleaning, along with an increase in both current and voltage at the maximum power point. Additionally, the module’s operating temperature, measured using the sensor, decreased from 55.6 °C to 43.3 °C.
According to data from the local station on the measurement days, the ambient temperature was 26.2 °C and 23.8 °C, respectively. During the study period, which coincided with the autumn–winter season, the region experienced relatively stable climatic conditions, with no significant fluctuations in temperature, irradiance, humidity, or wind. As a result, the primary factor influencing the results was the maintenance performed on the system. After normalizing the irradiance values, it was concluded that there was a reduction of approximately 15% between the initial and final operating temperatures of the reference module.
The resulting analysis indicates that the maximum power increased from 1667 W to 1730 W, while the short-circuit current varied from 7.11 A to 8.07 A. The value of was positive, increasing from 0.92 to 1.02. As in the previous case, the analysis on the power soiling rate remained below expectations, with the initial being 0.39 and the final being 0.46.
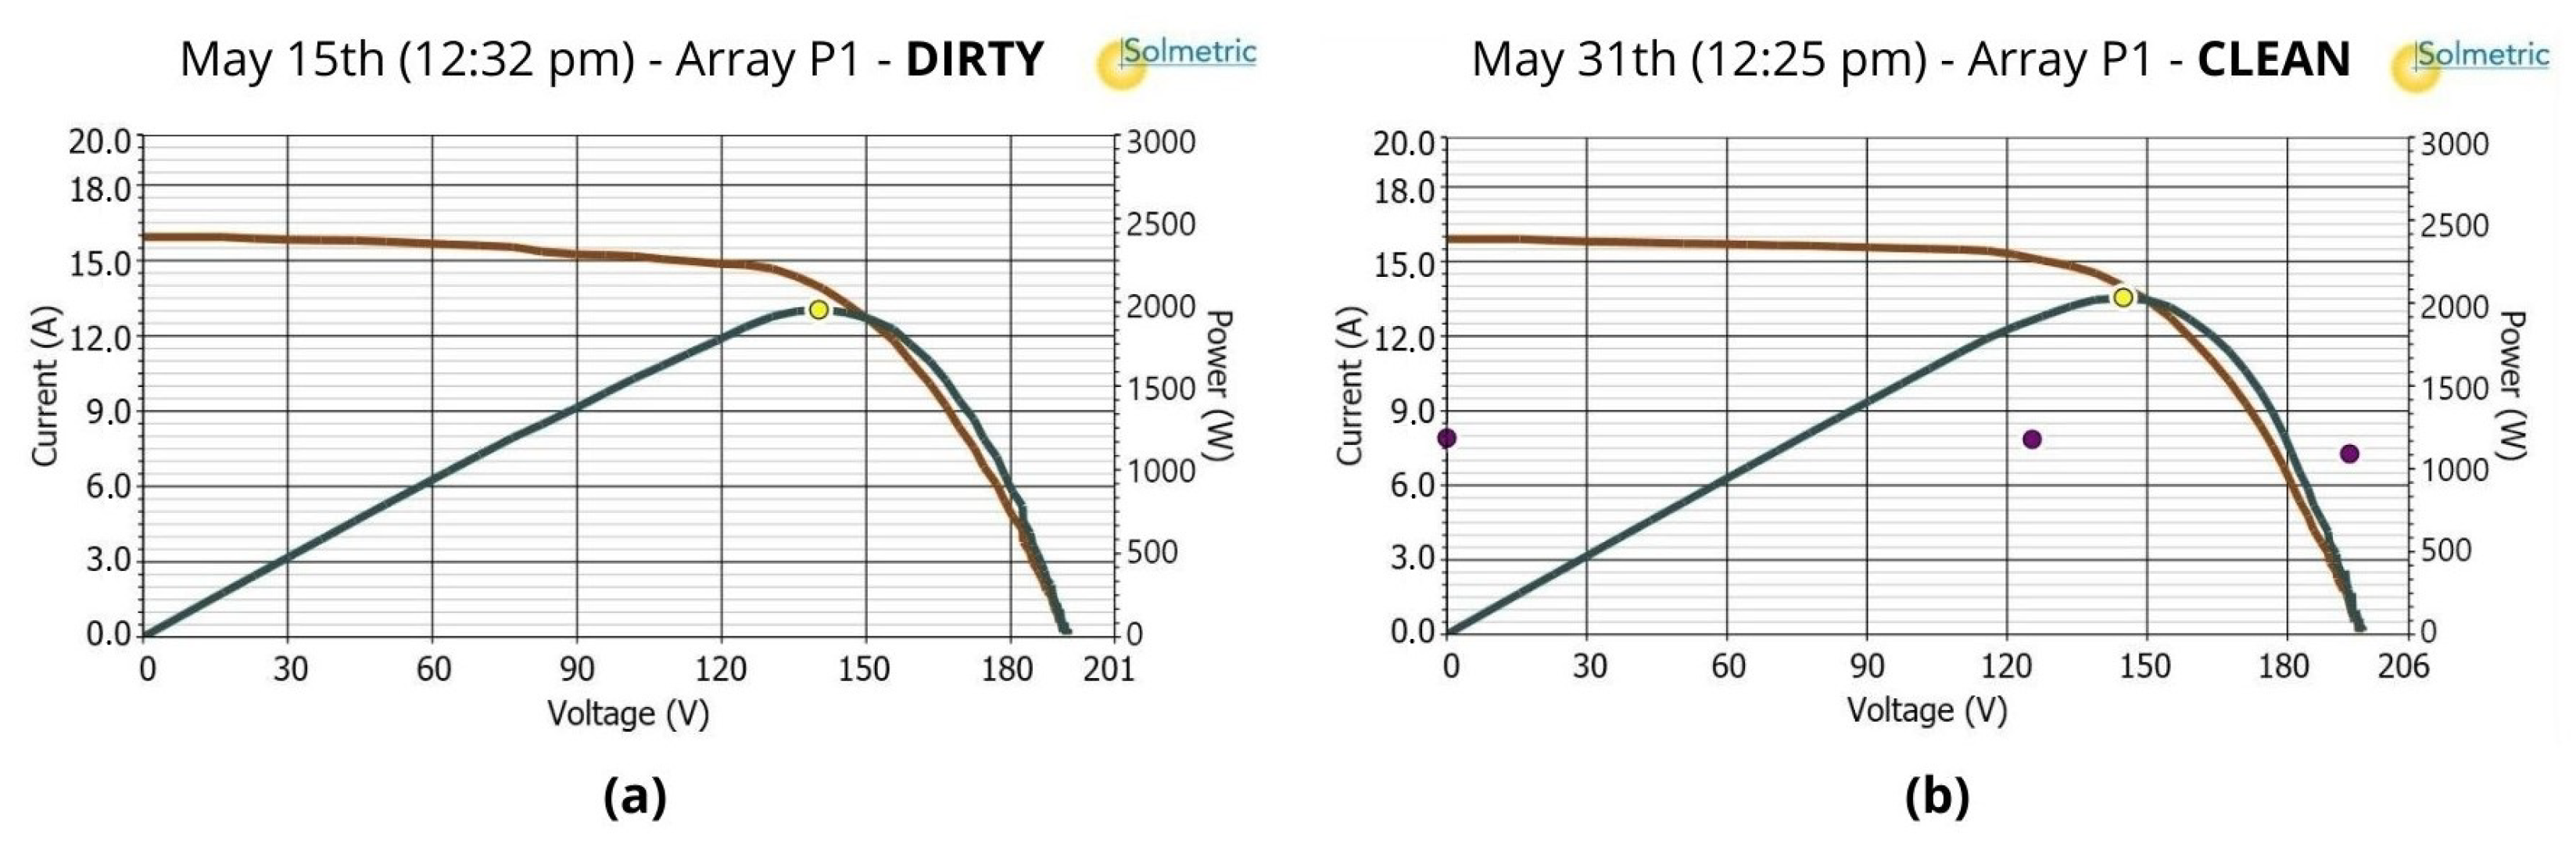
4.3. Arrangement P1
During the visual inspection of the P1 arrangement, it was observed that the modules located at the ends had a greater accumulation of dirt compared to the others. This was likely due to the effects of wind over the years. As a result, the decision was made to perform the thermal analysis at this specific location. As shown in
Figure 12, the results demonstrated an improvement similar to the other cases, with a significant reduction in dust accumulation.
In
Figure 13a, deformities in the curves are evident, consistent with the previously identified non-uniform dirt distribution pattern. In
Figure 13b, after the complete removal of dirt, there is a noticeable reduction in the deformation of the I–V curve, with values of
remaining constant, close to 15 A, for a longer duration until reaching the maximum power point. This improvement is significantly beneficial for the inverter, as it indicates less difficulty in aligning the current and voltage, thereby ensuring more efficient power operation at the maximum power point.
Unlike the other systems analyzed, the P1 arrangement has a higher , which is a result of compliance with an internal project at the TESLA laboratory. Nevertheless, the analysis of the soiling rate can be conducted in the same manner as with the other systems, and the results obtained were equally consistent.
Based on the qualitative evaluation, improved from 0.91 to 1.02. However, as observed in the other arrangements, did not reach the expected value of 1, remaining at a maximum of 0.72 for the clean system.
5. Discussion
Based on the qualitative analysis, the visual inspection revealed that all arrangements exhibited losses related to degradation over time, which were exacerbated by the prolonged period of exposure without maintenance. The removal of dirt resulted in a reduction in the operating temperature of the modules and a notable improvement in performance parameters. This improvement aligns with findings in the literature, where chemical compounds such as magnetite and hematite are known to cause high heat retention, further aggravating the degradation process.
In the quantitative analysis, which primarily focused on the SR factor that assesses the dirt present on the modules, all the configurations examined achieved a dirt rate of 1, considered the ideal value. The recovery of this factor, coupled with the export in the I–V curve, demonstrates the effectiveness of cleaning in regenerating , even for systems exposed to environmental conditions over the years.
However, when analyzing the , none of the studied arrangements achieved values corresponding to 1, with results remaining at 0.85, 0.46, 0.46, and 0.72 for the S1, F1, F2, and P1 arrangements, respectively. This indicates that environmental factors are causing direct losses in the maximum power output of the module. The power reduction can be explained by the action of the bypass diode, which is present in silicon modules. This protective mechanism operates when shading and localized heating occur; however, as shown in the analysis, some areas experience permanent heating, leading to a decrease in the module’s efficiency. It is also important to note that all arrangements exhibited non-conformities.
A comparison can also be made between the values obtained for and the P–V curve of the arrangements. Arrangements F1 and F2 exhibit a lower soiling rate, which results in a lower peak in the P–V curve compared to the other arrangements.
Given the importance of properly cleaning PV modules to prevent premature damage and ensure optimal system performance, and based on the performance rate, it is recommended that the modules undergo annual maintenance in August, considering the location of the TESLA PV Experimental Plant.
The data analyzed indicate that in August, there is extended exposure to the local dry period, which requires attention, as it promotes the accumulation of particulate matter on the modules. Under these conditions, the recommended performance ratio (PR) is approximately 72.8%. The dry period typically ends with sporadic rains in November, which, if greater than 5 mm, should help maintain the effects of cleaning. The rainy season, concentrated from January to March, will likely lead to a gradual decrease in PR until the next scheduled maintenance in August.
The data clearly demonstrate the need for periodic maintenance to avoid long-term damage to the system, with the maintenance frequency being dependent on the environment the PV modules are exposed to. This necessity is further supported by the restoration of the short-circuit current, the improvement in the I–V curve for all studied arrangements, as well as the reduction in operating temperature and the improvement in parameters such as the irradiance effectively captured by the module and the performance rate.
Over the long term, regular annual maintenance should help restore the TESLA PV Experimental Plant to optimal operating conditions, compensating for losses in maximum power output.
6. Conclusions
In light of the increasing demand for PV solar energy for both small and large-scale generation, this study emphasizes the importance of regular maintenance to ensure optimal system performance and mitigate long-term losses, in addition to demonstrating the effectiveness of cleaning in restoring the parameters of systems exposed to prolonged environmental conditions, as evidenced by the reestablishment of the I–V curves, the analysis highlights the critical role of maintenance in maintaining optimal system performance.
The gradual accumulation of particulate matter on the modules directly impacts system performance over time. As dirt accumulates, it reduces the system’s ability to capture irradiance, which is crucial for efficiently converting solar energy into electrical power.
Only installing a PV system does not ensure maximum efficiency throughout its lifespan. Natural wear and tear on electrical components can be significantly exacerbated by inadequate maintenance. This is evident through the evaluation of the soiling rate, which serves as a crucial indicator of system performance degradation.
The results indicate that the soiling rate for the analyzed arrangements ranged from 0.91 to 0.93 when measured with the modules in a dirty state. After successive cleanings, the SR consistently returned to its ideal value, as measurements were taken immediately following the cleaning process. Moreover, thermal imaging proved effective in visualizing dust accumulation on the modules. The quantitative analysis further demonstrated a reduction in operating temperature post-cleaning, a critical factor that directly impacts the energy generation efficiency of the system.
The soiling rate analyzed in terms of power () for the three cases remained below the estimated value, indicating that prolonged exposure to environmental factors, without proper periodic maintenance, may have caused irreversible damage to the electrical components of the cells.
The analysis methods employed were based on established regulations and literature, aligning with expectations, particularly concerning the performance of . For other aspects, the same theoretical framework was used to justify the system’s performance in relation to .


