Article

Impact Assessment of Second-Life Batteries and Local Photovoltaics for Decarbonizing Enterprises Through System Digitalization and Energy Management

by
Gerard Borrego-Orpinell
,
Jose-Fernando Forero
,
Adriano Caprara
and
Francisco Díaz-González
*,†
Centre d’Innovació Tecnològica en Convertidors Estàtics i Accionaments (CITCEA-UPC), Departament d’Enginyeria Elèctrica, Escola Tècnica Superior d’Enginyeria Industrial de Barcelona (ETSEIB), Universitat Politècnica de Catalunya, Av. Diagonal 647, Planta 0, Pavelló G, 08028 Barcelona, Spain
*
Author to whom correspondence should be addressed.
Serra Húnter Fellow.
Energies 2025, 18(5), 1198; https://doi.org/10.3390/en18051198
Submission received: 3 February 2025 / Revised: 21 February 2025 / Accepted: 21 February 2025 / Published: 28 February 2025
(This article belongs to the Section B: Energy and Environment)

Abstract

:
This paper shows an impact assessment of second-life batteries (SLBs) and local photovoltaics (PV) for decarbonizing enterprises through system digitalization and energy management. SLBs from electric vehicles offer a cost-effective and environmentally sustainable energy storage solution for enterprises. These systems can significantly reduce fossil fuel dependence coupled with local PV installations. This paper proposes a methodology for developing the complete digital twin of an enterprise in combination with an optimization algorithm for energy management. This methodology can be applied to a wide range of enterprises across different sectors, both industrial and non-industrial, with diverse consumption patterns. A sensitivity analysis has been carried out to evaluate the potential of this methodology for enterprises in different contexts, where different battery sizes, PV installations, consumption types, and environmental prioritization policies are encountered. Findings indicate that combining SLBs and PV installation, supported by digital energy management, can substantially reduce carbon footprints and operational costs.

1. Introduction

The reduction in greenhouse gas (GHG) emissions is one of the main challenges that EU society is facing. In Europe, energy generation and consumption accounts for more than 75% of total GHG emissions in the EU, while the transport sector accounts for the remaining 25% [1]. To decarbonize the economy, the European Green Deal planned a reduction of up to 90% of GHG emissions by 2050. Such a goal is tackled from diverse approaches and, among them, two of the strategic cornerstones are to decarbonize the industry sector—which accounts for 25% of total emissions—and road transport—which accounts for two-thirds of total GHG emissions of the transport sector. That is, road transport is intended to be electrical, and this imposes batteries as fundamental technologies to tackle. In addition, the decarbonization of the industrial sector is occurring through its electrification as well, and this also imposes batteries as fundamental technologies to promote local renewable generation integration and energy management. Adopting this approach, batteries—and in particular, second life batteries (SLB)—become one of the key drivers to promote synergies among the transport and the energy sector towards the energy transition, and this is the vision adopted in the present paper.
The growth of the global EV market is causing the massification of the production of batteries, since it is expected that between 112 and 275 GWh second-life batteries will become available per year for reuse by 2030 [2]. Even though battery storage systems are helpful for peak shaving [3], power system regulation and balance [4], renewable energy penetration [5], and transport sector decarbonization [6], the large number of retired batteries can generate relevant negative environmental effects during the use stages and final disposal [7].
Diverse methods to evaluate the required features of the battery to be utilized in a second use stage have been proposed based on capacity and voltage [8], resistance [9], capacitance [10], energy and volatility [11], amplitude, and consistency of the battery [12]. In general, SLBs remain at between 60 and 80% of their total capacity after eight and ten years of operation [13], which means that using them in certain applications would be more profitable than purchasing new storage devices [14,15]. To condense the models and prepare them for simulations and testing, the digital twin (DT) concept is widely deployed [2].
Battery DTs have been developed for State-of-X (SoX) estimation [16], sharing services [17], battery monitoring [18], and predictive maintenance use cases [19], where re-purposing and second-life applications have gained interest recently [20]. The above references are examples on the development of DTs for research purposes. In addition, DTs are core technologies for battery-related products such as Battery Management Systems (BMSs) and software for techno-economic analysis on battery-based projects. An example of such software is taken from the enterprise reLi [21]. The key technology here is a software that, based on the digitalization of batteries, solves its optimal sizing and operation optimization from final user premises such as load and renewable power sources and financial project goals. An industrial example of the usage of DTs for BMSs is taken from the enterprise STMicroelectronics [22]. This is a large manufacturer of microchips for the diverse applications of all ranges, i.e., from smartphones to electric cars and giant factory machines. Their products under the brand AutoDevKit offer, among several others, BMSs which state estimation, battery protection, and management are based on embedded battery models, where parameters are updated in time from field measurements (i.e., battery digital twins).
On the other hand, the estimation and control of pollutant emissions are currently key in the context of climate change. For SLBs, the life cycle analysis (LCA) approach to measure the environmental impact has recently been incorporated into optimization algorithms [7,23]. Initially, the LCA has been carried out to identify the influence of sizing and cell chemistry into life-cycle carbon emission [24], or analyze the reusable components of EV batteries [13]. Even a digital twin based on LCA is proposed to quantify the environmental impact highlighting potential biases when using general data. Subsequent works have sought to extend the SLB’s LCA to include its second use stage, measuring its environmental benefits. The environmental benefit of lithium-ion SLB in storing wind and photovoltaic electricity excess is assessed considering performance degradation and economic values through a Crandle-to-Gate approach of three different diagnosis scenarios using Gaby Education 2020 software [25]. The fact stands out that recycling the entire battery pack generates more significant benefits than using modules or cells separately. Other studies evaluate the environmental impact of SLBs applying Cradle-to-Grave methodology in buildings [26] and ceramic industry applications [27] with a Monte Carlo simulation and Simapro 9 software, respectively. Previous studies on SLB LCA in enterprise applications based on consumption patterns are scarce.
The relevant results of LCA studies on SLB’s mention that a global warming potential (GWP) reduction between 2.8% and 18.5% in comparison with the usage of the new lithium-ion battery is obtained in [26]. Savings of up to 74.8% could be achieved with an optimal combination of SLBs and standalone PV system as stated in [27]. Industry 4.0 has a strong component of blockchain technology making the sustainable manufacturing and management of the product life cycle. The optimal operation of SLBs, the new renewable energy, and the electrification of manufacturer processes from an environmental perspective are still challenging.
Furthermore, while economic and environmental feasibility are critical factors in SLB adoption, regulatory and policy considerations also play a significant role. Government incentives, such as tax credits, grants, and feed-in tariffs, can encourage the deployment of SLBs in industrial applications. However, regulatory barriers, including grid interconnection restrictions and end-of-life battery handling uncertainties, pose significant challenges. Current legislation varies widely across jurisdictions, impacting the ability of enterprises to integrate SLBs efficiently [28].
Moreover, grid interconnection policies often dictate the conditions under which industrial energy storage systems can participate in electricity markets or provide ancillary services, potentially limiting their economic benefits. In some regions, rigorous technical requirements for SLB deployment may discourage adoption due to compliance costs [28]. Additionally, environmental, social, and governance (ESG) compliance frameworks influence investment decisions, as enterprises with strong ESG performance tend to attract more capital for green energy projects [29]. The evolving landscape of ESG reporting has led to the increased scrutiny of industrial decarbonization efforts, reinforcing the need for clear and supportive regulatory frameworks that balance sustainability goals with economic viability. Addressing these barriers requires a coordinated approach among policymakers, industrial corporations, and energy regulators to develop standardized guidelines that facilitate the integration of SLBs while ensuring grid stability and compliance with environmental policies [29].
Based on the preceding discussions, this paper will assess the impact of incorporating an optimal SLB size and its energy strategy for a distinctive range of enterprises using a digital twin over a one-year simulation period. The primary contributions of this paper are as follows:
  • Assessment of the impact of SLBs over one year for an enterprise, within the waste management and urban environmental services sector, using digital twins and energy management tools.
  • Utilization of a multi-objective optimization strategy for energy management, considering the internal state of the battery. This strategy addresses economic factors (operational costs and battery degradation) and environmental factors.
  • The presentation of a methodology that applies to a broad spectrum of enterprises, accommodating various battery and PV sizes, consumption patterns, and prioritization strategies for economic and environmental criteria.

2. Methodology

To evaluate the potential of managing stationary energy storage in the industrial sector towards the minimization of electricity bills and the utopia of a 0% environmental footprint, this paper proposes the development of a complete mathematical model of an enterprise plant and its main assets (i.e., a complete digital twin) in combination with an optimization algorithm for energy management. To ensure the applicability of the proposed methodology across different industrial sectors, this study first presents a validation of the methodology in a case study context in Section 3. Then, the validation is extended to various industrial contexts, considering four distinct industrial sector energy consumption profiles:
  • Type A: Constant energy consumption throughout the day.
  • Type B: High daytime energy consumption and low nighttime consumption.
  • Type C: High nighttime energy consumption and low daytime consumption.
  • Type D: Peak energy consumption at specific times of the day or week.
Figure 1 illustrates the proposed methodology for optimizing industrial energy management through digital twins and optimization algorithms. The figure delineates the three key layers of the methodology, which consist of the physical layer, the digital twin layer, and the energy management layer. The interaction between these layers enables precise control over industrial energy assets, allowing an optimized power exchange between the storage system, PV system, and the grid. By integrating SLBs, digital twins, and optimization algorithms, this approach improves operational efficiency and sustainability.
The structured representation of Figure 1 serves as a foundation for the subsequent sections, where each component is analyzed in detail. Section 2.1 presents the digital twin of the stationary energy storage system, the PV system, and the enterprise loads. This section also includes a description of the inner control loops for the power exchanged by the power converters of the system. Then, Section 2.2 describes the energy management layer, mainly composed of the algorithms for the forecasting of the electricity price, PV generation, and load consumption; and also a mathematical optimization problem for solving the power setpoint in time for the stationary energy storage system.

2.1. Digital Twin Development

This section describes the mathematical model of all relevant enterprise assets for the present work. In Section 2.1.1, the digital twin for the stationary energy storage system is described. The digital twin for the PV system is described in Section 2.1.2. Finally, Section 2.1.3, depicts the modeling of the enterprise loads.

2.1.1. Second-Life Battery System

This section introduces the SLB system, its modeling approach, and its role in managing power setpoints.
The SLB physical layer is composed of a battery pack connected to an inverter. The battery pack is effectively refactored based on SLBs, as further depicted in Section 3. The inverter ensures that active power flow aligns with the specified optimization setpoints, and maintains stable dynamics between the DC-link internal inverter bus and grid interactions. If the grid frequency, battery voltage, or current exceeds safe limits, the system automatically disconnects from both the grid and the battery to prevent potential issues. In this case, an error flag is sent to the digital twin to avoid updating the digital twin of the SLB and the optimization algorithm.
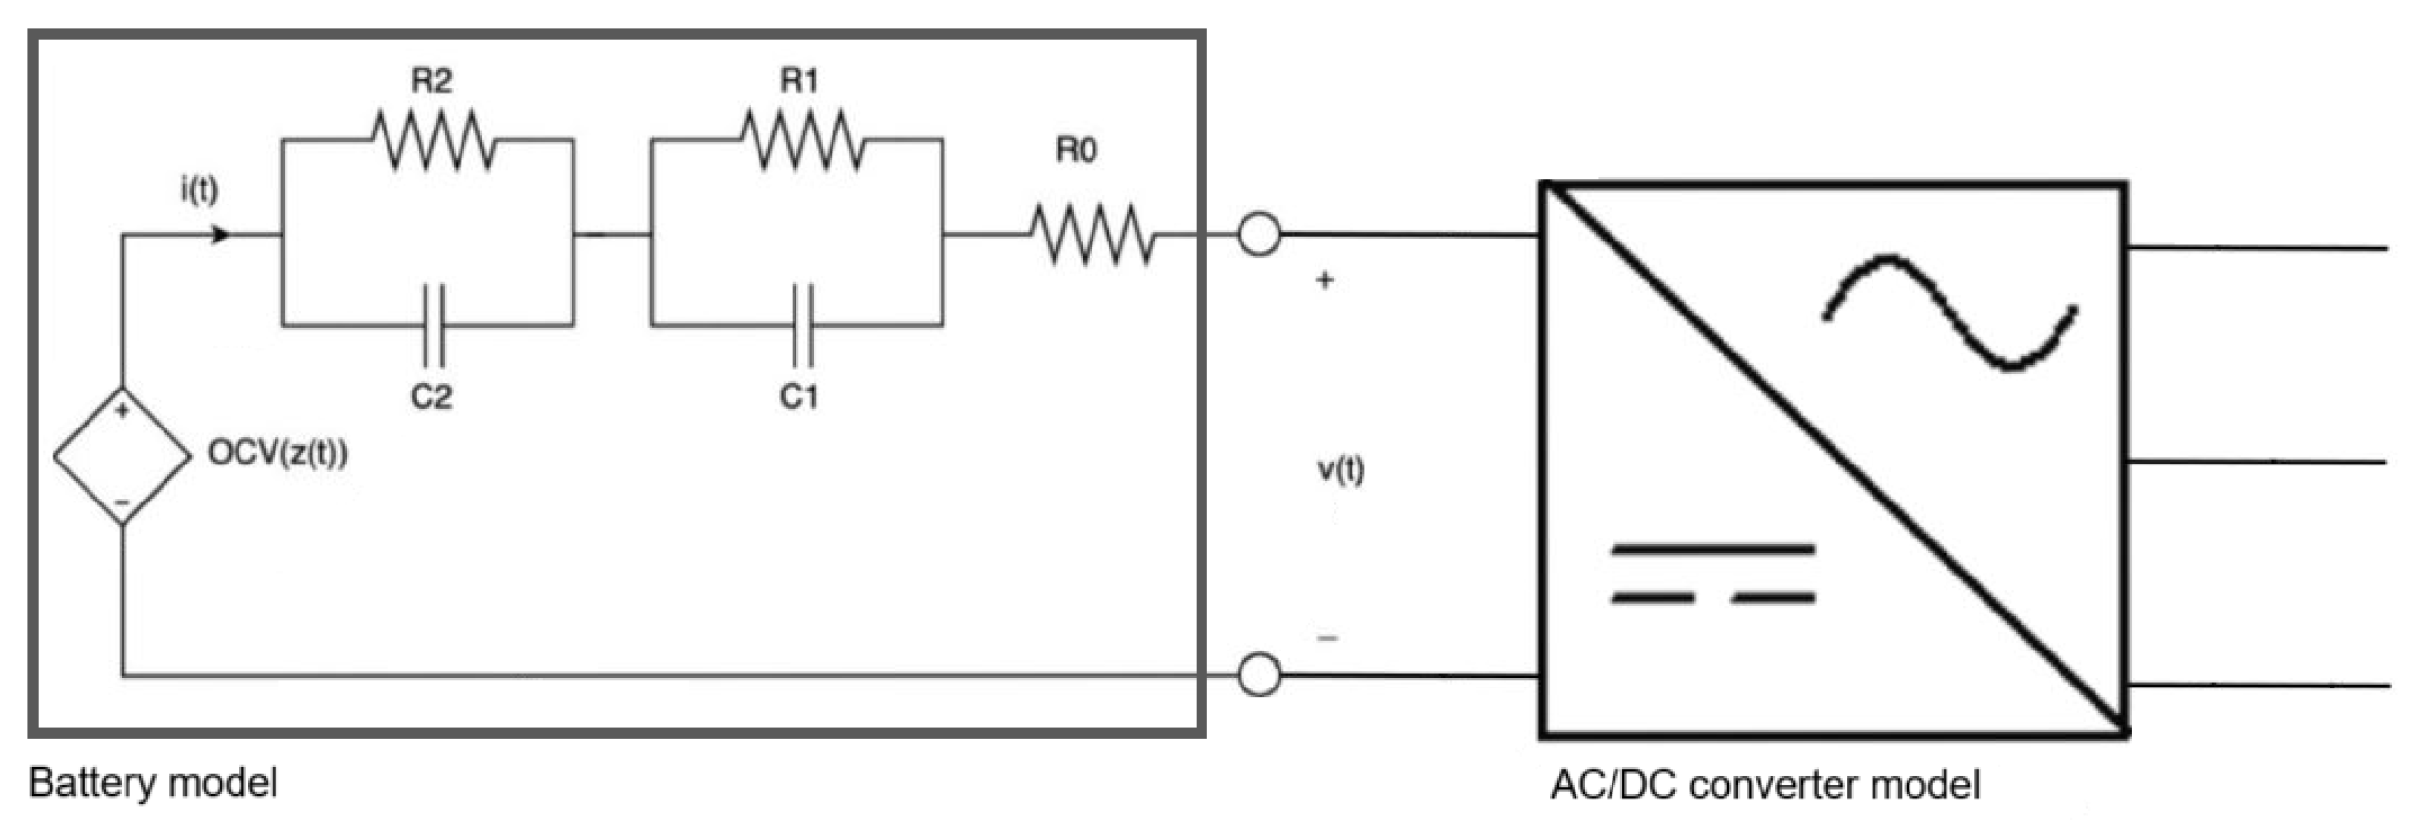
The digital twin of the SLB, illustrated in Figure 2, mathematically represents the internal states of the battery physical system as well as the inputs and outputs of the AC/DC converter. It consists of two main components, the battery model, and the AC/DC converter model.
The battery model is implemented using an equivalent electrical circuit. This circuit resembles the electrical behavior of the whole pack to a large battery cell. The equivalent circuit comprises a voltage source O C V ( z k ) , that represents the open circuit voltage of the pack, and the value of which depends on the state-of-charge (variable z k , for time k). The state of charge ( z k ) is used to obtain the initial conditions of the battery in the optimization algorithm of Section 2.3. The impedance of the pack is a combination of RC parallel associations with parameters R 1 , R 2 , C 1 , and C 2 in series with a pure ohmic resistance R 0 . The resistance R 0 determines the instantaneous voltage drop (or overvoltage) that the pack experiences at the time of exchanging current, while the RC associations represent the relatively slow dynamics for the voltage until the pack reaches a steady state condition (so the transients due to relaxation periods or start-up processes). Such voltage dynamics can be associated with the electrochemical phenomena of diffusion and charge transfer in electrodes [30,31].
So, all in all, and given a current i k in Amperes (positive for discharging); a Coulombic efficiency η in per unit values; and a rated capacity Q in A·s, the state-of-charge for time k is expressed as in Equation (1)
z k + 1 = z k η · i k · Δ t / Q .
The current through the resistive part of the RC branches, i R 1 , k and i R 2 , k , can be expressed using Equation (2),
i R j , k + 1 = e Δ t R j C j · i R j , k + ( 1 e Δ t R j C j ) · i k ,
being j the branch index.
Thus, the battery terminal voltage v k is obtained through Equation (3),
v k = O C V z k R 0 · i k R 1 · i R 1 , k R 2 · i R 2 , k .
In the real-time application, the above-presented model is fed by the current measurements i k . This updates the states of the battery pack, i.e., z k and i R j , k ; consequently, the voltage v k .
A least squares algorithm is utilized to further enhance the performance to update the parameters of the 2RC Thevenin model based on the stored voltage data. The least squares method minimizes the sum of the squared differences between the observed and predicted values, allowing for the estimation of optimal model parameters. This algorithm iteratively adjusts the Thevenin model’s parameters to ensure that it remains consistent with the actual behavior of the battery system, enabling accurate representation and enhanced performance in the optimization process [32].
The battery model is connected to a bi-directional AC/DC converter model, that acts as a current source, with its output following an efficiency curve extracted from experimental data acquired in the laboratory for both grid-to-battery and battery-to-grid power flows. The charge and discharge values are constrained by the converter limits ( P ACDC - limit = ± 40 kW; I DC - limit = ± 160 A) and the available battery power. Additionally, the AC/DC converter model receives the grid or battery error flag to effectively stop the digital twin until further notice. Resetting the converter can be done either manually or from the digital twin.

2.1.2. Photovoltaic-Based Power Generation System

This section introduces the photovoltaic-based power generation system, its modeling approach, and its role in managing PV power output.
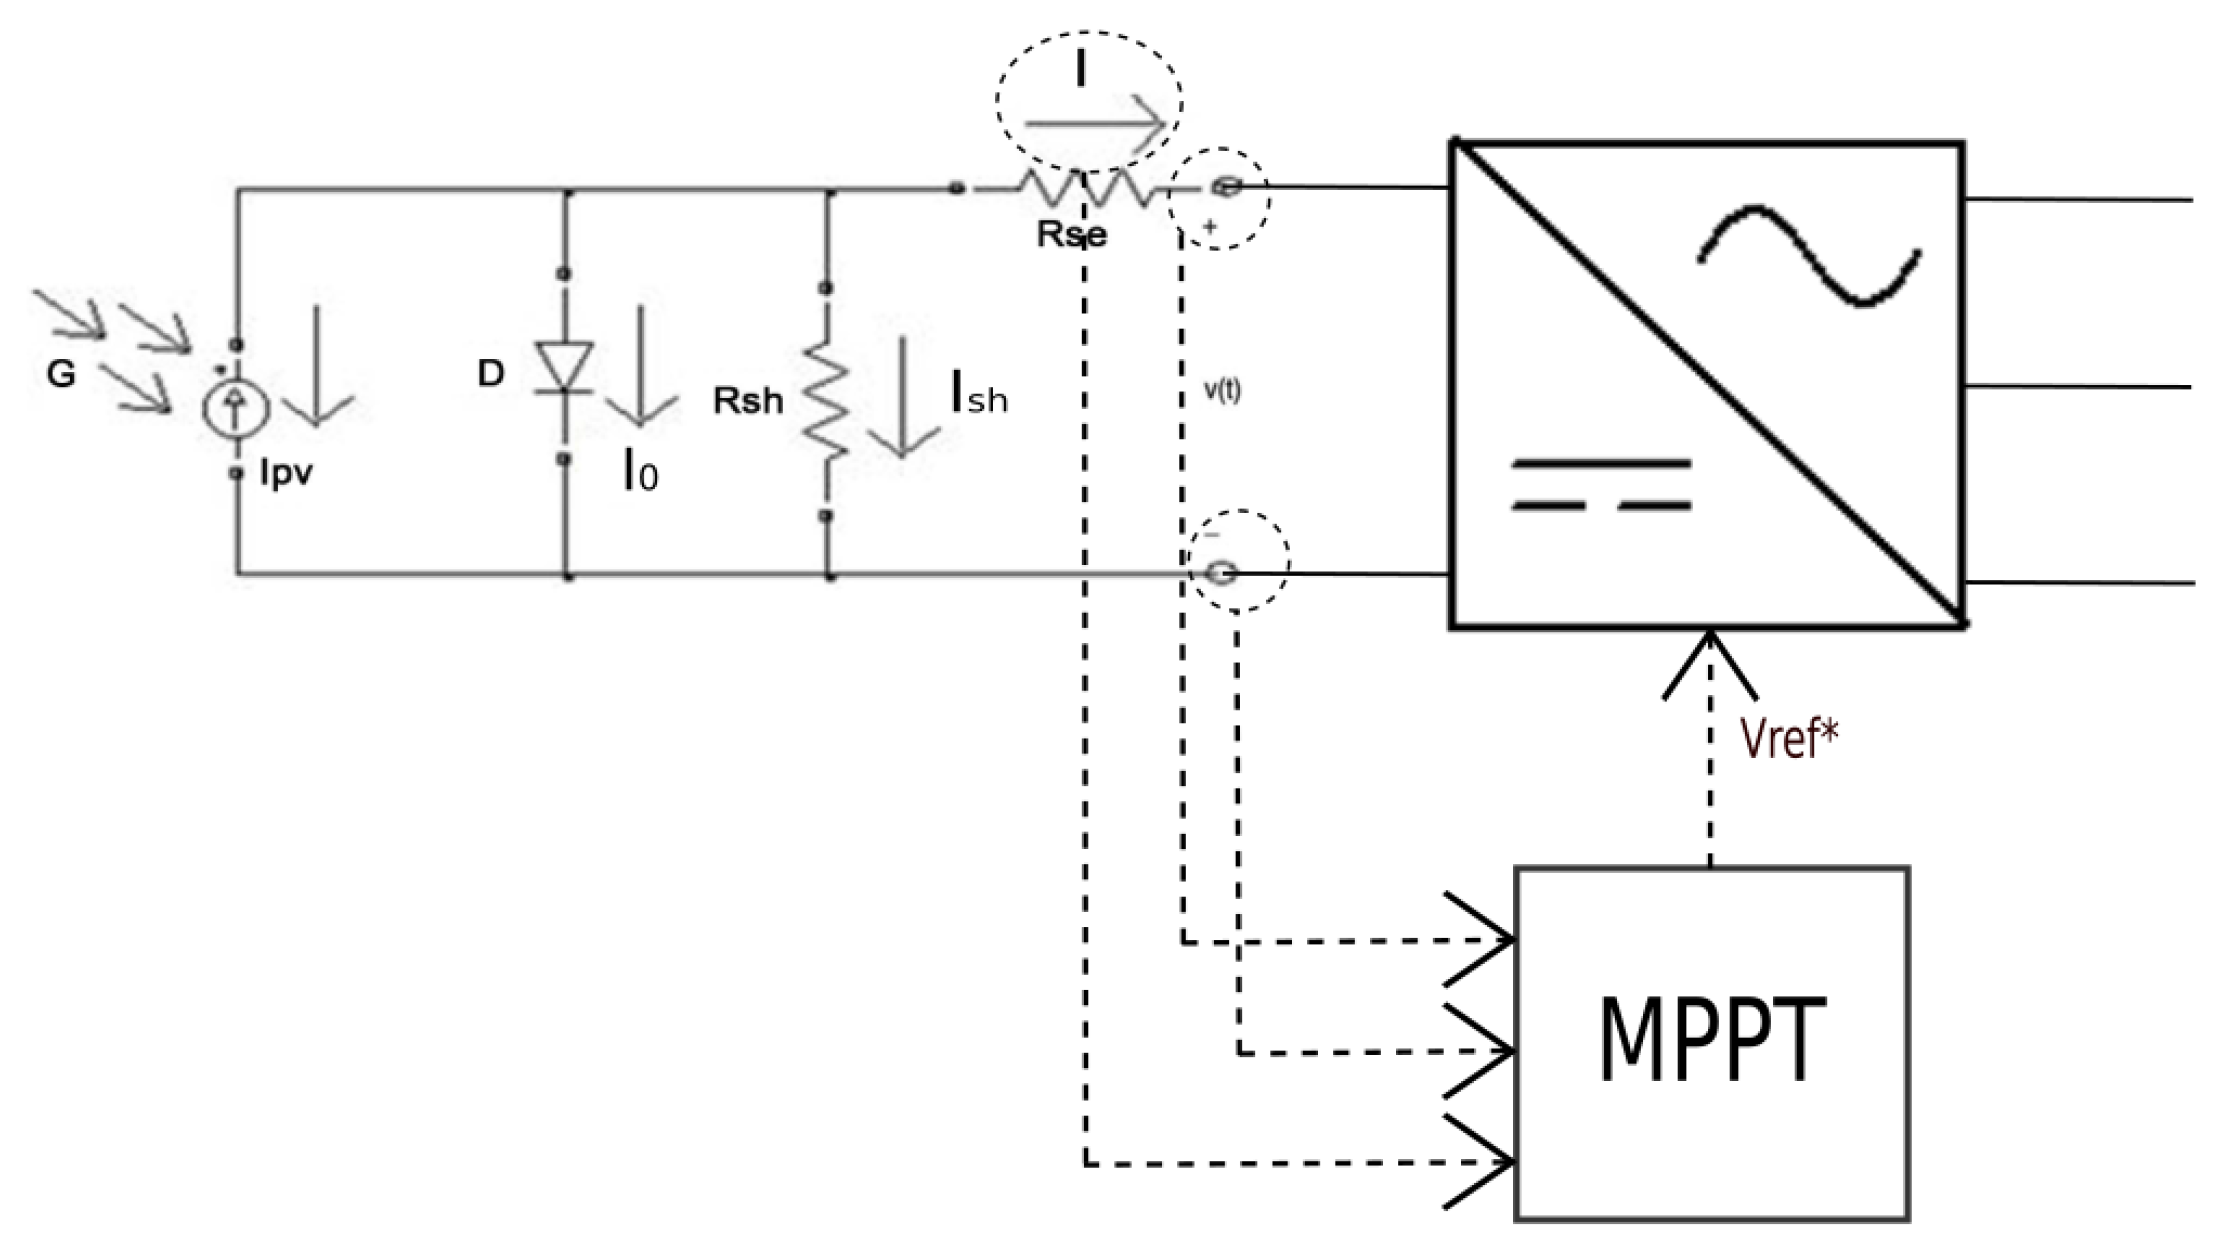
The photovoltaic-based power generation system is a crucial component for converting solar irradiance into electrical power. The system comprises PV modules and a PV converter installed in the selected enterprise and it is effectively modeled in a digital twin. The model consists of a PV array model connected to a PV inverter model which controls the voltage of the PV array through an MPPT algorithm, as depicted in Figure 3. The digital twin of the photovoltaic-based power generation system not only provides a mathematical representation of its internal states but also serves as a key tool for predictive analytics. By continuously updating real-time irradiance, voltage, and power output data, the digital twin enables the more accurate forecasting of PV generation. This forecast is then used as an input for the optimization algorithm, allowing energy scheduling and improved system efficiency.
The PV array model converts sunlight irradiance data into electrical energy using a single-diode equivalent circuit model. This model is obtained by connecting multiple PV cells in series and parallel [33,34]. The electrical characteristics of the PV cell model, such as current, voltage, or resistance, vary when it is exposed to light. The voltage–current relationship Equation [34] for a solar cell is given by Equation (4),
I = I p v I 0 e x p q V + I · R P K · T a 1 V + I · R S R P ,
where I p v represents the light-generated current or photocurrent, I 0 is the cell saturation of dark current, in Amperes; q is the electron charge, 1.602176634 × 10⁻¹⁹ Coulomb; K is the Boltzmann’s constant, 1.38 × 10⁻²³ J/K; T is the cell’s working temperature; a is an ideal factor, which represents the deviation of the actual cell behavior from the ideal behavior of a theoretical PV cell ( a = 1 : ideal behavior); R s h is the shunt resistance of the cell, in Ohm; and R e is the series resistance of the cell, in Ohm.
The photocurrent I p v mainly depends on the solar insolation and the cell’s working temperature, as given by Equation (5),
I p v = [ I s c + K i · ( T T n ) ] · H ,
where I s c is the cell’s short-circuit current at 25 °C and 1 kW/m2; K f is the cell’s short-circuit current temperature coefficient, in A/K; T n is the cell’s reference temperature, in Kelvin; and H is the solar isolation, in kW/m2.
The cell’s saturation current I 0 varies with the cell temperature, as indicated in Equation (6),
I 0 = I S C + K i · T T n e x p V O C + K v · T T n / ( a · N s · V t ) 1 ,
where V O C is the cell’s open circuit current at 25 °C and 1 kW/m2; K v is the cell’s open circuit voltage temperature coefficient, in V/K; N s is the number of cells connected in series per string; and V t is the thermal voltage given by V t = K · T / q .
The total current I of the PV array is given by Equation (7),
I = N p · I p v N p · I 0 · e x p q · ( V + I · R p ) N s · K · T 1 ,
where N s is the number of cells in series and N p is the number of cells in parallel. The resistance R p is given by Equation (8) as
R p = N s · R s / N p .
The values for R S and R P are calculated iteratively by equating the maximum power P m a x , m obtained from the model to the experimental maximum power obtained from the specification sheet of the PV. In the iterations, Equations (9) and (10) are computed, where the voltage V m p and current I m p , which give the maximum power, are iteratively calculated. Thus,
P m a x , m = V m p I p v I 0 e x p q k B T V m p + R s I m p a N s 1 V m p + R s I m p R p = P m a x , e ,
and
R p = V m p V m p + R s I m p V m p I p v V m p I 0 e x p q k B T V m p + R s I m p a N s + V m p I 0 P m a x , e .
The AC/DC PV converter extracts PV power by varying the duty cycle of its transistors to change the converter impedance. Moreover, the AC/DC PV converter sets the input PV voltage to an optimal voltage that extracts the maximum PV power, using maximum power point tracker (MTTP) algorithms. Perturb and observe (P&O) is an MTTP algorithm that shifts the operating point of the PV voltage array to its maximum power rating by continuously varying the array voltage [35]. In the case of the efficiency curve of an AC/DC PV converter, it varies depending on the voltage at the input and load of the inverter. In this research, for simplicity, the average efficiency ( η p = 0.984), the power limits ( P P V m a x = 100 kW), and a fixed input PV voltage ( V P V m a x = 600 V) recommended by the AC/DC manufacturer of the case study [36] have been taken into account.
In the real-time implementation, the PV model parameters will be updated using an online optimization method based on the Levenberg–Marquardt algorithm, [37]. In particular, to improve the efficiency of the algorithm, an adaptive Levenberg–Marquardt (ALM) method with an adaptive damping factor selection strategy has been developed to solve the parameter optimization problem. The ALM method dynamically adjusts the damping factor during the optimization process, leading to faster convergence and improved accuracy in parameter estimation. To further enhance the algorithm’s effectiveness, only those parameters of the PV module that have a significant influence will be updated. Those parameters are the temperature under standard test condition (STC) ( T r ), in K, the solar irradiance under STC ( G r ), in W/m2, the open-current voltage under STC ( V o c r ), in V, the number of PV cells connected in series and parallel (m and n) and the short-circuit current under STC ( I s c r ), in A. By focusing on the most influential parameters, computational resources are utilized more efficiently, reducing the computational burden associated with parameter optimization.

2.1.3. Enterprise Loads

The enterprise consumption model consists of an application programming interface (API) that allows the reception of measurements from the sensors installed in the enterprise consumption points. The historical data of the measurements are stored in a database accessible from the cloud. Through this API, the historical consumption data of up to the last 7 days can be extracted from the database to be processed by the forecasting algorithm (see Section 2.2).
The enterprise’s total energy consumption, as seen in Section 3, is the aggregate of multiple loads, including office electricity use, electric vehicle charging stations, and gas-powered vehicle compressors. The energy demand of the office facilities remains relatively constant throughout the day and night, contributing to a stable base load. In contrast, the charging stations and compressors introduce significant power peaks at specific times, particularly during vehicle charging cycles or gas compression operations. These peak loads create fluctuations in the overall consumption profile, which must be effectively managed through energy storage and optimization strategies.

2.2. Forecasting Algorithms for Electricity Price, PV Generation, and Load Consumption

This section provides an overview of the forecasting models used in this study. As discussed in Section 2.1.3, the real-time measurements from the enterprise’s physical layer serve as inputs for the digital twins, enabling the forecasting of key variables required by the optimization algorithm.
To ensure a realistic and representative forecasting approach, historical real-world data from 2022 have been utilized. This dataset corresponds to the enterprise introduced in Section 3, whose energy consumption profile remained stable after the integration of an electric vehicle fleet in 2021. The selection of 2022 is justified by the consistency of operational patterns and load characteristics, ensuring that the forecasted values accurately reflect a typical enterprise behavior. Furthermore, for validation purposes, the dataset has been scaled to align with the installed PV capacity currently installed, ensuring the optimal integration of forecasted values into the energy management system.
In Section 2.2.1, the methodology for forecasting electricity prices is presented, while Section 2.2.2 details the forecasting models for PV generation and load consumption.

2.2.1. Forecast Algorithm for Electricity Price

The electricity price forecast is obtained with a multiple linear regression (MLR) algorithm, taking the marginal price of the Spanish day-ahead market as the target variable. Firstly, the dataset is created by gathering the target variable and external features from the System Operator Information System (ESIOS) [38] of the Spanish grid. Additionally, calendar variables such as the hour or a binary variable to indicate whether it is a workday or not are engineered. With an hourly granularity, the dataset ranges from 1 January 2021 to 31 June 2022. To avoid over-fitting and ensure that only meaningful variables are included, recursive feature elimination with cross-validation (RFECV) is performed, with the final set of features shown in Table 1.
Other algorithms were considered, but ultimately MLR was the algorithm of choice. Apart from being a simple, computationally efficient, and well-known benchmark method, this is also justified by the presence of strong predictors of the target variable. The presence of target variable lags implies a significant linear relationship between external features and the target variable, validating the choice of the MLR algorithm. Furthermore, the electricity price is subject to trend disruptions, as shown by COVID-19 and the Ukraine War [46]. The frequent re-training of the algorithm is facilitated by MLR, which ensures good performance even with smaller datasets, unlike more complex models that are prone to over-fitting.
Simulating periodical model updates, results are obtained for the year 2022 by retraining the model every 3 months, extending the training dataset each time. For example, to obtain the predictions from July to September 2022, the training dataset ranges from 1 January 2021 to 31 June 2022. For visualization purposes, the results are shown as a single time series in Figure 4, where predicted values are compared with the held-out validation set. Then, the metrics mean absolute error (MAE), root mean squared error (RMSE), and coefficient of determination ( R 2 ) are used to evaluate the performance, as shown in Table 2.

2.2.2. Forecast Algorithm for PV Generation and Load Consumption

For the forecasting algorithm related to PV generation and load consumption, an Autoregressive Integrated Moving Average (ARIMA) model is employed. ARIMA incorporates autoregressive and moving average components, along with differencing to handle non-stationary data. The ARIMA algorithm is chosen for its superior accuracy in capturing time-related changes compared to other methods such as moving averages, multiple regression models, exponential smoothing, and neural networks [47].
Regarding the consumption case, the forecast model utilizes historical data from the database covering the past 7 days, recorded at quarterly hourly intervals. This approach allows the model to comprehensively represent consumption patterns for each day of the week, including holidays when consumption tends to be lower. For the irradiance case, historical data from the database from the past 24 h, recorded at quarter hourly intervals, has been used.
The ARIMA model accommodates seasonality by effectively capturing repeating patterns at fixed intervals. The model parameters are estimated, optimizing them based on the historical data [48]. The forecast is calculated using the estimated model and historical data to generate quarter-hourly forecasts for the next 24 h [49]. Figure 5 presents the forecasted enterprise consumption based on the ARIMA model. This forecast is essential for optimizing energy management decisions, as it allows the system to anticipate energy demand patterns and align them with a PV generation availability. The forecast results demonstrate the model’s ability to capture daily consumption trends, including peak demand periods and lower consumption during off-peak hours. The 90% confidence interval provides an estimate of the forecast’s reliability, ensuring that energy management strategies can account for potential variations.

2.3. Optimization Algorithm for the Energy Management of the Enterprise

The optimization algorithm manages the energy flows within the enterprise, optimizing to reduce the environmental impact and increase the economic benefit. The optimization problem is described through a set of input parameters, decision variables, objective functions, and associated constraints.

2.3.1. Input Parameters

The optimization input parameters are as follows:
  • Cost of electricity at time t, C p t , in EUR/kWh.
  • Purchased electricity life cycle emission factor at time t, F g t , in kg·CO2eq/kWh.
  • Electricity selling price to the grid at time t, C s t , in EUR/kWh.
  • Cost of the contracted power, C c , in EUR/kW-day.
  • Photovoltaic energy generated at time t, E P V t , in kWh.
  • Photovoltaic life cycle emission factor, F p v , in kg·CO2eq/kWh.
  • Energy consumption at time t, E c t , in kWh.
  • Battery 2 n d life capacity, E b , in kWh.
  • Battery maximum, nominal, and minimum voltage, V b m a x , V b r a t e d , and V b m i n , in Volts.
  • Battery maximum charge and discharge, I c m a x and I d m a x , in Amperes.
  • Battery internal resistance, R b , in ohms (Ω).
  • Slope and y-intercept factors of the linear trend in the SOC-OCV characteristic (from 90% to 10% SOC), a and b, in p.u.
  • Battery remaining cycles of the second-life application, N c y c , in units.
  • Battery nominal price C b n , in EUR/kWh.
  • Battery price reduction factor for second-life applications, F b r , in p.u.
  • Battery life cycle emission factor, F b , in kg·CO2eq/kWh.
  • Battery bi-directional DCDC converter charging and discharging efficiency, η c and η d , in p.u.

2.3.2. Decision Variables

The decision variables for the optimization algorithm are as follows:
  • Energy charged by the battery at time t, e c t , in kWh.
  • Energy discharged by the battery at time t, e d t , in kWh.
  • Energy purchased from the grid at time t, e p t , in kWh.
  • Energy sold to the grid at time t, e s t , in kWh.
  • Charged power by the battery at time t, p c t , in kW.
  • Discharged power by the battery at time t, p d t , in kW.
  • Contracted power from the grid, p c , in kW.
  • State of charge of the battery at time t, z t , in p.u.
  • Battery charged current at time t, i c t , in Amperes.
  • Battery discharged current at time t, i d t , in Amperes.
  • Open circuit voltage of the battery at time t, o c v b t , in Volts.
  • Voltage at the battery terminals at time t, v b t , in Volts.

2.3.3. Objective Function and Constraints

The enterprise’s operational costs, named J hereinafter, included two terms: the economic one and that associated with the environmental impact.
The economic operational costs, noted as J e c hereinafter, are defined by the energy exchanged with the grid, the power contracted, and the aging of the batteries. This yields a cost in monetary units through the following equation:
J e c = t e p t · C p t e s t · C s t + C c · p c + + C a · t e c t + e d t 2 · E b ,
where C a , in EUR/cycle, is a penalization cost associated with the battery number of cycles, which depends on the aging, the cyclability, and the total energy storage capacity of the batteries,
C a = E b · C b n · F b r N c y c .
In turn, the operational costs for the enterprise associated with the environmental impact, noted as J e n hereinafter, are defined by the CO2 footprint per kWh exchanged through the following equation,
J e n = t ( F g t · e p t + F b · ( e c t + e d t ) + F p v · E p v t ) ,
where factors F g t , F b , and F p v accounts for total life cycle emissions, expressed as total GWP, in kg·CO2eq/kWh, and associated to the energy purchased from the grid, the energy exchanged by the battery and the energy produced by the PV panels, correspondingly. The calculation of these parameters for the SLB and PV embraces the cradle-to grave LCA approach, which evaluates the carbon footprint from raw material extraction and material processing, passing by assembly, commissioning, usage stages, and final disposal. Specifically, both the remanufacturing and installation in a new stationary use application are included in the SLB’s emission factor calculation, taking into account the system boundaries exposed by [50], and the assumed substitution level in relation to a new battery in [51]. IPCC 100-year GWP impact factors are used for a cumulative environmental impact calculation. Please find the assumed factors F b and F p v in Table 3. Likewise, factor F g t is extracted from the ESIOS platform. In particular, this is a 15 min interval CO2 emission curve associated with the electricity generation mix in the country. Thus, this is the most relevant variable to forecast emission in Catalonia’s Autonomous Community (Spain) [52], this being the location of the case study shown later in the paper.
So, the total operational costs for the enterprise are defined by the sum of the above-defined two functions J e c and J e n . However, these two functions cannot be accounted for in a single mathematical expression unless expressed in the same units. To do so, both are normalized—so expressed in per unit values—and from their corresponding reference values J e c * and J e n * . In addition, to weight the economic impact in the overall total operational costs over the environmental impact, and vice versa, a parameter α is included. All in all, the function J becomes
J = α · J e c J e c * + ( 1 α ) · J e n J e n * .
To optimize the operational costs for the enterprise, the energy exchanged among the main assets of the enterprise and the electrical grid must be obtained by solving the following optimization problem
min e c t , e d t , p c t , p d t , e p t , e s t , p c , z t , i c t , i d t , o c v b t , v b t J ,
subject to:
  • The system energy balance should be ensured, so
    e d t · η d + e p t e s t e c t / η c + E P V t E c t = 0 t T .
  • The maximum power exchanged with the grid must be lower than the contracted power as,
    p c > = e p t / Δ t t T .
    and
    p c > = e s t / Δ t t T .
  • In turn, the energy exchanged by the battery is related to its instantaneous power as,
    e c t = p c t · Δ t t T ,
    and
    e d t = p d t · Δ t t T .
  • The instantaneous power of the battery is, in turn, related to the instantaneous voltage and current. The product i c t · v b t and i d t · v b t makes the optimization nonlinear. The complexity and optimization time is reduced by simplifying the constraint by calculating the power with a mean voltage value of the battery, V b r a t e d . This allows the optimization to remain linear. Therefore, the power constraints are defined as,
    p c t = i c t · V b r a t e d t T ,
    and
    p d t = i d t · V b r a t e d t T .
  • The voltage at the battery terminals is calculated as,
    v b t = o c v b t + R b · i c t R b · i d t t T ,
    where the open circuit voltage o c v b t is approximated by a linear trend from the state of charge z t ,
    o c v b t = a · z t + b t T ,
    and the state of charge is computed as
    z t = z t 1 + e c t e d t E b t T .
  • The voltage, current, and state of charge limitations of the battery are stated by,
    V b m a x < = v b t < = V b m i n t T ,
    I c m a x < = i c t t T ,
    I d m a x < = i d t t T
    and
    z m a x < = z t < = z m i n t T .
  • Finally, the state of charge at the final period of the horizon of the optimization should only deviate a fraction γ from the initial state of charge to ensure the replicability of the method in time. So,
    z t 0 > = z t e n d · ( 1 + γ )
    and,
    z t 0 < = z t e n d · ( 1 γ ) .

3. Case Study

The case study focuses on implementing the proposed methodology in a specific enterprise within the waste management and urban environmental services sector. The case study is also extended to various enterprise consumption pattern contexts using a sensitivity analysis. This section is structured as follows:

3.1. Enterprise-Specific Analysis

The selected sector for the case study analysis is the waste management and urban environmental services sector. The enterprise under study is principal in Spain, and it offers integrated waste collection, transportation, and treatment solutions from various sources including construction, industrial, and public administration sectors. The enterprise characteristics and the results of the specific analysis are described in the following subsection.

3.1.1. Enterprise Characteristics

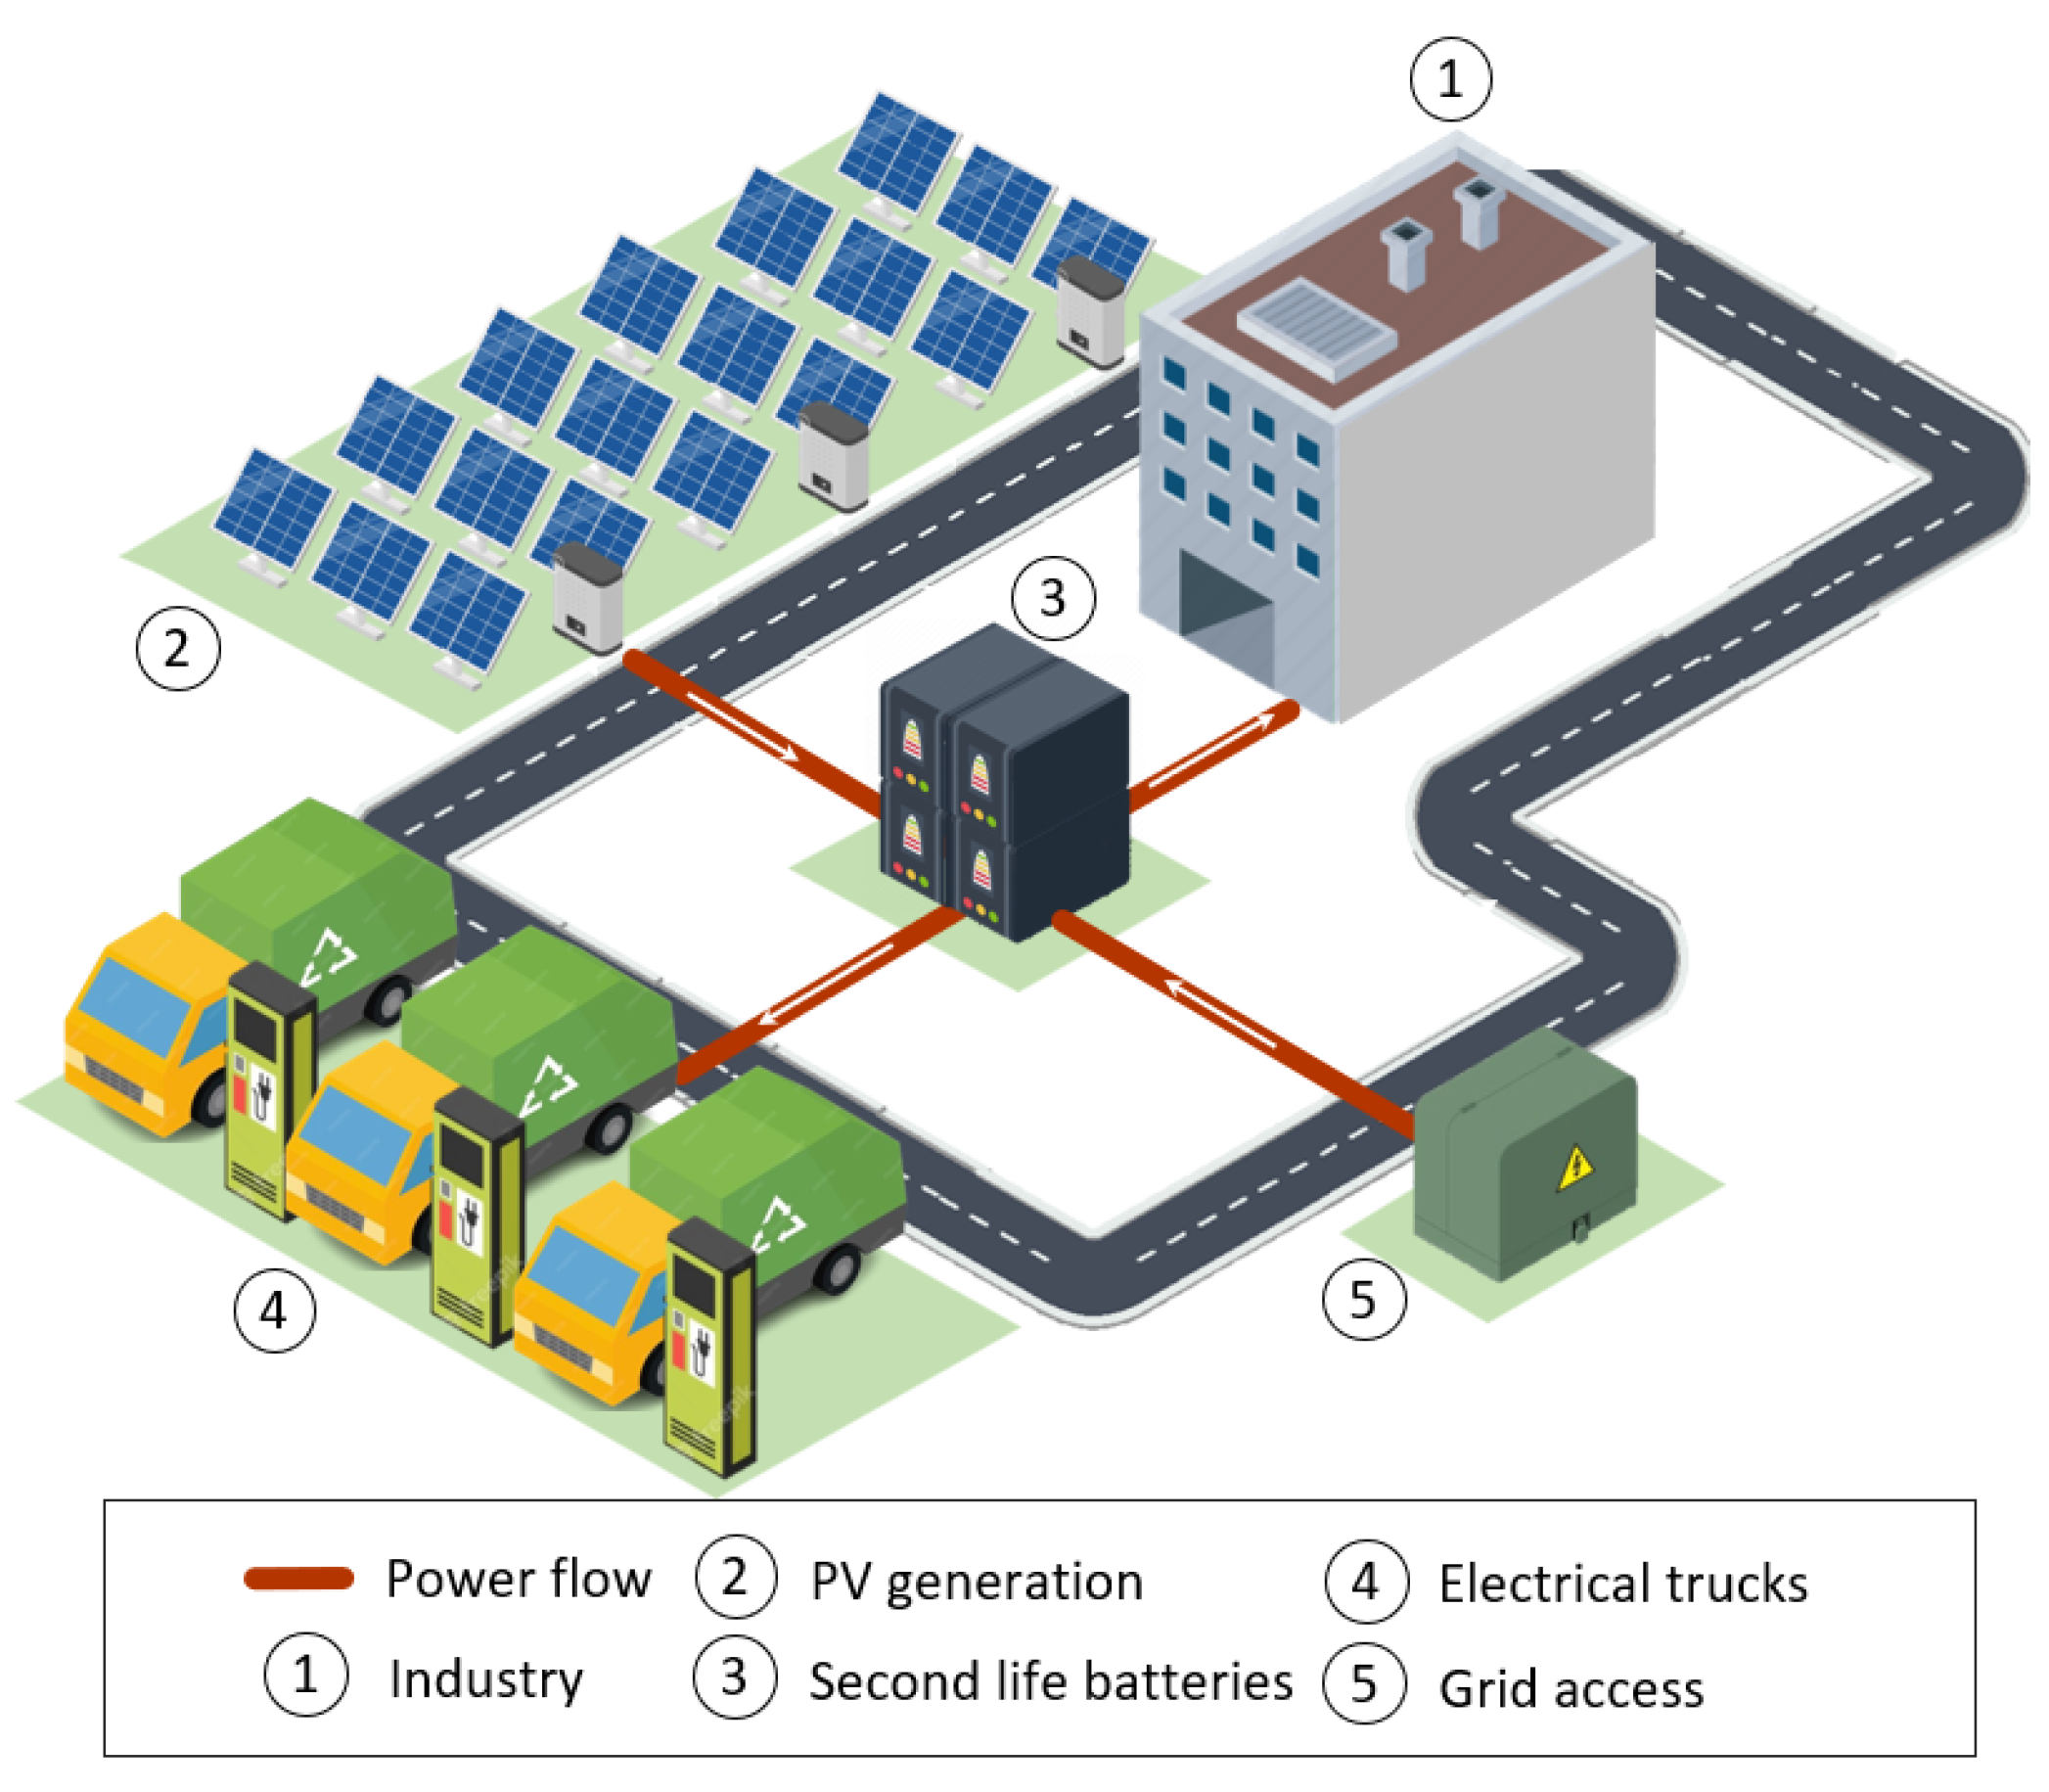
This subsection outlines the enterprise’s key characteristics, detailing its main components and the primary sources of power consumption. Figure 6 provides an overview of the enterprise’s energy infrastructure, highlighting the integration of various assets such as electric vehicle charging stations, offices, PV generation, and SLB storage. The enterprise operates a charging station for different types of vehicles involved in waste collection, such as electric, hybrid, and gas-powered vehicles. The station is responsible for servicing the waste collection needs of Barcelona (Spain) and its metropolitan area.
Energy consumption within the enterprise is distributed across various components. Office spaces exhibit consistent energy usage during working hours. Electric truck charging stations demand higher energy during specific periods. Moreover, the gas compression station’s demand is intermittent and dependent on operational requirements. Total aggregated consumption remains at a relatively constant daily average of 300 kW.
The PV generation of the enterprise consists of a 333 kWp PV array. Daily power generation varies seasonally, with PV generation typically producing surplus power only during peak solar hours, particularly in months with higher solar irradiance.
Additionally, the enterprise deploys an SLB energy storage system. The battery cells were previously utilized in electric trucks during their first life, experiencing high power demands. Subsequently, the batteries have been repurposed for a second-life storage application within the enterprise, where the power demand is comparatively lower. The selection process for these cells involved testing them in CITCEA-UPC’s laboratory, and only cells with a State of Health (SoH) between 55% and 80% were chosen to constitute the energy storage system.
Table 4 summarizes the key specifications of the enterprise’s infrastructure, providing details of consumption, generation, and energy storage attributes.

3.1.2. Results for the Selected Enterprise

The simulation of the proposed methodology has been carried out for the indicated use case. For this purpose, the optimization algorithm and the digital twins have been run for one year to analyze the results. To reduce the simulation time, without losing the annual representativeness, one working day and one holiday of each month of the year have been simulated, extrapolating the results for the rest of the days of the year.
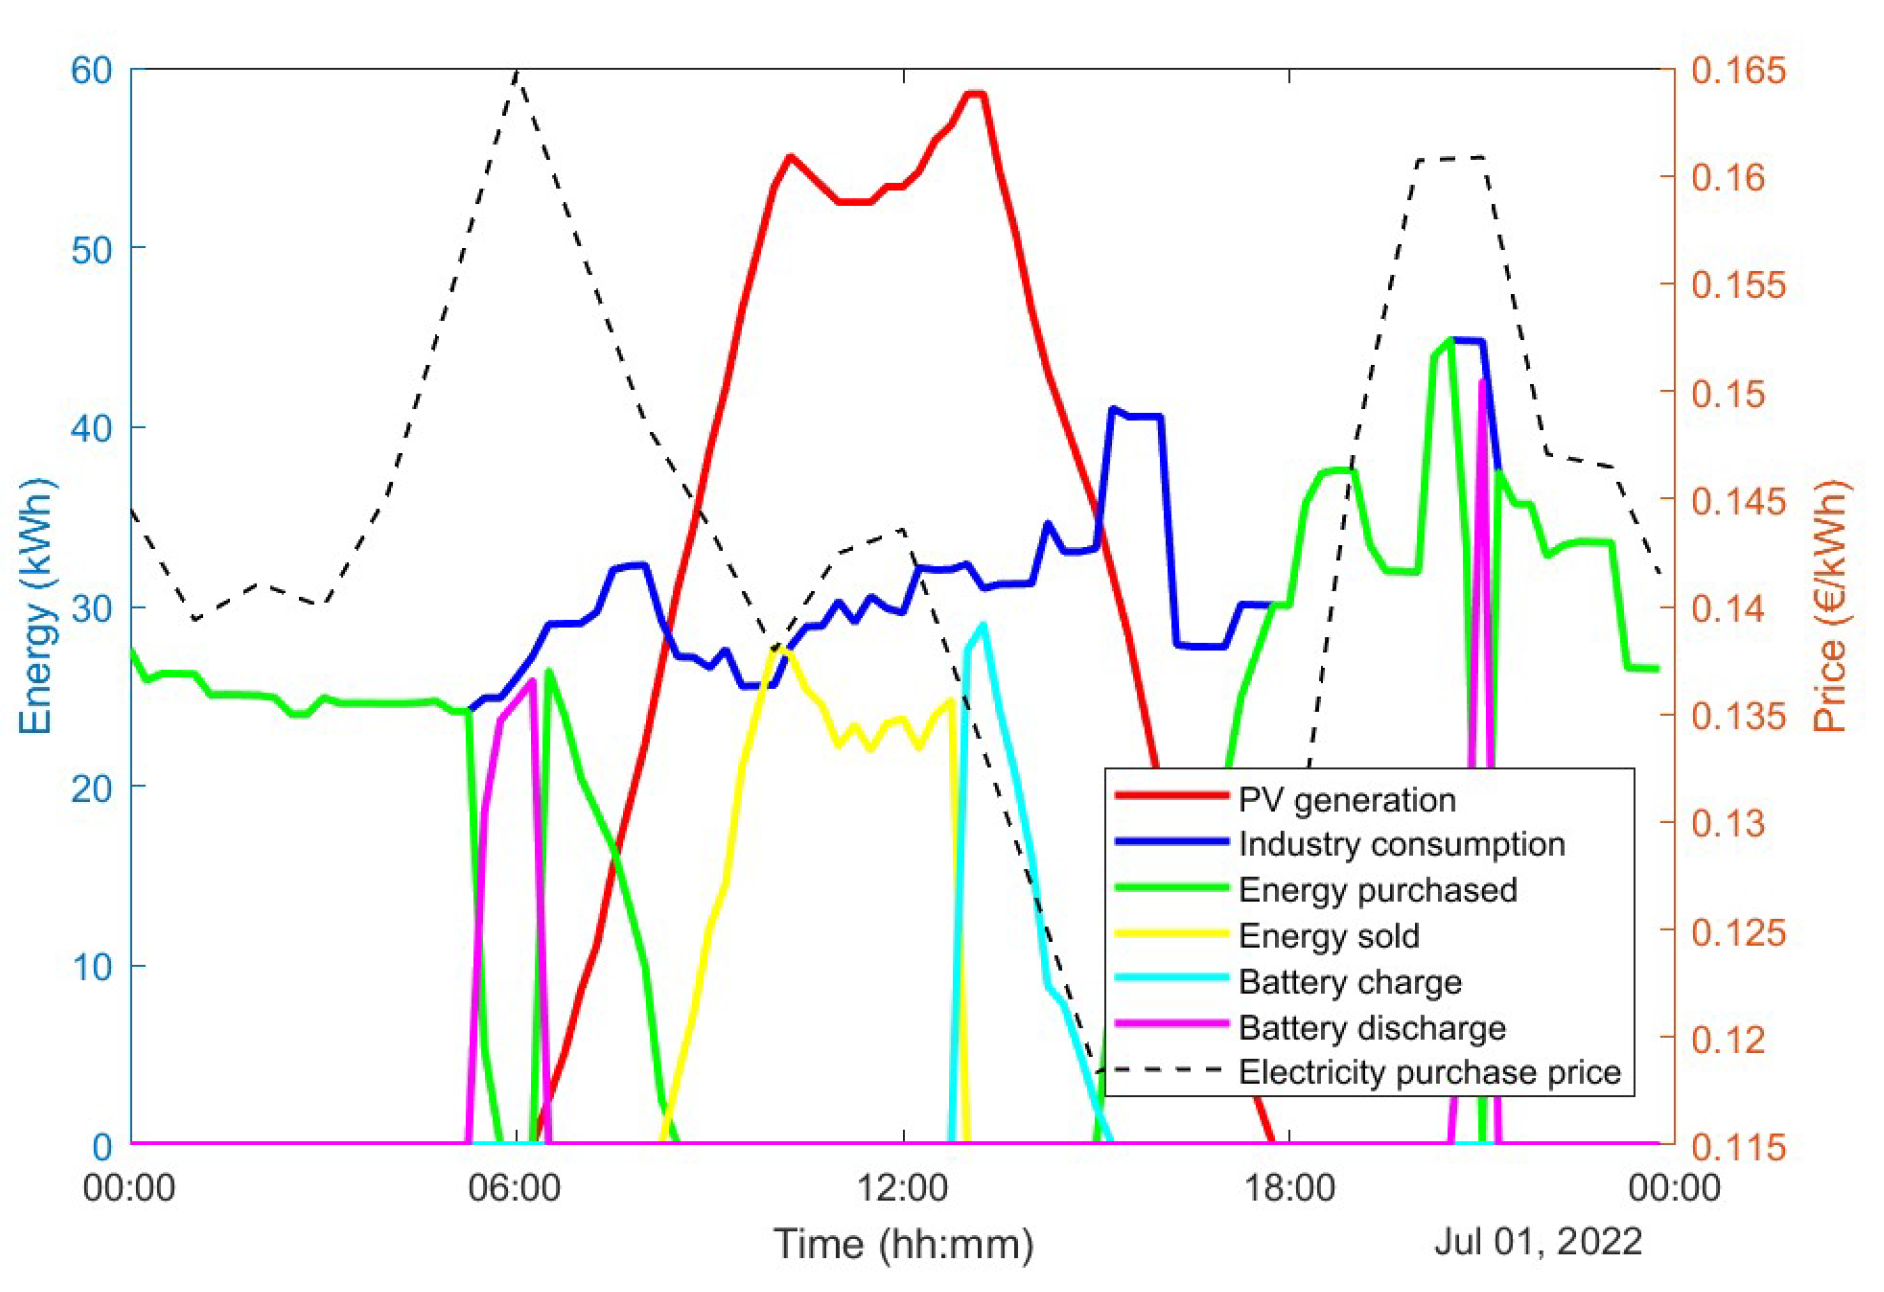
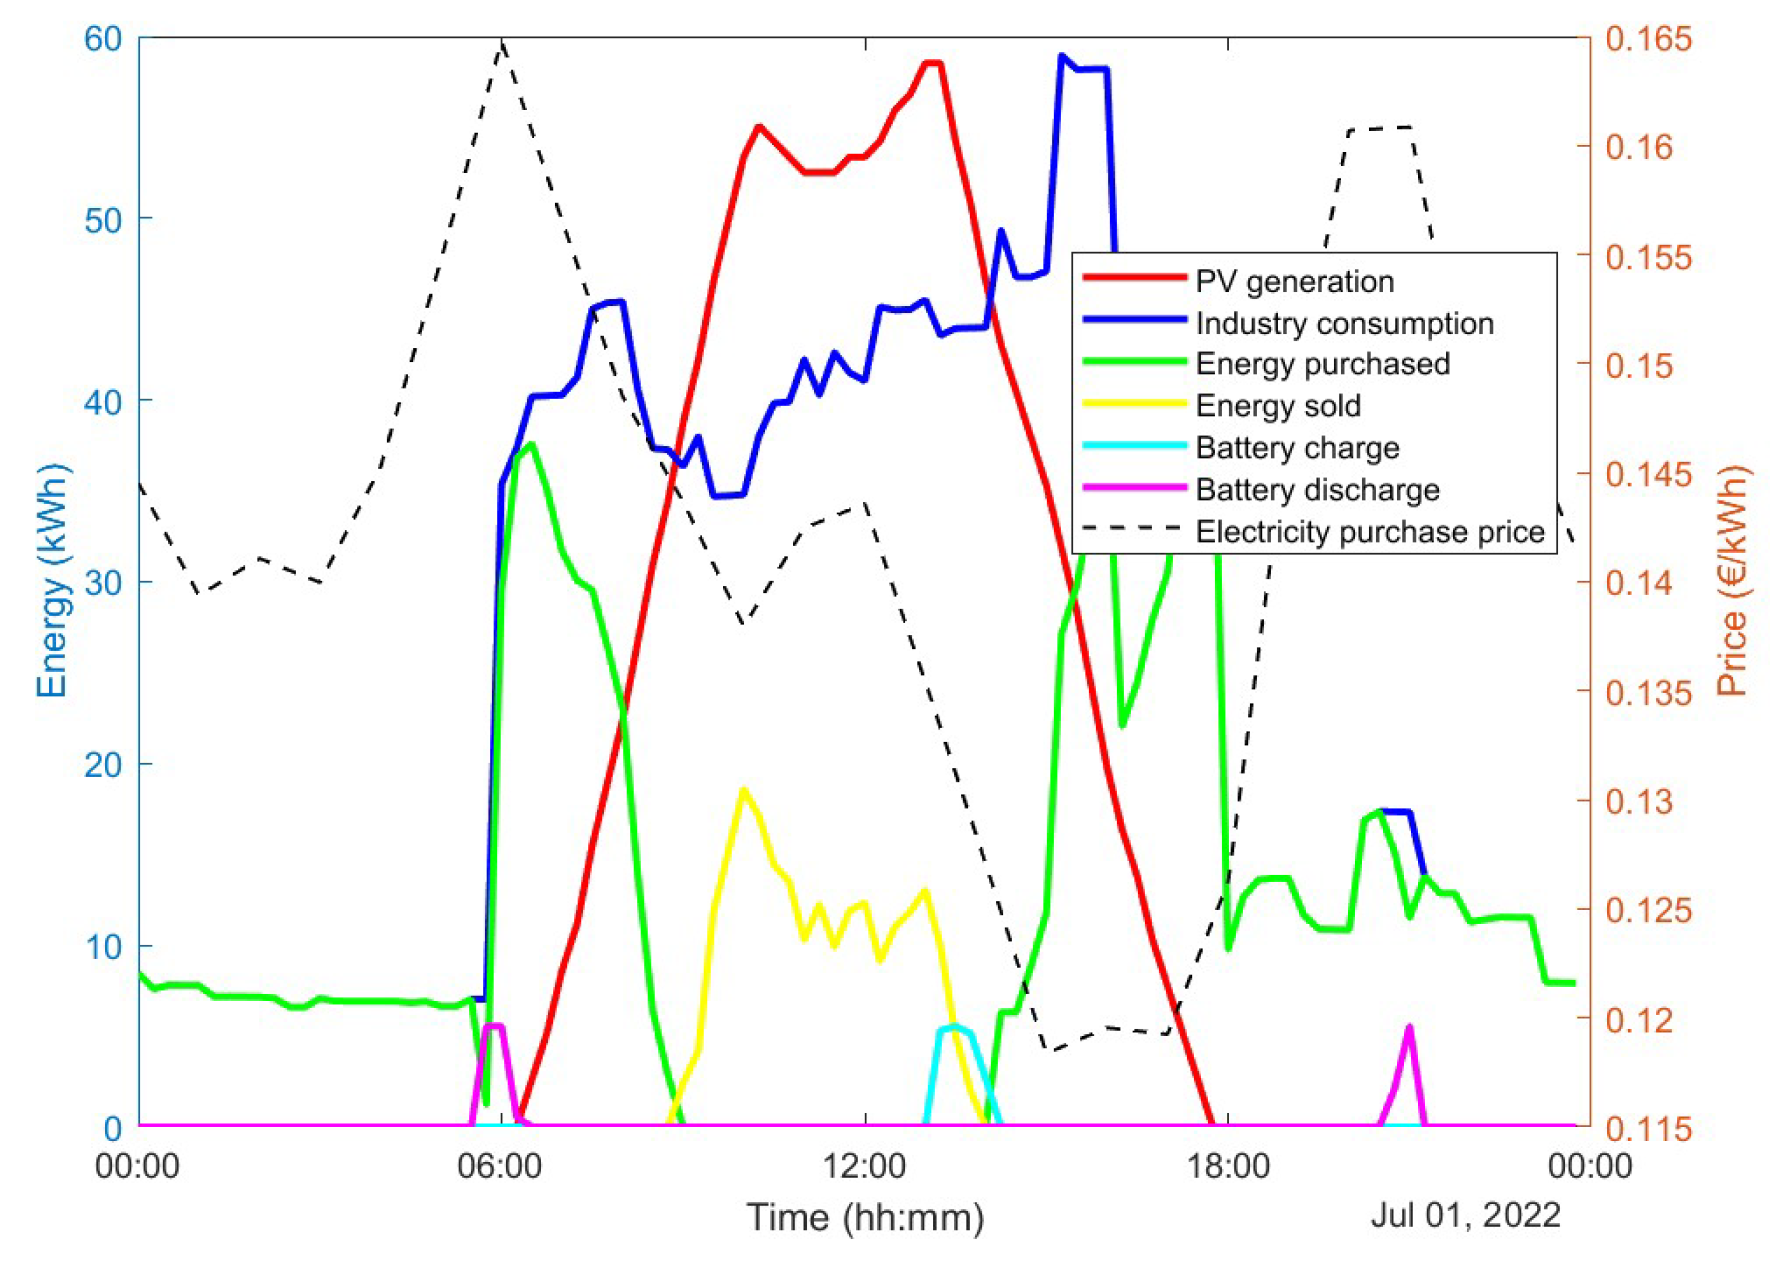
Figure 7 shows the result of a 24 h simulation of the optimization algorithm. This figure presents the input forecasts of PV energy generation, energy consumption by the enterprise, and energy price, along with the optimization results for energy purchases and sales to the grid, battery energy charge, and battery energy discharge. The energy purchased from the grid occurs primarily during periods of lower PV generation, such as early morning and late evening, and aligns closely with periods of higher enterprise consumption. There are intermittent periods where energy is sold back to the grid, particularly during times of high PV generation, as these surpluses are sold to the grid. Battery charging is noticeable during the morning and afternoon, coinciding with times when the PV generation is relatively high. Battery discharge occurs in the evening and early morning, covering periods of high consumption when PV generation is not available and the moments when the electricity price is higher, demonstrating the effective use of stored energy.
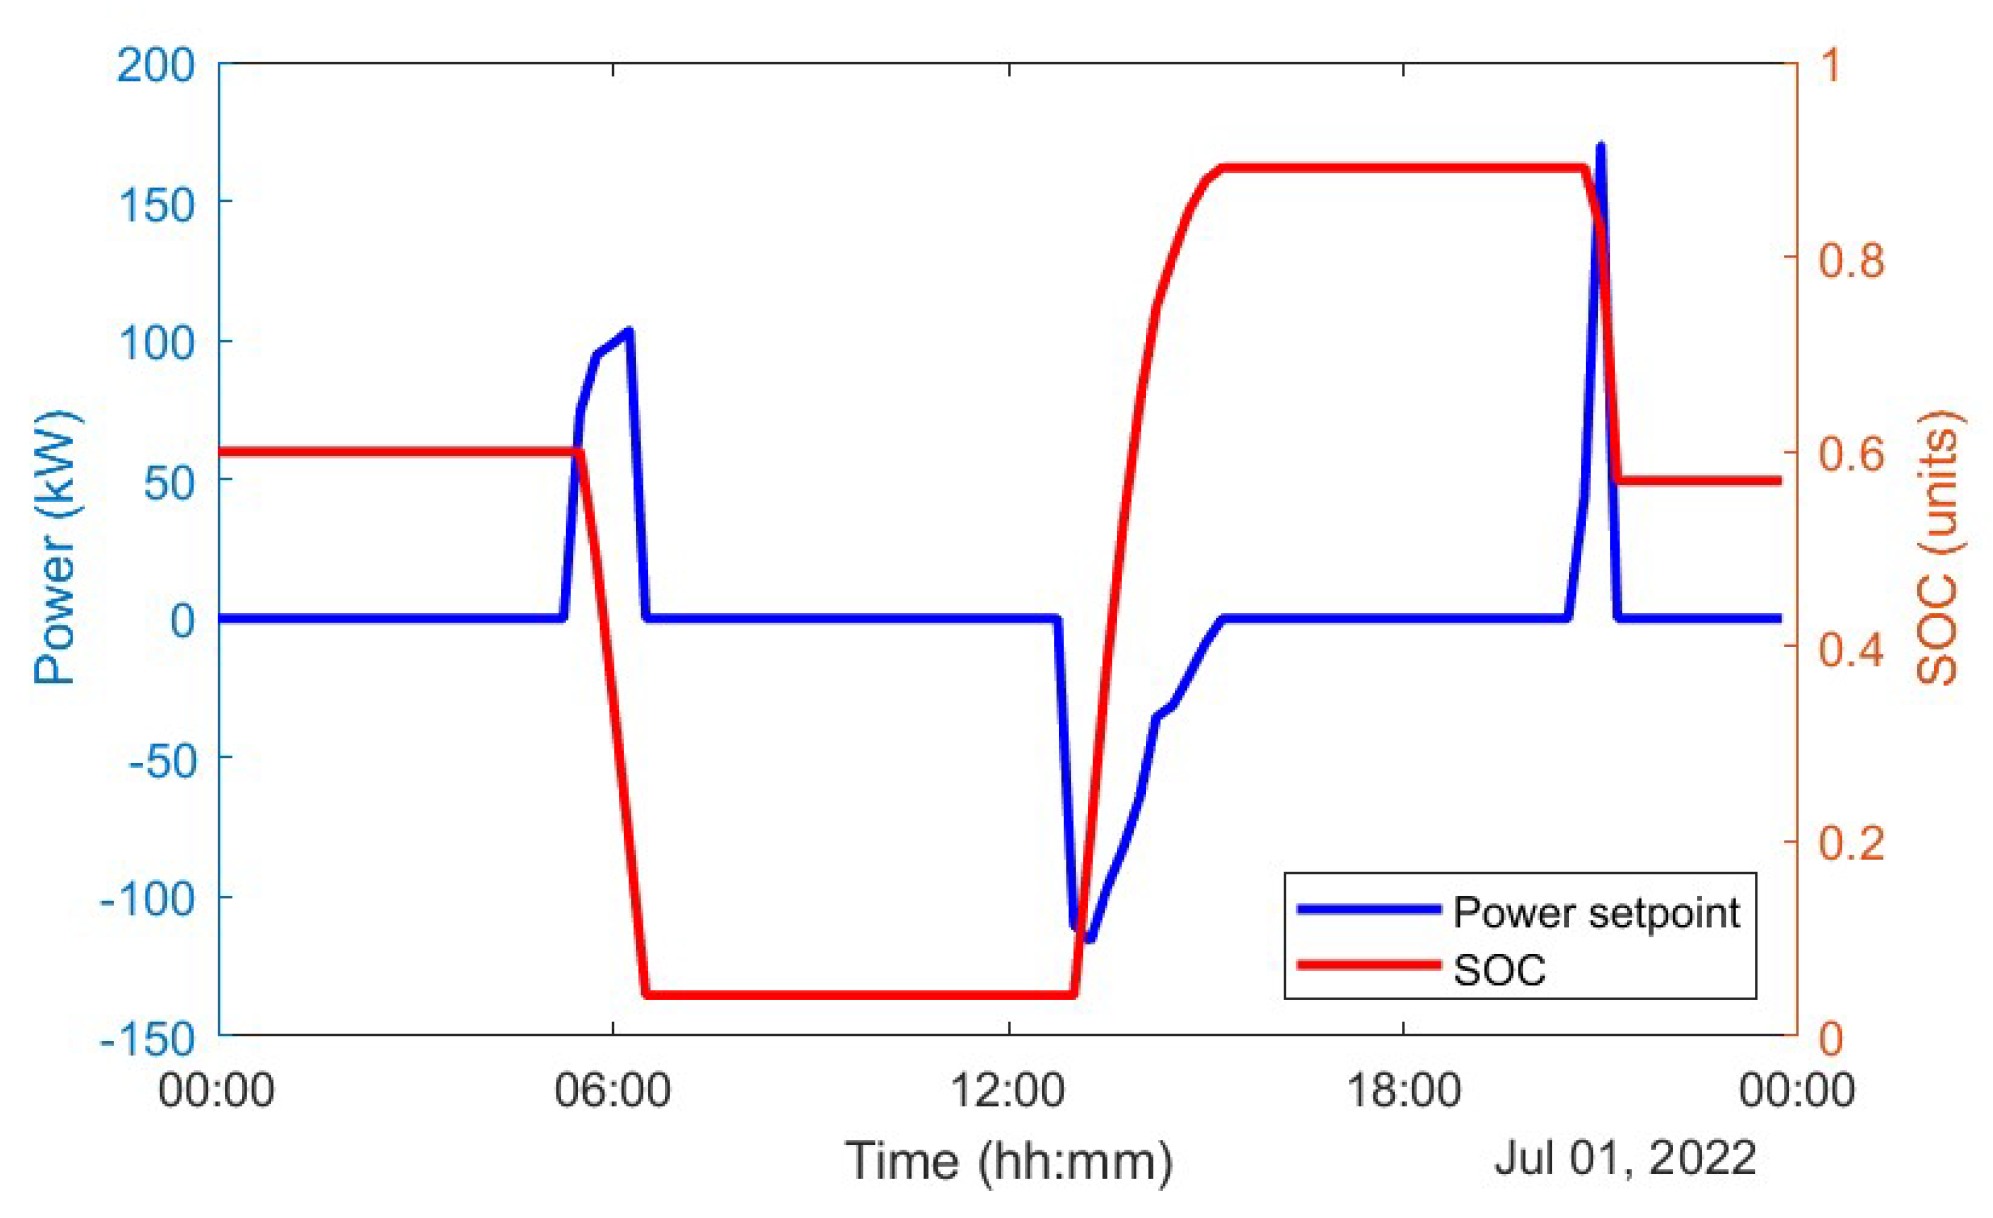
The optimization algorithm resolves and minimizes J, as formulated in Equation (14) described in Section 2.3. The minimization of the objective function resolves the battery power commands. These commands determine when and how the battery is charged and discharged during 24 h (see Figure 8), minimizing economics, including the battery degradation, and environmental impact. In addition, Figure 8 shows the state of charge ( z t ) during the 24 h, noting that this is between the maximum and minimum set, thus performing most of the complete cycle of the battery. The company is currently prioritizing economic criteria over environmental criteria. Accordingly, alpha ( α ) and beta ( β ) values of 0.75 and 0.25, respectively, will be used.
The annual outcomes of the optimization process are presented in Table 5. The table contains the main optimization results over a year. The objective function results are the accumulative results of the economic and environmental objective function in terms of the optimization problem over a year. In the case study, the company will spend EUR 188,000 to satisfy its consumption, including the revenues of surplus PV energy and the degradation cost of the battery. Compared to the scenario where the battery is not used, a total profit of EUR 1439 is achieved by utilizing the battery, which will also result in 1393 kg of CO2 emissions. The SLB would be amortized in 5.2 years with this annual economic profit. In one year, the battery performs a total of 97.85 cycles, considering a cycle as the energy exchanged by the battery during a complete charge and discharge.

3.2. Sensitivity Analysis for Generalization

This section aims to extend the specific enterprise analysis to various industrial contexts. A sensitivity analysis will be conducted using the digital twin of diverse enterprise configurations. This analysis will include a broad spectrum of input data, facilitating the exploration of potential outcomes across various scenarios.
The sensitivity analysis methodology and the results are described in the following subsections.

3.2.1. Methodology Overview

This sensitivity analysis aims to evaluate the behavior of the optimization algorithm under different conditions. The input data which will be varied to generalize the methodology are given as follows:
  • Power of the PV installation. The power of the photovoltaic installation will range from large powers, corresponding to enterprises with a large surface area and investments in renewable energies, to small powers, corresponding to small enterprises that have not yet been able to invest in renewable energies. The battery pack size will be related to the PV size. The estimation of the SLB energy for the enterprise involves a multi-step process. Initially, using the PV generation from the input value and industrial consumption data, the total surplus energy for each day of the year is computed. Subsequently, the cumulative probability function of the annual surpluses will be plotted, as can be seen in the example in Figure 9. The battery capacity is determined based on the 60th percentile of the annual surplus of the cumulative probability function to optimize the battery pack. This method ensures that the battery can store most of the excess energy generated during high production periods while avoiding the high costs and inefficiencies associated with over-dimensioning for infrequent peaks or periods of low solar irradiance. By capturing and utilizing 60% of the surpluses, this approach balances cost-effectiveness with operational reliability, providing sufficient storage to maximize the use of renewable energy without significantly relying on grid energy.
  • Economic criteria versus environmental criteria. Different scenarios will be created to reflect the enterprise’s policies of prioritizing economic versus environmental criteria, or vice versa. These scenarios will be represented by weight variables ( α or β ), indicating the level of prioritization given to each criterion. The selection of α and β values depends on the enterprise’s strategic priorities and regulatory environment. Companies prioritizing economic efficiency over environmental impact, focusing on cost reduction and pursuing fast payback periods, would apply α > 0.75. In contrast, enterprises in sectors with strong environmental commitments may adopt an environmental policy strategy ( β > 0.5), aiming to maximize CO2 reductions at the expense of longer payback periods. Hybrid approaches (0.5 ≤ α ≤ 0.75) may be adopted by enterprises balancing financial constraints with social responsibility objectives, especially in regions with incentives for clean energy adoption.
  • Industrial consumption type. The type of consumption profile may vary depending on the type of asset that the enterprise generates. This type of consumption profile may affect the appropriateness of incorporating an energy storage system. The following list defines the different types of enterprise consumption profiles that will be simulated to have this general representation.
    Type A: Constant Consumption: These enterprises maintain a relatively consistent level of energy consumption throughout the day and across seasons. They do not exhibit significant consumption peaks during the day or night.
    Type B: High Daytime Consumption: This type of enterprise exhibits high energy consumption during daylight hours and it significantly decreases during the nighttime.
    Type C: High Nighttime Consumption: In contrast to Type A, these enterprises experience high energy consumption during nighttime.
    Type D: Peak Consumption: Enterprises falling into this category have peak energy consumption periods that occur at specific times during the day or week. Outside these peaks, their energy consumption remains low.
This sensitivity analysis aims to identify common trends and patterns in various enterprises, thus contributing to a deeper understanding of the applicability and performance of the proposed methodology.

3.2.2. Results of Sensitivity Analysis

Simulations of the complete digital twin layer and the optimization algorithm of the energy management layer, covering a wide range of PV power of the installation, economic and environmental criteria, and different enterprise consumption profiles will be conducted. This section presents the results of the simulation of the sensitivity analysis.
Type A enterprises are characterized by relatively constant energy consumption throughout the day (See Figure 7). The evaluation of the impact of PV system size and the influence of economic and environmental criteria on system performance will be presented below.
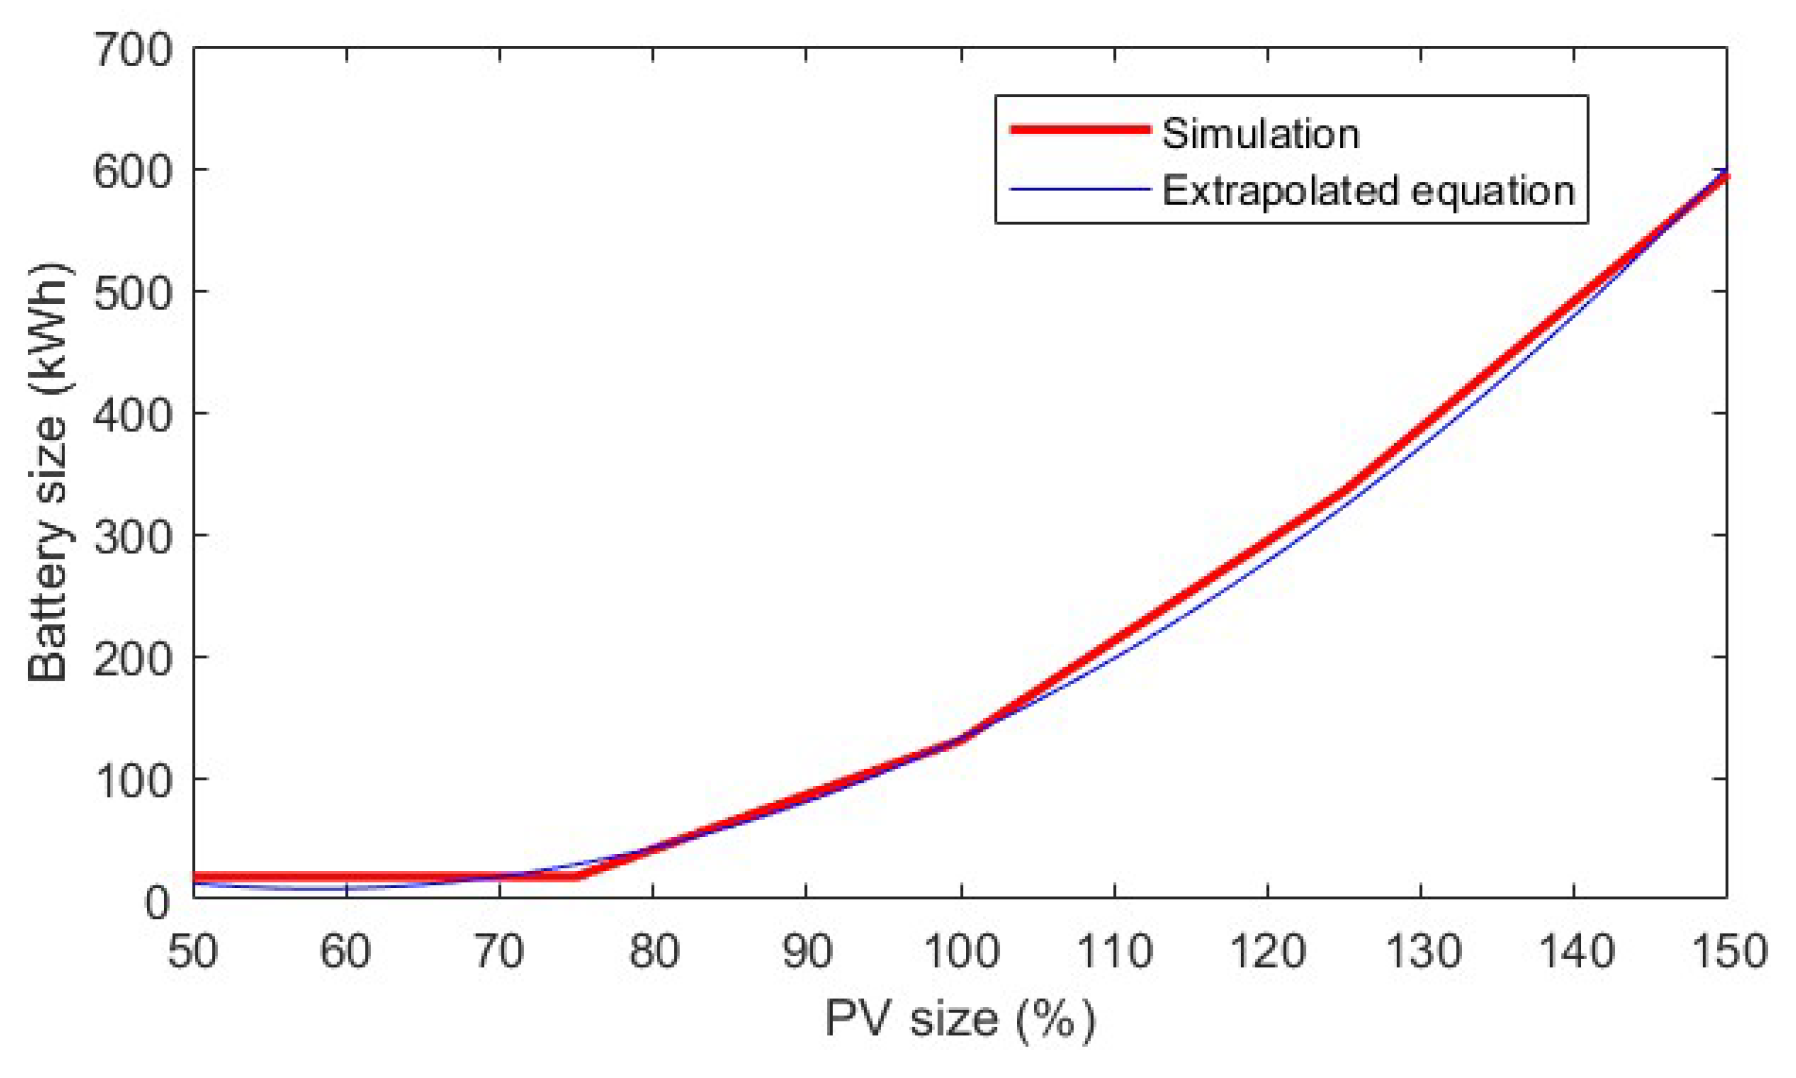
Figure 10 presents the correlation between battery size and PV system size. The x axis represents the PV installation size as a percentage of the nominal case study value (333 kWp). The results indicate that with a PV system size of 50% of the nominal value, no surplus energy is generated, leading to the selection of the minimum battery size. As the PV installation size increases, surplus PV energy also grows, which requires a proportional increase in battery capacity to store and optimize energy usage. The battery size is determined following the methodology described in Section 3.2.1 and the battery sizing values are effectively correlated using Equation (32). This equation defines the battery size required for each PV system size, considering the constant energy consumption profile in type A enterprises. The enterprise’s average power consumption ratio to peak PV power ( P c o n s m e a n / P P V ) varies between 1/0.5 and 1/1.5, representing different consumption scenarios.
E b = ( 0.0047 · P P V 2 1.39 · P P V + 112.16 ) · Y m e d Y m e d n o m ,
where E b , in kWh, represents the size of the SLB, and P P V , in kWp, denotes the maximum peak power of the PV installation. Y m e d n o m , in kWh/m2, refers to the annual mean global irradiance of the case study enterprise in Hospitalet de Llobregat, Barcelona. This value is obtained from the most recent data provided by the PVGIS application [55], which is 170 kWh/m2 for this study. Similarly, Y m e d in kWh/m2, corresponds to the annual mean global irradiance of the end user following the selected methodology. In this study, Y m e d is equivalent to Y m e d n o m .
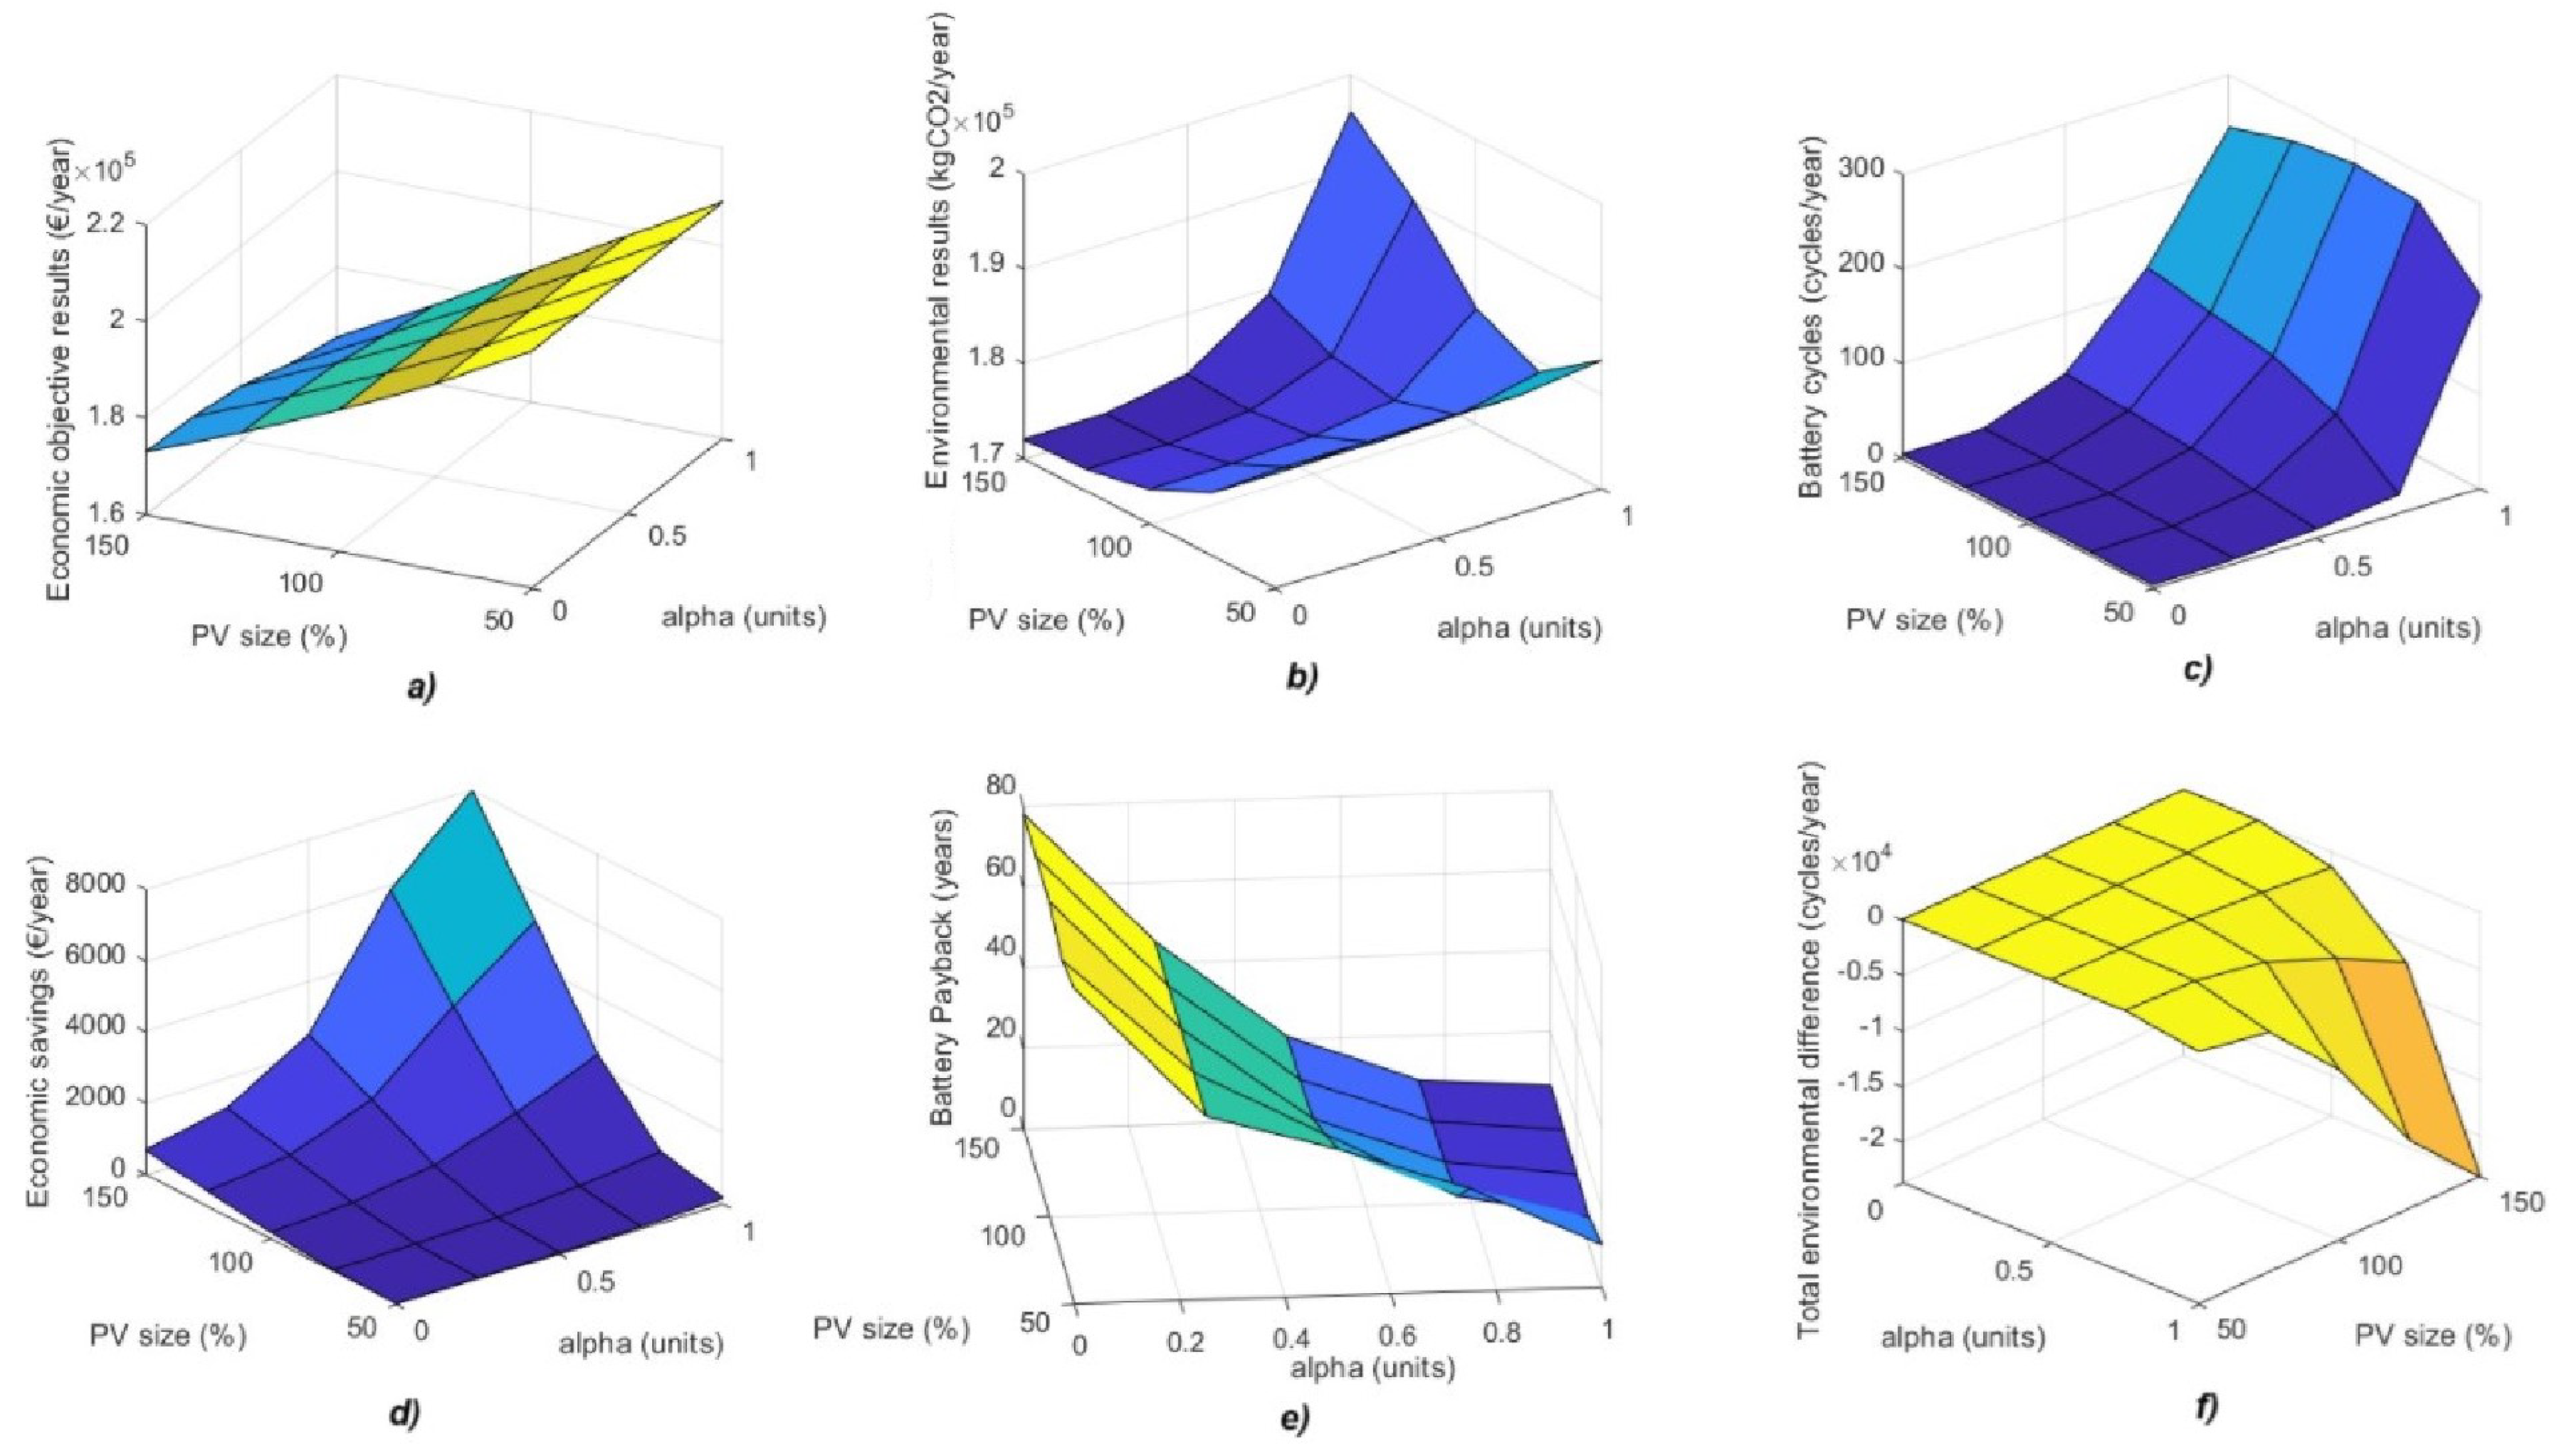
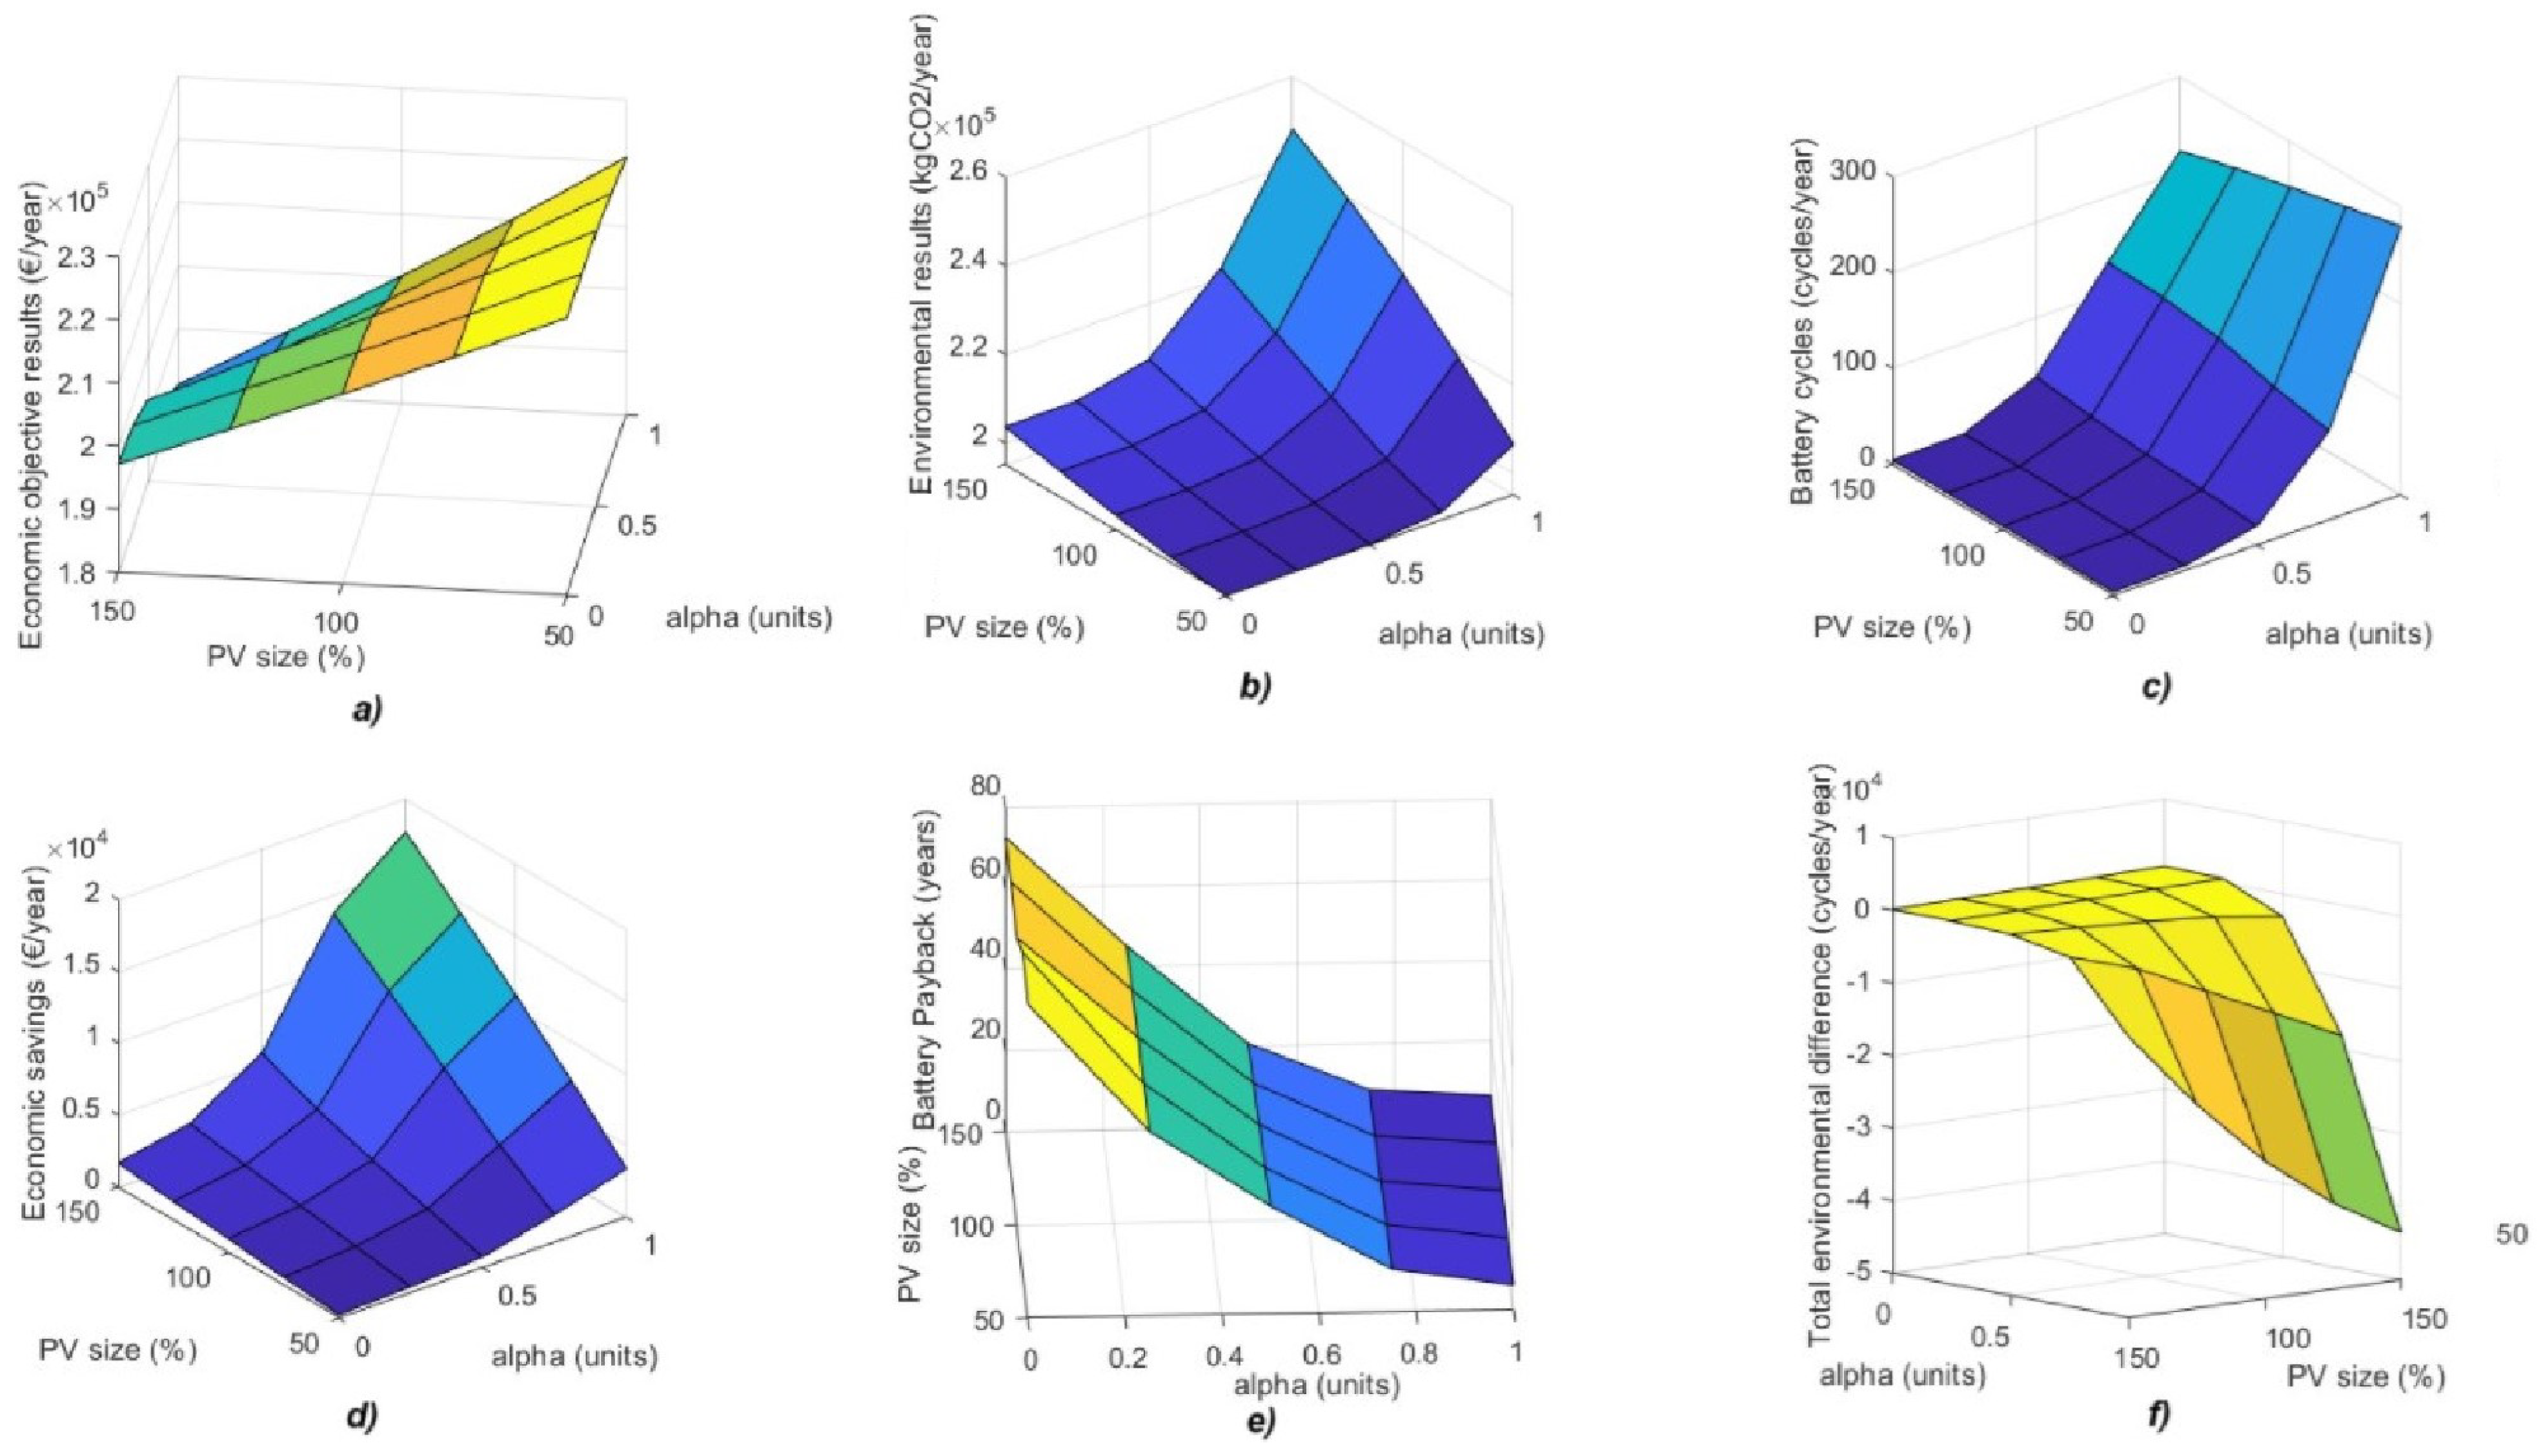
Figure 11 provides a detailed overview of the sensitivity analysis results. Figure 11a illustrates the economic objective function results, which are inversely proportional to the PV system size. As PV generation decreases, more electricity must be purchased from the grid, increasing economic costs. Additionally, the economic objective function results in a decrease with increasing alpha weighting criteria. A higher alpha value prioritizes the economic optimization, reducing the total energy purchased from the grid and consequently lowering the overall costs. Figure 11b shows that pollution emission savings increase with larger PV and SLB sizes, remaining relatively constant with values of beta greater than 50%. For PV sizes lower than 100%, the total emissions increase due to the pattern of consumption.
Figure 11c highlights the relationship between battery cycles and the alpha factor. The number of battery cycles increases with both the alpha weighting and PV system size. A higher alpha factor results in more intensive battery usage, maximizing economic benefits through energy arbitrage. Similarly, larger PV installations generate greater surplus energy, leading to increased battery charge-discharge cycles.
The economic savings of battery utilization are depicted in Figure 11d the savings generated by the SLB increase with both the alpha factor and PV system size. Since higher PV capacities lead to greater self-consumption potential, the battery becomes more effective in reducing grid dependency.
Finally, Figure 11e examines the battery payback period. The results indicate that payback time is closely linked to the economic prioritization factor. When the economic weight factor is 0.75 or higher, the battery payback period ranges from 10 to 6 years. Conversely, for weight values of 0.5 or lower, payback times exceed 20 years, making the investment less attractive under purely environmental prioritization scenarios.
These results underscore the importance of balancing economic and environmental priorities when implementing energy storage solutions in type A enterprises. While larger PV systems and higher alpha factors enhance financial returns, they also lead to more frequent battery cycling, which could impact long-term battery degradation and replacement costs.
To further understand the impact of varying PV system sizes and economic–environmental trade-offs, a sensitivity analysis was performed for type B enterprises. These enterprises exhibit high energy consumption during the day and significantly lower consumption at night, which influences surplus energy availability and battery storage requirements. While some trends are similar to those observed in type A enterprises, key differences arise due to the shift in consumption patterns.
Figure 12 presents the relationship between battery size and PV system size for type B enterprises. Unlike type A enterprises, where surplus energy is more uniformly distributed throughout the day, type B enterprises consume a greater proportion of PV generation directly, reducing the amount of surplus available for storage. As shown in the figure, when the PV system size is below 75% of the nominal value, no significant surplus energy is generated. In these cases, only the minimum battery size is selected, which consists of the necessary cells to achieve the required operating voltage without additional parallel branches. As the PV system size increases, surplus energy grows, leading to a larger battery requirement. This relationship is mathematically described by Equation (33).
E b = 20.77 · Y m e d Y m e d n o m , if ( 1 ) , ( 0.0036 · P P V 1.75 ) · Y m e d Y m e d n o m , if ( 2 ) ,
where condition (1) applies for PV sizes in the range 166.5 P P V 333 kW , and condition (2) applies for 333 < P P V 499.5 kW .
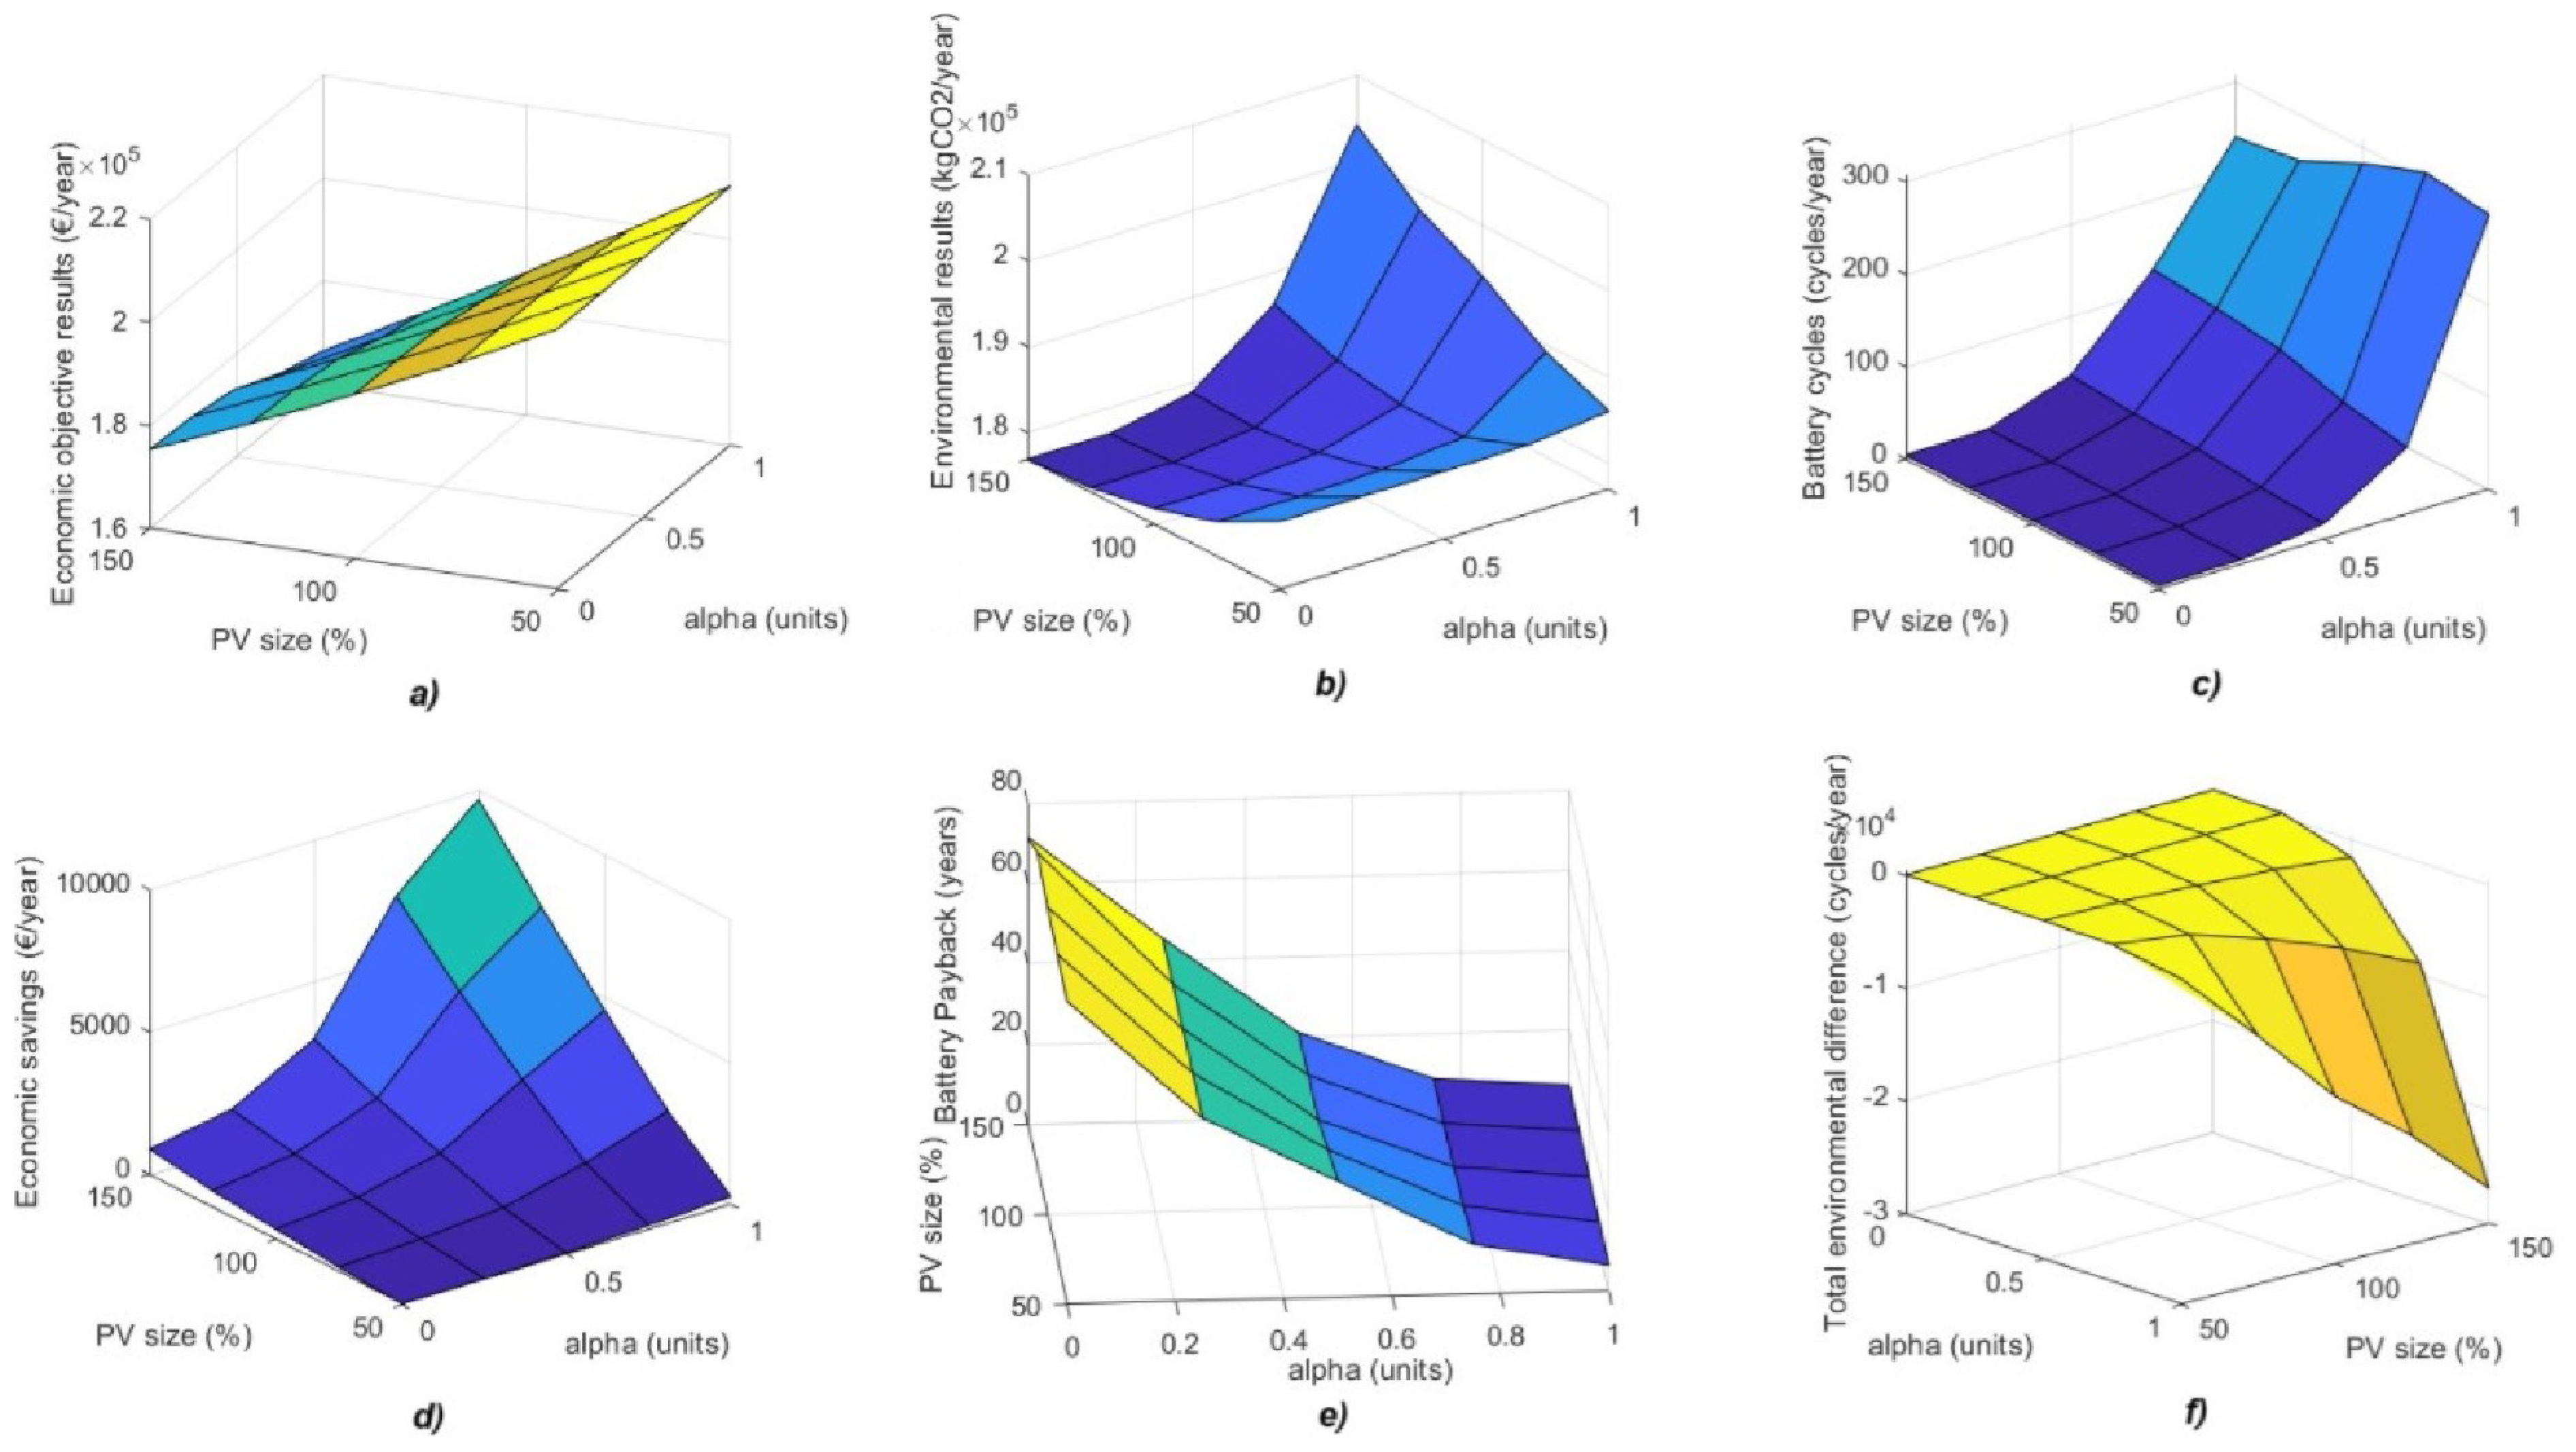
Figure 13 provides a comprehensive visualization of the sensitivity analysis results for type B enterprises. Figure 13a demonstrates that similarly to type A enterprises, the economic objective function is inversely proportional to PV system size. As PV generation increases, the need to purchase electricity from the grid decreases, thereby lowering costs. The influence of the alpha weighting factor follows the same trend in which prioritizing economic criteria (higher alpha values) results in lower total costs, as the optimization algorithm reduces grid dependence and maximizes battery utilization. As commented in type A enterprises, the distribution of total emission in type B enterprises has the same behavior as stated in Figure 13b. Here, beta and PV size have a high influence on the resulting emissions, curving the flat parts.
A key distinction for type B enterprises is observed in Figure 13c, which shows that the number of battery cycles is lower compared to type A enterprises. Since a larger portion of the PV generation is directly consumed rather than stored, battery charging occurs less frequently, leading to fewer charge–discharge cycles. Consequently, this also affects the economic savings of battery usage. As illustrated in Figure 13d, cost savings from battery integration are lower than in type A enterprises, where surplus energy is more available for storage and later use.
The implications for a battery payback period are presented in Figure 13e. Due to the reduced battery utilization, the investment recovery period is slightly longer than in constant consumption enterprises. However, for higher alpha values (0.75 and above), the payback period still falls within an economically viable range of approximately 6–10 years. For lower alpha values (0.5 and below), payback periods extend beyond 20 years, making the investment less attractive under scenarios that prioritize environmental considerations over financial savings.
To further illustrate the impact of these dynamics, Figure 14 presents the results of a 24 h simulation for a type B industry. The figure highlights how energy management strategies are influenced by consumption patterns. Compared to type A enterprises, battery charging is slightly reduced during peak generation hours due to the higher direct consumption of PV energy. The battery primarily charges during midday when the PV generation exceeds demand, and discharges in the evening when energy prices rise and grid dependence increases. The overall lower number of cycles aligns with the sensitivity analysis results, reinforcing the observation that battery utilization is less intensive in type B enterprises.
To further explore the impact of a PV system size and economic-environmental prioritization, a sensitivity analysis was conducted for type C enterprises. These enterprises differ significantly from type A and B enterprises due to their distinct consumption pattern—low energy usage during the day and high consumption at night. This consumption profile results in a higher availability of surplus PV energy, which strongly influences battery sizing, utilization, and overall system performance.
Figure 15 illustrates the relationship between battery size and PV system size for type C enterprises. Given that daytime consumption is minimal, a large proportion of PV generation becomes surplus energy, making battery storage a crucial element of the energy management strategy. As shown in the figure, battery size increases linearly with PV installation size, reflecting the direct correlation between surplus energy and storage capacity. This relationship is defined by Equation (34).
E b = ( 3.293 · P P V 324.02 ) · Y m e d Y m e d n o m ,
Figure 16 presents the sensitivity analysis results for type C enterprises. In Figure 16a, the economic objective function results reveal a clear inverse relationship with the PV system size. Larger PV installations reduce the need for grid electricity purchases, lowering economic costs. Additionally, the impact of the alpha weighting factor is evident. As the weight of economic prioritization increases, overall costs decrease due to optimized battery usage and reduced grid dependence. Given that the consumption is mainly at night, under-sizing the PV reduces the total emission (lower than 100%). Unlike Type B enterprises, PV size and beta do not impact environmental results, especially for beta greater than 50% as seen in Figure 16b.
Figure 16c highlights the number of battery cycles, which is significantly higher than in type A and B enterprises. Since type C enterprises generate substantial surplus PV energy, more charge–discharge cycles occur, maximizing the economic benefits of energy storage. This intensive battery usage contributes to greater economic savings, as shown in Figure 16d. Unlike type B enterprises, where direct PV consumption limits surplus energy availability, type C enterprises experience higher energy storage utilization, leading to increased economic returns.
The effect of these dynamics on battery payback time is illustrated in Figure 16e. The results indicate that the SLB payback period is shorter than in type B enterprises due to the increased number of battery cycles and greater cost savings. When economic factors are prioritized (alpha ≥ 0.75), the payback period remains within 6–9 years, making battery integration a financially viable solution. However, for lower alpha values (0.5 or below), payback times exceed 15 years, reducing the economic attractiveness of battery deployment in purely environmental strategic scenarios.
To provide a more detailed perspective, Figure 17 illustrates the results of a 24 h optimization simulation for a type C industry. The figure demonstrates how battery charging predominantly occurs during the day when surplus PV energy is available while discharging takes place during peak consumption hours at night. Compared to type B enterprises, where battery usage is more intermittent, type C enterprises rely heavily on storage to shift renewable energy from day to night, reducing reliance on grid electricity when prices are typically higher.
To analyze the effects of PV system size and economic–environmental trade-offs in enterprises with variable consumption patterns, a sensitivity analysis was conducted for type D enterprises. These enterprises are characterized by low base consumption with intermittent peaks, which significantly influences energy management strategies and battery utilization. Unlike type A, B, and C enterprises, where energy storage primarily serves to shift PV surplus to periods of higher demand, type D enterprises take into account battery storage mainly to reduce peak power demand from the grid.
Figure 18 illustrates the relationship between battery size and PV system size for type D enterprises. The results show that battery size for this type of industry tends to have an intermediate value when compared to type B and C enterprises or a value similar to type A enterprises. This is due to the balance between surplus PV energy availability and the need to manage power demand peaks. The relationship between PV system size and battery capacity is defined by Equation (35).
E b = ( 0.0019 · P P V 2 + 0.7877 · P P V 166.16 ) · Y m e d Y m e d n o m ,
Figure 19 presents the sensitivity analysis results for type D enterprises. Figure 19a shows that, similarly to previous cases, the economic objective function decreases as the PV system size increases. However, in contrast to type A and C enterprises, where economic benefits primarily arise from energy arbitrage, in type D enterprises, economic savings are mainly driven by peak shaving—reducing the maximum consumption power from the grid. Figure 19b bears great similarity with Figure 11b for Type A enterprises. Therefore, power consumption peaks are irrelevant when deciding the optimal weights of beta and alpha and the PV size.
Figure 19c highlights the battery cycling behavior. Compared to type C enterprises, type D enterprises exhibit a moderate number of charge–discharge cycles. Since the battery is primarily used for peak reduction rather than continuous energy shifting, it experiences fewer cycles than in enterprises with high surplus PV generation. This translates into lower degradation rates and potentially extended battery lifespan. However, as seen in Figure 19d, economic savings still increase with PV size and alpha weighting, reinforcing the role of SLBs in improving cost efficiency.
The battery payback period results, presented in Figure 19e, indicate that type D enterprises achieve a moderate return on investment. While payback periods are slightly longer than in type C enterprises due to lower battery cycling frequency, they remain within an economically feasible range when the alpha weighting is 0.75 or higher. This suggests that businesses capable of adjusting their contracted power dynamically can benefit significantly from battery storage integration.
To provide a real-world illustration of these dynamics, Figure 20 shows the results of a 24 h simulation for a type D industry. The figure highlights how battery charging aligns with PV generation surpluses while discharging is strategically timed to mitigate peak demand events. Unlike type C enterprises, where the battery is consistently cycled to shift energy from day to night, in type D enterprises, the battery functions primarily as a source that moderates fluctuations in energy demand.

4. Conclusions

In conclusion, our research demonstrates the impact assessment of SLBs in an enterprise by employing a multi-objective optimization algorithm based on the simulation of various system inputs through digital twins. The digital twin accurately represents the comprehensive mathematical model of the industrial plant and its main assets. This digital twin layer correctly links the control and energy management layers with the physical layer, ensuring that the appropriate control setpoints are applied to optimize the industrial operation effectively.
The developed forecasting algorithm effectively predicts key input variables for the optimization algorithm, ensuring a high level of accuracy as demonstrated by its close alignment with real-world behavior within the 90% confidence interval. This predictive capability enhances decision making by providing reliable estimations of electricity prices, PV generation, and industrial load consumption, using MLR and ARIMA tools. Additionally, the optimization algorithm successfully manages the battery operation according to the priorities set by the decision maker, whether in highly competitive markets, strong environmental commitments, or hybrid approaches. By dynamically adjusting the energy management strategy, the algorithm ensures optimal battery utilization, reducing costs, lowering emissions, and maximizing economic and environmental benefits based on the chosen strategic framework.
The findings indicate that optimal battery sizing is highly dependent on the specific enterprise energy consumption patterns. Type A enterprises, characterized by constant energy consumption, benefit from medium-sized SLBs to maximize energy arbitrage opportunities. Type B enterprises, with high daytime consumption, require smaller batteries due to limited surplus energy available for storage, making energy arbitrage and peak shaving the most viable strategies. In contrast, type C enterprises, with high nighttime consumption, generate significant surplus PV energy, necessitating larger battery sizes to enhance energy shifting from day to night. Finally, type D enterprises, which experience intermittent energy peaks, primarily utilize SLBs for peak shaving rather than continuous energy shifting, leading to moderate battery sizing requirements.
From an economic perspective, SLBs provide cost-effective storage solutions, particularly when the optimization strategy prioritizes economic efficiency. Payback periods are highly influenced by the alpha weighting factor in the optimization model. For enterprises that prioritize economic benefits ( α ≥ 0.75), payback periods range between 6 and 10 years, making SLBs a viable investment. In cases where environmental impact is prioritized ( α ≤ 0.5), payback times exceed 15 years, requiring additional incentives or policy support to enhance financial feasibility.
Regarding the environmental impact results, a pattern of behavior is observed regarding the number of CO2 emissions attributed to energy management in all types of enterprises analyzed. The larger PV and battery sizes, together with higher beta factor values, produce greater savings in polluting emissions. In contrast, emissions are more significant for smaller PV and battery sizes throughout any combination of weights ( α and β ), except for type C enterprises due to their nighttime consumption. Furthermore, beta values between 0 and 0.5 allow the greatest savings in CO2 emissions for PV sizes between 150% and 100%. There are even increases in emissions for PV values of 50% in type C enterprises. The above is explained by the fact that their consumption is mainly during night hours, increasing grid consumption, energy sales, and charging the battery through the network. The presence of peaks in electricity demand could be ignored when sizing the alpha and beta weights, or in the optimal design of the PV and battery system in terms of environmental impacts.
This study confirms the technical and economic feasibility of SLB integration in the industrial sector; however, its large-scale adoption remains influenced by external regulatory and political factors. In addition, differences in ESG rating methodologies can impact the investment attractiveness of enterprises. Government incentives, such as tax credits and grid integration policies, also play a crucial role in determining investment viability.

Author Contributions

Conceptualization, G.B.-O. and F.D.-G.; introduction, G.B.-O., J.-F.F., and F.D.-G.; methodology, G.B.-O., J.-F.F., A.C., and F.D.-G.; case study, G.B.-O. and J.-F.F.; results, G.B.-O. and J.-F.F.; review and editing, G.B.-O. and F.D.-G. All authors have read and agreed to the published version of the manuscript.

Funding

This research is part of Project PLEC2021-008152, funded by MCIN/AEI/10.13039/501100011033 and by the European Union “NextGenerationEU”/PRTR”.

Institutional Review Board Statement

Not applicable.

Informed Consent Statement

Not applicable.

Data Availability Statement

The original contributions presented in this study are included in the article. For further information, please contact the corresponding author.

Conflicts of Interest

The authors declare no conflicts of interest.

References

  1. European Environmental Agency, Datahub. Available online: https://www.eea.europa.eu/en/datahub (accessed on 14 February 2025).
  2. Naseri, F.; Gil, S.; Barbu, C.; Cetkin, E.; Yarimca, G.; Jensen, A.C.; Larsen, P.G.; Gomes, C. Digital twin of electric vehicle battery systems: Comprehensive review of the use cases, requirements, and platforms. Renew. Sustain. Energy Rev. 2023, 179, 113280. [Google Scholar] [CrossRef]
  3. Kodaira, D.; Jung, W.; Han, S. Optimal Energy Storage System Operation for Peak Reduction in a Distribution Network Using a Prediction Interval. IEEE Trans. Smart Grid 2020, 11, 2208–2217. [Google Scholar] [CrossRef]
  4. Koltermann, L.; Cortés, M.C.; Figgener, J.; Zurmühlen, S.; Sauer, D.U. Power curves of megawatt-scale battery storage technologies for frequency regulation and energy trading. Appl. Energy 2023, 347, 121428. [Google Scholar] [CrossRef]
  5. Borkowski, D.; Oramus, P.; Brzezinka, M. Battery energy storage system for grid-connected photovoltaic farm—Energy management strategy and sizing optimization algorithm. J. Energy Storage 2023, 72, 108201. [Google Scholar] [CrossRef]
  6. Colbertaldo, P.; Parolin, F.; Campanari, S. A comprehensive multi-node multi-vector multi-sector modelling framework to investigate integrated energy systems and assess decarbonisation needs. Energy Convers. Manag. 2023, 291, 117168. [Google Scholar] [CrossRef]
  7. Li, J.; Li, L.; Yang, R.; Jiao, J. Assessment of the lifecycle carbon emission and energy consumption of lithium-ion power batteries recycling: A systematic review and meta-analysis. J. Energy Storage 2023, 65, 107306. [Google Scholar] [CrossRef]
  8. Lai, X.; Qiao, D.; Zheng, Y.; Ouyang, M.; Han, X.; Zhou, L. A rapid screening and regrouping approach based on neural networks for large-scale retired lithium-ion cells in second-use applications. J. Clean. Prod. 2019, 213, 776–791. [Google Scholar] [CrossRef]
  9. Ran, A.; Zhou, Z.; Chen, S.; Nie, P.; Qian, K.; Li, Z.; Li, B.; Sun, H.; Kang, F.; Zhang, X.; et al. Data-Driven Fast Clustering of Second-Life Lithium-Ion Battery: Mechanism and Algorithm. Adv. Theory Simul. 2020, 3, 109. [Google Scholar] [CrossRef]
  10. Lee, K.; Kum, D. Development of cell selection framework for second-life cells with homogeneous properties. Int. J. Electr. Power Energy Syst. 2019, 105, 429–439. [Google Scholar] [CrossRef]
  11. Zhang, Y.; Zhou, Z.; Kang, Y.; Zhang, C.; Duan, B. A Quick Screening Approach Based on Fuzzy C-Means Algorithm for the Second Usage of Retired Lithium-Ion Batteries. IEEE Trans. Transp. Electr. 2021, 7, 474–484. [Google Scholar] [CrossRef]
  12. Jiang, T.; Sun, J.; Wang, T.; Tang, Y.; Chen, S.; Qiu, S.; Liu, X.; Lu, S.; Wu, X. Sorting and grouping optimization method for second-use batteries considering aging mechanism. J. Energy Storage 2021, 44, 103264. [Google Scholar] [CrossRef]
  13. Sitcharangsie, S. A systematic literature review of the life cycle assessment of electric vehicle components with a second use. In Proceedings of the 2022 International Conference on Data Analytics for Business and Industry (ICDABI), Sakhir, Bahrain, 25–26 October 2022; pp. 223–227. [Google Scholar]
  14. Li, J.; He, S.; Yang, Q.; Wei, Z.; Li, Y.; He, H. A Comprehensive Review of Second Life Batteries Towards Sustainable Mechanisms: Potential, Challenges, and Future Prospects. IEEE Trans. Transp. Electr. 2022, 9, 4824–4845. [Google Scholar] [CrossRef]
  15. Deng, Y.; Zhang, Y.; Luo, F.; Mu, Y. Hierarchical energy management for community microgrids with integration of second-life battery energy storage systems and photovoltaic solar energy. IET Energy Syst. Integr. 2022, 4, 206–219. [Google Scholar] [CrossRef]
  16. Wang, Y.; Xu, R.; Zhou, C.; Kang, X.; Chen, Z. Digital twin and cloud-side-end collaboration for intelligent battery management system. J. Manuf. Syst. 2022, 62, 124–134. [Google Scholar] [CrossRef]
  17. Tanizawa, T.; Suzumiya, T.; Ikeda, K. Cloud-connected battery management system supporting e-mobility. Fujitsu Sci. Tech. J. 2015, 51, 27–35. [Google Scholar]
  18. Cheng, G.; Wei, W.; Liu, Z. Research on Intelligent Operation and Maintenance System of Battery Based on Digital Twin. In Proceedings of the 2021 2nd International Conference on Computer Engineering and Intelligent Control (ICCEIC), Chongqing, China, 12–14 November 2021; pp. 154–157. [Google Scholar]
  19. Soleymani, A.; Maltz, W. Real time prediction of Li-Ion battery pack temperatures in EV vehicles. In Proceedings of the International Electronic Packaging Technical Conference and Exhibition, Virtual, 27–29 October 2020; Volume 84041, pp. 1–8. [Google Scholar]
  20. Baumann, M.; Rohr, S.; Lienkamp, M. Cloud-connected battery management for decision making on second-life of electric vehicle batteries. In Proceedings of the 2018 Thirteenth International Conference on Ecological Vehicles and Renewable Energies (EVER), Monte Carlo, Monaco, 10–12 April 2018; pp. 1–6. [Google Scholar]
  21. reLi Energy GmbH Website. Available online: https://www.relienergy.de/ (accessed on 14 February 2025).
  22. STMicroelectronics AutoDevKit. Available online: https://www.st.com/en/embedded-software/stsw-autodevkit.html (accessed on 14 February 2025).
  23. Shu, X.; Guo, Y.; Yang, W.; Wei, K.; Zhu, G. Life-cycle assessment of the environmental impact of the batteries used in pure electric passenger cars. Energy Rep. 2021, 7, 2302–2315. [Google Scholar] [CrossRef]
  24. Schneider, J.; Wolff, S.; Seidenfus, M.; Lienkamp, M. Sizing up sustainability: Influence of battery size and cell chemistry on battery-electric trucks’ life-cycle carbon emissions. Adv. Electr. Eng. Electron. Energy 2024, 9, 100656. [Google Scholar] [CrossRef]
  25. Cui, J.; Tan, Q.; Liu, L.; Li, J. Environmental Benefit Assessment of Second-Life Use of Electric Vehicle Lithium-Ion Batteries in Multiple Scenarios Considering Performance Degradation and Economic Value. Environ. Sci. Technol. 2023, 57, 8559–8567. [Google Scholar] [CrossRef] [PubMed]
  26. Kang, H.; Jung, S.; Kim, H.; An, J.; Hong, J.; Yeom, S.; Hong, T. Life-cycle environmental impacts of reused batteries of electric vehicles in buildings considering battery uncertainty. Renew. Sustain. Energy Rev. 2025, 207, 114936. [Google Scholar] [CrossRef]
  27. Silvestri, L.; Forcina, A.; Silvestri, C.; Arcese, G.; Falcone, D. Exploring the Environmental Benefits of an Open-Loop Circular Economy Strategy for Automotive Batteries in Industrial Applications. Energies 2024, 17, 1720. [Google Scholar] [CrossRef]
  28. Gharebaghi, M.; Rezaei, O.; Li, C.; Wang, Z.; Tang, Y. A Survey on Using Second-Life Batteries in Stationary Energy Storage Applications. Energies 2025, 18, 42. [Google Scholar] [CrossRef]
  29. Yucel, M.; Yucel, S. Environmental, Social, and Governance (ESG) Dynamics in the Energy Sector: Strategic Approaches for Sustainable Development. Energies 2024, 17, 6291. [Google Scholar] [CrossRef]
  30. Díaz-González, F.; Sumper, A.; Gomis-Bellmunt, O. Energy Storage in Power Systems; John Wiley & Sons: Barcelona, Spain, 2016. [Google Scholar]
  31. Plett, G.L. Battery Management Systems, Volume I: Battery Modeling; Artech House: Norwood, MA, USA, 2015. [Google Scholar]
  32. Plett, G.L. Battery Management Systems, Volume II: Equivalent-Circuit Methods; Artech House: Norwood, MA, USA, 2015. [Google Scholar]
  33. Jacob, A.S.; Banerjee, R.; Ghosh, P.C. Trade-off between end of life of battery and reliability in a photovoltaic system. J. Energy Storage 2020, 30, 101565. [Google Scholar] [CrossRef]
  34. Saravanan, C.; Srinivasan, K. Optimal Extraction of Photovoltaic Model Parameters Using Gravitational Search Algorithm Approach. Circuits Syst. 2016, 7, 3849–3861. [Google Scholar] [CrossRef]
  35. Chellakhi, A.; El Beid, S.; Abouelmahjoub, Y. An improved adaptable step-size P&O MPPT approach for standalone photovoltaic systems with battery station. Simul. Model. Pract. Theory 2022, 121, 102655. [Google Scholar]
  36. ENF Solar. SUN2000-100KTL-M1 Huawei Technologies. Available online: https://www.enfsolar.com/pv/inverter-datasheet/12848 (accessed on 20 February 2025).
  37. Wang, M.; Xu, X.; Yan, Z.; Wang, H. An online optimization method for extracting parameters of multi-parameter PV module model based on adaptive Levenberg–Marquardt algorithm. Energy Convers. Manag. 2021, 245, 114611. [Google Scholar] [CrossRef]
  38. Red Eléctrica de España. ESIOS—Information System of the Electrical System. Available online: https://www.esios.ree.es/en (accessed on 5 June 2024).
  39. Red Eléctrica de España. Marginal Price Day Ahead Market. Available online: https://www.esios.ree.es/en/analysis/600?vis=1&start_date=09-11-2022T00%3A00&end_date=20-01-2023T23%3A55&compare_start_date=08-11-2022T00%3A00&groupby=hour&geoids=3 (accessed on 5 June 2024).
  40. Red Eléctrica de España. Daily D+1 Wind Forecast. Available online: https://www.esios.ree.es/es/analisis/1777?vis=1&start_date=10-09-2024T00%3A00&end_date=12-09-2024T23%3A55&compare_start_date=09-09-2024T00%3A00&groupby=hour (accessed on 5 June 2024).
  41. Red Eléctrica de España. Real Time Nuclear Generation. Available online: https://www.esios.ree.es/es/analisis/549?vis=1&start_date=10-09-2024T00%3A00&end_date=10-09-2024T23%3A55&compare_start_date=09-09-2024T00%3A00&groupby=minutes5 (accessed on 5 June 2024).
  42. Red Eléctrica de España. Real Time National Combined Cycle Generation. Available online: https://www.esios.ree.es/en/analysis/2041?vis=1&start_date=10-09-2024T00%3A00&end_date=10-09-2024T23%3A55&compare_start_date=09-09-2024T00%3A00&groupby=minutes5 (accessed on 5 June 2024).
  43. Red Eléctrica de España. CO2 Free Generation. Available online: https://www.esios.ree.es/es/analisis/10006?vis=1&start_date=10-09-2024T00%3A00&end_date=10-09-2024T23%3A55&compare_start_date=09-09-2024T00%3A00&groupby=minutes5 (accessed on 5 June 2024).
  44. Red Eléctrica de España. Daily D+1 Demand Forecast. Available online: https://www.esios.ree.es/es/analisis/1775?vis=1&start_date=10-09-2024T00%3A00&end_date=12-09-2024T23%3A55&compare_start_date=09-09-2024T00%3A00&groupby=hour (accessed on 5 June 2024).
  45. Red Eléctrica de España. Forecast of Residual Demand. Available online: https://www.esios.ree.es/es/analisis/10249?vis=1&start_date=10-09-2024T00%3A00&end_date=12-09-2024T23%3A55&compare_start_date=09-09-2024T00%3A00&groupby=minutes15 (accessed on 5 June 2024).
  46. Saniuk, S.; Rokicki, T.; Milewski, D.; Xing, X.; Cong, Y.; Wang, Y.; Wang, X. The Impact of COVID-19 and War in Ukraine on Energy Prices of Oil and Natural Gas. Sustainability 2023, 15, 14208. [Google Scholar] [CrossRef]
  47. Sen, P.; Roy, M.; Pal, P. Application of ARIMA for forecasting energy consumption and GHG emission: A case study of an Indian pig iron manufacturing organization. Energy 2016, 116, 1031–1038. [Google Scholar] [CrossRef]
  48. MathWorks. ARIMA Models in MATLAB. Available online: https://es.mathworks.com/help/econ/arima.html (accessed on 14 February 2025).
  49. MathWorks. Forecast Method for Time Series Model. Available online: https://es.mathworks.com/help/ident/ref/idmodel.forecast.html (accessed on 14 February 2025).
  50. Kamath, D.; Shukla, S.; Arsenault, R.; Kim, H.C.; Anctil, A. Evaluating the cost and carbon footprint of second-life electric vehicle batteries in residential and utility-level applications. Waste Manag. 2020, 113, 497–507. [Google Scholar] [CrossRef]
  51. Wrålsen, B.; O’Born, R. Use of life cycle assessment to evaluate circular economy business models in the case of Li-ion battery remanufacturing. Int. J. Life Cycle Assess. 2023, 28, 554–565. [Google Scholar] [CrossRef]
  52. Merchante, L.F.S.; Clar, D.; Carnicero, A.; Lopez-Valdes, F.J.; Jimenez-Octavio, J.R. Real-time CO2 emissions estimation in Spain and application to the COVID-19 pandemic. J. Clean. Prod. 2021, 296, 126425. [Google Scholar] [CrossRef] [PubMed]
  53. Stamford, L.; Azapagic, A. Environmental Impacts of Photovoltaics: The Effects of Technological Improvements and Transfer of Manufacturing from Europe to China. Energy Technol. 2018, 6, 1148–1160. [Google Scholar] [CrossRef]
  54. Nordin, A.H.M.; Sulaiman, S.I.; Shaari, S. Life cycle impact of photovoltaic module degradation on energy and environmental metrics. Energy Rep. 2022, 8, 923–931. [Google Scholar] [CrossRef]
  55. European Commission. Joint Research Centre. Photovoltaic Geographical Information System (PVGIS). Available online: https://re.jrc.ec.europa.eu/pvg_tools/es/ (accessed on 14 February 2025).
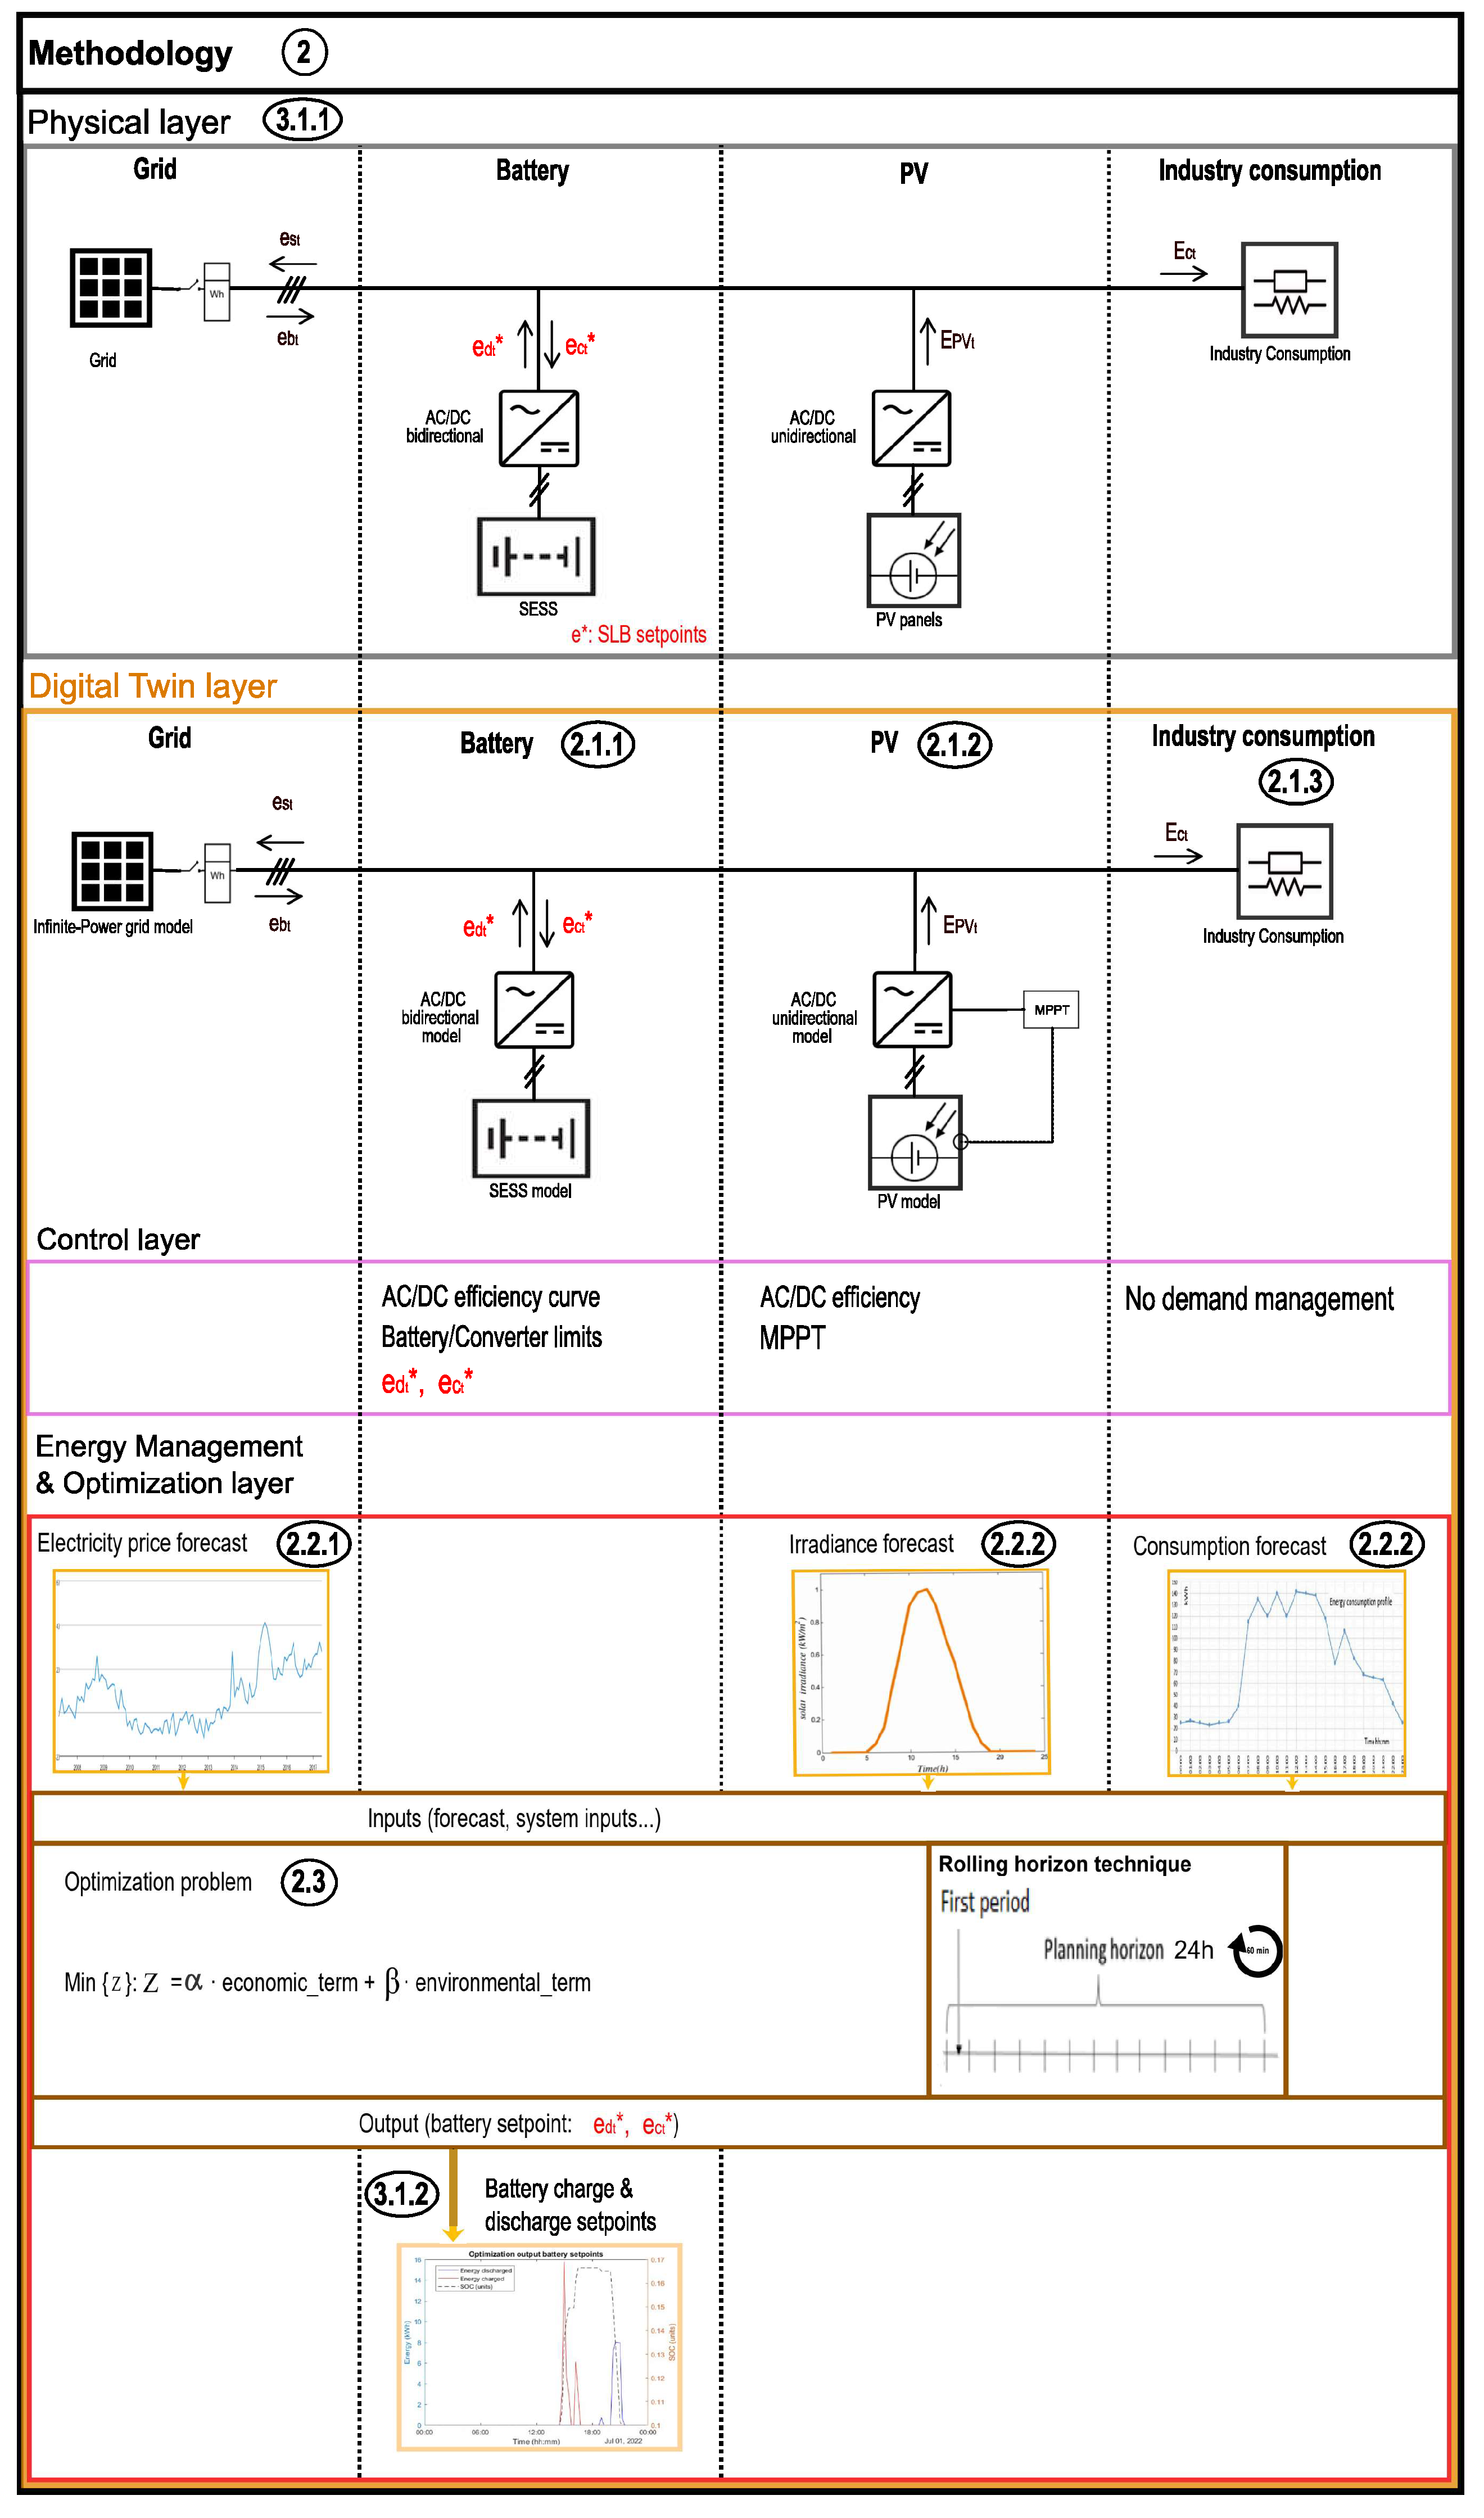
Figure 1. Scheme of the methodology.
Energies 18 01198 g001
Figure 2. Second-life battery model (left: battery model, right: AC/DC model.
Energies 18 01198 g002
Figure 3. Equivalent circuit of the photovoltaic-based power generation system.
Energies 18 01198 g003
Figure 4. Forecast of the electricity price.
Energies 18 01198 g004
Figure 5. Forecast of the enterprise consumption.
Energies 18 01198 g005
Figure 6. Configuration of the enterprise assets of the use case.
Energies 18 01198 g006
Figure 7. Main optimization algorithm results during a 24 h simulation in constant consumption enterprises ( α = 0.75; PV size = 100%).
Energies 18 01198 g007
Figure 8. Forecast of the output battery setpoint.
Energies 18 01198 g008
Figure 9. Battery size selection method using the cumulative probability function of the annual surplus.
Energies 18 01198 g009
Figure 10. Battery size for each PV installation scenario in type A enterprises.
Energies 18 01198 g010
Figure 11. Sensitivity analysis results in type A enterprises.
Energies 18 01198 g011
Figure 12. Battery size for each PV installation scenario in type B enterprises.
Energies 18 01198 g012
Figure 13. Sensitivity analysis results in type B enterprises.
Energies 18 01198 g013
Figure 14. Main optimization algorithm results during a 24 h simulation in type B enterprises ( α = 0.75; PV size = 100%).
Energies 18 01198 g014
Figure 15. Battery size for each PV installation scenario in type C enterprises.
Energies 18 01198 g015
Figure 16. Sensitivity analysis results in type C enterprises.
Energies 18 01198 g016
Figure 17. Main results of the optimization algorithm during a 24 h simulation in type C enterprises ( α = 0.75; PV size = 100%).
Energies 18 01198 g017
Figure 18. Battery size for each PV installation scenario in type D enterprises.
Energies 18 01198 g018
Figure 19. Sensitivity analysis results in type D enterprises.
Energies 18 01198 g019
Figure 20. Main results of the optimization algorithm during a 24 h simulation in type D enterprises ( α = 0.75; PV size = 100%).
Energies 18 01198 g020
Table 1. Electricity price forecast external features.
TypologyFeatureSource
CalendarHour of the day, work day.[38]
Target Variable LagsElectricity price shifted by 24, 48, 72, 96, and 168 h.[39]
Electricity generation mixWind, nuclear, combined-cycle gas turbine, emission-free generation percentage.[40,41,42,43]
Electricity demandSystem predicted demand, System residual demand.[44,45]
Table 2. Electricity price forecast performance.
PeriodMAERMSE R 2
January–March28.1740.110.71
April–June23.1333.110.57
July–September19.0125.280.57
October–December20.4326.770.70
Table 3. LCE factors for electricity generation sources.
GenerationGWP RangeMedian GWPReferences
F b 0.0706–1.40.14[50,51]
F p v 0.013–0.190.042[53,54]
Table 4. Use case infrastructure.
Consumption
Electric trucks, gas-powered trucks,∼300 kW averaged
EV charging points, gas compression points,
and office assets power ( P c o n s m e a n )
Annual energy consumption ( E c o n s a n n u a l )2570 MWh
Generation
PV installation ( P P V )333 kWp
PV inverter power ( P i n v )100 kW
Number of PV inverters in parallel ( m i n v )3 units
Annual PV energy generated ( E P V a n n u a l )310 MWh
Energy storage system
Capacity ( E b )166 kWh
Power ( P b m a x )191 kW
Cells in series ( n b )76
Cells in parallel ( m b )8
Maximum battery voltage ( V b m a x )304 V
Minimum battery voltage ( V b m i n )212.8 V
Rated battery voltage ( V b r a t e d )250.2 V
Maximum battery current ( I d m a x )720 A
SLB price per kWh ( J b u )90 EUR/kWh
SLB price per kWh ( J b )14,955 EUR
Remaining battery cycles ( n r e m )1000 cycles
Table 5. Optimization year results.
Simulation without battery
Objective function: Economic term ( J e c w b )189.44k EUR/year
Economic savings ( J e c s )1439 EUR/year
Battery cycles ( n c y c )97.85 equivalent complete
cycles per year
Battery payback (PB)4.1 years
Objective function: Environmental175.13 tones·CO2/year
term ( J e n )
Simulation without battery
Objective function: Environmental173.74 tones·CO2/year
term ( J e n w b )
Environmental impact ( J e n i )−1393 kg·CO2/year
Disclaimer/Publisher’s Note: The statements, opinions and data contained in all publications are solely those of the individual author(s) and contributor(s) and not of MDPI and/or the editor(s). MDPI and/or the editor(s) disclaim responsibility for any injury to people or property resulting from any ideas, methods, instructions or products referred to in the content.