Abstract
The rapid growth of photovoltaic (PV) installed capacity has driven advancements in photovoltaic technology, such as integrating PV panels into building envelopes. Temperature increases are known to negatively impact PV panel performance. This study investigates and optimizes the design of air-based cooling systems for PV roofs using experimental and numerical analyses, leveraging free natural convection for cooling. Experimental measurements included air inlet/outlet, PV panel, and roof surface temperatures. The primary parameters examined in Computational Fluid Dynamics (CFD) for the numerical study were the heights and widths of the air channels between the panels and the rooftop, with heights ranging from 25 mm to 75 mm and widths varying from 200 mm to 400 mm. There are good agreements between the numerical results and experimental measurements after model validation. The results reveal significant temperature non-uniformity across the surface of the PV panels, with a maximum temperature difference of 16.50 °C. The shading effect of the PV panels resulted in an average reduction in roof surface temperature by 12.90 °C. Parametric studies showed that changes in height had a more pronounced effect on cooling than in width. The optimal design was identified with a channel size of 75 mm × 400 mm, resulting in the lowest average PV panel temperature of 65.21 °C and enhanced temperature uniformity, with maximum efficiency reaching 11.54%.
1. Introduction
Buildings account for over 40% of global energy consumption and contribute up to 33% of global greenhouse gas (GHG) emissions [1]. These analyses indicate pathways [2,3] to achieve carbon reduction will require significant changes in how buildings use energy. The primary objective of the roadmap is to reduce and replace fossil fuels. The adoption of solar energy technologies holds immense potential in mitigating climate change by effectively reducing emissions associated with energy consumption [4]. Building-Integrated Photovoltaic (BIPV) and Building-Integrated Photovoltaic/thermal (BIPV/T) systems are highly effective methods that integrate photovoltaic technology into the building envelope [5,6,7]. They are crucial in generating renewable energy while also meeting architectural requirements and serving additional functions within the building envelope [8]. A variety of mounting structures have been developed explicitly for BIPV applications, including PV facades [9], inclined and flat roof installations [10], integrated glass–glass modules (opaque [10] or semi-transparent [11]), and PV tiles [12].
Photovoltaic (PV) systems harness solar energy for electricity generation, but excessive solar irradiance and high environmental temperatures can cause PV panels to overheat, thereby reducing power efficiency. Numerous studies [13,14,15,16] have demonstrated that an increase of 1 °C in PV panel temperature typically decreases efficiency from 0.25% to 0.5%. Cooling technology aims to lower the temperature of PV panels and enhance the efficiency of PV systems. Cooling techniques are broadly categorized into active and passive [17]. Active cooling methods involve fans and pumps, which can reduce PV panel temperatures by 20–40 °C. In contrast, passive cooling techniques utilize natural pressure differentials as a driving force, consuming no power and typically lowering PV panel temperatures by 10–20 °C on average.
Given the strong correlation between PV module temperature and efficiency, improving convective cooling around PV panels can significantly enhance PV efficiency [18]. Sharaf et al. [19] reviewed and analyzed common cooling methods for PV panels, including passive, active, and cooling using phase change materials (PCMs). Nižetić et al. [20] evaluated cooling techniques in a PV plant project, finding that air-based solutions offer the most viable option due to their favorable technical and economic performance over the lifecycle.
Han et al. [21] studied passive air channels for thermal regulation of PV panels, observing a significant temperature drop of 8 °C when an open channel was used behind PV panels in a configuration with two vertical parallel walls.
Kaiser et al. [22] investigated the impact of air gap size and forced ventilation on a BIPV configuration. Experimental results indicated that a channel with an aspect ratio close to 0.11 reduced PV panel overheating, with a duct velocity of 6 m/s, increasing power output by 19% compared to natural ventilation. In one other similar work by Tiwari et al. [23], they demonstrated that forced convective cooling reduced PV panel temperatures by 1.3–8 °C while increasing efficiency by 0.12–1.32%. Glick et al. [24] optimize the layout of utility-scale PV arrays based on wind direction, wind speed, and module inclination, which could increase the convective heat transfer coefficient by 30–45%. This approach can potentially enhance overall power output by 5% and reduce solar panel degradation by 0.3% annually.
Tiwari et al. [23] have further investigated the impact of air channel materials on efficiency, finding that cast iron achieved more significant temperature reductions and improved efficiency compared to non-conducting materials. Ahmad et al. [25] explored natural convection using aluminum finned plates, which increased conversion efficiency by 1.75%. Khan et al. [26] attached hollow rectangular aluminum tubes as fins to the rear surface of solar PV panels for cooling, achieving significant improvements: up to 12.97% in open circuit voltage and 2.08% in electrical output efficiency. Hamdan et al. [27] proposed L-shaped aluminum inline fins and optimized fin spacing to maximize PV performance. In a further work by Mohammad et al. [28], they utilized neural network models and multiple linear regression techniques to analyze the relationship between electrical generation and L-shaped aluminum fins.
In innovative design approaches, Sheyda et al. [29] employed wind-driven rooftop turbine ventilators to enhance ventilation and cool PV cells. Their experiments demonstrated that this high-speed cooling method reduced PV cell temperatures from 63.5 °C to 48.7 °C under the radiation of 1000 W/m2. In one other simulation research, Ahmadi et al. [30] explored the potential of rooftop-mounted solar panels for passive ventilation, finding that increasing surface emissivity on the roof could enhance natural convective currents. Their results indicated that a 34% increase in mass flow rate could reduce PV panel temperatures by 3 k.
In PV system cooling technology, air-based cooling utilizing natural airflow is considered the most cost-effective and straightforward method. This approach avoids the complexity of devices and processes. However, its cooling effectiveness is limited due to air’s low convective heat transfer and thermal conductivity. Consequently, research into optimizing airflow channels beneath PV panels is increasingly important. Specifically, determining the optimal size of the airflow channel or gap between PV cells and the roof is critical to enhancing natural heat convection and maximizing PV system efficiency. Furthermore, integrating PV panels with building roofs must consider structural stability and overall system performance.
Ongoing studies and research into air cooling for PV panels suggest that optimizing the size of the air channel or using rectangular fins can significantly enhance the performance of PV cells by improving cooling efficiency. Therefore, configuring the optimal cooling channel is a crucial and effective method for enhancing PV cell cooling performance [31].
2. Aim and Objectives
The primary objective of this study is to investigate and optimize the structure of air-based cooling PV roofs using experimental and numerical analyses to enhance PV roof cooling efficiency and maximize performance.
The research aims to determine PV module surface temperatures through experimental methods and numerical analysis, establishing parametric relationships between air channel dimensions and PV cell temperatures. Numerical analysis was conducted using Computational Fluid Dynamics (CFD) in Workbench 2023 software, with results validated through experiments conducted in Ji’nan’s climate.
Current research on air-based cooling for PV panels has primarily focused on systems with larger installation angles and broader cooling channels, such as BAPV roofs. However, PV roofs must maintain aesthetic consistency as integral building components, which imposes constraints on air channel design. There has been minimal study on integrating air channels into PV roofs, making this research valuable for designing PV module installations on rooftops and integrating them into BIPV systems.
3. Methodology
This study applies CFD to analyze and optimize the air channel beneath PV modules, efficiently providing highly accurate fluid flow and heat distribution results under various conditions. These simulation results are validated against field experiment measurements, which is essential for establishing an accurate CFD model that serves as a prototype for studying and calculating the thermal performance of PV roofs and BIPV systems with different configurations.
This section presents the numerical analysis of a roof-mounted PV module to assess its cooling performance during a summer day in Ji’nan. The numerical models were validated through experimental parametric studies aimed at maximizing cooling efficiency and improving power output by varying the size of the air channel. The combined approach of experimentation and simulation enhances the effectiveness of optimizing the cooling channel configuration.
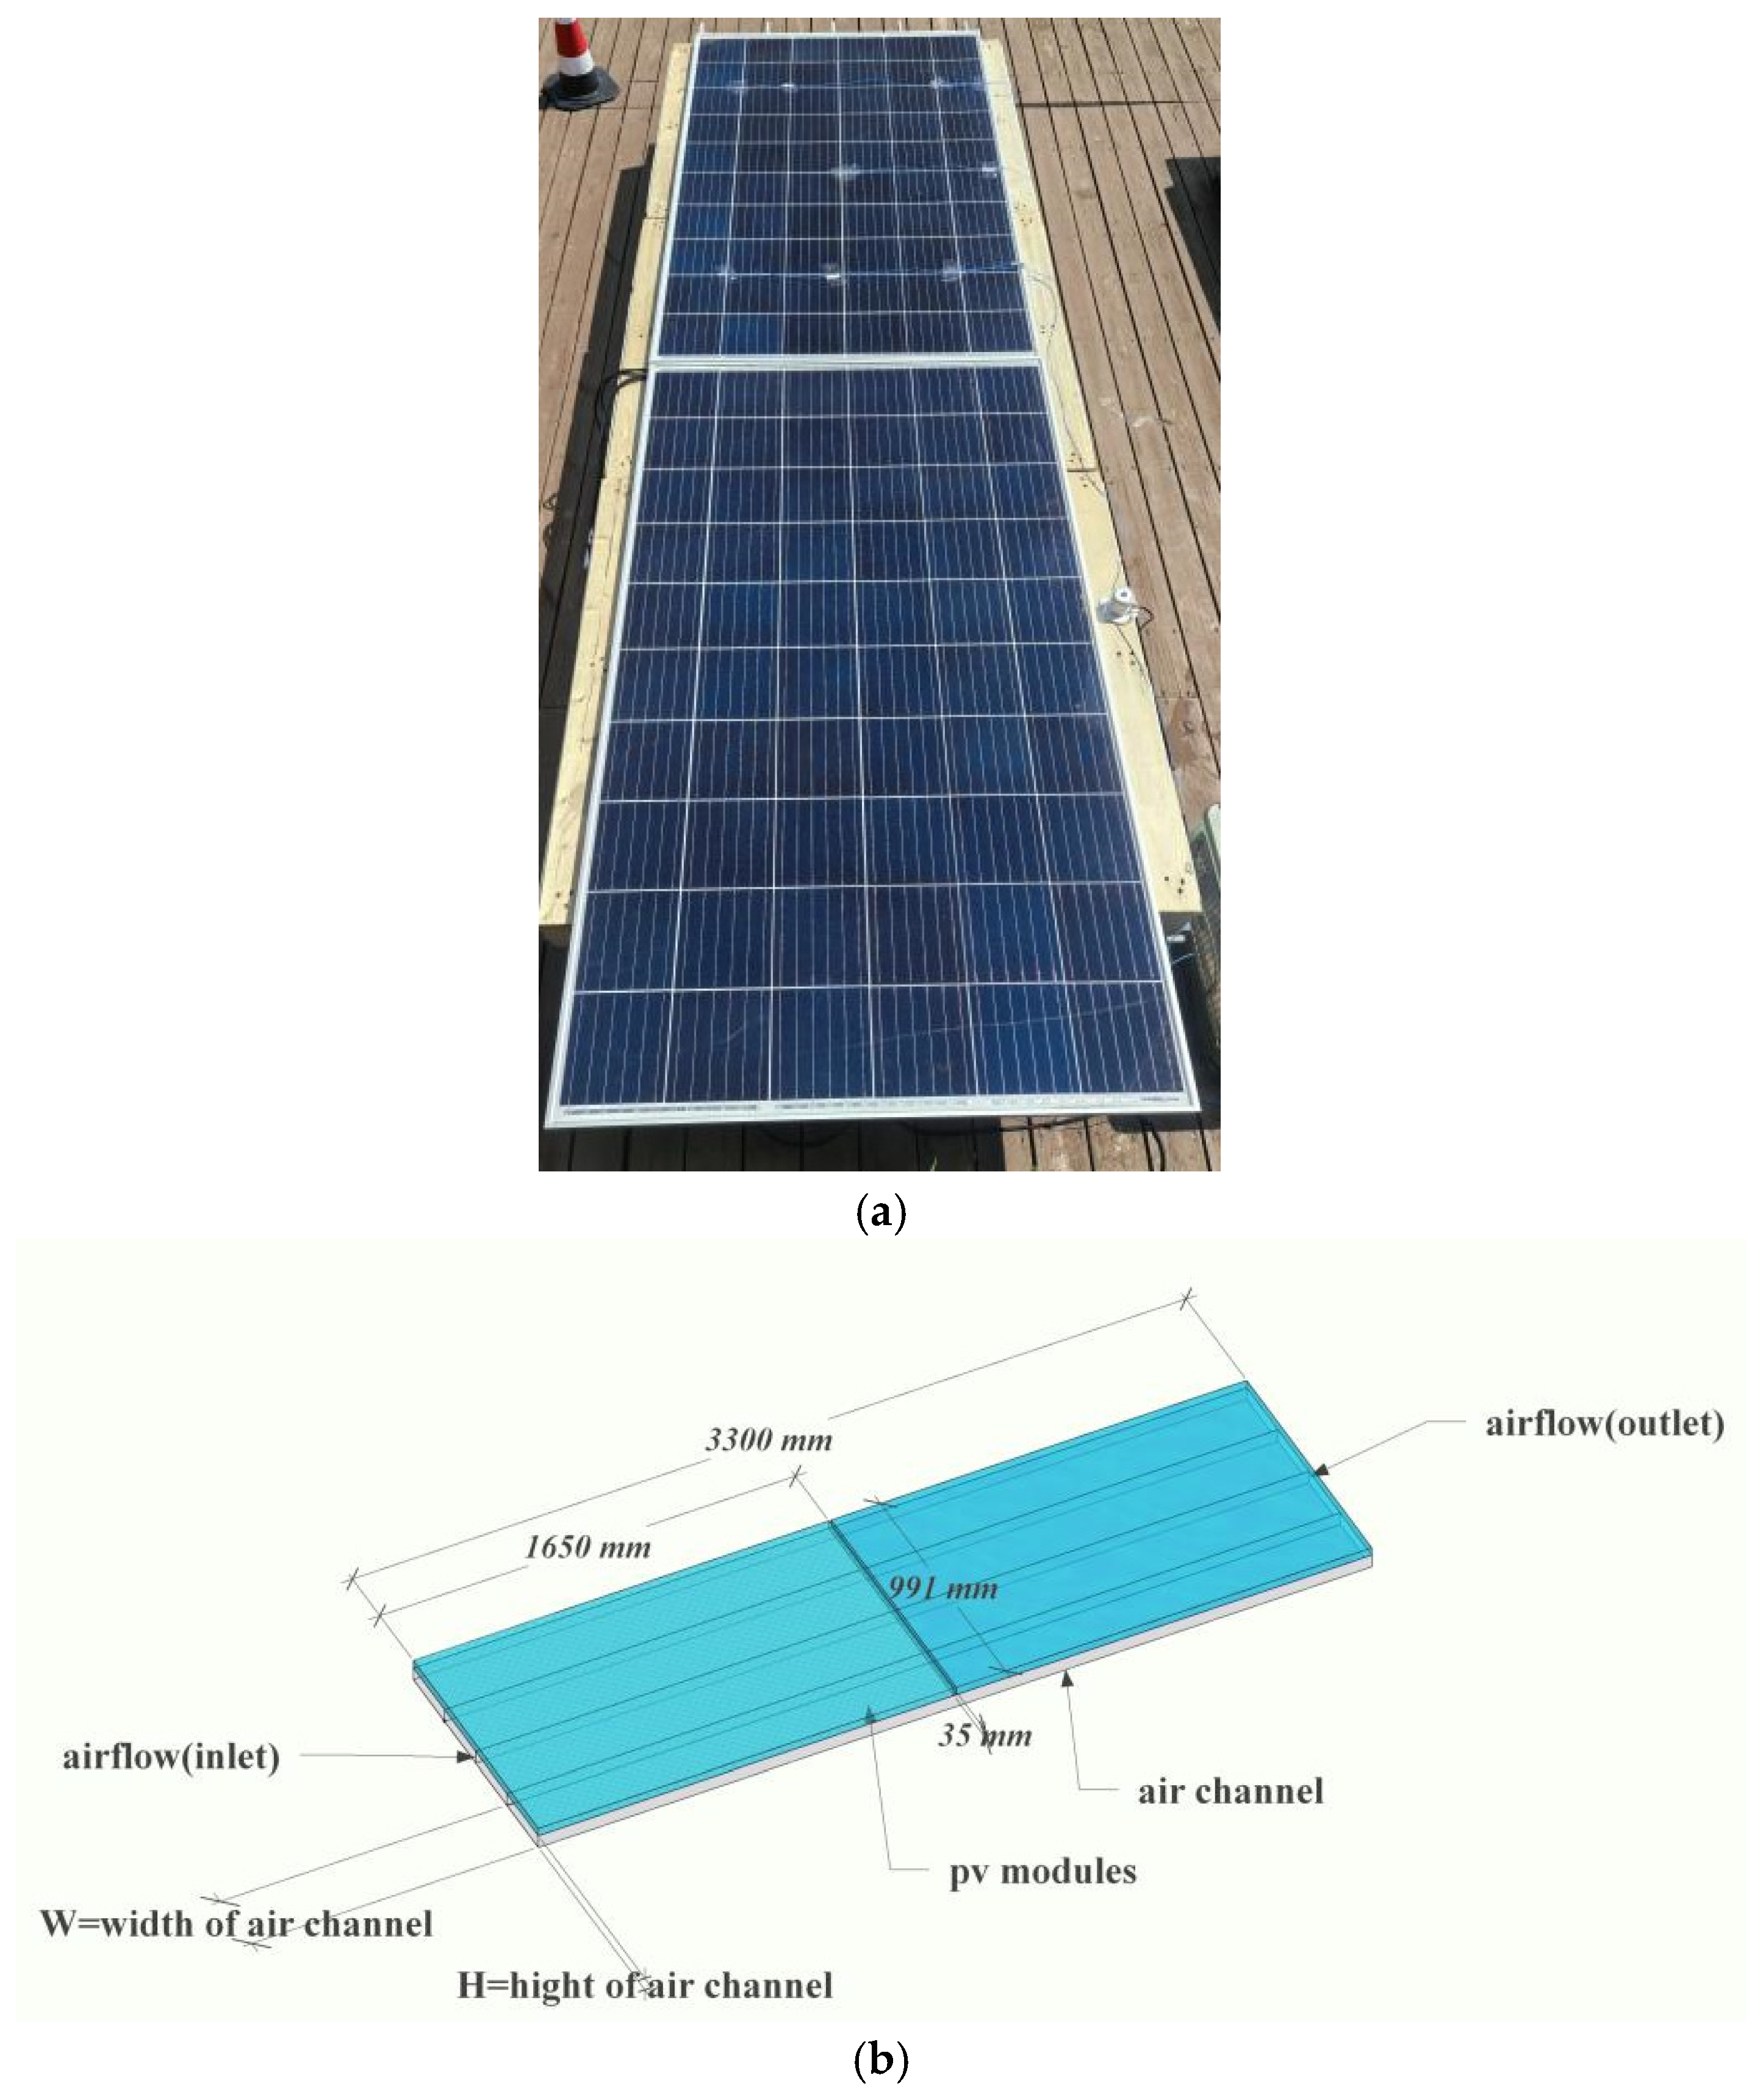
3.1. Experimental Setup and Procedure
Two polycrystalline PV panels are positioned on an existing horizontal roof, as depicted in Figure 1a. The PV panels are covered on their left and right sides due to the presence of an air channel, creating an enclosed space underneath for cooling. Air enters through lower-level inlets and exits through upper-level outlets. The specifications of the solar PV panels are detailed in Table 1.
Figure 1.
(a) Photograph of PV roof modules, (b) schematic.
Table 1.
Solar PV panel specifications.
The experiments utilized thermocouples with an accuracy of ±0.5 °C, which were calibrated prior to experimentation. Thirteen thermocouples were attached to the PV panels’ front and back surfaces. Two anemometers were positioned at the inlet and outlet of the air channel to measure air velocity and temperature. Additionally, a solar irradiance monitor with an accuracy of ±5% was placed at the same level adjacent to the PV panels to measure solar radiation. The arrangement of all monitoring points is illustrated in Figure 2 and detailed in Table 2.
Figure 2.
Photograph of the label of the measuring points in PV modules.
Table 2.
The detailed description of monitoring point arrangement.
The experiment site was free from shading, and data collection was conducted on clear, rain-free days to ensure relatively stable irradiance values.
3.2. Numerical Models for the Air-Based Cooling PV Roofs
3.2.1. Physical Model
A complete BIPV roof structure primarily comprises PV modules, an air channel, and roof tiles made of color-coated steel. Figure 1a,b depict the basic structure of the PV module, serving as the foundational elements for model development and simulation. These figures provide essential parameters of the PV panel, including its structural, thermophysical, and optical properties, detailed in Table 3 and Table 4. The thermal properties of the PV modules are independent, with no temperature-dependent relationships.
Table 3.
Thermophysical properties of PV panel.
Table 4.
Optical properties of PV panel components for normal incidence light.
The geometric models for numerical simulations were created in SpaceClaim based on the physical model. The PV module was simplified as a single layer due to its thin thickness relative to its length and width. This simplification reduces the risk of calculation errors and facilitates the creation of a high-quality mesh in subsequent steps.
Mesh generation was conducted using Fluent Mesh in the analysis system. A preliminary model was simulated to ensure adequate accuracy. The volume mesh utilized hex-core elements, producing a high-quality mesh with a maximum skewness of 0.91, consisting of 62,234 nodes and 248,985 elements. Mesh quality significantly influences the results of parametric studies, detailed further in Section 3.4, including grid independence analysis. Section 3.5 proposes additional parametric studies on the physical configuration of the air channel to explore its impact further.
3.2.2. Mathematical Formulation
ANSYS Fluent CFD software was employed to simulate PV roof models with varying configurations. Reynolds-Averaged Navier–Stokes (RANS) equations were used. The airflow can be considered incompressible. The standard k-ϵ model was applied to solve the numerical models of turbulent flow [32].
Continuity Equation:
Momentum Equation:
Energy Equation:
where
is velocity vector, (m/s);
is specific mass (kg/m3);
is the kinematic viscosity of fluid (m2/s);
is force per unit mass (N/kg);
is temperature, (K);
is thermal conductivity, (W/m2·k);
is viscous dissipation.
In the model, solar radiation, applied uniformly, serves as the primary heat source for the PV panels. The vertical solar incident angle incorporated average solar intensity data specific to Ji’nan obtained from actual measurements.
3.3. Boundary Conditions
The PV roofs consist of PV modules and metal roofing acting as an air channel. In practical installations, unique components connect these two parts, potentially causing turbulence in airflow. In our experimental setup, PV modules were securely affixed to a corrosion-resistant roof using seamless adhesive connections. This setup enabled steady-state analysis using the energy equation. Laminar airflow was assumed in the numerical model for simulation.
A trial model, proposed for validation as described in Section 3.4, was based on standard test conditions (STC) with an ambient temperature of 25 °C. Solar radiation, at 1000 W/m2 directly impacting the outer glass layer of the PV modules, provided all energy input. In formal simulations, environmental parameters would be defined using measured data specific to Ji’nan, detailed in Section 4.2.
Convection heat transfer on the PV module surfaces was modeled with a coefficient of 18.75 W/(m·K) [33]. The PV modules were considered semi-transparent with a solar transmissivity of 1 and absorption of 0.6 [34]. The external emissivity of other surfaces remained default at 1.
All contact surfaces and lines shared a topology, ensuring perfect thermal contact. Walls exposed to airflow were set with a no-slip condition, and inlet and outlet boundaries were configured to prevent reverse flow, maintaining a unidirectional airflow. The inlet was set as a ‘velocity inlet’, and the outlet was defined as a ‘pressure inlet’.
3.4. Grid Independence
The selection of appropriate mesh cells is crucial for optimizing computational memory and simulation time within the computational domain, directly impacting result accuracy.
The calculated results show minimal fluctuation with changes in mesh resolution. Table 5 illustrates the independence of simulation results under STC. Analyzing the magnitude and trend of changes in simulation outcomes reveals that finer mesh resolutions, particularly at the 250,000-cell level, yield more reliable results with enhanced accuracy.
Table 5.
The grid research results.
3.5. Parametric Studies on Air Channel
In this study, the cooling space beneath PV roofs is the primary physical configuration under optimization. Due to manufacturing constraints of color steel tiles, the roof shape is often irregular and typically approximated as trapezoidal or rectangular. To maximize cooling performance, rectangular structures are considered, offering larger surface areas relative to perimeter length. The optimal dimensions of the air channel ideally align with existing roof dimensions, with heights ranging from 25 mm to 75 mm and widths from 200 mm to 400 mm. Table 6 provides detailed mesh quality for each parametric study.
Table 6.
Mesh quality description for each parametric study.
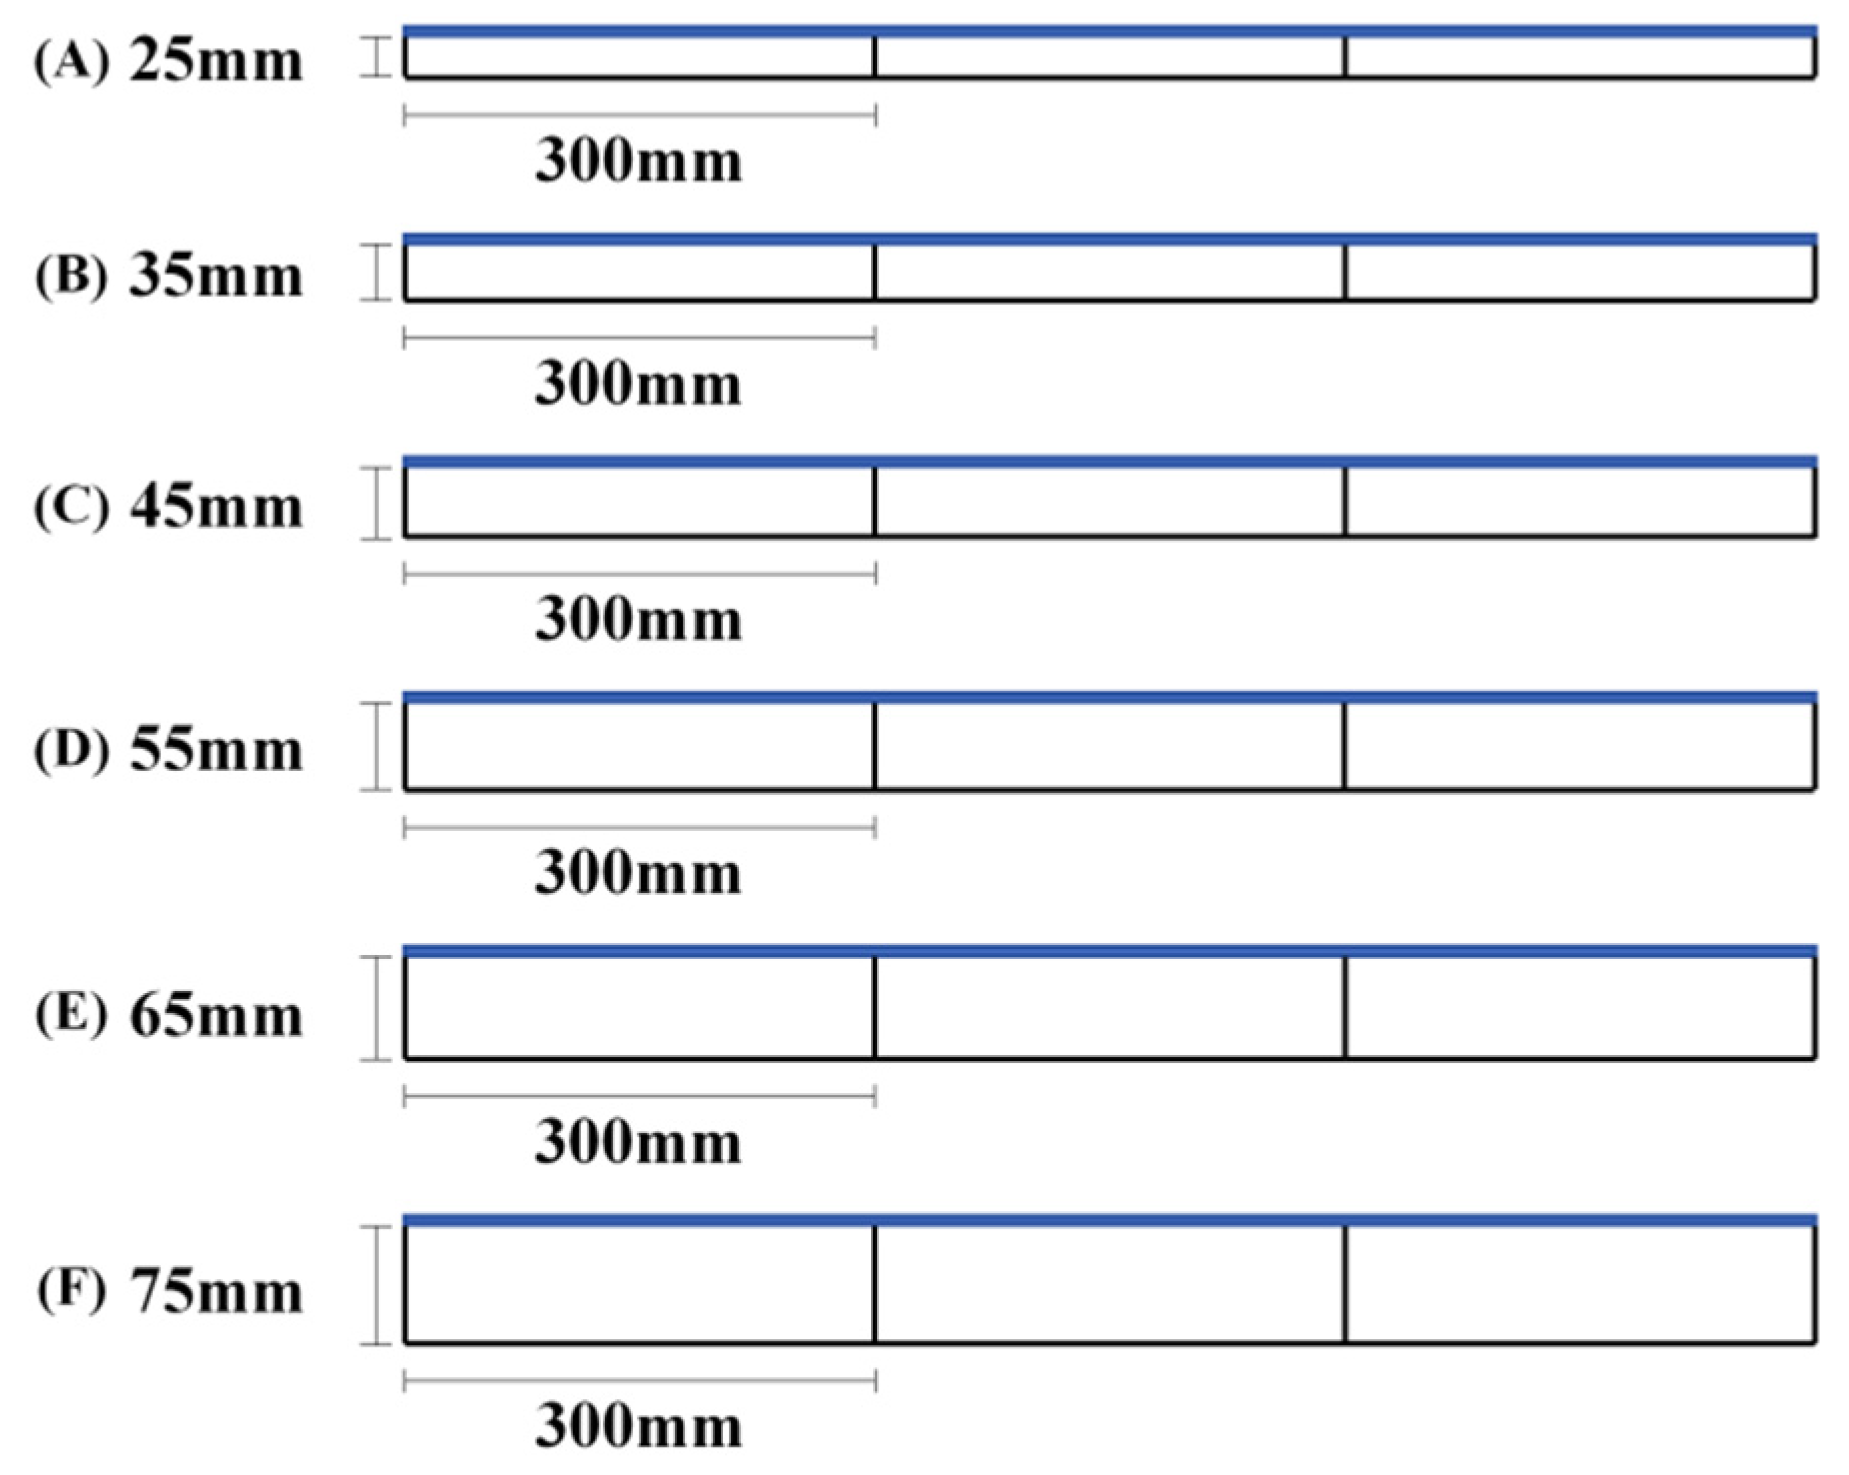
3.5.1. Case 1 Varying Air Channel Heights
The geometry was created and developed using SpaceClaim. For each simulation, the height of the air channel was incrementally increased by 10 mm. Meanwhile, the width was maintained at a constant 300 mm, approximately one-third of the width of the PV panel. Thus, Figure 3 illustrates six different models with varying air channel heights: 25 mm, 35 mm, 45 mm, 55 mm, 65 mm, and 75 mm.
Figure 3.
Geometry of simulated air channel integrated PV with different heights.
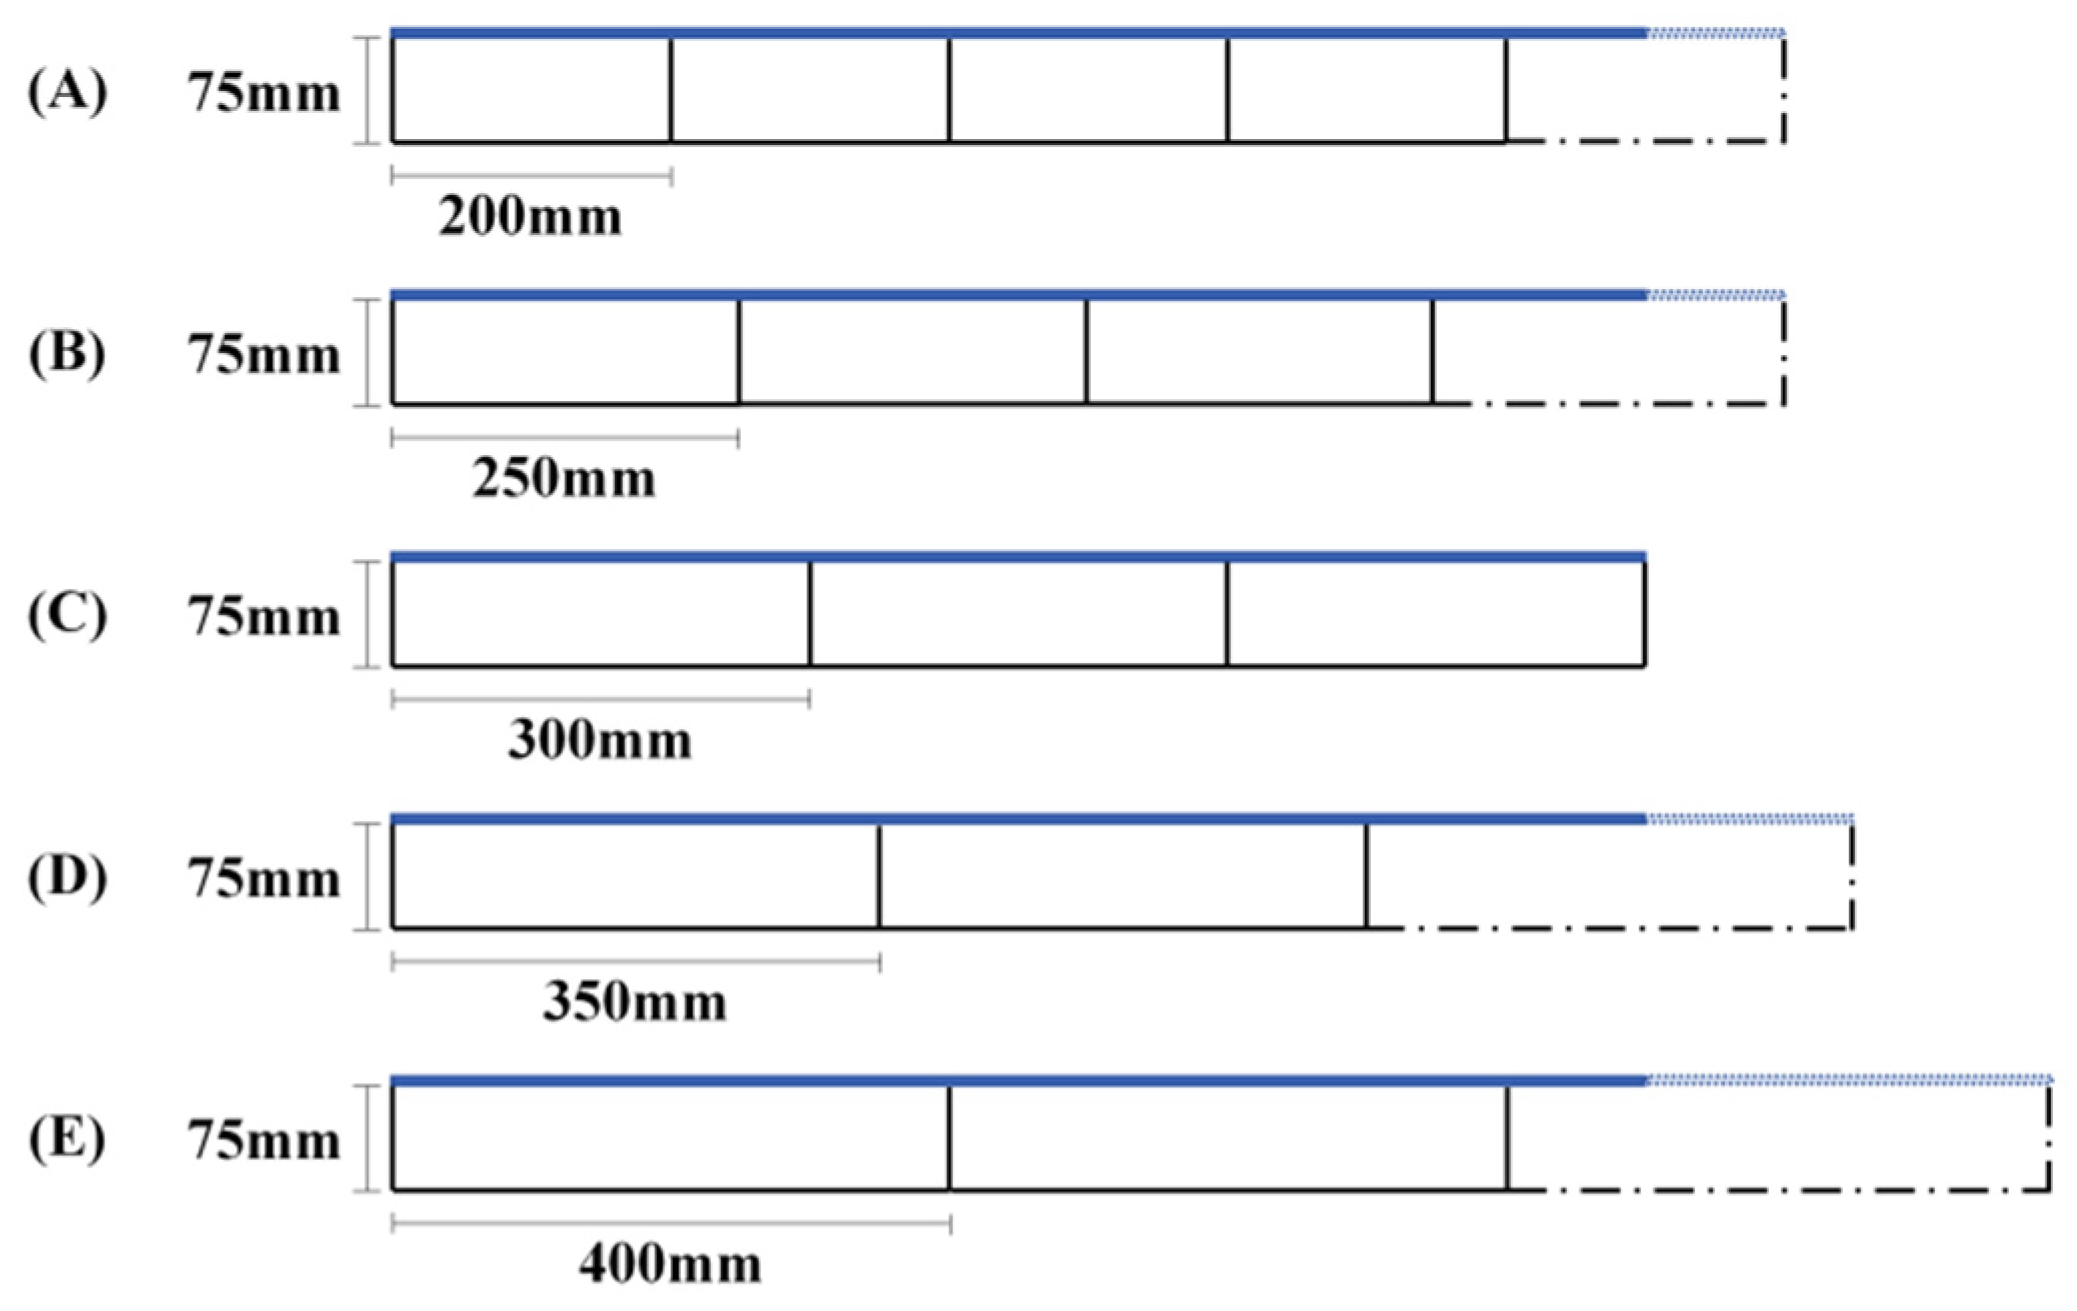
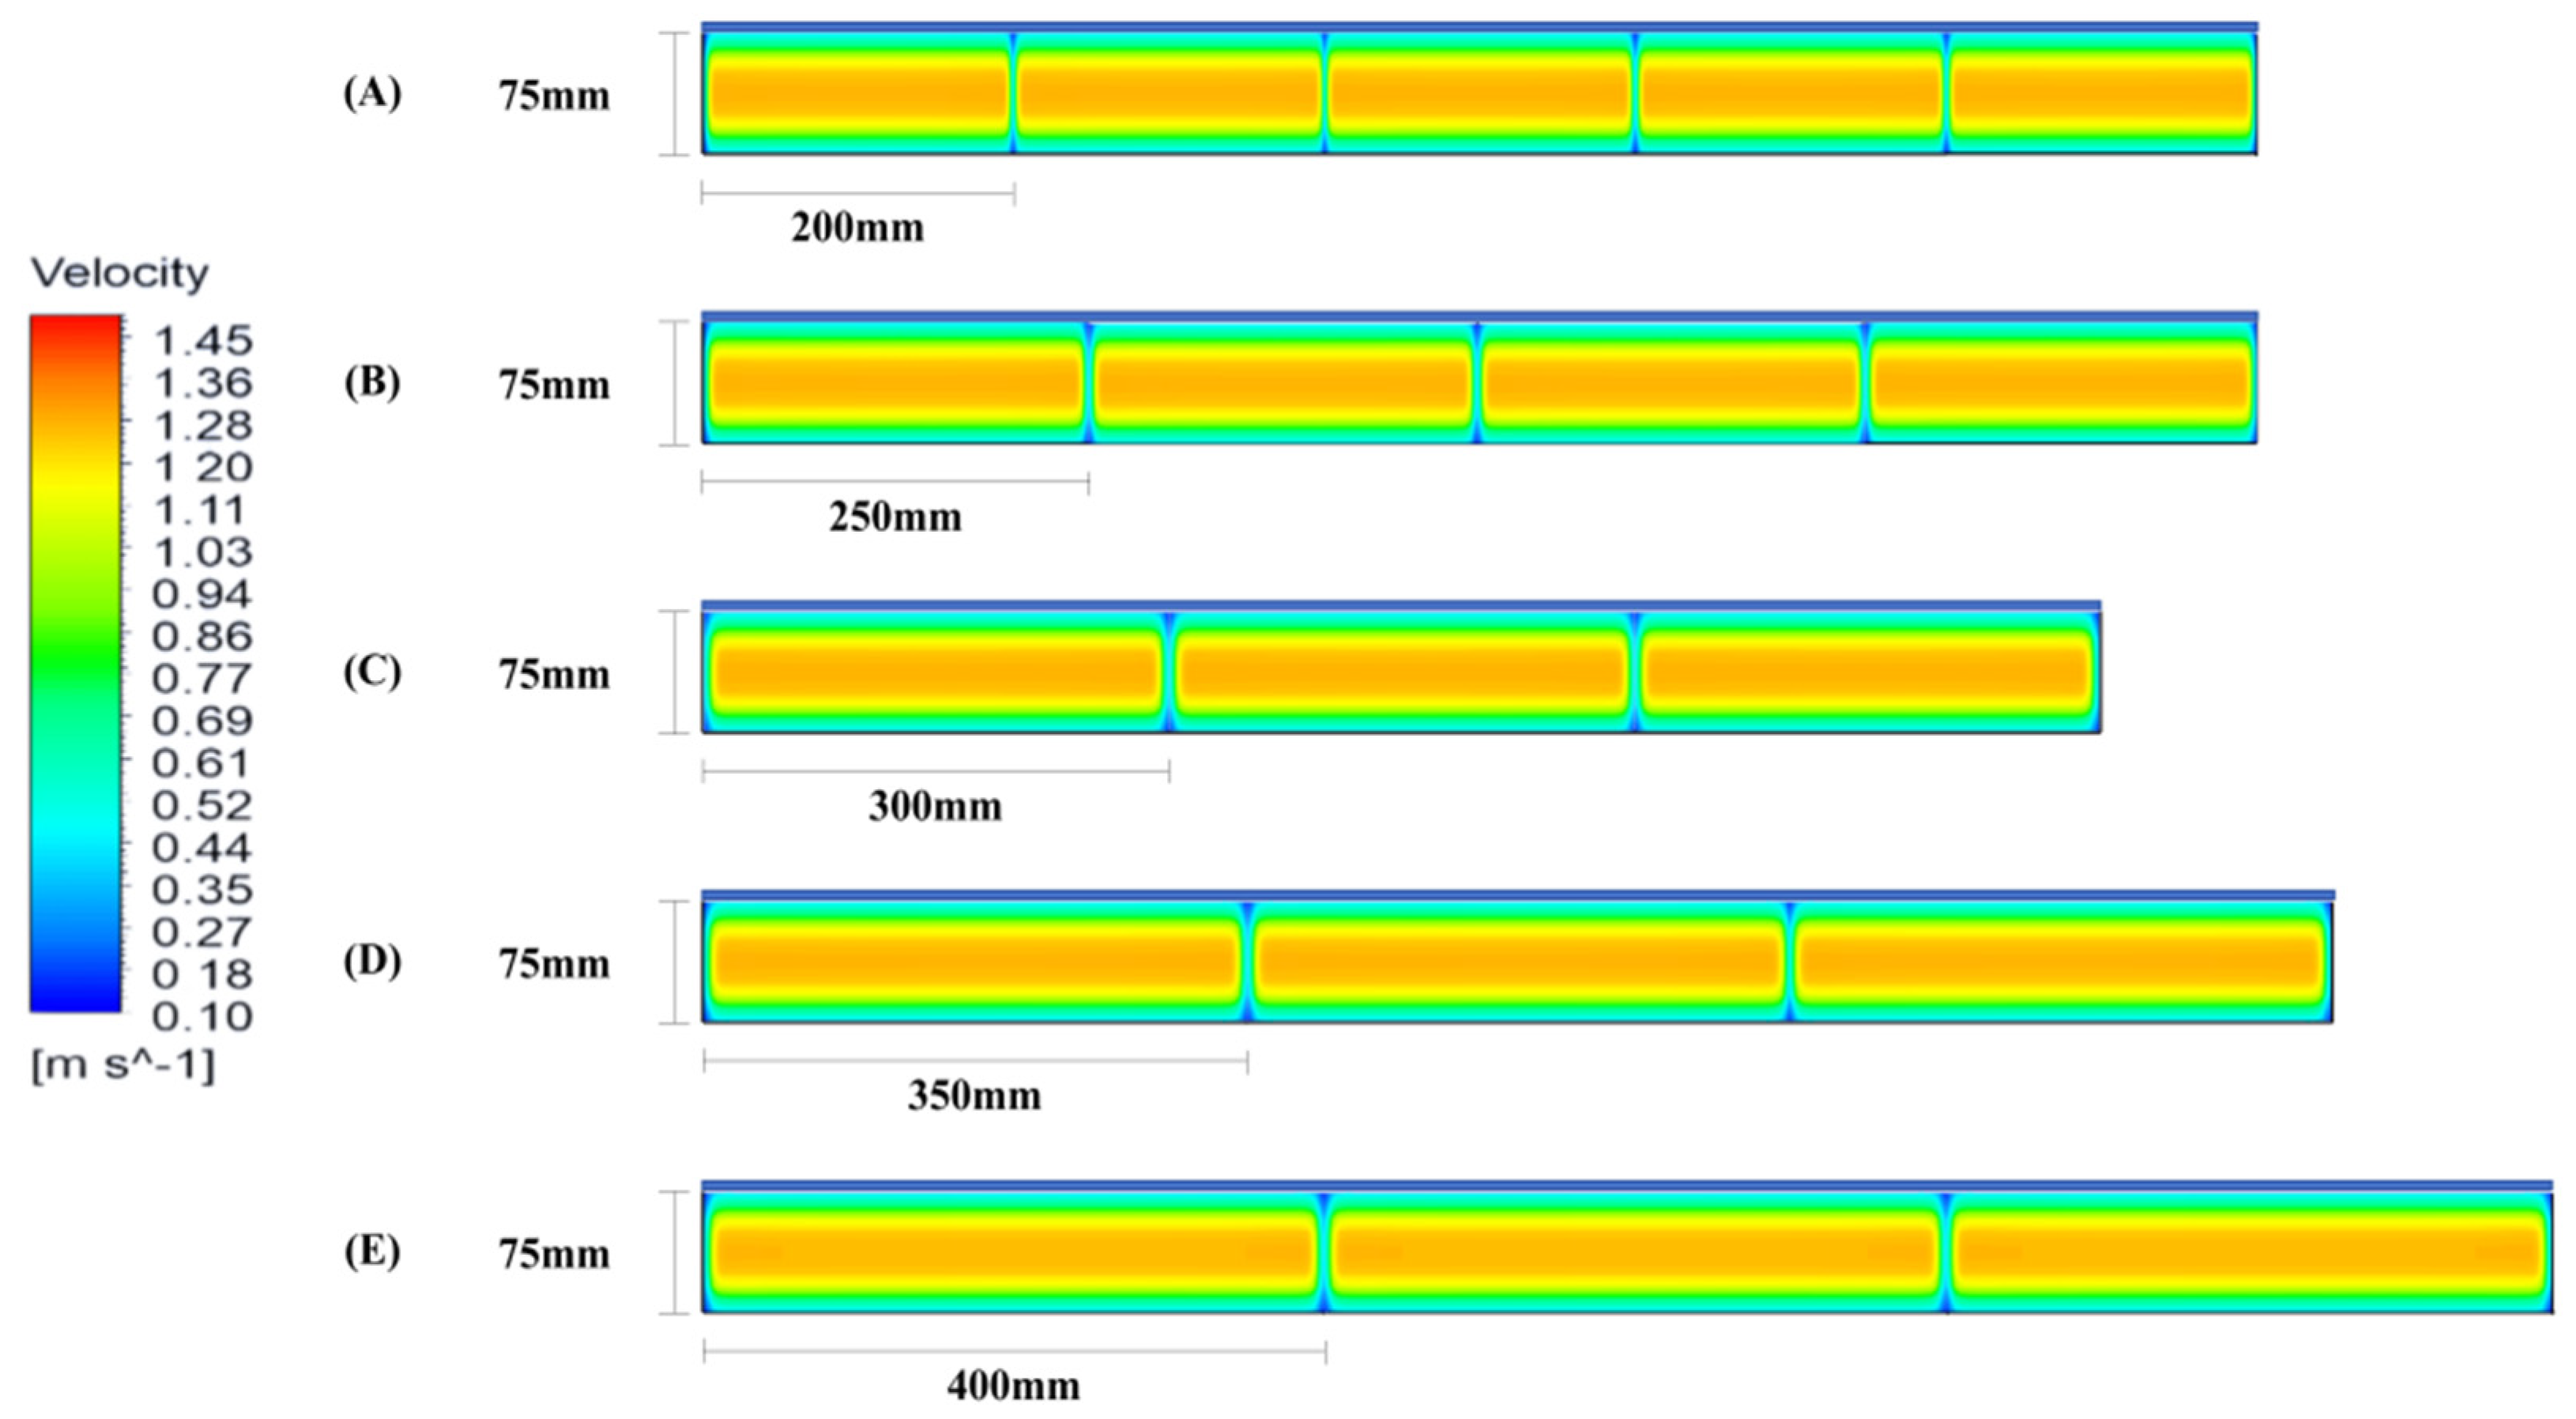
3.5.2. Case 2 Varying Air Channel Widths
The optimal air channel height identified from the previous analysis was applied in a parametric study to determine the most advantageous air channel widths. Five models were proposed with air channel widths increasing by 50 mm increments, ranging from 200 mm to 400 mm, aimed at enhancing cooling performance, as shown in Figure 4. Due to the imperfect alignment between the air channel and PV panels in width, dashed lines were used to complete the alignment. Through trial calculations, it was found that the change in the size of the PV module, resulting from the modification of the flow channel, leads to a negligible change in the temperature of the PV module.
Figure 4.
Geometry of simulated air channel integrated PV with different widths.
4. Results
This section presents two sets of results: experimental and simulated. While the boundary conditions and actual measurements differ slightly, they exhibit similar variation trends with acceptable errors. The primary goal is to use actual data to enhance and validate the numerical model.
4.1. Experimental Results
In test experiments on PV modules, a sunny day with stable solar irradiation and no clouds or rain is considered ideal testing conditions. Two sunny days in summer, 18 June and 28 July in 2024, were selected as test days, D1 and D2, respectively. Due to environmental factors, solar irradiation on D1 fluctuated more significantly, while the solar irradiation on D2 remained relatively stable. D1, which has a larger fluctuation of solar irradiation, is used as the boundary condition to validate the model, which can better reflect the degree of response and accuracy of the mathematical model. In contrast, D2 was used to study the temperature uniformity of the PV module, the shading effect, and its electrical performance.
4.1.1. Model Validation
Solar radiation and ambient temperature were collected between 8:00 and 16:00 on D1. These measured data were used as boundary conditions in the numerical model.
The mean absolute error (MAE) and the Root Mean Square Error (RMSE) were used to evaluate the performance of the numerical model [35,36]. The MAE, RMSE are calculated by the following equation [37]:
where
yi is the actual measured value;
is the predicted value.
Errors between the measured and simulated values are inevitable. The mean absolute error (MAE) is defined as a quantity utilized to measure the closeness of the predicted values with the measured values. It is more suitable for analyzing situations where there are large fluctuations in the error and is used in this study to analyze the variation of PV module temperature over the course of a day, as shown in Figure 5. Figure 5 demonstrates the calculated and measured temperatures of the PV panels with reasonable consistency. While a few data points may not align perfectly at certain times, the overall MAE is 4.02 °C.
Figure 5.
The measured temperature of PV panels at the central point, ambient temperature, and solar irradiation from the outdoor experiment on D1, the calculated temperature of the PV panels from CFD.
The accuracy of estimated parameters can be assessed using The Root Mean Square Error (RMSE), which was used to quantify the variance between the experimentally determined surface temperature and the CFD-simulated surface temperature of PV panels. The values are summarized in Table 7. The RMSE at the center of the point (T1) demonstrates the smallest value, and the RMSE at the surrounding points is relatively high. The RMSE of surface average temperature is 0.24 °C. According to Ranganathan and Elumalai et al. [38], a few inconsistencies were acceptable. There is good agreement between the measured and simulated values, demonstrating the analytical model’s reliability for estimation.
Table 7.
Root Mean Square Error (RMSE) values.
There is a strong correlation between changes in PV surface temperature and solar radiation. However, exact correspondence is not always achievable due to various factors, even under similar daily conditions. Our goal is to closely replicate real-world scenarios in our mathematical model by adjusting parameters and achieving high fidelity. The simulated temperatures range approximately from 38.24 °C to 66.08 °C, while the measured temperatures of the PV panel (T3) show variations between 37.41 °C and 62.05 °C.
4.1.2. Non-Uniformity of Surface Temperature
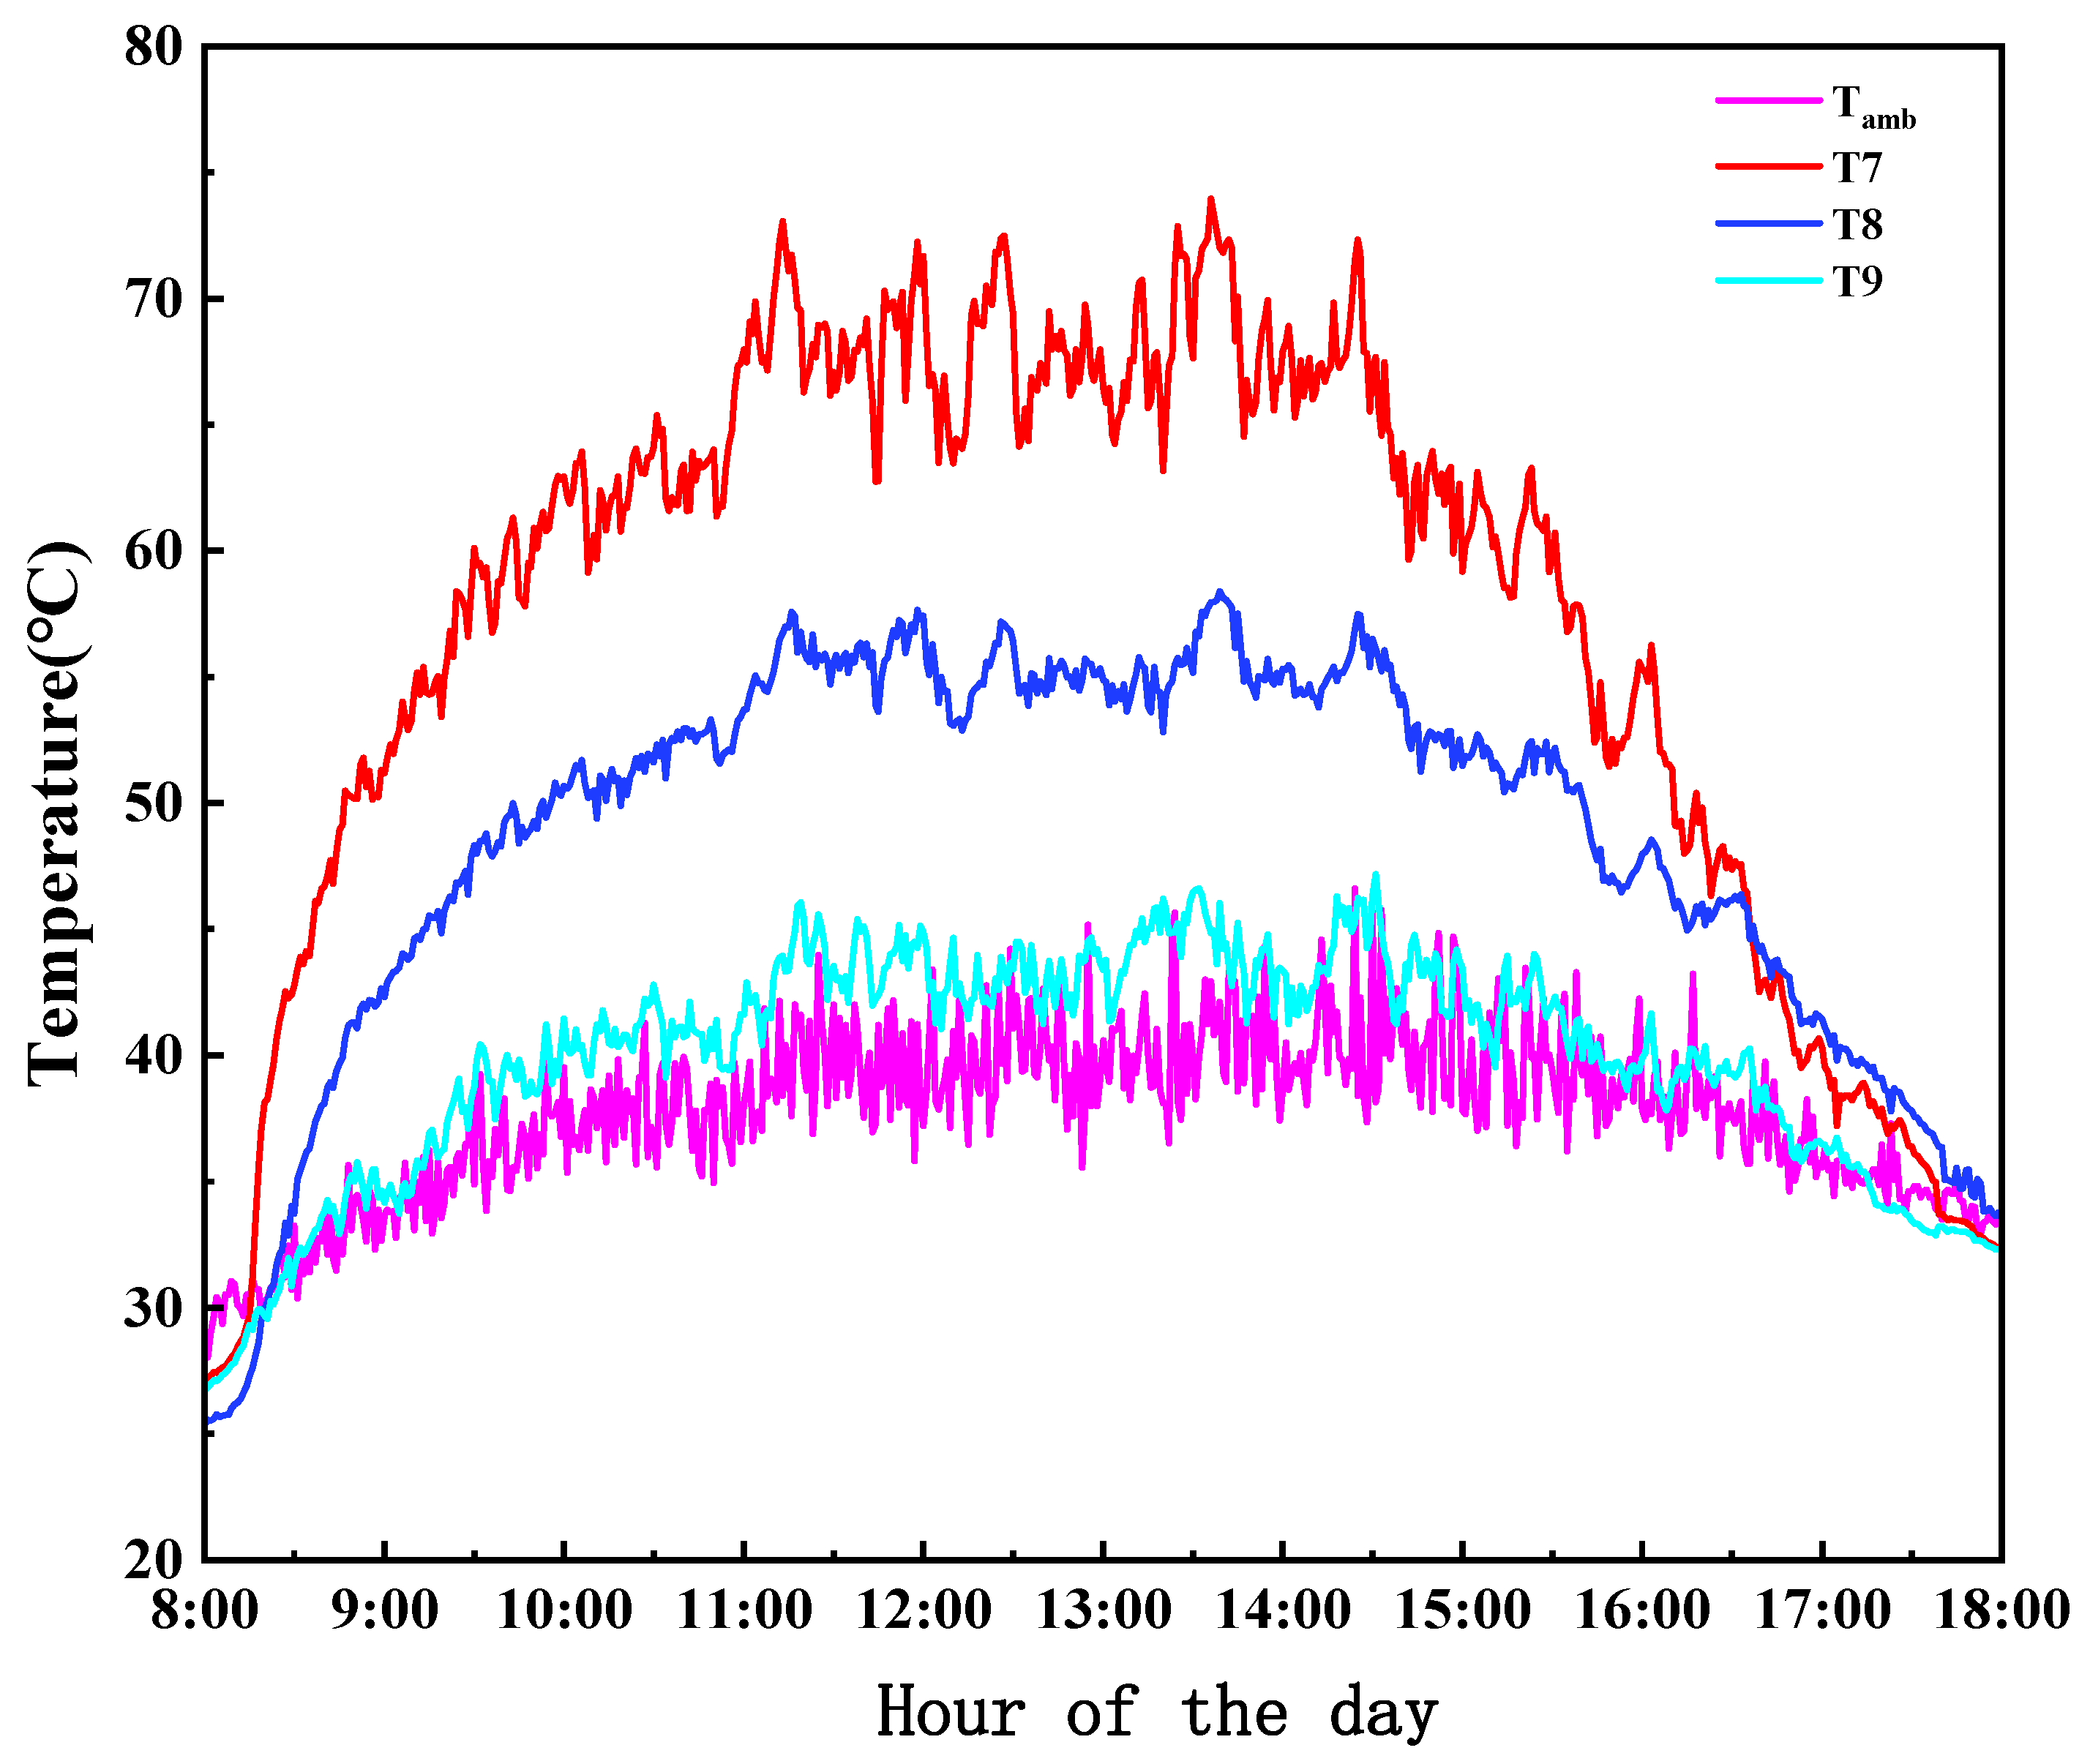
The surface temperature of PV panels increases with solar radiation, as expected. Specifically, the temperature distribution across the PV panels is uneven. Figure 6 displays the temperatures of five measurement points on the front side of the PV panel. Before 8:30 on D2, when solar irradiation changes drastically, the temperature difference on the panel can reach up to 16.50 °C. On the same PV panel, the temperatures at the upper measurement points (T1, T2) are slightly higher than those at the lower measurement points (T4, T5), with a temperature difference of less than 3.50 °C. These data indicate variations in temperature across the surface of the PV panel, highlighting an uneven temperature distribution. However, substantial temperature differences are not typical and may be influenced by factors such as shading or passing clouds.
Figure 6.
Daily transient PV panel temperature distribution and solar irradiation on D2.
4.1.3. Shade Effect
The PV modules are installed on traditional color steel tiles, which act as shading components that effectively reduce the roof temperature. Due to the material properties, metal roofs heat up rapidly under solar radiation, reaching temperatures as high as 73.95 °C without shading. Figure 7 illustrates the surface temperature of the metal roof with and without PV modules. Direct sunlight causes significant temperature fluctuations in the metal roof. Underneath the PV panels, the surface temperature of the metal roof decreases significantly, with the most pronounced effect observed around noon. The maximum cooling benefit can reach up to 29.25 °C with an average surface temperature reduction of 12.90 °C at the outlet of the air channel. Due to its location, the outlet (T9) temperature approximates the ambient temperature. Both temperature measurement points are situated within the air channel or beneath the metal roof, 200 mm from the inlet and outlet. However, the inlet temperature (T8) is generally higher than the outlet temperature (T9), varying from 1.07 to 15.02 °C. This phenomenon occurs because the inlet is oriented southward, exposing it to direct sunlight more frequently at the measurement point (Green-8) or transferring heat from other directly irradiated metal roof surfaces. Conversely, the measurement point (Green-9) has minimal exposure to direct sunlight, causing its temperature to be primarily influenced by the surrounding environment.
Figure 7.
Daily transient ambient temperature, the temperature of color steel tile with shade and without shade on D2.
4.1.4. Electrical Performance
Due to rapid environmental changes and measurement delays, polycrystalline PV panels’ actual instantaneous power output fluctuates significantly. Under STC, these panels exhibit an electrical efficiency of 20% with a temperature coefficient of −0.40%/°C. In this study, PV roofs with air channel dimensions of 75 mm × 250 mm achieve an effective area of close to 2.84 m2 for power generation. Table 8 presents the experimental results of electrical performance.
Table 8.
The typical instantaneous electrical performance PV roofs from 9:00–14:00 on D2.
4.2. Simulation Results
A three-dimensional (3D) simulation model was developed for parametric study. The cooling space for the PV panels is defined as the area between the metal roof and the PV panels, varying from 25 mm to 75 mm in height, with the width of the air channel ranging from 200 mm to 400 mm. Parameters were selected for analysis between 11:00 and 14:00 on D2, around the peak solar irradiance of 1100 W/m2 and an ambient temperature of 40 °C. The inlet air velocity in the air channel was approximately 1 m/s at the measurement point (Orange-13).
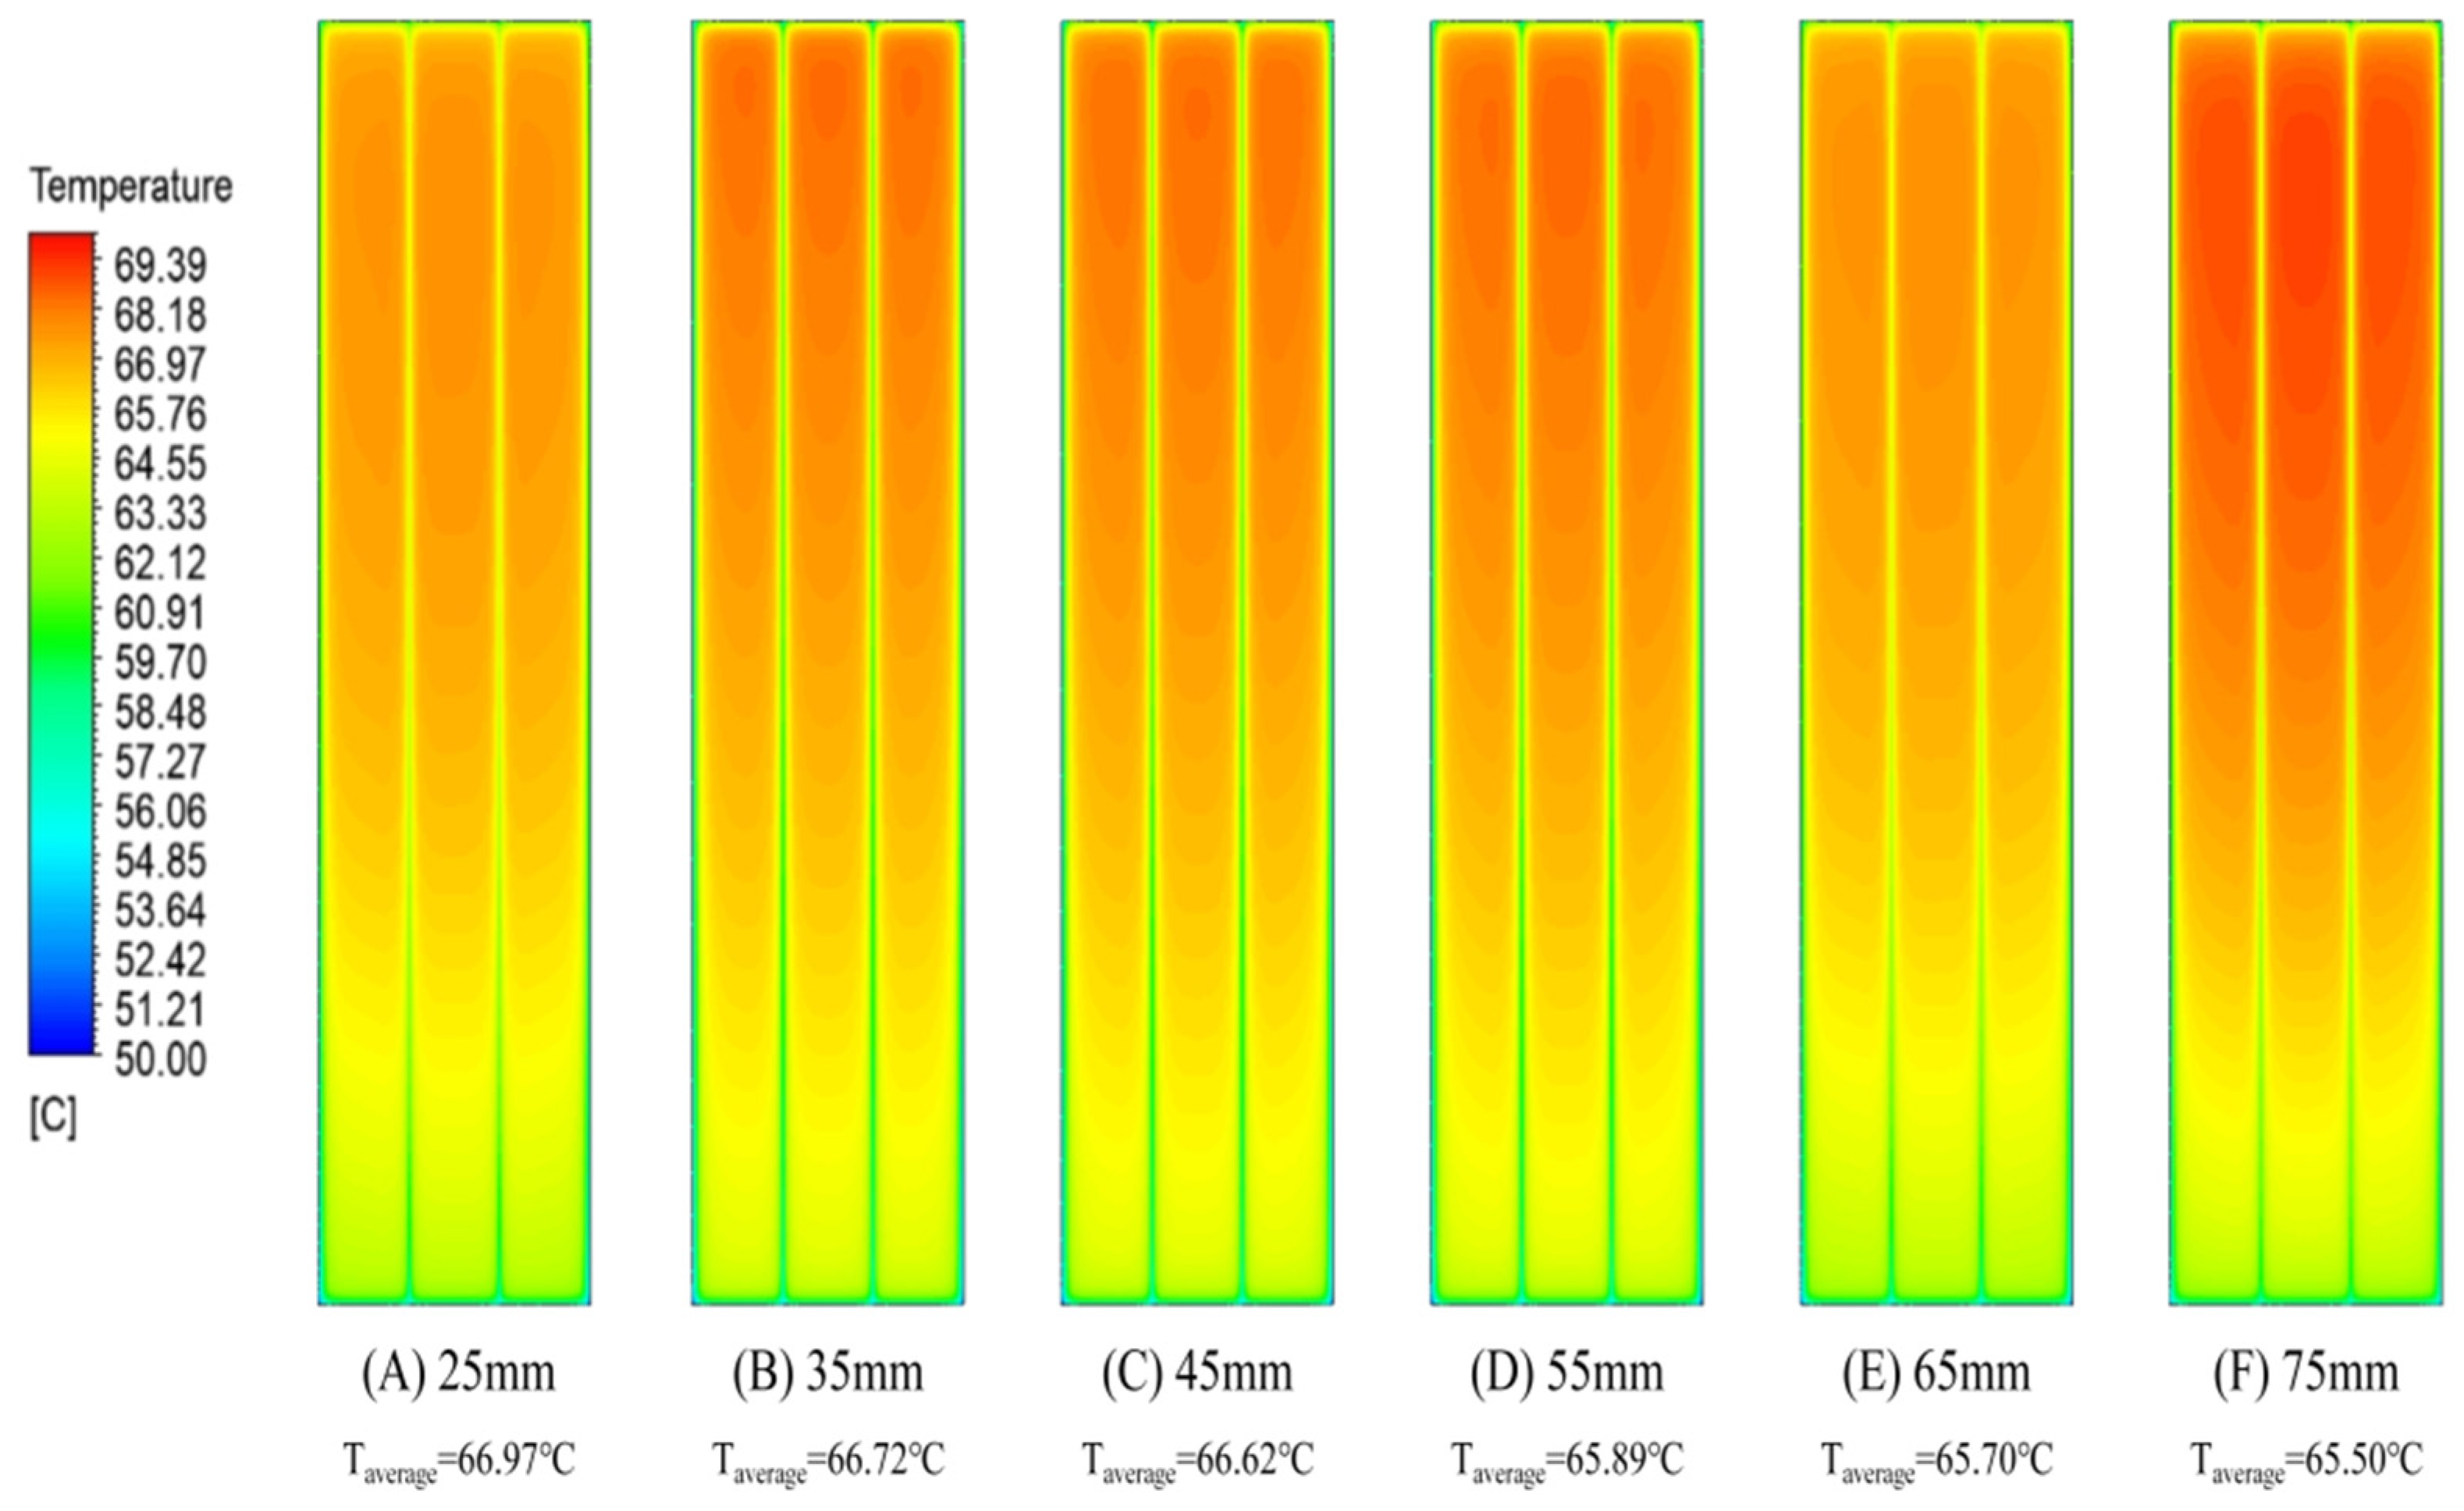
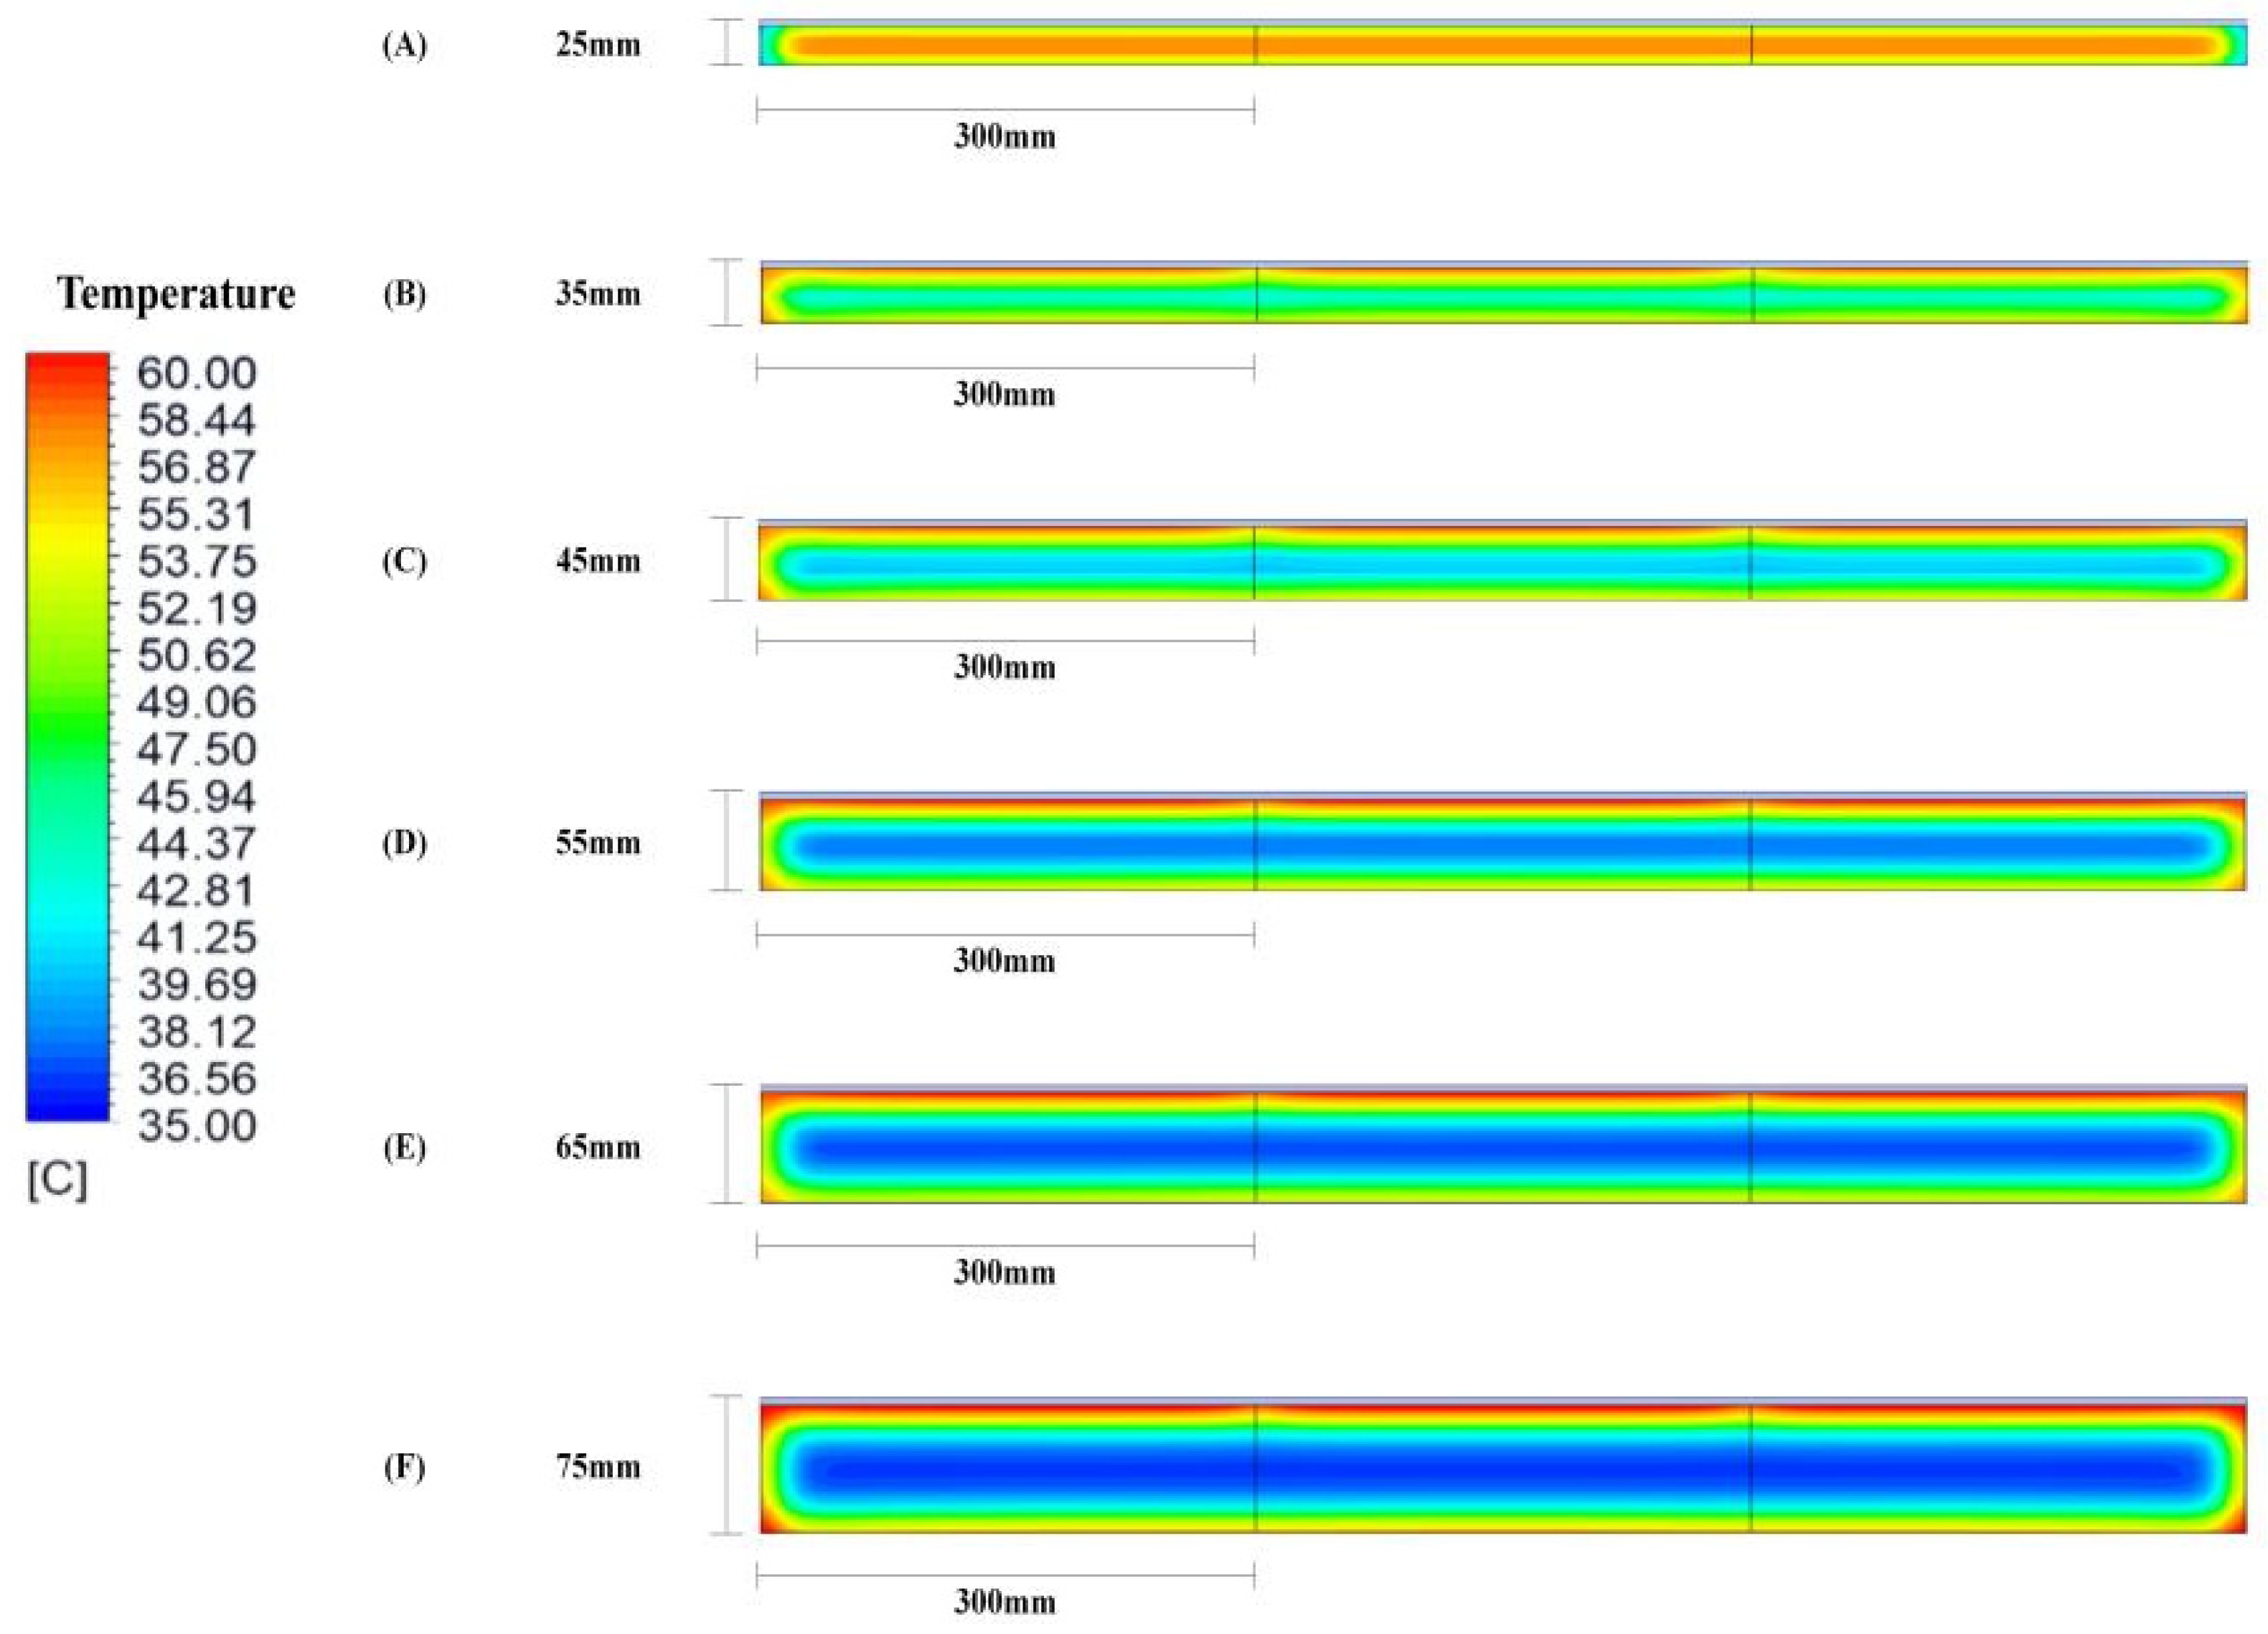
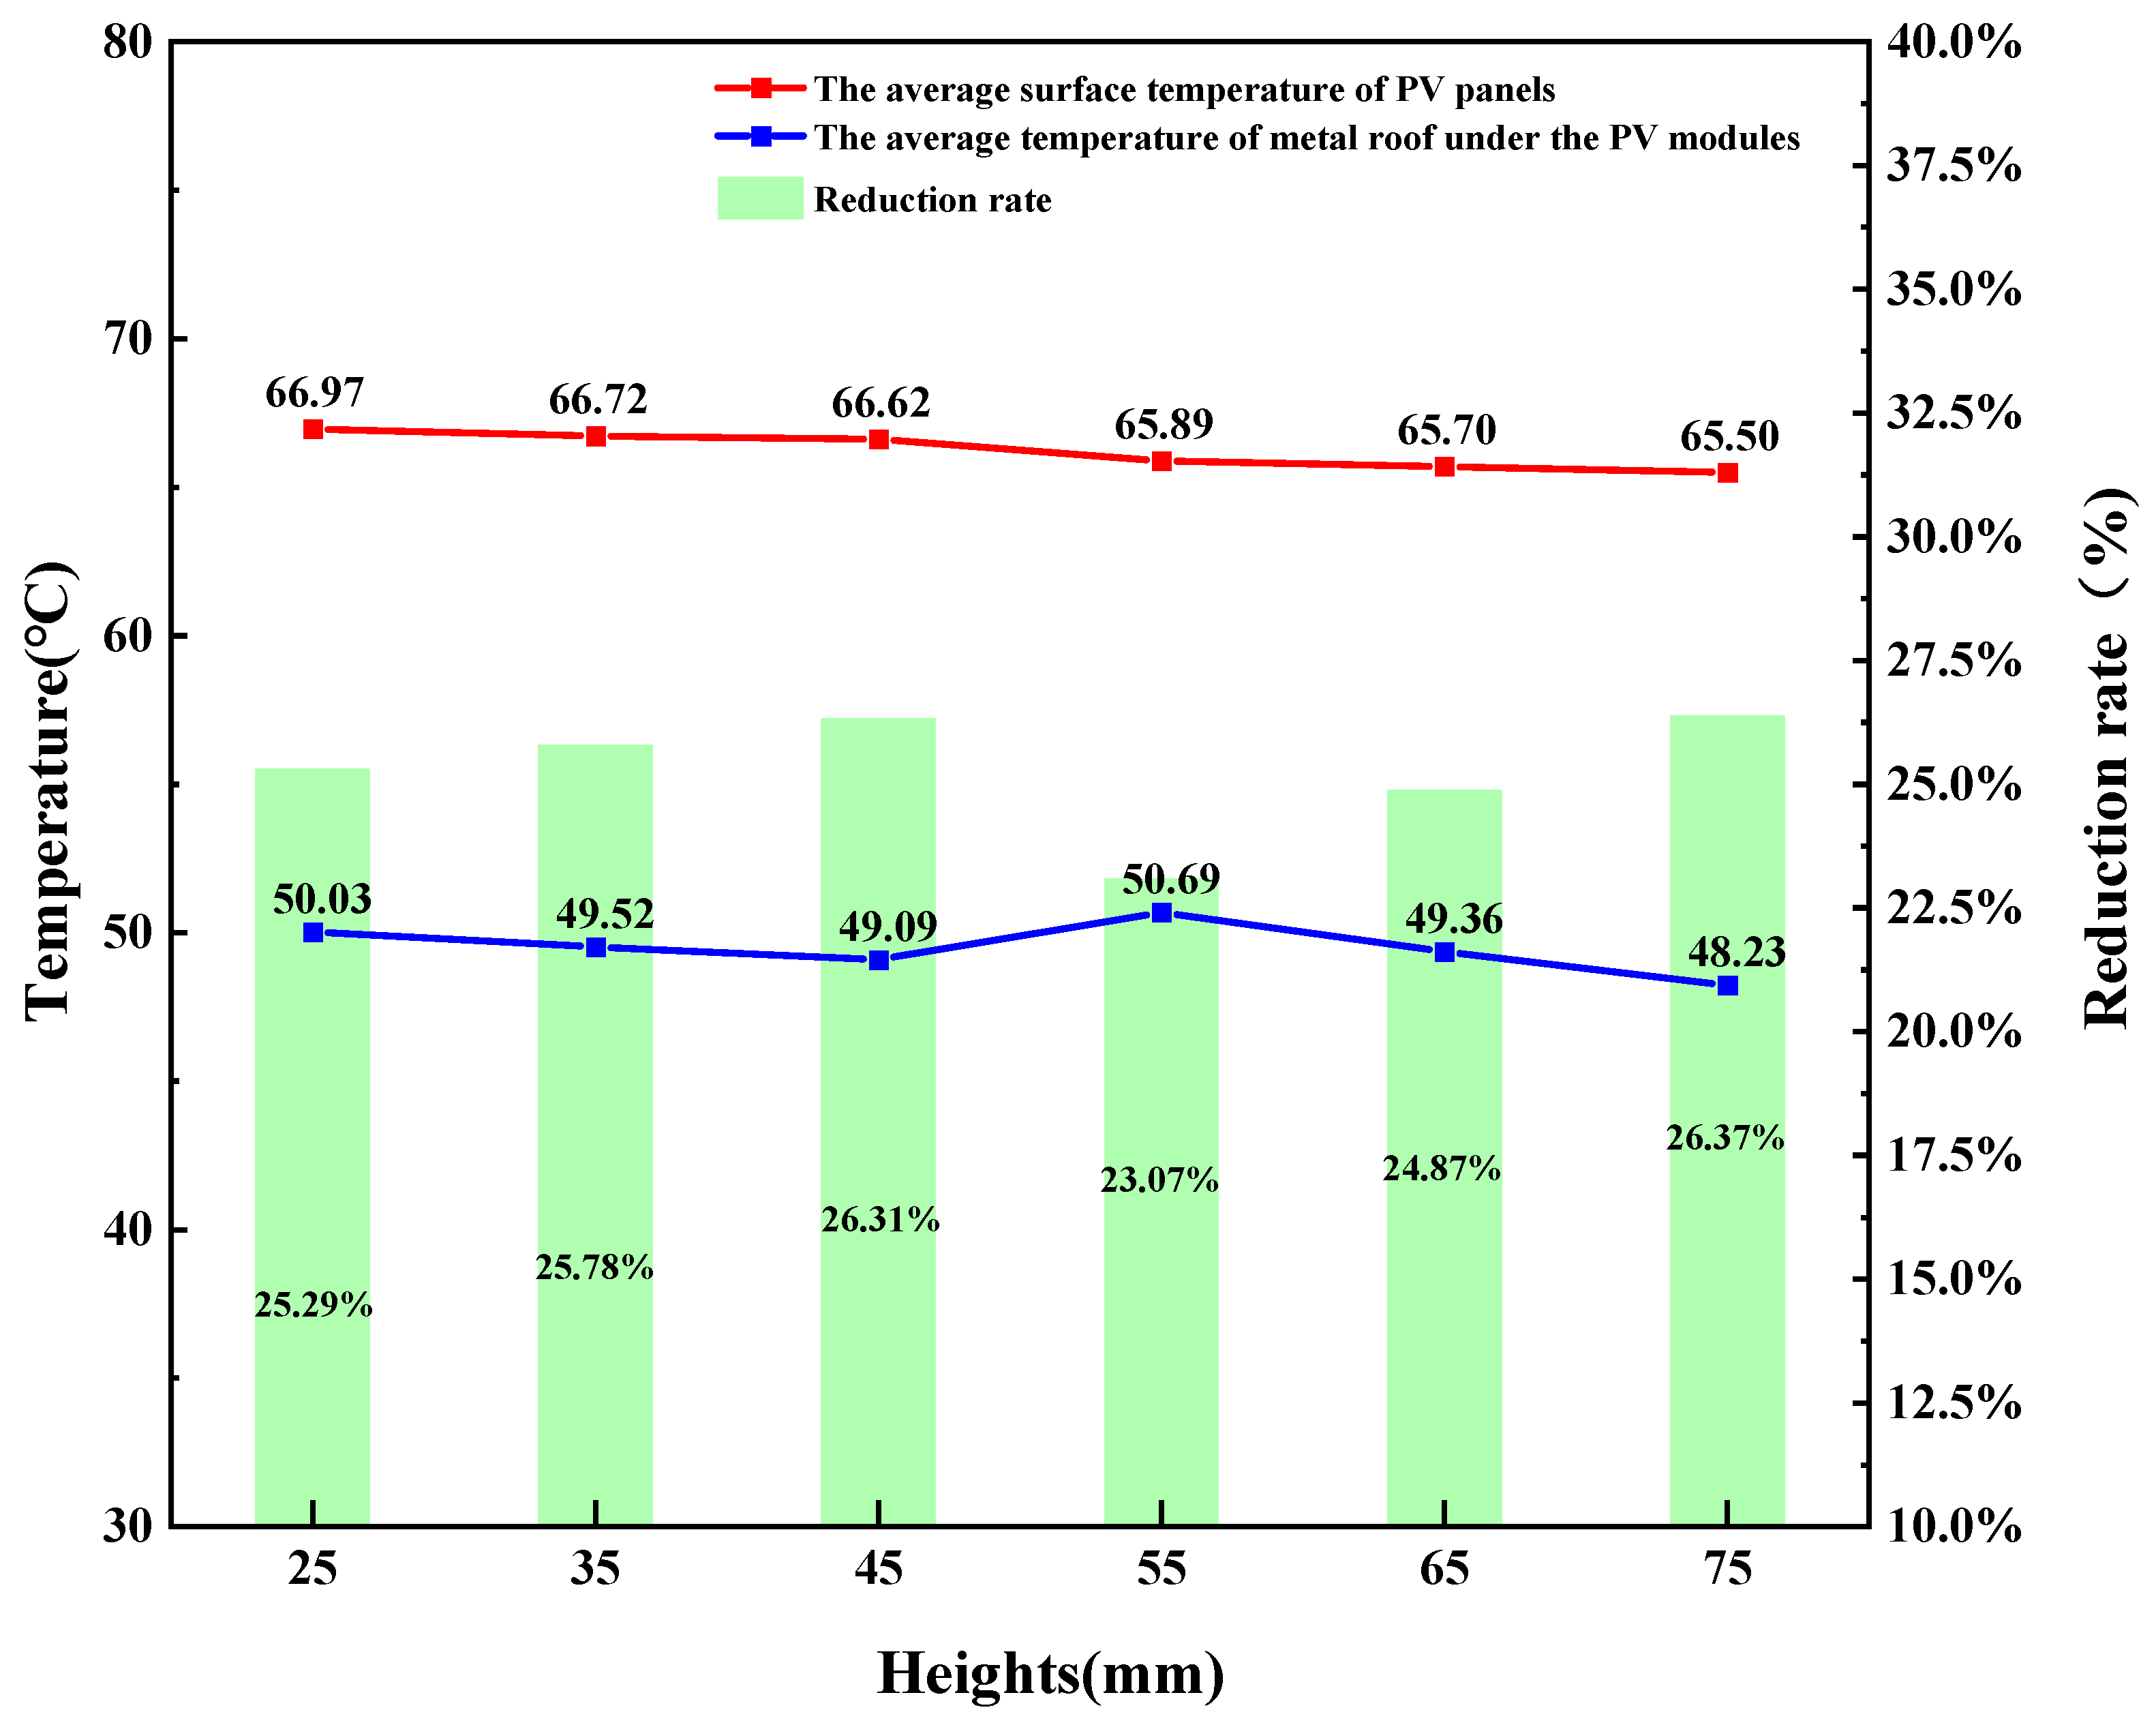
4.2.1. Case 1 Varying Air Channel Heights
Figure 8 illustrates the results of numerical models with varying heights. After calculation, the maximum temperatures of the top surface of PV roofs or external PV modules are recorded as 69.27 °C, 69.23 °C, 69.16 °C, 68.79 °C, 68.73 °C, and 68.50 °C for heights of 25 mm, 35 mm, 45 mm, 55 mm, 65 mm, and 75 mm, respectively. The temperature distribution shows similar patterns, with temperatures generally lower at the inlet than at the outlet due to enhanced heat transfer at the contact points with the metal ducts. At a height of 75 mm, the maximum outlet temperature reaches 62.26 °C, and the average outlet temperature shows a declining trend with increasing heights, reaching an average of 44.43 °C.
Figure 8.
Temperature contours of passively cooled PV panels with varying heights: 25 mm, 35 mm, 45 mm, 55 mm, 65 mm, and 75 mm.
Given the horizontal placement of the PV roofs, the air velocity inside the air channel decreases gradually towards the roofs, as depicted in Figure 9. Detailed results for the outlet temperatures and velocity are presented in Figure 10 and Figure 11 and Table 9.
Figure 9.
Air velocity contours of the bottom surface of the air channel with varying heights: 25 mm, 35 mm, 45 mm, 55 mm, 65 mm, and 75 mm.
Figure 10.
Temperature contours of outlet with varying heights: 25 mm, 35 mm, 45 mm, 55 mm, 65 mm, and 75 mm.
Figure 11.
Air velocity contours of outlet with varying heights: 25 mm, 35 mm, 45 mm, 55 mm, 65 mm, and 75 mm.
Table 9.
The results at the outlet in case A.
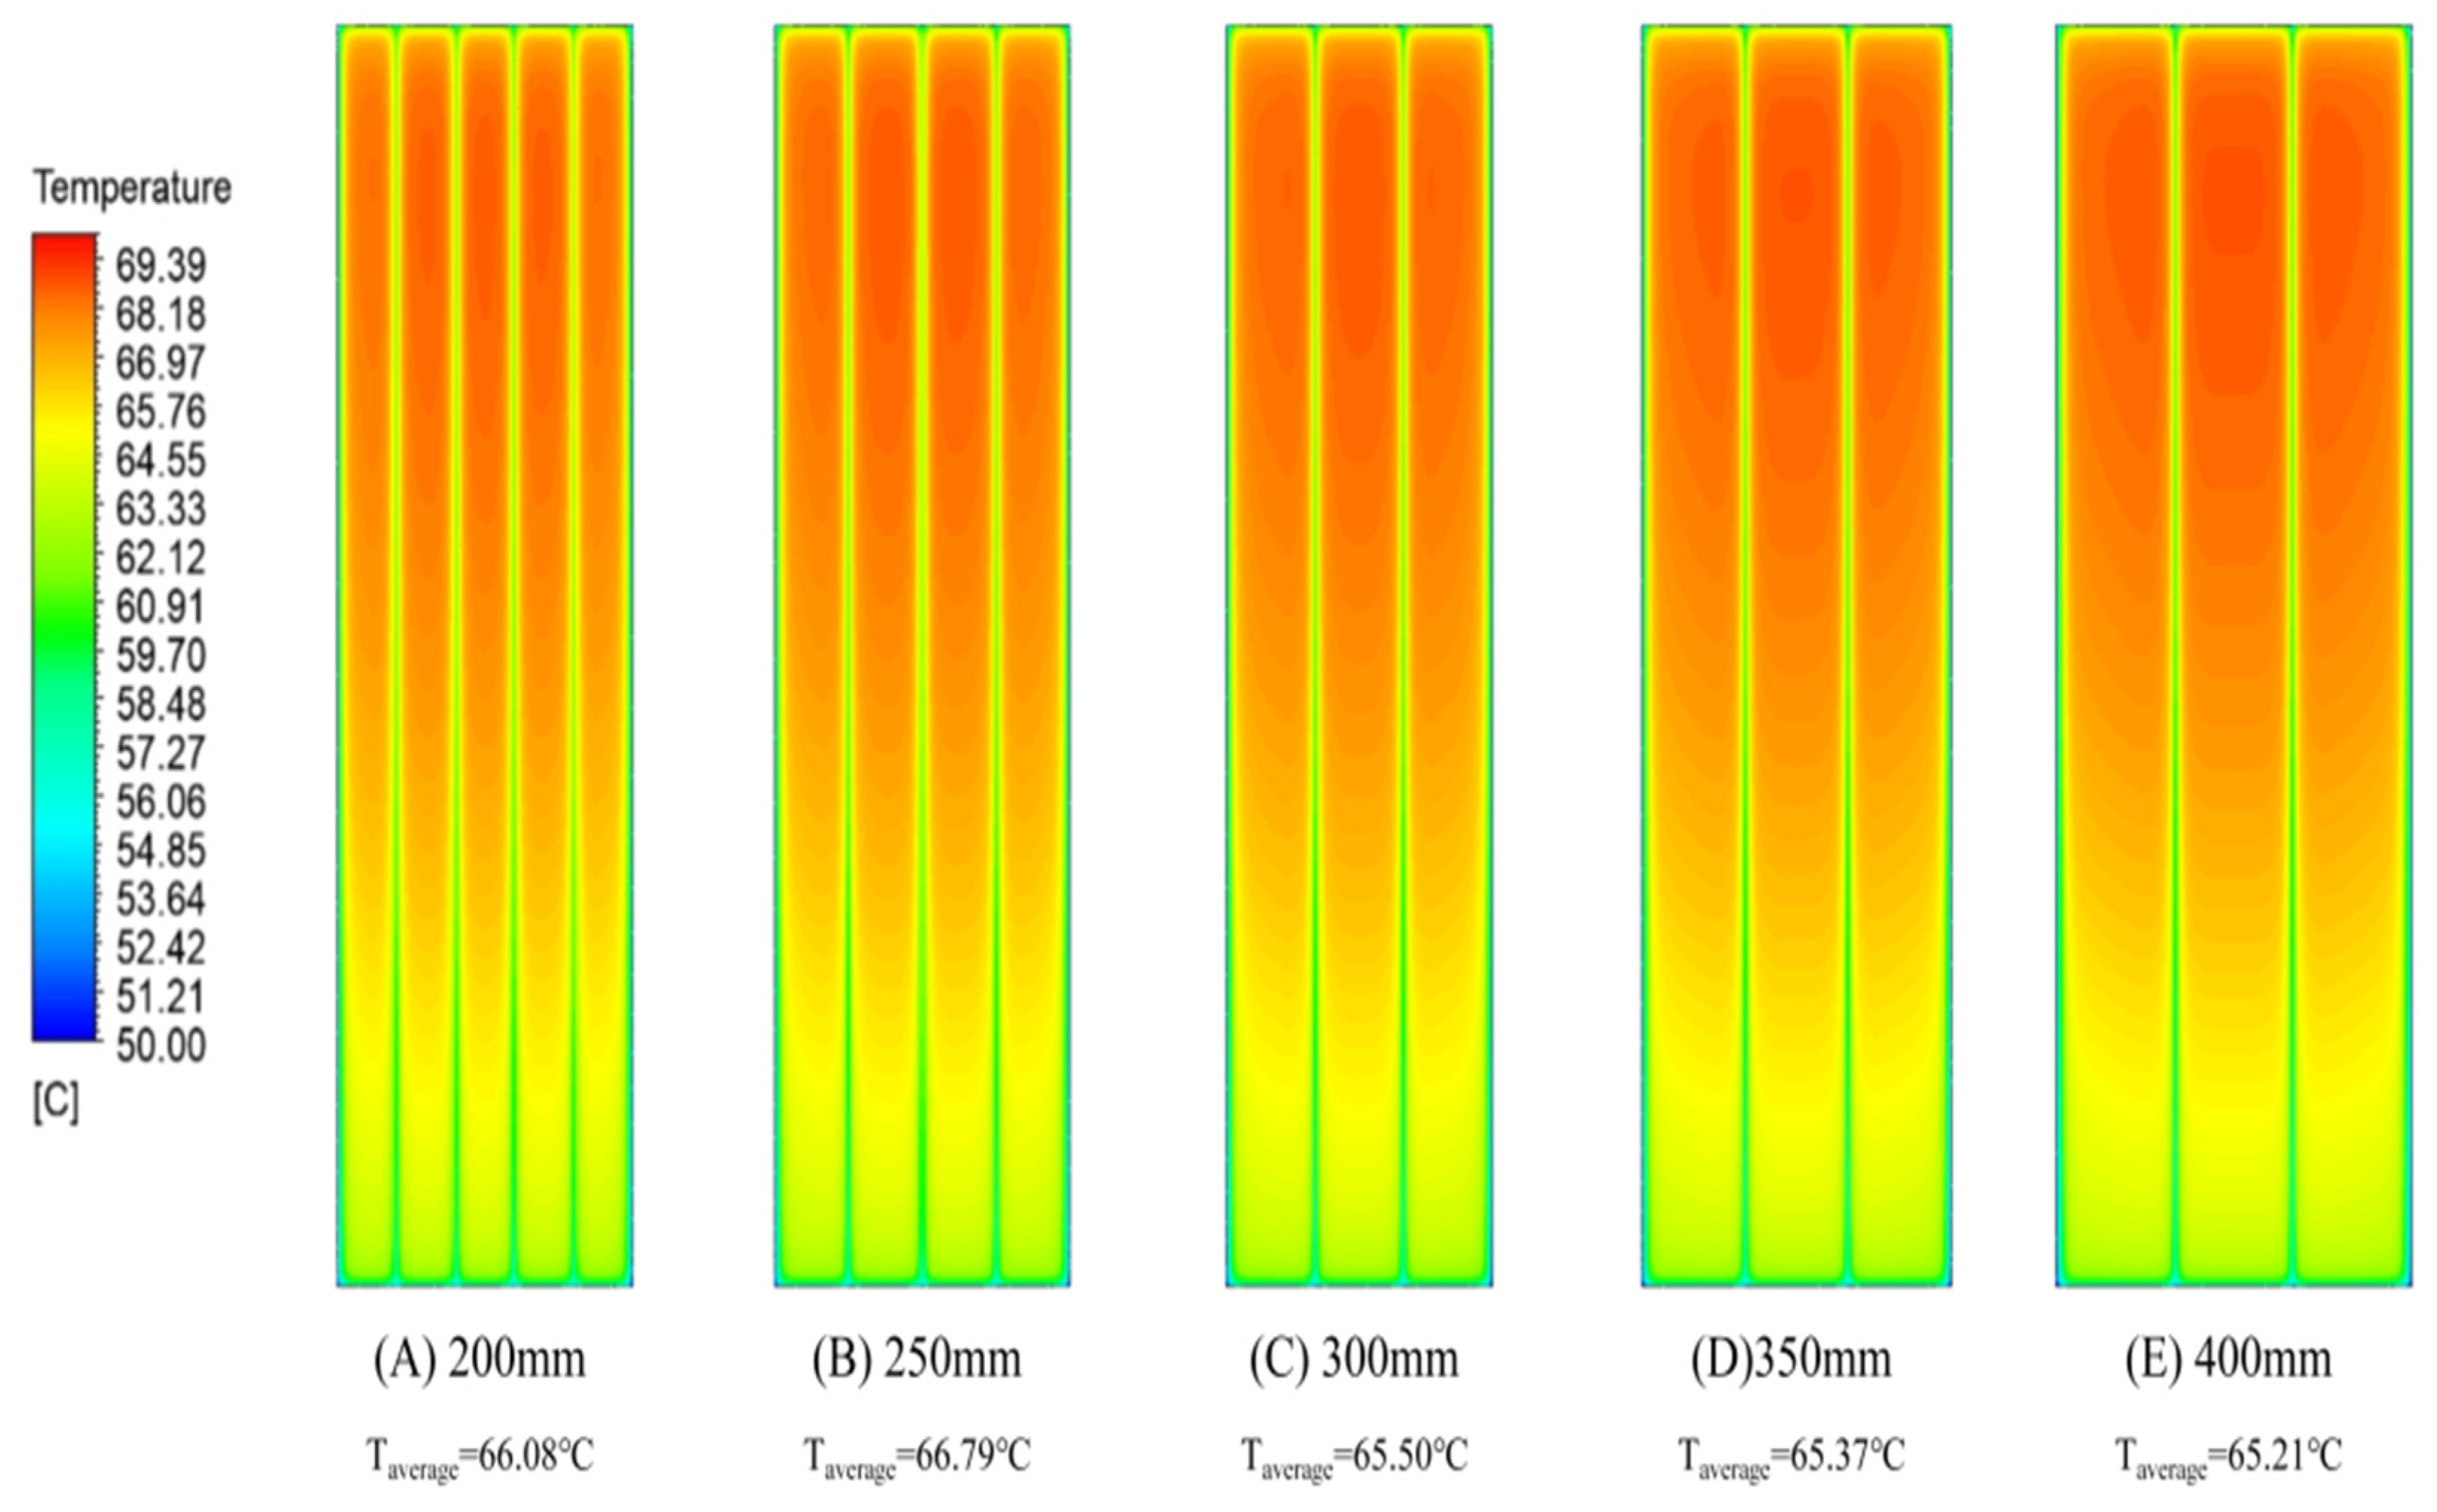
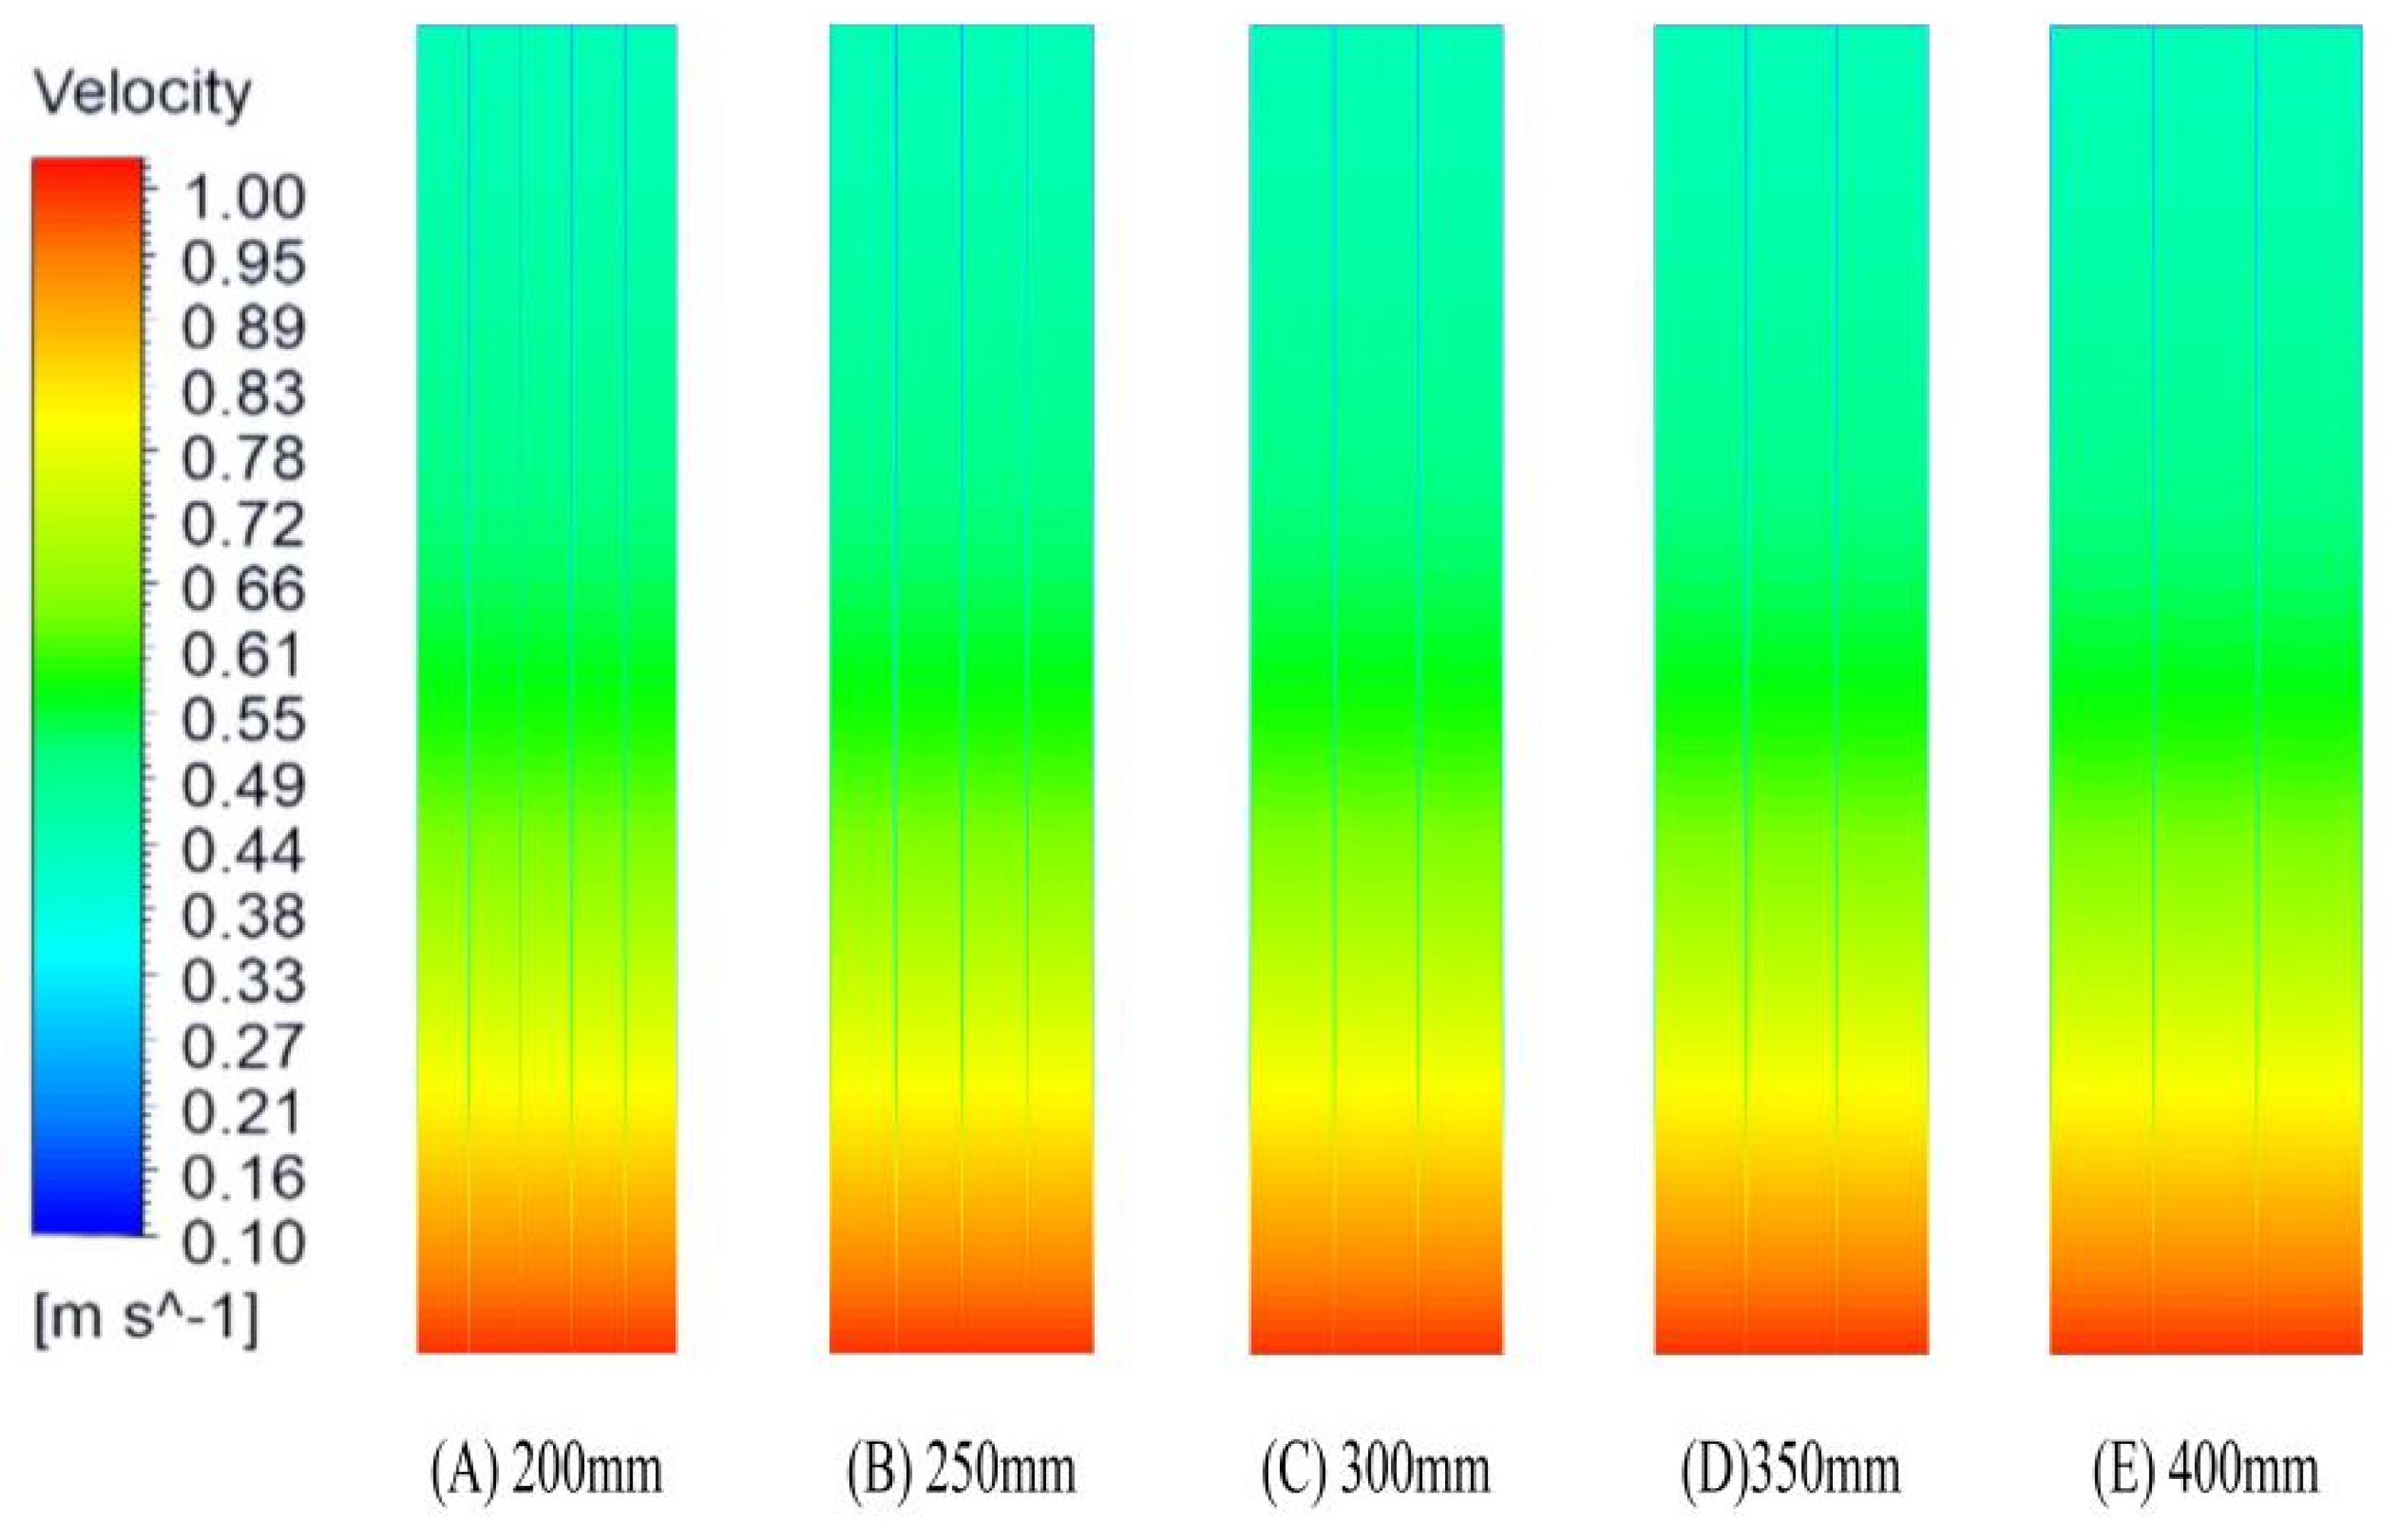
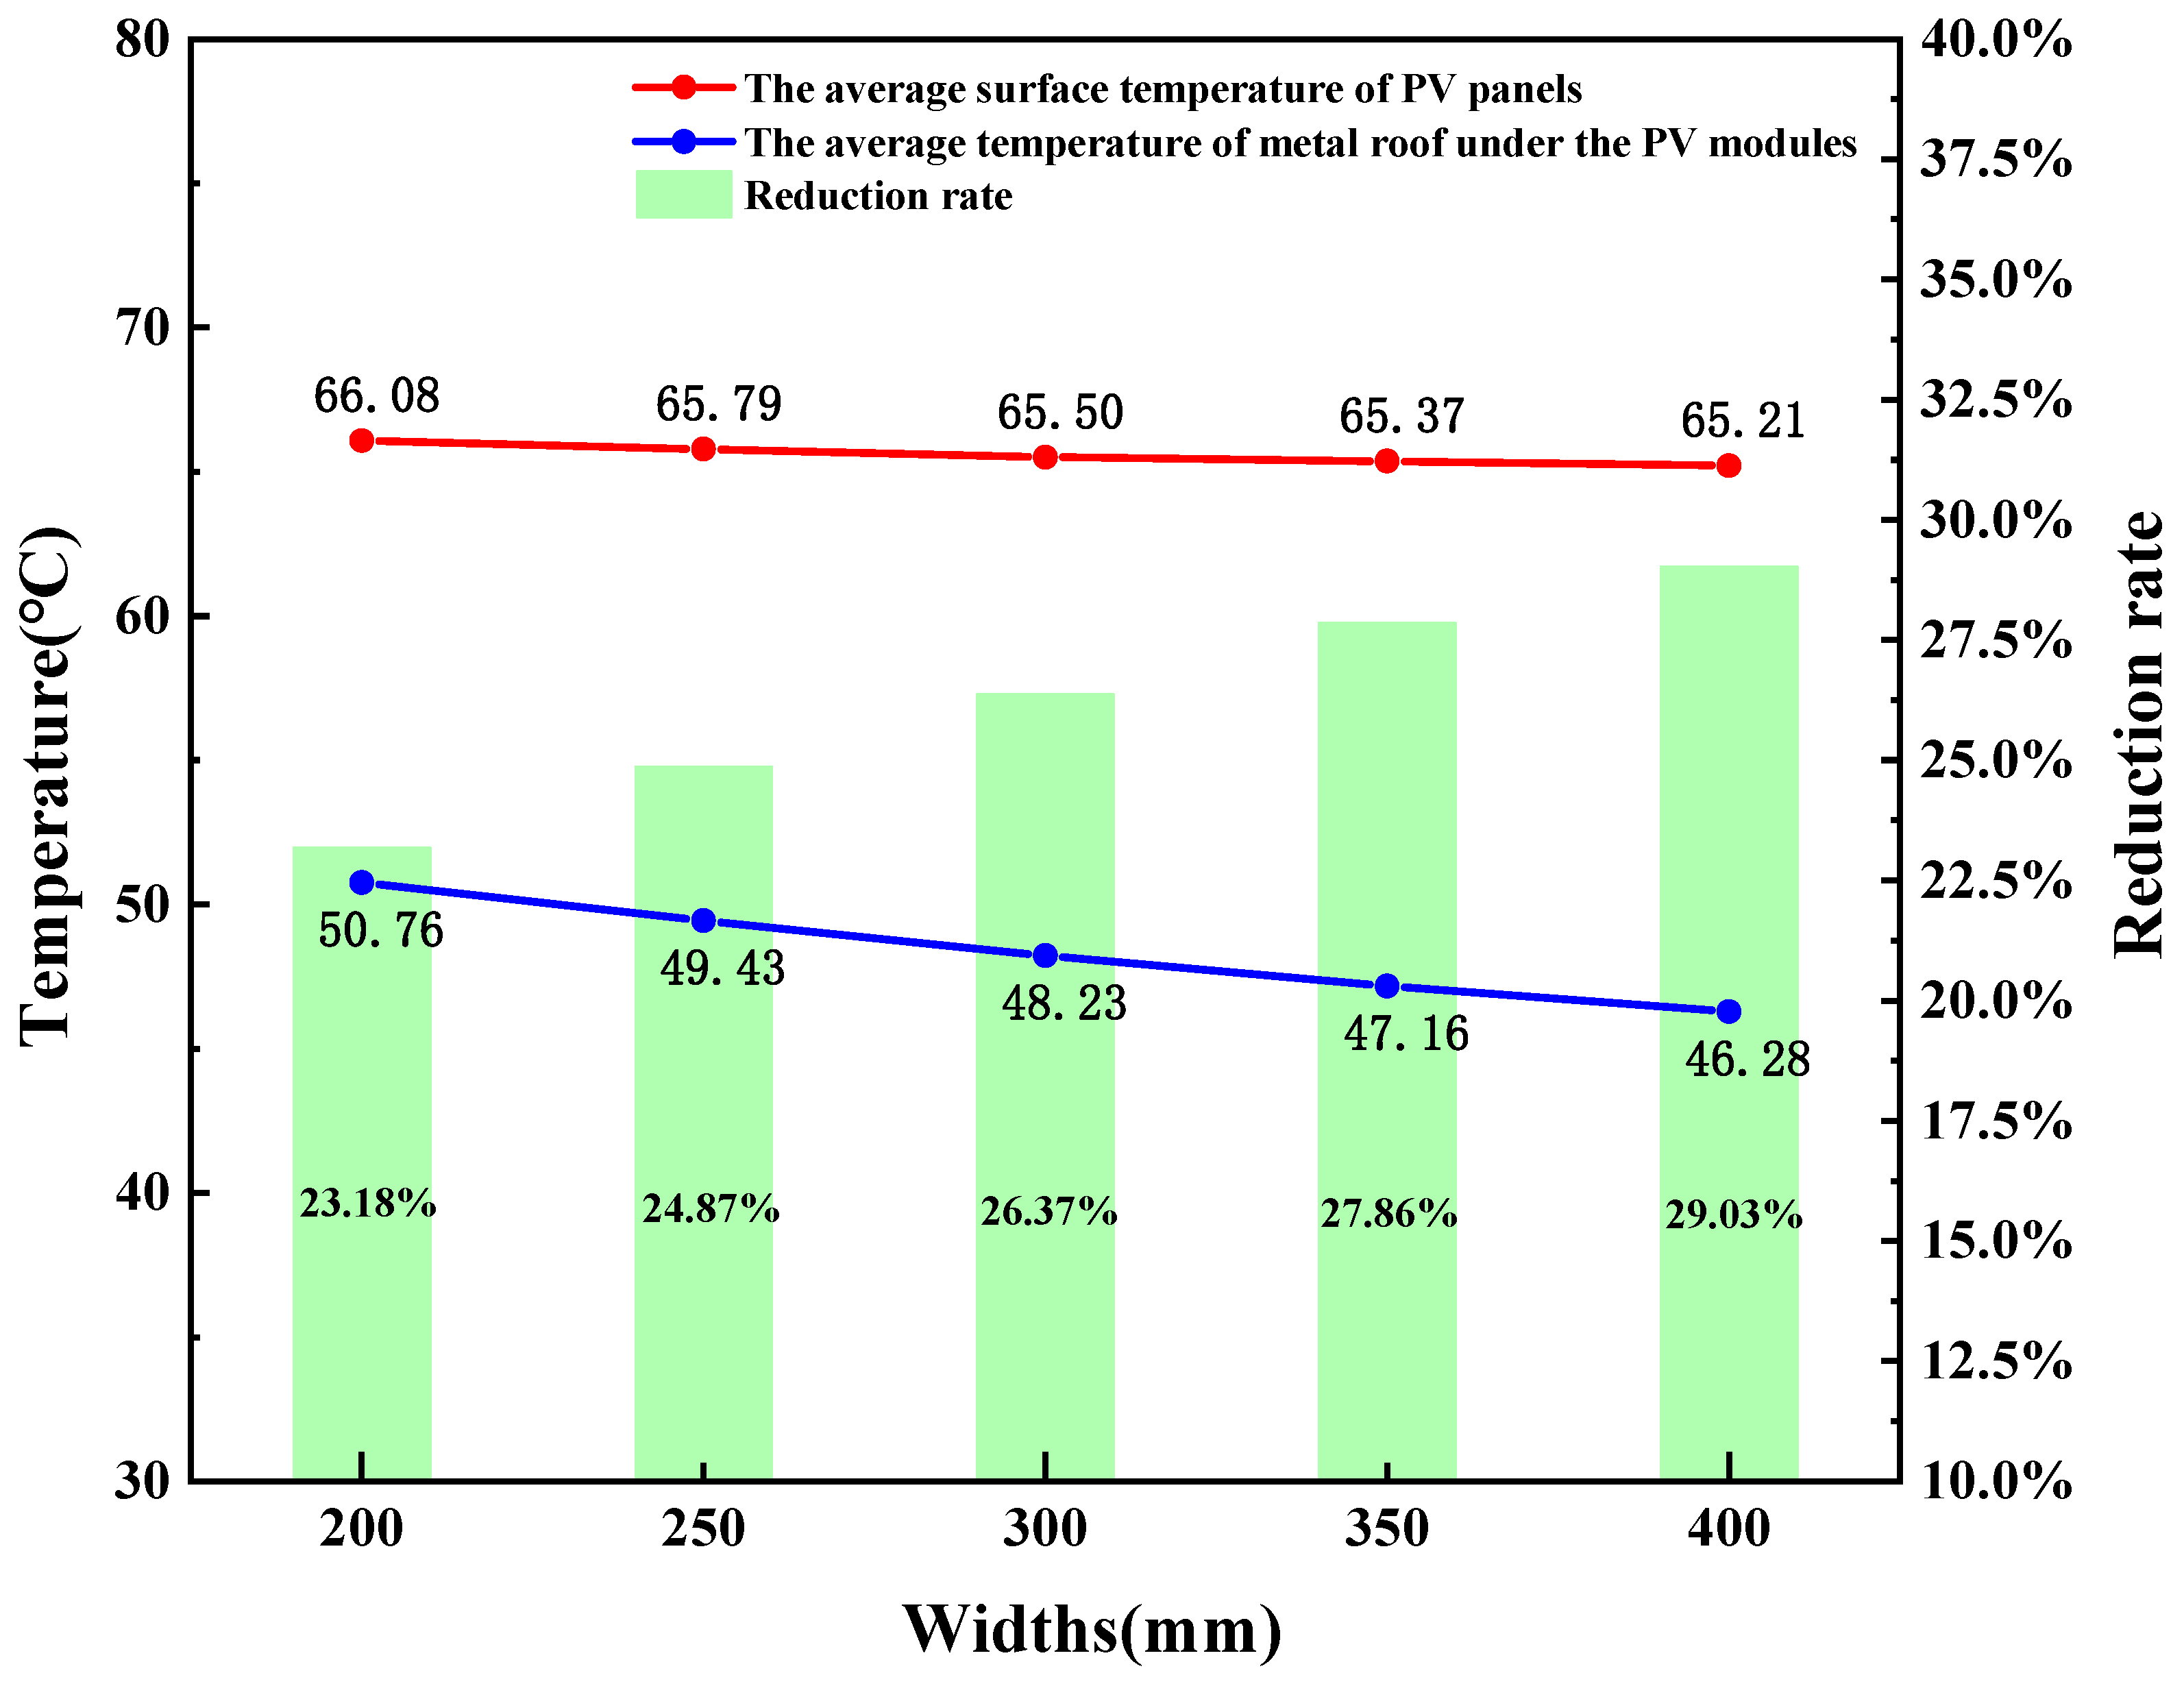
4.2.2. Case 2 Varying Air Channel Widths
Figure 12 presents the simulation results depicting temperature variations for models with different air channel widths. The temperature contours show maximum temperatures of 68.94 °C, 68.68 °C, 68.50 °C, 68.50 °C, and 68.27 °C for widths ranging from 200 mm to 400 mm in 50 mm increments. The outlet velocities exhibit minimal fluctuation, with average and maximum velocities recorded at 1.00 m/s and 1.27 m/s, respectively, as depicted in Figure 13. Detailed outlet temperatures and velocity results are provided in Figure 14 and Figure 15 and Table 10.
Figure 12.
Temperature contours of passively cooled PV panels with varying widths: 200 mm, 250 mm, 300 mm, 350 mm, and 400 mm.
Figure 13.
Air velocity contours of the bottom surface of the air channel with varying widths: 200 mm, 250 mm, 300 mm, 350 mm, and 400 mm.
Figure 14.
Temperature contours of outlet with varying widths: 200 mm, 250 mm, 300 mm, 350 mm, and 400 mm.
Figure 15.
Air velocity contours of outlet with varying widths: 200 mm, 250 mm, 300 mm, 350 mm, and 400 mm.
Table 10.
The results at the outlet in Case B.
5. Discussion
5.1. Cooling for Metal Roof
PV roofs represent an innovative structure that integrates PV modules with roofs using specialized fixing devices. The top layer of PV panels provides effective shading, aiding roof cooling.
In Case A, simulation results demonstrate that increasing the air channel height improves cooling efficiency. The roof’s maximum surface temperature decreases by 1.77 °C, with an average temperature reduction of 1.80 °C to 48.23 °C. Detailed temperature and reduction rate results are shown in Figure 16 and Figure 17.
Figure 16.
The simulated average surface temperatures of PV panels and roofs with varying heights are 25 mm, 35 mm, 45 mm, 55 mm, 65 mm, and 75 mm.
Figure 17.
The simulated average surface temperature of PV panels and roofs with varying widths is 200 mm, 250 mm, 300 mm, 350 mm, and 400 mm.
In Case B, varying the air channel width horizontally yields greater cooling effects than vertical variations in Case A. The maximum reduction rate reaches 29.03% with an air channel geometry of 75 mm × 400 mm, offering the largest cross-sectional cooling area. However, optimizing height may be a more feasible and effective solution for existing roof structures where adjusting air gap widths is impractical. This adjustment can be achieved through on-site installation and elevated support structures without requiring special custom processing.
5.2. Cooling Performance Comparison for Varying Physical Geometry
The impact of varying air channel dimensions on cooling efficiency reveals a gradual increase in heat dissipation as the air gap’s height (from 25 mm to 75 mm) and width (from 200 mm to 400 mm) increase. However, efficiency begins to decline when the height exceeds 65 mm. Among all 11 air channel configurations tested, the setup with dimensions of 75 mm × 400 mm achieves the lowest PV panel temperature at 65.21 °C, indicating the most effective cooling method with the highest temperature reduction. Compared to the smallest cooling space of 25 mm × 300 mm, this configuration shows an improvement of 1.76 °C in cooling performance. Further analysis of temperature contours depicted in Figure 8 and Figure 12 confirms a lower and more uniform temperature distribution across PV panels with larger cooling spaces.
The simulated results indicate that increasing the width of the air gap enhances heat dissipation to the surroundings, but its effectiveness is limited. In Case B, the temperature reduction trend is only 0.87 °C, whereas Case A shows a temperature decrease of 1.47 °C. All models were subjected to identical boundary conditions of inlet temperature at 40 °C and inlet velocity of 1 m/s, highlighting differences in outlet capabilities to remove heat. Due to the constraints of the cooling space, the smallest gap exhibits the highest temperature and lowest air velocity at the outlet. As the height increases, more air enters the channel, effectively dissipating heat. The airflow velocity increases by 0.47 m/s, and the average air temperature drops by 9.1 °C. In Case B, temperature and velocity at the outlet change only slightly with increasing widths, showing minimal differences in maximum air temperature and airflow velocity, while the average temperature and velocity remain nearly unchanged, as depicted in Figure 14, Figure 15 and Figure 18. These trends underscore the significant role of height in cooling performance.
Figure 18.
The simulated maximum and average surface temperature of PV panels, velocity, and average temperature at the outlet with all geometry.
Figure 10, Figure 11, Figure 14 and Figure 15 display the air velocity and temperature contours at the outlets, illustrating both their magnitude and uniformity across the numerical values. The maximum temperatures are observed near the PV panels and the edges of the air channel. This phenomenon is particularly evident in Case A; however, similar contours appear when the heights exceed 55 mm, as seen in the results for 65 mm and 75 mm heights. In Case B, the widths noticeably impact the uniformity, with a significant decrease observed. Figure 14 and Figure 15 indicate that, apart from minor differences at extreme values, the velocity and temperature distribution remains consistent in Case B. This further confirms that height is more significant in heat dissipation efficiency.
5.3. Electrical Performance Enhancement
Based on the analysis above, larger air channels contribute to improved cooling performance. The geometry of the air channel plays a crucial role in enhancing dissipation capabilities and decreasing trends in both average and surface temperatures.
Due to experimental limitations, temperature coefficients will be employed to study the theoretical efficiency differences in power generation among different models. The most effective heat dissipation structure shows a 2.63% temperature reduction compared to the least effective structure, potentially enhancing the photovoltaic module’s power generation efficiency by up to 0.70%. Detailed theoretical efficiency results are provided in Table 11.
Table 11.
Theoretical efficiency and power of PV roofs with Case A and Case B.
6. Conclusions
Efforts to promote and enhance BIPV systems necessitate mitigating operational temperatures close to nominal levels, which is particularly challenging in the summer or hot climates. This study presents experimental and numerical analyses to elucidate the impact of air channels beneath PV panels on cooling PV roofs. The conclusions drawn from this study are as follows:
- Non-uniform surface temperatures on PV panels were observed, with the center points exhibiting temperatures notably higher than the surroundings, reaching a maximum temperature difference of 16.50 °C, attributed to heat transfer;
- PV panels effectively shade and cool the metal roof, resulting in an average surface temperature reduction of 12.90 °C, with peak reductions up to 29.25 °C around noon under intense sunlight;
- Increasing air channel heights correlated with reduced PV panel temperatures, achieving a minimum mean temperature of 65.50 °C and a temperature reduction of 0.41 °C compared to a height of 25 mm. A height of 75 mm was identified as optimal for air channels in PV roofs;
- Similarly, widening the air channels reduced PV panel temperatures, with a width of 400 mm yielding the lowest mean temperature of 65.21 °C and a maximum temperature drop of 0.58 °C compared to a configuration of 75 mm × 250 mm;
- Parametric studies revealed that varying air channel heights had a more pronounced cooling effect compared to width variations. Case A, with varying heights, showed a temperature reduction of 1.47 °C and a reduction rate of 2.11%, whereas Case B, with varying widths, resulted in reductions of 0.87 °C and 1.32%, respectively. This demonstrates better temperature uniformity on PV panels with larger cooling spaces;
- Analysis of the outlet demonstrated significant temperature reduction and air velocity limitations without mechanical ventilation. For instance, the outlet of the air channel with dimensions of 25 mm × 300 mm exhibited a maximum temperature of 55.73 °C and the lowest air velocity of 0.53 m/s. Increasing heights improved heat dissipation, with heights of 75 mm maintaining mean temperatures and velocities at the outlet near 44.20 °C and 1 m/s, similar to inlet velocity.
Previous studies primarily focused on the impact of channel dimensions on the cooling performance of PV panels. In this study, while optimizing the channel dimensions, attention was also given to the temperature variation of the building roof beneath the PV panels. The data from two test days were used in the mathematical model simulations, ensuring the accuracy of the results. A comprehensive analysis of PV panels, air channels, and the roof has been provided, offering valuable insights that could guide the development of more efficient cooling solutions for PV or BIPV roofs in future applications.
Future research will focus on exploring the properties of various materials, as these will directly influence the precision of roof manufacturing and the complexity of the design. Additionally, the BIPV roof will be considered, aligning with the growing trend of integrating energy-efficient technologies into building designs. BIPV roofs positively impact the indoor environment by reducing energy consumption and improving thermal comfort while also enhancing both the aesthetic and functional performance of PV roofs.
Author Contributions
Y.X.: Conceptualization, Methodology, Validation, Supervision; Y.H.: Investigation, Visualization, Writing—original draft. Y.Z.: Formal analysis, Writing—review and editing, Resource. All authors have read and agreed to the published version of the manuscript.
Funding
This research received no external funding.
Data Availability Statement
Data will be made available on request.
Conflicts of Interest
The authors declare that they have no known competing financial interests or personal relationships that could have appeared to influence the work reported in this paper.
Abbreviations
| Abbreviations | |
| BAPV | Building Attached Photovoltaic |
| BIPV | Building-Integrated Photovoltaic |
| BIPV/T | Building-Integrated Photovoltaic/thermal |
| CFD | Computational Fluid Dynamics |
| GHG | Greenhouse Gas |
| MAE | Mean Absolute Error |
| PCM | Phase Change Material |
| PV | Photovoltaic |
| PV/T | Photovoltaic/Thermal |
| RMSE | Root Mean Square Error |
| STC | Standard Test Conditions |
| Symbols | |
| velocity vector, m/s | |
| specific mass, kg/m3 | |
| kinematic viscosity of fluid, m2/s | |
| force per unit mass, N/kg | |
| temperature, K | |
| thermal conductivity, W/m2·k | |
| viscous dissipation | |
| actual measured value | |
| predicted value. |
References
- Wheeler, V.M.; Kim, J.; Daligault, T.; Rosales, B.A.; Engtrakul, C.; Tenent, R.C.; Wheeler, L.M. Photovoltaic windows cut energy use and CO2 emissions by 40% in highly glazed buildings. One Earth 2022, 5, 1271–1285. [Google Scholar] [CrossRef]
- Van Vuuren, D.P.; Stehfest, E.; Gernaat, D.E.H.J.; Maarten, V.D.B.; Bijl, D.L.; De Boer, H.S.; Daioglou, V.; Doelman, J.C.; Edelenbosch, O.Y.; Harmsen, M.; et al. Alternative pathways to the 1.5 °C target reduce the need for negative emission technologies. Nat. Clim. Change 2018, 8, 391–397. [Google Scholar] [CrossRef]
- Ma, M.; Ma, X.; Cai, W.; Cai, W.G. Low carbon roadmap of residential building sector in China: Historical mitigation and prospective peak. Appl. Energy 2020, 273, 115247. [Google Scholar] [CrossRef]
- Shahsavari, A.; Akbari, M. Potential of solar energy in developing countries for reducing energy-related emissions. Renew. Sustain. Energy Rev. 2018, 90, 275–291. [Google Scholar] [CrossRef]
- Kaizuka, G.M.I. Trends in Photovoltaic Applications 2020; IEA Photovoltaic Power Systems Programme: Rome, Italy, 2020. [Google Scholar]
- Rajoria, C.; Kumar, R.; Sharma, A.; Singh, D.; Suhag, S. Development of flat-plate building integrated photovoltaic/thermal (BIPV/T) system: A review. Mater. Today Proc. 2021, 46, 5342–5352. [Google Scholar] [CrossRef]
- Mangherini, G.; Diolaiti, V.; Bernardoni, P.; Andreoli, A.; Vincenzi, D. Review of Façade Photovoltaic Solutions for Less Energy-Hungry Buildings. Energies 2023, 16, 6901. [Google Scholar] [CrossRef]
- Azami, A.; Sevinc, H. The energy performance of building integrated photovoltaics (BIPV) by determination of optimal building envelope. Build. Environ. 2021, 199, 107856. [Google Scholar] [CrossRef]
- Khencha, K.; Biara, R.W.; Belmili, H. Techno-economic study of BIPV in typical Sahara region in Algeria. J. Econ. Dev. Environ. People 2020, 9, 27. [Google Scholar] [CrossRef]
- Devetaković, M.; Djordjević, D.; Radojević, M.; Krstić-Furundžić, A.; Burduhos, B.-G.; Martinopoulos, G.; Neagoe, M.; Lobaccaro, G. Photovoltaics on landmark buildings with distinctive geometries. Appl. Sci. 2020, 10, 6696. [Google Scholar] [CrossRef]
- Villa, S.; Out, D.; Guillevin, N.; Hurtado Ellmann, M.; Ribberink, M.; Valckenborg, R. Outdoor Performance Analysis of Semitransparent Photovoltaic Windows with Bifacial Cells and Integrated Blinds. Sol. RRL 2024, 8, 2400515. [Google Scholar] [CrossRef]
- Masson, G.; L’Epine, M.d.; Kaizuka, I. Trends in Photovoltaic Applications 2023; IEA Photovoltaic Power Systems Programme: Rome, Italy, 2023. [Google Scholar]
- Kumar, P.; Shukla, A.K.; Sudhakar, K.; Mamat, R. Experimental exergy analysis of water-cooled PV module. Int. J. Exergy 2017, 23, 197–209. [Google Scholar] [CrossRef]
- Paliwal, M.K.; Jakhar, S.; Sharma, V. A comparative study on photovoltaic/thermal systems with various cooling methods. Mater. Today Proc. 2022, in press. [CrossRef]
- Li, G.; Pei, G.; Yang, M.; Ji, J. Experiment investigation on electrical and thermal performances of a semitransparent photovoltaic/thermal system with water cooling. Int. J. Photoenergy 2014, 2014, 360235. [Google Scholar] [CrossRef]
- Sun, C.; Zou, Y.; Qin, C.; Zhang, B.; Wu, X. Temperature effect of photovoltaic cells: A review. Adv. Compos. Hybrid Mater. 2022, 5, 2675–2699. [Google Scholar] [CrossRef]
- Koohestani, S.S.; Nižetić, S.; Santamouris, M. Comparative review and evaluation of state-of-the-art photovoltaic cooling technologies. J. Clean. Prod. 2023, 406, 136953. [Google Scholar] [CrossRef]
- Shukla, A.; Kant, K.; Sharma, A.; Biwole, P.H. Cooling methodologies of photovoltaic module for enhancing electrical efficiency: A review. Sol. Energy Mater. Sol. Cells 2017, 160, 275–286. [Google Scholar] [CrossRef]
- Sharaf, M.; Yousef, M.S.; Huzayyin, A.S. Review of cooling techniques used to enhance the efficiency of photovoltaic power systems. Environ. Sci. Pollut. Res. 2022, 29, 26131–26159. [Google Scholar] [CrossRef] [PubMed]
- Nižetić, S.; Papadopoulos, A.; Giama, E. Comprehensive analysis and general economic-environmental evaluation of cooling techniques for photovoltaic panels, Part I: Passive cooling techniques. Energy Convers. Manag. 2017, 149, 334–354. [Google Scholar] [CrossRef]
- Han, J.; Lu, L.; Yang, H.; Cheng, Y. Thermal regulation of PV façade integrated with thin-film solar cells through a naturally ventilated open air channel. Energy Procedia 2019, 158, 1208–1214. [Google Scholar] [CrossRef]
- Kaiser, A.; Zamora, B.; Mazón, R.; García, J.; Vera, F. Experimental study of cooling BIPV modules by forced convection in the air channel. Appl. Energy 2014, 135, 88–97. [Google Scholar]
- Tiwari, A.K.; Kumar, R.; Pande, R.R.; Sharma, S.K.; Kalamkar, V.R. Effect of forced convection cooling on performance of solar photovoltaic module in rooftop applications. In Advances in Energy Research, Volume 1: Selected Papers from ICAER 2017; Springer: Singapore, 2020; pp. 159–172. [Google Scholar]
- Glick, A.; Ali, N.; Bossuyt, J.; Calaf, M.; Cal, R.B. Utility-scale solar PV performance enhancements through system-level modifications. Sci. Rep. 2020, 10, 10505. [Google Scholar] [CrossRef]
- El Mays, A.; Ammar, R.; Hawa, M.; Abou Akroush, M.; Hachem, F.; Khaled, M.; Ramadan, M. Improving photovoltaic panel using finned plate of aluminum. Energy Procedia 2017, 119, 812–817. [Google Scholar] [CrossRef]
- Khan, S.; Waqas, A.; Ahmad, N.; Mahmood, M.; Shahzad, N.; Sajid, M.B. Thermal management of solar PV module by using hollow rectangular aluminum fins. J. Renew. Sustain. Energy 2020, 12, 063501. [Google Scholar] [CrossRef]
- Hamdan, M.; Abdelhafez, E.; Al Aboushi, A.; Othman, A.; Al-Saleh, S.; Ajib, S. Enhancing PV modules performance using L-shaped aluminum fins. Int. Rev. Mech. Eng. (IREME) 2023, 17, 48–56. [Google Scholar] [CrossRef]
- Hamdan, M.; Abdelhafez, E.; Musa, A.; Ajib, S. Estimation of Photovoltaic Module Performance with L-Shaped Aluminum Fins Using Weather Data. J. Ecol. Eng. 2024, 25, 336–344. [Google Scholar] [CrossRef] [PubMed]
- Valeh-e-Sheyda, P.; Rahimi, M.; Parsamoghadam, A.; Masahi, M.M. Using a wind-driven ventilator to enhance a photovoltaic cell power generation. Energy Build. 2014, 73, 115–119. [Google Scholar] [CrossRef]
- Ahmadi Moghaddam, H.; Tkachenko, S.; Yeoh, G.H.; Timchenko, V. A newly designed BIPV system with enhanced passive cooling and ventilation. In Building Simulation; Tsinghua University Press: Beijing, China, 2023; pp. 2093–2107. [Google Scholar]
- Abdallah, R.; Haddad, T.; Zayed, M.; Juaidi, A.; Salameh, T. An evaluation of the use of air cooling to enhance photovoltaic performance. Therm. Sci. Eng. Prog. 2024, 47, 102341. [Google Scholar] [CrossRef]
- Jia, B.; Li, X.; Liu, F.; Han, T. Optimization analysis of flow path arrangement in snake shaped flow path solar air collector. Renew. Energy Resour. 2019, 37, 34–39. [Google Scholar]
- Hu, W.; Li, X.; Wang, J.; Tian, Z.; Zhou, B.; Wu, J.; Li, R.; Li, W.; Ma, N.; Kang, J. Experimental research on the convective heat transfer coefficient of photovoltaic panel. Renew. Energy 2022, 185, 820–826. [Google Scholar] [CrossRef]
- Mankani, K.; Chaudhry, H.N.; Calautit, J.K. Optimization of an air-cooled heat sink for cooling of a solar photovoltaic panel: A computational study. Energy Build. 2022, 270, 112274. [Google Scholar] [CrossRef]
- Shah, A.A.; Ahmed, K.; Han, X.; Saleem, A. A novel prediction error-based power forecasting scheme for real pv system using pvusa model: A grey box-based neural network approach. IEEE Access 2021, 9, 87196–87206. [Google Scholar] [CrossRef]
- Keddouda, A.; Ihaddadene, R.; Boukhari, A.; Atia, A.; Arıcı, M.; Lebbihiat, N.; Ihaddadene, N. Experimental and numerical modeling of photovoltaic modules temperature under varying ambient conditions. Energy Convers. Manag. 2024, 312, 118563. [Google Scholar] [CrossRef]
- Mangherini, G.; Bernardoni, P.; Baccega, E.; Andreoli, A.; Diolaiti, V.; Vincenzi, D. Design of a ventilated façade integrating a luminescent solar concentrator photovoltaic panel. Sustainability 2023, 15, 9146. [Google Scholar] [CrossRef]
- Ranganathan, S.K.; Elumalai, N.; Natarajan, P.P. Numerical model and experimental validation of the heat transfer in air cooled solar photovoltaic panel. Therm. Sci. 2016, 20, 1071–1081. [Google Scholar] [CrossRef]
Disclaimer/Publisher’s Note: The statements, opinions and data contained in all publications are solely those of the individual author(s) and contributor(s) and not of MDPI and/or the editor(s). MDPI and/or the editor(s) disclaim responsibility for any injury to people or property resulting from any ideas, methods, instructions or products referred to in the content. |
© 2025 by the authors. Licensee MDPI, Basel, Switzerland. This article is an open access article distributed under the terms and conditions of the Creative Commons Attribution (CC BY) license (https://creativecommons.org/licenses/by/4.0/).