1. Introduction
The United Nations (UN 2020) highlights an alarming acceleration in environmental degradation. Key contributing factors include critical levels of water stress, the overexploitation of natural resources, inefficient waste management systems, slow progress in integrating renewable energy, and consistently elevated greenhouse gas (GHG) emissions. These trends present profound risks to ecological stability and the future of humanity. As a result, tackling environmental challenges has become an urgent priority requiring comprehensive and targeted interventions [
1]. The responsibility for environmental protection is no longer limited to countries and their governments, but the role of business in this process is also essential. Governments do not have sufficient resources to provide all the necessary solutions to such problems. Therefore, the public and private sectors must work together. Companies must ensure a more sustainable world economy by taking initiatives to protect the environment. An appropriate policy and decision-making framework is needed to improve the actual situation and to enable the assessment of the results of environmental actions taken [
2,
3].
Several energy groups form the supply side of the energy market in Poland, the most important of which include the Enea SA Capital Group (Enea Group). In 2012, the Enea Group started the CSR reporting process and published, as the first in the industry, the “Enea Capital Group CSR Report for 2011”, adopting an annual reporting cycle. Since then, the group has continued to publish non-financial data on environmental protection, social responsibility, and corporate governance. In 2013, the Enea Group was the first and only in the industry to publish the “Enea Capital Group CSR Report for 2012” according to the latest international standard of the Global Reporting Initiative, G4 Sustainability Reporting Guidelines, at the “Core” application level. The reporting process was conducted in accordance with the four principles of the standard: consideration of stakeholder needs, materiality, sustainability context, and completeness [
1]. The energy market uses environmental resources, affects the natural environment, and incurs environmental costs that correlate with the calculation of energy prices and tariffs.
The detailed objective of this study is to adapt the accounting policy of business entities to environmental challenges including the company’s chart of accounts of the energy sector using the example of the Enea Group, and as a result, a proposal for changes in the structure of the ESG report is created. Economic, social, environmental, and governance issues influence accounting. In accordance with Article 3,
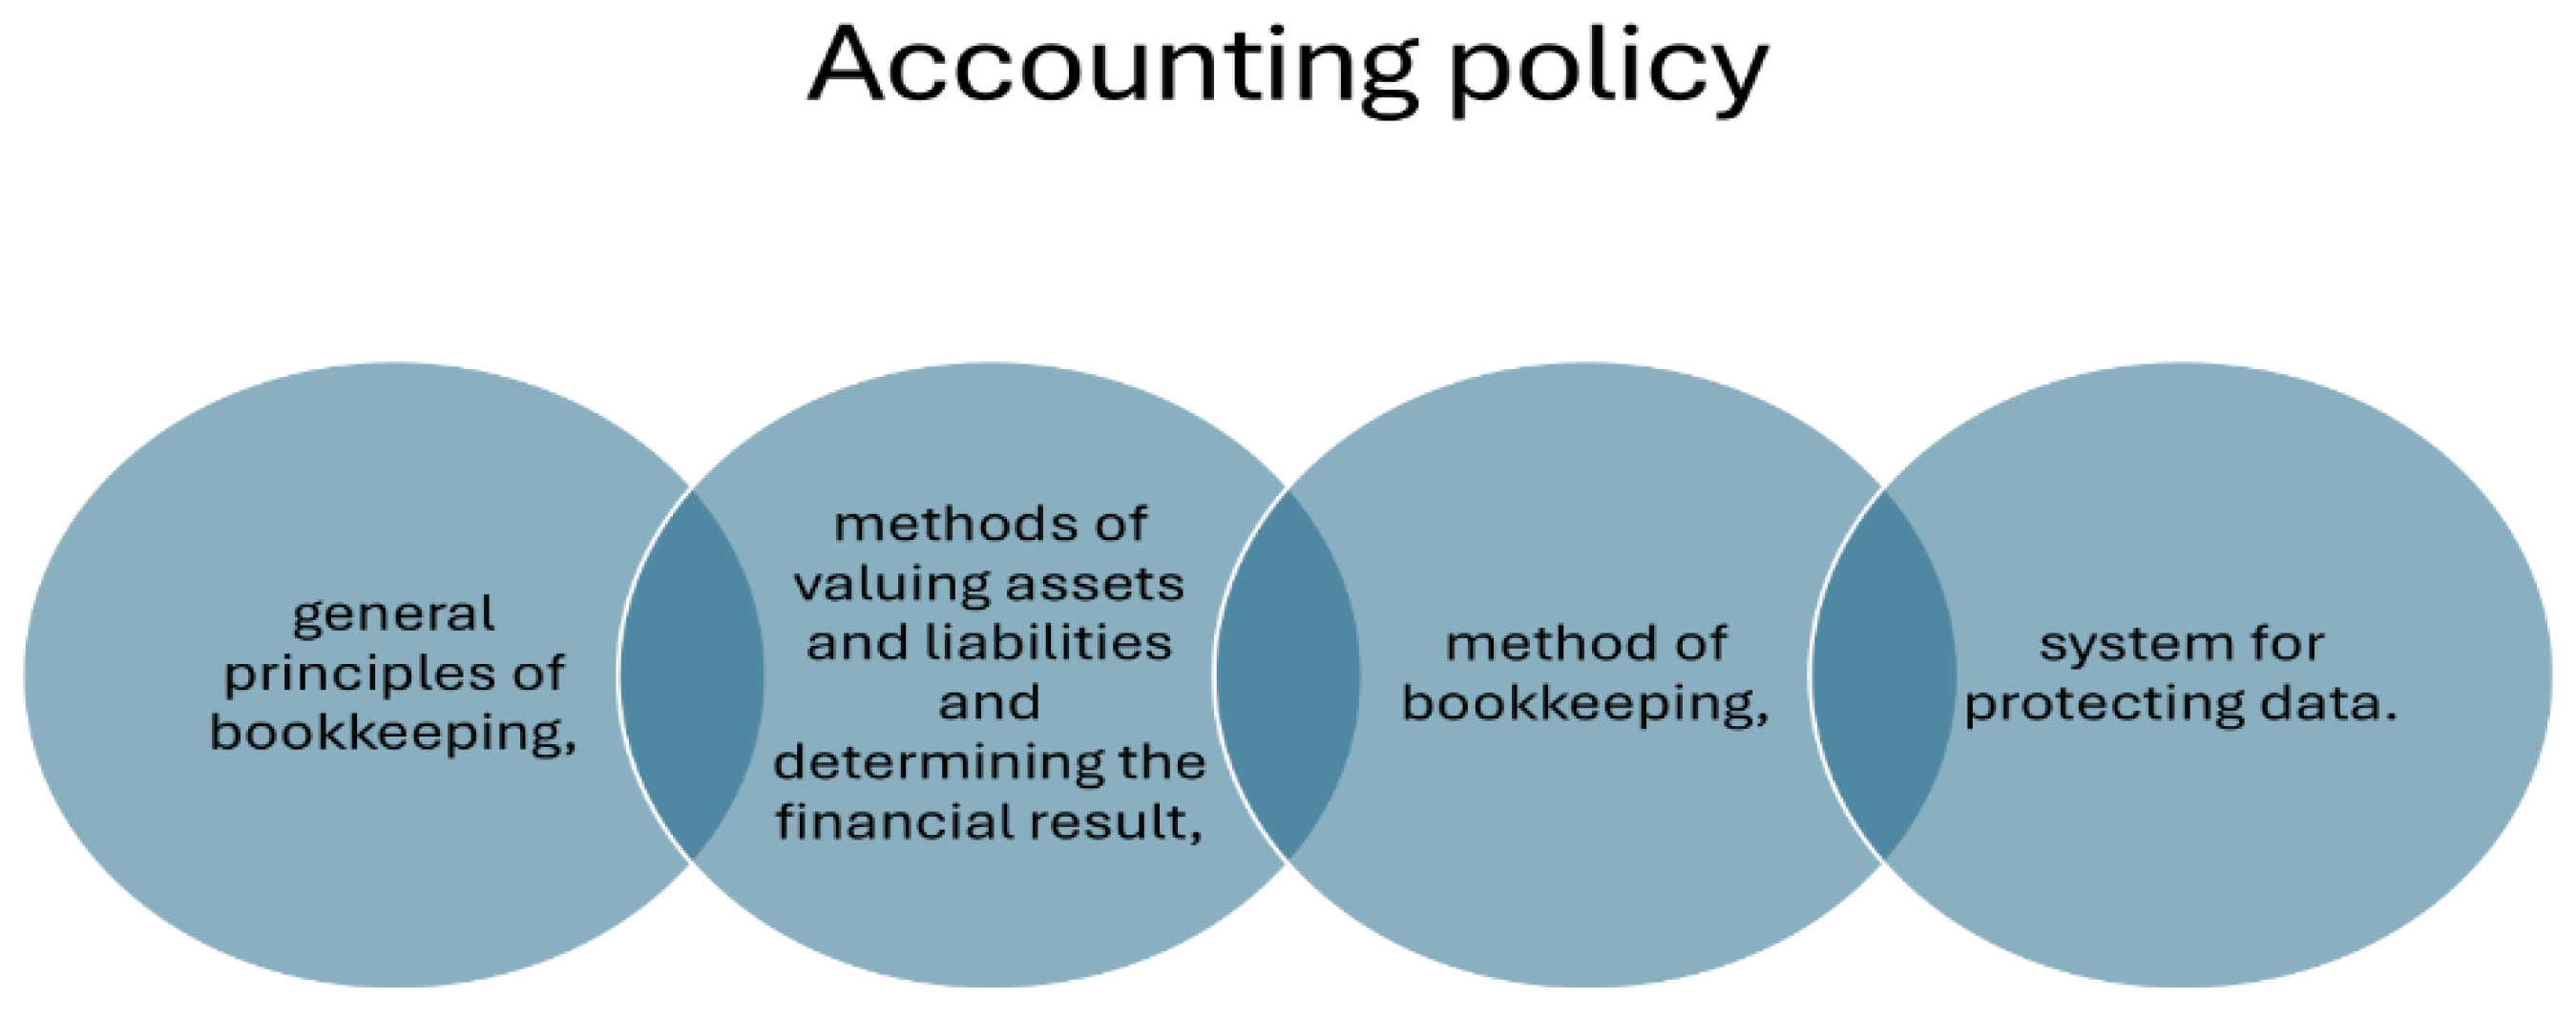
Section 1, Item 11 of the Accounting Act, the adopted accounting principles (policy) are understood as the solutions selected and applied by the entity, permitted by the Act, including those specified in IAS, ensuring the required quality of financial statements (this article uses “accounting policy”). Accounting policy according to International Financial Reporting Standards (IFRS) has a long, well-established, and widely accepted tradition. Climate change is a key issue facing the world today. The way of understanding accounting policy based on national guidelines—the Accounting Act and international guidelines—IAS and IFRS—is presented in
Figure 1.
The issues in
Figure 1 that are presented as elements of the accounting policy should be specified, and the following, as mentioned earlier, result from the national provisions of the Accounting Act and international solutions of IAS 1 and IAS 8 and IFRS:
- (1)
General principles of keeping accounting books.
- (2)
Methods of valuing assets and liabilities and determining the financial result.
- (3)
Method of keeping accounting books, including the following:
- (a)
Company’s chart of accounts;
- (b)
List of data sets constituting accounting books on computer data carriers;
- (c)
Description of the data processing system (IT system).
- (4)
Data protection system (including accounting entries, accounting books, and other documents constituting the basis for entries made in them).
Therefore, this study provides a better understanding of the challenges related to reporting on climate change and the environment, which will then allow us to transfer these considerations to an international context.
This article aims to analyse the disclosure of financial and non-financial information in an ESG report on the energy sector in Poland, using the example of the Enea Group, i.e., information on the following:
The Enea Group’s structure, its business model, and the values created.
The environmental impact of the energy sector.
Environmental costs in correlation with the calculation of electricity prices and rates (financial and non-financial aspects).
Environmental projects.
The specific aim is to adapt the accounting policy of business entities to environmental challenges by proposing changes to the energy sector’s chart of accounts, using the example of the Enea Group, which ultimately leads to changes in the structure of the integrated report and finally in the ESG report. This study is of a theoretical and conceptual nature. As a result of the triangulation of the scientific methods used in this article, it was found that neither the accounting policy nor the company’s chart of accounts has so far presented correct records of costs related to environmental protection, which implies the development and proposal of implementing changes in this area. The research sample is limited to three years and includes a case study of the Enea Group. The presented discussion allows us to fill the research gap in the scope of information on the activities undertaken by the Enea Group for the protection of the natural environment and the costs of environmental protection incurred. The added value is the original structure of the integrated report presented by the authors and ultimately the ESG report of the energy group and adapting the accounting policy to environmental challenges.
This study is theoretical and conceptual. In addition to the critical analysis of the literature, a case study, an analysis of phenomena and the synthesis of the results, and graphical data presentation techniques were used as the primary research methods. Data were taken from the Enea Group’s non-financial reports for 2019–2021, financial statements, ESG reports (from 2021), and the Enea Group’s websites. The research sample is limited to three years and includes a case study of the Enea Group.
The remainder of this paper is organised as follows. The materials and methods are introduced in
Section 2. The business model, value creation, and structure of the Enea Group are provided in
Section 3. The background considering the environmental impact of the energy sector according to ESG reports is presented in
Section 4. The results of a case study considering environmental costs and environmental projects are included in
Section 5. The results of this research are in
Section 6. The conclusions, limitations, and future research prospects are presented in
Section 7, which ends this paper.
2. Materials and Methods
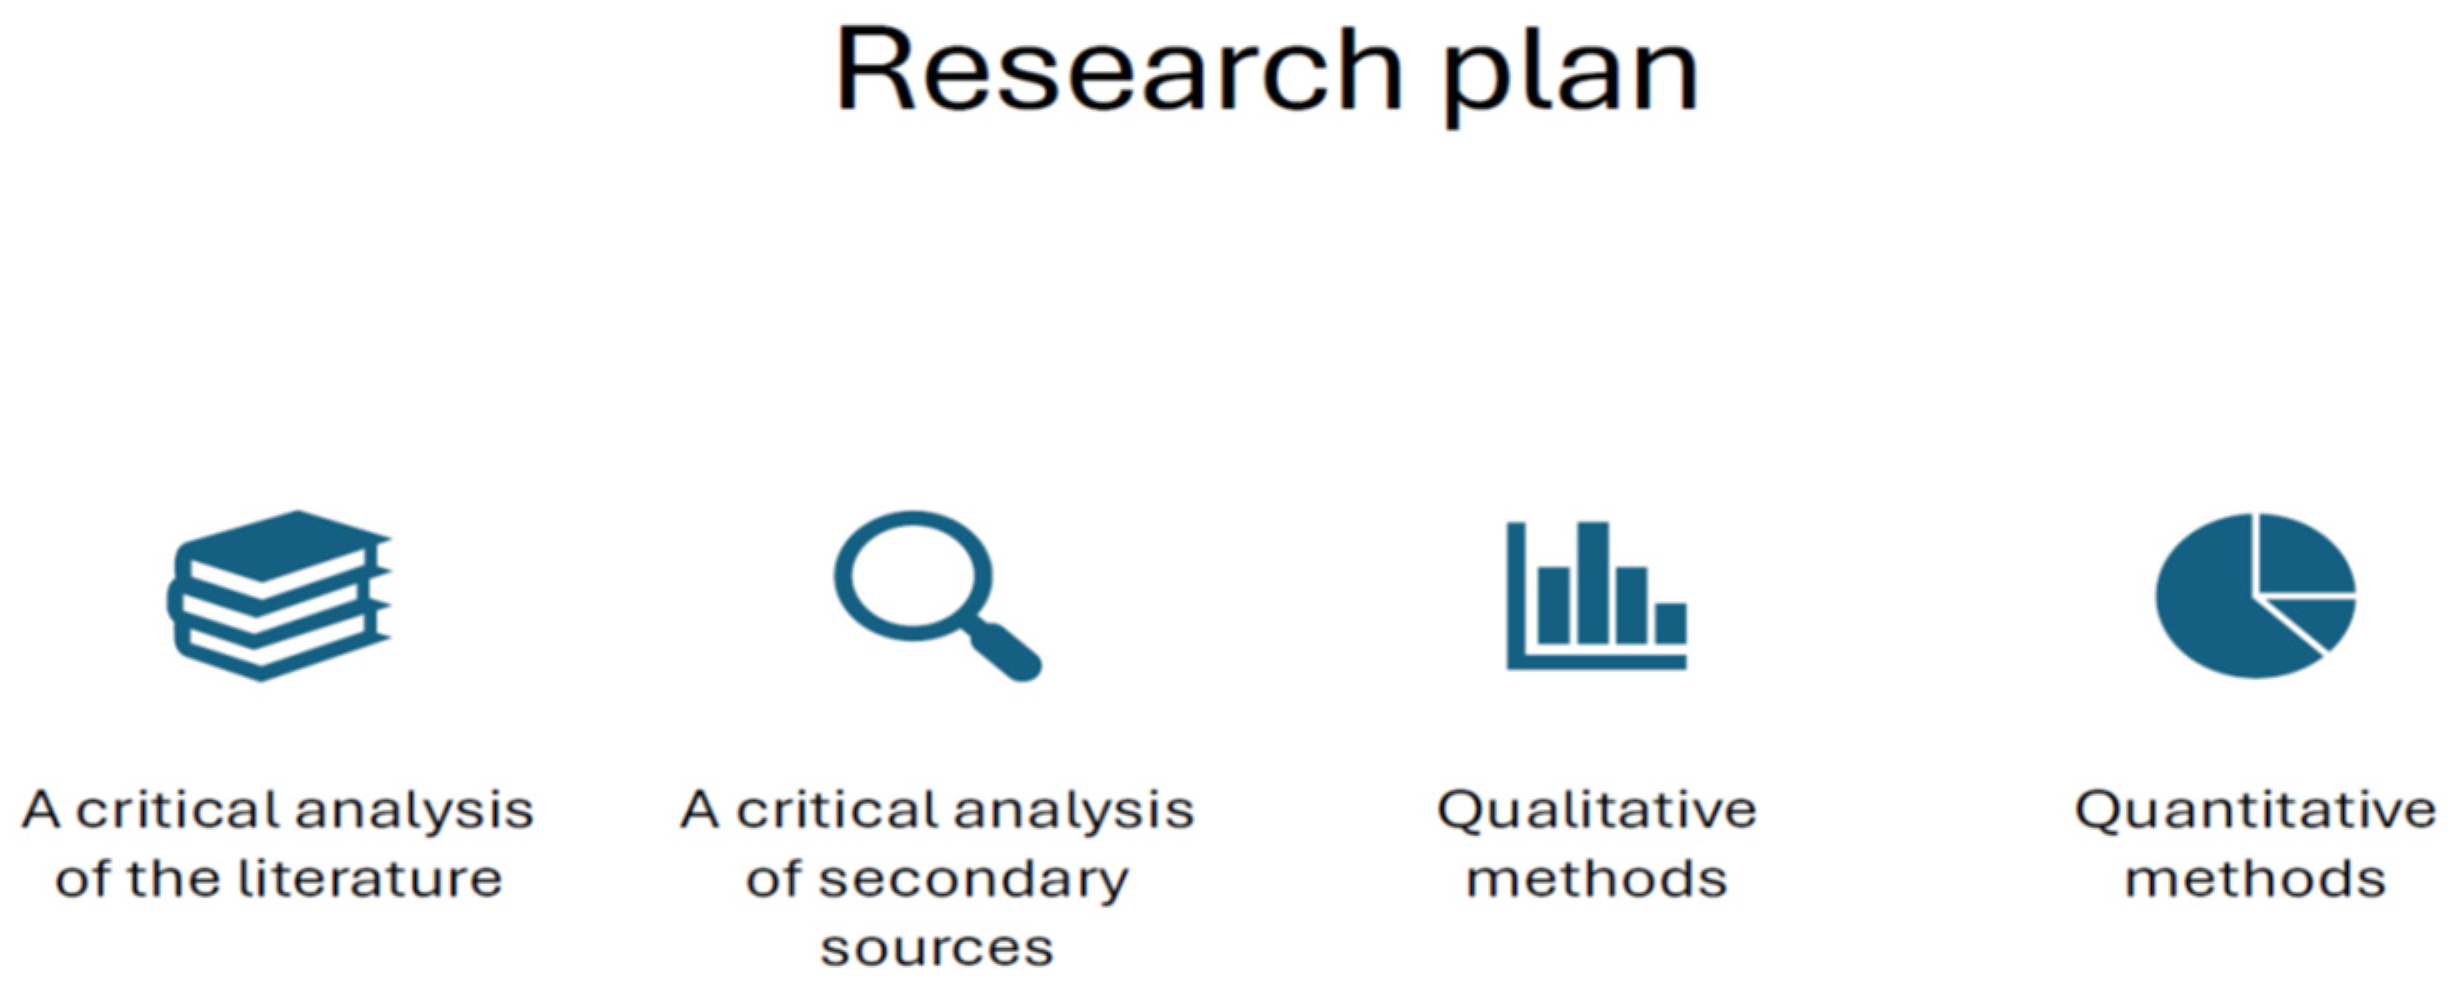
The multi-threaded nature of this study required the authors to use various research methods; therefore, a triangulation method was used [
5,
6], which allowed us to increase the cognitive capabilities of the studied phenomena. The research plan (step by step) is presented in
Figure 2.
This study also indicates (
Figure 2) directions that enable the diffusion of knowledge on accounting policy and the energy sector in Poland, using the Enea Group as an example. In this study, methodological triangulation was used, combining quantitative and qualitative methods, in accordance with the new approach of management sciences, which indicates combining several approaches and methods to manage open methodological attitudes. The choice of research methods and techniques was the result of conceptualisation and operationalisation processes. This study also used the survey method as the last form of verification (CAWI), which was addressed to 19 Enea Group controllers, as specialists.
3. The Business Model, Value Creation, and Structure of the Enea Group
Modern technical and technological progress is closely and directly dependent on electricity, which is an important factor in production. Measures of the importance of electricity in economic development and social life include production per capita, its share of global electricity production, consumption per capita, and access to household electricity.
Electricity production and, consequently, electricity consumption are constantly increasing both globally and by country [
7]. In recent years, the growth in electricity production and consumption has been particularly high in the BRICS countries (+8.5% in 2021 compared to 2019 levels). Both in the BRICS countries (especially China) [
3] and the European Union, wind and solar installations are the main source of increases in electricity production [
7,
8,
9,
10]. The development of renewable energy sources is due to several reasons, which include environmental concerns, running out of fossil sources, technological developments, and economic reasons, which are the result of, for example, the energy crisis caused by the war in Ukraine. In 2019, the European Commission announced a communication called the European Green Deal (EGD), which discusses building a sustainable economy for European Union countries based on the challenges of combatting climate change and the environment [
11,
12,
13]. The European Union’s policies related to electricity generation strongly support the development of renewable energy sources.
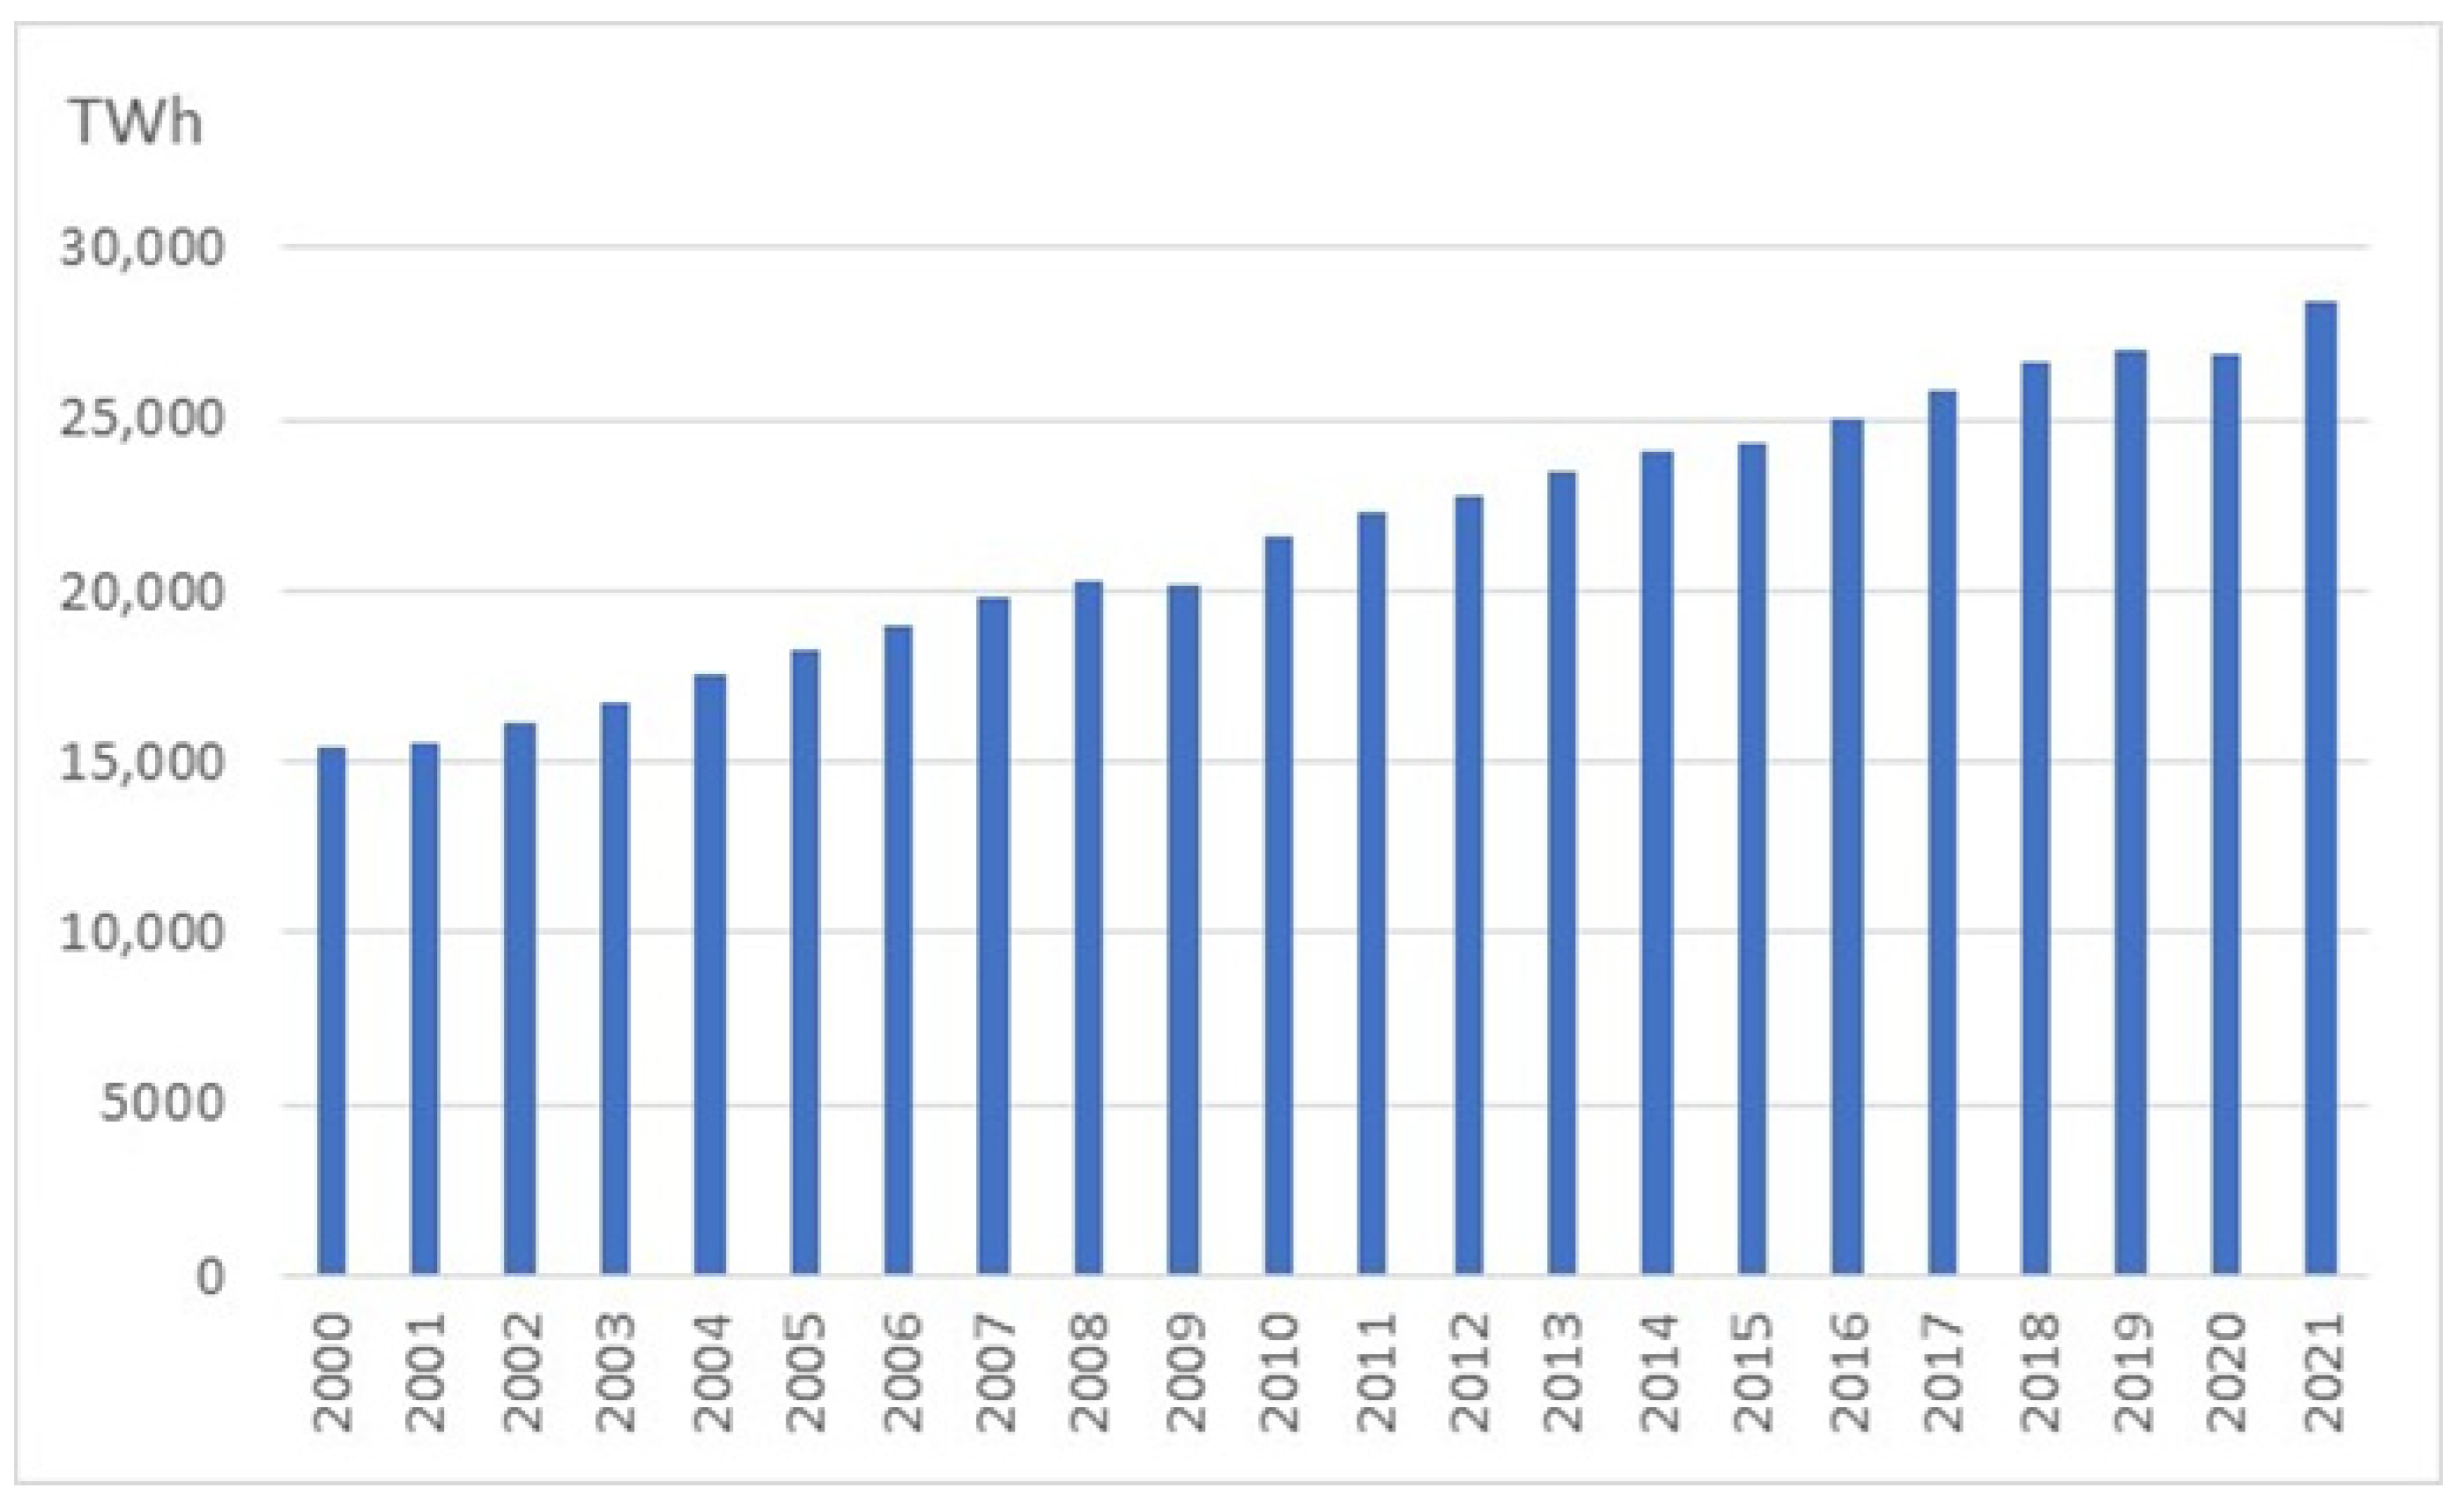
The dynamics of global electricity production between 2000 and 2022 are shown in
Figure 3.
Electricity production is increasing (
Figure 3); although there are fluctuations in the growth rate of electricity production, these are due to unpredictable global impacts such as the COVID-19 pandemic (0.3% decrease in 2020).
Economic development necessitates an increase in the dynamics of electricity production (
Figure 4). If we take electricity production and consumption as one measure of economic development, the analysis of the dynamics of change in electricity production shown in
Figure 1 shows that economic development worldwide is steady, apart from a slight fluctuation in 2020 due to the outages caused by the COVID-19 pandemic. However, this development is not equally dynamic in all countries.
Figure 4 shows electricity production per capita in the selected countries: Australia, Brazil, China, the United States, and a total of all 27 European Union countries. An analysis of the correlations shown in
Figure 4 shows that for Australia, Brazil, the United States, and the European Union countries, electricity production per capita was at a similar level for 10 years (2012–2021). In China, on the other hand, there was a significant increase in electricity production per capita (more than 50%) over these 10 years, which shows the relationship between electricity production growth and China’s economic growth well.
An indicator based on electricity production per capita (like other such indicators) is subject to some problems due to changes in the size of a country’s population. However, it is important to state that growth in electricity production is closely linked to economic development [
14,
15,
16].
The largest electricity producers in Poland are three entities: PGE Polska Grupa Energetyczna S.A., Enea S.A., and Tauron Polska Energia S.A. Together, they produce about two-thirds (62% in 2020) of the electricity consumed in Poland.
The Enea Group is the Polish electricity market’s vice-leader regarding power generation. It manages the full value chain in the electricity market from fuel, energy production, distribution, sales, and customer service. It should be noted that within the electricity sector, the generation, transmission, distribution, and storage sub-sectors are distinguished from each other [
17]. Enea S.A. is the parent company of the Enea Capital Group. Its majority shareholder is the State Treasury, which holds 51.50% of the share capital. There are seven leading entities within the group [
7]:
Enea S.A. (electricity trading);
Enea Operator sp. z o.o. (electricity distribution);
Enea Wytwarzanie sp. z o.o., Enea Elektrownia Połaniec S.A., and Enea Nowa Energia sp. z o.o. (production and sale of electricity and heat);
Enea Trading sp. z o.o. (wholesale electricity trading);
Lubelski Węgiel “Bogdanka” S.A. (coal mining).
Other entities provide ancillary activities to the listed companies. Enea has business activities in four main areas, as presented in
Table 1.
The main areas (
Table 1) of the Enea Group’s operations affect the environment by optimising environmental benefits, applying modern, environmentally friendly technological solutions and taking measures to minimise the direct negative impact on the environment [
18,
19,
20,
21,
22,
23,
24,
25,
26]. An important objective of the Enea Group is to implement changes that result in the sustainable transformation of the entity, building growth in its value. This objective will be pursued through the following:
Developing renewable energy sources (RESs) based on modern technologies;
Producing an optimal and sustainable mix of products and services for well-identified customers in cooperation with business and social partners;
Developing new business lines to offer customers new products beyond energy;
Maintaining the financial security of the entity.
The Enea Group’s value creation takes place by achieving climate neutrality through RES development. The increase in RES capacity will be achieved through acquisitions, our projects’ development, and business partners’ participation [
7].
The Enea Group’s value creation is embedded in the group’s business model, defined by the key indicators for achieving strategic objectives, as shown in
Table 2.
The key indicators for achieving the Enea Group’s 2030–2040 targets correspond to capital expenditure (
Table 2). Capital expenditure in all business areas is estimated at over PLN 68 billion, which includes the following:
Distribution: 42.5 million;
RESs: 13.8 million;
Gas and stream units: 6.8 million;
Other activities: 6.2 million.
The business model and value creation in the Enea Group are determined by current world issues in decarbonising the economy, including climate change. This is discussed more extensively in [
27,
28,
29,
30,
31,
32,
33].
4. Background—The Environmental Impact of the Energy Sector According to ESG Reports
At the end of May 2021, the Enea Group published its first ESG report for 2020, prepared in accordance with the international GRI reporting standards, which comprehensively present activities in the areas of environmental protection, social involvement, and responsible management undertaken in 2020. This report presents not only the achieved results but also the group’s commitments for the future, including the scope of transformation into a zero-emission group. At the end of May 2022, the “ENEA Group ESG Report for 2021” was published, which is a report not only on the results of its efforts already achieved but also on planned strategic undertakings and adopted short-, medium-, and long-term goals. The report includes, among others, multi-year schedules, which include goals of reducing CO2 emissions to zero and changes in the structure of energy generation. Other important manifestations of the transparency of the Enea Group’s communication with its environment include the significant expansion of the section devoted to managing risks related to climate change, the presentation of an analysis of climate opportunities, and the commencement of reporting data on indirect energy greenhouse gas emissions (so-called Scope 2). At the end of May 2023, the “ENEA Group ESG Report for 2022” was published. Since 2023 was a year of war beyond Poland’s eastern border—which not only caused turmoil in the energy market but also a humanitarian crisis—the report shows how Enea responded to both challenges, proving the group’s solid foundations for sustainable development. The report not only describes Poland’s efforts to achieve climate neutrality by 2050, the development of Poland’s renewable energy sources, and the expansion and modernisation of distribution networks but also the broader context of the “ENEA Green Change”, including implemented research and development programs, the management of risks, and opportunities related to climate change. The descriptions of the activities carried out and the goals adopted are accompanied by detailed numerical data, including those regarding greenhouse gas emissions, which were also partially calculated for the first time for the so-called Scope 3. In May 2023, the “Enea Group ESG Report for 2023” was published. Some of the key activities of the Enea Group in 2023 were the development and adoption of the “Climate Policy of the ENEA Capital Group”, which is a supplement to the “Development Strategy of the ENEA Capital Group until 2030 with a perspective of 2040”. The report also includes information on the carbon footprint. In 2023, the Enea Group took steps to comprehensively report on inventory and full data on the size of greenhouse gas emissions in accordance with the international GHG Protocol standard. Scope 1 and 2 data and those of selected Scope 3 categories were collected and reported.
In the case of entities in the energy sector, the natural environment provides natural resources and at the same time “takes in” the by-products of energy production, i.e., heat from cooling systems, gaseous substances, and dust, as well as solid and liquid waste. Significant quantities of these substances cause adverse changes in atmospheric air, water, and soil, negatively affecting the quality of human life and degrading the plant and animal world [
34,
35,
36,
37,
38,
39,
40,
41,
42,
43]. The main pollutants generated by the energy sector are presented in
Figure 5.
The main pollutants generated by the energy sector (
Figure 5) are from the emissions of gaseous pollutants, mainly including sulphur dioxide, nitrogen oxides, and particulate matter; from the emissions of heated cooling; from the destruction of land by opencast mining; and from the landfilling of various types of mine waste on the ground. The effects of the energy sector’s negative environmental impacts take a toll on the following: water management, forestry and agriculture, industrial production, and human health [
44,
45,
46,
47,
48,
49,
50,
51,
52,
53,
54].
The Enea Group takes action to support environmental protection and pollution prevention in a manner that takes into account socio-economic needs. It strives to minimise carbon dioxide emissions to achieve climate neutrality by 2050, thus contributing to the achievement of the European Union’s climate goals. This can be achieved, among other things, through the production of energy from RESs, as shown in
Table 3.
The modification of the conventional methods of obtaining energy in Poland (
Table 3), where the energy sector is based primarily on burning coal, involves the development of clean technology branches, which reduces the emission of harmful substances into the natural environment. For example, excessive emissions of carbon dioxide (CO
2) have a negative impact on the environment, leading to higher temperatures. Carbon dioxide entering the atmosphere comes from a variety of sources including motor vehicles, power plant chimneys, and industrial production. The Enea Group emits CO
2, which is related to power generation (
Table 4).
In addition to CO
2 (
Table 4), the energy industry (Enea Group) emits sulphur dioxide (SO
2), dust, and nitrogen oxide (NO
x). The levels of the emissions of sulphur dioxide (SO
2), dust, and nitrogen oxides (NO
x) of companies from the Generation Segment in 2020–2021 are presented in
Table 5.
Environmental aspects, in addition to emissions (
Table 5), also include the consumption of resources (raw materials and materials). When producing electricity and heat, the Enea Group consumes significant amounts of energy resources: hard coal, gas, biomass, and fuel oils. The primary fuel for electricity generation is hard coal (fines), as shown in
Table 6.
The Enea Group’s operations are mainly mining (
Table 6) and manufacturing activities, which are inextricably linked to the generation of various types of waste (
Table 7).
The hazardous waste group, in particular, is subject to the continuous control and minimisation of waste generation levels, as the Enea Group understands Corporate Social Responsibility (CSR) as the impact of the actions and decisions of individual companies on society and the environment.
5. Case Study—Environmental Costs and Environmental Projects
Environmental protection measures generate certain costs. These are the costs of modernisation and development, the operation of equipment and installations, and new investments. Environmental protection costs include the following [
17]:
Depreciation or amortisation charges for fixed assets brought into service as a result of development and modernisation investments.
Interest on loans taken out for development and modernisation investments and the financial costs associated with servicing these loans.
Labour costs; the consumption of materials, fuels, energy, and water; waste disposal; transport costs; and repair costs, all resulting from the type of equipment used, installations, and their operating conditions.
The costs of co-financing projects and services aimed at reducing consumers’ fuel and energy consumption.
The costs of co-financing projects related to the development of unconventional energy.
The Enea Group aims to reduce the emissions of pollutants generated during production processes as much as possible, which is supported by further infrastructure investments undertaken. These make it possible to make steady progress in reducing the emissions of sulphur dioxide, dust, and nitrogen oxides. The Enea Group also offers products and services that have a positive impact on the environment. Pro-environmental investments and their costs are shown in
Table 8.
It should be noted that Regulation 2020/852/EU [
55] of the European Parliament and of the Council on the establishment of a framework to facilitate sustainable investments was enacted on 18 June 2020 and 21 April 2021—the classification of environmentally sustainable activities based on it, commonly referred to as the Taxonomy (
Table 8). As a result, it was established that in 2021, the following were true:
A total of 18.7% of the Enea Group’s total turnover came from activities that qualify for the EU classification of sustainable economic activities.
A total of 53.8% of the group’s capital expenditure (CAPEX) and 48.9% of its operating expenditure (OPEX) were classifiable as being related to such activities.
In the case of the turnover and CAPEX ratio (
Table 10), the consolidated items identifiable in the financial section of the report were the basis for calculating the share of activities eligible for systematisation. In the case of the OPEX indicator, due to its specific definition in the Taxonomy, such an exercise was not feasible (
Table 11). At this point, it should be noted that the OPEX denominator for the Taxonomy is not the same as all operating costs incurred by the group. The OPEX denominator identified for the Taxonomy amounted to less than PLN 600 million, while the group’s cost of sales revenues amounted to almost PLN 19 billion, meaning that the OPEX calculation basis for the purposes of the Taxonomy (
Table 9) represented only 3.16% of all operating costs (excluding other operating activities).
Both pro-ecological investments and other activities in the field of environmental protection imply the generation of costs related to them. Costs are a significant element of the Enea Group’s operations, because the group’s financial results, i.e., profit or loss from operating activities, depend on their level. Costs are an element of the accounting policy and at the same time the company’s chart of accounts. In the Enea Group, they should be recognised as direct or indirect costs recorded in analytical accounts. Groups of costs and expenses related to pro-ecological investments and protection activities should be reflected in one internal document of the Enea Group—an integrated report—and finally in an ESG report. Reporting is based on cost records, described in the accounting policy of the economic entity, the key element of which is the company’s chart of accounts.
6. Results—The Original Structure of the Integrated Report and the Proposed Changes in the Accounting Policy
Taking into account the applied triangulation of research methods, through their differentiation, the last stage of verification consisted of a study that was conducted in September 2023. The research tool was a survey questionnaire (conducted using the CAWI technique), prepared in MS Teams and addressed to 19 Enea Group controllers, as an expert assessment. The specific objective of this study was to obtain information on the business operations recording system, including environmental operations.
Firstly, it was asked whether information relating to environmental protection activities is collected, recorded, processed, and presented within the Enea Group as part of the mandatory accounting system and whether there are separate accounts in the company’s chart of accounts for recording business operations relating to the group’s environmental activities. Both answers were negative.
The next question was the following: “does the Enea Group separate environmental costs in team 4 (analytically)?”. The respondent also answered this question in the negative. The results of three further questions are shown in
Table 12.
The respondent was then asked whether they prepare an integrated report and whether they use quality costing in their operations, a modern costing useful for managing environmental costs. The answers to both questions were in the negative (
Table 12).
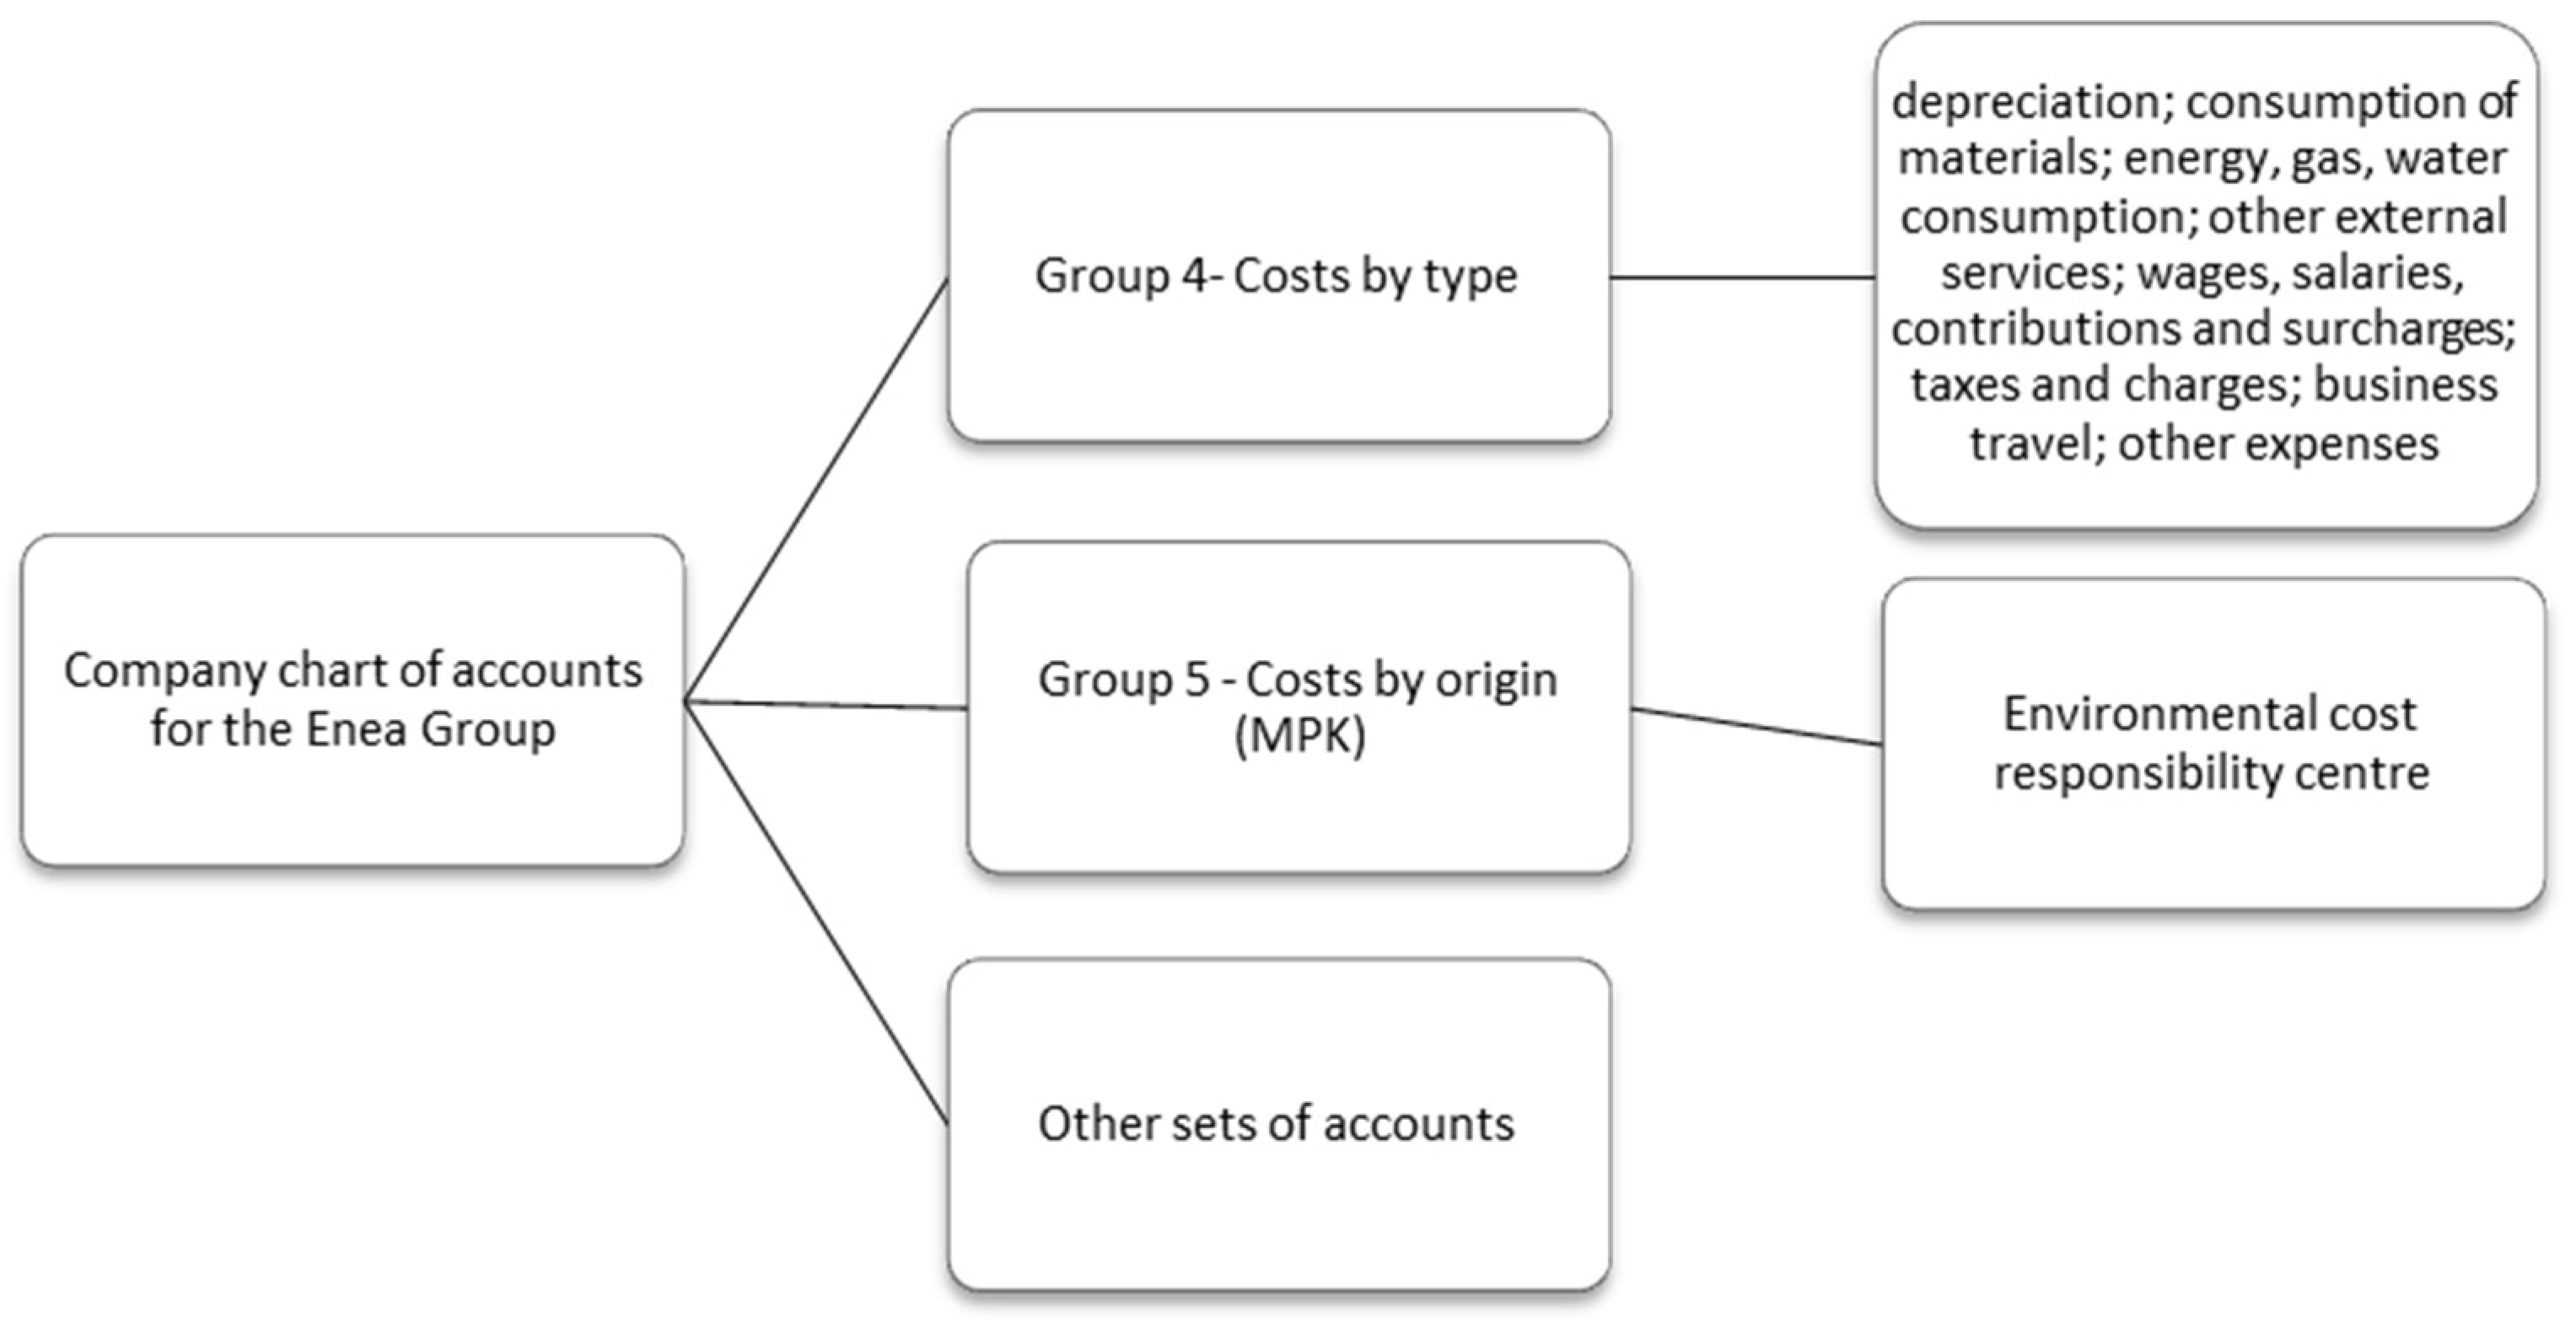
As a result of the analysis of internal documents and the Enea Group’s research, it should be concluded that neither the accounting policy nor the company’s chart of accounts presents a correct record of environmental costs, which implies that changes in this area should be developed, and their implementation should be proposed. These changes can be implemented through the use of management accounting or controlling concepts. A controlling department is already in place in the Enea Group. Referring only to cost recognition, the authors’ scheme for changes to the chart of accounts at the macro level (general model) is presented in
Figure 6.
The general model for environmental cost accounting includes costs by type and costs by place of origin (
Figure 6). The recording of environmental costs is preceded by the measurement and valuation of factor consumption. By type, the modification of sets 4 and 5 of the chart of accounts is proposed for the Enea Group. The recording of environmental costs can only be narrowed down to an extension of band 5 (MPK) of the chart of accounts; this is decided by the entity itself.
Table 13 shows the authors’ proposed changes to band 4 of the chart of accounts—costs by type.
Table 13 presents changes to the cost accounting of band 4 of the chart of accounts about environmental costs (cost by type). It is necessary to describe all changes to the accounting model in the Enea Group’s accounting policy, with particular emphasis on accounting for costs indirectly. It is imperative to describe the entire system of accounting for environmental costs and to identify the allocation keys for this. Currently, in the Enea Group, costs by place of origin (MPK) have 10 characters and are recorded in band 5 of the company’s chart of accounts as follows:
12XXXXxxxx—the Enea Group’s permanent designation.
XXXX—the type of cost (e.g., 1—distribution; 8—management costs).
xxxx—the designation of the organisational unit to which the cost is attributed (e.g., 3133 Szczecin branch/district one/energy station three).
For example, detailed MPK markings are as follows:
12 1XXX—distribution costs.
12 3XXX—customer service costs and CUW contracts.
12 4XXX—overheads of units.
12 5XXX—IT costs.
12 6XXX—transport costs.
12 8XXX—general administrative expenses.
A sample solution for the organisation of the company’s chart of accounts for the Enea Group, taking into account the needs of financial and management or controlling accounting, can be presented in the construction of a single accounting account, as presented in
Table 14. The organisation of the chart of accounts according to Group 5—MPK—is a close reflection of the organisational structure of the Enea Group.
The organisation of the chart of accounts according to the ICC with environmental costs requires a broader accounting of direct costs for environmental protection activities and processes so that these costs can be recorded separately by accounting according to the ICC (
Table 14).
Changes to the Enea Group’s accounting policy and the company’s chart of accounts imply changes to the group’s reporting, both financial and non-financial. It is postulated that the audited entity should formulate one integrated report [
44,
45,
46,
47,
48,
49,
50,
51,
52,
53,
54]. The authors’ proposal for an integrated report for the Enea Group is presented in
Table 15 and
Table 16.
Nowadays, in terms of integrated reporting, the principles of its preparation should provide users with a reliable and neutral context for reading financial and non-financial information about the Enea Group’s operations. In
Table 15 and
Table 16, the authors introduced weights in addition to the different reporting levels—here, the so-called auditors’ scale, which was established using expert opinions, allowed for partial results and then allowed auditors to determine the overall outcome. Both the item results and the overall results will allow both auditors and managers to provide some reference information. Different projects or cases can then be compared using the results, or at least, such numerical data presented in the reports will allow for a more effective assessment of individual parts of the report, assuming that there may be parts/levels where a company, entity, or even a group reaches 0.
The authors hope that taking into account the proposed quantitative criteria for scoring numerical data within accounting reports will allow for their better assessment by auditors, as well as the better management of all areas, assuming the indicated criteria. As the human mind perceives the environment through information obtained through the senses and selects and remembers only the most important information, the Enea Group should select the data disclosed and presented in the integrated report so that they are useful to users. The general and detailed proposal for the structure of the integrated report for the Enea Group can be freely modelled and adapted by the entity, and finally, an ESG report can be created [
56,
57,
58,
59,
60].
7. Conclusions, Limitations, and Future Research Directions
The main objective of this article was to analyse the disclosure of financial and non-financial information in an ESG report on the energy sector in Poland using the example of the Enea Group, i.e., information on the following: (1) the structure of the Enea Group, its business model, and created values; (2) the impact of the energy sector on the environment; (3) environmental costs in correlation with the calculation of electricity prices and rates (financial and non-financial aspects); (4) and pro-ecological projects. The specific objective was to propose changes in the accounting policy, including the energy sector’s corporate chart of accounts, using the example of the Enea Group, (5) and consequently to propose changes in the structure of the integrated report and finally the ESG report. Economic, social, environmental, and corporate governance issues affect accounting, which is reflected in the accounting policy, which is why this became the subject of this study. As a result of the analysis of internal documents and research of the Enea Group, it should be stated that neither the accounting policy nor the company’s chart of accounts presents a correct record of environmental costs, which implies the development and proposal of implementing changes in this area. This article fills a research gap, and the research results will not only enrich the literature on the subject, expanding the scope of existing knowledge in the field of factors shaping the accounting policy of companies from the energy sector in the example of Poland, but can also provide valuable advice for managers in this area. The authors’ research results allowed the research gap to be filled in the scope of information on the activities undertaken by the Enea Group for environmental protection and the costs of environmental protection incurred. A significant added value is the original structure of the integrated report presented by the authors and the proposed changes to the accounting policy, including the Enea Group’s corporate chart of accounts in the field of recording environmental protection costs. The presented scenario of changes is universal and can be applied to other entities in the energy sector, including entities from the area of “green energy”, e.g., hydrogen economy, which will be a cheaper source of energy. The authors indicate that one limitation of the conducted study may be the fact that the research topic covered the Polish energy group. This study is unique for several reasons. First, to the authors’ knowledge, this is the only study of this type on the relationship between environmental challenges and the accounting policy and the changes introduced therein and the chart of accounts of energy companies. Second, the authors propose a modern approach to accounting policy. Finally, the case study of the Enea Group, supported by the analysis of the largest energy companies and groups, provides new evidence for scientific discussion and can support decision-making in these areas.
However, it should be noted that the Enea Group has an international reach, and its accounting is based on IFRS, which is why the next study will be directed at international energy groups from other European countries.
Author Contributions
Conceptualisation: B.S., G.L., M.W.-J., W.D. and B.P.; methodology: B.S., G.L., M.W.-J., W.D. and B.P.; software: B.S., G.L., M.W.-J., W.D. and B.P.; formal analysis: B.S., G.L., M.W.-J., W.D. and B.P.; data curation: B.S., G.L., M.W.-J., W.D. and B.P.; writing—original draft: B.S., G.L., M.W.-J., W.D. and B.P.; writing—review and editing: B.S., G.L., M.W.-J., W.D. and B.P.; visualisation: B.S., G.L., M.W.-J., W.D. and B.P. All authors have read and agreed to the published version of the manuscript.
Funding
This article presents the result of Project no. 062/ZIR/2024/POT financed from the subsidy granted to the Krakow University of Economics (M.W.-J.), co-financed by the Minster of Science under the “Regional Excellence Initiative” (B.S., W.D., and B.P.).
Data Availability Statement
The original contributions presented in this study are included in this article; further inquiries can be directed to the corresponding author.
Conflicts of Interest
The authors declare that they have no known competing financial interests or personal relationships that could have appeared to influence the work reported in this paper.
References
- Collier, Z.A.; Lambert, J.H.; Linkov, I. Advanced analytics for environmental resilience and a sustainable future. Environ. Syst. Decis. 2021, 41, 1–2. [Google Scholar] [CrossRef]
- Linkov, I.; Moberg, E.; Trump, B.D.; Yatsalo, B.; Keisler, J.M. Multicriteria Decision Analysis Case Studies in Engineering and the Environment, 2nd ed.; Taylor & Francis: Boca Raton, FL, USA, 2020. [Google Scholar]
- Zarzycka, E.; Krasodomska, J. Environmental Key Performance Indicators: The Role of Regulations and Stakeholder Influence. Environ. Syst. Decis. Environ. Syst. Decis. 2021, 41, 651–666. Available online: https://link.springer.com/article/10.1007/s10669-021-09825-z (accessed on 2 November 2024). [CrossRef]
- Available online: https://www.ifrs.org/issued-standards/list-of-standards/ias-8-accounting-policies-changes-in-accounting-estimates-and-errors/ (accessed on 19 February 2025).
- Czakon, W. Podstawy Metodologii Badań w Naukach o Zarządzaniu; Wydawnictwo Nieoczywiste: Piaseczno, Poland, 2016. [Google Scholar]
- Zioło, M. Finanse Zrównoważone; PWE: Warszawa, Poland, 2020. [Google Scholar]
- Enea Group. Available online: https://www.enea.pl (accessed on 21 September 2022).
- Ahmad, T.; Zhang, D. A critical review of comparative global historical energy consumption and future demand: The story told so far. Energy Rep. 2020, 6, 1973–1991. [Google Scholar] [CrossRef]
- Costa, E.; Rodrigues Teixeira, A.C.; Silva Costa, S.C.; Consoni, F.L. Influence of public policies on the diffusion of wind and solar PV sources in Brazil and the possible effects of COVID-19. Renew. Sustain. Energy Rev. 2022, 162, 112449. [Google Scholar] [CrossRef]
- Toktarova, A.; Karlsson, I.; Rootzén, J.; Göransson, L.; Odenberger, M.; Johnsson, F. Pathways for Low-Carbon Transition of the Steel Industry-A Swedish Case Study. Energies 2020, 13, 3840. [Google Scholar] [CrossRef]
- Nasirov, S.; O’Ryan, R.; Osorio, H. Decarbonization Tradeoffs: A Dynamic General Equilibrium Modeling Analysis for the Chilean Power Sector. Sustainability 2020, 12, 8248. [Google Scholar] [CrossRef]
- Kittel, M.; Goeke, L.; Kemfert, C.; Oei, P.-Y.; von Hirschhausen, C. Scenarios for Coal-Exit in Germany-A Model-Based Analysis and Implications in the European Context. Energies 2020, 13, 2041. [Google Scholar] [CrossRef]
- Lew, G.; Sadowska, B.; Chudy-Laskowska, K.; Zimon, G.; Wójcik-Jurkiewicz, M. Influence of Photovoltaic Development on Decarbonization of Power Generation—Example of Poland. Energies 2021, 14, 7819. [Google Scholar] [CrossRef]
- Communication from the Commission to the European Parliament, the European Council, the Council, the European Economic and Social Committee and the Committee of the Regions—The European Green Deal, Brussels, 11.12.2019 COM(2019) 640, European Commission. Available online: https://commission.europa.eu/strategy-and-policy/priorities-2019-2024/european-green-deal_en (accessed on 2 October 2022).
- Nikas, A.; Gambhir, A.; Trutnevyte, E.; Koasidis, K.; Lund, H.; Thellufsen, J.; Mayer, D.; Zachmann, G.; Miguel, L.; Ferre-ras-Alonso, N.; et al. Perspective of comprehensive and comprehensible multi-model energy and climate science in Europe. Energy 2020, 215, 119153. [Google Scholar] [CrossRef]
- Glavic, P.; Pintaric, Z.N.; Bogataj, M. Process Design and Sustainable Development—A European Perspective. Processes 2021, 9, 148. [Google Scholar] [CrossRef]
- Available online: https://yearbook.enerdata.net (accessed on 15 June 2024).
- Available online: https://ourworldindata.org (accessed on 22 July 2024).
- Atems, B.; Hotaling, C. The effect of renewable and nonrenewable electricity generation on economic growth. Energy Policy 2018, 112, 111–118. [Google Scholar] [CrossRef]
- Szustak, G.; Dąbrowski, P.; Gradoń, W.; Szewczyk, Ł. The Relationship between Energy Production and GDP: Evidence from Selected European Economies. Energies 2022, 15, 50. [Google Scholar] [CrossRef]
- Sobocińska, M. Processes of Modernization of Consumption in Poland in the Context of the Sustainable Consumption and the Functioning of the Renewable Energy Market. Energies 2022, 15, 289. [Google Scholar] [CrossRef]
- Drożdż, W.; Pilecki, B.; Ciężki, D.; Sroka, M. Operator Systemu Dystrybucyjnego na Współczesnym Rynku Elektroenergetycznym; Wydawnictwo Naukowe Uniwersytetu Szczecińskiego: Szczecin, Poland, 2021; pp. 12–13. [Google Scholar]
- Majchrzak, I. Społeczna odpowiedzialność sektora energetycznego wobec środowiska naturalnego. In Europa Regionum XVII; Wydawnictwo Naukowe Uniwersytetu Szczecińskiego: Szczecin, Poland, 2013; pp. 277–292. [Google Scholar]
- Schaik, L.; Van Schunz, S. Explaining EU Activism and Impact in Global Climate Politics: Is the Union a Norm or Interest-Driven Actor? J. Common Mark. Stud. 2012, 50, 178. [Google Scholar] [CrossRef]
- Pellerin-Carlin, T.; Vinois, J.A.; Rubio, E.; Fernandes, S. Making the Energy Transition a European Success. Tackling the Democratic, Innovation, Financing and Social Challenges of the Energy Union. Stud. Rep. Notre Eur. Jacques Delors Inst. 2017, 114, 176. [Google Scholar]
- Goodall, A.H. Why have the leading journals in management (and other social sciences) failed to respond to climate change? J. Manag. Inq. 2008, 17, 408–420. [Google Scholar] [CrossRef]
- Dyduch, W. Corporate Entrepreneurship Measurement for Improving Organizational Performance. J. Econ. Manag. 2008, 4, 15–40. [Google Scholar]
- Sovacool, B.K. What are we doing here? Analyzing fifteen years of energy scholarship and proposing a social science research agenda. Energy Res. Soc. Sci. 2014, 1, 1–29. [Google Scholar] [CrossRef]
- Schuitema, G.; Sintov, N.D. Should we quit our jobs? Challenges, barriers and recommendations for interdisciplinary energy research. Energy Policy 2017, 101, 246–250. [Google Scholar] [CrossRef]
- Geels, F.W.; Sovacool, B.K.; Schwanen, T.; Sorrell, S. Sociotechnical transitions for deep decarbonization. Science 2017, 357, 1242–1244. [Google Scholar] [CrossRef]
- Cooper Adam, C.G. Building physics into the social: Enhancing the policy impact of energy studies and energy social science research. Energy Res. Soc. Sci. 2017, 26, 80–86. [Google Scholar] [CrossRef]
- Kiuila, O. Decarbonisation perspectives for the Polish economy. Energy Policy 2018, 118, 69–76. [Google Scholar] [CrossRef]
- Zenghelis, D. Securing Decarbonisation and Growth. Natl. Inst. Econ. Rev. 2019, 250, 1. [Google Scholar] [CrossRef]
- Krzakiewicz, K.; Cyfert, S. Strategic orientations of the organization—Entrepreneurial, market and organizational learning. Management 2019, 23, 7–19. [Google Scholar] [CrossRef]
- Knobloch, F.; Pollitt, H.; Chewpreecha, U.; Daioglou, V.; Mercure, J.F. Simulating the Deep Decarbonisation of Residential Heating for Limiting Global Warming to 1.5 °C. Energy Effic. 2019, 12, 521–550. [Google Scholar] [CrossRef]
- Callaghan, M.W.; Minx, J.C.; Forster, P.M. A topography of climate change research. Nat. Clim. Change 2020, 10, 118–123. [Google Scholar] [CrossRef]
- Papadis, E.; Tsatsaronis, G. Challenges in the decarbonization of the energy sector. Energy 2020, 205, 118025. [Google Scholar] [CrossRef]
- Kulovesi, K.; Oberthür, S. Assessing the EU’s 2030 Climate and Energy Policy Framework: Incremental Change toward Radical Transformation? Rev. Eur. Comp. Int. Environ. Law 2020, 29, 151–166. [Google Scholar] [CrossRef]
- Victoria, M.; Zhu, K.; Brown, T.; Andresen, G.B.; Greiner, M. Early decarbonisation of the European energy system pays off. Nat. Commun. 2020, 11, 6223. [Google Scholar] [CrossRef] [PubMed]
- Oyewunmi, T.; Crossley, P.; Talus, K.; Sourgens, F.G. Decarbonization and the Energy Industry: An Introduction to the Legal and Policy Issues. Tulane Public Law Res. Pap. 2020. Available online: https://ssrn.com/abstract=3548837 (accessed on 1 February 2022).
- Leal-Arcas, R. Towards Sustainability in Trade, Energy and Climate. Mod. Environ. Sci. Eng. 2020, 6, 1–30. [Google Scholar] [CrossRef]
- Sadik-Zada, E.R.; Gatto, A. The Puzzle of Greenhouse Gas Footprints of Oil Abundance. Socio-Econ. Plan. Sci. 2020, 75, 11. [Google Scholar] [CrossRef]
- Zastempowski, M.; Cyfert, S. Social responsibility of SMEs from the perspective of their innovativeness: Evidence from Poland. J. Clean. Prod. 2021, 317, 128400. [Google Scholar] [CrossRef]
- Kludacz-Alessandri, M.; Cygańska, M. Corporate Social Responsibility and Financial Performance among Energy Sector Companies. Energies 2021, 14, 6068. [Google Scholar] [CrossRef]
- Drożdż, W.; Kinelski, G.; Czarnecka, M.; Wójcik-Jurkiewicz, M.; Maroušková, A.; Zych, G. Determinants of Decarbonization—How to Realize Sustainable and Low Carbon Cities? Energies 2021, 14, 2640. [Google Scholar] [CrossRef]
- Chudy-Laskowska, K.; Rokita, S. Profitability of Energy Sector Companies in Poland: Do Internal Factors Matter? Energies 2024, 17, 5135. [Google Scholar] [CrossRef]
- Wójcik-Jurkiewicz, M.; Czarnecka, M.; Kinelski, G.; Sadowska, B.; Bilińska-Reformat, K. Determinants of Decarbonisation in the Transformation of the Energy Sector: The Case of Poland. Energies 2021, 14, 1217. [Google Scholar] [CrossRef]
- Zhao, J.; Dong, K.; Dong, X.; Shahbaz, M. How renewable energy alleviate energy poverty? A global analysis. Renew. Energy 2022, 186, 299–311. [Google Scholar] [CrossRef]
- Żylicz, T. Ekonomia Wobec Problemów Środowiska Przyrodniczego; Państwowe Wydawnictwo Naukowe: Warsaw, Poland, 1989. [Google Scholar]
- Fiedor, B. Działania Zbiorowe w sferze Zanieczyszczenia Środowiska i jego Ochrony: Próba Objaśnienia na Podstawie Teorii dóbr Publicznych Teorii Niedoskonałości Rynku oraz Teorii Regulacji Publicznej w Gospodarce Rynkowej; Działania zbiorowe-teoria i praktyka; Prace Naukowe Akademii Ekonomicznej we Wrocławiu: Warsaw, Poland, 2003; pp. 22–41. [Google Scholar]
- Poskrobko, B. Usługi środowiska jako kategoria ekonomii zrównoważonego rozwoju. Econ. Environ. 2010, 1, 14–24. [Google Scholar]
- Fiedor, B. Ogólna charakterystyka ekonomii środowiska jako części składowej współczesnej teorii ekonomii. Econ. Environ. 1992, 1, 19–34. [Google Scholar]
- Poskrobko, B. Paradygmat zrównoważonego rozwoju jako wiodący kanon w badaniu nowych obszarów ekonomii. Econ. Environ. 2013, 3, 10–24. [Google Scholar]
- Hausner, J.; Żylicz, T. Lasy Państwowe powinny być korporacją publiczną. Przemysł Drzewny 2014, 3. [Google Scholar]
- Available online: https://eur-lex.europa.eu/legal-content/EN/ALL/?uri=LEGISSUM%3A4481971 (accessed on 19 February 2025).
- Eccles, R.G.; Armbrester, K. Integrated Reporting on the Cloud: Two Disruptive Ideas Combined. IESE Bus. Sch. 2011, 8, 13–20. [Google Scholar] [CrossRef]
- Eccles, R.G.; Krzus, M.P.; Tapscott, D. One Report: Integrated Reporting for a Sustainable Strategy; John Wiley & Sons: Hoboken, NJ, USA, 2010. [Google Scholar]
- Majchrzak, I. Ustalanie kosztów ochrony środowiska na potrzeby podsystemu rachunku kosztów ochrony środowiska przedsiębiorstw energetycznych. In Finanse, Rynki Finansowe, Ubezpieczenia:18; Wydawnictwo Naukowe Uniwersytetu Szczecińskiego: Szczecin, Poland, 2009; pp. 280–288. [Google Scholar]
- Węgrzyńska, M. Zielona Rachunkowość; Wydawnictwo Wyższej Szkoły Bankowej w Poznaniu: Poznań, Poland, 2013. [Google Scholar]
- Szczypa, P. Narzędzia Rachunkowości Wspomagające Działalność Proekologiczną Przedsiębiorstw w Polsce; CeDeWu sp. z o.o.: Warszawa, Poland, 2012. [Google Scholar]
Figure 1.
Accounting policy. Source: own elaboration based on Accounting Act, IFRS, IAS 1, and IAS 8 [
4].
Figure 1.
Accounting policy. Source: own elaboration based on Accounting Act, IFRS, IAS 1, and IAS 8 [
4].
Figure 2.
Research plan. Source: own elaboration.
Figure 2.
Research plan. Source: own elaboration.
Figure 3.
Global electricity production from 2000 to 2021. Source: own elaboration based on [
12].
Figure 3.
Global electricity production from 2000 to 2021. Source: own elaboration based on [
12].
Figure 4.
Electricity production in selected countries per capita. Source: own elaboration based on [
13].
Figure 4.
Electricity production in selected countries per capita. Source: own elaboration based on [
13].
Figure 5.
The main pollutants generated by the energy sector. Source: own elaboration based on [
17].
Figure 5.
The main pollutants generated by the energy sector. Source: own elaboration based on [
17].
Figure 6.
Example of cost account splitting scheme for Enea Group. Source: own study.
Figure 6.
Example of cost account splitting scheme for Enea Group. Source: own study.
Table 1.
Main areas of Enea’s operations.
Table 1.
Main areas of Enea’s operations.
| Area of Activities | Specific Activities | In Numbers—Share in EBITDA in 2021 | In Numbers |
|---|
| mining | - -
hard coal production - -
sale of hard coal - -
securing raw material base for Enea
| PLN 798 million | - -
23.1% share of Polish thermal coal market - -
432 million tonnes of extraction potential of 4 concession areas - -
9.9 million tonnes of net coal production
|
| production | - -
electricity generation based on coal, biomass, gas, wind, hydro, and biogas - -
heat generation - -
transmission and distribution of heat - -
electricity trading
| PLN 1602 million | - -
6.3 GW total installed capacity - -
443 MW of installed RES capacity - -
26.4 TWh of total net power generation
|
| distribution | - -
provision of electricity - -
planning and ensuring expansion of distribution network, including connection of new customers - -
operation, maintenance, and repair of distribution network - -
measurement of data management
| PLN 1393 million | - -
2.7 million customers of distribution services - -
121,300 km of distribution lines including connections - -
20.3 TWh of energy supplied
|
| turnover | Retail turnover:- -
electricity and gas trading on retail market - -
product and service offerings tailored to customer needs - -
comprehensive customer service
Wholesale:- -
optimisation of portfolio of wholesale electricity and gas fuel contracts - -
activities in product markets - -
providing access
| PLN 125 million | - -
2.6 million customers - -
24.5 TWh of electricity and gas fuel sales to retail customers - -
32 customer service offices, including 1 mobile office
|
Table 2.
Key indicators for achieving Enea’s 2030–2040 targets.
Table 2.
Key indicators for achieving Enea’s 2030–2040 targets.
| Financial Indicators | Area of Operation | Specification | Indicator |
|---|
| 2030 | 2040 | 2030 | 2040 | 2030 | 2040 |
|---|
| Indicator of profitability capital (ROE) | Manufacturing | Increase in power installed in RESs | Specific CO2 (in kg CO2/MWh) |
| 6.40% | 7.1% | 1510 MW | 3580 MW | 254 | 201 |
| Indicator of profitability capital (ROA) | Distribution | SAIDI/SAIFI indicators | Index of network losses in distribution |
| 2.9% | 4.6% | 74.59
min/2.02 | 70
min/1.93 | 5.14% | 5.0% |
| Share of new EBITDA lines of business | Turnover | Market share in electricity sales | |
| 7–12% | 10–15% | 16% | 17% |
Table 3.
Renewable energy production from 2019 to 2021 in [GWh].
Table 3.
Renewable energy production from 2019 to 2021 in [GWh].
| Energy Production from RESs | 2019 | 2020 | 2021 |
|---|
| Total production from renewable energy sources, including the following: | 2279 | 2392 | 2415 |
| Enea Nowa Energia: hydroelectric power plants. | 130 | 130 | 114 |
| Enea Nowa Energia: wind farms. | 185 | 183 | 157 |
| Enea Nowa Energia: biogas plants. | 5 | 9 | 9 |
| Enea Ciepło: biomass combustion. | 204 | 255 | 227 |
| Enea Połaniec Power Plant: biomass co-firing. | 314 | 371 | 326 |
| Enea Połaniec Power Plant: biomass combustion. | 1441 | 1442 | 1582 |
Table 4.
CO2 emissions related to energy generation from 2019 to 2021 in [mg].
Table 4.
CO2 emissions related to energy generation from 2019 to 2021 in [mg].
| CO2 Emissions from Power Generation | 2019 | 2020 | 2021 | Change 2020/2021 |
|---|
| Kozienice power plant | 14,883,264 | 13,786,235 | 15,855,535 | +15% |
| Połaniec power plant | 6,751,791 | 4,555,879 | 6,030,838 | +32% |
| Bialystok Combined Heat and Power Plant | 253,522 | 174,755 | 312,696 | +79% |
| Heating plant “Zachód” (Białystok) | 12,254 | 14,588 | 18,138 | +24% |
| MEC Piła | 80,450 | 81,089 | 89,811 | +11% |
| PEC Oborniki | 13,597 | 13,490 | 15,443 | +14% |
| Leczyńska Energetyka | 44,697 | 45,263 | 53,083 | +17% |
| Biogas power plants (Enea Nowa Energia) | 5647 | 10,287 | 9235 | −10% |
Table 5.
Emission levels of sulphur dioxide (SO2), dust, and nitrogen oxides (NOx) of companies in Generation Segment in 2021.
Table 5.
Emission levels of sulphur dioxide (SO2), dust, and nitrogen oxides (NOx) of companies in Generation Segment in 2021.
| Company Name | Emission Levels [mg] |
|---|
| SO2 | Dust | NOx |
|---|
| 2020 | 2021 | 2020 | 2021 | 2020 | 2021 |
|---|
| Enea Wytwarzanie | 10,433.3 | 8792.1 | 523.2 | 447.0 | 10,450.7 | 10,728.6 |
| Enea Połaniec Power Plant | 7272.5 | 4518.2 | 378.7 | 384.4 | 5184.7 | 5060.6 |
| Bialystok Combined Heat and Power Plant | 101.0 | 217.0 | 41.0 | 37.0 | 443.0 | 495.6 |
| Heating plant “Zachód” (Białystok) | 13.6 | 17.8 | 1.0 | 0.6 | 12.8 | 15.3 |
Table 6.
The main raw materials used by the Generation Segment in the Enea Group.
Table 6.
The main raw materials used by the Generation Segment in the Enea Group.
| Fuel Type | 2020 | 2021 |
|---|
Quantity
[Thousand.t] | Cost
[PLN Million] | Quantity
[Thousand.t] | Cost
[PLN Million] |
|---|
| Hard coal | 8719 | 2143 | 10,484 | 2539 |
| Biomass | 1957 | 515 | 2033 | 465 |
| Heating oil (heavy) | 13 | 16 | 15 | 30 |
| Heating oil (light) | 6 | 15 | 7 | 23 |
| Gas [thousand m3] | 21,518 | 25 | 15,342 | 20 |
Table 7.
Waste generated [mg].
Table 7.
Waste generated [mg].
| Waste Generated | 2019 | 2020 | 2021 |
|---|
| Total weight of waste generated by Enea Group | 7,486,683 | 6,328,559 | 5,973,746 |
| Hazardous waste | 5464 | 833 | 976 |
| Non-hazardous waste | 7,481,219 | 6,327,726 | 5,972,769 |
Table 8.
Enea’s environmentally friendly investments.
Table 8.
Enea’s environmentally friendly investments.
| Investments | Implementation 2019
[PLN Million] | Implementation 2020
[PLN Million] | Implementation 2021
[PLN Million] |
|---|
| Adaptation to BAT conclusions (Połaniec Power Plant) | 115 | 103.7 | 91.6 |
| Commercial connection of wind farms (Enea Operator) | 6 | 79.2 | - |
| Installation of SCR for units 9 and 10 (Kozienice Power Plant) | 60 | 27.8 | - |
| Other environmental investments (Połaniec Power Plant) | - | 22.3 | - |
| Other environmental investments (Kozienice Power Plant) | - | 5.8 | - |
| Construction of cogeneration source in Piła (MEC Piła) | - | - | 33.4 |
| Adaptation to BAT conclusions (Kozienice Power Plant) | 31 | 27.1 | 10.4 |
| Modernisation of electrostatic precipitator K8 (Białystok) | 12 | - | - |
Table 9.
The Enea Group’s activities that qualify for the EU classification of sustainable economic activities.
Table 9.
The Enea Group’s activities that qualify for the EU classification of sustainable economic activities.
| Specification | Turnover
[PLN Thousand] | Share
[%] |
|---|
| A. Activities eligible for systematisation | 3,964,907 | 18.7 |
| Transmission and distribution of electricity | 3,135,374 | 14.8 |
| Electricity production from bioenergy | 542,108 | 2.6 |
| Electricity production from wind power | 57,432 | 0.3 |
| Hydroelectric power generation | 49,285 | 0.2 |
| Cogeneration of heat/cooling and electricity from bioenergy | 82,412 | 0.4 |
| Distribution in district heating/cooling systems | 98,296 | 0.5 |
| B. Activities which do not qualify for systematisation | 17,231,764 | 81.3 |
| Total (A + B) | 21,196,671 | 100 |
Table 10.
CAPEX eligible for systematisation.
Table 10.
CAPEX eligible for systematisation.
| Specification | Capex
[PLN Thousand]. | Share
[%] |
|---|
| A. Activities eligible for systematisation | 1,065,102 | 53.78 |
| Electricity production using photovoltaic technology | 9578 | 0.48 |
| Distribution in district heating/cooling systems | 44,111 | 2.23 |
| Cogeneration of heat/cooling and electricity from bioenergy | 4768 | 0.24 |
| Installation, maintenance, and repair of energy-efficient equipment | 2959 | 0.15 |
| Electricity production from bioenergy | 698 | 0.04 |
| Hydroelectric power generation | 4086 | 0.21 |
| Transmission and distribution of electricity | 998,903 | 50.44 |
| B. CAPEX expenditure on non-systematic activities | 915,265 | 46.22 |
| Total (A + B) | 1,980,367 | 100 |
Table 11.
OPEX eligible for systematisation.
Table 11.
OPEX eligible for systematisation.
| Specification | OPEX
[PLN Thousand]. | Share
[%] |
|---|
| A. Activities eligible for systematisation | 292,866 | 48.9 |
| Transmission and distribution of electricity | 256,897 | 42.9 |
| Hydroelectric power generation | 1843 | 0.3 |
| Electricity production from wind power | 6423 | 1.1 |
| Electricity production from bioenergy | 17,250 | 2.9 |
| Cogeneration of heat/cooling and electricity from bioenergy | 7879 | 1.3 |
| Distribution in district heating/cooling systems | 10 | 0.0 |
| Renovation of existing buildings | 2564 | 0.4 |
| B. Operating expenditure (OPEX) on activities that do not qualify for systemisation | 306,592 | 51.1 |
| Total (A + B) | 599,459 | 100 |
Table 12.
The results of the survey on the system of recording business operations in the Enea Group.
Table 12.
The results of the survey on the system of recording business operations in the Enea Group.
| | Question | Answer |
|---|
| Yes | Not | I Don’t Know |
|---|
| 1. | Does Enea Group separate environmental costs in team 5- MPK (additionally, analytically)? | X | | |
| 2. | Do the elements of the financial statements (e.g., balance sheet, income statement) separately identify information on the Group’s environmental activities? | X | | |
| 3. | Which information do you think is necessary within the framework of environmental protection for proper and efficient operations (please indicate the three most important: | | | |
| | information on the sources of financing of the assets that will be involved in the environmental measures | | | X |
| information on assets, including fixed assets, that are currently or will in the future be involved in environmental protection activities | | | X |
| information on the level of environmental expenditure | X | | |
| information on the level of environmental costs | X | | |
| information on the level of environmental protection expenditures | X | | |
| 4. | Do you report on environmental activities broken down into financial and non-financial? | X | | |
Table 13.
Changes to the cost accounting of band 4 of the chart of accounts about environmental costs.
Table 13.
Changes to the cost accounting of band 4 of the chart of accounts about environmental costs.
| Account Number | Specific Costs According to the Company’s Chart of Accounts | Analytical Account Number | Examples of Environmental Costs for a Given Cost by Type, Analytically Separated in Group 4 of the Chart of Accounts | Specification |
|---|
| 400 | Depreciation | 400 01 | environmental fixed assets | Here, the same tangible or intangible asset is used in several activities or in different sources of power generation; depreciation should be allocated and accounted for propositionally according to the accounting key and the degree of involvement of that fixed asset. For the Enea Group’s operations, it is postulated to use the straight-line method of the depreciation of fixed assets. |
| 400 02 | environmental intangible assets |
| 400 03 | other (…) |
| 401 | Consumption of materials and energy | 401 01 | materials | The measurement of the consumption of environmental materials and energy can be carried out directly or by the estimation method. It is postulated that either the actual purchase (acquisition) price or the fixed inventory price should be used, as envisaged in the Accounting Act. |
| 401 02 | energy |
| 401 03 | other (…) |
| 402 | Third-party services | 402 01 | environmental renovation services | Here, the level of environmental costs can be derived directly from accounting documents (invoices, receipts), or it can be accounted for indirectly according to the provisions of the accounting policy by the person with substantive responsibility for commissioning the service in question. |
| 402 02 | transport services |
| 402 03 | educational services |
| 402 04 | equipment services |
| 402 05 | banking services |
| 402 06 | other services: approvals, notices, land reclamation, supplies |
| 402 07 | other (…) |
| 403 | Taxes and charges | 403 01 | environmental taxes (property taxes, taxes on means of transport) | Source documentation for taxes and charges should show the type and extent of environmental pollution, as well as the rate per unit of pollution emitted. |
| 403 02 | fees (for specific water use, waste storage, air emissions, administrative stamp duties) |
| 404 | Salaries | 404 01 | for work carried out for the benefit of environmental protection (work as an educator) | Personnel costs (salaries and surcharges on these salaries) related to environmental activities should be valued on the basis of the employee’s actual contribution in this area. |
| 404 02 | contracts, assignments |
| 404 03 | the value of benefits to employees in kind or their equivalent for work carried out for the benefit of environmental protection |
| 404 04 | other (…) |
| 405 | Social security and other benefits | 405 01 | the part of social security contributions for salaries covering environmental tasks | As above. |
| 405 02 | other (…) |
| 406 | Other costs by type | 406 01 | representation and advertising costs | These costs should be charged to the period, month of account on the basis of source documents (invoices, declarations, accounting orders, payment orders or other internal accounting documents). |
| 406 02 | business trips |
| 406 03 | sectoral allowances |
| 406 04 | property insurance |
| 406 05 | environmental rationalisation and invention costs |
| 406 06 | other (…) |
| 490 | Settlement of costs by type | | |
Table 14.
The organisation of the chart of accounts according to the ICC about environmental costs.
Table 14.
The organisation of the chart of accounts according to the ICC about environmental costs.
| Symbol MPK | Place of Costs (MPK) |
|---|
| 12 | Currently | Amended |
|---|
| Example 1 | 12 1XXX—distribution costs | 12 1XXXA—environmental distribution costs |
| 12 3XXX—customer service costs and CUW contracts | 12 3XXXA—environmental costs for customer services and CUW contracts |
| 12 4XXX—overheads of units | 12 4XXXA—environmental overheads of units |
| 12 5XXX—IT costs | 12 5XXXA—IT costs |
| 12 6XXX—transport costs | 12 6XXXA—environmental transport costs |
| 12 8000—general administrative expenses | 12 8000A—environmental overheads |
| Example 2 | 12 800—general administrative expenses | 12 800A—environmental overheads
12 800a—environmental overheads—salaries of employees involved in environmental activities
12 800b—environmental overheads—bonuses for employees involved in environmental activities
12 800c—environmental travel expenses
12 800d—environmental training costs for employees |
Table 15.
The overall level of integrated reporting—a proposal for the structure of the integrated report for the Enea Group.
Table 15.
The overall level of integrated reporting—a proposal for the structure of the integrated report for the Enea Group.
| LR | Enea Group Business Area/Activities and Processes | Components of an Integrated Report | |
|---|
| FP | NONFP |
|---|
| S | AS | S | AS | Total |
|---|
| I | Financial—financial statements (balance sheet, income statement, cash flow, notes) | 1 | 5 | 1A | 2 | 11 |
| 1B | 2 |
| 1C | 2 |
| II | Environmental—environmental costs and measures | 2 | 5 | 2A | 3 | 11 |
| 2B | 3 |
| III | Social—external stakeholders | 3 | 5 | 3A | 2 | 11 |
| 3B | 2 |
| 3C | 2 |
| IV | Employee | 4 | 5 | 4A | 3 | 11 |
| 4B | 3 |
| V | Risks | 5 | 5 | 5 | 3 | 11 |
| 5A | 3 |
| | Total | | 25 | | 30 | 55 |
Table 16.
The detailed level of integrated reporting—a proposal for the structure of the integrated report for the Enea Group.
Table 16.
The detailed level of integrated reporting—a proposal for the structure of the integrated report for the Enea Group.
| Part of the Report | AS | Basic Elements of the Integrated Report |
|---|
| Level I—Enea Group business area/financial activities and processes—financial statements |
| Financial | 1 | 5 | - -
assets and sources of financing of assets financial results and preliminary profit distribution - -
costs and revenues, including those covering environmental protection activities - -
financial aspects of entity’s side activities, donations, and in-kind contributions of fixed assets - -
economic and financial analysis - -
indicator analysis
|
| Non-financial | 1A | 2 | - -
non-financial (descriptive) relationships between Enea Group’s operational activities and areas of other activities, including environment - -
preferred business model - -
internal procedures and guidelines
|
| 1B | 2 | - -
non-financial aspects relating to entity’s side activities, donations, and in-kind contributions of fixed assets - -
indirect operating costs, including environmental ones
|
| 1C | 2 | - -
work of employees involved in environmental activities including surcharges, bonuses, and rewards - -
involvement of human resources in innovative activities, inventiveness
|
| Level II—Environmental—environmental costs and measures |
| Financial | 2 | 5 | - -
level of costs involved in environmental protection measures, including quality improvements - -
level of costs and expenses of applying new technologies and investments that reduce consumption of natural resources and minimise creation of nuisance products
|
| Non-financial | 2A | 3 | - -
description of measures and processes for saving environment and maintaining its quality - -
practices and actions for conservation of biodiversity and ecosystems
|
| Non-financial | 2B | 3 | - -
environmental activities in cooperation with environment
|
| Level III—Social—external stakeholders |
| Financial | 3 | 5 | - -
level of costs and expenditures in improving quality of life of citizens - -
investment costs - -
costs of energy losses and unavailability, downtime, failures - -
costs of land development from new investment projects
|
| Non-financial | 3A | 2 | - -
fulfilling educational function of society - -
identifying good practices for responsible use of environment in everyday life, e.g., according to principles of circular economy, use of renewable resources
|
| Non-financial | 3B | 2 | - -
publications, workshops, research, customer communication channels
|
| Non-financial | 3C | 2 | - -
involvement of local communities in promoting marketing and narrative of Enea Group’s activities including RESs
|
| Level IV—Employee |
| Financial | 4 | 5 | - -
work of employees involved in environmental activities including surcharges, bonuses, and rewards (their salaries, emoluments, working equipment) - -
financial incentives linked to environmental activities - -
costs of training, business trips, and post-graduate studies
|
| Non-financial | 4A | 3 | - -
employment structure, accidents at work, privileges, non-wage incentives
|
| Non-financial | 4B | 3 | - -
organisation of employee’s time with their families, excursions for employees’ families, picnics, excursions, leisure centres - -
activities for building ethical work culture and counteracting discrimination - -
activities that contribute to building organisational culture based on respect and mutual trust between employees, co-workers, and superiors
|
| Level V—Risks |
| Financial | 5 | 3 | - -
financial part
|
| Non-financial | 5A | 3 | - -
operational part
|
| Disclaimer/Publisher’s Note: The statements, opinions and data contained in all publications are solely those of the individual author(s) and contributor(s) and not of MDPI and/or the editor(s). MDPI and/or the editor(s) disclaim responsibility for any injury to people or property resulting from any ideas, methods, instructions or products referred to in the content. |
© 2025 by the authors. Licensee MDPI, Basel, Switzerland. This article is an open access article distributed under the terms and conditions of the Creative Commons Attribution (CC BY) license (https://creativecommons.org/licenses/by/4.0/).


 ,
, 


