Article

Numerical Analysis of Diesel Engine Combustion and Performance with Single-Component Surrogate Fuel

by
Mehedi Hassan Pranta
and
Haeng Muk Cho
*
Department of Mechanical Engineering, Kongju National University, Cheonan 31080, Republic of Korea
*
Author to whom correspondence should be addressed.
Energies 2025, 18(5), 1082; https://doi.org/10.3390/en18051082
Submission received: 26 January 2025 / Revised: 20 February 2025 / Accepted: 21 February 2025 / Published: 23 February 2025

Abstract

:
Compression ignition engines are widely recognized for their reliability and efficiency, remaining essential for transportation and power generation despite the transition toward sustainable energy solutions. This study employs ANSYS Forte to analyze the combustion and performance characteristics of a direct-injection, single-cylinder, four-stroke engine fueled with an n-heptane-based diesel surrogate. The investigation considers varying SOI timings (−32.5°, −27.5°, −22.5°, and −17.5° BTDC) and EGR rates (0%, 15%, 30%, 45%, and 60%). The simulation incorporates the RNG k-ε turbulence model, the power-law combustion model, and the KH-RT spray breakup model. The results indicate that the optimal peak pressure and temperature occur at an SOI of −22.5° BTDC with 0% EGR. Advancing SOI enhances oxidation, reducing NOx and CO emissions but increasing UHC due to delayed fuel–air mixing. Higher EGR rates lower in-cylinder pressure, temperature, HRR, and NOx emissions while elevating CO and UHC levels due to oxygen depletion and incomplete combustion. These findings highlight the trade-offs between combustion efficiency and emissions, emphasizing the need for optimized SOI and EGR strategies to achieve balanced engine performance.

1. Introduction

Internal combustion engines have long been the dominant power source in the transportation sector, with hydrocarbons serving as the primary fuel for over a century. The increasing demand for heavy-duty vehicles is expected to drive diesel consumption at a higher rate than gasoline. However, advancements in engine efficiency—achieved through downsizing, turbocharging, and reductions in vehicle weight—are anticipated to mitigate the growth in gasoline consumption [1]. The rapid expansion of the automotive industry and the rising number of vehicles have significantly contributed to elevated exhaust gas emissions, exacerbating environmental concerns and accelerating the depletion of fossil fuel reserves [2,3]. In response to stringent emissions regulations and the growing emphasis on ecological sustainability, the engine industry has intensified research into alternative energy sources for next-generation powertrains [4,5].
Combustion characteristics and emission profiles are largely dictated by engine design and operational parameters, such as pressure dynamics, fuel spray models, and injection timing, which play a pivotal role in overall engine performance [6,7]. To address future demands for high-efficiency and low-emission combustion systems, researchers have explored various advanced combustion strategies. Among these, low-temperature combustion (LTC) has emerged as a promising approach, integrating several modern combustion techniques to achieve significant NOx reductions. However, LTC requires a high activation energy threshold, posing challenges in its practical implementation [8,9].
In the automotive sector, exhaust gas recirculation (EGR) has gained popularity due to its ability to significantly lower engine emissions, especially NOx emissions, a dangerous environmental pollutant that must be minimized [10,11]. Part of the engine’s exhaust gasses is diverted and reintroduced into the intake mechanism to properly dilute the entering air–fuel mixture [12]. Instead of depending exclusively on aftertreatment systems, this strategy seeks to reduce pollutant production during the combustion process, which has been investigated as an alternative to conventional post-treatment techniques [13]. Recirculation of exhaust gasses has been widely recognized as an effective strategy for reducing engine emissions. By introducing recirculated exhaust gasses into the intake air, the overall oxygen concentration is reduced, leading to a lower peak combustion temperature [12]. Since NOx formation is highly temperature-dependent, this reduction in peak temperature significantly inhibits its production [13]. The primary objective of the EGR system is not only to decrease combustion temperatures but also to ensure they remain below 1500 °C (1750 K), a critical threshold beyond which NOx formation occurs through a chain reaction mechanism. By maintaining combustion temperatures below this limit, EGR effectively mitigates NOx emissions while contributing to improved environmental performance. Moreover, adding ineffective exhaust gasses to the blend of air and fuel can produce more uniform combustion surroundings, which may help lower particulate matter and other controlled pollutants that are generally linked to concentrated regions of higher temperatures and substantial air–fuel proportions [12,14]. The EGR has been widely recognized for its ability to enhance engine efficiency while significantly reducing NOx emissions. As the EGR rate increases, NOx emissions decrease due to lower combustion temperatures, contributing to improved environmental performance [11,15,16]. However, several studies have reported that EGR reduces the oxygen concentration in the intake air, leading to incomplete combustion and a marginal decline in brake power and brake thermal efficiency [17]. Additionally, the increased presence of inert gasses within the combustion chamber elevates specific fuel consumption [18]. Nevertheless, recent research indicates that optimizing EGR rates and incorporating alternative fuels can effectively counteract efficiency losses while maintaining the NOx reduction benefits [19].
The combustion and performance characteristics of an engine are profoundly influenced by the timing of fuel injection, commonly referred to as the start of injection (SOI). Modifying the timing of both main and pilot injections significantly affects engine efficiency as well as emissions of carbon monoxide (CO), nitrogen oxides (NOx), and unburned hydrocarbons (HCs), as it alters multiple aspects of combustion dynamics [20]. One of the primary advantages of direct fuel injection over conventional port-fuel injection systems is the precise control it offers over injection timing, enabling more effective regulation of fuel–air mixture formation and combustion processes [21]. Additionally, variations in injection angles have been shown to influence combustion temperature and in-cylinder pressure, further impacting emissions of HC, NOx, and CO [22].
Direct injection technology provides several key benefits, including enhanced volumetric efficiency, reduced heat losses, and the ability to operate at higher compression ratios, all of which contribute to improved engine performance and fuel efficiency. As a result, the optimization of fuel injection strategies has become a critical research area for both academics and original equipment manufacturers (OEMs). Particular attention has been given to leveraging direct injection for advanced combustion techniques, such as stratified charge direct injection, which aim to maximize efficiency while minimizing pollutant formation [23]. The precise timing of fuel injection plays a crucial role in shaping combustion behavior by influencing fuel spray dispersion, turbulence interactions, and in-cylinder air motion, all of which directly impact combustion efficiency and emissions [23].
A comprehensive understanding of in-cylinder flow dynamics and fuel–air mixture formation is essential for optimizing combustion characteristics and minimizing emissions [24]. While blending alternative fuels with diesel or gasoline can effectively reduce emissions, it often results in a slight compromise in brake power output [25]. Diesel and gasoline fuels consist of hundreds of chemical compounds, making it impractical to model their combustion behavior with a complete reaction mechanism (RM) that accounts for all chemical species. This challenge extends to diesel substitutes as well. Consequently, surrogate fuels—simplified fuel models that emulate the key physicochemical properties of real fuels—are widely used to facilitate combustion research [24].
Single-component surrogates such as n-dodecane and n-heptane are well-characterized in terms of their physicochemical properties, making them valuable in studies related to spray atomization, chemical kinetic modeling, and combustion simulation [26]. In numerous combustion investigations, an n-heptane-based surrogate has been widely used to reproduce the characteristics of diesel fuel and has generated a great deal of scientific interest. Diesel fuel combustion’s varied characteristics can lead to unfavorable engine performance and adverse environmental consequences, including loud knocking and high emissions of particulate matter and nitrogen oxides [27]. An n-heptane-based surrogate is widely accepted for diesel engine simulations due to its well-defined combustion characteristics, simplified chemical kinetics, and computational efficiency [28]. Diesel is a complex mixture of hydrocarbons, making multi-component surrogates more representative but computationally demanding. n-heptane (C7H16) provides a practical alternative by closely approximating key diesel combustion properties such as autoignition delay and ignition temperature [29]. With a cetane number of approximately 56, it effectively replicates ignition behavior, making it useful for autoignition and combustion studies [30]. Furthermore, its well-documented chemical reaction mechanisms enable reduced kinetic models, allowing for faster, more accurate numerical simulations compared to multi-component surrogates, which require solving intricate reaction pathways [31]. Despite these advantages, n-heptane has notable limitations, primarily its inability to capture the aromatic and cycloalkane components of real diesel, leading to discrepancies in soot formation and emissions predictions [32]. Additionally, unlike diesel fuels, which exhibit a distribution of ignition delays due to their diverse hydrocarbon composition, n-heptane follows a single ignition delay behavior, making multi-component surrogates more suitable for advanced combustion strategies like low-temperature combustion [33]. While these limitations restrict its applicability for precise emissions modeling, n-heptane remains highly valuable in engineering applications where computational efficiency and fundamental ignition studies are prioritized. It is widely employed in computational fluid dynamics (CFD) simulations and chemical kinetics modeling due to its well-established reaction mechanisms and its ability to approximate ignition delay and flame propagation under high-pressure diesel engine conditions [30]. However, for real-world diesel performance optimization and emissions analysis, more complex surrogates incorporating aromatics and cycloalkanes may be preferable [34]. Despite this, n-heptane remains a practical and widely accepted surrogate for diesel engine simulations, particularly when prioritizing computational efficiency and fundamental combustion studies. This numerical study aims to analyze the behavior of a diesel engine under varying SOI timing and EGR conditions while ensuring computational efficiency by using n-heptane-based surrogate fuel.
The study considers EGR levels from 0% to 60% to comprehensively evaluate its impact on combustion characteristics and emissions. While excessive EGR (>45%) can introduce combustion instability due to oxygen dilution and lower in-cylinder temperatures, investigating a wide range of EGR rates provides valuable insights into the transition from stable to unstable combustion regimes [35,36]. Additionally, high EGR rates significantly influence HC and CO emissions due to incomplete oxidation, making it essential to quantify the trade-offs between NOx reduction and combustion efficiency [37]. By extending the analysis up to 60% EGR, this study aims to establish critical limits beyond which combustion performance deteriorates, contributing to a more comprehensive understanding of the practical feasibility of high EGR applications in diesel engines.
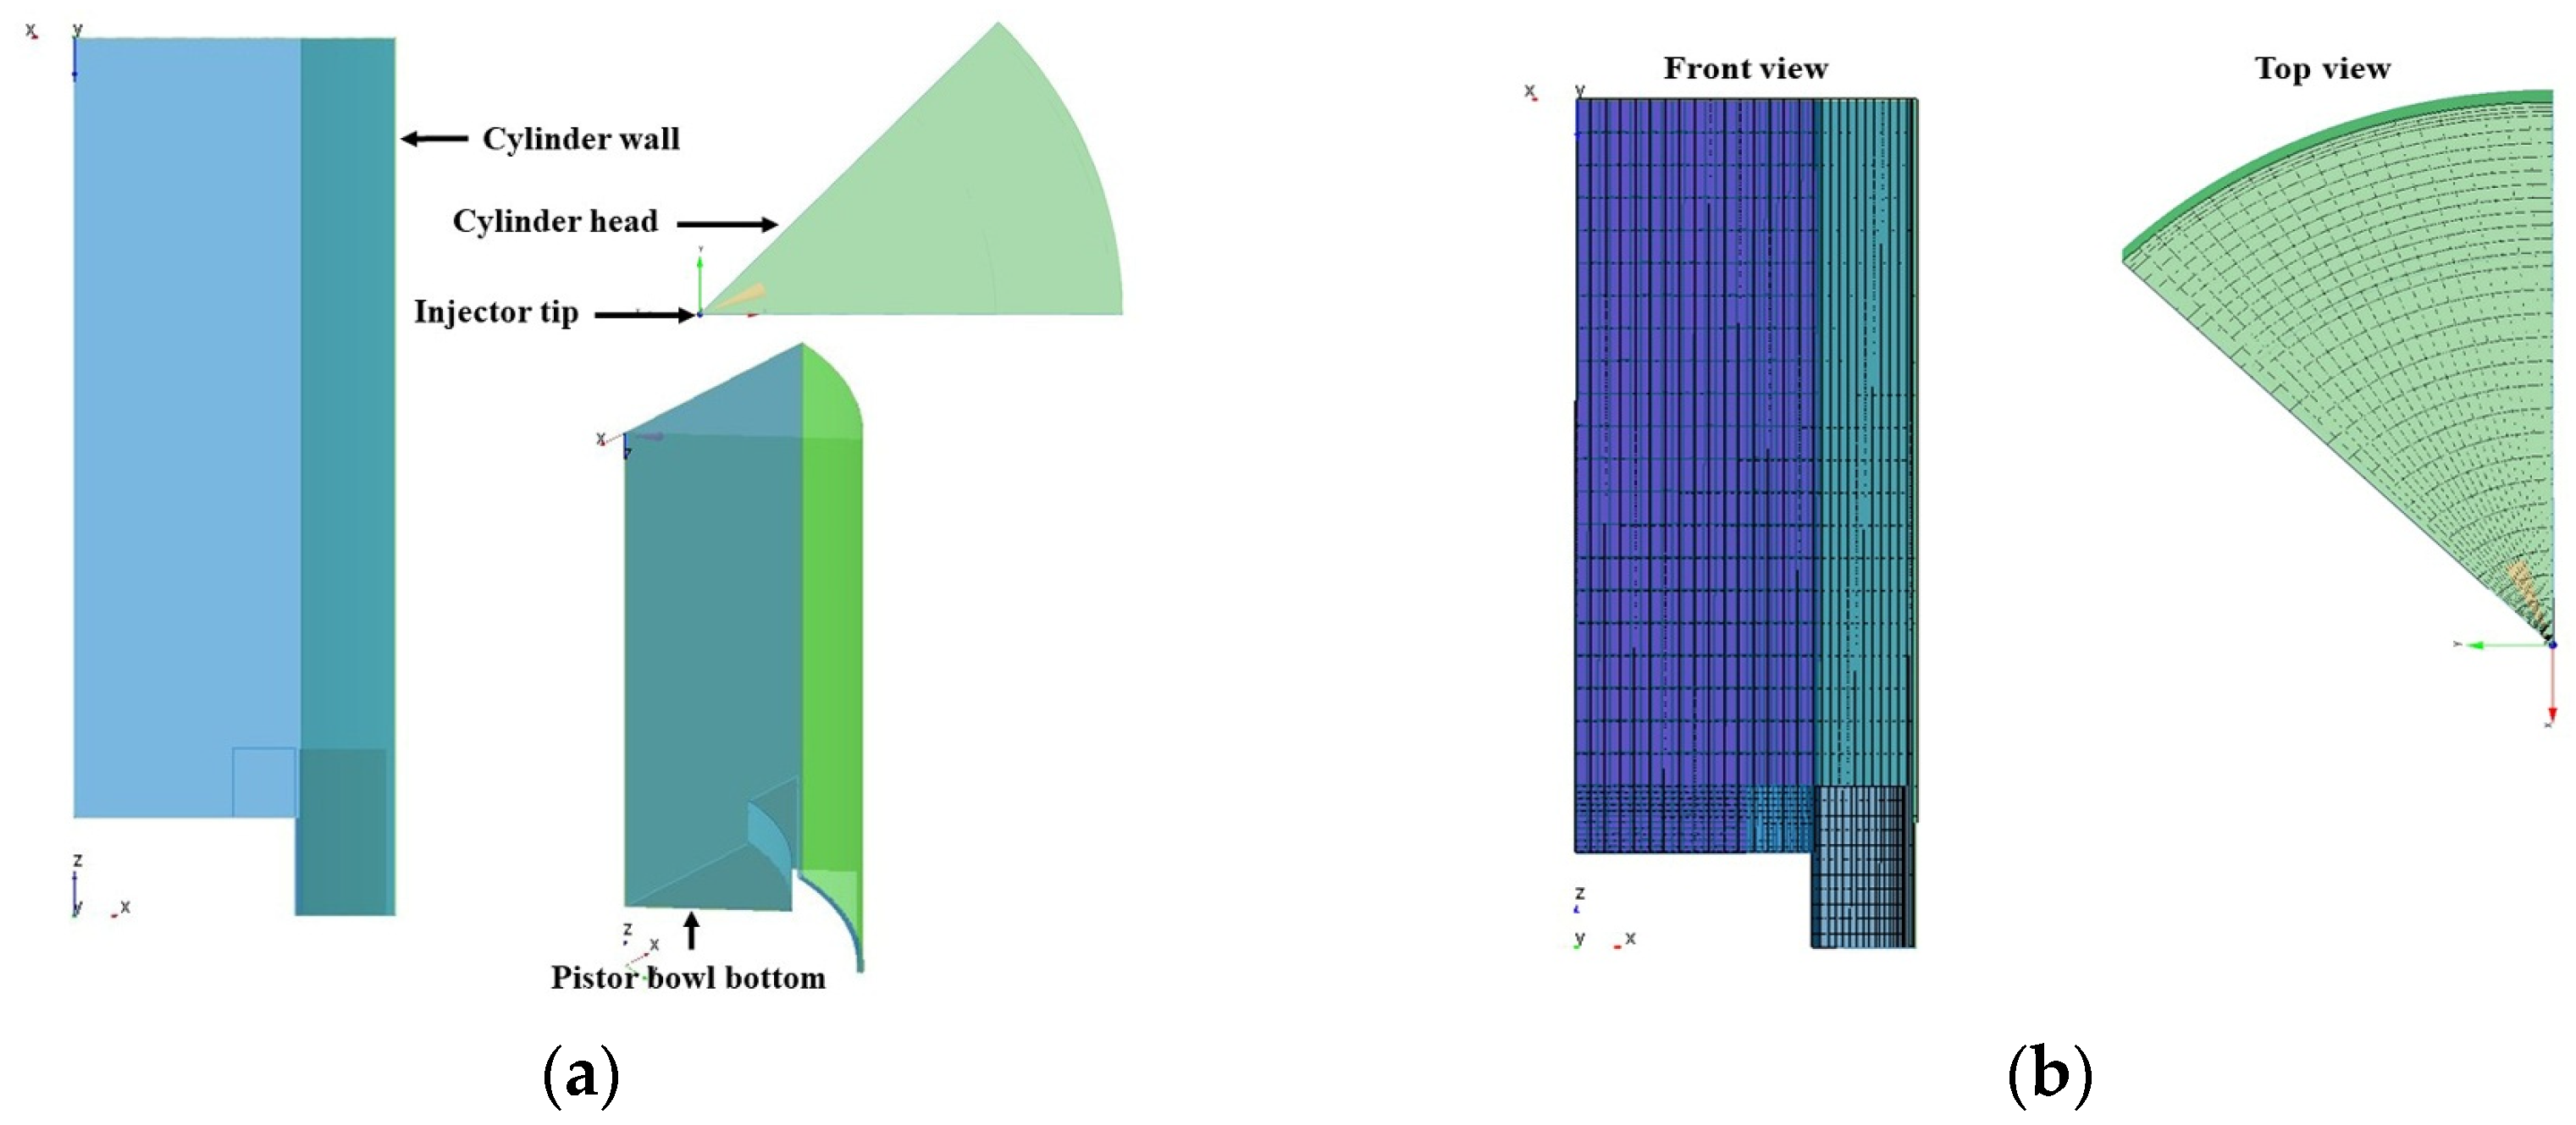
CFD simulation has been used to continue the analysis since numerical analysis has become a valuable tool for studying and developing engine control techniques because of its greater flexibility and cheaper cost. It plays a crucial role in combustion research by providing insights into complex processes such as fluid flow, heat transfer, and chemical reactions [38]. The simulation used ANSYS 2022 R1 Forte, one of the most excellent tools for analyzing engine efficiency and emissions, to make optimization decisions [39]. This application can be used to analyze several engine data, including temperature, fuel consumption, in-cylinder pressure, and emissions of HC, NOx, and CO. This software simulates internal combustion engine combustion procedures by combining liquid fuel spray, turbulent gas dynamics, and comprehensive chemical kinetics in a highly effective way [40].

2. Materials and Methods

2.1. Simulation Setup

The operation of an IC engine was simulated using the FORTE 2022 R1 software, developed by ANSYS. This software integrates CFD for modeling liquid fuel spray, turbulent gas dynamics, and transport phenomena with an industry-standard chemical kinetics solver (CHEMKIN files). The inclusion of CHEMKIN ensures accurate resolution of chemical reaction mechanisms and thermodynamic properties, enhancing the fidelity of combustion simulations.
In this study, a Cummins N-14 single-cylinder diesel engine was utilized. The engine configuration consisted of one exhaust valve and two intake valves, with direct injection implemented in a quiescent combustion chamber. The detailed engine specifications are presented in Table 1 [41].
Diesel fuel combustion was modeled using a simplified n-heptane chemical mechanism. The chemical kinetics were represented using a standard ANSYS Chemkin Pro chemistry set, incorporating a semi-detailed n-heptane mechanism comprising 36 species and 74 reactions [42]. The key chemical properties of this n-heptane-based surrogate fuel are summarized in Table 2 [43].
The lower density of n-heptane (684 kg/m3) compared to conventional diesel (850 kg/m3) poses significant challenges for high-pressure common rail systems, such as those in Cummins N-14 DI engines operating at ~1000 bar, particularly in maintaining consistent volumetric energy delivery and equivalence ratios. To address these challenges, this study employed ANSYS Forte simulations with meticulously calibrated injection parameters, including pressure and duration, to ensure accurate fuel mass delivery and combustion modeling. While the reduced density of n-heptane could theoretically increase leakage risks in diesel-optimized fuel systems, the simulations assumed idealized sealing conditions, a well-established approach in surrogate fuel studies that effectively isolates combustion dynamics from mechanical inefficiencies. This methodology enables a robust representation of spray development, mixture formation, and combustion phasing, providing critical insights into the adaptability of common rail systems to alternative fuel properties without compromising analytical fidelity.

2.2. Governing Equations

Internal combustion engines utilize both the air–fuel mixture before combustion and the burned byproducts after combustion as working fluids. To simulate the turbulent reacting flows in diesel engines, ANSYS Forte was employed, incorporating turbulent flows governed by the Navier–Stokes Equation with chemical blending and reaction. The Eulerian-Lagrangian formulation method was applied to model reactive spray, a key characteristic of diesel engine combustion [44]. The RNG k-ε turbulence model was selected due to its capability to accurately depict turbulent transport in highly sheared circulatory flows at a lower computational cost [45]. This model enhances estimations of swirling and recirculating flows for spray and combustion simulations by incorporating an additional component into the dissipation rate equation, improving precision in highly strained flows [46]. However, while the RNG k-ε model is more accurate than the standard k-ε model, it struggles with identifying significant anisotropic turbulence and compressibility effects, which can be critical in transient diesel combustion scenarios. Alternative turbulence models, such as Large Eddy Simulation (LES) and the Reynolds Stress Model (RSM), have demonstrated superior accuracy in analyzing complex flow systems, though at a significantly higher computational cost [47].
To accurately capture flame propagation dynamics, the G-equation combustion model was utilized, while the KH-RT droplet breakup model was applied to simulate the atomization and breakup of diesel fuel spray, ensuring a realistic representation of spray-induced turbulence. Additionally, the Han–Reitz heat transfer model was implemented to enhance the accuracy of in-cylinder heat transfer predictions and thermal loss estimations [48]. To strike a balance between computational efficiency and predictive accuracy, a simplified chemical kinetics model based on an n-heptane single-fuel surrogate was used, incorporating 36 species and 74 reactions. This approach significantly reduced computational costs while preserving critical combustion characteristics. However, the simplification of reaction pathways may introduce discrepancies in ignition delay, flame speed, and pollutant formation, particularly for emissions such as NOx and soot [49]. A more detailed multi-step reaction mechanism, although computationally demanding, could improve forecasting accuracy by accounting for intermediate species and complex oxidation pathways [50].

2.2.1. Eulerian Phase

The fuel’s vapor phase and the surrounding air are both included in the Eulerian phase. The Navier–Stokes equations of mass, momentum, and energy conservation represent the motion of the Eulerian phase. Equation (1) is applied for mass conservation:
ρ v t + ρ v u i x i = S m ,
where ρ v is the steam density and u i represents the Eulerian velocity. S m does droplet evaporation derive the source. This phrase makes the link between the Eulerian and Lagrangian phases possible. Using the term origin, the mass dissipated throughout the liquid phase’s evaporation can be added to the Eulerian phase.
Equation (2) is utilized for the momentum conservation:
ρ u t + ρ u u i x i = p x i + τ i j x i + S ,
The stress tensor τ i j is given by Equation (3):
τ i j = 2 μ S i j 2 3 μ S k k δ i j = μ u j x i + u i x j 2 3 u k x k δ i j ,
where δ i j represent as the Kronecker symbol.
Equation (4) is used for energy conservation:
ρ v e t t + ρ v e t u j x j = p u j x j + τ i j u i x j q i x j + S e ,
Heat flux q i and e t are calculated through Equations (5) and (6).
e t = p γ ν 1 + 1 2 u i u i ,
q i = k v T x j ,
where γ ν is an adiabatic index of gas and k v represents the thermal conductivity index of gas. S e is the inverse of heat change due to evaporation and conduction.

2.2.2. Lagrangian Phase

The liquid phase of the fuel is contained in the Lagrangian phase. Transfer parameters allow the two phases to be linked together, with this phase imposed on top of the Eulerian phase.
d u l d t = F T u v u l + F M V + g ρ l ρ v ρ l ,
Equation (7) represents the conservation of momentum where F T is the drag force, F M V is virtual mass. These can be solved using Equations (8) and (9)
F T = 18 μ v C D R e r 24 1 ρ l d l 2 ,
F M V = 1 2 ρ r ρ l d d t u v u l ,

2.2.3. Standard k-ε Model

A semi-empirical method, the k-ε model assumes that the flow is entirely turbulent and particle viscosity has little effect. This framework determines the turbulent kinetic energy k and its dissipation rate ε separately using two transport equations [44]. The model works well in several turbulent scenarios and is stable and computationally effective. Equations (10) and (11) represent the transport equations of k and ε.
ρ ¯ k ~ t + ρ ¯ u ~ k ~ = 2 3 ρ ¯ u ~ u ~ + σ ¯ Γ : u ~ + μ + μ T P r k k ~ ρ ¯ ϵ ~ + W ¯ ˙ s
ρ ¯ ε ~ t + ρ ¯ u ~ ε ~ = 2 3 C ε 1 C ε 3 ρ ¯ ε ~ u ~ + v + v T P r ε ε ~ + ε ~ k ~ C ε 1 σ ¯ Γ : u ~ C ε 2 ρ ¯ ε ~ + C s W ¯ ˙ s
Here, P r k , P r ε , C ε 1 , C ε 2 , C ε 3 are constants of the model and W ¯ ˙ s represents the negative rate of the turbulent eddies of dispersing spray droplets.

2.2.4. RNG k-ε Model

The Reynolds Average Navier–Stokes (RANS) is a time-averaged equation and can be expressed as in Equation (12) [45].
ρ ¯ ε ~ t + ρ ¯ u ~ ε ~ = 2 3 C ε 1 C ε 3 ρ ¯ ε ~ u ~ + v + v T P r ε ε ~ + ε ~ k ~ C ε 1 σ ¯ Γ : u ~ C ε 2 ρ ¯ ε ~ + C s W ¯ ˙ s ρ ¯ R c
R can be defined from the following Equation (13)
R = C μ η 3 1 η η 0 ε ~ 2 1 + β η 3 k ~ ,
where η can be derived from Equation (14)
η = S k ~ ε ~ ,
Scalar quantity S can be derived from Equation (15)
S = 2 S ¯ : S ¯ ,
S ¯ represents the tensor of the mean strain rate, which can be derived from Equation (16)
S ¯ = 0.5 u ~ + u ~ T ,
In the ANSYS Forte model, constant values P r k , P r ε , C ε 1 , C ε 2 , C ε 3 were modified to account for the compressibility effect [45]. Equations (17)–(19) represent the constants’ modification.
C ε 3 = 1 + 2 C ε 2 3 m n 1 + 1 δ 6 C μ C η η 3 ,
where m = 0.5, n = 1.4 for an ideal gas
R = η 1 η η 0 1 + β η 3 ,
With
δ = 1   i f   u ~ < 0 0   i f   u ~ > 0 ,
With this method, the value of C ε fluctuates between −0.9 and 1.72621, and ANSYS Forte is automatically calculated based on the model’s other constant specifications and flow circumstances. Table 3 shows the values of constants in both the standard k-ε model and the RNG k-ε model.

2.2.5. Turbulent Flame Speeds

The flame front and flame position are tracked using a Favre-averaged G-equation. Throughout combustion, the unburned zone’s flame front has a G-equation of zero-G (x, t) < 0, but the burnt zone has a G (x, t) > 0 [51]. Equations (20)–(23) can be written as follows to calculate the flame speed [52,53].
G ~ t + u ~ u v e r t e x G ~ = ρ ¯ u ρ ¯ b S T O G ~ D T κ ~ G ~ ,
G n 2 ~ t + u ~ G n 2 ~ = = ρ ¯ u ρ ¯ b D T = G n 2 ~ + 2 D T G ~ 2 C S ε ~ k ~ G n 2 ~ ,
Here, = represents the tangential gradient operator, u fluid velocity, u v e r t e x is the moving vertex velocity, ρ ¯ u and ρ ¯ b , respectively, denote the average densities of the unburned and burned blends. k ~ is the Favre mean flame front curvature and D T denotes turbulent diffusivity. In the G-equation, S T O , the turbulent flame can be derived from the following equation.
S T O S L O = 1 + I P a 4 b 3 2 l I 2 b 1 l F + a 4 b 3 2 l 1 2 b 1 l F 2 + a 4 b 3 2 u ´ l I S T O l F 1 / 2 ,
where C S , a 4 , b 1 , b 3 are model constants, laminar flame thickness, and the turbulence integral length scale are, respectively, shown by l I , and l F . The laminar flame speed S L O can be derived from the following equation.
S L O = S L ,     r e f O T u T u , r e f α p p r e f β F d i l ,
Here, r e f is denoted as the reference condition, which is 1 atm and 298 K. F d i l represents factor for the diluent’s effect.

2.2.6. Injection Model

The spray division is captured using the KH-RT spray model [51]. Equations (24) and (25) represent the KH-RT spray model, where A K H is the wavelength and Ω K H is the rate of increase in the fastest-growing wave.
A K H = 9.02 r 0 1 + 0.45 Z 1 + 0.4 T a 0.7 1 + 0.865 W e 1.67 0.7 ,
Ω K H = 0.34 + 0.38 W e 1.5 1 + Z 1 + 1.4 T 0.6 σ ρ l r 3 ,

2.2.7. Exhaust Gas Recirculation

The exhaust gas recirculation (EGR) percentage can be calculated using Equation (26) [54].
% o f   E G R = m E G R m a + m f ,
where m E G R , m a , and m f respectively represent the mass of EGR, mass of air, and mass of fuel.
Balanced stoichiometric combustion reaction for n-heptane with air is shown in Equation (27).
C 7 H 16 + 11 ( O 2 + 3.76 N 2 ) = 7 C O 2 + 8 H 2 O + 41.36 N 2
Molar mass of C7H16 is 100 g/mol.
Equation (28) shows the stoichiometric air–fuel ratio and for n-heptane it is 15.1.
A F R = M a s s   o f   a i r M a s s   o f   f u e l
Mass of air, m a is 15.1 m f , then total mass of air and fuel is 16.1 m f .
Using Equation (26), mass of EGR can be calculated. On the other hand, the mass of EGR is the sum of the masses of CO2, H2O, O2, and N2. Consequently, the value of mass of fuel, m f can be obtained.

2.3. Computational Domain and Meshing

In ANSYS Forte, the Sector Mesh Generator is employed to construct the computational geometry required for simulations, optimizing mesh efficiency and reducing computational costs. Given the combustion chamber’s design, which features eight fuel injection holes, the computational domain is divided into eight periodic sectors to enhance simulation accuracy while minimizing computational demand. The 45-degree sector model is generated based on key engine parameters, including bore, stroke, crevice width, and squish. Additionally, the engine bowl geometry is utilized to define the combustion chamber topology, ensuring an accurate representation of in-cylinder flow and combustion dynamics. Figure 1 provides a visualization of the 3D combustion chamber geometry and the mesh layout of the computational domain.
Ansys Forte software employs an immersed boundary approach to generate real-time Cartesian volume meshes, which are automatically updated at each piston position based on specified criteria and refinement parameters. When no mesh refinement is applied, the global mesh size determines the background mesh resolution. Mesh refinement enhances surface definition and computational accuracy in critical regions, adapting dynamically to parameters such as velocity and temperature. Although finer meshes improve accuracy, they demand higher computational resources, necessitating a balance between precision and efficiency. To evaluate mesh sensitivity, six different grid resolutions were tested under identical boundaries and initial conditions. Table 4 presents a comparison of the cell numbers and their corresponding maximum pressure and temperature.
Considering the computational time with 17,619 cells, it has considerable capacity for ensuring grid-independent solutions.

2.4. Boundary Conditions and Numerical Parameters

Boundary conditions play a crucial role in defining the model’s scope and ensuring the accurate representation of physical phenomena in computational simulations. They explain the effects of these models before going into detail about new behaviors and connecting models from various physics theoretical frameworks. The boundary conditions employed in this study are detailed in Table 5. To match with the injection requirement for the cylinder displacement and proper air–fuel mixing, 53.5 mg of fuel was injected into the combustion chamber [55].
Additionally, various numerical parameters essential for the simulation setup are presented in Table 6.

2.5. Model Validation

The numerical simulation was performed using ANSYS Forte, and the model was validated to ensure the reliability and accuracy of the obtained results. For validation, the simulated data from the current study was compared with findings from existing literature. Figure 2 illustrates the simulation outcomes for the n-heptane combustion process, providing a comparative analysis of in-cylinder pressure between the present study and previously published data, which demonstrate sufficient consistency. Approximately 2.47% [56], 1.18% [57], 2.12% [58], and 6.46% [24] variation in maximum pressure have been identified compared to the current study, indicating that the current model can be used for additional analysis.

3. Result and Discussion

This study provides a comprehensive evaluation of engine performance and combustion characteristics for an n-heptane-based diesel surrogate, focusing on variations in fuel injection timing and EGR. The SOI is a critical parameter, as it directly influences combustion initiation, emissions, and overall engine performance. Optimizing injection timing can enhance these characteristics, leading to a more efficient combustion process.
EGR is a widely adopted technique for reducing NOx emissions by recirculating a portion of exhaust gasses into the intake air before combustion. The study examines key in-cylinder parameters, including pressure, temperature, heat release rate, CO emissions, unburned hydrocarbons, and NOx emission index (EINOx), across different crankshaft angles. These parameters were analyzed under varying SOI and EGR conditions to assess their impact on engine behavior.
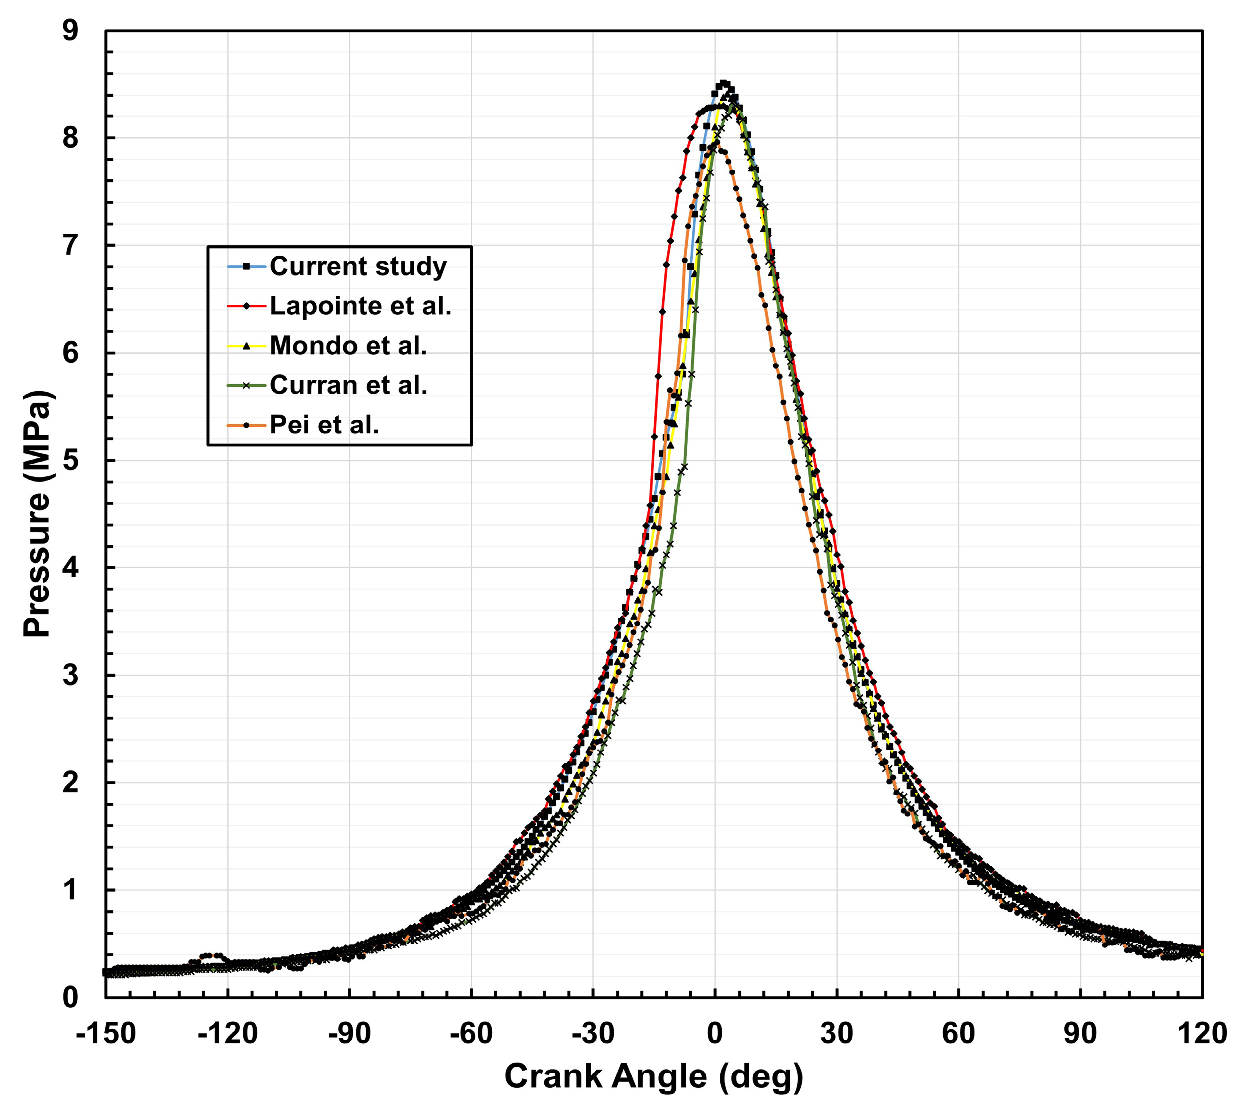
For model validation against the existing literature, the SOI and EGR values were set at −22.5° crank angle before the top dead center (BTDC) and 0%, respectively, in the current study. These conditions serve as the reference case for further analysis involving different SOI and EGR levels.

3.1. In-Cylinder Pressure and Temperature

In an internal combustion engine, in-cylinder pressure and temperature vary with crank angle due to changes in cylinder volume, combustion, and heat transfer.
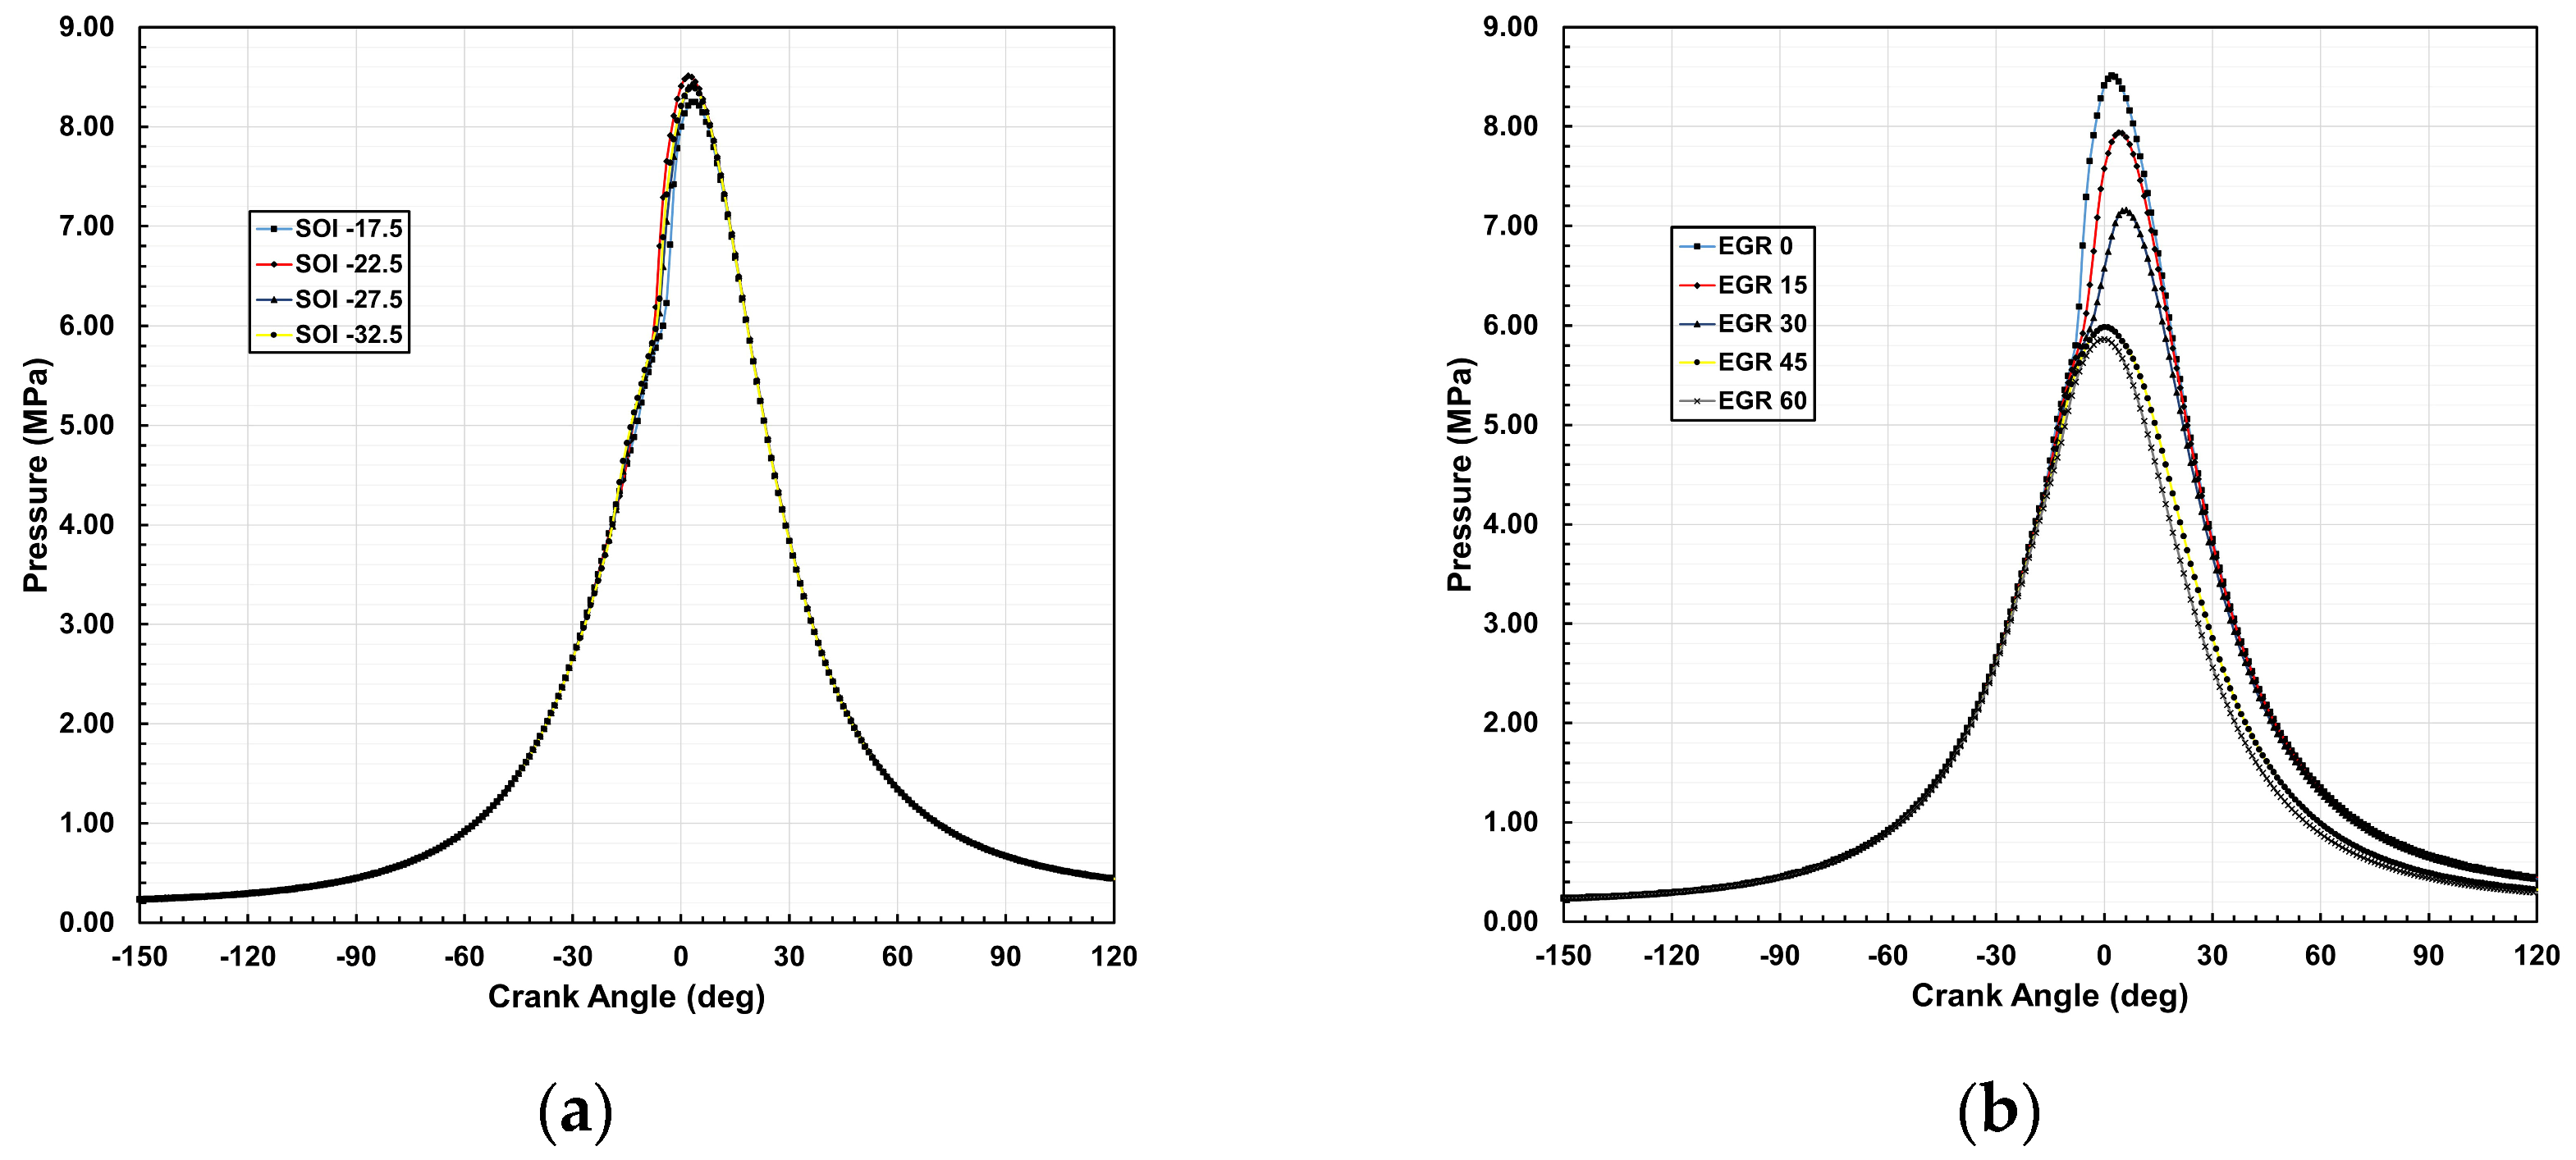
 Figure 3 and Figure 4 illustrate the variation in in-cylinder pressure in terms of SOI and EGR across crank angles. At 0% EGR and an SOI of −22.5° BTDC, the peak pressure reaches 8.51 MPa, but it decreases by 3.1%, 1%, and 1.31% when the SOI is shifted to −17.5°, −27.5°, and −32.5°, respectively. This trend highlights the role of combustion phasing, where intermediate SOI values (−22.5° to −27.5° BTDC) achieve higher peak pressures compared to earlier (−32.5° BTDC) or later (−17.5° BTDC) injections. Earlier SOI provides extended time for fuel–air mixing, potentially enhancing charge homogeneity, yet excessively early injection may lead to wall-wetting and mixture cooling, reducing combustion efficiency. Conversely, delayed SOI limits mixture formation and flame propagation, leading to incomplete combustion and lower peak pressures. The optimal SOI balances mixture preparation and combustion phasing, maximizing pressure near top dead center (TDC) to improve engine work output.
This variation in in-cylinder pressure highlights the combined effects of SOI timing and EGR on combustion characteristics and engine performance. Reduced air–fuel mixing time at SOI −17.5° and earlier combustion during the compression stroke at −27.5° and −32.5° influence pressure development, as a portion of combustion energy counteracts the upward piston motion, reducing peak pressure despite longer mixing durations. At an SOI of −22.5° BTDC, increasing EGR from 0% to 60% results in a proportional pressure reduction of 6.73%, 15.9%, 29.69%, and 31.09% at EGR levels of 15%, 30%, 45%, and 60%, respectively. This inverse relationship between EGR rate and peak pressure stems from both physical and chemical effects. EGR introduces inert exhaust gasses into the intake charge, diluting the air–fuel mixture and increasing the specific heat capacity of the charge. This leads to a lower combustion temperature, as a portion of the heat released during combustion is absorbed by the inert gasses rather than contributing to pressure rise. Additionally, higher EGR rates reduce the availability of fresh air and oxygen, leading to incomplete combustion and further suppressing pressure buildup.
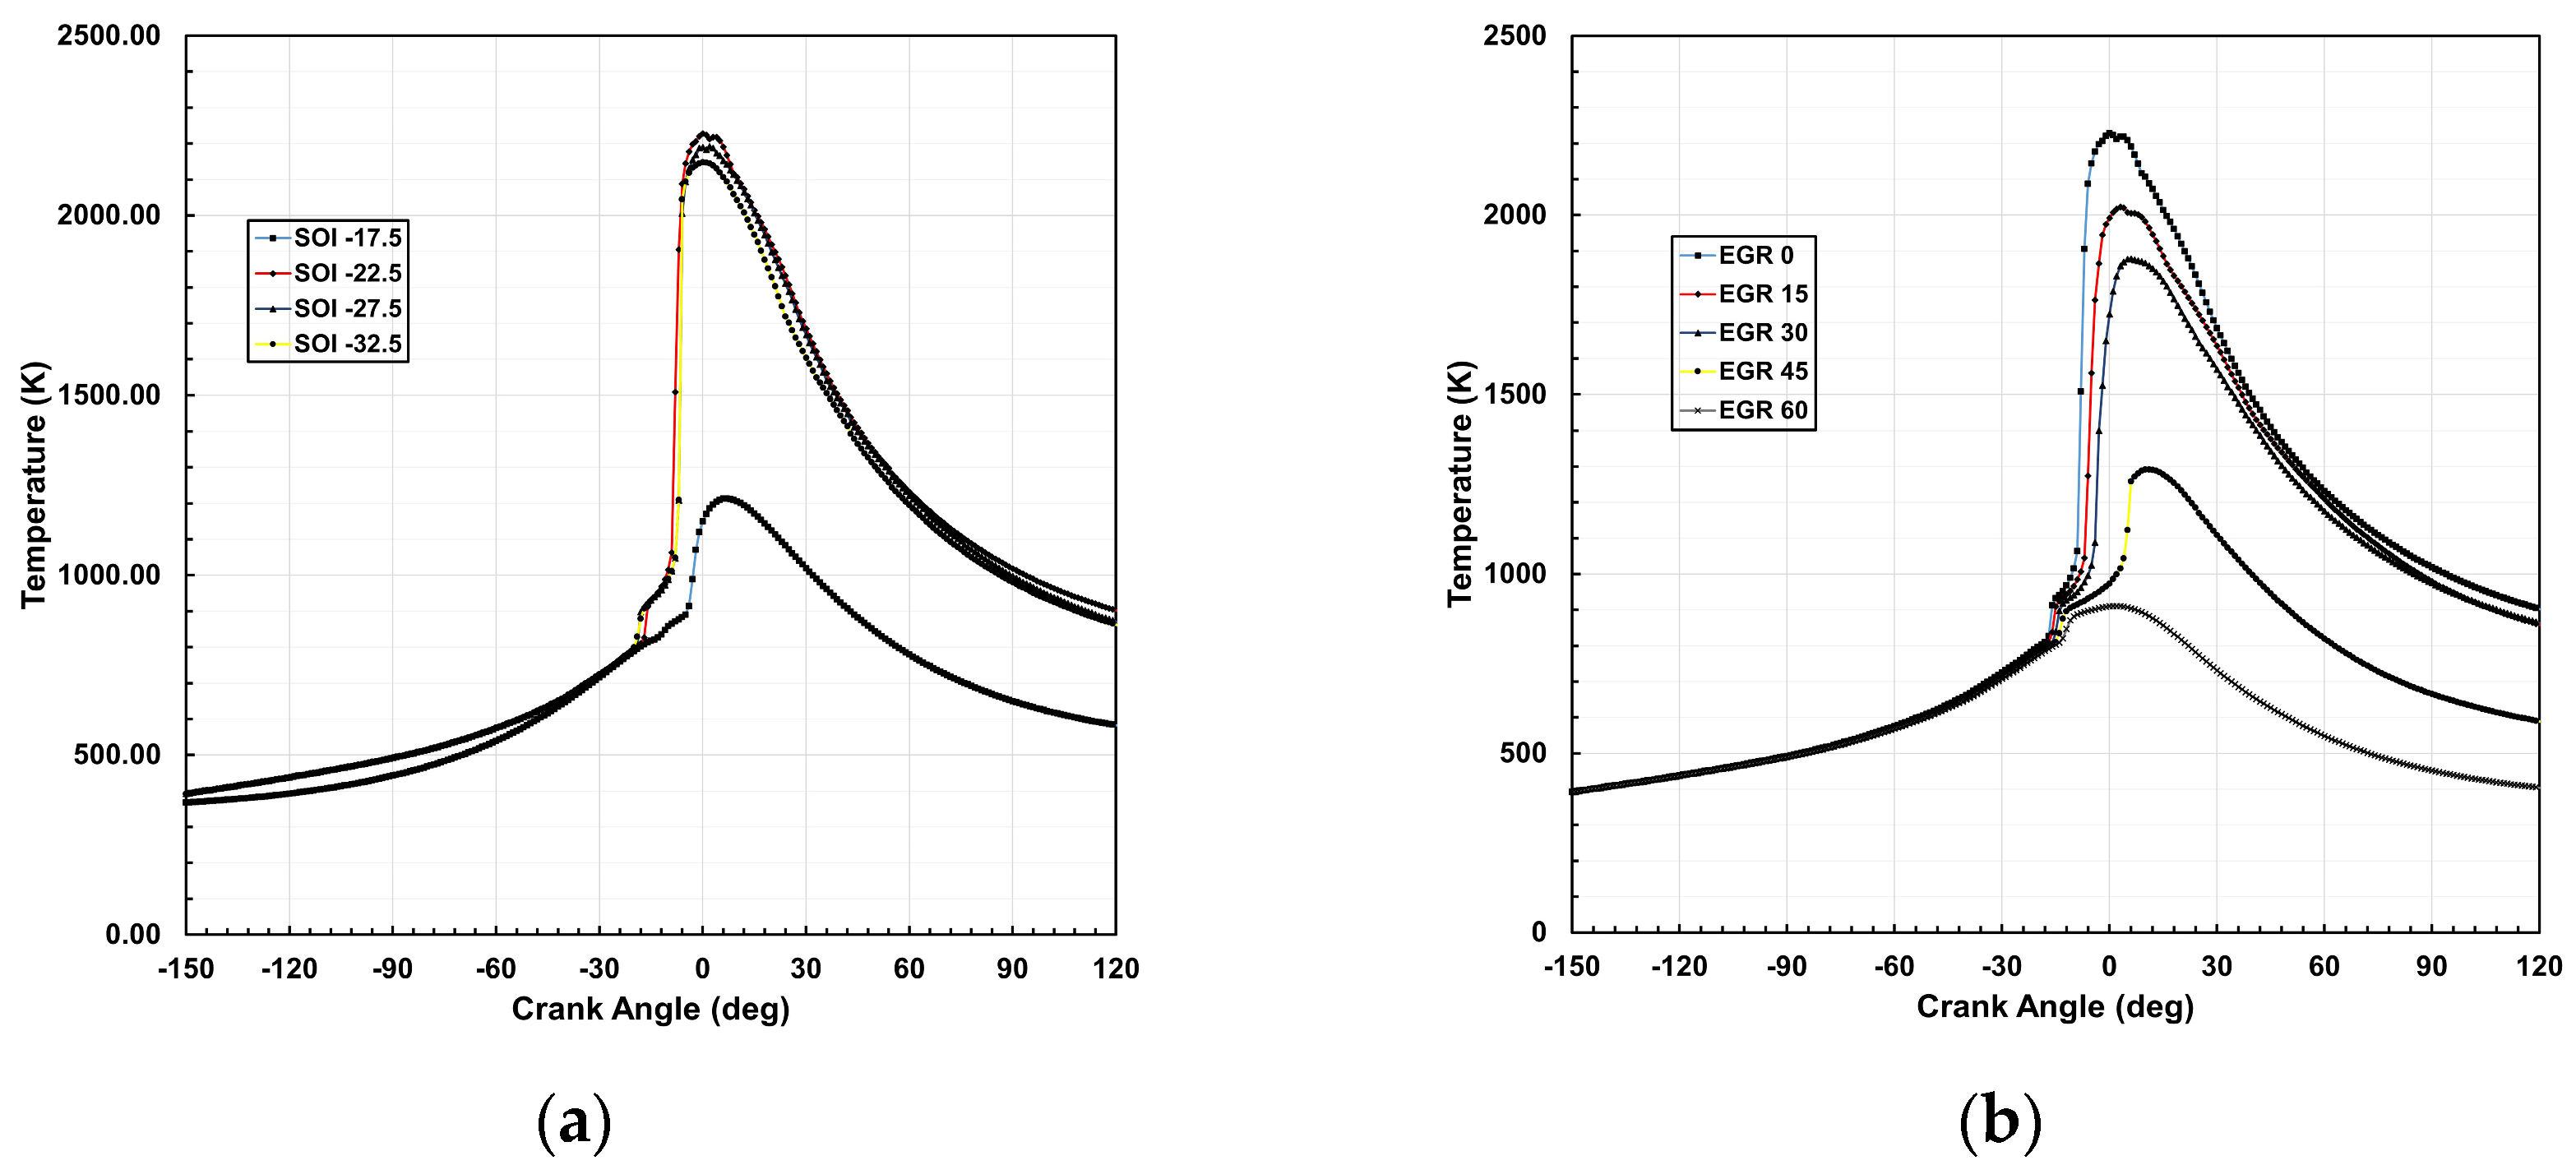
The in-cylinder temperature distribution is significantly influenced by SOI timing and EGR, mirroring pressure trends. At 0% EGR, peak temperature reaches 2228.12 K at an SOI of −22.5° BTDC, decreasing by 45.54% (1213.34 K), 1.65% (2191.44 K), and 3.6% (2147.83 K) at −17.5°, −27.5°, and −32.5°, respectively. Intermediate SOI timings (−22.5° to −27.5° BTDC) yield higher peak temperatures compared to earlier (−32.5° BTDC) or later (−17.5° BTDC) injections due to the balance between fuel–air mixing and combustion phasing. While earlier SOI allows extended mixing, excessive advances may induce over-mixing and cooling effects, slightly lowering peak temperature. Conversely, delayed SOI limits mixture preparation, resulting in less complete combustion and lower temperatures. Furthermore, increasing EGR from 0% to 60% progressively reduces peak temperature by 9.26% (2021.83 K), 15.71% (1878.12 K), 42.06% (1290.97 K), and 59.12% (910.75 K) at EGR levels of 15%, 30%, 45%, and 60%, respectively. This reduction is attributed to the dilution of the air–fuel mixture and the increased specific heat capacity of the charge, which absorbs more combustion heat, leading to lower peak temperatures. While EGR effectively suppresses NOx emissions by reducing combustion temperature, excessive EGR can negatively impact combustion efficiency and power output due to slower burn rates and reduced energy release.

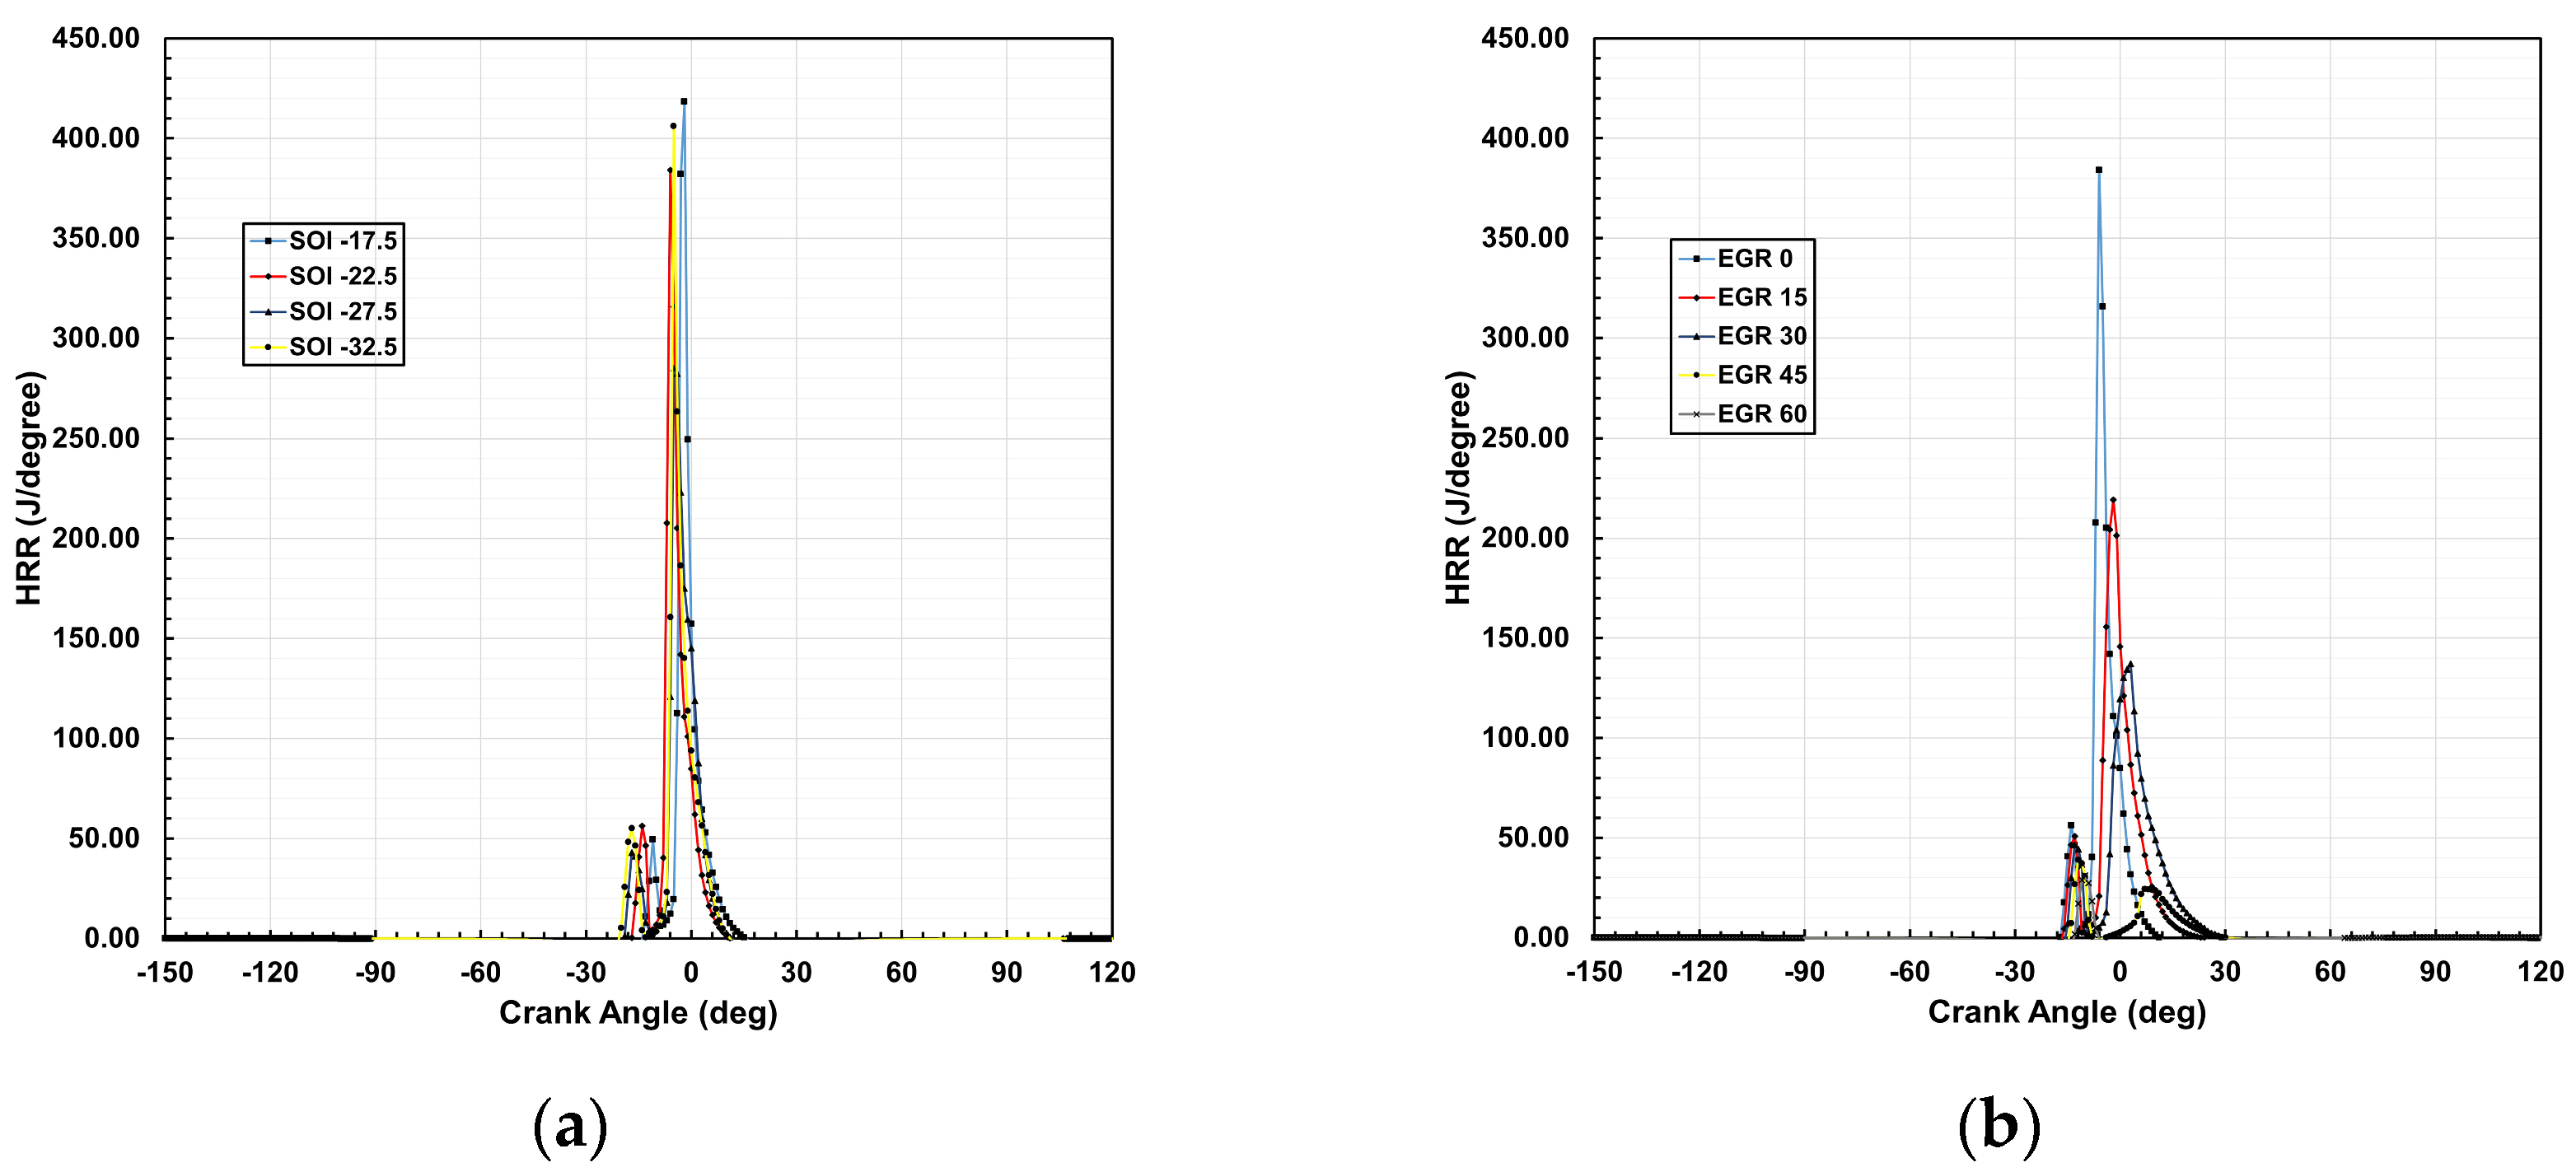
3.2. Heat Release Rate

The HRR indicates the combustion rate, and Figure 5 shows the fluctuation in heat release rate along the crank angle at various SOIs and EGR percentages. The combustion process is divided into two phases: the first phase shows a slight increase in HRR due to fuel–air mixing, where the dispersion of turbulent combustion rises with an increase in the air–fuel mixture, while in the second phase, the HRR reaches its peak due to a higher air–fuel equivalent ratio.
The HRR at SOI −22.5° was 384.14 J/degree, increasing by 8.9% and 5.74% at SOI −17.5° and −32.5°, respectively, but decreasing by 25.79% at −27.5°. At −17.5°, the higher HRR is attributed to enhanced fuel accumulation within a shorter ignition delay, causing combustion to begin abruptly but inadequately. Despite the higher HRR, it does not result in higher pressure or temperature since combustion starts later in the expansion stroke. At −27.5°, HRR is reduced due to premature heat losses and a more extended combustion period. Partial recovery of HRR is observed at −32.5° due to improved premixed combustion, though losses persist. Lower HRR limits peak pressure and temperature, but improved mixing at −32.5° partially increases HRR. However, while varying EGR percentages from 0 to 15, 30, 45, and 60, HRR rates gradually decreased by 42.93%, 64.32%, 89.83%, and 91.93%.

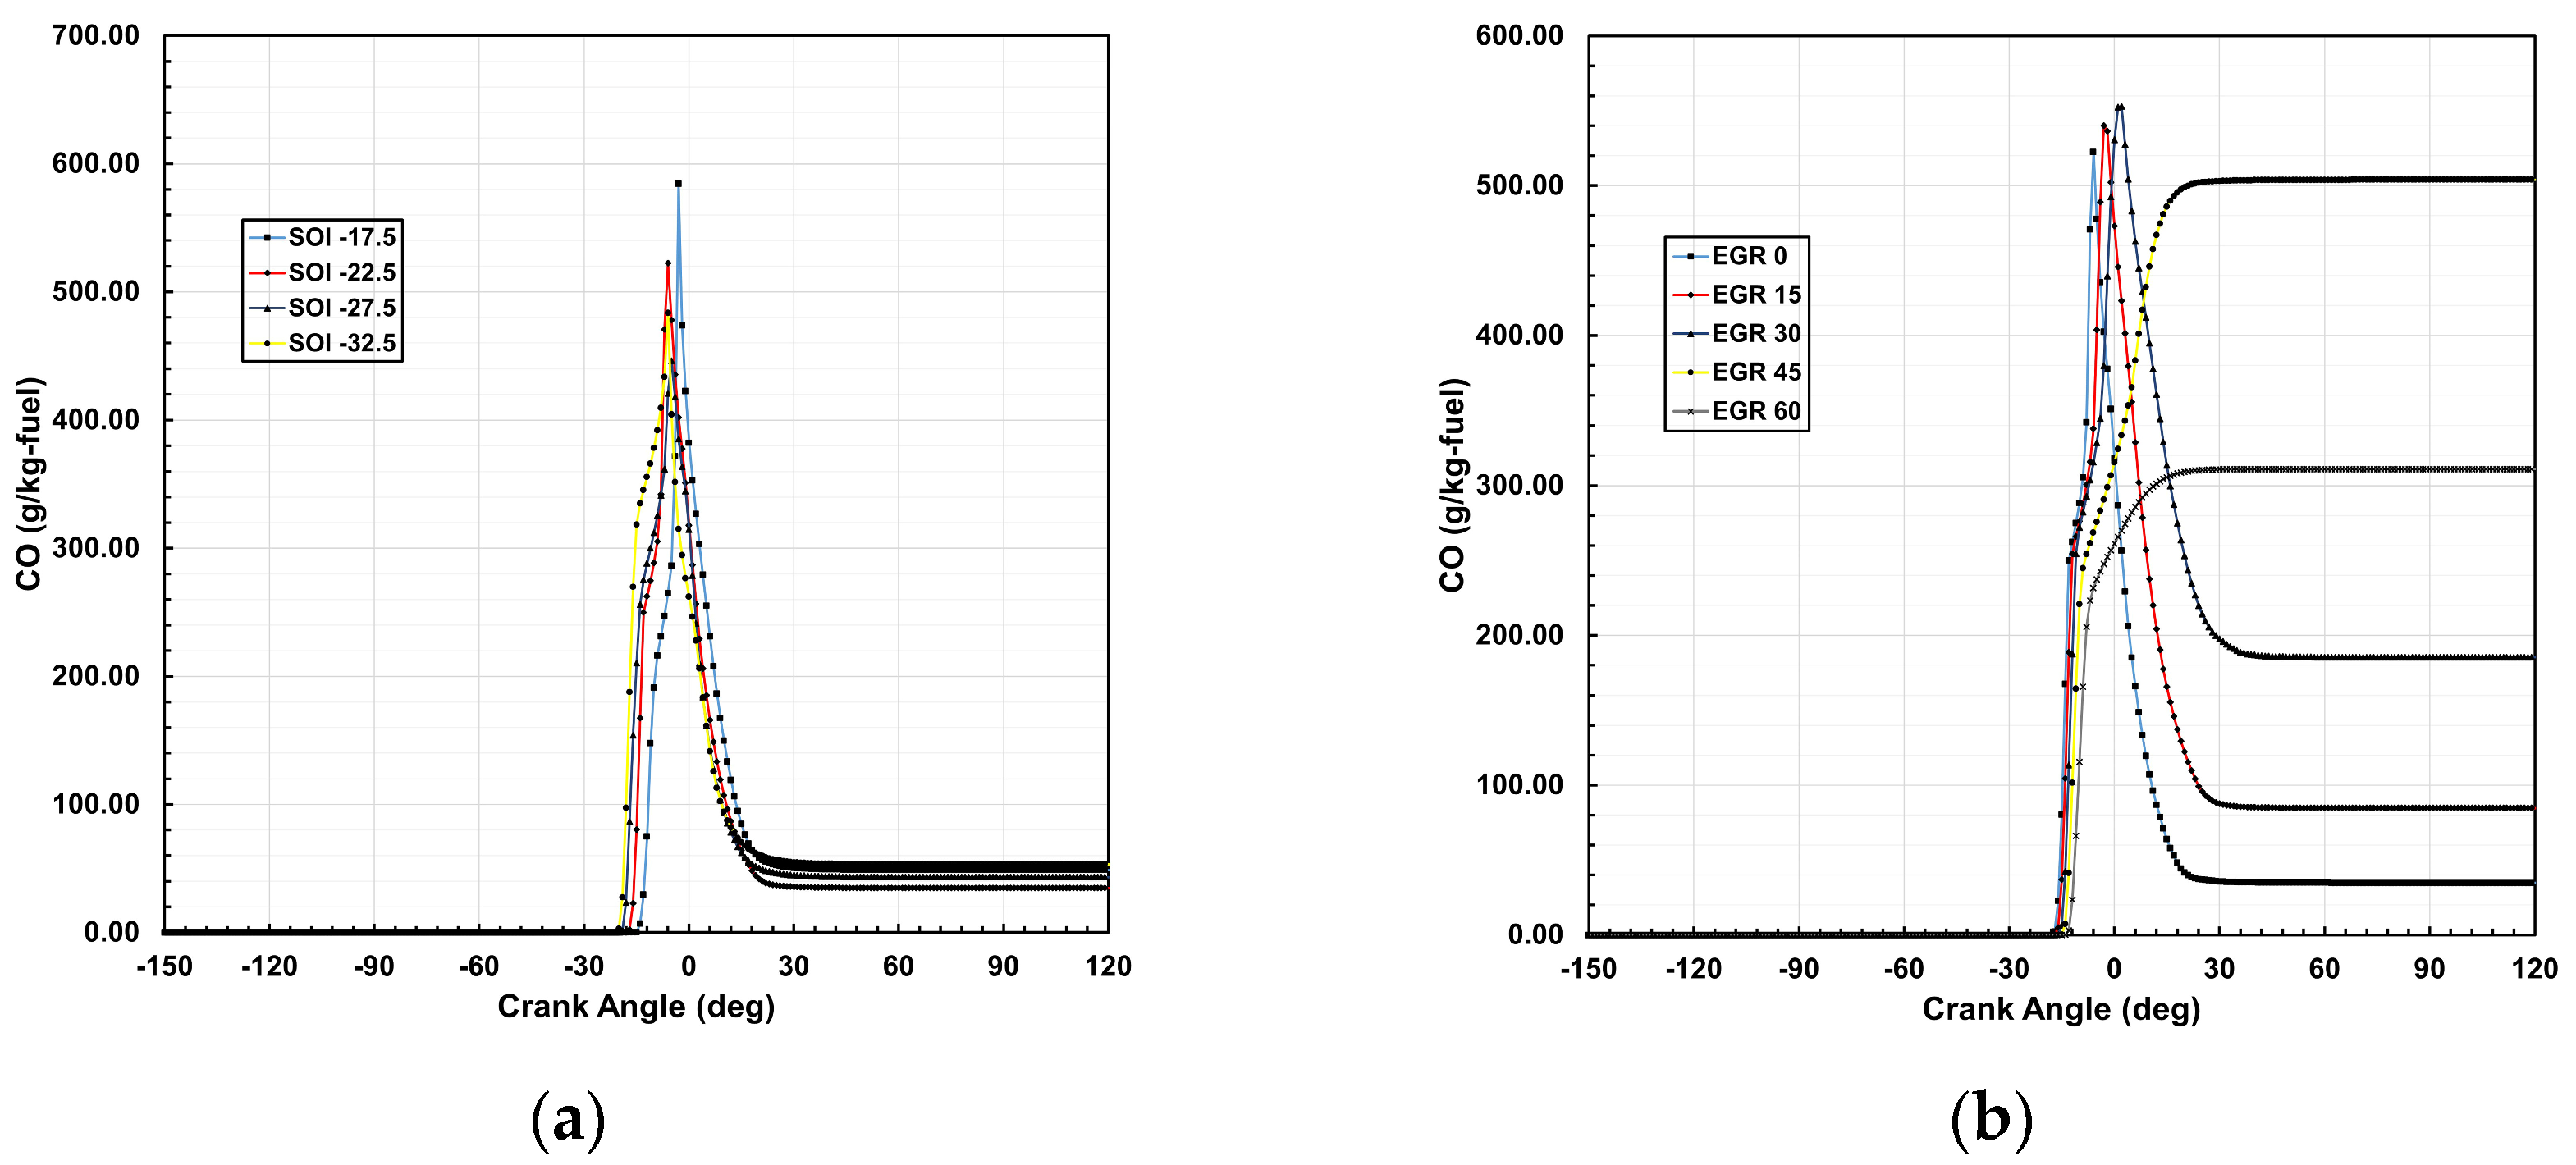
3.3. CO Mass Fraction

The variation in carbon monoxide (CO) emissions is strongly influenced by SOI timing and EGR, as shown in Figure 6. CO emissions primarily result from incomplete combustion due to insufficient oxygen or a rich air–fuel mixture, with peak CO formation occurring near combustion events. Later SOI timings (−17.5° and −22.5° BTDC) exhibit higher CO emissions compared to earlier SOI timings (−27.5° and −32.5° BTDC) due to reduced mixing time, leading to locally fuel-rich zones where incomplete oxidation occurs. Advancing SOI improves fuel–air mixing, enhancing combustion efficiency and lowering CO emissions by 14.62% and 7.43% at −27.5° and −32.5° BTDC, respectively. However, excessive SOI advancement can impact overall combustion efficiency, reducing peak temperature and pressure. Additionally, increasing EGR levels affects CO emissions due to temperature-dependent oxidation. At 15% and 30% EGR, CO emissions rise by 3.36% and 5.87%, respectively, due to lower oxygen availability and incomplete combustion. However, at higher EGR rates of 45% and 60%, significant temperature reductions suppress CO formation, leading to emission reductions of 3.53% and 40.45%, respectively.

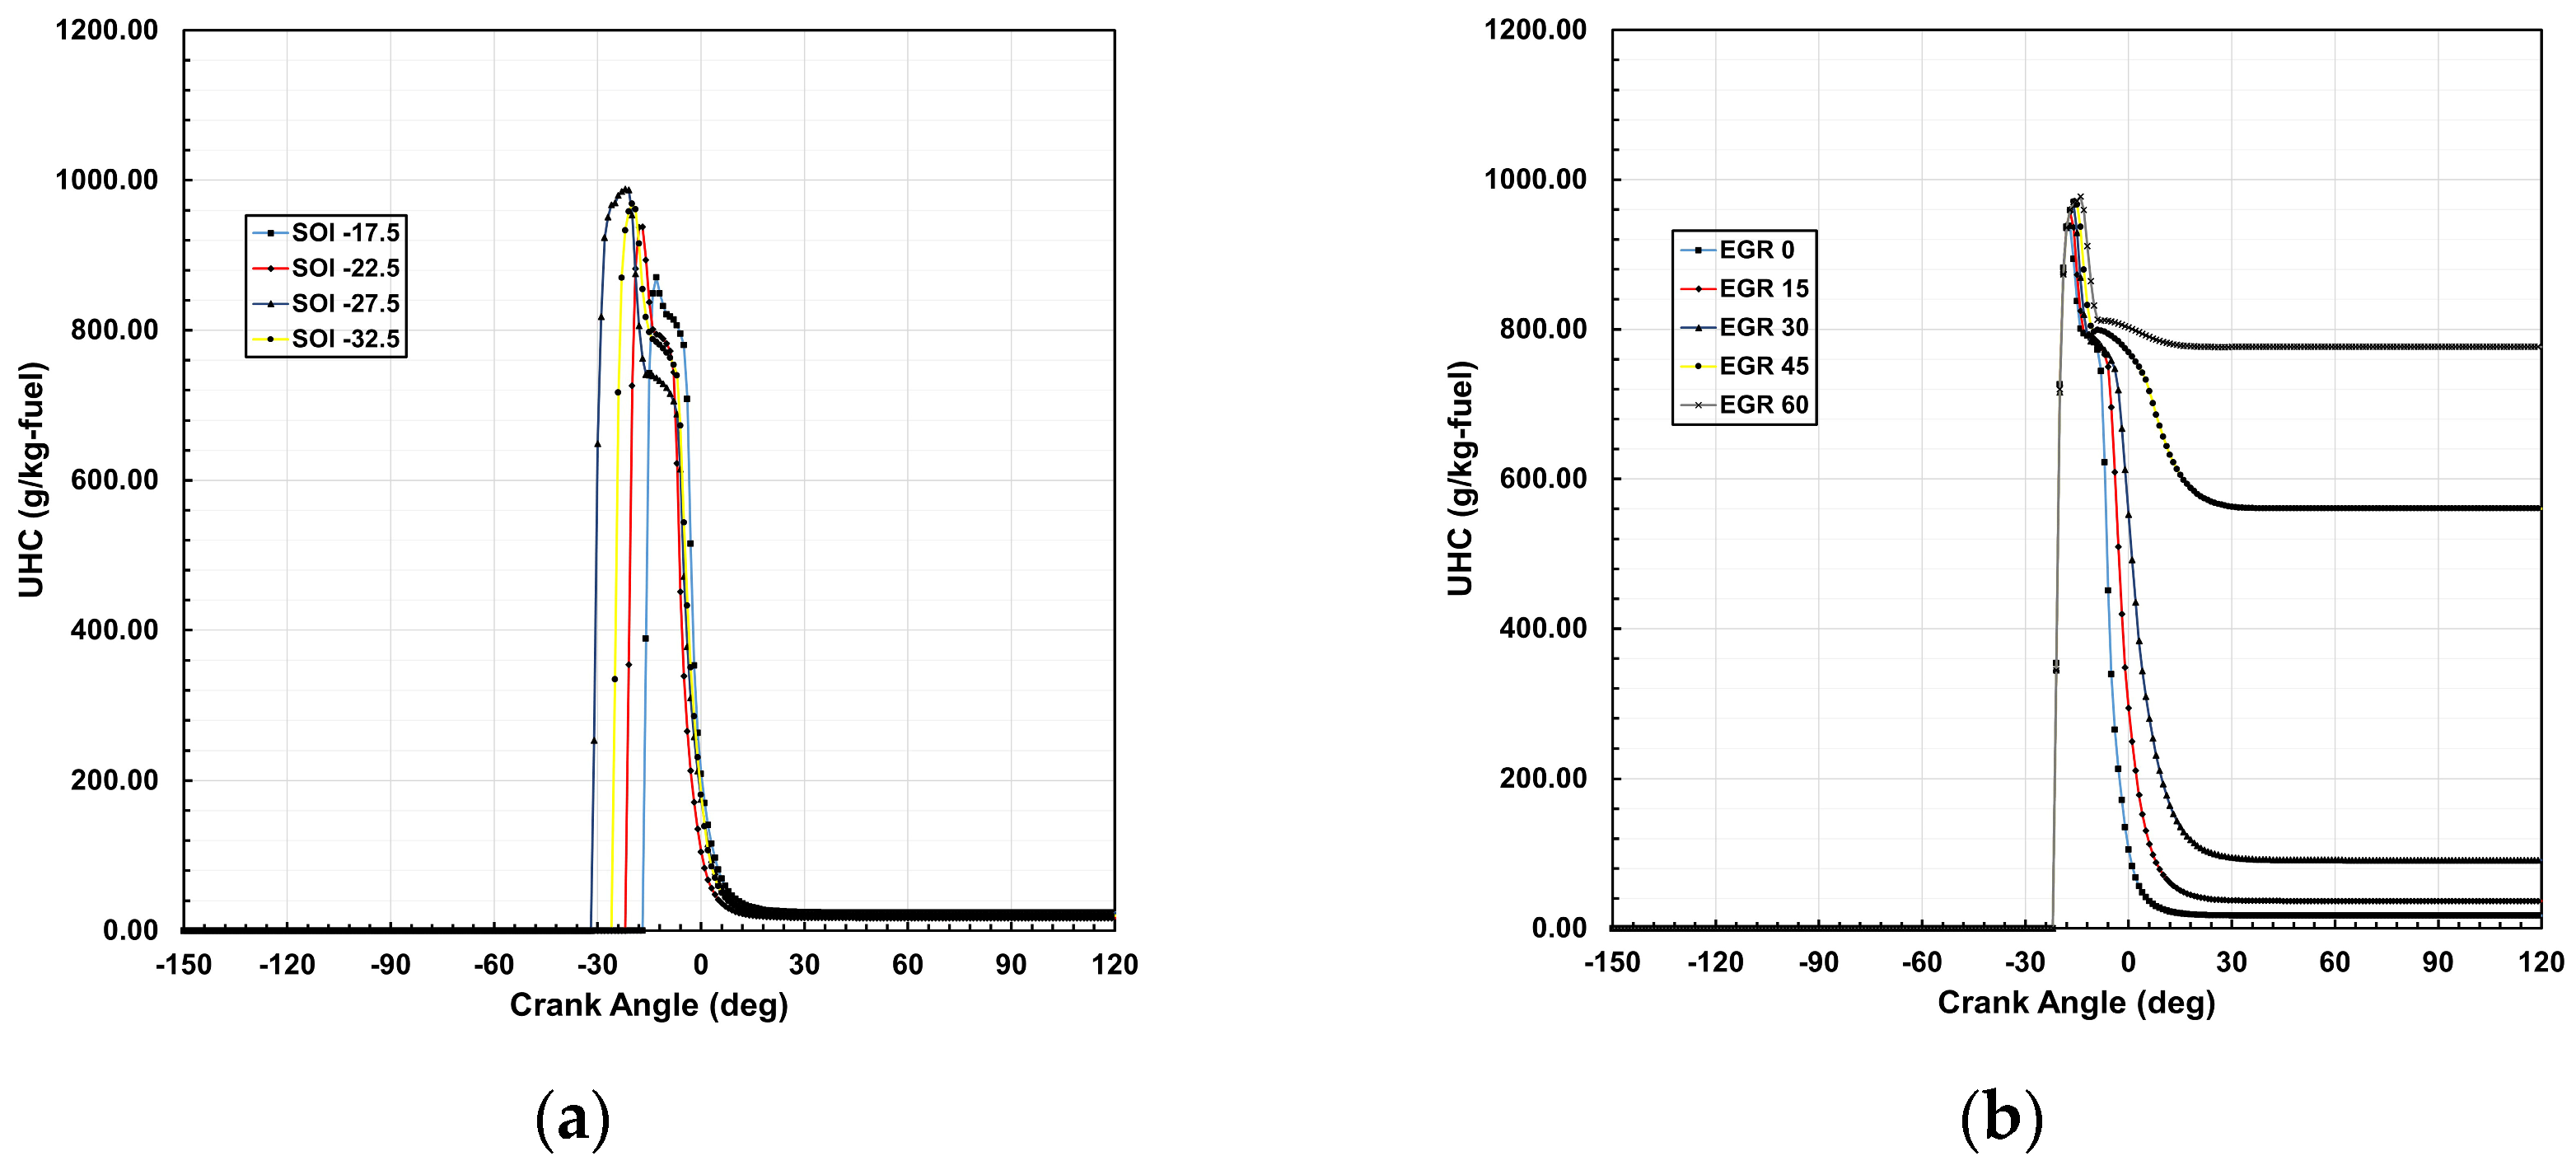
3.4. Unburned Hydrocarbon

The formation of unburned hydrocarbons (UHCs) in exhaust gasses is strongly influenced by the homogeneity of the air–fuel mixture, which plays a critical role in flame propagation. The presence of squish volumes and crevices contributes to UHC generation, as the flame tends to be extinguished in these near-wall regions.
At an SOI of −22.5°, UHC emissions were recorded at 937.75 g/kg-fuel. As the SOI was retarded to −17.5°, the ignition delay decreased, leading to improved fuel consumption and a 7.16% reduction in UHC emissions. However, when the SOI was advanced to −27.5° and −32.5°, UHC emissions increased by 3.36% and 5.38%, respectively. This increase can be attributed to prolonged ignition delay, which limits effective fuel–air mixing and results in incomplete combustion.
At a fixed SOI of −22.5°, increasing the EGR rate to 15%, 30%, 45%, and 60% led to a progressive reduction in oxygen concentration within the combustion chamber. This resulted in a deteriorated air–fuel mixture, causing UHC emissions to rise by 2.03%, 3.09%, 3.53%, and 4.24%, respectively. Figure 7 illustrates the impact of varying SOI and increasing EGR rates on air–fuel mixture uniformity, ignition delay, and subsequent UHC emissions.

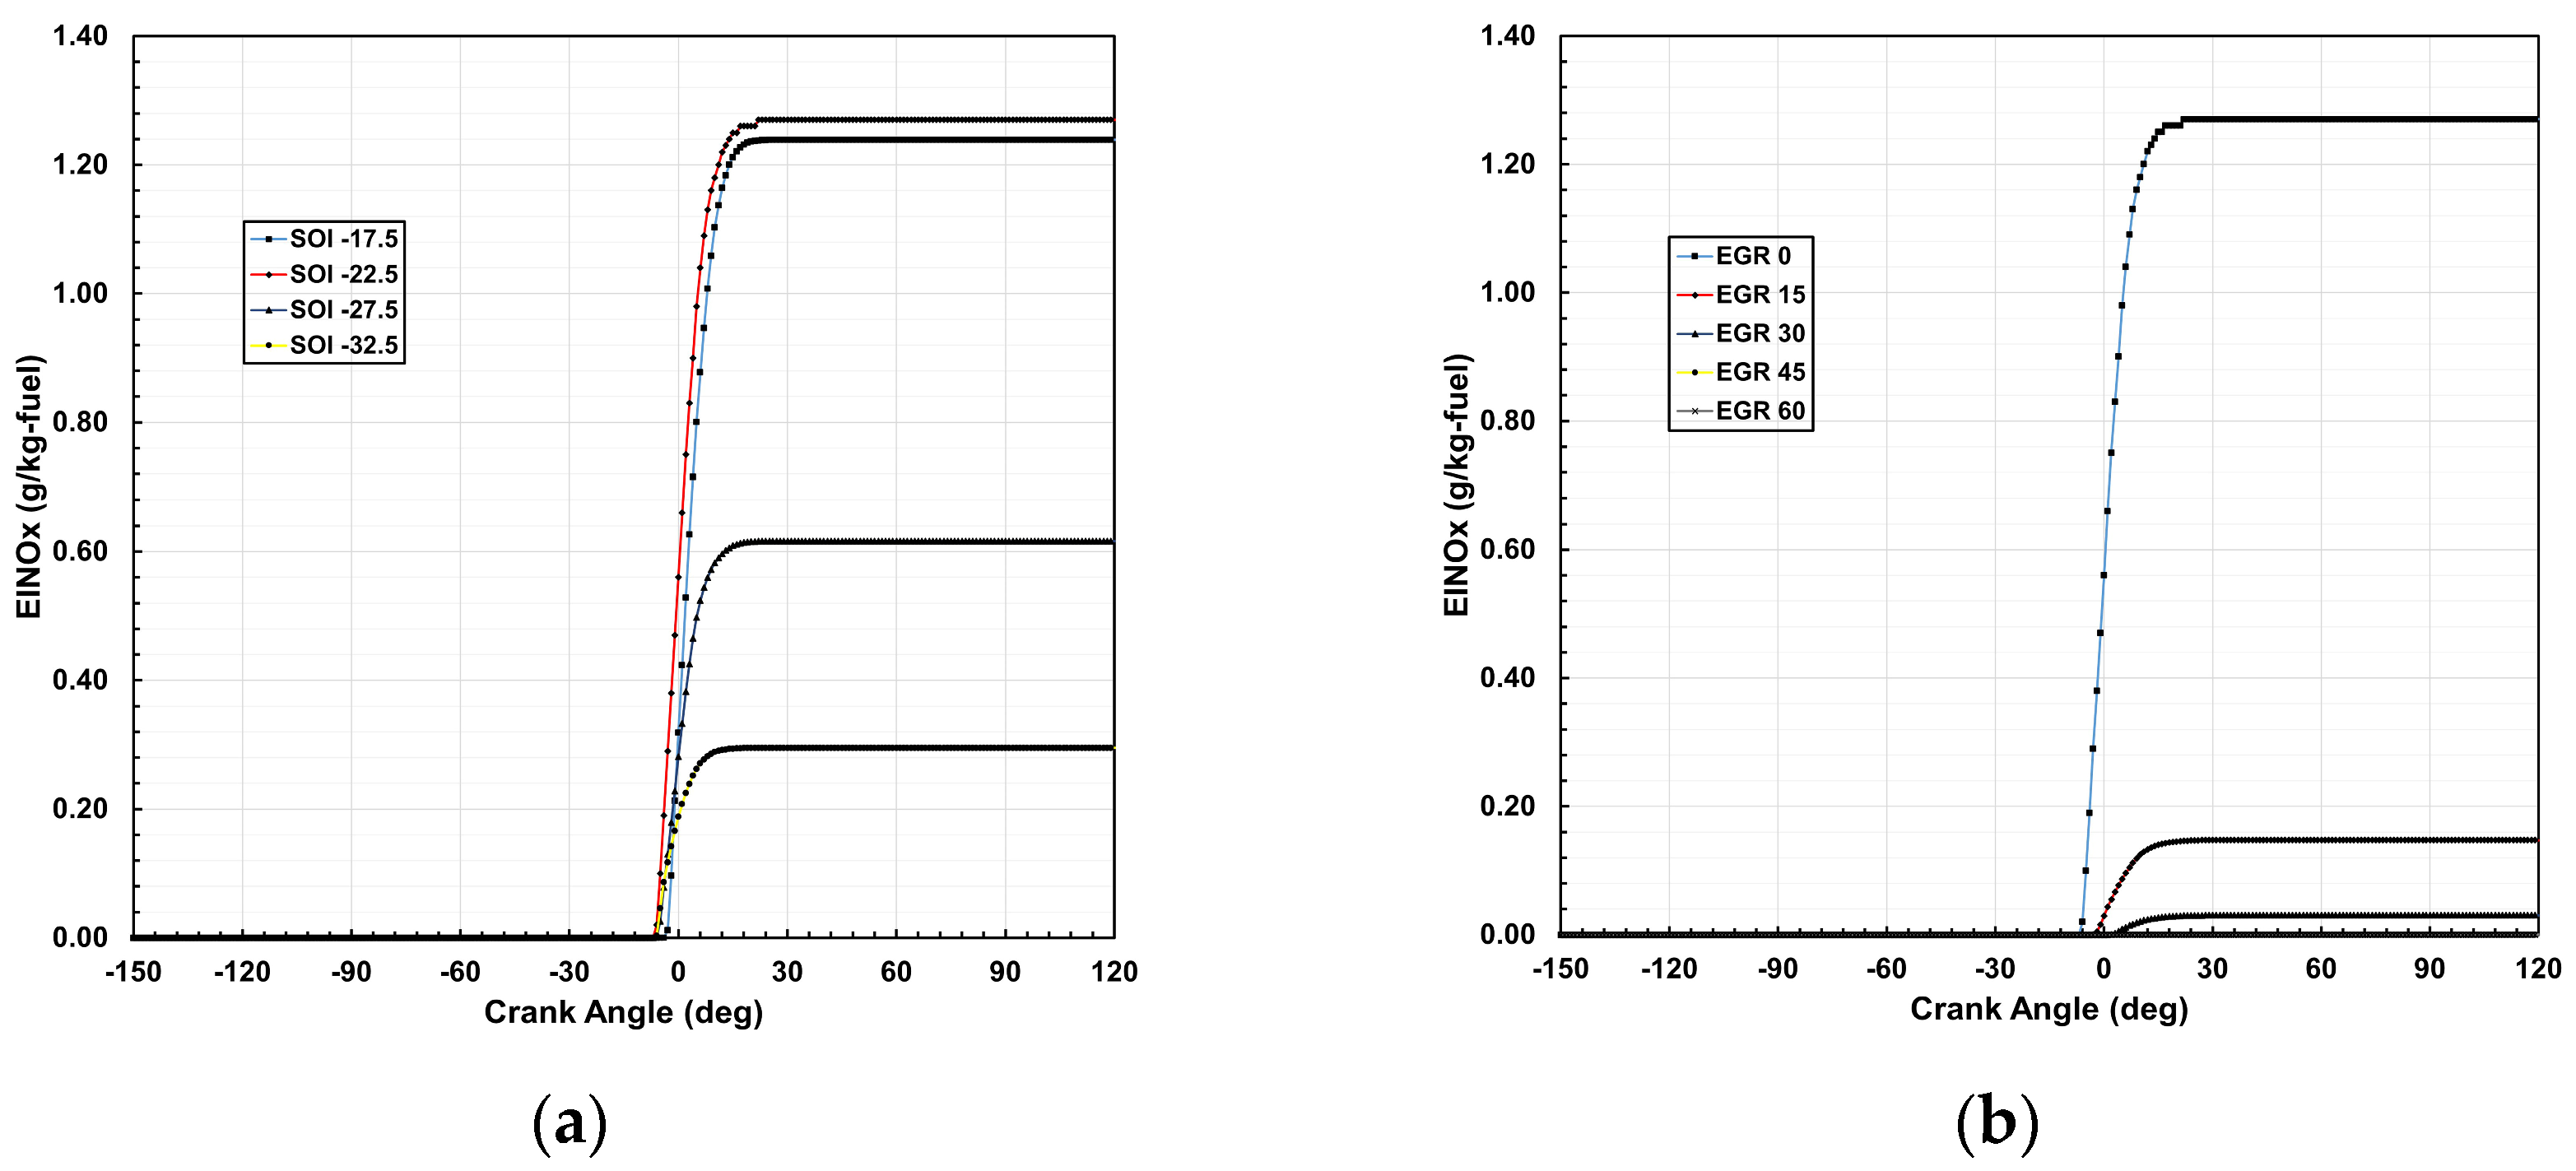
3.5. Emission Indexed NOx (EINOx)

Figure 8 illustrates the EINOx distribution for various SOI and EGR rates, highlighting the significant impact of increased EGR on NOx formation. As the EGR rate increases, the reintroduction of exhaust gasses into the combustion chamber reduces oxygen availability and lowers combustion temperatures, thereby suppressing thermal NOx formation. The results indicate that at EGR 0%, NOx emissions are 1.27 g/kg-fuel, which decreases substantially with increasing EGR. At EGR 15% and 30%, NOx emissions drop to 0.15 g/kg-fuel and 0.03 g/kg-fuel, respectively, and are nearly eliminated at EGR 45% and 60%, reaching 0.00 g/kg-fuel. Additionally, advancing the SOI further contributes to NOx reduction, as earlier combustion results in greater heat loss to the cylinder walls, limiting peak flame temperatures. While higher EGR rates effectively mitigate NOx emissions, excessive EGR can lead to combustion inefficiencies, necessitating careful optimization for practical applications.

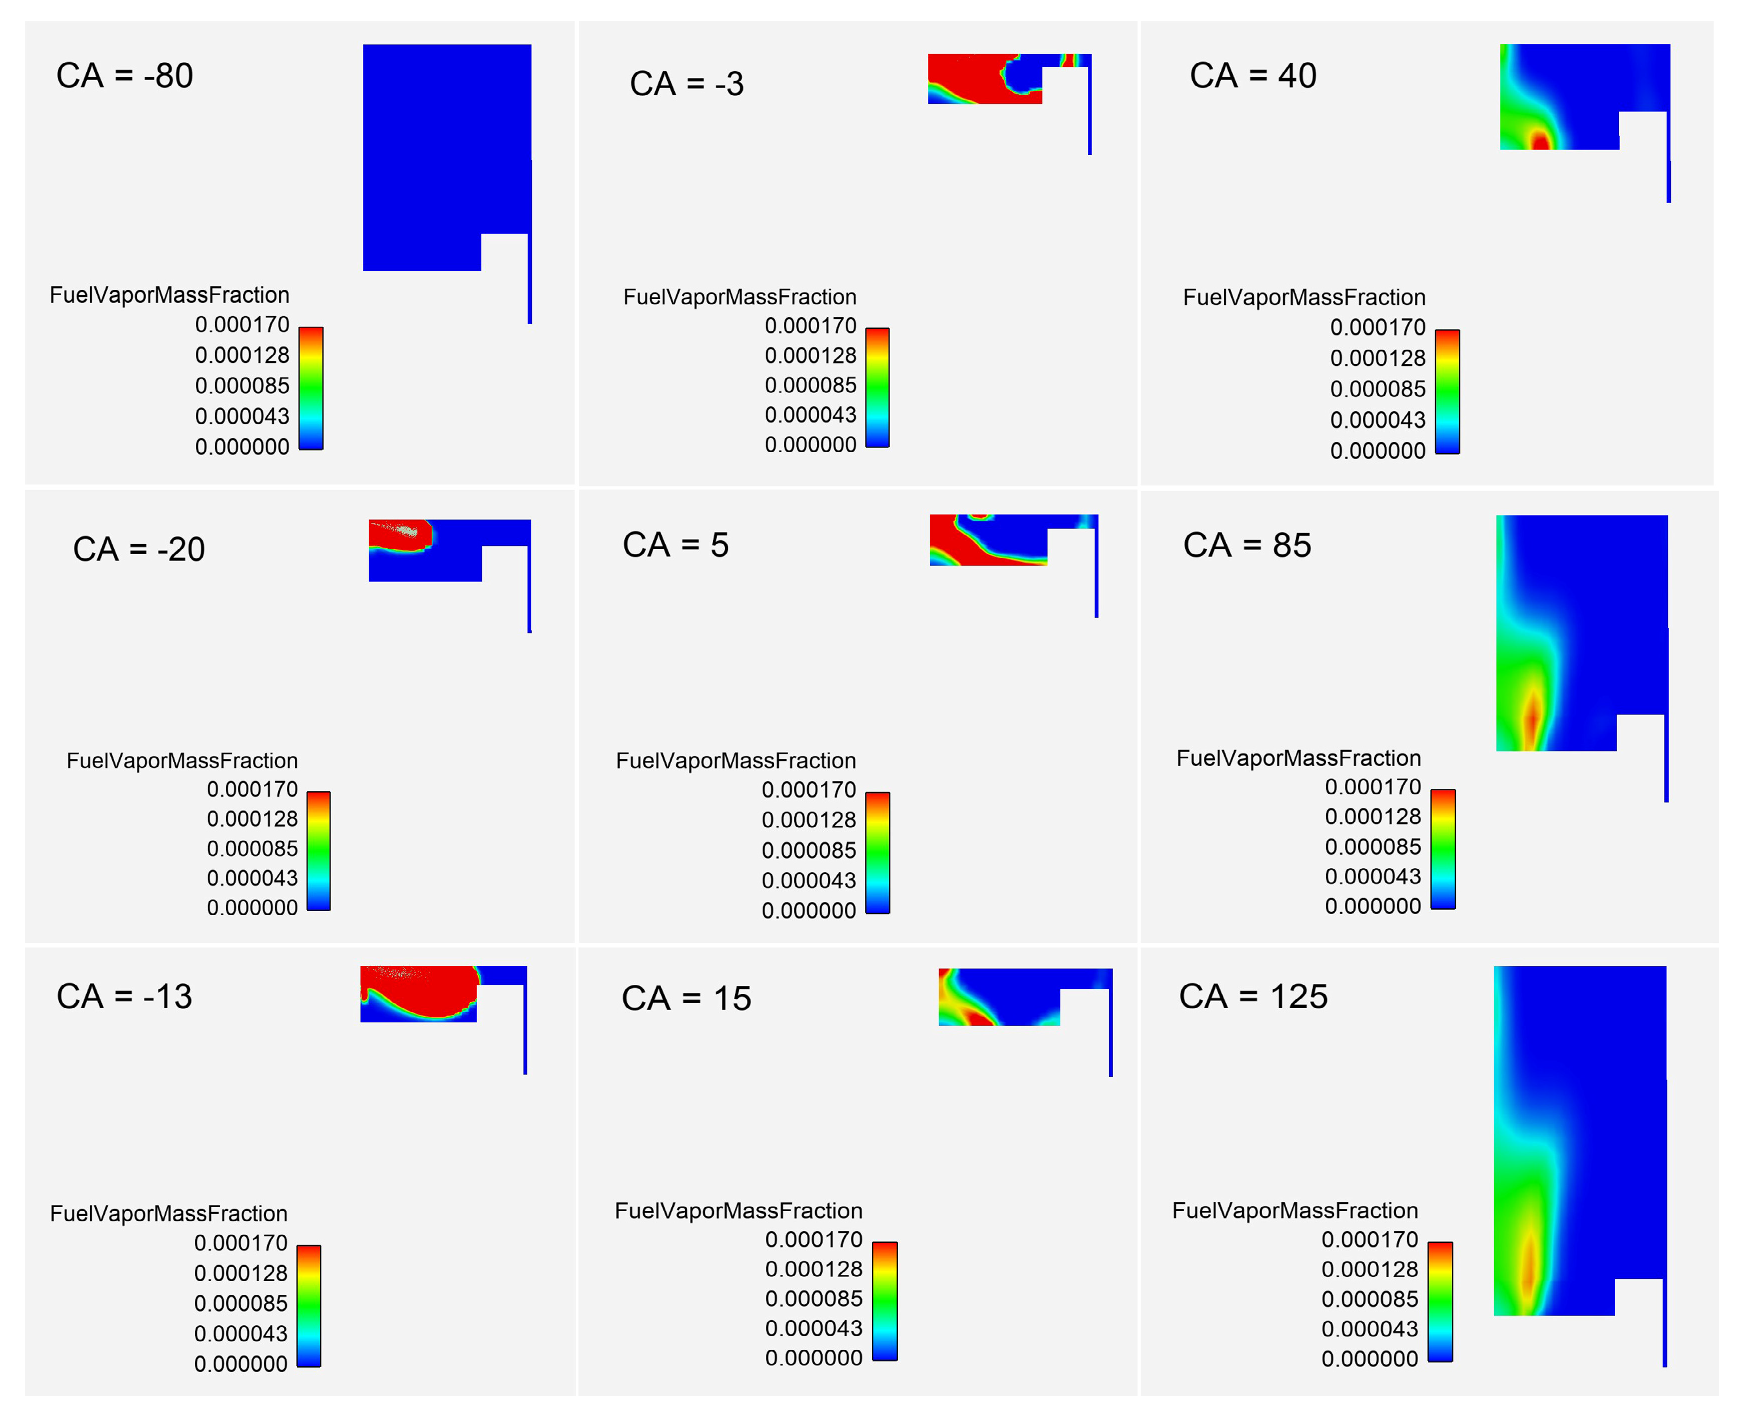
3.6. Fuel Vapor Mass Fraction Contour

Figure 9 visually represents the n-heptane surrogate, illustrating fuel injection through fuel vapor mass fraction contours at various crank angles (CAs). During the intake stroke, the temperature remains nearly constant but gradually increases throughout the compression stroke. After −20° BTDC, as fuel begins to be injected into the cylinder, the temperature rises rapidly, reaching a maximum of 2228.12 K. This contour corresponds to fuel injection at an SOI of −22.5° and a 0% EGR rate.

4. Conclusions

Computational fluid dynamics is a powerful tool for evaluating combustion characteristics and pollutant emissions in internal combustion engines. In this study, a CFD simulation was conducted to analyze the combustion and emission behavior of a single-cylinder direct injection diesel engine operating at 1200 RPM, fueled with an n-heptane-based surrogate. The k-ε RNG turbulence model was employed to predict combustion dynamics and emissions. The study investigated the effects of fuel injection timing at SOI values of −17.5°, −22.5°, −27.5°, and −32.5° BTDC, as well as the impact of EGR at rates of 0%, 15%, 30%, 45%, and 60%. The key findings are summarized as follows:
  • A fuel injection timing of −22.5° BTDC with 0% EGR results in increased in-cylinder pressure, temperature, HRR, and EINOx emissions.
  • Advancing SOI to −27.5° and −32.5° BTDC leads to earlier combustion energy release, which counteracts the piston’s upward movement, affecting overall engine performance. While this can lower CO emissions due to improved fuel oxidation, it also increases UHC emissions due to prolonged ignition delay and incomplete combustion.
  • Advancing SOI significantly reduces NOx emissions by increasing heat transfer to the cylinder walls during the early combustion phase.
  • Higher EGR rates reduce fresh air intake, leading to lower in-cylinder pressure, HRR, temperature, and EINOx emissions. However, excessive EGR increases UHC and CO emissions due to diminished oxygen availability and incomplete combustion.

Author Contributions

Conceptualization, M.H.P. and H.M.C.; methodology, M.H.P.; software, M.H.P.; validation, M.H.P. and H.M.C.; formal analysis, M.H.P.; investigation, M.H.P.; resources, M.H.P.; data curation, M.H.P.; writing—original draft preparation, M.H.P.; writing—review and editing, M.H.P. and H.M.C.; visualization, M.H.P.; supervision, H.M.C.; project administration, H.M.C.; funding acquisition, H.M.C. All authors have read and agreed to the published version of the manuscript.

Funding

This research received no external funding.

Data Availability Statement

The original contributions presented in this study are included in the article. Further inquiries can be directed to the corresponding author.

Conflicts of Interest

The authors declare no conflicts of interest.

Abbreviations

The following abbreviations are used in this manuscript:
LTCLow-Temperature Combustion
RMReaction Mechanism
RNGRe-Normalization Group
HRRHeat Release Rate
DIDirect Injection
KH-RTKelvin-Helmholtz-Raleigh Taylor
OEMsOriginal Equipment Manufacturers
CICompression Ignition
CO2Carbon Dioxide
HCHydrocarbon
COCarbon Monoxide
NOxNitric Oxides
ICInternal Combustion
LESLarge Eddy Simulation
RSMReynolds Stress Model
AFRAir Fuel Ratio
3DThree Dimension
CACrank Angle
TDCTop Dead Center
BTDCBefore Top Dead Center
UHCUnburned Hydrocarbon
J/degreeJoule per degree
g/kg-fuelGrams per kilogram of fuel
RANSReynolds Averaged Navier–Stokes
CFDComputational Fluid Dynamics
KKelvin
SOI Start of Injection
EGRExhaust Gas Recirculation
RPMRevolution Per Minute

References

  1. Kalghatgi, G. Is It Really the End of Internal Combustion Engines and Petroleum in Transport? Appl. Energy 2018, 225, 965–974. [Google Scholar] [CrossRef]
  2. Lyu, P.; Wang (Slade), P.; Liu, Y.; Wang, Y. Review of the Studies on Emission Evaluation Approaches for Operating Vehicles. J. Traffic Transp. Eng. 2021, 8, 493–509. [Google Scholar] [CrossRef]
  3. Zhang, L.; Long, R.; Chen, H.; Geng, J. A Review of China’s Road Traffic Carbon Emissions. J. Clean. Prod. 2019, 207, 569–581. [Google Scholar] [CrossRef]
  4. Mock, P. CO2 Emission Standards for Passenger Cars and Light-Commercial Vehicles in the European Union. Available online: https://theicct.org/publication/co2-emission-standards-for-passenger-cars-and-light-commercial-vehicles-in-the-european-union/ (accessed on 25 January 2025).
  5. Duan, X.; Liu, J.; Tan, Y.; Luo, B.; Guo, G.; Wu, Z.; Liu, W.; Li, Y. Influence of Single Injection and Two-Stagnation Injection Strategy on Thermodynamic Process and Performance of a Turbocharged Direct-Injection Spark-Ignition Engine Fuelled with Ethanol and Gasoline Blend. Appl. Energy 2018, 228, 942–953. [Google Scholar] [CrossRef]
  6. Gopinath, S.; Devan, P.K.; Sabarish, V.; Sabharish Babu, B.V.; Sakthivel, S.; Vignesh, P. Effect of Spray Characteristics Influences Combustion in DI Diesel Engine—A Review. Mater. Today Proc. 2020, 33, 52–65. [Google Scholar] [CrossRef]
  7. Mansor, M.R.A.; Mohamad, T.I.; Sabah, O. Numerical Investigation on Combustion and Emissions in a Direct Injection Compression Ignition Engine Fuelled with Various Hydrogen–Methane–Diesel Blends at Different Intake Air Temperatures. Energy Rep. 2021, 7, 403–421. [Google Scholar] [CrossRef]
  8. Kumar, R.; Zheng, M. Fuel Efficiency Improvements of Low Temperature Combustion Diesel Engines. In Proceedings of the SAE World Congress & Exhibition; SAE International: Warrendale, PA, USA, 2008. [Google Scholar]
  9. Bendu, H.; Sivalingam, M. Experimental Investigation on the Effect of Charge Temperature on Ethanol Fueled HCCI Combustion Engine. J. Mech. Sci. Technol. 2016, 30, 4791–4799. [Google Scholar] [CrossRef]
  10. D’Aniello, F.; Arsie, I.; Pianese, C.; Stola, F. Development of an Integrated Control Strategy for Engine and SCR System Based on Effective EGR Rate. IFAC-PapersOnLine 2020, 53, 14034–14039. [Google Scholar] [CrossRef]
  11. Lopatin, O.P. The Effect of Operational Modes of Diesel Engines to Emissions of Nitrogen Oxides. IOP Conf. Ser. Mater. Sci. Eng. 2020, 862, 062087. [Google Scholar] [CrossRef]
  12. Peng, B.; Feng, C.; Liu, S.; Zhang, R. Synthesis of CuO Catalyst Derived from HKUST-1 Temple for the Low-Temperature NH3-SCR Process. Catal. Today 2018, 314, 122–128. [Google Scholar] [CrossRef]
  13. Rimkus, A.; Melaika, M.; Matijošius, J. Efficient and Ecological Indicators of CI Engine Fuelled with Different Diesel and LPG Mixtures. Procedia Eng. 2017, 187, 504–512. [Google Scholar] [CrossRef]
  14. Khujamberdiev, R.; Cho, H. Impact of Biodiesel Blending on Emission Characteristics of One-Cylinder Engine Using Waste Swine Oil. Energies 2023, 16, 5489. [Google Scholar] [CrossRef]
  15. Yasin, M.H.M.; Mamat, R.; Yusop, A.F.; Idris, D.M.N.D.; Yusaf, T.; Rasul, M.; Najafi, G. Study of a Diesel Engine Performance with Exhaust Gas Recirculation (EGR) System Fuelled with Palm Biodiesel. Energy Procedia 2017, 110, 26–31. [Google Scholar] [CrossRef]
  16. Rajesh Kumar, B.; Saravanan, S. Effect of Exhaust Gas Recirculation (EGR) on Performance and Emissions of a Constant Speed Di Diesel Engine Fueled with Pentanol/Diesel Blends. Fuel 2015, 160, 217–226. [Google Scholar] [CrossRef]
  17. Nalluri, P.; Premkumar, P.; Sastry, M.R.C. Thermodynamic Simulation Study on Compression Ignition Engine Operating with Oil Obtained via Catalytic Pyrolysis of Waste Polythene Covers. Sustain. Chem. Clim. Action 2024, 4, 100041. [Google Scholar] [CrossRef]
  18. Fatkhurrozak, F.; Sanjaya, F.L.; Syarifudin, S. The Effect of Additional Diethyl Ether (DEE) and Jatropa on the Brake Power and the Fuel Consumption of Diesel Engine with an EGR System. AIP Conf. Proc. 2024, 3070, 40002. [Google Scholar] [CrossRef]
  19. Sethin, A.; Oo, Y.M.; Thawornprasert, J.; Somnuk, K. Effects of Blended Diesel–Biodiesel Fuel on Emissions of a Common Rail Direct Injection Diesel Engine with Different Exhaust Gas Recirculation Rates. ACS Omega 2024, 9, 20906–20918. [Google Scholar] [CrossRef]
  20. Vedula, R.T.; Song, R.; Stuecken, T.; Zhu, G.G.; Schock, H. Thermal Efficiency of a Dual-Mode Turbulent Jet Ignition Engine under Lean and near-Stoichiometric Operation. Int. J. Engine Res. 2017, 18, 1055–1066. [Google Scholar] [CrossRef]
  21. Siadkowska, K.; Barański, G.; Sochaczewski, R.; Wendeker, M. Experimental Investigation on Indicated Pressure and Heat Release for Direct Hydrogen Injection in a Dual Fuel Diesel Engine. Adv. Sci. Technol. Res. J. 2022, 16, 54–66. [Google Scholar] [CrossRef]
  22. Lu, Z.; Ma, M.; Wang, T.; Lu, T.; Wang, H.; Feng, Y.; Shi, L. Numerical Research of the In-Cylinder Natural Gas Stratification in a Natural Gas-Diesel Dual-Fuel Marine Engine. Fuel 2023, 337, 126861. [Google Scholar] [CrossRef]
  23. Cardone, M.; Marialto, R.; Ianniello, R.; Lazzaro, M.; Di Blasio, G. Spray Analysis and Combustion Assessment of Diesel-LPG Fuel Blends in Compression Ignition Engine. Fuels 2020, 2, 1–15. [Google Scholar] [CrossRef]
  24. Pei, Y.; Mehl, M.; Liu, W.; Lu, T.; Pitz, W.J.; Som, S. A Multicomponent Blend as a Diesel Fuel Surrogate for Compression Ignition Engine Applications. J. Eng. Gas Turbines Power 2015, 137, 111502. [Google Scholar] [CrossRef]
  25. Khandal, S.V.; Banapurmath, N.R.; Gaitonde, V.N. Performance Studies on Homogeneous Charge Compression Ignition (HCCI) Engine Powered with Alternative Fuels. Renew. Energy 2019, 132, 683–693. [Google Scholar] [CrossRef]
  26. Gheraissa, N.; Bouras, F.; Khaldi, F.; Hidouri, A.; Rehouma, F.; Dogga, A. A Comparative Study of the Combustion Supplied by Multi-Fuels: Computational Analysis. Energy Rep. 2021, 7, 3819–3832. [Google Scholar] [CrossRef]
  27. Sathishkumar, S.; Ibrahim, M.M. Investigation on the Effect of Injection Schedule and EGR in Hydrogen Energy Share Using Common Rail Direct Injection Dual Fuel Engine. Int. J. Hydrog. Energy 2021, 46, 11494–11510. [Google Scholar] [CrossRef]
  28. Parveg, A.S.M.S.; Ratner, A. Droplets Combustion Characteristics Comparison of Single Component and Multicomponent Diesel Surrogates With Petroleum-Based Commercial Diesel Fuel. In Proceedings of the ASME 2023 International Mechanical Engineering Congress and Exposition, New Orleans, LA, USA, 29 October–2 November 2023. [Google Scholar]
  29. Salahi, M.M.; Mahmoudzadeh Andwari, A.; Kakoee, A.; Hyvonen, J.; Gharehghani, A.; Mikulski, M.; Lendormy, É. Novel Chemical Kinetics Mechanism for Robust Simulation of Multi-Component Fuel Blends in Engine Conditions. In Proceedings of the Conference on Sustainable Mobility; SAE International: Warrendale, PA, USA, 2024. [Google Scholar]
  30. Dahham, R.Y.; Wei, H.; Zhang, R.; Li, J.; Shu, G.; Pan, J. Numerical Study for the Comparison between Direct Dual-Fuel Stratification and Reactivity-Controlled Compression Ignition of Ammonia-Based Engines. Appl. Therm. Eng. 2025, 258, 124624. [Google Scholar] [CrossRef]
  31. Mahdi, M.; Amin, S.; Andwari, M.; Kakoee, A.; Golbaghi, K. New Chemical Kinetics Mechanism for Simulation of Natural Gas/Hydrogen/Diesel Multi-Fuel Combustion in Engines. In Proceedings of the Second SIMS EUROSIM Conference on Modelling and Simulation, SIMS EUROSIM 2024, Oulu, Finland, 10–12 September 2024; pp. 11–12. [Google Scholar] [CrossRef]
  32. Rorimpandey, P.; Yip, H.L.; Srna, A.; Zhai, G.; Wehrfritz, A.; Kook, S.; Hawkes, E.R.; Chan, Q.N. Hydrogen-Diesel Dual-Fuel Direct-Injection (H2DDI) Combustion under Compression-Ignition Engine Conditions. Int. J. Hydrogen Energy 2023, 48, 766–783. [Google Scholar] [CrossRef]
  33. Wang, X.; Bu, H.; Chen, H.; Liu, J.; Chen, Z.; Gao, J. Numerical Investigation of Diesel Spray Combustion Characteristics in the Ammonia/Air Atmosphere. J. Energy Inst. 2024, 116, 101718. [Google Scholar] [CrossRef]
  34. Udaybhanu, G.; Jameel, A.G.A.; Roberts, W.L.; Mahendra Reddy, V. Development of Laminar Burning Velocity Prediction Model and Correlation of Iso-Octane Air Mixtures Using Artificial Neural Network. Energy 2024, 307, 132639. [Google Scholar] [CrossRef]
  35. Elkelawy, M.; El Shenawy, E.A.; Mohamed, S.A.; Elarabi, M.M.; Alm-Eldin Bastawissi, H. Impacts of EGR on RCCI Engines Management: A Comprehensive Review. Energy Convers. Manag. X 2022, 14, 100216. [Google Scholar] [CrossRef]
  36. Qi, D.; Ma, L.; Chen, R.; Jin, X.; Xie, M. Effects of EGR Rate on the Combustion and Emission Characteristics of Diesel-Palm Oil-Ethanol Ternary Blends Used in a CRDI Diesel Engine with Double Injection Strategy. Appl. Therm. Eng. 2021, 199, 117530. [Google Scholar] [CrossRef]
  37. Öztürk, E.; Can, Ö. Effects of EGR, Injection Retardation and Ethanol Addition on Combustion, Performance and Emissions of a DI Diesel Engine Fueled with Canola Biodiesel/Diesel Fuel Blend. Energy 2022, 244, 123129. [Google Scholar] [CrossRef]
  38. Sadeq, A.M. Combustion Advancements: From Molecules to Future Challenges; Amazon KDP: Seattle, WA, USA, 2023; ISBN 9798990783614. [Google Scholar]
  39. Bayramoğlu, K.; Yılmaz, S. Emission and Performance Estimation in Hydrogen Injection Strategies on Diesel Engines. Int. J. Hydrog. Energy 2021, 46, 29732–29744. [Google Scholar] [CrossRef]
  40. Rizvi, I.H.; Gupta, R. Numerical Investigation of Injection Parameters and Piston Bowl Geometries on Emission and Thermal Performance of DI Diesel Engine. SN Appl. Sci. 2021, 3, 626. [Google Scholar] [CrossRef]
  41. Plengsa-Ard, C.; Kaewbumrung, M. CFD Modelling Wall Heat Transfer inside a Combustion Chamber Using ANSYS Forte. IOP Conf. Ser. Mater. Sci. Eng. 2018, 297, 012036. [Google Scholar] [CrossRef]
  42. Rashid, N.M.H.N.A.; Hairuddin, A.A.; Rezali, K.A.M.; Masuri, S.U.; Mossa, A.A.M.A.; Jaafar, J.; Fitriyana, D.F. Computational Fluid Dynamics (CFD) Validation and Investigation the Effect of Piston Bowl Geometries Performance on Port Fuel Injection-Homogeneous Charge Compression Ignition (PFI-HCCI) Engines. J. Adv. Res. Numer. Heat Transf. 2024, 18, 30–48. [Google Scholar] [CrossRef]
  43. Aggarwal, S.K.; Fu, X.; Wijeyakulasuriya, S. Effects of Fuel Reactivity and Injection Timing on Diesel Engine Combustion and Emissions. Int. J. Green Energy 2016, 13, 431–445. [Google Scholar] [CrossRef]
  44. Nkol, F.P.N.; Freidy, E.J.; Banta, N.J.I.; Yotchou, G.V.T.; Abbe, C.V.N.; Mouangue, R.M. Simulating the Effect of Methanol and Spray Tilt Angle on Pollutant Emission of a Diesel Engine Using Different Turbulence Models. Int. J. Heat Technol. 2023, 41, 1105–1120. [Google Scholar] [CrossRef]
  45. Han, Z.; Reitz, R.D. Turbulence Modeling of Internal Combustion Engines Using RNG κ-ε Models. Combust. Sci. Technol. 1995, 106, 267–295. [Google Scholar] [CrossRef]
  46. Kumar, A.; Bharti, R.P. Evaluation of Rans-Based Turbulence Models for Isothermal Flow in a Realistic Can-Type Gas Turbine Combustor Application. J. Comput. Sci. 2024, 81, 102362. [Google Scholar] [CrossRef]
  47. Sonachalam, M.; Manieniyan, V. Optimization of Critical Angle, Distance and Flow Rate of Secondary Fuel Injection in DI Diesel Engine Using Computational Fluid Dynamics. SN Appl. Sci. 2021, 3, 126. [Google Scholar] [CrossRef]
  48. Abay, M. Computational Fluid Dynamics Analysis of Flow and Combustion of a Diesel Engine. J. Therm. Eng. 2017, 4, 1878–1895. [Google Scholar] [CrossRef]
  49. Chakchak, S.; Hidouri, A.; Ghabi, A.; Chrigui, M.; Boushaki, T. Numerical Study of Turbulent Swirling Diffusion Flame Under Lean and Rich Conditions Using Turbulence Realizable K-Epsilon Model. Combust. Sci. Technol. 2023, 195, 1461–1482. [Google Scholar] [CrossRef]
  50. Liu, Z.; Wijeyakulasuriya, S.; Mashayekh, A.; Chai, X. Investigation of Reynolds Stress Model for Complex Flow Using CONVERGE. In Proceedings of the WCX SAE World Congress Experience; SAE International: Warrendale, PA, USA, 2020. [Google Scholar]
  51. Singh, S.; Reitz, R.D.; Musculus, M.P.B. Comparison of the Characteristic Time (CTC), Representative Interactive Flamelet (RIF), and Direct Integration with Detailed Chemistry Combustion Models against Optical Diagnostic Data for Multi-Mode Combustion in a Heavy-Duty DI Diesel Engine. In Proceedings of the SAE 2006 World Congress & Exhibition; SAE International: Warrendale, PA, USA, 2006. [Google Scholar]
  52. Yoshikawa, T.; Reitz, R.D. Validation of a Grid Independent Spray Model and Fuel Chemistry Mechanism for Low Temperature Diesel Combustion. Int. J. Spray Combust. Dyn. 2009, 1, 283–316. [Google Scholar] [CrossRef]
  53. Xu, C.; Zhong, A.; Wang, C.; Jiang, C.; Li, X.; Zhou, K.; Huang, Y. Combustion Characteristics and Laminar Flame Speed of Premixed Ethanol-Air Mixtures with Laser-Induced Spark Ignition. Biofuels Eng. 2017, 2, 63–72. [Google Scholar] [CrossRef]
  54. Performance of a CI Engine Operating in Highly Premixed Late Injection and Low Temperature Combustion Mode to Achieve Cleaner Emission—A CFD Analysis. In Proceedings of the International Conference on Mechanical, Industrial and Energy Engineering (ICMIEE), Khulna, Bangladesh, 22–24 December 2022.
  55. Torn, D. SIMULACION CFD DE LA INYECCI ‘ON Y’ COMBUSTION CON SISTEMA DUAL-FUEL EN UN MCI HEAVY-DUTY. 2020. Available online: http://hdl.handle.net/2117/340307 (accessed on 20 February 2025).
  56. Lapointe, S.; Zhang, K.; McNenly, M.J. Reduced Chemical Model for Low and High-Temperature Oxidation of Fuel Blends Relevant to Internal Combustion Engines. Proc. Combust. Inst. 2019, 37, 789–796. [Google Scholar] [CrossRef]
  57. Mondo, K.; Agrebi, S.; Hamdi, F.; Lakhal, F.; Sadiki, A.; Chrigui, M. Impact of Multi-Component Surrogates on the Performances, Pollutants, and Exergy of IC Engines. Entropy 2022, 24, 671. [Google Scholar] [CrossRef] [PubMed]
  58. Curran, H.J.; Gaffuri, P.; Pitz, W.J.; Westbrook, C.K. A Comprehensive Modeling Study of N-Heptane Oxidation. Combust. Flame 1998, 114, 149–177. [Google Scholar] [CrossRef]
Figure 1. (a) 3D geometry of the combustion chamber; (b) mesh layout of the computational domain.
Energies 18 01082 g001
Figure 2. Comparison of in-cylinder pressure in the CI engine between the current study, Lapointe et al. [56], Mondo et al. [57], Curran et al. [58], and Pei et al. [24].
Energies 18 01082 g002
Figure 3. In-cylinder pressure distribution at: (a) 0% EGR; (b) SOI −22.5°.
Energies 18 01082 g003
Figure 4. In-cylinder temperature distribution at: (a) 0% EGR; (b) SOI −22.5°.
Energies 18 01082 g004
Figure 5. The heat release rate variation at: (a) 0% EGR; (b) SOI −22.5°.
Energies 18 01082 g005
Figure 6. Variation in CO mass fraction across CA: (a) 0% EGR; (b) SOI −22.5°.
Energies 18 01082 g006
Figure 7. Unburned hydrocarbon emission depending on: (a) 0% EGR; (b) SOI −22.5°.
Energies 18 01082 g007
Figure 8. EINOx distribution at: (a) 0% EGR; (b) SOI −22.5°.
Energies 18 01082 g008
Figure 9. Fuel vapor mass fraction contour comparison at various CA.
Energies 18 01082 g009
Table 1. Engine specification.
ParametersUnitDescription
Engine type Cummins N-14 DI diesel
Number of cylinders 1
Swirl ratio 0.5
Engine RPM 1200
Borecm13.97
Strokecm15.24
DisplacementL2.34
Connecting rod lengthcm30.48
Compression ratio 16.0
Fuel injector type Common rail
Number of nozzles 8, equally spaced
Table 2. Chemical properties.
Fuel PropertiesUnitValue
Density at 298 Kkg/m3684
Boiling pointK371
Ignition temperatureK496
Lower heating valueKJ/kg44,926
Heat of vaporizationKJ/mol31.77
ViscositymPa·s0.42
Cetane number 56
Table 3. Constant values in standard k-ε model and RNG k-ε model.
Model C μ C ε 1 C ε 2 C ε 3 1 / P r k 1 / P r ε η 0 β
Standard k-ε model 0.091.441.92−1.01.00.769--
RNG k-ε model0.08451.421.68-1.391.394.380.012
Table 4. Cell numbers and their corresponding maximum pressure and temperature.
Cell NumbersMaximum Pressure (MPa)Maximum Temperature (K)
13868.341215
82628.461236
15,5608.481237
17,6198.511249
21,7848.511240
32,6718.51238
Table 5. Boundary conditions.
VariablesUnitDescription
Engine speedrpm1200
Piston temperatureK500
Cylinder wall temperatureK420
Cylinder head temperatureK470
SOIdeg−17.5, −22.5, −27.5, −32.5
Injection durationdeg7.75
Injected fuel massmg53.5
Heat transfer model Han-Reitz
Droplet breakup model Kelvin Helmholtz-Rayleigh Taylor (KH-RT)
Combustion model G-equation
Table 6. Numerical parameters.
VariablesDescription
Turbulence modelRNG k-ε
Epsilon coefficient 11.42
Epsilon coefficient 21.68
Viscosity coefficient0.085
RNG beta parameter0.012
Epsilon spray coefficient1.5
Droplet breakup modelKH-RT
Size constant of KH breakup1.0
Time constant of KH breakup40
Size constant of RT breakup0.15
Time constant of RT breakup1.0
RT distance constant1.9
Droplet size distributionUniform
Reaction mechanismn-haptane
No. of species36
No. of reactions74
Disclaimer/Publisher’s Note: The statements, opinions and data contained in all publications are solely those of the individual author(s) and contributor(s) and not of MDPI and/or the editor(s). MDPI and/or the editor(s) disclaim responsibility for any injury to people or property resulting from any ideas, methods, instructions or products referred to in the content.

