Article

Simulation and Analysis of Different Bipolar Plate Geometrical Parameters on the Performance of PEM Fuel Cells Applying the Taguchi Method

Product Innovation & Multiphysics Simulation Unit, Eurecat, Centre Tecnològic de Catalunya, Av. Universitat Autònoma, 23, 08290 Cerdanyola del Vallès, Spain
*
Author to whom correspondence should be addressed.
Energies 2025, 18(4), 986; https://doi.org/10.3390/en18040986
Submission received: 29 January 2025 / Revised: 13 February 2025 / Accepted: 17 February 2025 / Published: 18 February 2025

Abstract

:
This study examines the impact of key stamping process parameters on metallic bipolar plates for Proton Exchange Membrane Fuel Cell (PEMFC) performance using computational fluid dynamics (CFD) combined with thermal and electrochemical simulations and applying the design of experiments based on the Taguchi method. An exhaustive study on this topic is not found in the literature, and this study aims to identify the most influential parameters and their interactions to optimize channel geometries for enhanced PEMFC performance within manufacturing limits. Main effects analysis revealed the BP–GDL contact length-to-pitch ratio as the most influential parameter, achieving the best performance at its higher end (0.4). The external radius showed improved performance at a lower value (0.14 mm), while pitch and channel height had smaller effects, favoring lower values (1 mm and 0.3 mm, respectively). The channel angle exhibited minimal impact but slightly improved performance at 35°. Interaction analysis highlighted a complex relationship between pitch and angle, indicating that their combined effects on current density vary with specific value combinations. A higher pitch (2.5 mm) reduced performance with lower angles, whereas a lower pitch (1 mm) improved performance with reduced angles. Finally, two new geometrical designs derived from these optimized parameter combinations enhanced fuel cell performance by 1.97% and 1.23% over the baseline, demonstrating the Taguchi method’s value in optimizing the geometrical design of metallic bipolar plates in PEMFCs. These findings contribute to advancing more efficient and practical fuel cell technologies.

1. Introduction

Proton Exchange Membrane (PEM) fuel cells have emerged as a compelling alternative energy source, recognized for their high efficiency, minimal emissions, and wide-ranging applications [1,2], and thus, playing a crucial role in balancing energy generation and consumption [3,4,5]. PEMFCs operate electrochemically, ensuring efficient energy conversion and a rapid response to fluctuations in demand. This makes them ideal for grid stabilization and integration with intermittent renewable energy sources. Additionally, PEMFCs offer a long operational lifespan and a compact design, further contributing to their cost-effectiveness and adaptability [6].
The performance and cost-efficiency of PEM fuel cells are influenced by several factors, particularly the selection of bipolar plate materials and the design of flow channels [7,8]. Bipolar plates are critical components in PEM fuel cells, as they ensure the efficient distribution of reactants, improve mass transfer, and minimize pressure drop. Therefore, selecting cost-effective bipolar plate materials that sustain optimal fuel cell performance is crucial for the widespread integration of PEM fuel cells in the highly competitive global market [9,10].
Studies on the configuration of channels within bipolar plates have aimed at enhancing fuel cell designs while reducing pressure losses. This includes examining channel patterns and layouts to achieve effective reactant distribution and lower flow resistance.
Numerous studies have investigated how different flow field configurations affect fuel cell performance, particularly in Proton Exchange Membrane Fuel Cells (PEMFCs). For instance, Arif et al. [11] and Carcadea et al. [12] analyzed serpentine flow channel designs to improve PEMFC performance. Arif et al. found that the three-channel serpentine design offered better gas distribution and lower pressure drop. Carcadea et al. identified the 14-channel serpentine configuration as the most effective at high current densities, with shallower channels enhancing water removal and membrane humidification, leading to higher current output.
Chen et al. [13] and Limjeerajarus and Charoen-Amornkitt [14] investigated the effects of parallel channels on PEMFC performance. Chen et al. developed a validated 3D multiphysics model and found that a parallel–serpentine–parallel configuration enhanced oxygen distribution and electrochemical performance, highlighting the potential of compensation flow fields for stack development. Limjeerajarus and Charoen-Amornkitt analyzed six flow field designs in a small-scale PEMFC, concluding that fewer channels improved uniformity and performance. Their study also emphasized that as the number of channels increased, geometric configuration had a greater impact on overall efficiency.
Although significant research has been conducted on the channel distribution in bipolar plates, little attention has been given to examining the shape and cross-section of the channels.
Al-Okbi et al. [15] compared square and triangular cross-section channels, finding that triangular channels offered better PEMFC performance due to more consistent velocity distributions at both the inlet and outlet. Xu et al. [16] explored wave-shaped flow channels and grooves in the gas diffusion layer (GDL), discovering that grooves improved mass transfer and increased net power density, with the best design featuring nine wavy cycles. In another study, Xu et al. [17] examined trapezoidal channels and baffles, concluding that optimizing the contact area between the channel and GDL significantly boosted current density, with trapezoidal channels delivering higher efficiency and performance than standard straight channels.
Collectively, these studies highlight the critical role of optimizing channel shape in the design of PEM fuel cells, which is essential for developing more efficient and high-performance fuel cell systems. Concerning materials, metallic bipolar plates offer significant advantages compared with bipolar plates made from materials like graphite, including reduced weight, lower production costs, and enhanced mechanical strength, making them particularly well suited for applications where minimizing weight and cost are crucial [18]. In addition, the potential for shaping metallic bipolar plates through stamping processes has attracted significant research attention. Stamping, a widely used manufacturing technique, allows for complex geometries with a high level of precision that improve reactant distribution and feature excellent repeatability, cost-effectiveness for large production runs, and durability, making it an advantageous method for fuel cell applications [19,20]. On the other hand, they also face certain challenges that require attention. Issues like corrosion and springback pose potential risks to their long-term performance and production. These challenges can be influenced by variations between different batches of material and by manufacturing methods, highlighting the importance of meticulous material selection, material quality control, and the implementation of effective surface treatment techniques [20].
Neto et al. [21] conducted a numerical investigation of the formability of metallic bipolar plates for PEM fuel cells, examining how channel shape affects both manufacturability and performance. Meanwhile, Wilberforce et al. [22] analyzed the impact of various bipolar plate materials—aluminum, copper, and stainless steel—on a single PEM fuel cell stack through both numerical and experimental methods. Their findings indicated that aluminum serpentine bipolar plates outperformed those made from copper and stainless steel.
On the other hand, the Taguchi method is widely used as an effective method of arranging experiments, as it is a systematic approach that allows the design of efficient systems at a minimized resource cost [23,24].
Although it has not been extensively used for PEMFC design and simulation, a few examples can be found. Amadane et al. [25] developed a 3D model to analyze water flooding effects using the Taguchi method to find the optimal conditions for relative humidity, GDL porosity, temperature, and pressure. The results showed optimal power densities based on varying relative humidity at the anode and cathode for different conditions.
Parallelly, Yan et al. [26] developed a 3D simulation model of PEMFCs, validated against experimental data, and applied the Taguchi method to analyze how anode channel distortion, gas diffusion layer thickness, and porosity affect current density. The study identified optimal structural parameters that led to increased current density, demonstrating the effectiveness of the Taguchi method through single-factor experiments.
Despite progress in fuel cell modeling [27], research on channel geometries that both align with manufacturing processes and improve fuel cell performance remains limited. Moreover, the Taguchi method as a tool for PEMFC optimization has not been widely used, and previous publications indicate its use only for operation conditions and GDL characterization optimization, but its use to study the effects of different geometrical parameters on channel definition in bipolar plate design is yet to be tackled.
Building on our previous work [28], this study aims to address this gap by combining computational fluid dynamics (CFD) with thermal and electrochemical simulations. The novelty of this study lies in its thorough geometrical analysis by using the Taguchi method, which is not found in the current literature. Five different parameters have been defined to be of importance in a stamping process, and this research uncovers how these factors affect fuel cell performance and identifies the most influential parameters and their interactions. The goal is to determine optimal channel geometries that enhance performance while meeting sheet metal forming requirements, facilitating the efficient and cost-effective production of fuel cell bipolar plates.

2. Methodology

2.1. Design of Experiments (DOE): Taguchi Method

The Taguchi method is a design of experiments (DOE) methodology that involves the use of orthogonal matrices where the parameters that affect the process and the levels between which they could vary are organized [26]. The key difference is that unlike a factorial design, which tests all possible combinations, the Taguchi method tests pairs of combinations. This approach enables the collection of essential data to identify the most influential factors, thus reducing the number of experiments [24,29].
The methodology uses the values 1 and 2 to denote the high and low levels instead of the usual ± notation, since the possibility of more than 2 levels in each factor is considered. The L8 design matrix allows a factorial design of up to a maximum of 7 factors with 2 levels, which can be used for a factorial design with fewer factors [30].
To analyze the results, several statistical methods can be used. In this paper, these two methods are followed [31]:
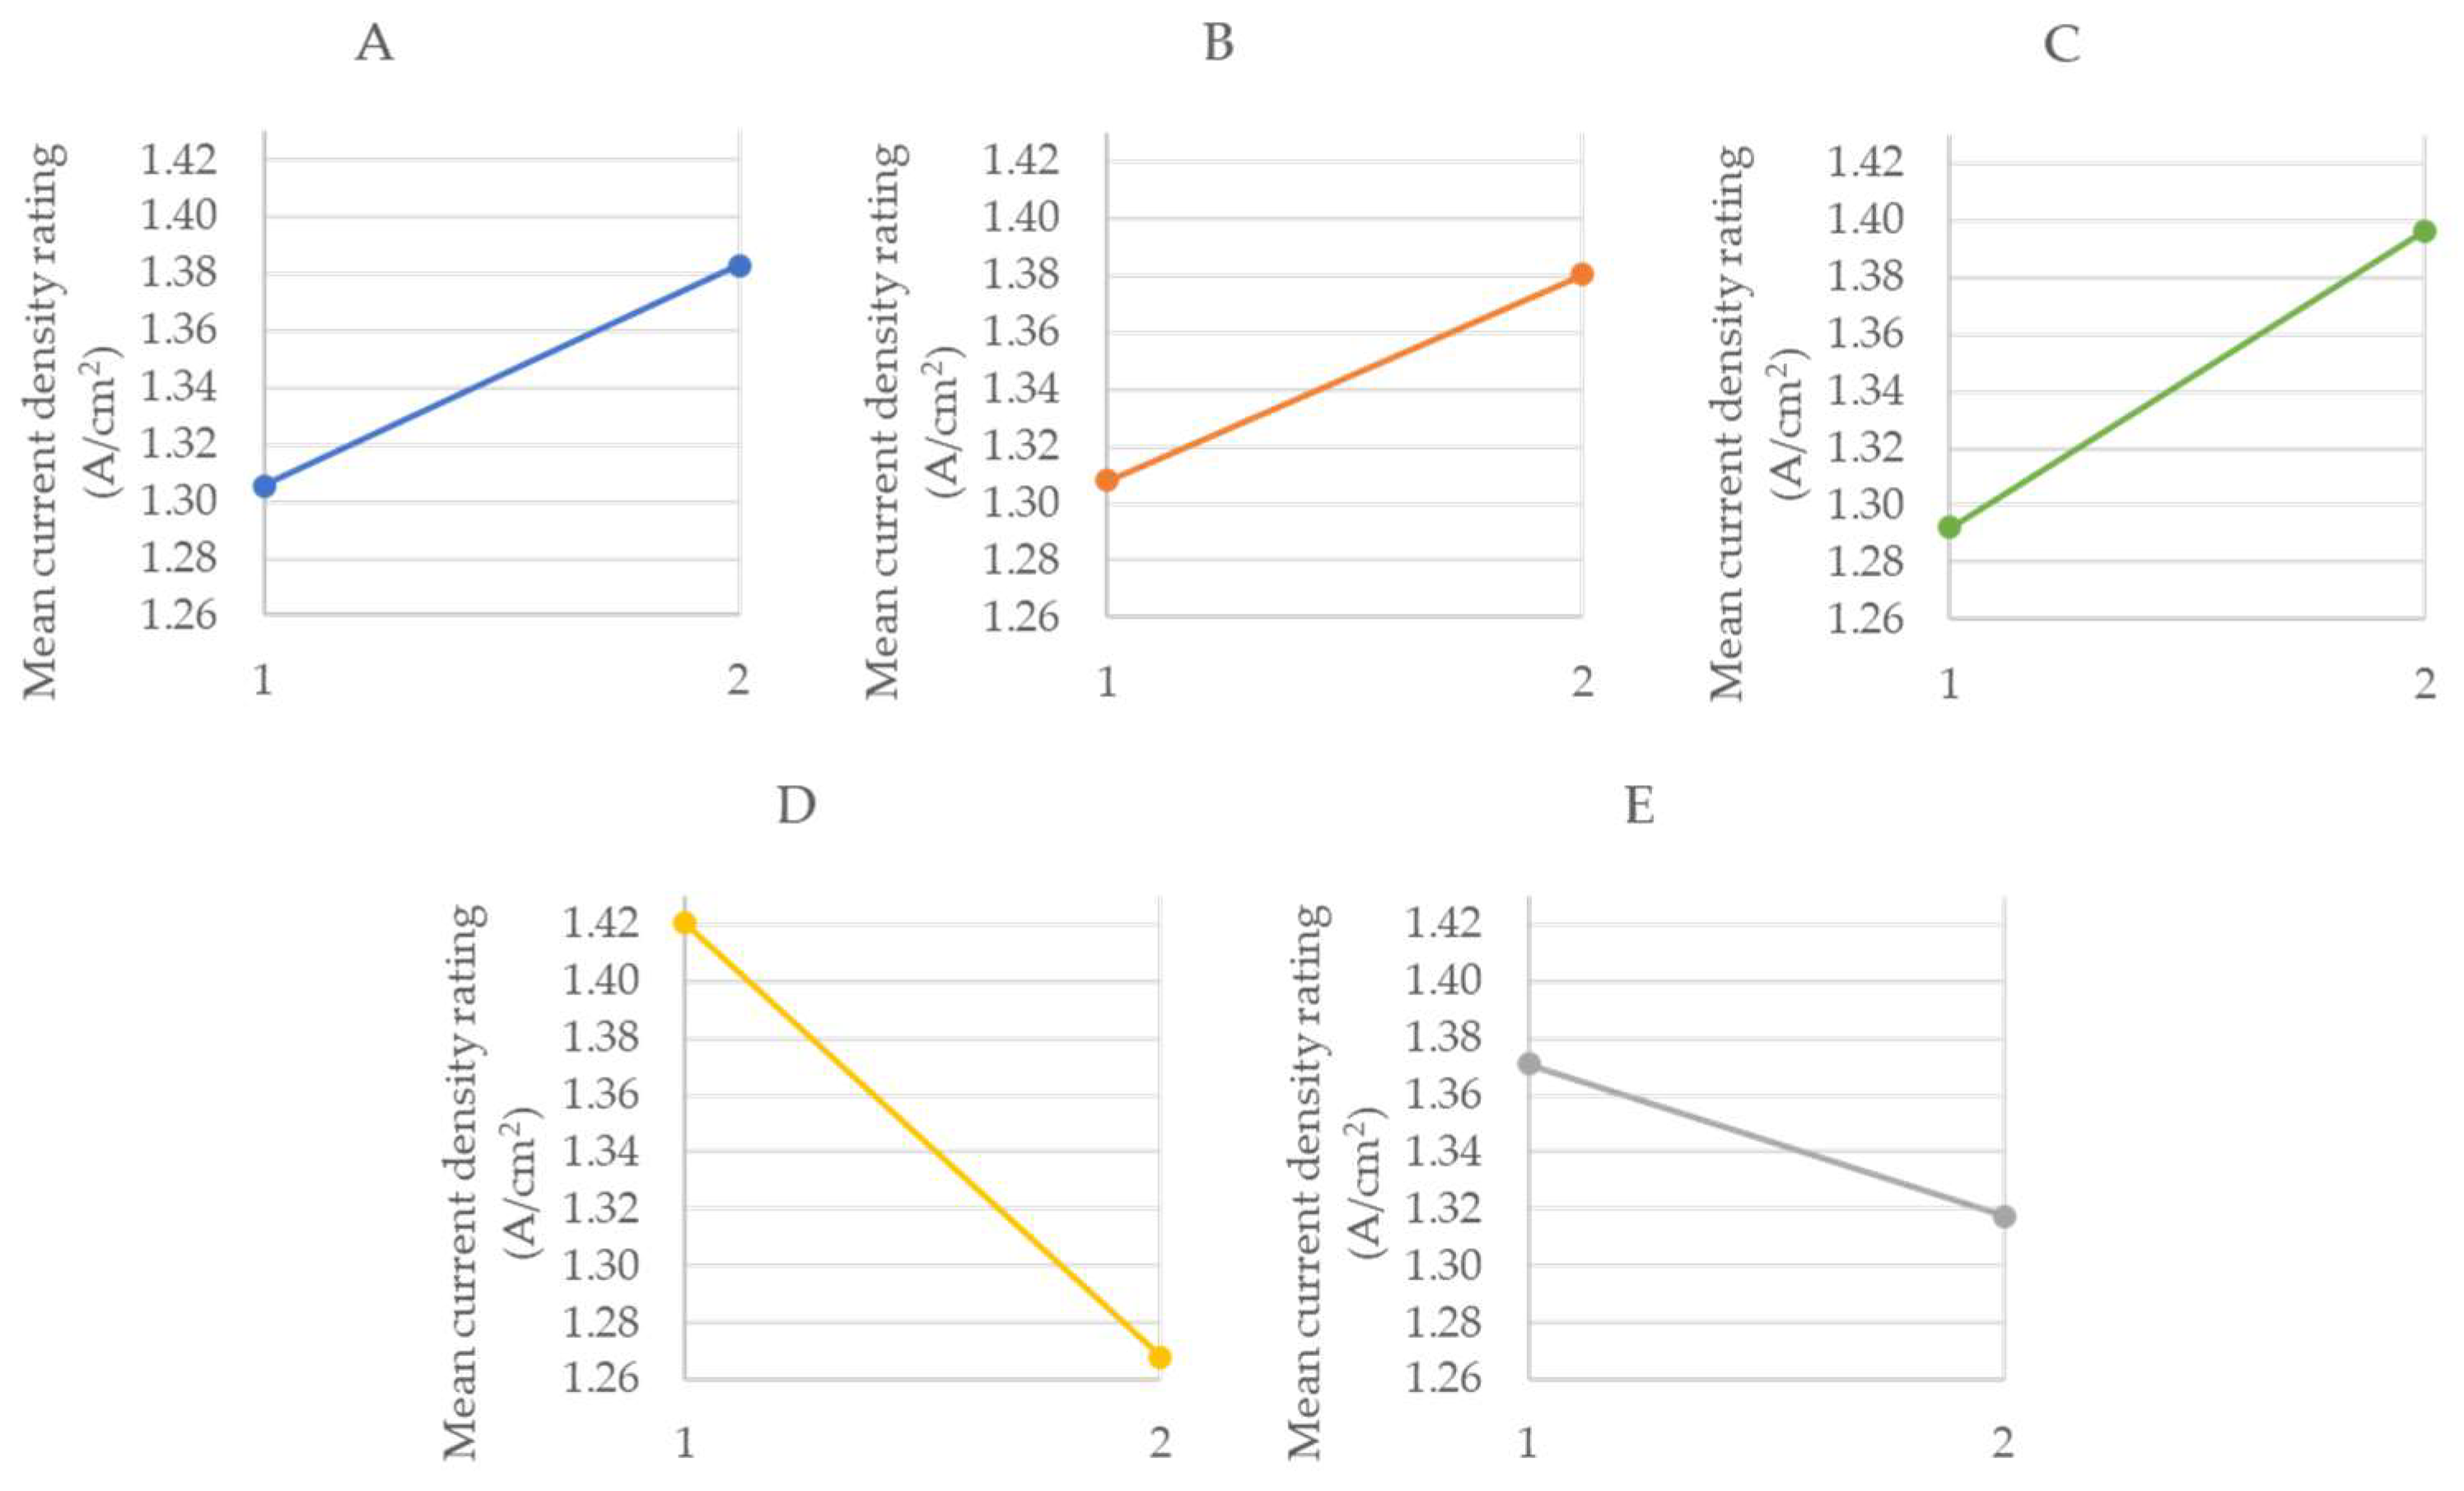
  • Column effects method: this method is essentially a quick check on the relative importance of each factor (main effects). The average effects (mean effect—ME) are analyzed for each parameter.
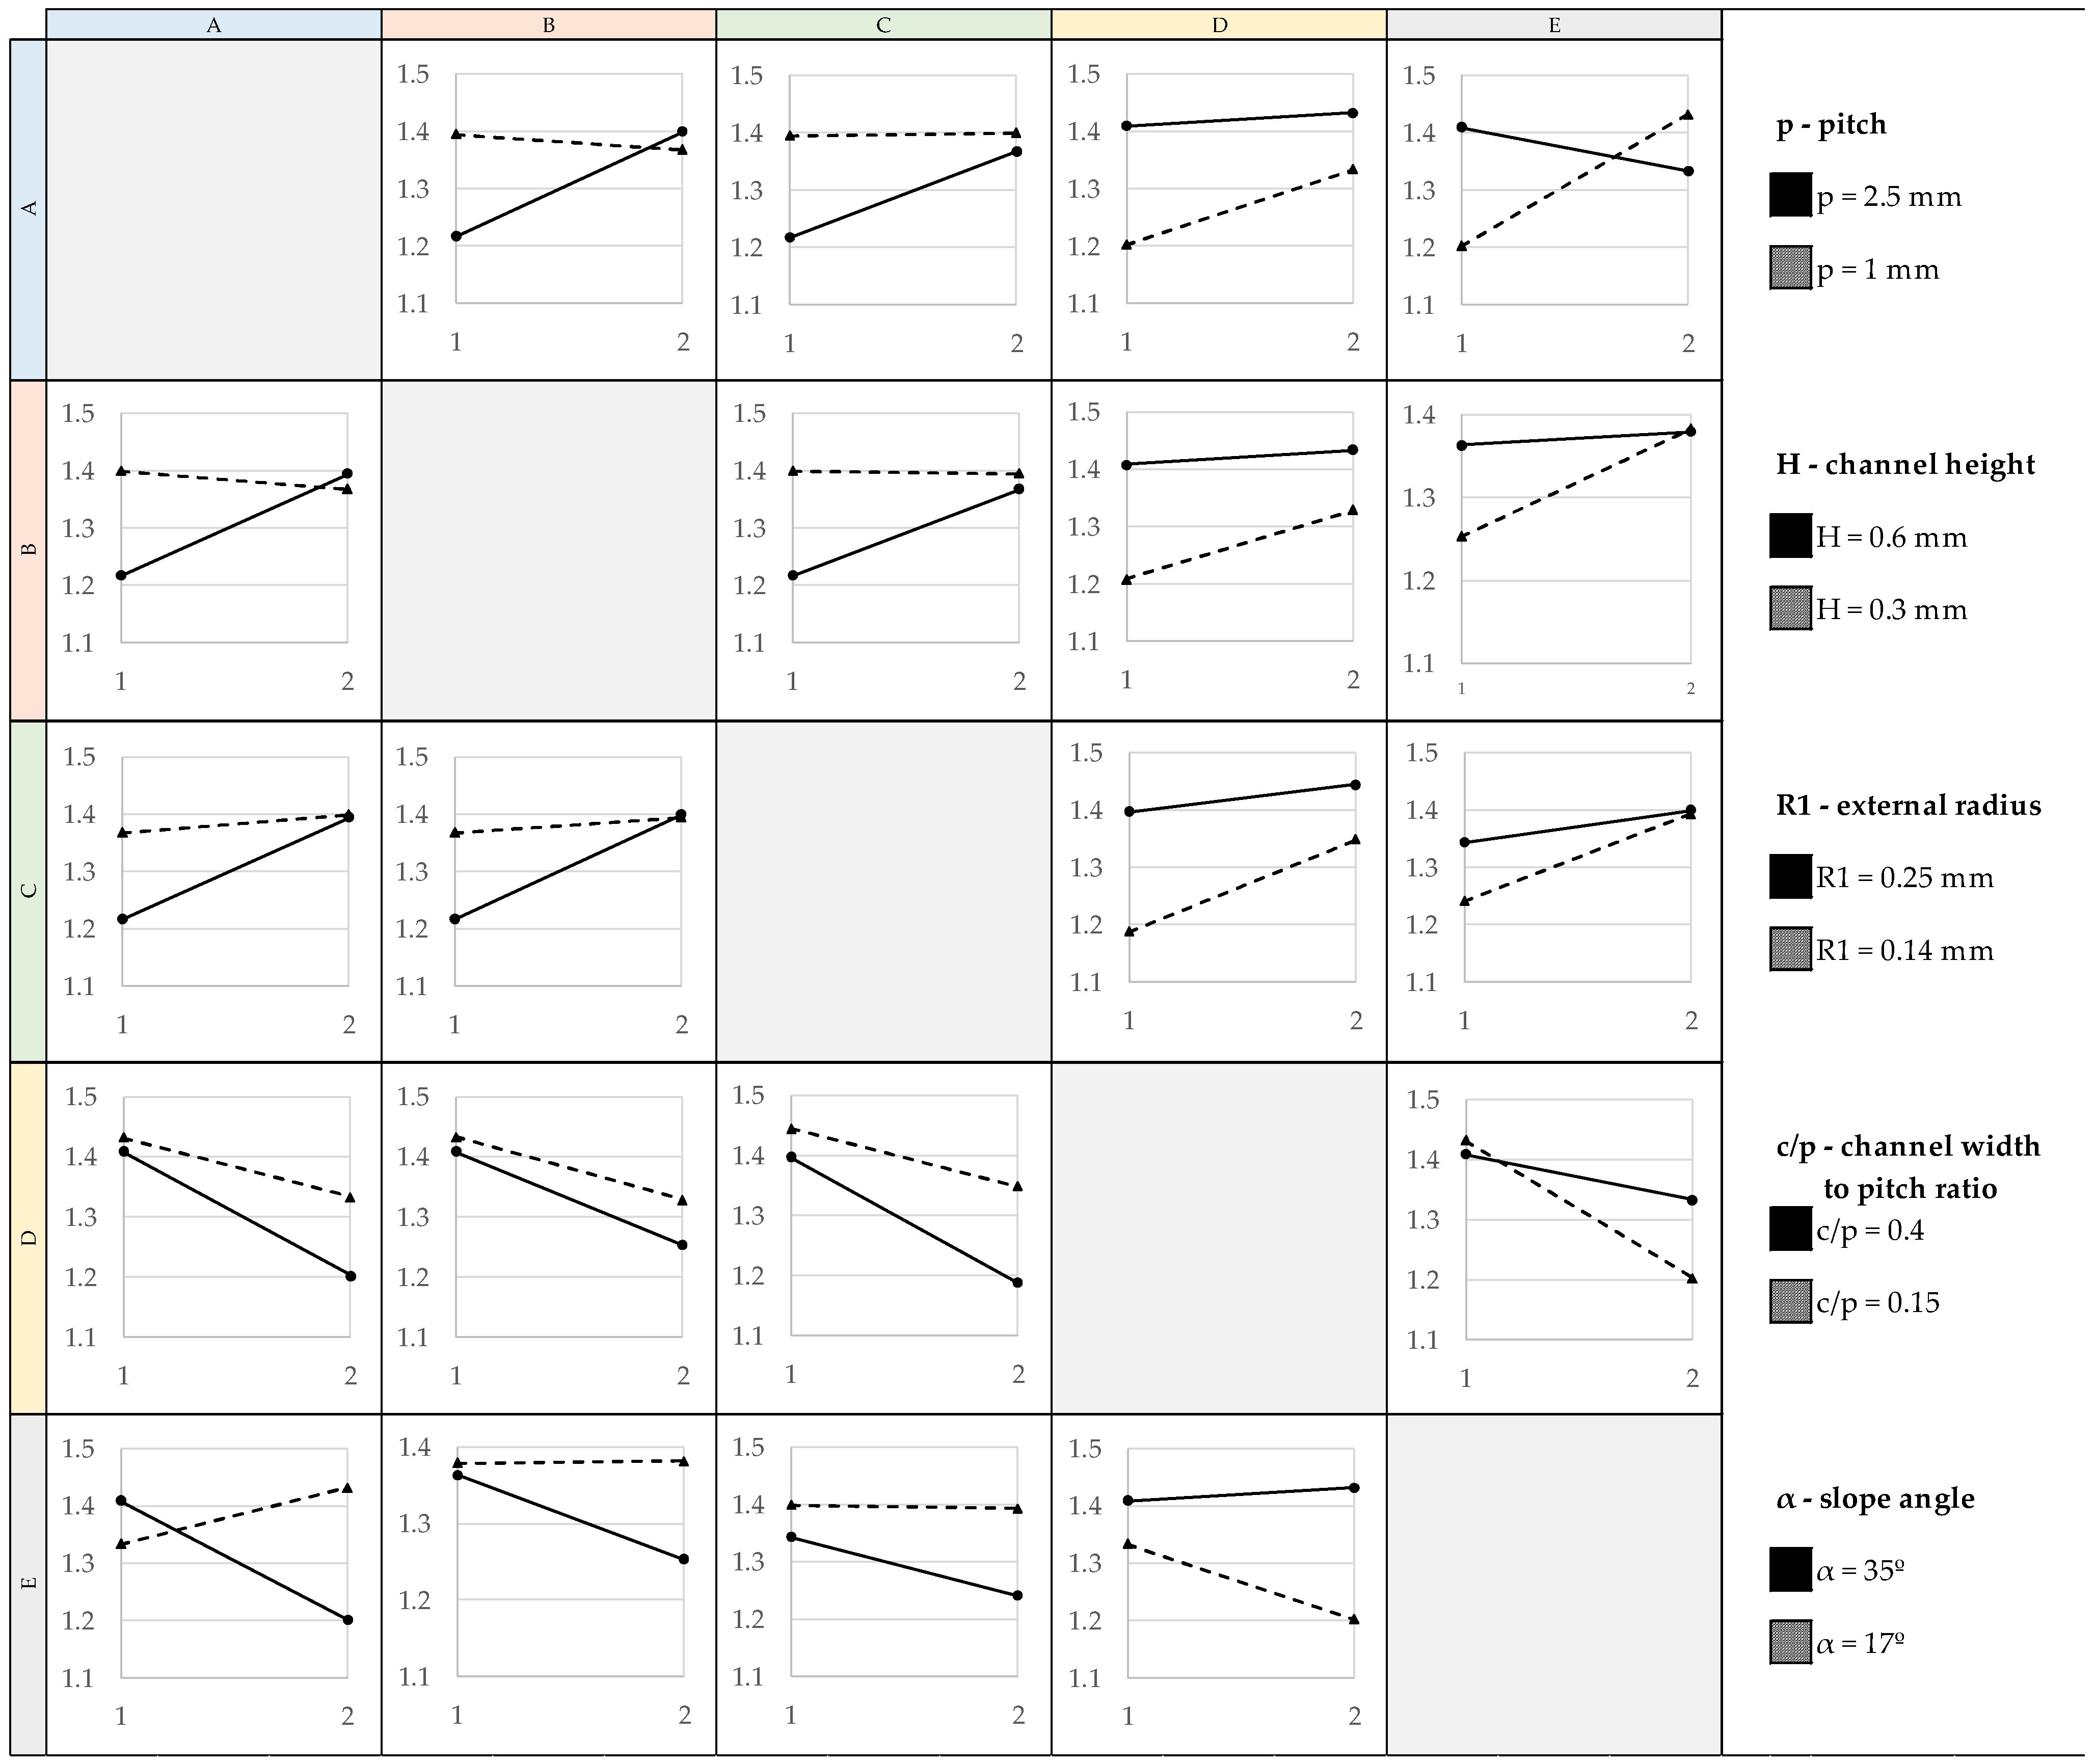
  • Graphical method: the MEs are graphed for each factor individually, obtaining practically the same information as in the previous method. It is also possible to draw the interactions between factors, obtaining two lines in each graph. If these lines are parallel, it is estimated that these parameters do not have an interaction; however, if these lines cross, the parameters have a high interaction.
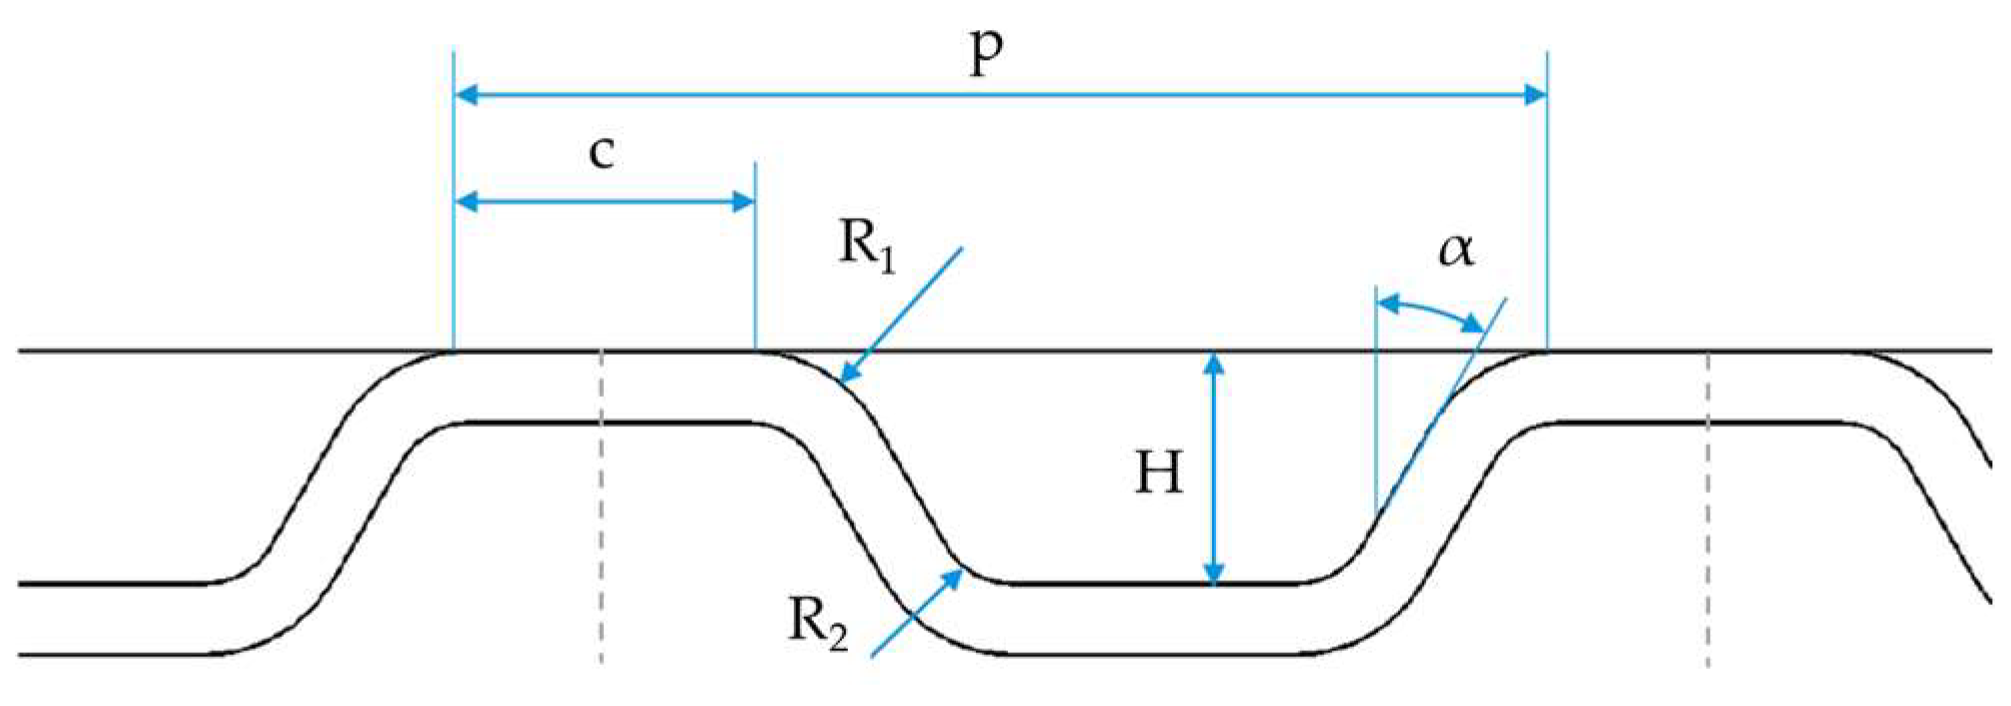
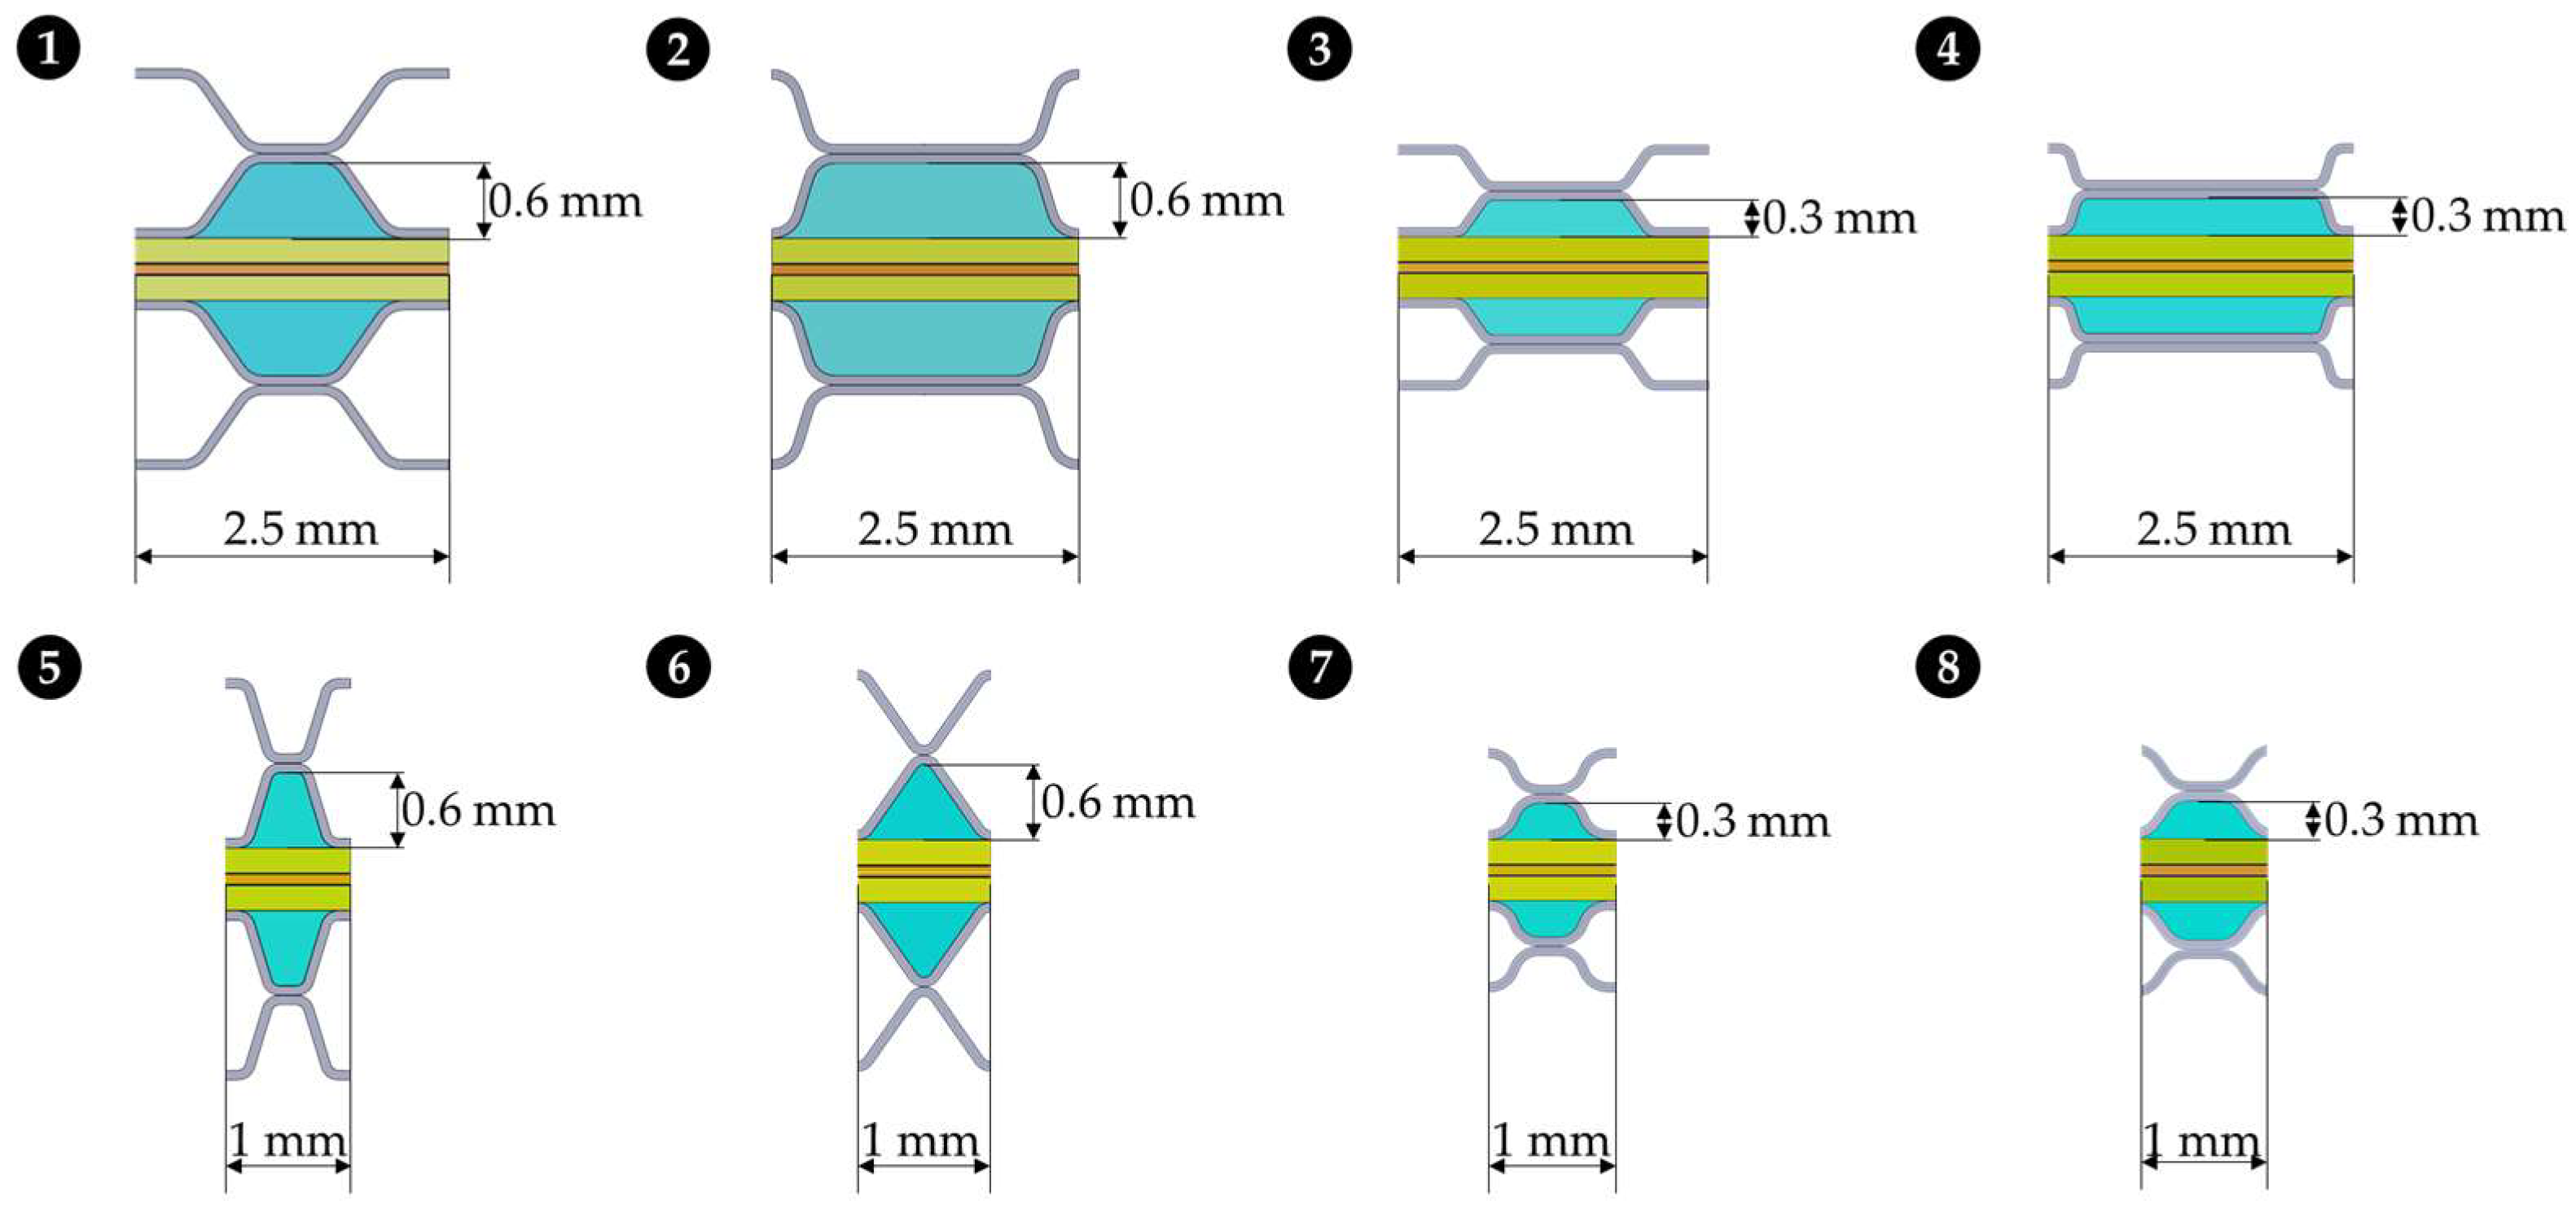
As stated, L8 Taguchi matrix allows up to 7 factors with 2 levels (P = 7, L = 2), but in this study, 5 parameters are detected with possible influence on the PEMFC behavior. These parameters are depicted in Figure 1 and correspond to p—pitch (A), H—channel height (B), R1—external radius (R1 = R2 + 0.075 mm) (C), c/p—BP–GDL contact length-to-pitch ratio (D), and α—angle (E). Parameters from A to E are defined within 2 levels according to manufacturing possibilities and constraints. Thus, P = 5, L = 2 matrix is defined in Table 1.

2.2. Analyzed Cases

To evaluate the effects of these parameters and their impact on performance, and as described in Table 1, 8 different geometries are modeled using computer-aided design software (2023). Figure 2 shows channel cross-section for all geometries, where the channel is depicted in cyan, and the bipolar plate is shown in gray. Membrane is colored in orange, catalyst layers in dark blue, and finally, GDLs are shown in ochre. GDL, catalyst, membrane, and bipolar plate thicknesses are maintained for all geometries at 200, 10, 80, and 75 µm, respectively, as well as channel length that corresponds to 10 mm for all cases. To reduce computational cost, only the channel is modeled, with symmetry conditions on both sides.
Based on previous work [28], it is understood that the fuel cell’s reactivity depends on the ability of hydrogen to diffuse toward the membrane. Therefore, increasing the contact area between the channel and the GDL is expected to enhance performance [15,17,32,33]. Thus, a complementary analysis of geometry-based theoretical results is shown in Table 2, which indicates that cases 2 and 8 have higher contact area ratios (MEA area/contact area), while cases 1 and 3 reach a larger BP–GDL contact area ratio. All these factors have an impact on the current density generated by each of the cases; however, the results highlight that it is not possible to extract conclusions based on only geometry without simulating the performance, as the superiority of any of the cases over the others is not clear.

2.3. Mesh

The corresponding 3D geometries are imported into the Ansys Workbench mesher, where they are discretized into small computational elements. Given the complex physical and electrochemical processes within the MEA, PEM fuel cell simulations require a fine and detailed mesh [11,34]. The system has high aspect ratios due to the large variation in length scales from 10 µm in the catalyst layers to 10 mm along the channel length. As a result, employing a hexahedral mesh, where feasible, is the most practical approach in this context [35].
Following the same criteria as in our previous work [28], where a mesh independence study was carried out and the simulation was validated against experimental results, showing good agreement [36], 3 layers of cells are placed across the catalysts, 4 on the membrane, and 6 on the GDL layers.

2.4. Model Assumptions and Governing Equations

In a PEMFC, hydrogen is supplied to the anode and air to the cathode for power generation. The electrochemical reactions described below then occur at the electrodes [1]:
H 2 2 H + + 2 e ( a n o d e )
1 2 O 2 + 2 e + 2 H + H 2 O ( c a t h o d e )
Electrons generated at the anode travel through an external circuit to the cathode, while protons move through the membrane. At the same time, water is produced at the cathode as a result of osmotic drag and electrochemical reactions. When the water vapor pressure exceeds the saturation pressure, liquid water is formed [13,34].
To simulate the multiphysical phenomena, ANSYS Fluent software (2023 R2) with the PEM Fuel Cell Module is utilized. This module facilitates the modeling of electrochemistry, ionic and protonic charge transport, gas species transport, and the generation and movement of liquid water and energy, allowing for the analysis of fuel cell performance across various channel geometries.
Key assumptions made for the model are as follows [13,37]:
  • The operation of the PEM fuel cell is under non-isothermal and steady-state conditions.
  • Ideal gas laws are followed by all gas species.
  • MEA materials are assumed to be isotropic.
  • Transport and formation of liquid water are included.
The primary governing equations for modeling PEMFCs are based on the conservation of mass, momentum, species transport, charge, and energy [38]. A brief overview of these equations is provided in this section, with a more detailed explanation available in the ANSYS PEM Fuel Cell Module manual [38].
Mass conservation:
· ρ u = S m
S m is a source term and varies according to Equations (4)–(6). At the anode, hydrogen is consumed and transported to the cathode, which leads to the application of source term (4). At the cathode, oxygen is consumed at the rate specified by source term (5), and as a result of the oxygen reduction reaction, liquid water is formed at the cathode at a rate described by (6).
S H 2 = M w , H 2 2 F R a n < 0
S O 2 = M w , O 2 4 F R c a t < 0
S H 2 O = M w , H 2 O 2 F R c a t > 0
Momentum conservation:
· ρ   u   u i = · μ u i p i + S m o m , i                     i = x ,   y , z
where S m o m , i is a source term that has the following equation for catalyst layers and GDL regions:
S m o m , i = μ K i g u i
Charge conservation:
Electronic and protonic potentials are solved using conservation of charge equations.
· σ s o l ϕ s o l + R s o l = 0
· σ m e m ϕ m e m + R m e m = 0
where R s o l equals R a n at the anode side and + R c a t   at the cathode side, and R m e m equals + R a n at the anode side and R c a t   at the cathode side.
Source terms ( R ) of Equations (9) and (10) are modeled using the Butler–Volmer equations given in (11) and (12).
R a n = ζ a n j a n r e f H 2 H 2 r e f γ a n e α a n F η a t R T e α c a t F η a n R T
R c a t = ζ c a t j c a t r e f O 2 O 2 r e f γ c a t e α a n F η c a t R T + e α c a t F η c a t R T
Most variables, such as reference exchange current density per active surface area (jref), specific active surface area (ζ), and charge transfer coefficients (α) are input parameters and are detailed in Table 3. Parallelly, [H2,O2,H2]ref and [O2]ref refer to the concentration of species in anode and cathode reactions.
Energy conservation:
The variation in the temperature balances and conserves the energy within the PEMFC [39]:
· ρ c T u T = · k T e f f T + S h
where S h represents the additional volumetric sources incorporated into the thermal energy equation, as not all the chemical energy released in the electrochemical reactions can be converted into electrical work due to the irreversibility of the processes [38].
𝑆 = ℎ𝑟𝑒𝑎𝑐𝑡 − 𝑅𝑎𝑛,𝑐𝑎𝑡𝜇𝑎𝑛,𝑐𝑎𝑡 + 𝐼2𝑅𝑜ℎ𝑚+ℎ𝐿

2.5. Input Parameters, Boundary Conditions, and Material Properties

The model’s primary input parameters, such as charge transfer coefficients and exchange current densities, are kept at default values for comparison purposes, as shown in Table 3. Table 4 lists the operating parameters used for all the studied geometries, with hydrogen gas supplied to the anode and air fed to the cathode at a constant rate. Terminal walls are located at the external faces of the anode and cathode in contact with the next BP, and their temperature is kept constant at 80 °C. At the inlets, temperature is also 80 °C. Parallelly, a symmetry boundary condition is implemented on the left and right faces in Figure 2, and the remaining walls are considered adiabatic. Finally, Table 5 includes the material properties used for simulation [40].

2.6. Solver Setup

Simulations are performed on a computing server equipped with 2 Intel Xeon Gold 6442Y processors and 512 GB of RAM. Each simulation utilizes 10 cores and reaches convergence for a single voltage point in about 20 min (4 h per geometry). The simulations use first-order upwind spatial discretization and the SIMPLE pressure–velocity coupling scheme, following the methodologies applied in previous studies [11,14,28,39].

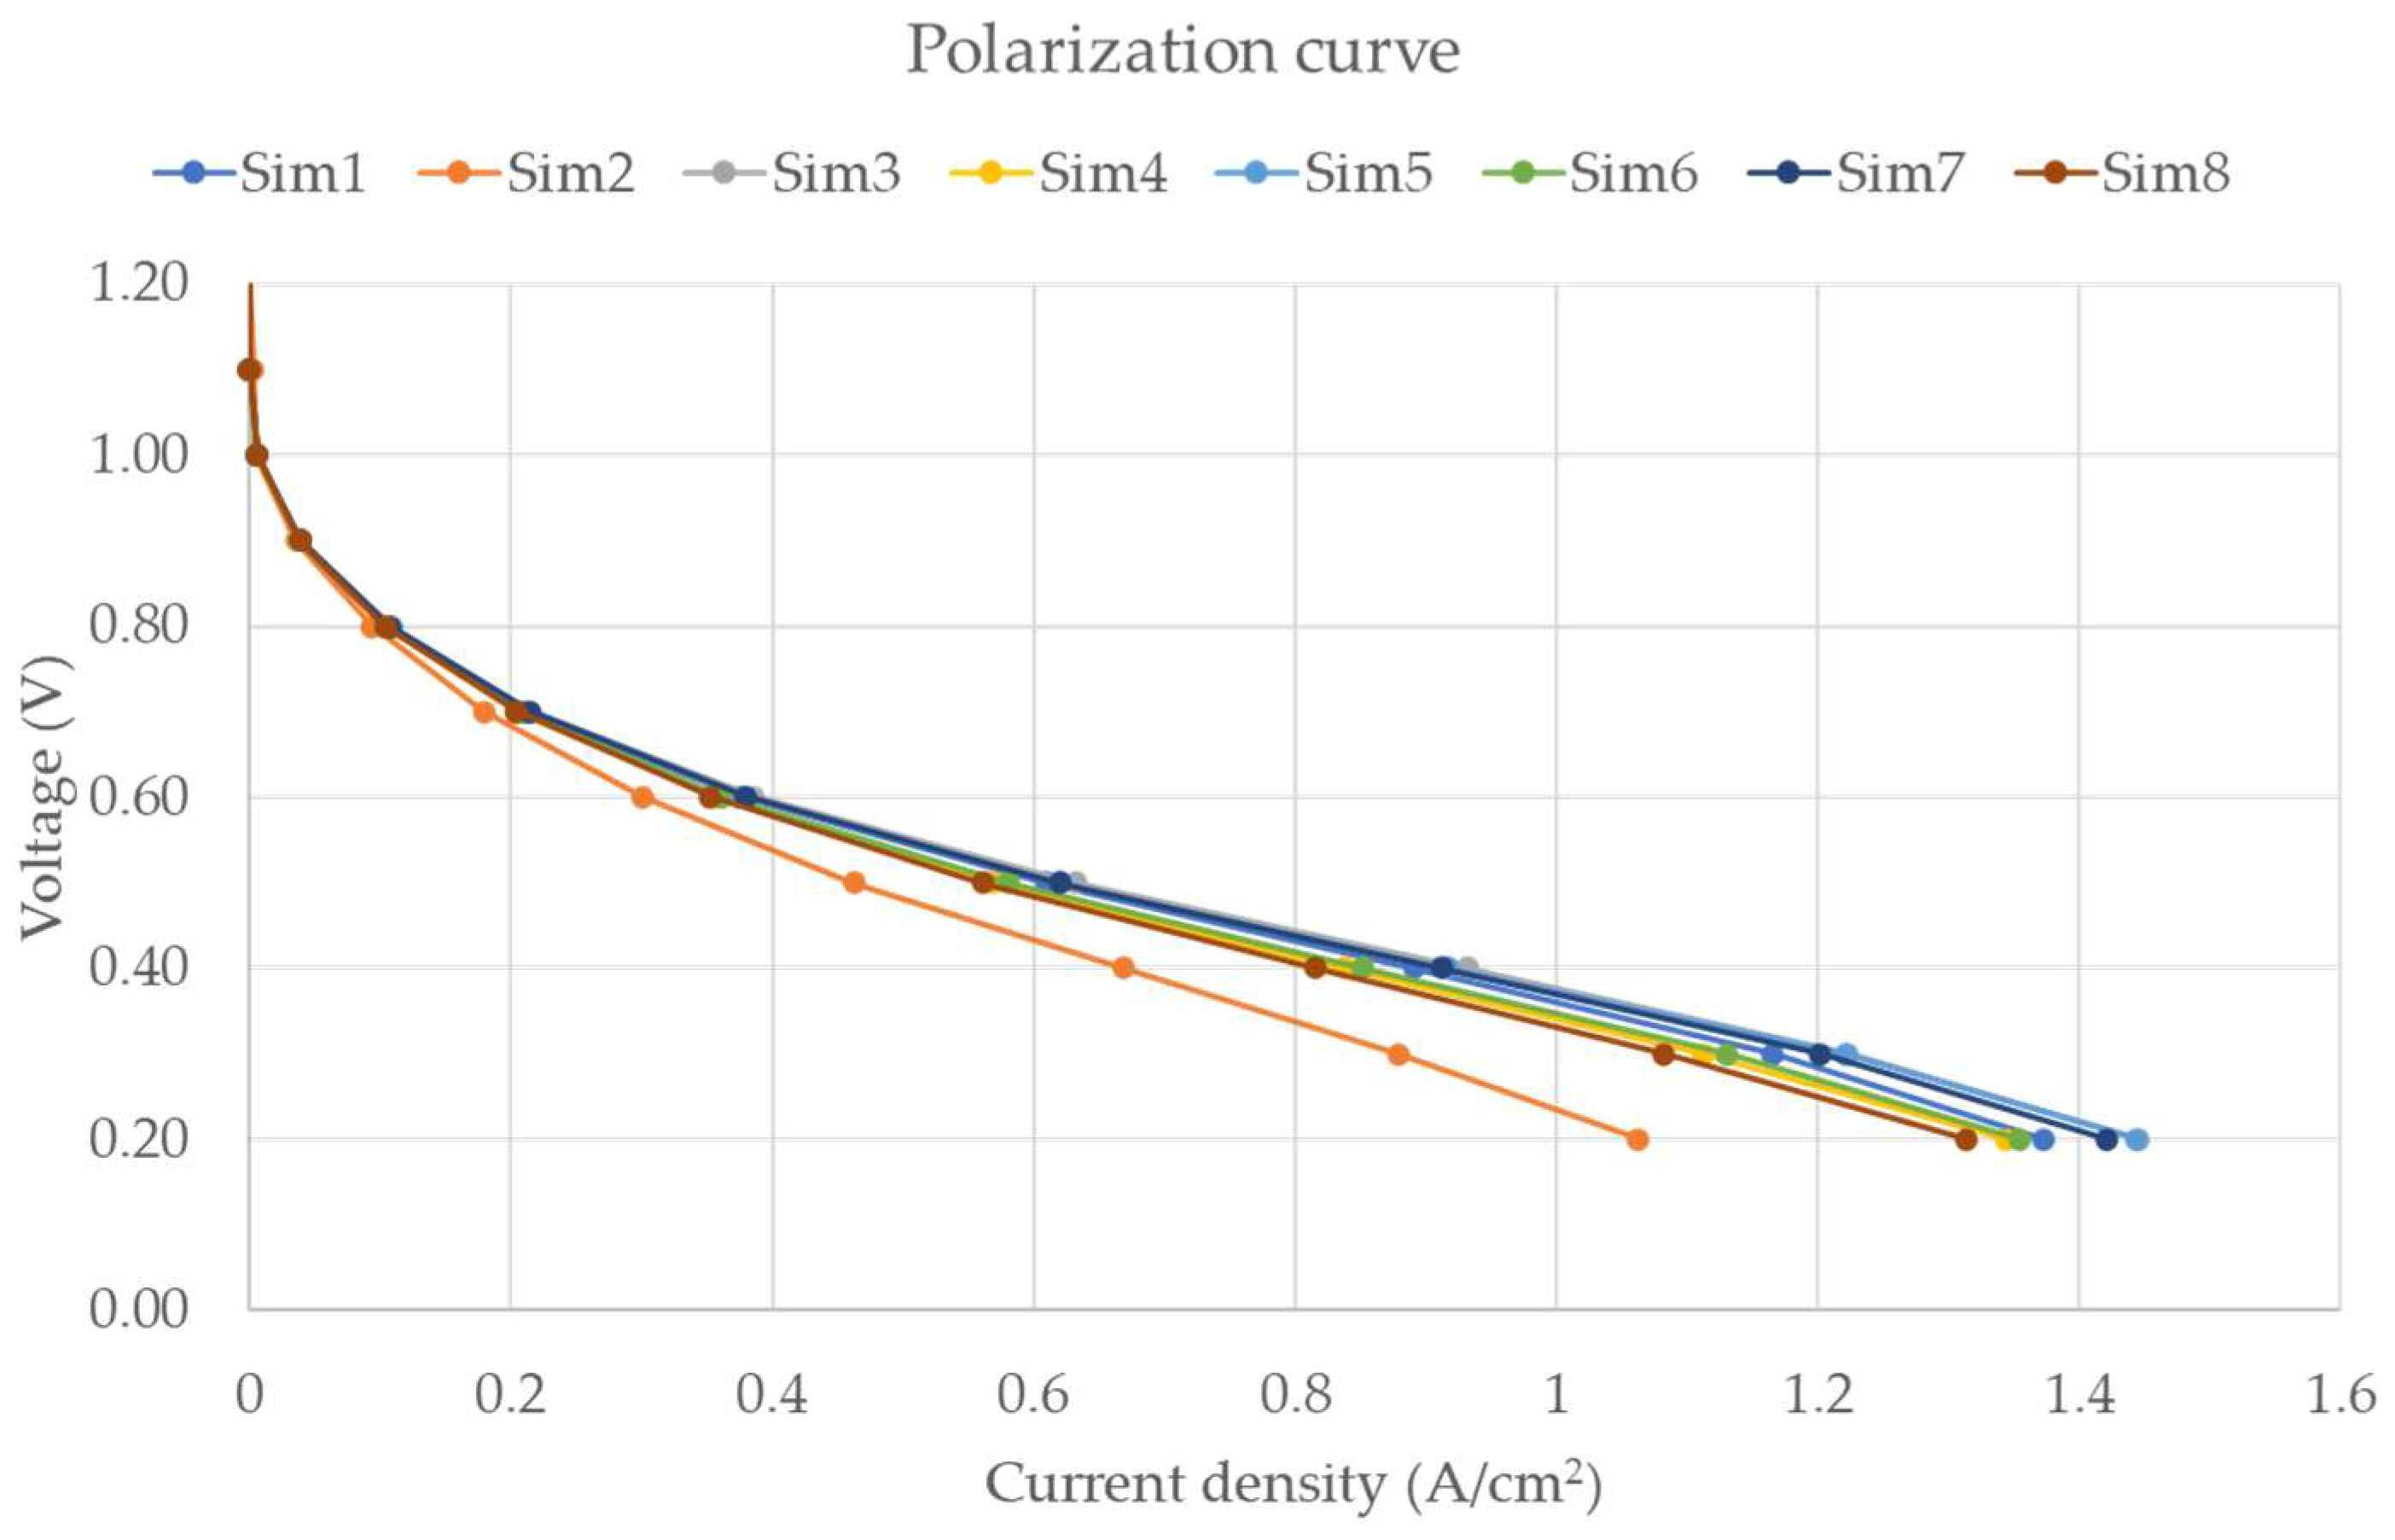
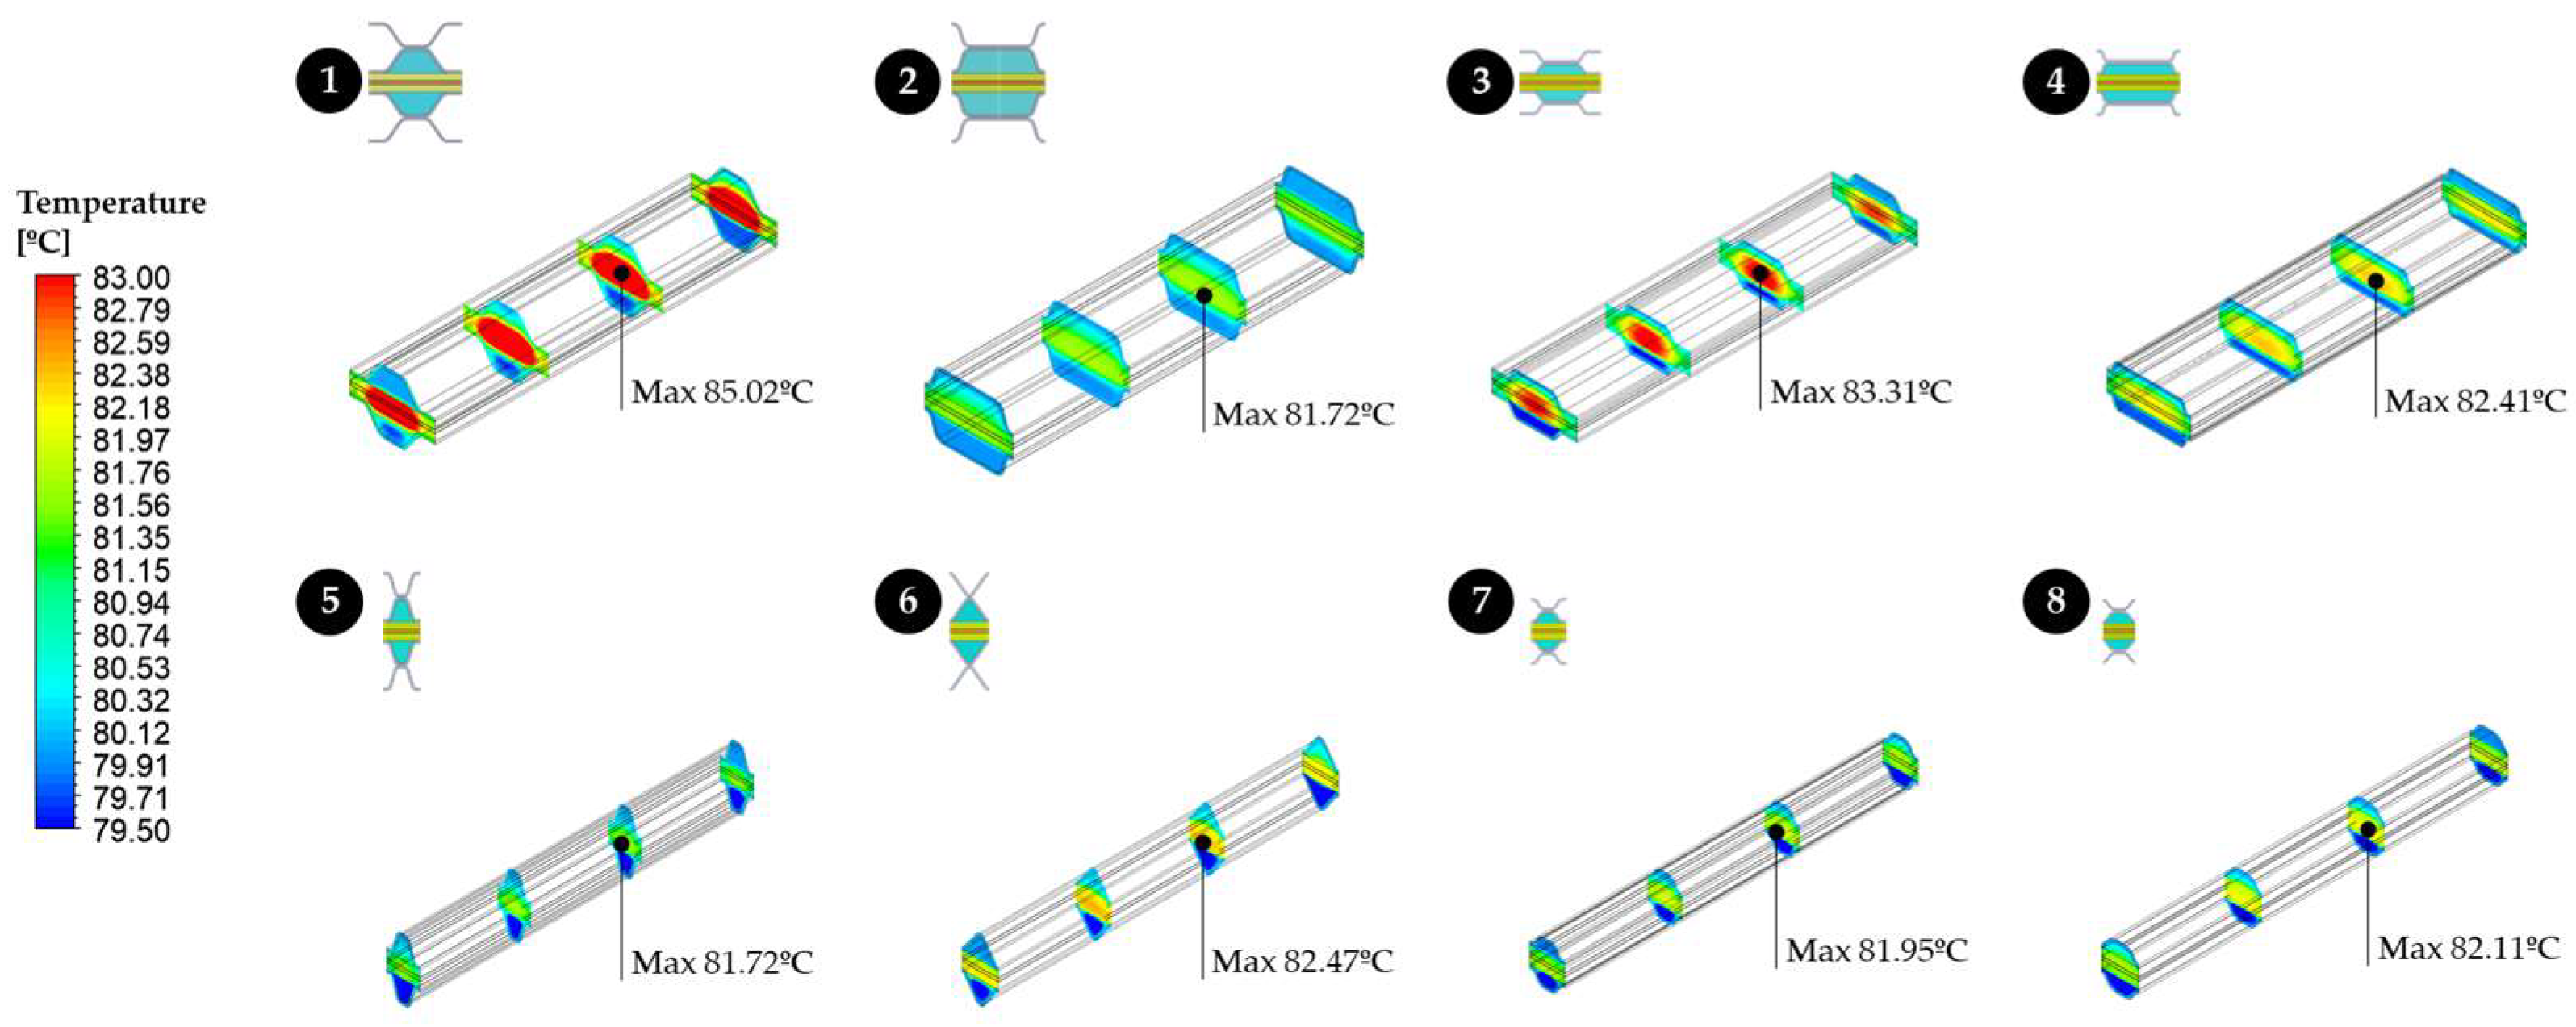
3. Results and Discussion

Computational fluid dynamics (CFD), coupled with thermal and electrochemical simulations using ANSYS Multiphysics software and the PEM Fuel Cell add-on, is applied to analyze eight cases. This approach evaluates the impact of five parameters and two levels based on the geometries previously described and defined using the Taguchi L8 method.
Figure 3 shows the polarization curve of all the simulated cases. Higher current density values are obtained for simulations 3 and 5, being 1.445 and 1.444 A/cm2 at 0.2 V, respectively. Although case 3 does not exhibit a high contact area ratio (Table 2), it has the maximum BP–GDL area ratio out of all the studied cases, which indicates that it may be an important factor for cell performance. Case 5 does not stand out in any of the parameters studied in Table 2; thus, it is emphasized that all parameters analyzed are interconnected and the obtention of optimal geometries is not trivial.
Figure 4 shows the temperature distribution along channel length at 0.2 V. The maximum temperature difference between cases is 3.30 °C, located at the membrane and catalyst layers, as it is where the reaction is taking place.
Once all simulations are performed, the results are analyzed by observing the current density for each case at 0.2 V. Table 6 shows the main effects analysis by the statistical method of the column effects method, where the main effect is identified to be D, the BL–GDL contact length-to-pitch ratio, so PEMFC performance is improved when c/p is higher at 0.4. The parameter with the second most influence is C, the external radius, and performance is improved when R1 is reduced at 0.14 mm. A, pitch, and B, channel height, also have an effect on fuel cell performance, but at lower levels, reaching higher current densities at lower values of 1 mm and 0.3 mm, respectively. Finally, parameter E, angle, has the smallest influence on performance, reaching slightly higher current density values at 35°.
Figure 5 shows the same results already discussed but analyzed by the graphical method, where it can be clearly seen that main factor is D, and the parameter with the smallest influence is E.
After the analysis of the main effects only, a new parameter combination that theoretically maximizes current density can be defined. However, it is important to consider also the possible parameter interactions, as this could reveal new combinations that could enhance performance that may not be obvious when focusing only on main effects.
Figure 6 shows the interaction effects matrix by the graphical method, where the Y-axis indicates the mean current density rate (A/cm2) and the X-axis indicates the Taguchi matrix level. As stated, scenarios where the lines cross indicate a strong parameter interaction. Although there are a few scenarios where the lines cross, the most evident parameter interaction is between A and E. It can be seen, for p = 2.5 mm, reducing the angle represents a decrease in current density. Parallelly for p = 1 mm, reducing the angle represents an increase in current density. On the other hand, for α = 35°, reducing the pitch represents a decrease in current density; however, for α = 17°, reducing the pitch represents an increase in current density. So, these parameters depend on each other in a non-evident manner. The same behavior could apply to A and B interactions.
That being said, main effects analysis showed that parameter E does not have much influence on its own; however, interaction analysis demonstrates that it may have important effects depending on other parameters, so it is an interesting combination to test.
To validate the Taguchi DOE results, two new parameter combinations are tested. Case 9 corresponds to the best parameter combination obtained by the main effects analysis. Finally, case 10 would be the same as case 9 with the exception of parameter E, which is the opposite. Both new combinations are detailed in Table 7, and the geometries are shown in Figure 7.
After performing the required simulations, Figure 8 shows the polarization curve of all the geometries simulated as well as the current density values at 0.2 V. As can be observed in the table, both cases 9 and 10 outperform the other cases tested, enhancing the fuel cell performance with respect to case 3, at 1.97 and 1.23%, respectively.

4. Conclusions

This research investigated the effects of different geometrical parameters on the performance of PEM fuel cells, applying the Taguchi method and addressing the evident lack of in-depth analysis by focusing on identifying designs that not only improve performance but also align with the cost-efficiency and limitations of the stamping process.
As an extension of our previous work [28] and by using computational simulations, five different parameters of importance in the stamping process were analyzed by defining eight different cases as per Taguchi’s guidelines. Higher current density values were obtained for geometries 3 and 5, being 1.445 and 1.444 A/cm2 at 0.2 V, respectively. Although case 3 exhibited high BP–GDL contact area, case 5 did not stand out in any of the studied parameters, and thus, it was emphasized that all parameters are interconnected, and a DOE is necessary to find optimal solutions.
The main effects analysis revealed that the most significant factor is D, the BL–GDL contact length-to-pitch ratio, with PEMFC performance improving as the c/p ratio increases, reaching its highest value at 0.4. The second most influential parameter is C, the external radius, where performance improves as R1 decreases to 0.14 mm. Parameters A (pitch) and B (channel height) also impact fuel cell performance, though to a lesser extent, with higher current densities observed at lower values of 1 mm and 0.3 mm, respectively. Lastly, parameter E (angle) has the smallest effect on performance, showing a slight improvement in current density at 35°.
Interaction effects were further analyzed using a graphical method, revealing that the most pronounced interaction occurred between factors A and E. When the pitch (p) is set to 2.5 mm, reducing the angle leads to a decrease in current density. Conversely, at p = 1 mm, a reduction in the angle causes an increase in current density. Similarly, for an angle (α) of 35°, decreasing the pitch results in a lower current density, whereas for α = 17°, reducing the pitch increases the current density. This indicates that these parameters influence each other in a complex and non-obvious way.
The main effects and interactions led to the analysis of two new parameter combinations. Case 9 resulted from the application of the best-performing parameters according solely to main effects, and case 10 delved into the possibility of changing parameter E to its contrary, as its interaction with A suggested a better result when the lower level was used.
The results show that cases 9 and 10, achieved by minimizing pitch, channel height, and external radius while maximizing the BP–GDL contact length-to-pitch ratio and angle, outperform the previous cases. Specifically, they enhance fuel cell performance by 1.97% and 1.23%, respectively, compared with case 3. This suggests that the Taguchi method is a valuable tool for optimizing the geometry of bipolar plates in PEM fuel cells. In conclusion, this study offers important insights into optimizing metallic bipolar plates in PEMFCs, aiding the advancement of more efficient and practical fuel cell technologies.

Author Contributions

R.B.: Conceptualization, methodology, software, data curation, writing—original draft preparation, and writing—review and editing. M.B.: Data curation and writing—review and editing. E.R.: Software and writing—review and editing. A.B.: Conceptualization, writing—review and editing, and supervision. All authors have read and agreed to the published version of the manuscript.

Funding

This work was financially supported by the Catalan Government through the funding grant ACCIÓ-Eurecat (Project TRAÇA GreenH2).

Data Availability Statement

Data are contained within the article.

Conflicts of Interest

The authors declare no conflicts of interest.

References

  1. Abdi, H.; Ait Messaoudene, N.; Kolsi, L.; Naceur, M.W. Modeling and optimization of a proton exchange membrane fuel cell using particle swarm algorithm with constriction coefficient. J. Therm. Anal. Calorim. 2021, 144, 1749–1759. [Google Scholar] [CrossRef]
  2. Choi, Y.; Win, M.Z.; Oo, W.; Min, J.; Ko, K.; Kim, Y.; Choi, H.; Chougule, S.S.; Khikmatulla, D.; Yi, K.B.; et al. Experimental simulation study on the poisoning effect of hydrocarbon-based ionomers on Pt catalysts for fuel cells. Electrochem. Commun. 2023, 157, 107602. [Google Scholar] [CrossRef]
  3. Khan, M.I.; Asfand, F.; Al-Ghamdi, S.G. Progress in research and technological advancements of thermal energy storage systems for concentrated solar power. J. Energy Storage 2022, 55, 105860. [Google Scholar] [CrossRef]
  4. Guédez, R.; Spelling, J.; Laumert, B.; Fransson, T. Optimization of Thermal Energy Storage Integration Strategies for Peak Power Production by Concentrating Solar Power Plants. Energy Procedia 2014, 49, 1642–1651. [Google Scholar] [CrossRef]
  5. Deepak Selvakumar, R.; Wu, J.; Ding, Y.; Alkaabi, A.K. Melting behavior of an organic phase change material in a square thermal energy storage capsule with an array of wire electrodes. Appl. Therm. Eng. 2023, 228, 120492. [Google Scholar] [CrossRef]
  6. Hu, K.; Zhao, P.; Wang, S.; Wang, Y. Three-dimensional multiphase simulation of a partially narrowed flow field configuration for a high-performance polymer electrolyte membrane fuel cell. Appl. Therm. Eng. 2023, 223, 119986. [Google Scholar] [CrossRef]
  7. Zhang, J.; Wang, Z.; Ding, H.; Pan, Z.; Huang, X.; Pan, X. Heat and mass transfer characteristics of a novel three-dimensional flow field metal bipolar plate for PEMFC by laser 3D printing. Int. J. Hydrog. Energy 2023, 50, 1036–1049. [Google Scholar] [CrossRef]
  8. Wu, S.; Yang, W.; Yan, H.; Zuo, X.; Cao, Z.; Li, H.; Shi, M.; Chen, H. A review of modified metal bipolar plates for proton exchange membrane fuel cells. Int. J. Hydrog. Energy 2021, 46, 8672–8701. [Google Scholar] [CrossRef]
  9. Li, S.; Jin, R.; Li, S.; Wang, L.; Xie, Z.; Li, X.; Wang, Z. High corrosion resistance and conductivity of Al2O3/CrN coating for metal bipolar plates in PEMFCs: Al2O3 hinders CrN columnar crystals growth. Int. J. Hydrog. Energy 2023, 50, 805–816. [Google Scholar] [CrossRef]
  10. Li, S.; Zhou, W.; Liu, R.; Huang, J.; Chu, X. Fabrication of porous metal fiber sintered sheet as a flow field for proton exchange membrane fuel cell. Curr. Appl. Phys. 2020, 20, 686–695. [Google Scholar] [CrossRef]
  11. Arif, M.; Cheung, S.C.P.; Andrews, J. Numerical investigation of effects of different flow channel configurations on the 100 cm2 PEM fuel cell performance under different operating conditions. Catal. Today 2022, 397–399, 449–462. [Google Scholar] [CrossRef]
  12. Carcadea, E.; Ismail, M.S.; Bin Ingham, D.; Patularu, L.; Schitea, D.; Marinoiu, A.; Ion-Ebrasu, D.; Mocanu, D.; Varlam, M. Effects of geometrical dimensions of flow channels of a large-active-area PEM fuel cell: A CFD study. Int. J. Hydrog. Energy 2021, 46, 13572–13582. [Google Scholar] [CrossRef]
  13. Hu, C.; Zhao, Y.; Zhang, Z.; Zhang, H.; Chen, D. Optimization of flow field structure for proton exchange membrane fuel cell stack by multi-physics coupling simulation. Int. J. Electrochem. Sci. 2023, 18, 100195. [Google Scholar] [CrossRef]
  14. Limjeerajarus, N.; Charoen-amornkitt, P. Effect of different flow field designs and number of channels on performance of a small PEFC. Int. J. Hydrog. Energy 2015, 40, 7144–7158. [Google Scholar] [CrossRef]
  15. Al-Okbi, Y.; Al-murshedi, A.S.N.; Nemah, M.N.; Saad, H.A.K. Influence of design anode and cathode channel on (PEMFC) fuel cell performance. Mater. Today Proc. 2021, 42, 2177–2184. [Google Scholar] [CrossRef]
  16. Xu, C.; Wang, H.; Cheng, T. Wave-shaped flow channel design and optimization of PEMFCs with a groove in the gas diffusion layer. Int. J. Hydrog. Energy 2023, 48, 4418–4429. [Google Scholar] [CrossRef]
  17. Xu, C.; Wang, H.; Li, Z.; Cheng, T. Effects of the Design and Optimization of Trapezoidal Channels and Baffles (Number and Position) on the Net Power Density of Proton-Exchange Membrane Fuel Cells. ACS Omega 2022, 7, 4214–4223. [Google Scholar] [CrossRef]
  18. Hala, M.; Kodým, R.; Prokop, M.; Paidar, M.; McCay, K.; Ansaloni, L.; Bouzek, K. Impact of the flow-field distribution channel cross-section geometry on PEM fuel cell performance: Stamped vs. milled channel. Fuel 2024, 373, 132299. [Google Scholar] [CrossRef]
  19. Kargar-Pishbijari, H.; Hosseinipour, S.J.; Jamshidi Aval, H. A novel method for manufacturing microchannels of metallic bipolar plate fuel cell by the hot metal gas forming process. J. Manuf. Process. 2020, 55, 268–275. [Google Scholar] [CrossRef]
  20. Zhang, Y.; Tu, Z. Flow-field design of the bipolar plates in polymer electrolyte membrane fuel cell: Problem, progress, and perspective. Appl. Energy Combust. Sci. 2024, 17, 100244. [Google Scholar] [CrossRef]
  21. Neto, D.M.; Oliveira, M.C.; Alves, J.L.; Menezes, L.F. Numerical Study on the Formability of Metallic Bipolar Plates for Proton Exchange Membrane (PEM) Fuel Cells. Metals 2019, 9, 7. [Google Scholar] [CrossRef]
  22. Wilberforce, T.; Ijaodola, O.; Emmanuel, O.; Thompson, J.; Olabi, A.; Abdelkareem, M. Optimization of Fuel Cell Performance Using Computational Fluid Dynamics. Membranes 2021, 11, 146. [Google Scholar] [CrossRef] [PubMed]
  23. Lalotra, J.; Lehana, P.K. COMSOL Modeling of Taguchi Optimized PEM Fuel Cell Arrays for Maximum Driving Capabilities. Int. J. Eng. Trends Technol. 2022, 70, 146–153. [Google Scholar] [CrossRef]
  24. Chang, K.-Y. The optimal design for PEMFC modeling based on Taguchi method and genetic algorithm neural networks. Int. J. Hydrog. Energy 2011, 36, 13683–13694. [Google Scholar] [CrossRef]
  25. Amadane, Y.; Mounir, H.; El Marjani, A.; Bouhrim, H.; Rafi, M.A. Taguchi Approach in Combination with CFD Simulation as a Technique for the Optimization of the Operating Conditions of PEM Fuel Cells. Arab. J. Sci. Eng. 2020, 45, 7587–7597. [Google Scholar] [CrossRef]
  26. Yan, W.; Wang, J.; Li, J.; Wang, G. Optimizing Structural Parameters of PEMFC Based on Taguchi Method. World Electr. Veh. J. 2023, 14, 76. [Google Scholar] [CrossRef]
  27. Zhang, Z.; Wang, Q.; Bai, F.; Chen, L.; Tao, W. Performance simulation and key parameters in-plane distribution analysis of a commercial-size PEMFC. Energy 2023, 263, 125897. [Google Scholar] [CrossRef]
  28. Busqué, R.; Bossio, M.; Brigido, A.; Lara, A. Effects of Different Channel Geometries of Metallic Bipolar Plates on Proton Exchange Membrane Fuel Cell Performance. Energies 2023, 16, 23. [Google Scholar] [CrossRef]
  29. Fraley, S.; Zalewski, J.; Oom, M. Terrien Design of Experiments via Taguchi Methods—Orthogonal Arrays Engineering LibreTexts. Available online: https://eng.libretexts.org/Bookshelves/Industrial_and_Systems_Engineering/Chemical_Process_Dynamics_and_Controls_(Woolf)/14%3A_Design_of_Experiments/14.01%3A_Design_of_Experiments_via_Taguchi_Methods_-_Orthogonal_Arrays (accessed on 9 September 2024).
  30. Ruiz, M.D. Desarrollo de la metodología de Taguchi Universidad de Granada. Available online: https://www.ugr.es/~mruiz/temas/Tema_9.pdf (accessed on 9 September 2024).
  31. Joneja, A. Robust Design: Statistical Analysis for Taguchi Methods Hong Kong University of Science and Technology. Available online: https://ieda.ust.hk/dfaculty/ajay/courses/ielm317/lecs/robust/robustdesign2.pdf (accessed on 9 September 2024).
  32. Xuan, L.; Wang, Y.; Mei, D.; Lan, J. Design and Modelling of 3D Bionic Cathode Flow Field for Proton Exchange Membrane Fuel Cell. Energies 2021, 14, 19. [Google Scholar] [CrossRef]
  33. Marappan, M.; Palaniswamy, K.; Velumani, T.; Chul, K.B.; Velayutham, R.; Shivakumar, P.; Sundaram, S. Performance Studies of Proton Exchange Membrane Fuel Cells with Different Flow Field Designs—Review. Chem. Rec. 2021, 21, 663–714. [Google Scholar] [CrossRef]
  34. Tzelepis, S.; Kavadias, K.A.; Marnellos, G.E. A Three-Dimensional Simulation Model for Proton Exchange Membrane Fuel Cells with Conventional and Bimetallic Catalyst Layers. Energies 2023, 16, 10. [Google Scholar] [CrossRef]
  35. Iranzo, A.; Gregorio, J.M.; Boillat, P.; Rosa, F. Bipolar plate research using Computational Fluid Dynamics and neutron radiography for proton exchange membrane fuel cells. Int. J. Hydrog. Energy 2020, 45, 12432–12442. [Google Scholar] [CrossRef]
  36. Al-Baghdadi, M.A.R.S. A CFD model for analysis of performance, water and thermal distribution, and mechanical related failure in PEM fuel cells. J. Mechatron. Electr. Power Veh. Technol. 2016, 7, 7–20. [Google Scholar] [CrossRef]
  37. Arif, M.; Cheung, S.C.P.; Andrews, J. Diagnostic analysis of a single-cell Proton Exchange Membrane unitised regenerative fuel cell using numerical simulation. Int. J. Hydrog. Energy 2021, 46, 29488–29500. [Google Scholar] [CrossRef]
  38. ANSYS, Inc. Chapter 21: Modeling Fuel Cells. In Fluent Theory Guide 2023 R2; ANSYS, Inc.: Canonsburg, PA, USA, 2023. [Google Scholar]
  39. Arif, M.; Cheung, S.C.P.; Andrews, J. A systematic approach for matching simulated and experimental polarization curves for a PEM fuel cell. Int. J. Hydrog. Energy 2020, 45, 2206–2223. [Google Scholar] [CrossRef]
  40. Hashemi, F.; Rowshanzamir, S.; Rezakazemi, M. CFD simulation of PEM fuel cell performance: Effect of straight and serpentine flow fields. Math. Comput. Model. 2012, 55, 1540–1557. [Google Scholar] [CrossRef]
Figure 1. Parameters analyzed in the DOE.
Energies 18 00986 g001
Figure 2. Cross-section of 8 geometries simulated.
Energies 18 00986 g002
Figure 3. Polarization curve for the eight geometries simulated.
Energies 18 00986 g003
Figure 4. Temperature distribution along the channel for eight geometries simulated at 0.2 V.
Energies 18 00986 g004
Figure 5. Main effects analysis (graphical method).
Energies 18 00986 g005
Figure 6. Interaction effects analysis (graphical method).
Energies 18 00986 g006
Figure 7. Cross-section of new geometries simulations (case 9 and 10).
Energies 18 00986 g007
Figure 8. Polarization curve of geometries 1 to 10 and current density values at 0.2 V.
Energies 18 00986 g008
Table 1. Taguchi matrix (P = 5, L = 2).
ABCDEA (p)
(mm)
B (H)
(mm)
C (R1)
(mm)
D (c/p)
(−)
E (α)
(°)
1111112.50.60.250.4035
2111222.50.60.250.1517
3122112.50.30.140.4035
4122222.50.30.140.1517
5212121.00.60.140.4017
6212211.00.60.140.1535
7221121.00.30.250.4017
8221211.00.30.250.1535
Table 2. Geometric and velocity comparison between cases.
MEA Area (mm2)Contact Area (mm2)Channel Cross-Section (mm2)BP–GDL Area (mm2)
125.0017.600.657.40
225.0024.951.170.05
325.0016.460.398.54
425.0023.320.611.68
510.008.070.251.93
610.6010.560.300.04
710.009.700.160.30
810.009.980.190.02
Table 3. Model input parameters.
Input ParametersValue
Anodic   exchange   current   density   ( j a n r e f )10,000 (A/m2)
Cathodic   exchange   current   density   ( j c a t r e f )10 (A/m2)
Anodic   charge   transfer   coefficient   ( α a n )1
Cathodic   charge   transfer   coefficient   ( α c a t )1
Faraday   constant   ( F )9.65 × 10⁴ (C/mol)
Universal   gas   constant   ( R )8.314 (J/(mol K))
Anode   electrode - specific   active   surface   area   ( ζ a n )20,000 (m−1)
Cathode   electrode - specific   active   surface   area   ( ζ c a t )20,000 (m−1)
Table 4. Operating conditions.
Operating ParametersValue
Cell temperature80 (°C)
Operating pressure101325 (Pa)
Anode mass flow rate1 × 10−7 (kg/s)
Anode H2 mass fraction at inlet0.60
Anode H2O mass fraction at inlet0.40
Cathode mass flow rate1.4 × 10−6 (kg/s)
Cathode O2 mass fraction at inlet0.21
Cathode H2O mass fraction at inlet0.05
Table 5. Material properties.
PropertyCatalystCurrent CollectorGDLMembrane
Density (kg/m3)2719271927191980
Specific heat density (J/(kg K))8718718712000
Thermal conductivity (W/(m K))10100102
Electrical conductivity (S/m)5 × 103 1 × 1065 × 103 1 × 10⁻¹⁶
Porosity0.2-0.60.5
Permeability (m2)2 × 10⁻¹³-3 × 10−121 × 10−18
Table 6. Main effects analysis (column effects method).
A (p)B (H)C (R1)D (c/p)E (α)
ME2(X)-ME1(X)0.0770.0720.104−0.152−0.053
Table 7. New parameter combinations tested (cases 9 and 10).
ABCDEA (p)
(mm)
B (H)
(mm)
C (R1)
(mm)
D (c/p)
(−)
E (α)
(°)
12221110.30.140.435
22221210.30.140.417
Disclaimer/Publisher’s Note: The statements, opinions and data contained in all publications are solely those of the individual author(s) and contributor(s) and not of MDPI and/or the editor(s). MDPI and/or the editor(s) disclaim responsibility for any injury to people or property resulting from any ideas, methods, instructions or products referred to in the content.

