Article

A Universal Highly Concentrated Electrolyte for Improved Cycling Stability in Li(Ni1-x-yMnxCoy)O2-NMC-Based Batteries

1
School of Materials Science and Engineering, Nanyang Technological University, 11 Faculty Ave, Singapore 639977, Singapore
2
Energy Research Institute at NTU, Nanyang Technological University, 1 Cleantech Loop, #06-04, Singapore 637141, Singapore
*
Author to whom correspondence should be addressed.
Energies 2025, 18(4), 974; https://doi.org/10.3390/en18040974
Submission received: 31 January 2025 / Revised: 14 February 2025 / Accepted: 15 February 2025 / Published: 18 February 2025
(This article belongs to the Section D: Energy Storage and Application)

Abstract

:
While 1 M LiPF6 has been widely adopted as the standard electrolyte in current LIBs, its chemical instability has reduced the battery’s cycling stability by, for instance, accelerating the dissolution of transition metals from electrode materials, particularly in high-voltage cathodes. Lithium bis(fluorosulfonyl)imide (LiFSI) has emerged as a promising alternative salt for next-generation high-voltage energy-dense LIB electrolytes. However, despite extensive research, the optimal concentration and formulation of LiFSI remain unresolved, with variations typically tested across different Li(Ni1-x-yMnxCoy)O2 (NMC) series cathodes. Herein, 6:4.5:8.3 LiFSI/EC/DMC (in molar ratio) is proposed as a universal electrolyte for high-voltage NMC series cathodes. The 6:4.5:8.3 LiFSI/EC/DMC electrolyte decomposes to form a uniform cathode–electrolyte interface with abundant inorganic species, resulting in a lower interface resistance. By adopting the 6:4.5:8.3 LiFSI/EC/DMC electrolyte, NMC series Li-ion half-cells are all able to stably cycle up to 200 cycles at a cut-off voltage of 4.4 V. Especially for high Ni content (NMC 811) cathode, the capacity retention was improved from 43.6% to 87.5% when charged to 4.4 V at 1C rate. This work provides a feasible universal electrolyte formulation for developing next-generation high-voltage LIBs.

1. Introduction

Electrification has been seen as a critical strategy to mitigate carbon emissions to the environment and a way to decarbonize the energy supply chain [1,2]. Renewable energy is one source from where electrical energy can be harvested; however, it is intermittent. This would mean that energy can only be harvested when the conditions are favorable. Thus, the storage of excess energies during favorable times will be key in ensuring a more reliable energy supply even during unfavorable energy generation conditions. Lithium-ion batteries (LIBs) are arguably the most popular and successful energy storage technology in today’s world due to their high energy density and stability [3]. Other high-energy-density storage batteries include metal–air batteries [4]. In metal–air batteries, oxygen from ambient air is used as a cathode source; this reduces the weight of the battery and results in higher energy density [5]. Additionally, the use of such a cathode source would significantly lower the cost of the battery [5]. Despite metal–air batteries’ potential, the cell’s lifetime is one major challenge that hinders their wider adoption. Some of the causes that limit the cell lifetime of metal–air batteries include the corrosion of the electrode, stability of the electrolyte, and rechargeability [5]. In the aspect of battery safety, sodium-ion batteries (SIBs) are promising alternatives to LIBs due their better overall thermal stability, where the use of SIBs has been seen to form less toxic and explosive gases during thermal runaway [6,7]. The established thermal hazard assessment model in the study by Huang et al. further validated this when it was concluded that the thermal risk of SIBs was several times less than that of LIBs [7]. Other benefits of SIBs include their low cost and abundance [7]. Despite these advantages, SIBs’ lower energy density compared to LIBs makes LIBs more suited for applications with high energy demands (which is one of the critical factors when deciding on the choice of batteries) [8]. Thus, LIBs remain to be the most reliable option when it comes to energy storage capabilities. With electrification gaining momentum [1,9], there is a need to advance the capabilities of lithium-ion battery technologies to meet these higher energy demands. Cathode materials have been considered an important component in LIBs because they predominately affect the battery capacity and are often referred to as the source of energy or the lithium source of the battery [10]. In recent years, high-voltage Ni-rich cathode materials have garnered attention in energy-dense LIB research due to their ability to provide higher capacity and power [10]; the operating voltage of the battery can be increased to obtain higher specific capacity, and this is due to the ease of full Ni2+-to-Ni4+ oxidation compared to Co while not involving oxygen redox activity as it will pose battery safety concerns if triggered [11]. However, this increase in operating voltage would unfortunately jeopardize the stability of the current state-of-the-art electrolyte [12,13].
Current state-of-the-art electrolytes include 1 molar (M) quantity of LiPF6 as the main lithium salt dissolved in solvents like ethylene carbonate (EC), dimethyl carbonate (DMC), ethyl methyl carbonate (EMC), and diethyl carbonate (DEC), to name a few [14,15]. At high voltages (>4.2 V [13]), water may be produced by the continuous oxidation of the carbonated solvent with the singlet oxygen released from the cathode, especially NMC cathode [13], which is not ideal given that LiPF6 reacts with trace water to form hydrofluoric acid (HF) [12,16]. HF is highly corrosive and would accelerate the dissolution of transition metal ions and oxygen evolution from the cathode surface; it also reacts with the solid electrolyte interphase (SEI) components and corrodes other cell components [17,18], resulting in battery degradation. Other factors that would contribute to cell degradation would include the charging conditions of the battery; for instance, overcharging would lead to electrolyte oxidation and the deposition of lithium metal [19]. The operating and storage temperature of the battery is another factor that will contribute to cell degradation due to active material dissolution and phase changes; these temperatures would also affect the thermal stability of the electrolyte [19]. Thus, developing a suitable electrolyte alternative for next-generation high-voltage energy-dense LIBs is of great importance given its extensive presence within the battery.
Lithium bis(fluorosulfonyl)imide (LiFSI) has emerged as a promising alternative salt due to its superior conductivity compared to other lithium salts such as lithium bis(oxalato)borate (LiBOB), lithium bis(trifluoromethanesulfonimide) (LiTFSI), and lithium perchlorate (LiClO4) [20,21]. This enhanced conductivity is attributed to its low ion binding energy, which facilitates improved Li+ dissociation [22]. Recently, highly concentrated electrolytes (HCEs) have been widely explored and demonstrated to be more stable at high operating voltages (>4.2 V [13]) due to their higher oxidative stability and more robust cathode–electrolyte interphase (CEI) layer [16]. Furthermore, in HCEs, the solvation structure of Li+ ions differs from those of the conventional dilute electrolytes, and this, in turn, makes the CEI layer more influenced by the decomposition of lithium salt rather than, traditionally, by the solvent [23]. The CEI layer is a critical component as it protects the cathode by acting as a barrier between the electrolyte and cathode to reduce unwanted side reactions. A good CEI layer also represses the dissolution of transition metals from the cathode [23] due to repeated Li-ion intercalation and deintercalation. This is important as the dissolution of transition metals will result in irreversible lattice atom loss and gas release [24,25]; this vicious cycle, when triggered, can degrade the battery performance.
Unlike conventional LiPF6 electrolytes, which have 1 M as the common/standard salt concentration, HCEs can have many concentrations, starting from 3 M [26]. When limiting the search to only carbonate-based HCEs (e.g., DMC, EC, FEC, EMC, and DEC), the literature has 4 M LiFSI-DMC (in Gr/NMC 622 and NMC 622 half-cells) [27], 10 M LiFSI in EC/DMC (in Li/NMC 622 full cells) [28], ~7.9 M LiFSI in DMC (in Li/NMC 622 full cells) [29], and 9.9 M LiFSI in EC (in Si-Gr/NMC 111 full cells) [20] as optimal LiFSI concentration in different battery configurations citing the benefits of HCEs compared to conventional electrolytes. This wide range of optimal concentrations hints at the possibility that there may not be a single optimal HCE concentration unlike in the case of 1 M LiPF6 electrolytes. A possible argument for the concentration difference obtained in the literature could be due to the difference in battery cell set-ups (e.g., in testing parameters, cell configurations, the solubility of LiFSI salts in solvents, etc.). These factors would affect the CEI layer formation, Li+ solvation structure, and, eventually, the battery performance. To date, no single formulation has been established as universally superior, and a comprehensive comparison across all high-voltage NMC cathode materials has yet to be conducted.
This study investigated the potential of a single-concentration LiFSI-based electrolyte as a common electrolyte for next-generation high-energy-density LIBs. Various concentrations of LiFSI electrolytes were examined to identify an optimal formulation for improved battery performance across NMC systems. The 6:4.5:8.3 LiFSI/EC/DMC configuration (in molar ratio) was found to be the optimal electrolyte for all LiNi1-x-yMnxCoyO2 cathode half-cell systems, specifically LiNi0.33Mn0.33Co0.33O2 (NMC 111), LiNi0.6Mn0.2Co0.2O2 (NMC 622), and LiNi0.8Mn0.1Co0.1O2 (NMC 811). The underlying mechanisms were elucidated through comprehensive analyses including Electrochemical Impedance Spectroscopy (EIS), Transmission Electron Microscopy (TEM), and X-ray Photoelectron Spectroscopy (XPS). This paper offers a viable universal electrolyte formulation for the development of high-energy-density LIBs.

2. Materials and Methods

2.1. Cathodes Preparation

NMC 111 active material was obtained from Xiamen TOB New Energy Technology Co. Ltd, Xiamen, China, NMC 622 active material was obtained from Umicore, and NMC 811 active material was obtained from Hubei Ronbay Lithium Battery Material Co. Ltd, Ezhou, China. The active material (NMCs) was magnetic-stirred with carbon black (Timcal C65) and polyvinylidene fluoride (PVDF) using N-Methyl-2-pyrrolidone (NMP) as the mixing solvent according to the mass ratio of 94:3:3. The resulting slurry was doctor-blade-coated on battery-grade aluminum foil, purchased from Targray, Krikland, QC, Canada, to obtain a mass loading of 9–11 mg/cm2 active material. The cathode foils were further calendared to ensure denser particle arrangement. A 12 mm diameter cathode was cut out using an electrode cutter and dried overnight in a 130 °C vacuum oven before cell assembly.

2.2. Electrolyte Preparation

Ethylene carbonate (EC) and dimethyl carbonate (DMC) solvents were purchased from Sigma-Aldrich, Singapore. The LiFSI salt was supplied by Arkema Pte Ltd., Colombes, France. and weighed accordingly to form different electrolytes with different LiFSI salt contents in a solvent mix of EC and DMC at 3:7 v/v. The lowest LiFSI salt content electrolyte had a molar ratio of 3:4.5:8.3, LiFSI/EC/DMC. The LiFSI electrolyte containing mid LiFSI salt content had a molar ratio of 6:4.5:8.3 and the LiFSI electrolyte containing the highest LiFSI salt content had a molar ratio of 7:4.5:8.3. The electrolytes were prepared in the mbraun LABmaster pro glove box and stirred overnight before usage. The 1 M LiPF6 in EC: DMC 1:1 v/v electrolyte was used as received and purchased from Sigma-Aldrich, Singapore.
The concentration of 3 moles was used as the minimum concentration to be considered a HCE (where LiFSI salt had seen success). Beyond 7 moles of LiFSI salt in EC/DMC solvent, the authors were not able to obtain reproducible cycling data suitable for result reporting (possibly due to the high viscosity of the electrolyte). Furthermore, with 6 moles being the optimal LiFSI concentration, a concentration below 6 moles (3 moles) and above 6 moles (7 moles) would provide a comprehensive analysis of the impact of less optimal electrolytes on the two ends of the spectrum, e.g., the effect of electrolyte that contained less than 6 moles of LiFSI and the effect of electrolyte that had more than 6 moles of LiFSI, with 6 moles being the optimal concentration.

2.3. Half-Cell Assembly, Electrochemical Testing, and Electrolyte Properties

The coin cell parts used were purchased from Xiamen Tmax Battery Equipment Pte Ltd., Xiamen, China. This included CR20232 Al-coated coin cell battery caps, Al-coated springs, and Al spacers. The coin cell parts were dried under vacuum at 60 °C before cell assembly in the glove box. The counter electrode, 14 mm pre-cut lithium metal, was purchased from X2 Lab Pte Ltd., Singapore. and its surface was smoothened before cell assembly. Whatman GF/F glass microfiber filter purchased from Cytiva was used as the separator for this coin cell set-up. Assembled cells were tested using Neware tester at 1 C rate. The cells were rested for 24 h before the commencement of the first charge/discharge cycle of the battery; no formation cycles were conducted. The practical capacity used for charging and discharge of NMC cathodes was 1 C = 160 mAh/g for all cathodes. Between each charge and discharge, the cells were rested for a minute. The cells were charged to 4.4 V and discharged to 2.8 V for 200 cycles.
Impedance measurements were conducted using BioLogic SP-300 (sourced from Bio-Logic Science Instruments SG Pte Ltd., Singapore) and an equivalent circuit model was fitted using EC-lab V11.12 software Z-fitting. The cells were tested from open circuit voltage (OCV) and the impedance was measured from 0.1 Hz to 1 MHz versus open circuit potential. The sinus amplitude used was 10.0 mV, the wait period before each frequency was 0.1, the average measure for each frequency was 2, and the number of points per decade in logarithmic spacing was 6. Linear sweep voltammetry (LSV) was used to determine the electrochemical stability of the electrolytes. LSV was also performed using BioLogic SP-300, where lithium was used as the counter and reference electrode and aluminum was used as the working electrode. The testing parameters for LSV were as follows: the sweep started from the OCV of the cell to 4.4 V (which was the voltage the cells were cycled up to) with a scan rate of 1 mV/s.
The conductivities of the electrolytes were measured using a Mettler Toledo S7 Seven2Go pro conductivity meter (sourced from Mettler Toledo Singapore,). The calibration of the meter was performed using a 12.88 mS conductivity standard from Eutech Instruments, Singapore in ambient conditions and the actual conductivity measurement of the electrolytes was conducted in the glovebox to ensure the accuracy of the results. Next, the viscosities of the electrolytes were measured using the RheoSense microVISC viscosity meter (sourced from LMS Technologies Pte Ltd., Singapore). The meter was first calibrated with the N10 calibration oil from Cannon Instrument Company (sourced from LMS Technologies Pte Ltd., Singapore) in ambient conditions and was brought into the glove box when measuring the viscosities of the electrolytes. For conductivity and viscosity measurements, the average values of 3 measurements were taken.

2.4. Characterization Techniques

Shimadzu Kratos Axis Supra XPS, Shimadzu (Aisa) Pacific Pte Ltd., Singapore) was used to identify the constituents in the CEI layer. The XPS was operated using an Al anode source (15 kV) with a 700 μm × 300 μm elliptical spot size. Survey scans were conducted using a pass energy of 224 eV at 1 eV step size. The high-resolution scans were conducted using pass energy of 26 eV at 0.1 eV step size. Using CasaXPS software (version 2.3.15), the XPS peak fitting was conducted. The peaks were fitted using GL (30) line shapes on a Shirley background and all spectra were corrected according to the binding energy of the carbon 1 s peak (assigned to 284.8 eV), compensating any offset during the measurement. The databases used for peak fitting included the table of elements for XPS of atomic elements by ThermoFisher Scientific, Waltham, MA, USA [30] and NIST X-ray Photoelectron Spectroscopy Database (SRD 20), Version 5.0 [31]. For XPS sample preparation, the cycled cathodes were first disassembled in a glove box and retrieved. Then, they were rinsed with anhydrous DMC before transferring into the XPS air-sensitive transporter for sample loading into the flexi-lock of the XPS machine and vacuumed overnight before analysis.
JEOL JEM-2200 FS TEM microscope, JEOL Aisa Pte Ltd., Singapore was used to image the CEI layer due to presence of various electrolytes. The cryoEM technique was employed due to the sensitivity of the interface on the cathodes to air; the cryoEM technique would preserve the integrity of these cathode interfaces. In cryoEM, samples are preserved using liquid nitrogen (LN2), resulting in a ‘freezing’ effect. In contrast, the conventional TEM involves sample exposure to air before being transferred into the TEM for analysis. This results in possible contamination of the cathode interfaces from ambient air, which can be avoided with the use of cryoEM technique. The sample preparation for cryoEM was as follows: the cathodes were first mixed with DMC solvent and drop-cast on the TEM grid in the glove box. With minimal exposure to air, the grid was placed in a dewar filled with LN2. The cooled grid was then transferred to the cryo workstation and placed on the TEM cryo sample holder. The TEM was equipped with a ZrO/W(100) Schottky field-emission gun and a 200 kV accelerating voltage was used for imaging. The magnification of the microscope ranged from 50 k to 100 k depending on the thickness of the interface.
X-ray diffraction (XRD) Bruker D8 Advance, Bruker Singapore Pte Ltd., Singapore was used to identify the crystal structure of the NMC cathodes before and after cycling to ensure that the cell’s capacity fade was the result of the electrolytes rather than cathode degradation. The XRD data were obtained from 15° and 90° (2Theta) with a step size of 0.02°. The time per step used was 0.5 s/step. The XRD patterns were fitted using MATCH! Software (version 3.16) and its database.

3. Results and Discussion

3.1. Understanding the Effect of LiFSI Concentration

A series of LiFSI-based electrolytes were prepared by adding 3, 6, and 7 moles of LiFSI salt into a solvent mix of EC and DMC to study the cycling stabilities of NMC cathode cells due to these electrolytes. A 1 M LiPF6 electrolyte was also used as a benchmark. NMC-series (NMC 111, 622 and 811) Li-ion half-cells were assembled and tested at a 1 C rate with a high cut-off voltage of 4.4 V. Figure 1 compares the cycling performances of NMC batteries with different electrolytes. The initial discharge capacities for NMCs were similar regardless of the electrolytes. As the battery cycled, a faster capacity decay could be observed in the cells containing 1 M LiPF6 electrolyte. The 6:4.5:8.3 LiFSI/EC/DMC electrolyte provided the best cycle stability for all NMC batteries, extending to 200 cycles. This highlights the superiority of HCEs compared to the conventional 1 M LiPF6 electrolyte in NMC-cathode battery systems for extended cycling (>100 cycles).
In the NMC 111 cathode system, a capacity retention of 82.5% was achieved when using the 6:4.5:8.3 LiFSI/EC/DMC as the electrolyte while the cell that contained a 1 M LiPF6 electrolyte only achieved a retention of 60.3% (Figure 1a and Table 1). In NMC 622 and NMC 811 cathode systems, the highest capacity retentions were also achieved by the cell containing the 6:4.5:8.3 LiFSI/EC/DMC electrolyte. In NMC 622, 86.0% of the discharge capacity was retained in the cell cycled with the 6:4.5:8.3 LiFSI/EC/DMC electrolyte while only 62.0% of the capacity was retained by the cell containing the 1 M LiPF6 electrolyte (Figure 1b and Table 1). In the NMC 811 cathode system, 87.5% capacity retention was achieved by the cell containing the 6:4.5:8.3 LiFSI/EC/DMC electrolyte, and the capacity retention was only 43.6% when the cell was cycled with the 1 M LiPF6 electrolyte (Figure 1c and Table 1). An increasing trend of capacity retention improvement could also be observed with an increasing nickel content in the cathodes (NMC 111 to NMC 622 to NMC 811). This indicates that the optimal LiFSI electrolyte could be more beneficial for cathodes with more aggressive composition (e.g., high Ni contents). The XRD patterns of the NMC cathodes before and after cycling were analyzed to ensure no structural changes in the cathodes as they would contribute to capacity fade (Figure S1). The XRD data showed very similar XRD patterns for the pristine and cycled cathodes, indicating that the cathodes did not degrade drastically and thus the capacity fade could be attributed to the influence of the electrolytes.
Based on the cycling performance of these NMC cells, the optimal 6:4.5:8.3 LiFSI/EC/DMC electrolyte could be a viable alternative to the conventional 1 M LiPF6 electrolyte for batteries using LiNi1-x-yMnxCoyO2 cathode systems, especially for high Ni contents. The galvanostatic charge/discharge (GCD) curves for cells containing 1 M LiFP6 and 6:4.5:8.3 LiFSI/EC/DMC were further compared. For these curves, more severe polarization was observed in the cells containing 1 M LiPF6. This was critical as polarization reduces the efficiency of a battery and is detrimental to the cycling stability of the battery [32]. One form of polarization will be concentration polarization, which is especially prominent at high charging rates as the transference number of Li+ ions is less than 0.4 in most conventional LIB electrolytes, causing lithium salt to accumulate at the electrodes at the respective charge and discharge cycles [33]. This accumulation then causes a concentration gradient of Li salt between the electrodes, building up overpotential opposing the net cell voltage [33]. The 6:4.5:8.3 LiFSI/EC/DMC electrolyte, containing more lithium salt, is likely more susceptible to such polarization but was shown to be otherwise with smaller polarization, as depicted in Figure 1d–f.
Electrochemical Impedance Spectroscopy (EIS) analysis was first conducted on cycled NMC half-cells to understand the reason for the superior cycle stability of the 6:4.5:8.3 LiFSI/EC/DMC electrolyte over other concentrations and the 1 M LiPF6 electrolyte. It is well known that resistance within a battery would affect the battery’s ability to carry current and result in energy loss and performance degradation [34,35,36]. The plots obtained were fitted to a circuit modelled to the reactions that occurred during the test. This fitting would allow the data to be analyzed quantitatively. In a lithium-ion-battery half-cell system, the EIS spectra mainly come from the working electrode, and thus, the model does not need to consider the counter electrode [37]. This leaves the cathode, electrolyte, current collector, and interfacial layer as the components providing resistance for ion movement. During discharging, the Li-ion moves from the anode to the cathode through the electrolyte and the electrolyte is the first form of resistance. Next, the Li-ion then passes through the interfacial layer, which is another form of resistance, and this consists of double-layer capacitance as well. Next, the Li-ion then experiences the double-layer capacitance once again before entering the lattice of the cathode, which is also another form of resistance (charge transfer). Additionally, resistances (charge transfer) and capacitance are also present when charges interact with the current collector. These resistances and capacitances can be categorized according to their response at high, medium, and low frequencies. The slow transport process of chemical lithium diffusion, denoted by Warburg impedance, is represented in the low frequency range; impedances due to charge transfer are usually found in the middle frequency range and fast transport processes through the interface layers can be measured at high frequencies [37]. In this study, the resistances within the cell (electrolyte, separator, and electrodes) could be combined into one component called bulk resistance (Rb). However, given that electrolyte was the only variable when comparing EIS spectra within the same NMC half-cell, Rb could replaced with the ohmic resistance of the electrolyte (RΩ). Next, with the formation of an interfacial layer during battery cycling, the resistance (Rsf) and capacitance (Qsf) of the interfacial layer were included in the equivalent circuit model. Charge transfer resistance (Rct) and double-layer capacitance (Qdl) were also included in the model. Finally, the impedance due to diffusion processes, known as the Warburg impedance (Zw), was also included.
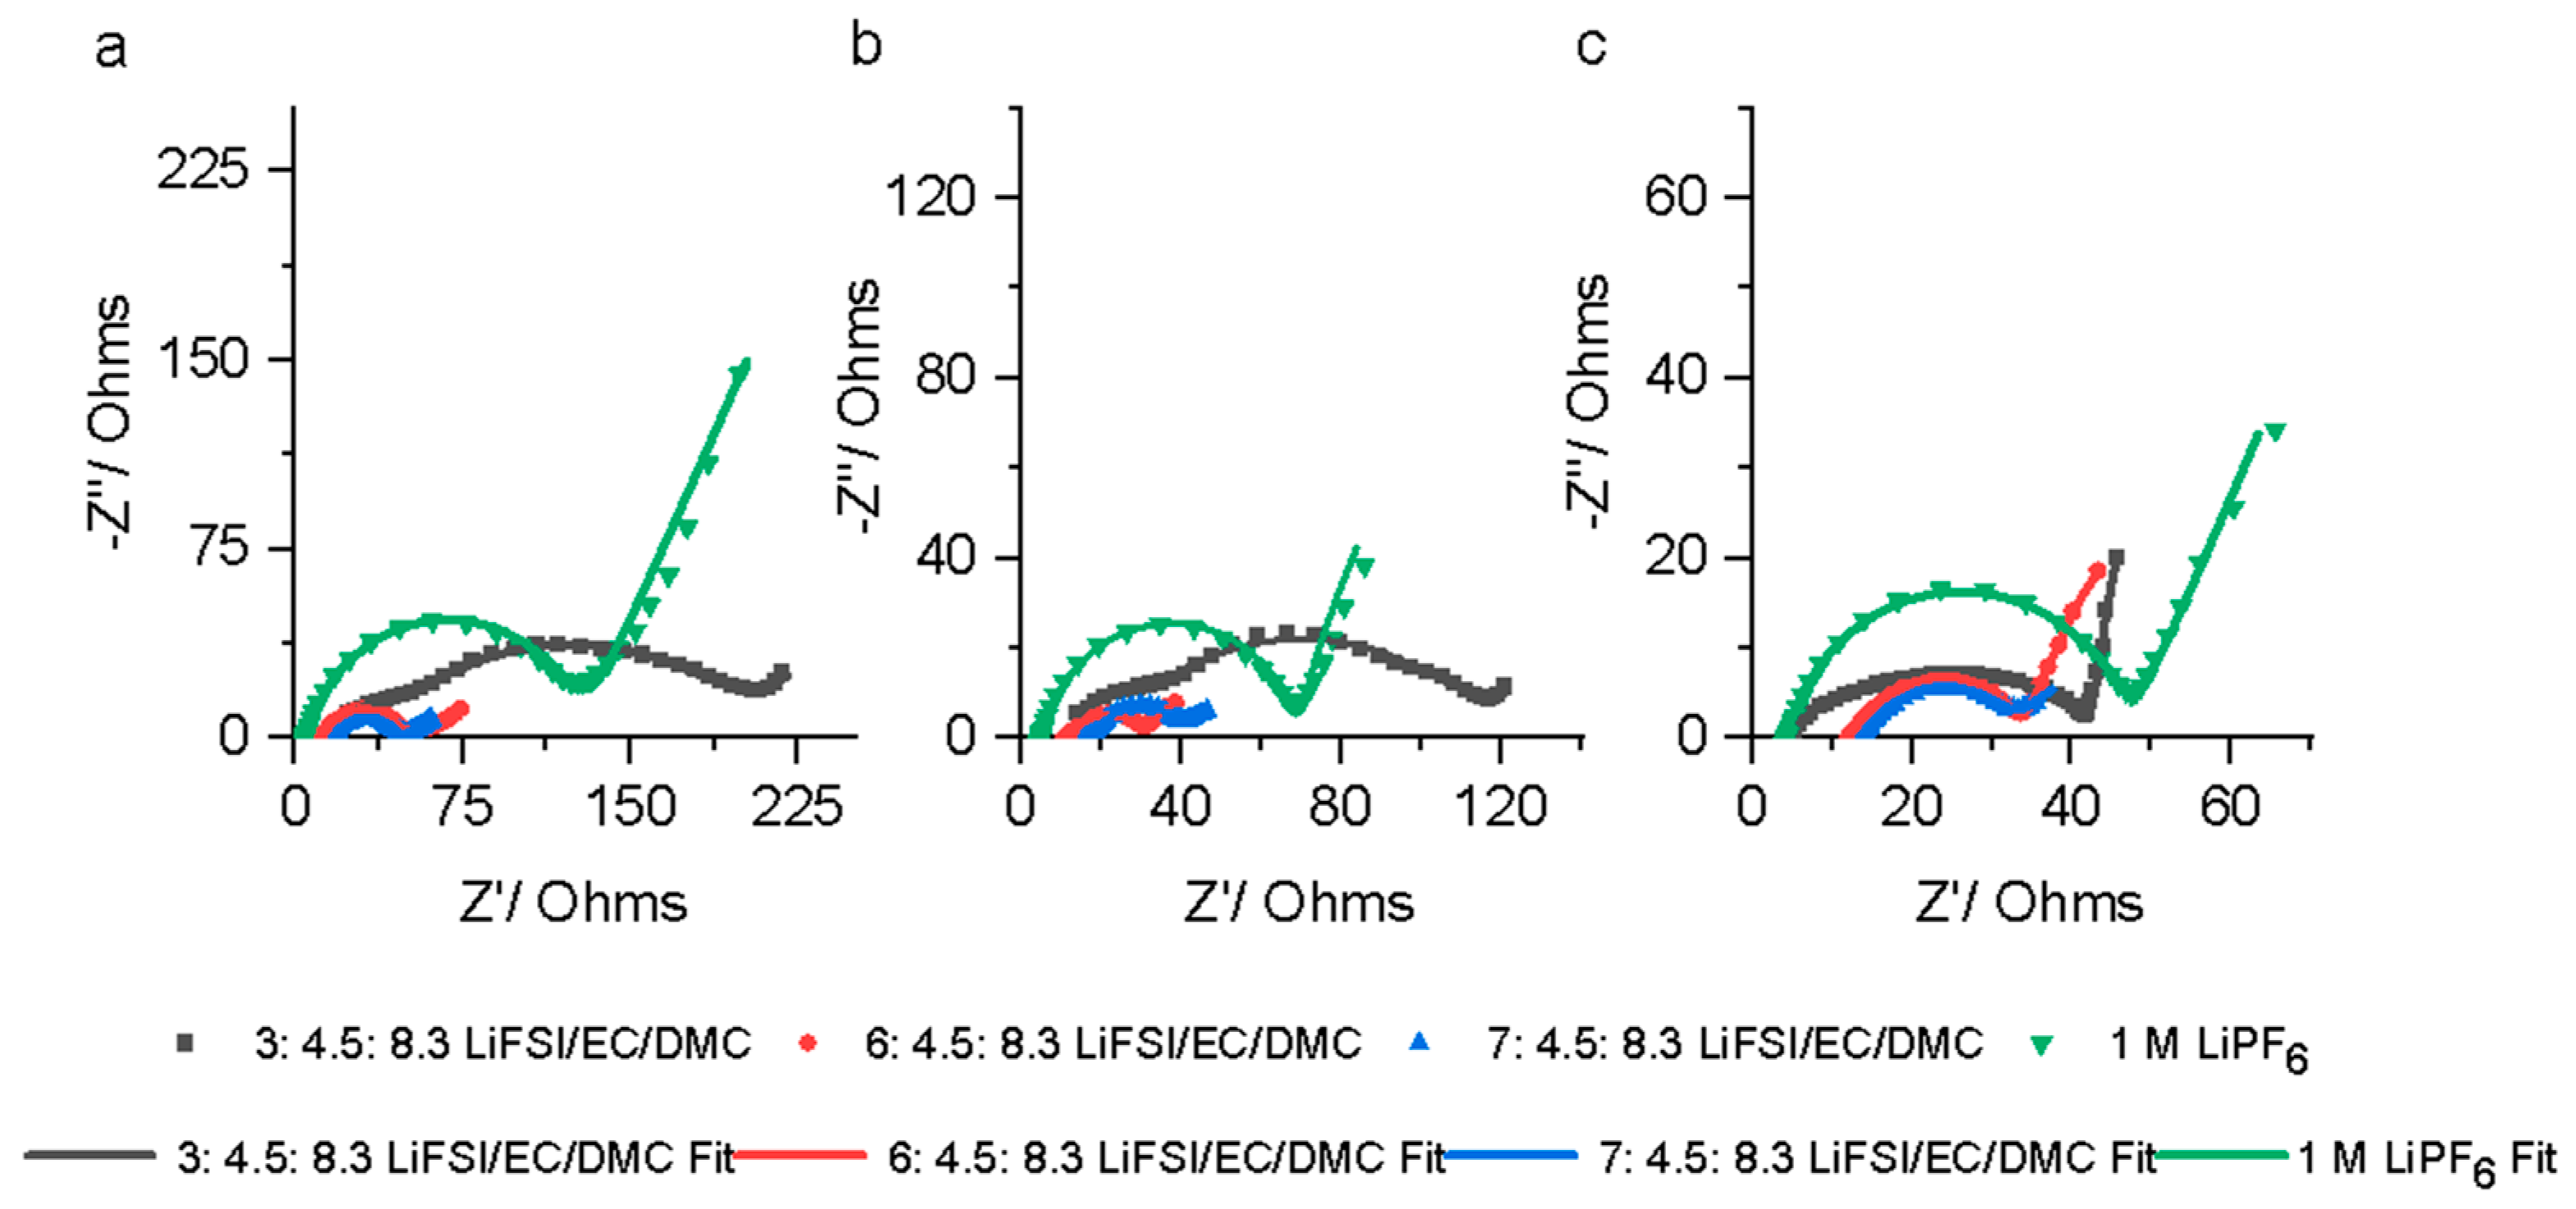
Figure 2 shows the fitted curve for the different NMC cells with the respective electrolytes and the corresponding fitted circuit model and the resistance values obtained from the fit can be found in Tables S1–S3, representing data from NMC 111, NMC 622, and NMC 811 cells, respectively. Low RΩ values were found in the 3:4.5:8.3 LiFSI/EC/DMC and 1 M LiPF6 electrolytes due to their lower salt contents (Tables S1–S3) [38]. Despite the low electrolyte resistance, the cells containing these electrolytes did not show a good cycling performance. Instead, better cycling performances were observed in NMC cells containing 6:4.5:8.3 LiFSI/EC/DMC and 7:4.5:8.3 LiFSI/EC/DMC electrolytes, which had much lower Rsf and Rct values. This may lead us to conclude that interface resistance (Rsf) and charge transfer (Rct) may have a larger impact on battery cycle stability compared to the bulk resistance of the electrolyte (RΩ) [39,40]. The resistance values obtained corresponded to the GCD results since resistance would affect the efficiency of energy delivery [41], where low-resistance cells (specifically those with low Rsf, seen in cells using the 6:4.5:8.3 LiFSI/EC/DMC electrolyte) had better cycling stabilities compared to the rest, across LiNi1-x-yMnxCoyO2 cathode systems. With the presence of interfaces in LIBs being identified as one of the most critical issues [42], further interface characterization would aid in understanding the factors that bring about this low-resistance interface that arises from using the 6:4.5:8.3 LiFSI/EC/DMC electrolyte across LiNi1-x-yMnxCoyO2 cathode systems.
The cathode–electrolyte interface (CEI) layer is a critical component in the battery as it influences multiple aspects of the cell and, most importantly, the cycling stability of the battery [43]. Thus, understanding the formation of the CEI and identifying potential components that contribute to and affect the interphase properties and thereby the battery performance would be beneficial [25]. Transmission electron microscope characterization was first employed to observe the morphology of the CEI layers due to the respective electrolytes. The CEI layers, which were different due to the different LiFSI electrolytes on the NMC cathodes, were first compared. The 3:4.5:8.3 LiFSI/EC/DMC electrolyte gave an interphase that was thicker and provided inconsistent coverage on the cathode surface, as seen in Figure 3a–c. The 6:4.5:8.3 LiFSI/EC/DMC electrolyte, on the other hand, formed interphases that were more uniform in thickness, between 5 and 10 nm, and covered the surface of the cathodes consistently (Figure 3d–f). The interphases with 7:4.5:8.3 LiFSI/EC/DMC (Figure 3g–i) were seen to be less consistent and thicker compared to those with 6:4.5:8.3 LiFSI/EC/DMC. Thicker interphases potentially increase resistance to charge transfer, as reflected in the EIS results, and thus are not ideal. Concerning the consistency of the interface, it is possible that the inner CEI layer played a critical role in this issue. The CEI layer has a complex multilayer structure and is formed due to the electrochemical interaction between the electrolyte components and the cathode surface and the migration of SEI components to the CEI layer [44]. Additionally, the process of CEI layer formation is a dynamic process, and this involves the layer’s generation/disappearance/regeneration during the charge/discharge process [44]. Being a multilayer structure, the inner layer of the CEI layer will be critical to the stability of the whole CEI layer as this medium (the inner CEI layer) can possibly double up as an adhesive between the cathode and the outer CEI layer, ensuring the formed CEI layer remain adhered to the cathode, protecting it from further interaction with the electrolyte. However, such a hypothesis will have to be verified using the XPS and TEM data of cathodes with shorter cycle numbers to determine the layer’s composition and morphology and how it may allow good adhesion. Thus, the inner CEI layer could have been the critical component differentiating 6:4.5:8.3 LiFSI/EC/DMC and 7:4.5:8.3 LiFSI/EC/DMC electrolyte interface consistency. So, with the 6:4.5:8.3 LiFSI/EC/DMC electrolyte, the cathode was more protected by the consistent interphase, which was thin and less resistive, allowing better cycling stability. A further comparison was performed on the interfaces of cycled and pristine cathodes, and no visible interfaces were seen on the pristine cathodes (Figure S2). This further indicates that the CEI layers observed, shown in Figure 3, were due to the interaction between the electrolyte and the cathode surface.
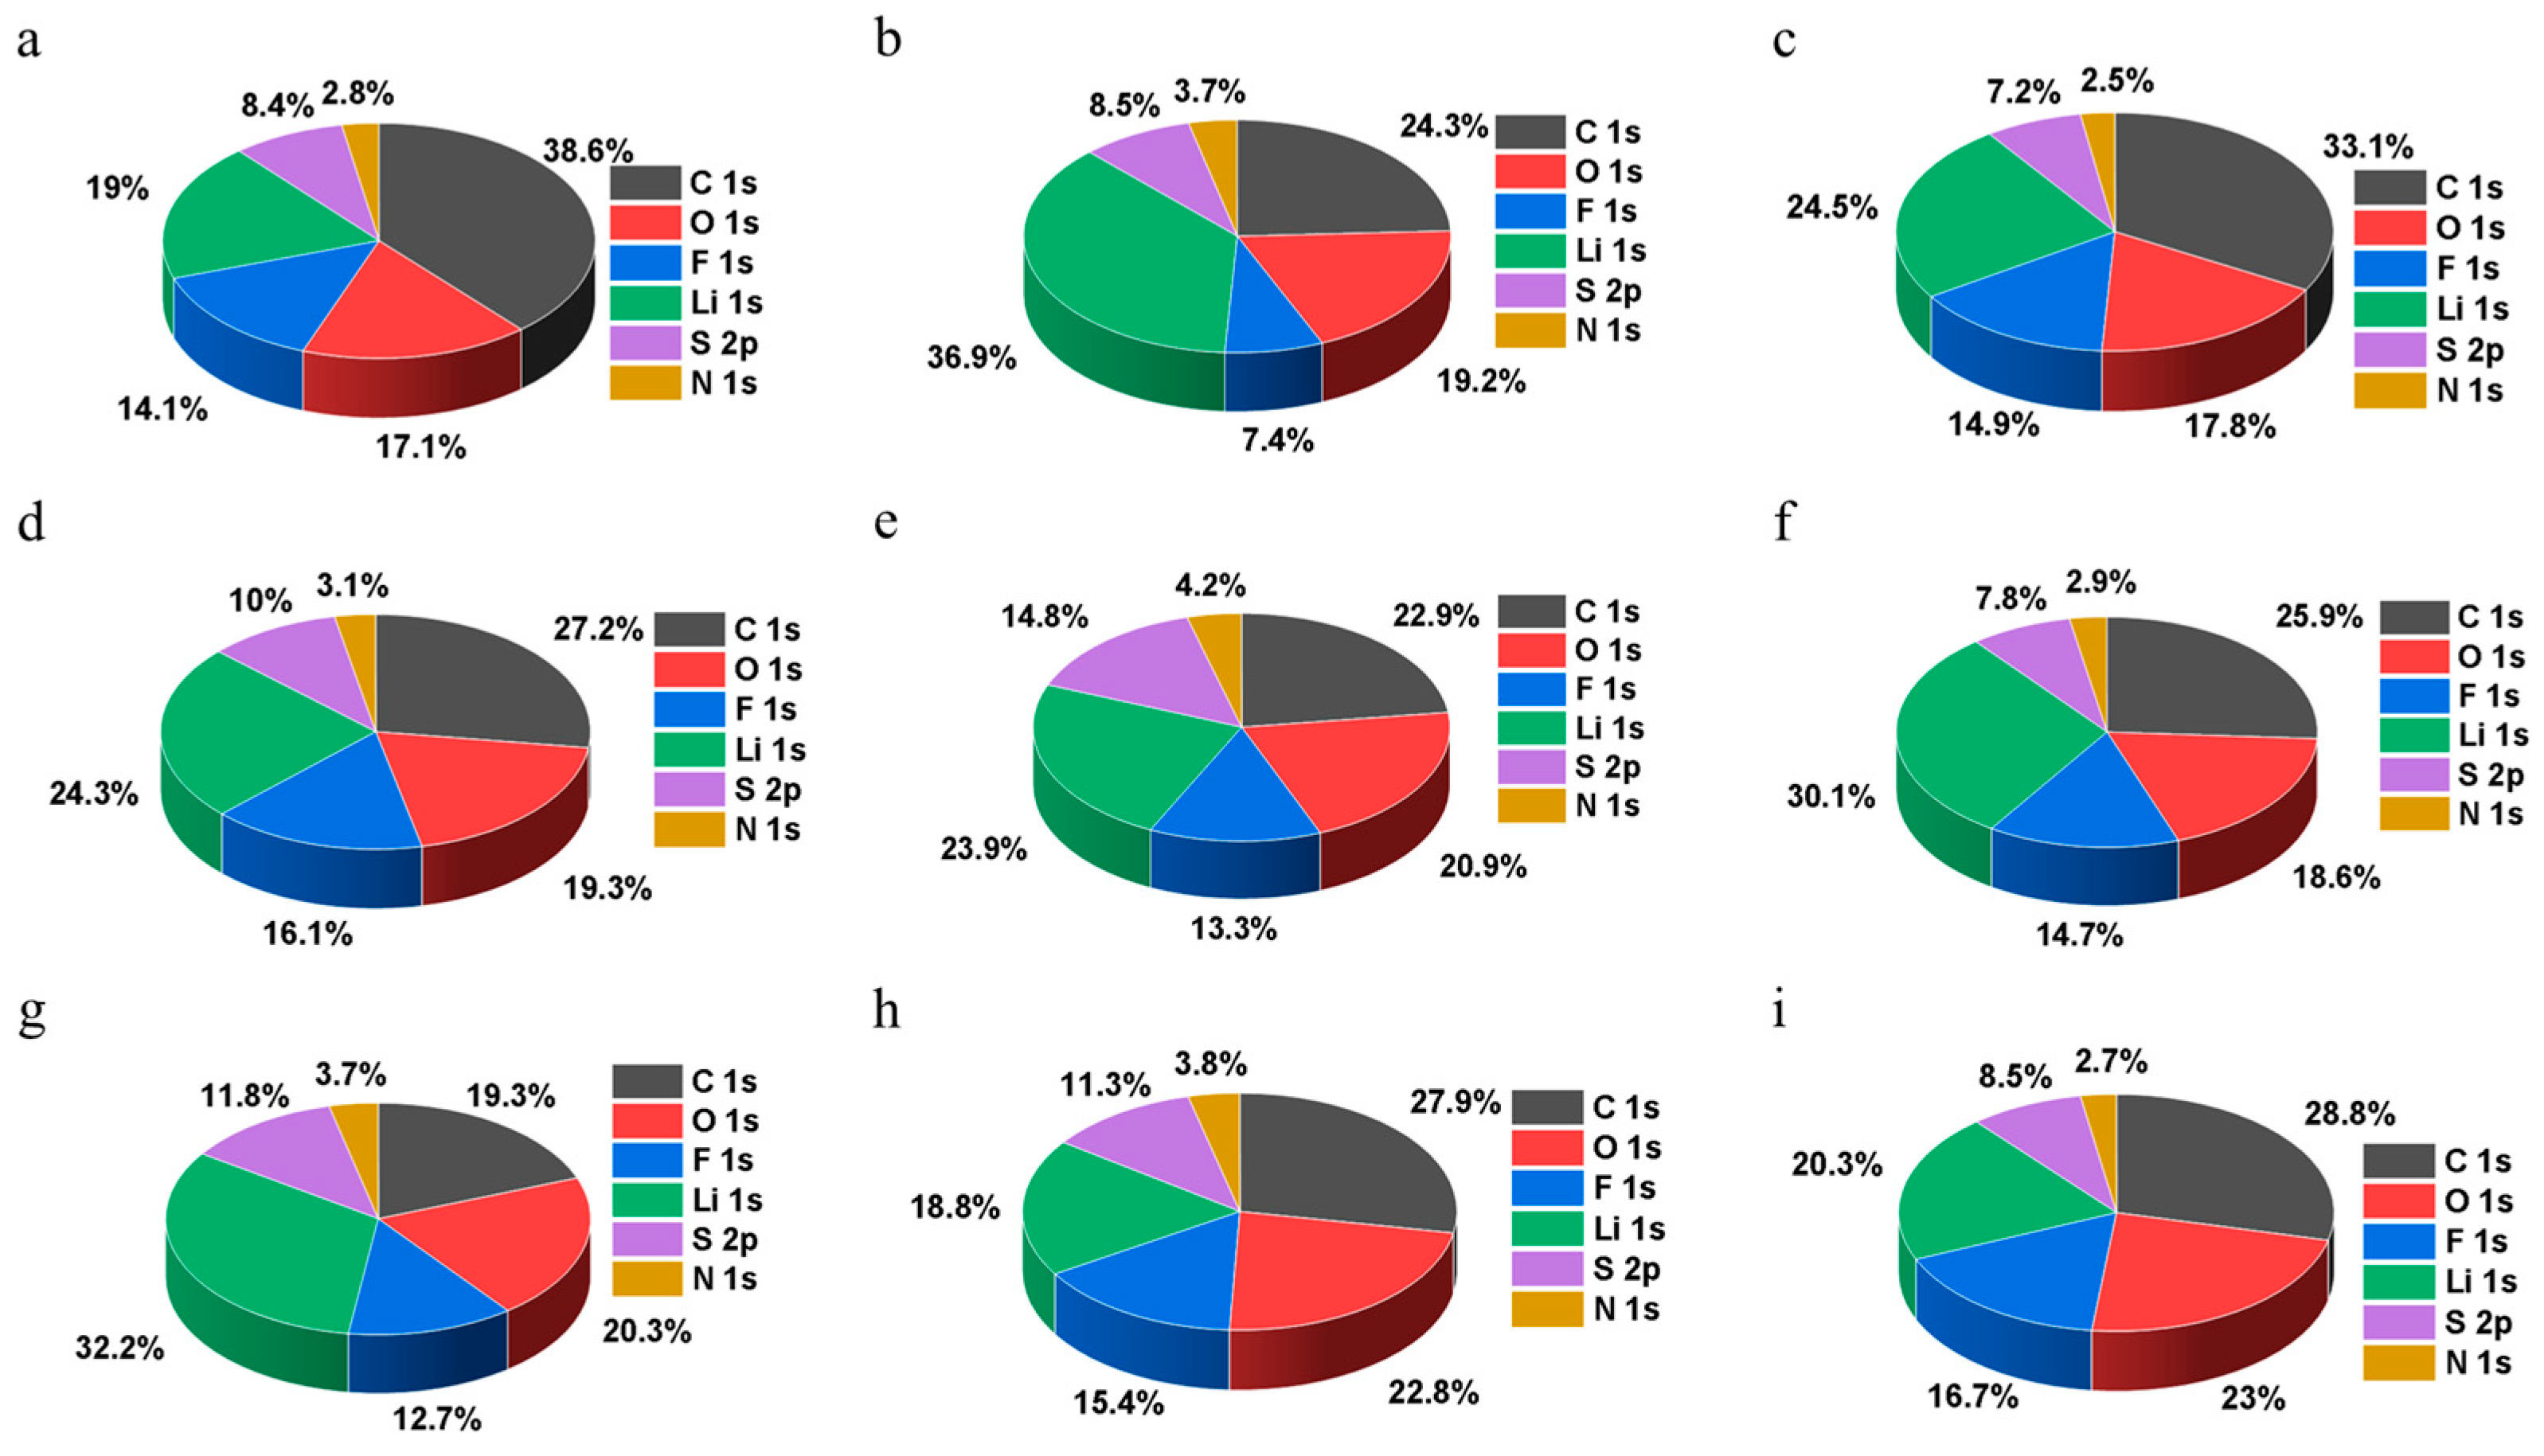
Next, the effect of the LiFSI concentration on the CEI layer composition was further studied using the XPS technique. From the composition obtained from the wide scan of the CEI layers with the 3:4.5:8.3 LiFSI/EC/DMC, 6:4.5:8.3 LiFSI/EC/DMC, and 7:4.5:8.3 LiFSI/EC/DMC electrolytes on different NMC cathodes, a trend of an increasing fluorine-to-carbon (F:C) ratio was observed with an increasing LiFSI salt concentration in the electrolyte (Figure 4). The carbon ratio can represent decomposition products due to the solvent and F was used to represent decomposition products due to the lithium salt, LiFSI [28]. The ratios are tabulated in Table 2; the F:C ratio increased when the LiFSI concentration in the electrolyte changed from 3 moles to 6 moles. A further increase in the LiFSI concentration to 7 moles did see a further increase in the F:C ratio in NMC 111, but in NMC 622 and NMC 811, the F:C ratio did not have a significant difference. This indicated that the extent of the increasing salt concentration in terms of forming a more inorganic interphase had reached an optimal/plateau point at 6 moles and a further increase in salt concentration would have had minimal benefit in terms of increasing the inorganic nature of the CEI layer. The presence of more inorganic content in the interphase was seen to be more ideal as inorganics would improve the conductivity of the interphase [23,28,44,45], resulting in more efficient charge transfer and increasing the cycling stability of the battery.
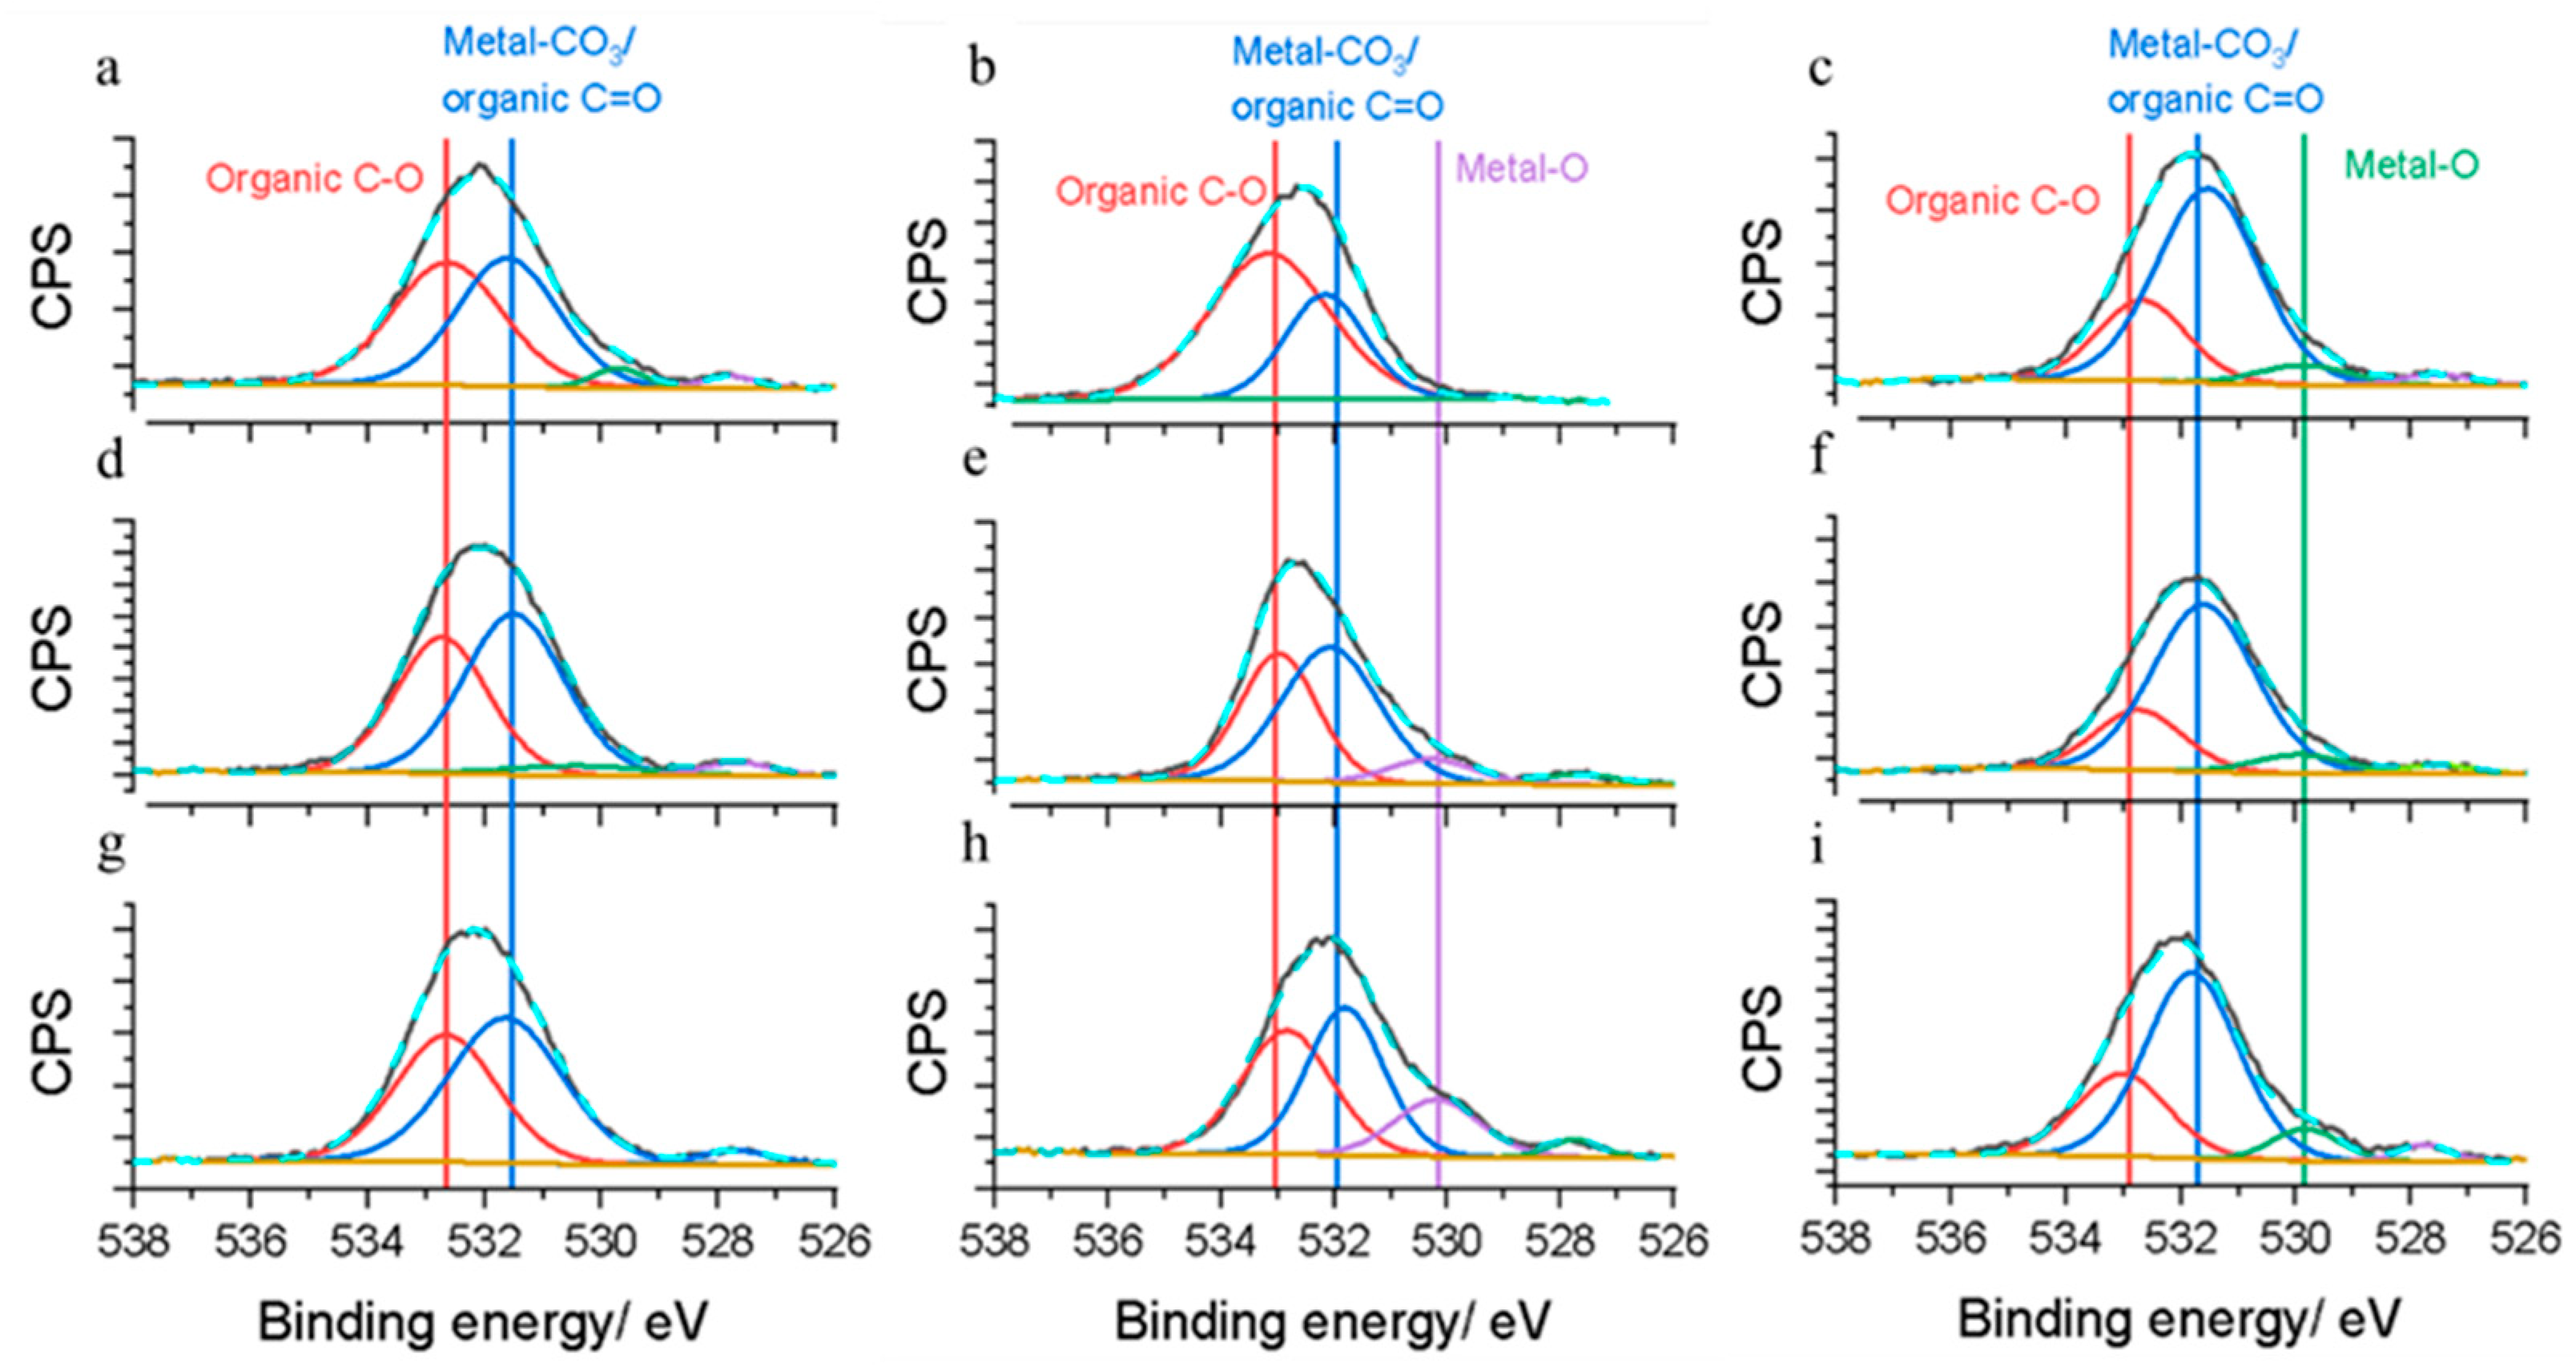
The O 1s scans of the CEI layers with electrolytes of different LiFSI concentrations on different cathodes showed that with increasing concentrations of LiFSI in the electrolyte, the CEI layers formed consisted of more inorganic O 1s components regardless of cathodes. This was more ideal as organics would cause the interphase to be less conductive [23,28,44,45], resulting in less efficient charge transfer, decreasing the cycling stability of the battery. However, the increase in inorganic content had also brought about undesirable metal oxide (Metal-O) components, which were found in the CEI layers on the NMC 622 and 811 cathodes (Figure 5b,c,e,f,h,i). The metal oxide atomic% was seen to increase as the LiFSI concentration increases, as evident in the peak areas of metal oxides in NMC 622 and NMC 811 cathodes (Figure 5b,c,e,f,h,i). Metal oxides could contain lithium (potentially dead lithium), which is critical for battery performance [46,47,48]; the migration of Li+ ions has also been seen to be affected by these oxides [49,50,51]. This was reflected in the poorer cycling performance of batteries containing 7:4.5:8.3 LiFSI/EC/DMC electrolytes where the CEI layers contained a higher content of metal oxides.
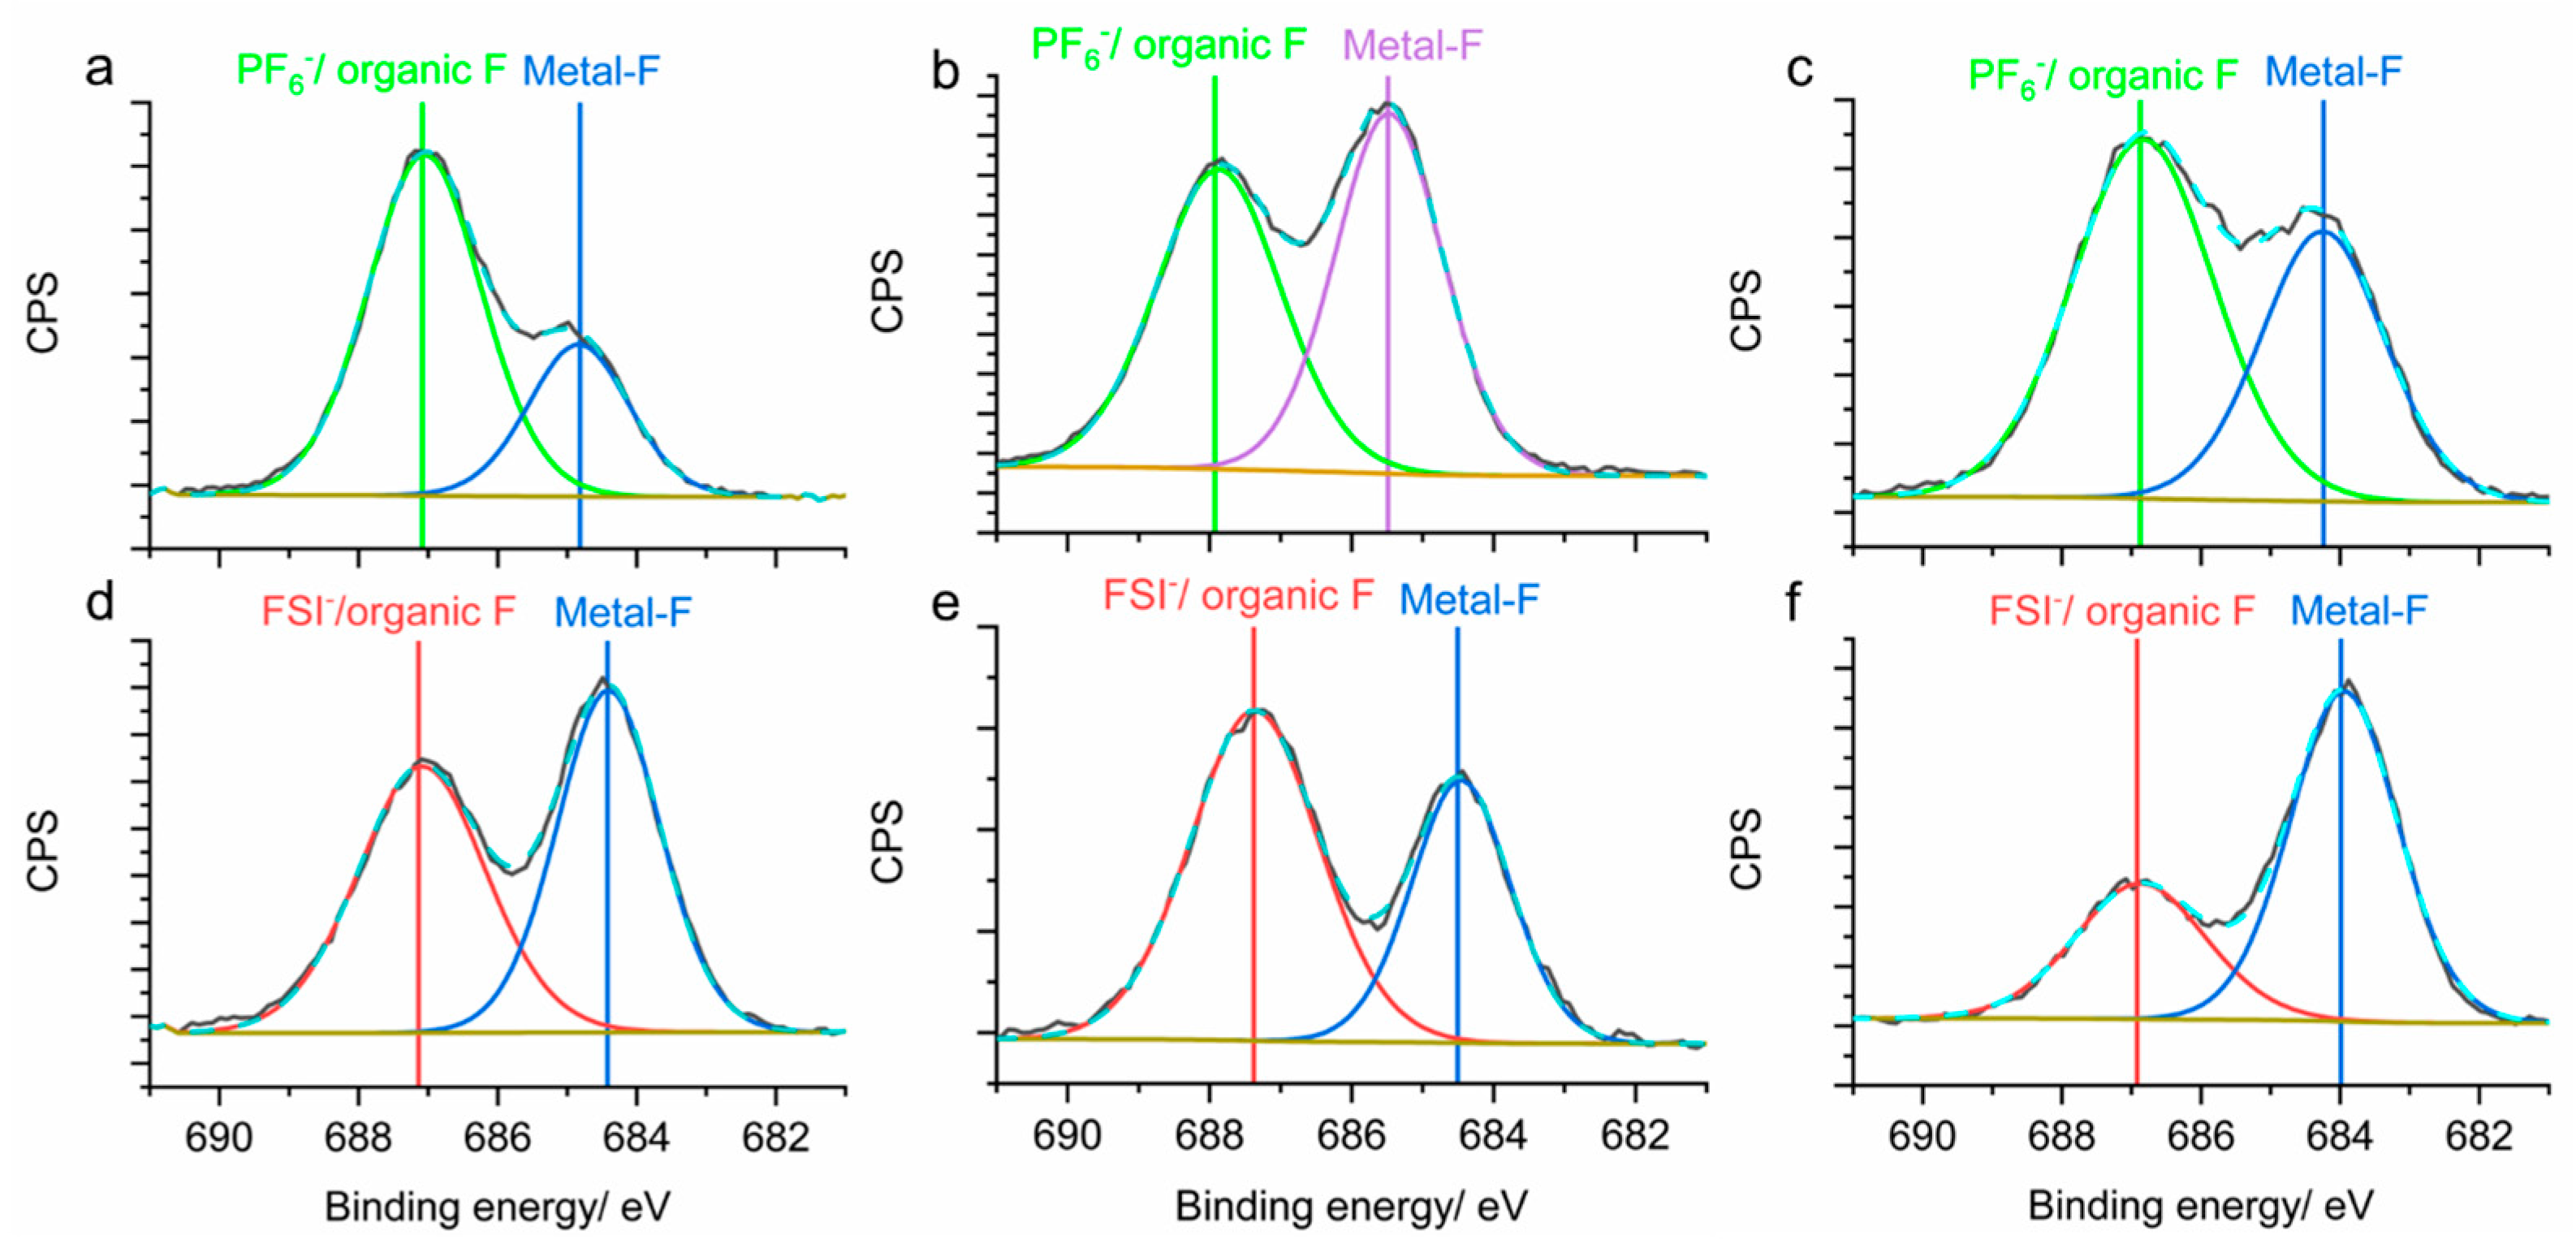
In F 1s spectra, the increase in LiFSI in the electrolyte saw the CEI layer decrease in metal-F to the FSI atomic percentage in all NMC cathodes. The difference was most prominent when the concentration of LiFSI changed from 3 moles to 6 moles (Figure 6a–f). At 7 moles LiFSI, the F 1s spectra were very similar to those of the 6:4.5:8.3 LiFSI/EC/DMC and 7:4.5:8.3 LiFSI/EC/DMC electrolytes, producing CEI layers that contained slightly more metal-F with respect to FSI (Figure 6d–i). Furthermore, the peaks obtained in the 3:4.5:8.3 LiFSI/EC/DMC LiFSI electrolyte, regardless of cathodes, were very different compared to those in the 6:4.5:8.3 LiFSI/EC/DMC and 7:4.5:8.3 LiFSI/EC/DMC electrolytes, hinting that the decomposition of the LiFSI salt is concentration-dependent. Having fluorine-containing species, including LiF (metal-fluoride), CFx, and S-F (FSI), has also been observed to form a dense cathode interphase, suppressing unwanted reactions between cathodes and electrolytes [28], similar to what was observed in this study. The ‘dark green metal-F’ peak could be assigned to LiSO2F, which was often seen in interphases due to the presence of concentrated electrolytes [52,53], a product of LiFSI salt decomposition. As for the “blue metal-F”, it was also a product of LiFSI decomposition, as widely reported in LiF [54].
Finally, SO42− was the major component in most of the S 2p spectra regardless of the cathode or electrolyte (Figure S3). This ensured better Li+ ion transport given that the partial negative charges on the oxygen atoms of the SOx functional group could improve the kinetic behavior of Li+ ions through the ion hopping mechanism [55,56], lowering the interfacial resistance of the CEI layers.
The XPS technique was also used on the pristine cathodes to identify the components that made up the cathode surfaces. Figure S4 shows that the elemental components included carbon, oxygen, and fluorine, with carbon being the major component (around 75 at.%) for all pristine cathodes. The formation of this carbon interface was likely due to the interaction of the cathode surface with air during the preparation of the cathodes from their powdered form to the eventual cathode sheet on an aluminum sheet. These carbon interfaces were, however, very thin layers given that they were not obvious in the TEM images of the pristine cathodes (Figure S2).
Overall, the increase in LiFSI concentration in the electrolyte formed a more inorganic CEI layer based on the increasing F:C ratio calculated from the wide scan and seen in the O 1s narrow scan spectra. This increased the conductivity of the interphase, allowing more efficient ion Li+ transfer and thus improving the battery’s cycle stability. However, the increased salt concentration also brought about a higher content of resistive metal oxide, most prominent in the 7:4.5:8.3 LiFSI/EC/DMC electrolyte, which would affect Li+ migration and battery stability. Lastly, SO42− was the major component in most of the S 2p spectra, regardless of the cathode or electrolyte; it ensured better Li+ ion transport due to the partial negative charges on the oxygen atoms of the SOx functional group, improving the kinetic behavior of Li+ ions through the ion hopping mechanism [55,56]. This lowered the interfacial resistance of the CEI layers. Thus, the 6:4.5:8.3 LiFSI/EC/DMC electrolyte was established as the optimal electrolyte due to its more conductive inorganic interphase with a minimal detrimental effect of excess metal oxide due to high LiFSI salt contents.

3.2. Properties of LiFSI/EC/DMC and 1 M LiPF6 Electrolytes

The LiFSI/EC/DMC electrolytes were inherently more viscous compared to the 1 M LiFP6 electrolyte due to the difference in salt content in a given volume of electrolyte. The viscosity of the electrolyte with the lowest LiFSI salt content, the 3:4.5:8.3 LiFSI/EC/DMC electrolyte, had a viscosity of 13.43 mPa.s, close to four times that of the 1 M LiPF6 electrolyte, which had a viscosity of only 3.50 mPa.s. This difference in viscosity became more drastic as the LiFSI content in LiFSI/EC/DMC electrolyte continued to increase to 6 moles, forming an electrolyte with 67.77 mPa.s, and at 7 moles, the viscosity reached 112.43 mPa.s (Figure S5a). The high viscosity further implied that high salt-containing electrolytes had lower conductivity, which was not ideal (Figure S5b) [57]. This highlights the drawback of electrolytes containing high salt contents as low-viscosity electrolytes generally have better wettability and conductivity/ion mobility, which enhances better performance [58].
The electrochemical stabilities of the formulated electrolytes were also studied with the 1 M LiPF6 electrolyte as a reference. Figure S4c shows the linear sweep voltammetry plot of the different electrolytes. When compared to the 1 M LiPF6 electrolyte, the 3: 4.5: 8.3 LiFSI/EC/DMC electrolyte produced higher oxidative current, indicating instability. With the increase in the LiFSI salt concentration in the electrolyte, the 6:4.5:8.3 LiFSI/EC/DMC electrolytes achieved a lower oxidative current than the 1 M LiPF6 electrolyte, displaying the electrochemical stability that an optimally concentrated high-salt electrolyte can bring about. The oxidative currents of 6:4.5:8.3 LiFSI/EC/DMC and 1 M LiPF6 were 0.67 mA and 1.13 mA at 4.4 V, respectively.
Then, the proposed electrolyte in this study was further compared with LiFSI-based electrolytes available in the literature. In the literature available, conductivity values were more available and thus used to evaluate the proposed electrolyte. When comparing five different works on LiFSI-based electrolytes, it was seen that the conductivity of these electrolytes ranged between 1.5 mS/cm and 3.1 mS/cm at temperatures between 25 °C and 30 °C despite differences between the electrolytes’ salt contents. The electrolytes compared included 4 M LiFSI DMC [27], 10 M LiFSI/DMC [28], 1:1.5 LiFSI/DMC [29], and 1:2 LiFSI EC [20]. The proposed electrolyte in this study has a conductivity of 2.2 mS/cm, coincidentally within the range of the electrolytes found in the literature. This could hint that, for highly concentrated electrolytes, at least, 1.5 mS/cm to 3.1 mS/cm might be the more ideal electrolyte conductive range an electrolyte should have for it to be more optimal. As for cost, the high-cost components are DMC and LiFSI. The cost of the proposed electrolyte is SGD 22/mL (based on the price in Sigma-Aldrich), which is the median of the electrolytes compared largely due to the less LiFSI and DMC used to formulate the electrolyte compared to the amounts in electrolytes like 10 M LiFSI/DMC, which only contains the costly components. These comparisons can be found in Table S4.

3.3. Optimal LiFSI Electrolyte Versus State-of-the-Art LiPF6 Electrolyte

Next, the CEI layers on the NMC cathodes with the optimal LiFSI electrolyte, 6:4.5:8.3 LiFSI/EC/DMC, were further compared with the CEI layers with the 1 M LiPF6 electrolyte. Figure 7d–f show the CEI layer after 200 cycles in the 6:4.5:8.3 LiFSI/EC/DMC electrolyte imaged using TEM. The interphases formed were continuous, uniform, and thin surface layers on the NMC particles. These CEI layers ranged from 6 to 10 nm. In comparison, inconsistent CEI layers were observed on the NMC particles cycled in the 1 M LiPF6 electrolyte, and they were inconsistent in thickness, ranging from 4 to 40 nm (Figure 7a–c). These results indicate that 6:4.5:8.3 LiFSI/EC/DMC enabled efficient surface protection on all the tested NMC cathodes. This difference was a possible reason for improved cycling stability for the cells cycled with the 6:4.5:8.3 LiFSI/EC/DMC electrolyte because unwanted side reactions and growths in interfacial resistance can be reduced with a stable CEI layer [25]. A stable CEI layer also preserves the cathode’s native structure since the phase transition of layered structure to spinel, especially in NMC cathodes, is considered the dominant factor for cell degradation [49]. The combination of a thinner and low-impedance CEI layer (in the case of 6:4.5:8.3 LiFSI/EC/DMC) is therefore beneficial for the performance of high-voltage batteries [59,60].
X-ray Photoelectron Spectroscopy (XPS) analysis on NMC cathodes was further conducted to investigate the composition of the CEI layer. Figure 8 shows the elements and their relative atomic% (at.%) values detected in the XPS wide scan of the CEI layers with 6:4.5:8.3 LiFSI/EC/DMC and 1 M LiPF6 electrolytes in different NMC cathode systems. The CEI layers with the 1 M LiPF6 electrolyte were dominated by C constituents ranging from 46.8 to 51.7 at.%. and other components included Li, fluorine (F), oxygen (O), and phosphorous. The CEI layer with the 6:4.5:8.3 LiFSI/EC/DMC electrolyte had a significantly lower C constituent, with elements like Li, O and sulfur (S) contributing more to the overall CEI layer composition (Figure 8) compared to 1 M LiPF6’s CEI layer composition. This difference in C at.% between the CEI layers was consistent across all NMC cathode systems and should be further discussed given the critical role interphases like the CEI layer play in determining a battery’s cycling performance [61,62]. The lower C at.% would first indicate a less organic CEI layer that improved the ionic conductivity of the CEI layers (leading to a less resistive CEI layer) [23,28,44,45] seen in the cells containing the 6:4.5:8.3 LiFSI/EC/DMC electrolyte. Other benefits of a less organic CEI layer include its effectiveness in protecting the cathode from side reactions [63,64], which preserves the integrity of the cathode. Inorganic-rich CEI has a weak bond to transition metal oxide cathodes, which will suffer less strain/stress during the volume change in the cathode, maintaining its protection of the cathode surface [65]. Thus, the lower C content with the 6:4.5:8.3 LiFSI/EC/DMC electrolyte was essential for cathode preservation and efficient ion transfer.
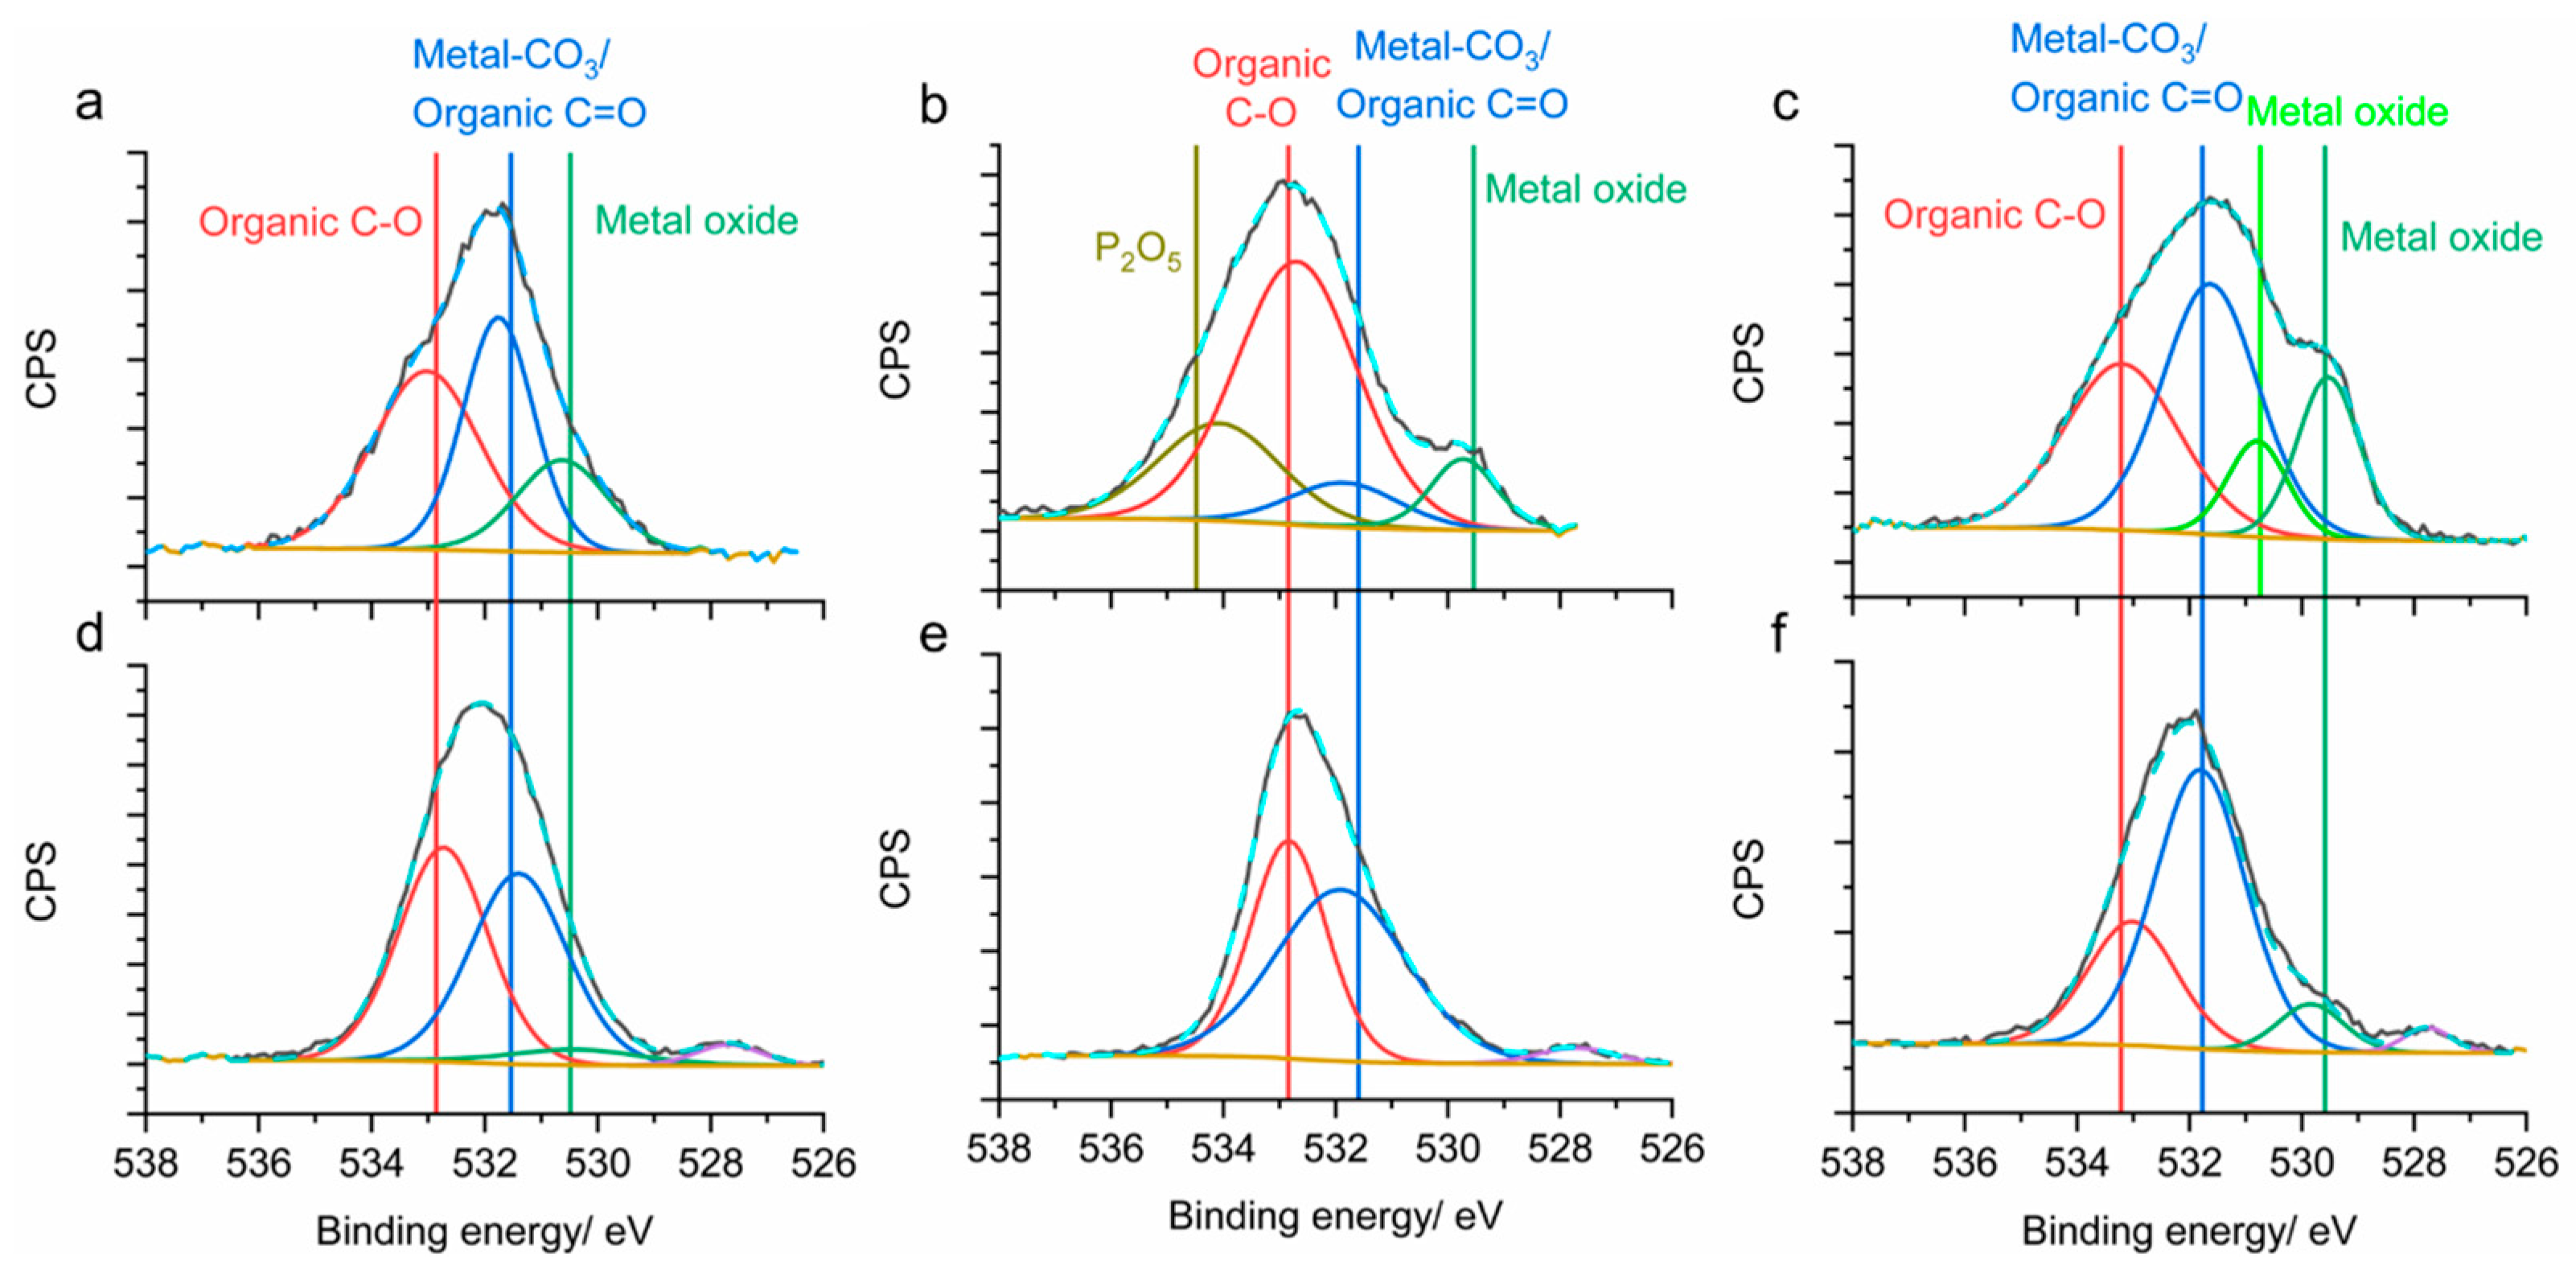
The deconvolution of the O 1s spectra revealed that the CEI layers with both the 6:4.5:8.3 LiFSI/EC/DMC and 1 M LiPF6 electrolytes, regardless of the NMC cathode, were composed of organic C-O and metal-CO3/organic C=O as the main components (Figure 9). In addition, a metal oxide peak was consistently detected on the cathode surface cycled in 1 M LiPF6 electrolytes. These metal oxide peaks, when matched to the database by the National Institute of Standards and Technology (NIST) [31], could be assigned to lithium oxides, nickel oxides, cobalt oxides, and manganese oxides. This could indicate dissolutions of transition metals from the cathode when the 1 M LiPF6 electrolyte was used, and this may have affected the migration of Li+ ions [49,50], potentially affecting battery performance. On the other hand, such metal oxide peaks were not detected (or were in lower area%) on the cathode surface cycled in the 6:4.5:8.3 LiFSI/EC/DMC electrolyte. In addition, a peak at ~527/528 eV was constantly detected for the CEI layers with the 6:4.5:8.3 LiFSI/EC/DMC electrolyte. This peak could be assigned to Li2O, which had this low binding energy as its signature in the O 1s spectrum [66,67]. The benefits of having Li2O in the CEI layer included enhancing the mechanical strength of the interphase and improving the diffusion kinetics of Li+ [68,69].
In noting the deconvoluted F 1s spectra, it was observed that metal fluorides (metal-F), organic F, and PF6 or FSI made up the spectra (Figure 10). Similar surface compositions were observed across different cathodes, regardless of which electrolytes were used. The metal fluoride peaks were not assigned to LiF as most of the literature did due to the overlapping binding energies of LiF, MnF2, and NiF2 [31]. CoF2 could have contributed to this range of binding energies as well [70]. Lower-binding-energy metal-F peaks were consistently seen in the spectra with the 6:4.5:8.3 LiFSI/EC/DMC electrolyte (Figure 10); this indicated increased electron density around the F atom and hinted at a more inorganic environment in the CEI layer due to the 6:4.5:8.3 LiFSI/EC/DMC electrolyte whereas in the case of the CEI layer due to 1 M LiPF6 electrolyte, organics dominated, supporting the wide scan analysis.
Finally, S constituents made up about 10 at.% of the CEI layer with 6:4.5:8.3 LiFSI/EC/DMC, a component that was not present in 1 M LiPF6’s CEI layer due to the different make-up of the lithium salt. The influence of S on the properties of the CEI layer cannot be undermined and plays a role in improved battery performance. SOx (e.g., SO42−, SO3, and SO2) is a functional group considered to be able to improve the surface stability of cathodes due to its ability to allow only ion migration while inhibiting electron transfer and suppressing electrolyte decomposition [55,71]. In particular, the partial negative charges on the oxygen atoms of the SOx functional group can improve the kinetic behavior of Li+ ions through the ion hopping mechanism [55,56], implying that having a SOx functional group could effectively improve the cycling performance of a Ni-rich NMC cathode. The fitted S 2p spectrum (Figure S6) showed SOx constituents and could suggest its contributions to a better battery performance, along with other desirable components of an ideal CEI layer [72].
In summary, the CEI layers formed by the 6:4.5:8.3 LiFSI/EC/DMC electrolyte on different NMC cathodes revealed Li, C, and O as the main components, with atomic percentages (at.%) varying across cathodes, generally ranging from 20 to 30 at.%. In contrast, the CEI layers formed using 1 M LiPF6 electrolyte were dominated by C, comprising around 50 at.% of the layer, indicating a more organic CEI layer composition. The lower C content and the reduced content of metal oxide in the CEI layers formed by the 6:4.5:8.3 LiFSI/EC/DMC electrolyte increased the interface’s conductivity, allowing more efficient charge transfer. Meanwhile, trace amounts of Li2O were consistently present, contributing to the increased mechanical strength of the CEI layer and preserving the cathodes’ integrity. Lastly, ~10 at.% of sulfur was consistently present in the CEI layer with the 6:4.5:8.3 LiFSI/EC/DMC electrolyte. It enhanced surface stability by allowing ion migration while inhibiting electron transfer and suppressing electrolyte decomposition. Notably, these beneficial components were only observed in the CEI layers formed by the 6:4.5:8.3 LiFSI/EC/DMC electrolyte due to the optimal salt concentration and the LiFSI salt, enhancing the cycling stability of NMC batteries.
In high-salt-concentration electrolytes, the free solvent molecules are decreased by increasing the anion content (salt content), and this increase in anion content changes the interfacial reactions on the electrode surface such as on the CEI layer. Consequently, the solvation structure of Li+ ion in the electrolyte also changes due to the increased lithium salt concentration, and this alters the CEI layer’s properties [44,73], as evident from the TEM and XPS results obtained. Specifically, the anions are decomposed in place of solvent molecules, forming a CEI layer with lower organic content and higher conductivity [44]. Additionally, this decrease in organic content would also decrease the side reactions at the interphase [63], ensuring good battery cycling stability as seen from the battery performance with the 6:4.5:8.3 LiFSI/EC/DMC electrolyte in this study. Despite the benefits of high salt concentrations, excess lithium salt results in poorer battery cycling stability, as seen in the 7:4.5:8.3 LiFSI/EC/DMC electrolyte, and thus an optimal lithium salt concentration needs to be identified. The problems associated with electrolytes with higher-than-optimal salt concentration include lower ionic conductivity and increased viscosity, which results in cell polarization, decreasing the performance of the battery [74]. Additionally, this study showed that the 7:4.5:8.3 LiFSI/EC/DMC electrolyte produced interphases that contained metal oxide and did not fully protect the cathode from the electrolyte’s interaction and was thus less ideal than the optimal electrolyte, 6:4.5:8.3 LiFSI/EC/DMC. This established that there was a critical concentration of lithium salt in the electrolyte; deviation from this resulted in poorer battery stability. Figure 11 depicts a schematic representation of the role of 6:4.5:8.3 LiFSI/EC/DMC vs. the 1 M LiPF6 electrolyte on the cycle stability of NMC-series LIBs. The use of 6:4.5:8.3 LiFSI/EC/DMC in the EC DMC electrolyte has allowed consistent superior cycling stability in LiNi1-x-yMnxCoyO2 cathode half-cell systems compared to the cells cycled with 1 M LiPF6 electrolytes, achieving a capacity retention improvement of up to 40%. The combination of less organic materials and sulfur components on the NMC series cathode surfaces cycled in 6:4.5:8.3 LiFSI/EC/DMC lowered the resistance of the CEI layer and contributed to better cycling stability in this study (Figure 11). Furthermore, the CEI layers with the 6:4.5:8.3 LiFSI/EC/DMC electrolyte were observed to be more consistent, reducing the cathodes’ interaction with the electrolyte and unwanted side reactions, resulting in a notable improvement in the electrochemical performance of NMC-series cathode LIBs.

4. Conclusions

The 6:4.5:8.3 LiFSI/EC/DMC (in molar ratio) electrolyte has been developed as a universal electrolyte for NMC-based LIBs, improving the capacity retention of these batteries from 43.6% to up to 87.5% under a high cut-off voltage 4.4 V. This has been due to the 6:4.5:8.3 LiFSI/EC/DMC electrolyte’s ability to effectively reduce the cell resistances and passivate the NMC cathode surface through the formation of low organic contents and sulfur-containing component interfaces. These interfaces are also thin, continuous, and robust compared to their conventional counterparts. All these findings extend the conventional knowledge on the interface of NMC materials with LiFSI-based electrolytes and provide an effective universal electrolyte for NMC-based LIBs.

Supplementary Materials

The following Supporting Information can be downloaded at: https://www.mdpi.com/article/10.3390/en18040974/s1, Figure S1. Representative XRD pattern of (a) NMC 111, (b) NMC 622, and (c) NMC 811 cathodes before battery cycling and after battery cycling with different electrolytes; Figure S2. TEM images of pristine (a) NMC 111, (b) NMC 622, and (c) NMC 811 cathode surfaces.; Figure S3. XPS S 2p spectra of CEI layers with 3: 4.5: 8.3 LiFSI/EC/DMC electrolyte on (a) NMC 111, (b) NMC 622, and (c) NMC 811; 6:4.5:8.3 LiFSI/EC/DMC electrolyte on (d) NMC 111, (d) NMC 622, (e) NMC 811 cathodes; and 7: 4.5: 8.3 LiFSI/EC/DMC electrolyte on (g) NMC 111, (h) NMC 622, and (i) NMC 811 cathodes.; Figure S4. XPS wide scan of pristine (a) NMC 111, (b) NMC 622, and (c) NMC 811 cathodes; Figure S5. (a) Viscosities of the experimented electrolytes at 25 °C, (b) conductivities of the experimented electrolytes at 25 °C, and (c) linear sweep voltammetry (LSV) plot of cells containing the experimented electrolytes; Figure S6. XPS S 2p spectra of CEI layers with 6:4.5:8.3 LiFSI/EC/DMC electrolyte on (a) NMC 111, (b) NMC 622, and (c) NMC 811 cathodes; Table S1: Corresponding resistance values from the fitted impedance curves for NMC 111 cells with different electrolytes and the equivalent circuit model used for fitting; Table S2: Corresponding resistance values from the fitted impedance curves for NMC 622 cells with different electrolytes and the equivalent circuit model used for fitting; Table S3: Corresponding resistance values from the fitted impedance curves for NMC 811 cells with different electrolytes and the equivalent circuit model used for fitting; Table S4. Electrolyte conductivity and cost comparison (prices stated were referenced from Sigma-Aldrich).

Author Contributions

Conceptualization, J.J.N.L.; methodology, J.J.N.L.; validation, J.J.N.L., Y.C. and M.S.; formal analysis, J.J.N.L. and Y.C.; investigation, J.J.N.L. and Y.C.; resources, J.J.N.L., Y.C. and M.S.; data curation, J.J.N.L. and Y.C.; writing—original draft preparation, J.J.N.L. and Y.C.; writing—review and editing, J.J.N.L. and Y.C.; visualization, J.J.N.L. and Y.C.; supervision, M.S.; project administration, J.J.N.L. and Y.C.; funding acquisition, M.S. All authors have read and agreed to the published version of the manuscript.

Funding

This work is based upon funding and support by Arkema Pte Ltd. in collaboration with Economic Development Board (EDB) Singapore and Nanyang Technological University (NTU) through the EDB Industrial Postgraduate Programme (EDB-IPP).

Data Availability Statement

The original contributions presented in this study are included in the article/Supplementary Materials. Further inquiries can be directed to the corresponding author(s).

Acknowledgments

We would like to acknowledge the Facility for Analysis, Characterisation, Testing and Simulation, Nanyang Technological University, Singapore, for use of their electron microscopy. The cryo-TEM was assisted by Tay Yee Yan and Andrew SW Wong from the Facility for Analysis, Characterisation, Testing and Simulation (FACTS).

Conflicts of Interest

The authors declare that this study received funding from Arkema Pte Ltd. The funder was not involved in the study design, collection, analysis, interpretation of data, the writing of this article or the decision to submit it for publication.

References

  1. Electrification. Available online: https://www.iea.org/energy-system/electricity/electrification (accessed on 24 March 2024).
  2. What Is Electrification? Available online: https://www.energy.gov/electricity-insights/what-electrification (accessed on 24 March 2024).
  3. Beyond Batteries: Most Efficient Energy Storage 2023. Available online: https://solar.huawei.com/za/blog/za/2023/most-efficient-energy-storage#:~:text=Green%20hydrogen%2C%20also%20known%20as,energy%20sources%20like%20solar%20power (accessed on 24 March 2024).
  4. Ahmed, S.; Ali, A.; Asif, M.; Shim, J.; Park, G. Exploring innovative trends and advancements in rechargeable zinc-air batteries. Inorg. Chem. Commun. 2024, 170, 113288. [Google Scholar] [CrossRef]
  5. Olabi, A.G.; Sayed, E.T.; Wilberforce, T.; Jamal, A.; Alami, A.H.; Elsaid, K.; Rahman, S.M.A.; Shah, S.K.; Abdelkareem, M.A. Metal-Air Batteries—A Review. Energies 2021, 14, 7373. [Google Scholar] [CrossRef]
  6. What Are Sodium-Ion Batteries and How Do They Compare to Lithium-Ion Batteries? Available online: https://www.driveelectrictn.org/what-are-sodium-ion-batteries-and-how-do-they-compare-to-lithium-ion-batteries/#:~:text=Lithium%2Dion%20batteries%20have%20faced,storage%20and%20household%20energy%20systems (accessed on 11 February 2025).
  7. Huang, X.; Jing, H.; Yang, M.; Lu, H.; Xue, F.; Zhao, J.; Cheng, X.; Zhang, H.; Fu, Y. Comparative study on thermal and gas characteristics of 26700 sodium-ion and lithium-ion batteries. J. Power Sources 2025, 631, 236270. [Google Scholar] [CrossRef]
  8. Sodium-Ion Batteries: A Sustainable Energy Solution for 2024. Available online: https://www.monolithai.com/blog/sodium-ion-battery-news#:~:text=As%20one%20of%20the%20most,just%2020%20ppm%20for%20lithium.&text=Given%20that%20sodium%20is%20both,(source) (accessed on 11 February 2025).
  9. Building Electrification Gains Momentum with Heat Pump Adoption. Available online: https://www.facilitiesnet.com/hvac/article/Building-Electrification-Gains-Momentum-with-Heat-Pump-Adoption--20057 (accessed on 24 March 2024).
  10. [Battery101] Cathode Materials That Determine the Power of Li-ion Battery. Available online: https://news.samsungsdi.com/global/articleView?seq=178 (accessed on 30 July 2024).
  11. Liu, D.W.; Oh, P.; Liu, D.X.; Lee, M.-J.; Cho, W.; Chae, S.; Kim, P.D.Y.; Cho, P.D.J. Nickel-Rich Layered Lithium Transition-Metal Oxide for High-Energy Lithium-Ion Batteries. Angew. Chem. Int. Ed. 2015, 54, 4440–4457. [Google Scholar] [CrossRef]
  12. Liu, M.; Vatamanu, J.; Chen, X.; Xing, L.; Xu, K.; Li, W. Hydrolysis of LiPF6-Containing Electrolyte at High Voltage. ACS Energy Lett. 2021, 6, 2096–2102. [Google Scholar] [CrossRef]
  13. Guo, K.; Qi, S.; Wang, H.; Huang, J.; Wu, M.; Yang, Y.; Li, X.; Ren, Y.; Ma, J. High-Voltage Electrolyte Chemistry for Lithium Batteries. Small Sci. 2022, 2, 2100107. [Google Scholar] [CrossRef]
  14. Li, Q.; Chen, J.; Fan, L.; Kong, X.; Lu, Y. Progress in electrolytes for rechargeable Li-based batteries and beyond. Green Energy Environ. 2016, 1, 18–42. [Google Scholar] [CrossRef]
  15. Battery Electrolyte Solutions. Available online: https://www.targray.com/li-ion-battery/electrolyte#:~:text=The%20Role%20of%20Electrolyte%20in%20Lithium%2Dion%20Batteries&text=The%20most%20commonly%20used%20electrolyte,LiPF6%20in%20an%20organic%20solution (accessed on 24 March 2024).
  16. Han, H.-B.; Zhou, S.-S.; Zhang, D.-J.; Feng, S.-W.; Li, L.-F.; Liu, K.; Feng, W.-F.; Nie, J.; Li, H.; Huang, X.-J.; et al. Lithium bis(fluorosulfonyl)imide (LiFSI) as conducting salt for nonaqueous liquid electrolytes for lithium-ion batteries: Physicochemical and electrochemical properties. J. Power Sources 2011, 196, 3623–3632. [Google Scholar] [CrossRef]
  17. Banerjee, A.; Ziv, B.; Shilina, Y.; Luski, S.; Aurbach, D.; Halalay, I.C. Acid-Scavenging Separators: A Novel Route for Improving Li-Ion Batteries’ Durability. ACS Energy Lett. 2017, 2, 2388–2393. [Google Scholar] [CrossRef]
  18. Han, J.Y.; Jung, S. Thermal Stability and the Effect of Water on Hydrogen Fluoride Generation in Lithium-Ion Battery Electrolytes Containing LiPF6. Batteries 2022, 8, 61. [Google Scholar] [CrossRef]
  19. Shchurov, N.I.; Dedov, S.I.; Malozyomov, B.V.; Shtang, A.A.; Martyushev, N.V.; Klyuev, R.V.; Andriashin, S.N. Degradation of Lithium-Ion Batteries in an Electric Transport Complex. Energies 2021, 14, 8072. [Google Scholar] [CrossRef]
  20. Aktekin, B.; Hernández, G.; Younesi, R.; Brandell, D.; Edström, K. Concentrated LiFSI–Ethylene Carbonate Electrolytes and Their Compatibility with High-Capacity and High-Voltage Electrodes. ACS Appl. Energy Mater. 2022, 5, 585–595. [Google Scholar] [CrossRef]
  21. Mauger, A.; Julien, C.M.; Paolella, A.; Armand, M.; Zaghib, K. A comprehensive review of lithium salts and beyond for rechargeable batteries: Progress and perspectives. Mater. Sci. Eng. R Rep. 2018, 134, 1–21. [Google Scholar] [CrossRef]
  22. Overview of Lithium Salts in Li Ion Battery Electrolyte. Available online: https://www.dnkpower.com/lithium-salts-in-li-ion-battery-electrolyte/ (accessed on 24 March 2024).
  23. Liu, W.; Li, J.; Li, W.; Xu, H.; Zhang, C.; Qiu, X. Inhibition of transition metals dissolution in cobalt-free cathode with ultrathin robust interphase in concentrated electrolyte. Nat. Commun. 2020, 11, 3629. [Google Scholar] [CrossRef] [PubMed]
  24. Zhang, J.-N.; Li, Q.; Wang, Y.; Zheng, J.; Yu, X.; Li, H. Dynamic evolution of cathode electrolyte interphase (CEI) on high voltage LiCoO2 cathode and its interaction with Li anode. Energy Storage Mater. 2018, 14, 1–7. [Google Scholar] [CrossRef]
  25. Wang, H.; Li, X.; Li, F.; Liu, X.; Yang, S.; Ma, J. Formation and modification of cathode electrolyte interphase: A mini review. Electrochem. Commun. 2021, 122, 106870. [Google Scholar] [CrossRef]
  26. Giffin, G.A. The role of concentration in electrolyte solutions for non-aqueous lithium-based batteries. Nat. Commun. 2022, 13, 5250. [Google Scholar] [CrossRef]
  27. Wang, J.; Zheng, Q.; Fang, M.; Ko, S.; Yamada, Y.; Yamada, A. Concentrated Electrolytes Widen the Operating Temperature Range of Lithium-Ion Batteries. Adv. Sci. 2021, 8, 2101646. [Google Scholar] [CrossRef] [PubMed]
  28. Fan, X.; Chen, L.; Ji, X.; Deng, T.; Hou, S.; Chen, J.; Zheng, J.; Wang, F.; Jiang, J.; Xu, K.; et al. Highly Fluorinated Interphases Enable High-Voltage Li-Metal Batteries. Chem 2018, 4, 174–185. [Google Scholar] [CrossRef]
  29. Piao, N.; Ji, X.; Xu, H.; Fan, X.; Chen, L.; Liu, S.; Garaga, M.N.; Greenbaum, S.G.; Wang, L.; Wang, C.; et al. Countersolvent Electrolytes for Lithium-Metal Batteries. Adv. Energy Mater. 2020, 10, 1903568. [Google Scholar] [CrossRef]
  30. Table of Elements. Available online: https://www.thermofisher.com/sg/en/home/materials-science/learning-center/periodic-table.html (accessed on 15 March 2024).
  31. National Institute of Standards and Technology. NIST X-Ray Photoelectron Spectroscopy Database (SRD 20), Version 5.0. 2024. Available online: https://srdata.nist.gov/xps/SpectraIdentifier (accessed on 15 March 2024).
  32. Guo, J.; Guo, Q.; Liu, J.; Wang, H. The Polarization and Heat Generation Characteristics of Lithium-Ion Battery with Electric–Thermal Coupled Modeling. Batteries 2023, 9, 529. [Google Scholar] [CrossRef]
  33. Kim, D.-H.; Hwang, S.; Cho, J.-J.; Yu, S.; Kim, S.; Jeon, J.; Ahn, K.H.; Lee, C.; Song, H.-K.; Lee, H. Towards Fast Operation of Lithium Batteries: Ion Activity as the Factor To Determine the Concentration Polarization. ACS Energy Lett. 2019, 4, 1265–1270. [Google Scholar] [CrossRef]
  34. Biologic. Internal Resistance Series. Part I: What Is Internal Resistance in a Battery? Available online: https://www.biologic.net/topics/internal-resistance-series-part-i-what-is-internal-resistance-in-a-battery/ (accessed on 24 March 2024).
  35. Why Is It Important to Measure Battery’s Internal Resistance? Available online: https://www.hioki.com/sg-en/learning/electricity/internal-resistance.html#:~:text=Internal%20resistance%20is%20one%20of,a%20small%20amount%20of%20current (accessed on 24 March 2024).
  36. Jow, T.R.; Delp, S.A.; Allen, J.L.; Jones, J.-P.; Smart, M.C. Factors Limiting Li+ Charge Transfer Kinetics in Li-Ion Batteries. J. Electrochem. Soc. 2018, 165, A361. [Google Scholar] [CrossRef]
  37. Choi, W.; Shin, H.-C.; Kim, J.M.; Choi, J.-Y.; Yoon, W.-S. Modeling and Applications of Electrochemical Impedance Spectroscopy (EIS) for Lithium-ion Batteries. J. Electrochem. Sci. Technol. 2020, 11, 1–13. [Google Scholar] [CrossRef]
  38. Xie, J.-D.; Patra, J.; Rath, P.C.; Liu, W.-J.; Su, C.-Y.; Lee, S.-W.; Tseng, C.-J.; Gandomi, Y.A.; Chang, J.-K. Highly concentrated carbonate electrolyte for Li-ion batteries with lithium metal and graphite anodes. J. Power Sources 2020, 450, 227657. [Google Scholar] [CrossRef]
  39. Nara, H.; Mukoyama, D.; Shimizu, R.; Momma, T.; Osaka, T. Systematic analysis of interfacial resistance between the cathode layer and the current collector in lithium-ion batteries by electrochemical impedance spectroscopy. J. Power Sources 2019, 409, 139–147. [Google Scholar] [CrossRef]
  40. Wu, H.-C.; Wu, H.-C.; Lee, E.; Wu, N.-L. High-temperature carbon-coated aluminum current collector for enhanced power performance of LiFePO4 electrode of Li-ion batteries. Electrochem. Commun. 2010, 12, 488–491. [Google Scholar] [CrossRef]
  41. BU-802a: How Does Rising Internal Resistance Affect Performance? Available online: https://batteryuniversity.com/article/bu-802a-how-does-rising-internal-resistance-affect-performance#:~:text=A%20battery%20with%20low%20internal%20resistance%20delivers%20high%20current%20on,last%20for%20a%20few%20seconds (accessed on 24 March 2024).
  42. Yua, X.; Manthiram, A. Electrode–electrolyte interfaces in lithium-based batteries. Energy Environ. Sci. 2018, 11, 527–543. [Google Scholar] [CrossRef]
  43. Zhang, Z.; Qin, C.; Wang, K.; Han, X.; Li, J.; Sui, M.; Yan, P. Deciphering the critical effect of cathode-electrolyte interphase by revealing its dynamic evolution. J. Energy Chem. 2023, 81, 192–199. [Google Scholar] [CrossRef]
  44. Zhang, N.; Wang, B.; Jin, F.; Chen, Y.; Jiang, Y.; Bao, C.; Tian, J.; Wang, J.; Xu, R.; Li, Y.; et al. Modified cathode-electrolyte interphase toward high-performance batteries. Cell Rep. Phys. Sci. 2022, 3, 101197. [Google Scholar] [CrossRef]
  45. Zhang, R.; Bao, J.; Wang, Y.; Sun, C.-F. Concentrated electrolytes stabilize bismuth–potassium batteries. Chem. Sci. 2018, 9, 6193–6198. [Google Scholar] [CrossRef]
  46. Manthiram, A. A reflection on lithium-ion battery cathode chemistry. Nat. Commun. 2020, 11, 1550. [Google Scholar] [CrossRef] [PubMed]
  47. Chen, Y.; Zhao, W.; Zhang, Q.; Yang, G.; Zheng, J.; Tang, W.; Xu, Q.; Lai, C.; Yang, J.; Peng, C. Armoring LiNi1/3Co1/3Mn1/3O2 Cathode with Reliable Fluorinated Organic–Inorganic Hybrid Interphase Layer toward Durable High Rate Battery. Adv. Funct. Mater. 2020, 30, 2000396. [Google Scholar] [CrossRef]
  48. Liu, T.; Dai, A.; Lu, J.; Yuan, Y.; Xiao, Y.; Yu, L.; Li, M.; Gim, J.; Ma, L.; Liu, J.; et al. Correlation between manganese dissolution and dynamic phase stability in spinel-based lithium-ion battery. Nat. Commun. 2019, 10, 4721. [Google Scholar] [CrossRef]
  49. Kim, T.; Ono, L.K.; Qi, Y. Understanding the active formation of a cathode–electrolyte interphase (CEI) layer with energy level band bending for lithium-ion batteries. J. Mater. Chem. A 2023, 11, 221–231. [Google Scholar] [CrossRef]
  50. Cherkashinin, G.; Motzko, M.; Schulz, N.; Späth, T.; Jaegermann, W. Electron Spectroscopy Study of Li[Ni,Co,Mn]O2/Electrolyte Interface: Electronic Structure, Interface Composition, and Device Implications. Chem. Mater. 2015, 27, 2875–2887. [Google Scholar] [CrossRef]
  51. Takahashi, I.; Kiuchi, H.; Ohma, A.; Fukunaga, T.; Matsubara, E. Cathode Electrolyte Interphase Formation and Electrolyte Oxidation Mechanism for Ni-Rich Cathode Materials. J. Phys. Chem. C 2020, 124, 9243–9248. [Google Scholar] [CrossRef]
  52. Gu, W.; Borodin, O.; Zdyrko, B.; Lin, H.-T.; Kim, H.; Nitta, N.; Huang, J.; Magasinski, A.; Milicev, Z.; Berdichevsky, G.; et al. Conversion cathodes: Lithium–iron fluoride battery with in situ surface protection. Adv. Funct. Mater. 2016, 26, 1490. [Google Scholar] [CrossRef]
  53. Cho, S.-J.; Yu, D.-E.; Pollard, T.P.; Moon, H.; Jang, M.; Borodin, O.; Lee, S.-Y. Nonflammable Lithium Metal Full Cells with Ultra-high Energy Density Based on Coordinated Carbonate Electrolytes. iScience 2020, 23, 100844. [Google Scholar] [CrossRef]
  54. Kim, S.Y.; Yim, T. Sustainable cathode-electrolyte interphases of nickel-rich layered oxides in-situ functionalized by lithium fluoride abundant layers for lithium-ion batteries. J. Energy Storage 2024, 99, 113264. [Google Scholar] [CrossRef]
  55. Chae, B.-J.; Yim, T. Effect of surface modification using a sulfate-based surfactant on the electrochemical performance of Ni-rich cathode materials. Mater. Chem. Phys. 2018, 214, 66–72. [Google Scholar] [CrossRef]
  56. Bauer, I.; Thieme, S.; Brückner, J.; Althues, H.; Kaskel, S. Reduced polysulfide shuttle in lithium–sulfur batteries using Nafion-based separators. J. Power Sources 2014, 251, 417–422. [Google Scholar] [CrossRef]
  57. Borah, R.; Hughson, F.R.; Johnston, J.; Nann, T. On battery materials and methods. Mater. Today Adv. 2020, 6, 100046. [Google Scholar] [CrossRef]
  58. Galek, P.; Slesinski, A.; Fic, K.; Menzel, J. Peculiar role of the electrolyte viscosity in the electrochemical capacitor performance. J. Mater. Chem. A 2021, 9, 8644–8654. [Google Scholar] [CrossRef]
  59. Xu, J. Critical Review on cathode–electrolyte Interphase Toward High-Voltage Cathodes for Li-Ion Batteries. Nano Micro Lett. 2022, 14, 166. [Google Scholar] [CrossRef] [PubMed]
  60. Bolloju, S.; Chiou, C.-Y.; Vikramaditya, T.; Lee, J.-T. (Pentafluorophenyl)diphenylphosphine as a dual-functional electrolyte additive for LiNi0.5Mn1.5O4 cathodes in high-voltage lithium-ion batteries. Electrochim. Acta 2019, 299, 663–671. [Google Scholar] [CrossRef]
  61. Minato, T.; Abe, T. Surface and interface sciences of Li-ion batteries: -Research progress in electrode–electrolyte interface. Prog. Surf. Sci. 2017, 92, 240–280. [Google Scholar] [CrossRef]
  62. Yana, C.; Yuan, H.; Park, H.S.; Huang, J.-Q. Perspective on the critical role of interface for advanced batteries. J. Energy Chem. 2020, 47, 217–220. [Google Scholar] [CrossRef]
  63. Borodin, O.; Self, J.; Persson, K.A.; Wang, C.; Xu, K. Uncharted Waters: Super-Concentrated Electrolytes. Joule 2020, 4, 69–100. [Google Scholar] [CrossRef]
  64. Jiang, D.L.-L.; Yan, D.C.; Yao, Y.-X.; Cai, D.W.; Huang, P.J.-Q.; Zhang, P.Q. Inhibiting Solvent Co-Intercalation in a Graphite Anode by a Localized High-Concentration Electrolyte in Fast-Charging Batteries. Angew. Chem. Int. Ed. 2020, 60, 3402–3406. [Google Scholar] [CrossRef]
  65. Bai, P.; Ji, X.; Zhang, J.; Zhang, W.; Hou, S.; Su, H.; Li, M.; Deng, T.; Cao, L.; Liu, S.; et al. Formation of LiF-rich Cathode-Electrolyte Interphase by Electrolyte Reduction. Angew. Chem. Int. Ed. 2022, 61, e202202731. [Google Scholar] [CrossRef]
  66. Philippe, B.; Dedryvère, R.; Allouche, J.; Lindgren, F.; Gorgoi, M.; Rensmo, H.; Gonbeau, D.; Edström, K. Nanosilicon Electrodes for Lithium-Ion Batteries: Interfacial Mechanisms Studied by Hard and Soft X-ray Photoelectron Spectroscopy. Chem. Mater. 2012, 24, 1107–1115. [Google Scholar] [CrossRef]
  67. Tanaka, S.; Taniguchi, M.; Tanigawa, H. XPS and UPS studies on electronic structure of Li2O. J. Nucl. Mater. 2000, 283–287, 1405–1408. [Google Scholar] [CrossRef]
  68. Lowe, J.S.; Siegel, D.J. Modeling the Interface between Lithium Metal and Its Native Oxide. ACS Appl. Mater. Interfaces 2020, 12, 46015–46026. [Google Scholar] [CrossRef]
  69. Shen, C.; Yan, H.; Gu, J.; Gao, Y.; Yang, J.; Xie, K. Li2O-Reinforced Solid Electrolyte Interphase on Three-Dimensional Sponges for Dendrite-Free Lithium Deposition. Front. Chem. 2018, 6, 422220. [Google Scholar] [CrossRef]
  70. Pietrowski, M.; Zieliński, M.; Alwin, E.; Suchora, A.; Gawarecka, J. Synthesis and characterization of MgF2–CoF2 binary fluorides. Influence of the treatment atmosphere and temperature on the structure and surface properties. RSC Adv. 2019, 9, 5711–5721. [Google Scholar] [CrossRef] [PubMed]
  71. Huang, J.-Q.; Zhang, Q.; Peng, H.-J.; Liu, X.-Y.; Qiana, W.-Z.; Wei, F. Ionic shield for polysulfides towards highly-stable lithium–sulfur batteries. Energy Environ. Sci. 2014, 7, 347–353. [Google Scholar]
  72. Cheng, X.-B.; Yang, S.-J.; Liu, Z.; Guo, J.-X.; Jiang, F.-N.; Jiang, F.; Xiong, X.; Tang, W.-B.; Yuan, H.; Huang, J.-Q.; et al. Electrochemically and Thermally Stable Inorganics–Rich Solid Electrolyte Interphase for Robust Lithium Metal Batteries. Adv. Mater. 2024, 36, 2307370. [Google Scholar] [CrossRef]
  73. Borodin, O.; Ren, X.; Vatamanu, J.; Cresce, A.v.W.; Knap, J.; Xu, K. Modeling Insight into Battery Electrolyte Electrochemical Stability and Interfacial Structure. Acc. Chem. Res. 2017, 50, 2886–2894. [Google Scholar] [CrossRef] [PubMed]
  74. Kremer, L.S.; Danner, D.T.; Hein, D.S.; Hoffmann, D.A.; Prifling, B.; Schmidt, P.D.V.; Latz, P.D.A.; Wohlfahrt-Mehrens, D.M. Influence of the Electrolyte Salt Concentration on the Rate Capability of Ultra-Thick NCM 622 Electrodes. Batter. Supercaps 2020, 3, 1172–1182. [Google Scholar] [CrossRef]
Figure 1. Cycling performances of (a) NMC 111, (b) NMC 622, and (c) NMC 811 half-cells at 1 C rate using 1 M LiPF6 and different-concentration LiFSI electrolytes. The 1st and 200th cycle charge/discharge curves with 1 M LiPF6 and 6:4.5:8.3 LiFSI/EC/DMC electrolytes in (d) NMC 111, (e) NMC 622, and (f) NMC 811 half-cells are shown.
Energies 18 00974 g001
Figure 2. Nyquist plots of (a) NMC 111, (b) NMC 622, and (c) NMC 811 half-cells after 200 cycles using 1 M LiPF6 and different-concentration LiFSI electrolytes.
Energies 18 00974 g002
Figure 3. TEM images of the CEI layers with 3:4.5:8.3 LiFSI/EC/DMC electrolyte on (a) NMC 111, (b) NMC 622, and (c) NMC 811; with 6:4.5:8.3 LiFSI/EC/DMC electrolyte on (d) NMC 111, (e) NMC 622, and (f) NMC 811 cathodes; and with 7:4.5:8.3 LiFSI/EC/DMC electrolyte on (g) NMC 111, (h) NMC 622, and (i) NMC 811 cathodes (Yellow dashed lines were used as the default colour to outline the interfaces, however, at area where the use of yellow dashed lines did not provide good contrast, red dashed lines were used as a replacement).
Energies 18 00974 g003
Figure 4. XPS wide scan composition of the CEI layers (in atomic%) due to presence of 3:4.5:8.3 LiFSI/EC/DMC electrolyte on (a) NMC 111, (b) NMC 622, and (c) NMC 811; due to presence of 6:4.5:8.3 LiFSI/EC/DMC electrolyte on (d) NMC 111, (e) NMC 622, and (f) NMC 811 cathodes; and due to presence of 7:4.5:8.3 LiFSI/EC/DMC electrolyte on (g) NMC 111, (h) NMC 622, and (i) NMC 811 cathodes.
Energies 18 00974 g004
Figure 5. XPS O 1s spectra of CEI layers with 3:4.5:8.3 LiFSI/EC/DMC electrolyte on (a) NMC 111, (b) NMC 622, and (c) NMC 811; 6:4.5:8.3 LiFSI/EC/DMC electrolyte on (d) NMC 111, (e) NMC 622, and (f) NMC 811 cathodes; and 7:4.5:8.3 LiFSI/EC/DMC electrolyte on (g) NMC 111, (h) NMC 622, and (i) NMC 811 cathodes.
Energies 18 00974 g005
Figure 6. XPS F 1s spectra of CEI layers with 3:4.5:8.3 LiFSI/EC/DMC electrolyte on (a) NMC 111, (b) NMC 622, and (c) NMC 811; 6:4.5:8.3 LiFSI/EC/DMC electrolyte on (d) NMC 111, (e) NMC 622, and (f) NMC 811 cathodes; and 7:4.5:8.3 LiFSI/EC/DMC electrolyte on (g) NMC 111, (h) NMC 622, and (i) NMC 811 cathodes.
Energies 18 00974 g006
Figure 7. TEM images of the interfaces cycled with 1 M LiPF6 on (a) NMC 111, (b) NMC 622, and (c) NMC 811 and with 6:4.5:8.3 LiFSI/EC/DMC electrolyte on (d) NMC 111, (e) NMC 622, and (f) NMC 811 cathodes (Yellow dashed lines were used as the default colour to outline the interfaces, however, at area where the use of yellow dashed lines did not provide good contrast, red dashed lines were used as a replacement).
Energies 18 00974 g007
Figure 8. XPS wide scan composition of the CEI layers (in atomic%) with 1 M LiPF6 electrolyte on (a) NMC 111, (b) NMC 622, and (c) NMC 811 and with 6:4.5:8.3 LiFSI/EC/DMC electrolyte on (d) NMC 111, (e) NMC 622, and (f) NMC 811 cathodes.
Energies 18 00974 g008
Figure 9. XPS O 1s spectra of CEI layers with 1 M LiPF6 electrolyte on (a) NMC 111, (b) NMC 622, and (c) NMC 811, and 6:4.5:8.3 LiFSI/EC/DMC electrolyte on (d) NMC 111, (e) NMC 622, and (f) NMC 811 cathodes.
Energies 18 00974 g009
Figure 10. XPS F 1s spectra of CEI layers with 1 M LiPF6 electrolyte on (a) NMC 111, (b) NMC 622, and (c) NMC 811, and with 6:4.5:8.3 LiFSI/EC/DMC electrolyte on (d) NMC 111, (e) NMC 622, and (f) NMC 811 cathodes.
Energies 18 00974 g010
Figure 11. Schematic representation of 1 M LiPF6 and 6:4.5:8.3 LiFSI/EC/DMC electrolytes’ impacts on the different cathodes’ interfaces and the corresponding cycling stabilities of the LIBs.
Energies 18 00974 g011
Table 1. Discharge capacities and capacity retentions of NMC half-cells containing 1 M LiPF6 and 6:4.5:8.3 LiFSI/EC/DMC electrolytes.
1 M LiPF6 EC/DMC6:4.5:8.3 LiFSI/EC/DMC
Cathode cellNMC 111NMC 622NMC 811NMC 111NMC 622NMC 811
Initial discharge capacity (mAh/g)185.0190.1200.4191.2190.8195.5
200th cycles discharge capacity (mAh/g)111.5117.987.4157.8164.1171.0
Capacity retention (%)60.362.043.682.586.087.5
Table 2. F:C ratios of the CEI layer with different LiFSI electrolytes and NMC cathodes.
ElectrolyteNMC 111NMC 622NMC 811
3:4.5:8.3 LiFSI/EC/DMC0.370.310.45
6:4.5:8.3 LiFSI/EC/DMC0.590.580.57
7:4.5:8.3 LiFSI/EC/DMC0.660.550.58
Disclaimer/Publisher’s Note: The statements, opinions and data contained in all publications are solely those of the individual author(s) and contributor(s) and not of MDPI and/or the editor(s). MDPI and/or the editor(s) disclaim responsibility for any injury to people or property resulting from any ideas, methods, instructions or products referred to in the content.