
Research on Economic Operation of Cascade Small Hydropower Stations Within Plants Based on Refined Efficiency Models


Abstract
1. Introduction
2. Refined Model of the Hydraulic Turbine’s Operating Performance Curve
2.1. Basic Principles of BP Neural Network
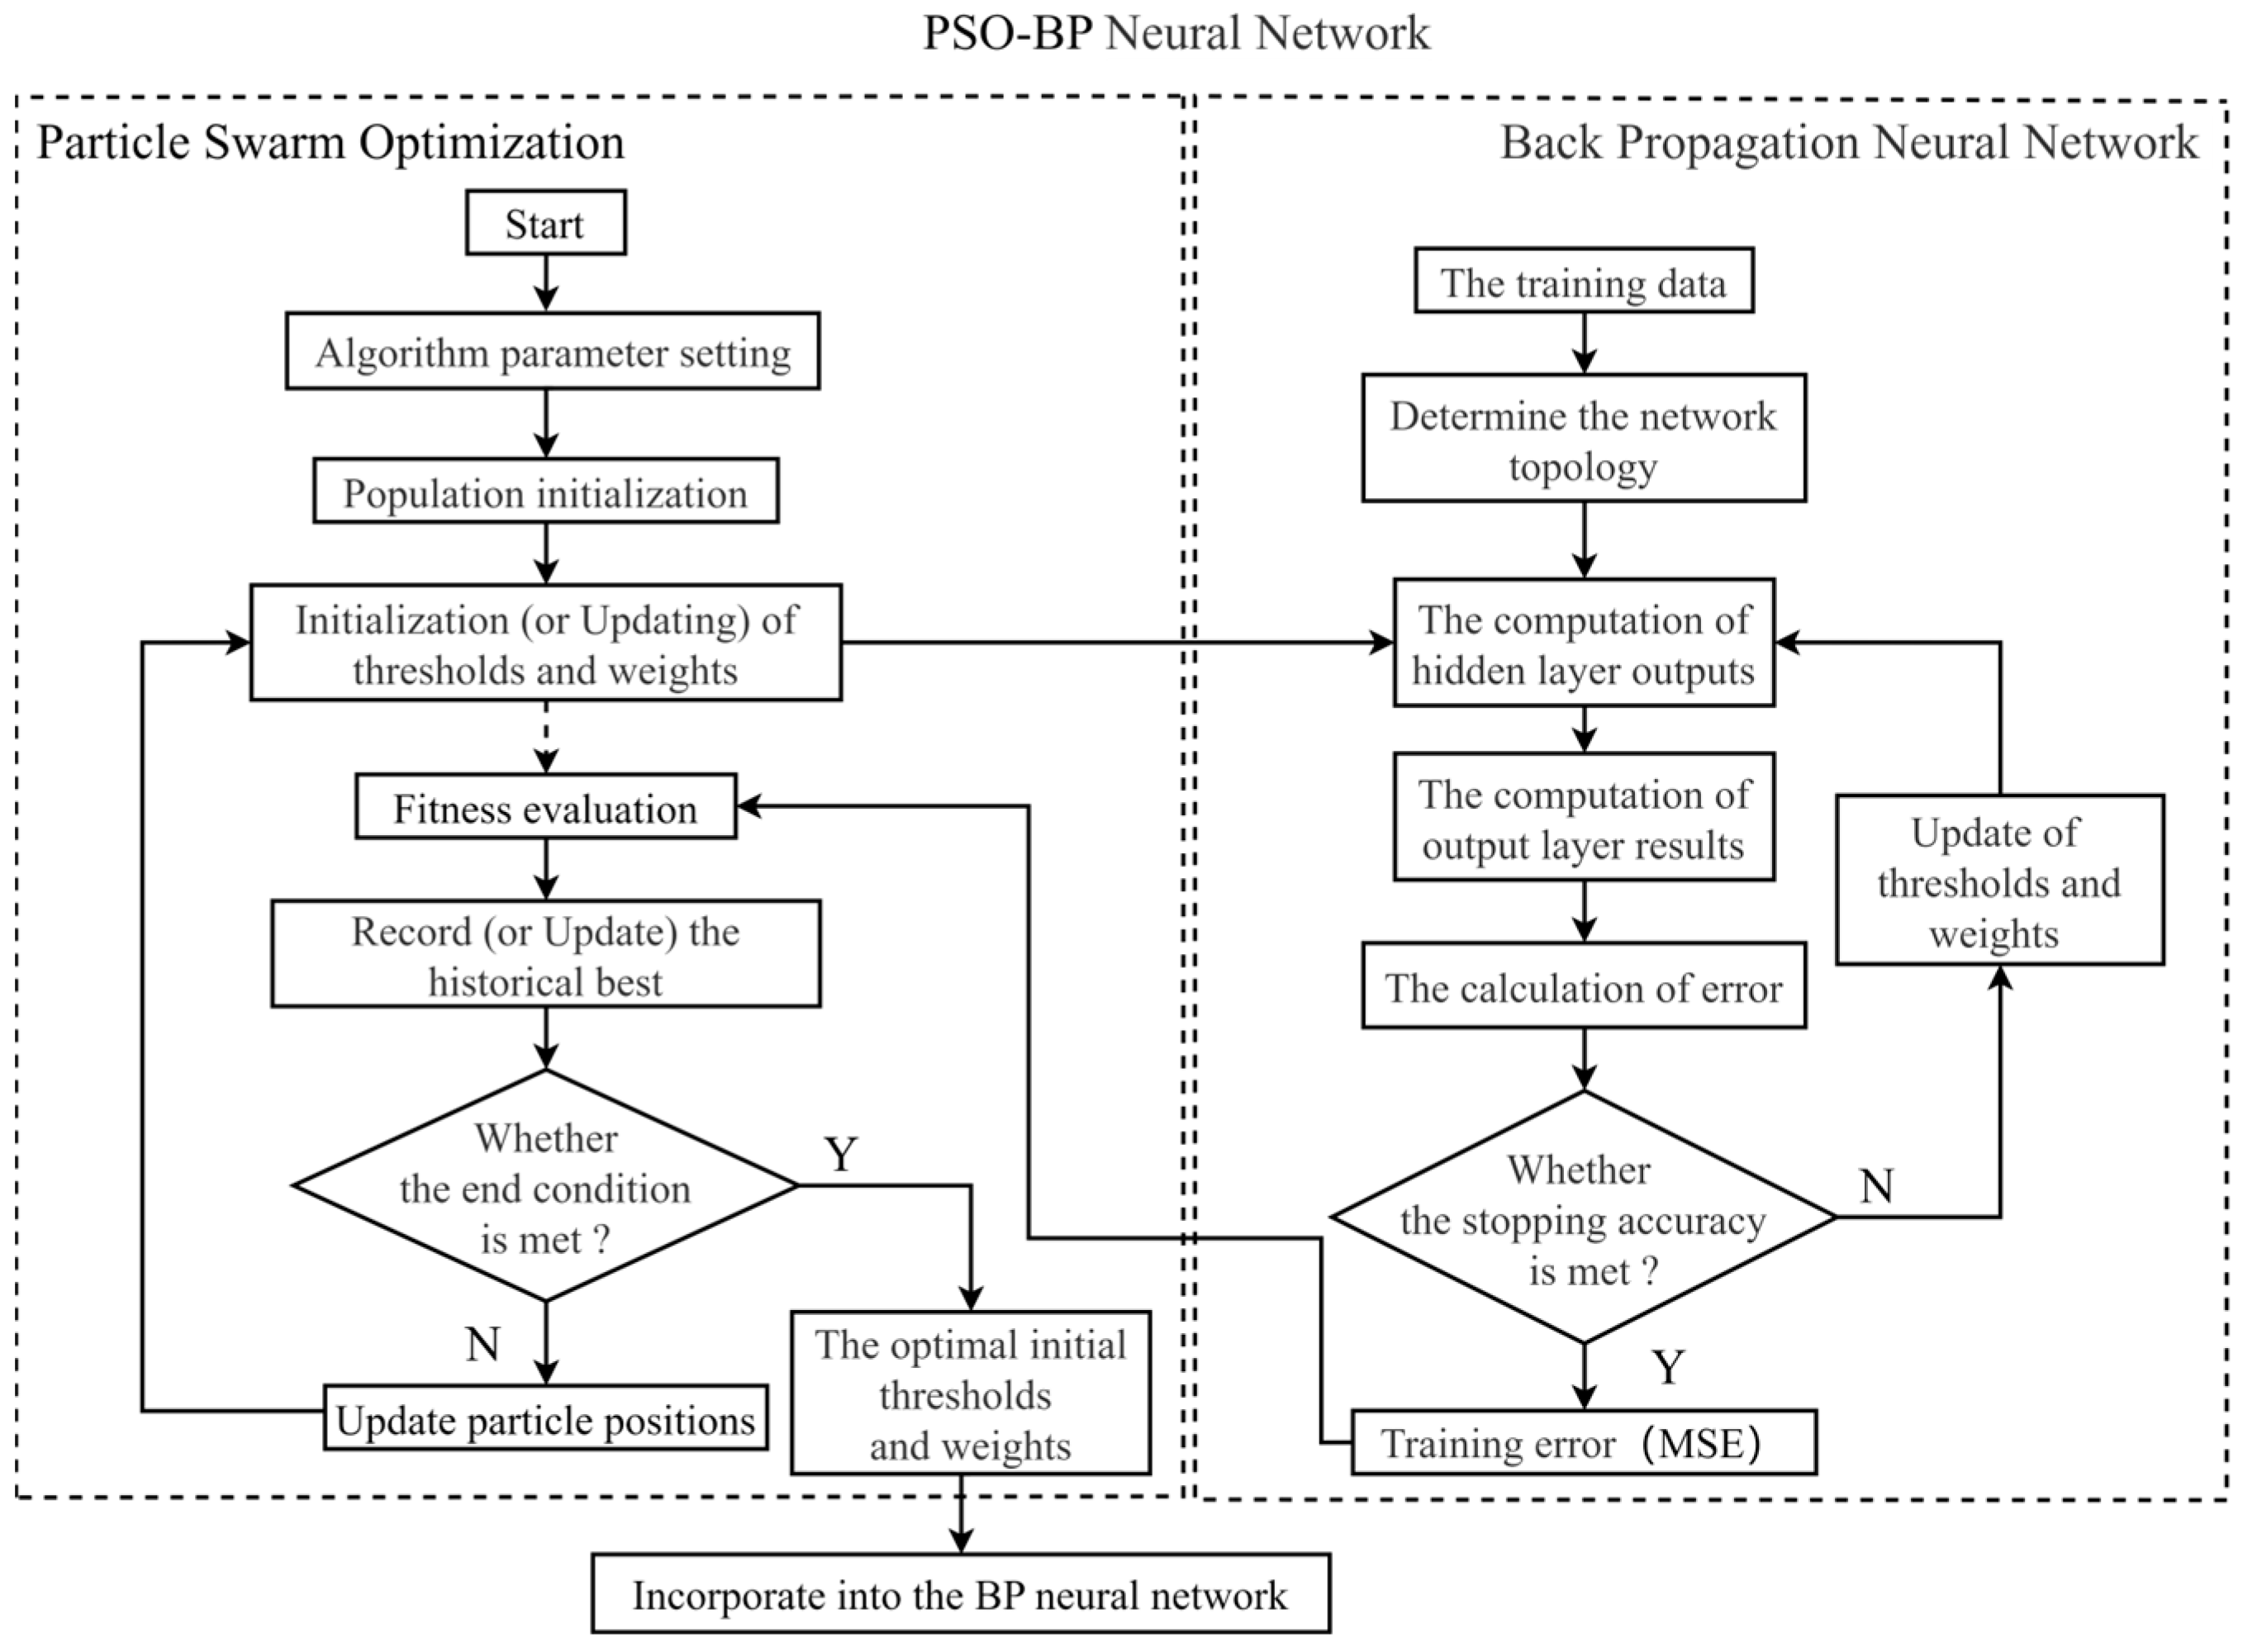
2.2. Refined Model of the Hydraulic Turbine’s Operating Performance Curve Based on PSO-BP Neural Network
- Step 1: The hydraulic turbine operating performance curve is read using chart-reading software to obtain a series of training data for the neural network. The input layer variable of the neural network is defined as the turbine output P and the head H. The output layer variable of the neural network is defined as the turbine efficiency η. The number of hidden layer nodes is also defined.
- Step 2: Set the algorithm parameters. Include population size N, inertia weight ω, maximum number of iterations T, and learning factors and . Determine the BP neural network’s activation function and the number of hidden layer nodes.
- Step 3: Initialize the population. The position of each particle represents the BP neural network’s weights and thresholds. Randomly initialize the position and velocity of the particles, and set the current iteration count to 1.
- Step 4: Fitness evaluation. The current weight and threshold of each particle are fed into the BP neural network, and the mean square error (MSE) after training the BP neural network for each particle is calculated as the fitness value, as shown in Equation (5).
- Step 5: The historical best is recorded. Record the global best solution in the current particle swarm, and its position is set as the global best position.
- Step 6: Judge whether the convergence condition is met. Check if any of the following conditions are satisfied: the current global best meets the preset accuracy requirements or the maximum number of iterations has been reached. If the conditions are met, end the process and output the global best solution, representing the optimal initial parameters of the BP neural network. If not, proceed to the next step.
- Step 7: Particle position update. According to the particle position update rules, update the velocity and position of each particle, as shown in Equations (6) and (7). Increment the iteration count by 1; then, return to Step 4.
3. The In-Plant Economic Operation Model
3.1. Objective Function
3.2. Constraints
- 1.
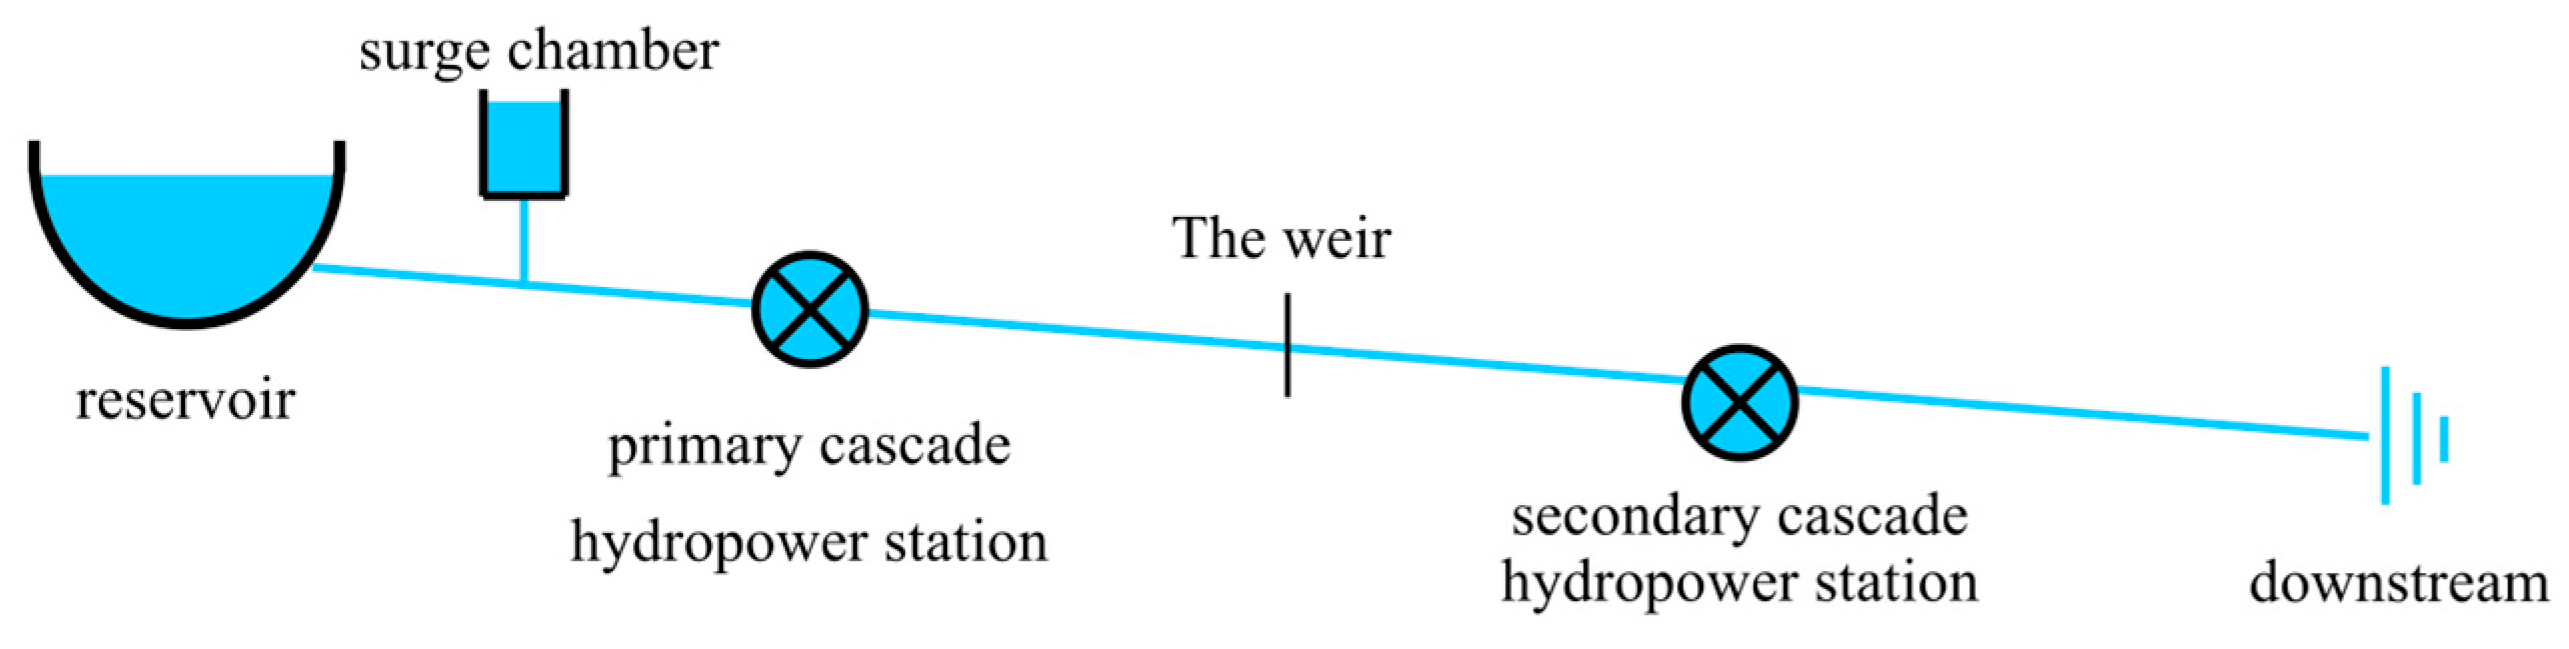
- The reservoir
- 2.
- The cascade hydropower station units
- 3.
- The plant site of the cascade hydropower station
- 4.
- The weirs
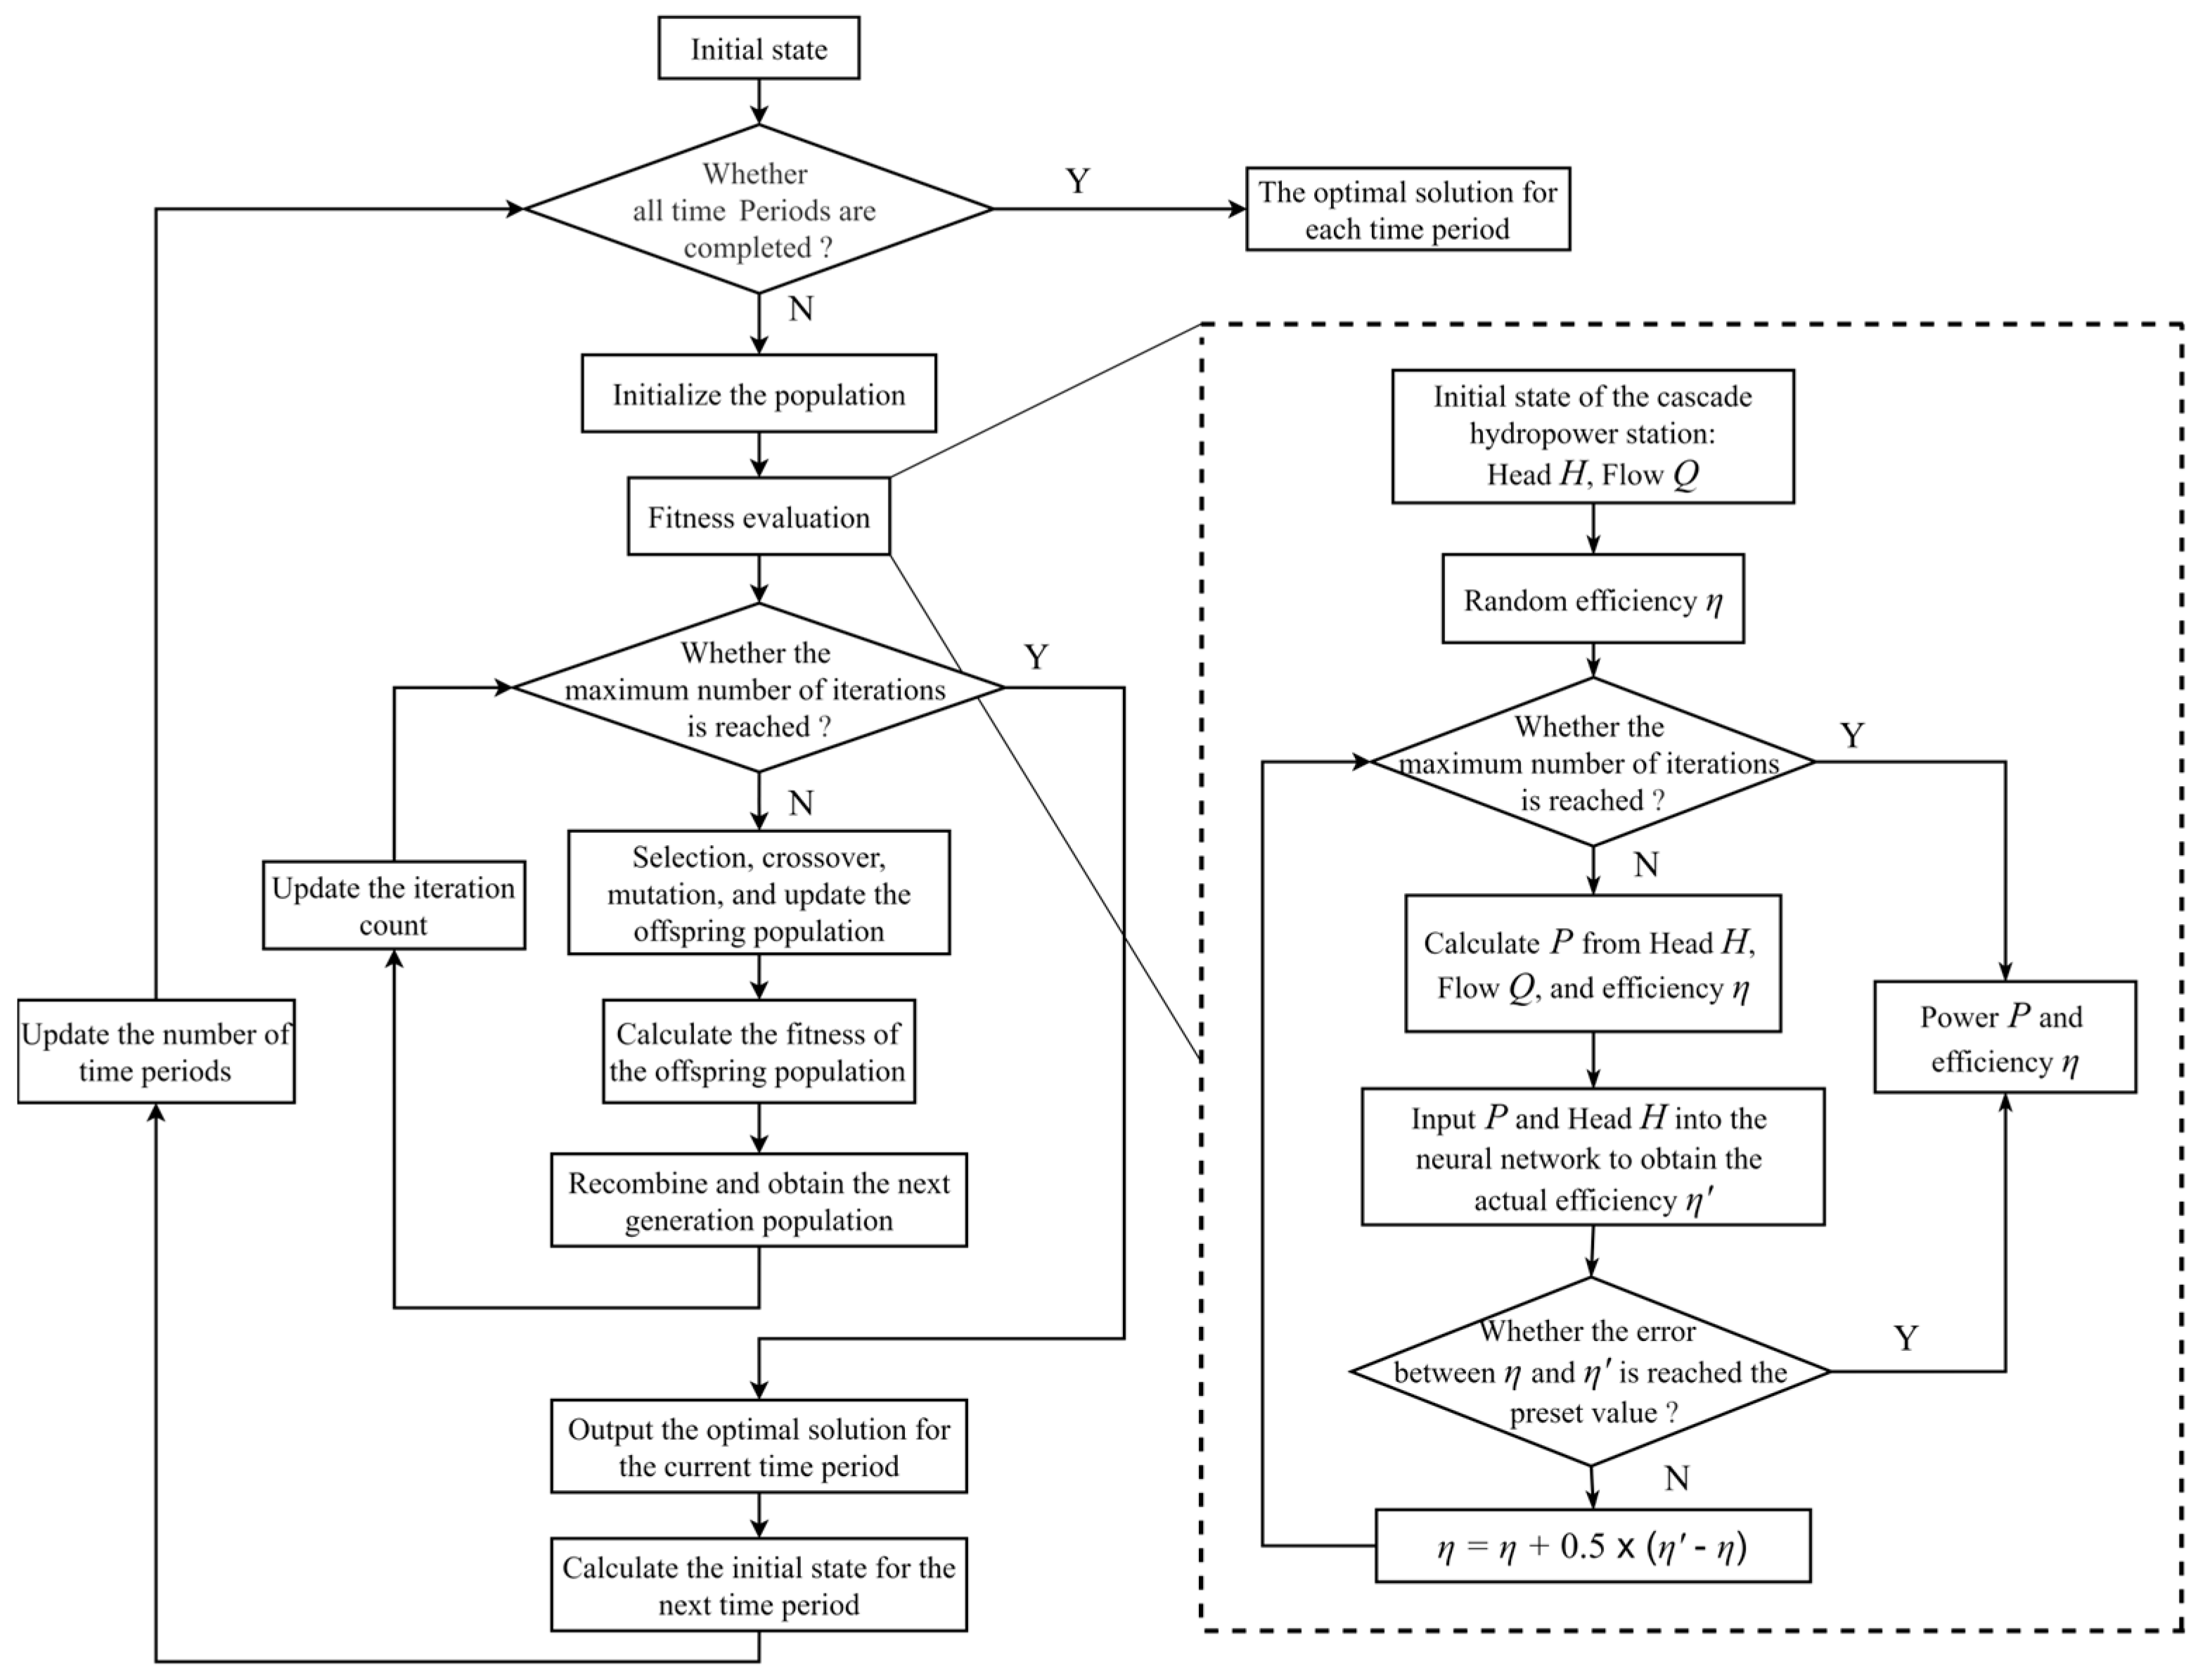
3.3. Solution Method
- Step 1: Set the algorithm parameters. Include population size , maximum iteration count , crossover probability , and mutation probability .
- Step 2: Determine whether the economic operation of the cascade hydropower stations in the basin has been optimized for the final time period. If optimized, output the optimal solutions for each time period; otherwise, proceed to Step 3.
- Step 3: Initialize the population. Each individual in the population represents the possible generation flow rates of all units . Record the current time period: .
- Step 4: Calculate the fitness evaluation of each individual in the initial population, representing the power output of units. The steps inside the dashed box in Figure 3 represent the process.
- Step 5: The individual with the highest fitness value is identified and recorded. This individual is then compared with the historical best individual, and updates are made based on the fitness value.
- Step 6: Check whether the maximum number of iterations has been reached. If it has, stop the calculation, output the optimal solution, and proceed to Step 11. Otherwise, proceed to Step 7.
- Step 7: Selection, crossover, and mutation operations generate offspring; the offspring are recombined with the previous generation to form the new population.
- Step 8: Calculate the fitness of the new population. Compute the fitness of each individual in the new population.
- Step 9: Update the historical best individual information: If an individual in the new population has a higher fitness than the previous best individual, update the historical best individual; otherwise, retain the historical best individual.
- Step 10: Increment the iteration count and return to Step 6.
- Step 11: Calculate the initial state of the next period for the cascade hydropower station. Use the output optimal solution, the hydrological relationship model, and the dynamic characteristic model of the cascade hydropower station to calculate the initial state for the next period. At the same time, increment the current period number by 1 and proceed to Step 3 for iteration.
4. Case Study Analysis
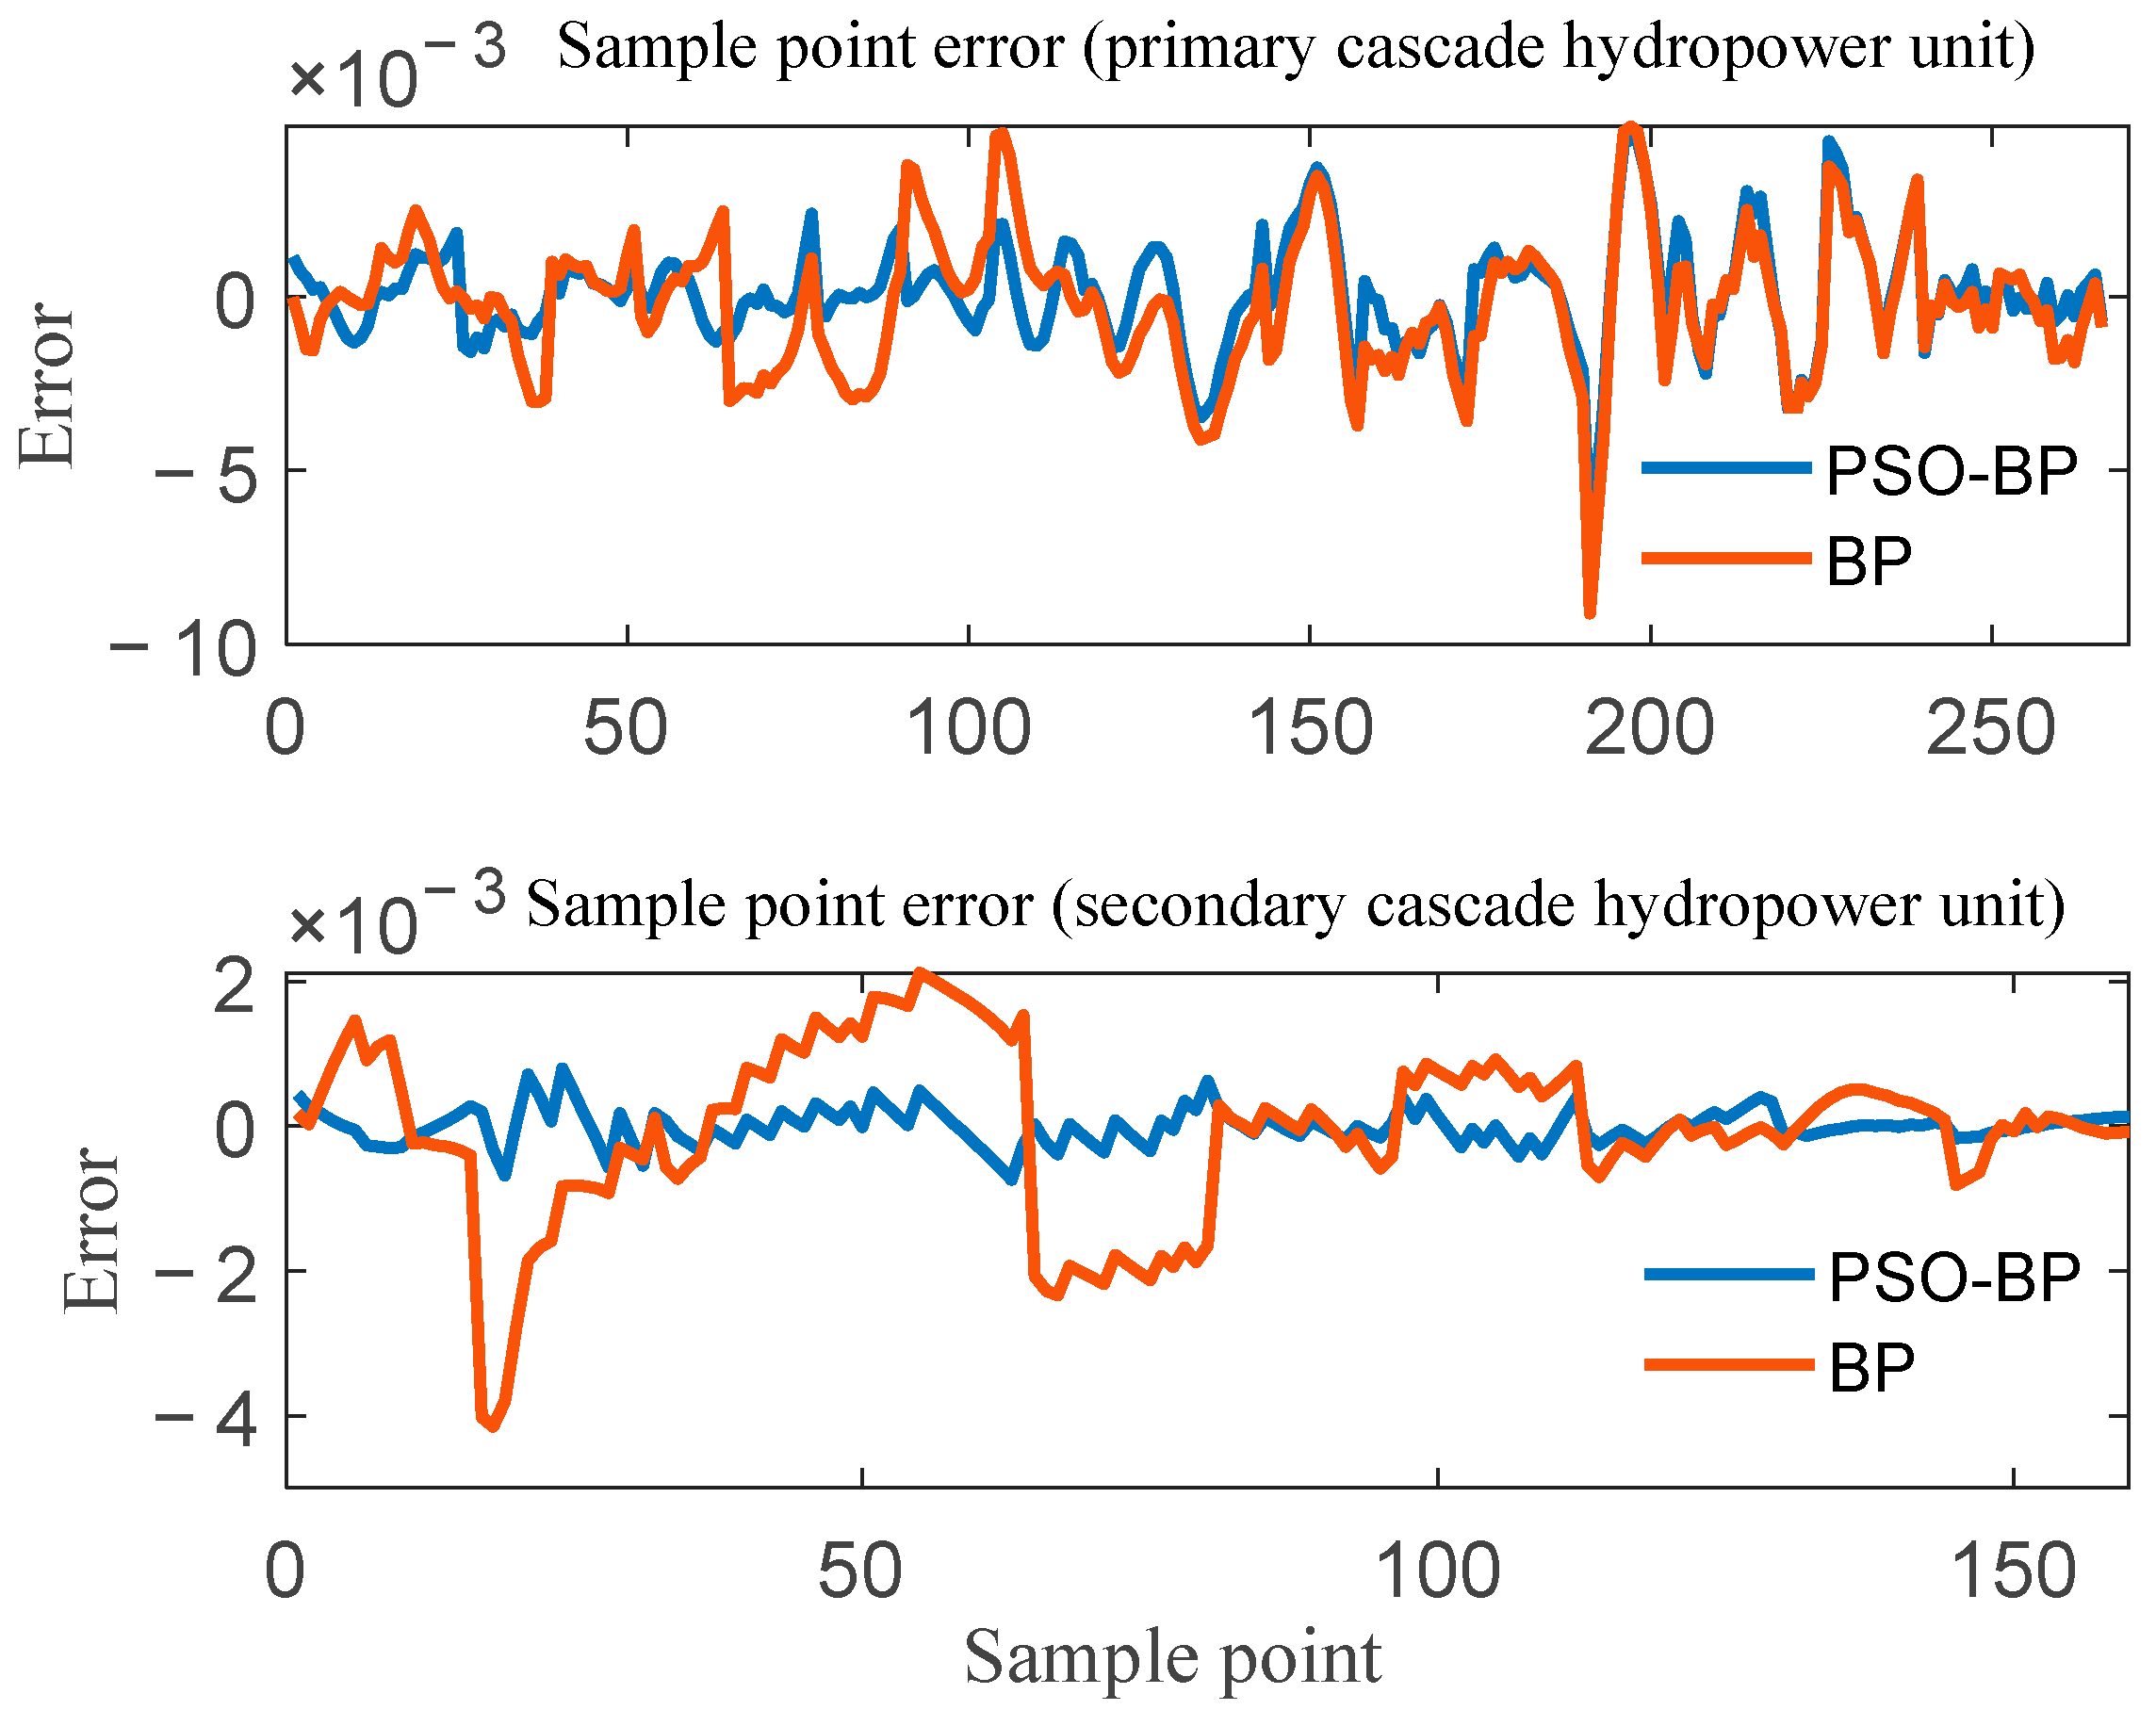
4.1. The Refined Modeling Results of the Hydraulic Turbine’s Operating Performance Curve
4.2. The Optimization Results of the Internal Economic Operation Model
5. Conclusions
Author Contributions
Funding
Data Availability Statement
Conflicts of Interest
References
- Haugen, M.; Blaisdell-Pijuan, P.L.; Botterud, A.; Levin, T.; Zhou, Z.; Belsnes, M.; Korpås, M.; Somani, A. Power market models for the clean energy transition: State of the art and future research needs. Appl. Energy 2024, 357, 122495. [Google Scholar] [CrossRef]
- Sharma, P.; Chhillar, A.; Said, Z.; Memon, S. Exploring the Exhaust Emission and Efficiency of Algal Biodiesel Powered Compression Ignition Engine: Application of Box–Behnken and Desirability Based Multi-Objective Response Surface Methodology. Energies 2021, 14, 5968. [Google Scholar] [CrossRef]
- Tian, X.; An, C.; Chen, Z. The role of clean energy in achieving decarbonization of electricity generation, transportation, and heating sectors by 2050: A meta-analysis review. Renew. Sustain. Energy Rev. 2023, 182, 113404. [Google Scholar] [CrossRef]
- Zhao, M.; Wang, Y.; Wang, X.; Chang, J.; Chen, Y.; Zhou, Y.; Guo, A. Flexibility evaluation of wind-PV-hydro multi-energy complementary base considering the compensation ability of cascade hydropower stations. Appl. Energy 2022, 315, 119024. [Google Scholar] [CrossRef]
- Wang, S.; Jia, R.; Luo, C.; An, Y.; Guo, P. Spatiotemporal Complementary Characteristics of Large-Scale Wind Power, Photovoltaic Power, and Hydropower. Sustainability 2022, 14, 9273. [Google Scholar] [CrossRef]
- Jing, Z.; Wang, Y.; Chang, J.; Wang, X.; Zhou, Y.; Li, L.; Tian, Y. Benefit compensation of hydropower-wind-photovoltaic complementary operation in the large clean energy base. Appl. Energy 2024, 354, 122040. [Google Scholar] [CrossRef]
- Klein, S.J.W.; Fox, E.L.B. A review of small hydropower performance and cost. Renew. Sustain. Energy Rev. 2022, 169, 112898. [Google Scholar] [CrossRef]
- Rodríguez-Pérez, A.M.; Rodríguez-Gonzalez, C.A.; López, R.; Hernández-Torres, J.A.; Caparrós-Mancera, J.J. Water Microturbines for Sustainable Applications: Optimization Analysis and Experimental Validation. Water Resour. Manag. 2023, 38, 1011–1025. [Google Scholar] [CrossRef]
- Huang, W.; Yang, K.; Guo, X.; Ma, J.; Wang, J.; Li, J. Prediction Method for the Complete Characteristic Curves of a Francis Pump-Turbine. Water 2018, 10, 205. [Google Scholar] [CrossRef]
- Hu, Z.; Cheng, Y.; Chen, H.; Liu, D.; Ji, B.; Wang, Z.; Zhang, P.; Xue, S. Predicting pump-turbine characteristic curves by theoretical models based on runner geometry parameters. Energy 2024, 301, 131561. [Google Scholar] [CrossRef]
- Yang, Q.; Zhang, Y.; Zhang, Y.; Deng, C. A Nonlinear Hybrid Modeling Method for Pump Turbines by Integrating Delaunay Triangulation Interpolation and an Improved BP Neural Network. Electronics 2024, 13, 2573. [Google Scholar] [CrossRef]
- Li, J.; Han, C.; Yu, F. A New Processing Method Combined with BP Neural Network for Francis Turbine Synthetic Characteristic Curve Research. Int. J. Rotating Mach. 2017, 2017, 1870541. [Google Scholar] [CrossRef]
- Liu, B.; Zhou, J. Complete characteristic curve processing method based on improved backpropagation neural network and Logarithmic curve projection. J. Phys. Conf. Ser. 2021, 2108, 012021. [Google Scholar] [CrossRef]
- Wang, X.; Yang, K.; Yang, L. Application Research of Inner-plant Economical Operation by Multi-colony Ant Optimization. Water Resour. Manag. 2018, 32, 4275–4295. [Google Scholar] [CrossRef]
- Lu, X.; Yang, K.; Zheng, J. Limited adaptive genetic algorithm for inner-plant economical operation of hydropower station. Hydrol. Res. 2013, 44, 583–599. [Google Scholar]
- Yang, Z.; Yang, K.; Su, L.; Hu, H. The Short-Term Economical Operation Problem for Hydropower Station Using Chaotic Normal Cloud Model Based Discrete Shuffled Frog Leaping Algorithm. Water Resour. Manag. 2020, 34, 905–927. [Google Scholar] [CrossRef]
- Zhang, H.; Chang, J.; Gao, C.; Wu, H.; Wang, Y.; Lei, K.; Long, R.; Zhang, L. Cascade hydropower plants operation considering comprehensive ecological water demands. Energy Convers. Manag. 2019, 180, 119–133. [Google Scholar] [CrossRef]
- Myateg, T.; Mitrofanov, S.; Xi, C.; Sekretarev, Y.; Safaraliev, M.; Volosatov, R.; Arestova, A.; Gulakhmadov, A. Long-Term Hydropower Plant Scheduling Considering Environmental and Economic Criteria. Sustainability 2024, 16, 10106. [Google Scholar] [CrossRef]
- Tan, Q.-F.; Wen, X.; Fang, G.-H.; Wang, Y.-Q.; Qin, G.-H.; Li, H.-M. Long-term optimal operation of cascade hydropower stations based on the utility function of the carryover potential energy. J. Hydrol. 2020, 580, 124359. [Google Scholar] [CrossRef]
- Ren, L.; Tao, Y.; Liu, J.; Jin, X.; Fan, C.; Dong, X.; Wu, H. Predictions of Peak Discharge of Dam Failures Based on the Combined GA and BP Neural Networks. Water 2024, 16, 2946. [Google Scholar] [CrossRef]
- Wang, D.; Tan, D.; Liu, L. Particle swarm optimization algorithm: An overview. Soft Comput. 2017, 22, 387–408. [Google Scholar] [CrossRef]
- Li, J.; Moe Saw, M.M.; Chen, S.; Yu, H. Short-Term Optimal Operation of Baluchaung II Hydropower Plant in Myanmar. Water 2020, 12, 504. [Google Scholar] [CrossRef]
- Wang, C.; Jiang, Z.; Xu, Y.; Wang, S.; Wang, P. Discussion on the monotonicity principle of the two-stage problem in joint optimal operation of cascade hydropower stations. J. Hydrol. 2023, 623, 129803. [Google Scholar] [CrossRef]
- Zhu, Y.; Chen, S.; Ma, G.; Huang, W.; Han, X.; Ding, L. Complementary operation of a small cascade hydropower station group and photovoltaic power stations. Clean Technol. Environ. Policy 2020, 22, 1565–1578. [Google Scholar] [CrossRef]
- Feng, Y.; Zhou, J.; Mo, L.; Yuan, Z.; Zhang, P.; Wu, J.; Wang, C.; Wang, Y. Long-Term Hydropower Generation of Cascade Reservoirs under Future Climate Changes in Jinsha River in Southwest China. Water 2018, 10, 235. [Google Scholar] [CrossRef]
- Zhang, L.; Yang, S.; Yuan, C.; Zhang, H.; Chang, J.; Xu, P.; Liu, J.; Hu, J.; Xing, Z.; Wang, C.; et al. Practice of multiple risk operation in multi-objective optimal operation of cascade hydropower plants: A case in lower branch of Lancang River Basin. J. Hydrol. 2025, 650, 132481. [Google Scholar] [CrossRef]
- Li, Y.; Zhou, L.; Gao, P.; Yang, B.; Han, Y.; Lian, C. Short-Term Power Generation Forecasting of a Photovoltaic Plant Based on PSO-BP and GA-BP Neural Networks. Front. Energy Res. 2022, 9, 824691. [Google Scholar] [CrossRef]


| Methods | Characteristics |
|---|---|
| Interpolation | Simple structure, few model parameters, high accuracy but poor generalization, high-degree interpolation prone to overfitting. |
| Function fitting | Simple structure, few model parameters, but poor generalization and accuracy. |
| BP neural network | Moderate complexity and number of model parameters, with average generalization capability and accuracy. |
| Fuzzy logic models | Complex structure, numerous model parameters, moderate generalization and accuracy; model quality depends on the design of fuzzy rules. |
| ANN-based (Artificial Neural Network) | Complex structure, numerous model parameters, moderate generalization capability, but high demands on data volume and computational resources. |
| PSO-BP neural network | Moderate complexity and number of model parameters, with good generalization capability and high accuracy. |
| Cascade Hydropower Stations | Installed Capacity (MW) | Maximum Head (m) | Minimum Head (m) | Head Loss Coefficient |
|---|---|---|---|---|
| Primary cascade hydropower station | 2 × 8 | 245.58 | 194.27 | 0.1755 |
| Secondary cascade hydropower station | 2 × 2 | 50.2 | 47.3 | 0.02596 |
| Parameters | Training Iterations | Number of Hidden Layer Nodes | Training Function | Number of Particles | Maximum Number of Iterations | Inertia Weight | Acceleration on Factors |
|---|---|---|---|---|---|---|---|
| BP | 1000 | 5 | Trainlm | — | — | — | — |
| PSO-BP | 1000 | 5 | Trainlm | 30 | 100 | 0.6 | 2 |
| Cascade Hydropower Stations | Upper Limit of Error (BP/PSO BP) | Lower limit of Error (BP/PSO BP) | Variance (BP/PSO BP) |
|---|---|---|---|
| Primary cascade hydropower station | 0.004898/0.004534 | −0.009107/−0.007303 | |
| Secondary cascade hydropower station | 0.002116/0.000794 | −0.004154/−0.000738 |
| Parameters | Population Size | Individual Length (Byte) | Maximum Number of Iterations | Crossover Probability | Mutation Probability |
|---|---|---|---|---|---|
| Genetic algorithm | 200 | 60 | 100 | 0.6 | 0.1 |
| Population Size/ Crossover Probability/ Mutation Probability | 150/0.6/0.1 | 250/0.6/0.1 | 200/0.5/0.1 | 200/0.6/0.1 | 200/0.6/0.15 | 200/0.6/0.05 |
|---|---|---|---|---|---|---|
| Generation increase rate | 2.93% | 3.16% | 3.11% | 3.35% | 3.20% | 3.29% |
Disclaimer/Publisher’s Note: The statements, opinions and data contained in all publications are solely those of the individual author(s) and contributor(s) and not of MDPI and/or the editor(s). MDPI and/or the editor(s) disclaim responsibility for any injury to people or property resulting from any ideas, methods, instructions or products referred to in the content. |
© 2025 by the authors. Licensee MDPI, Basel, Switzerland. This article is an open access article distributed under the terms and conditions of the Creative Commons Attribution (CC BY) license (https://creativecommons.org/licenses/by/4.0/).
Share and Cite
Wei, D.; Feng, C.; Liu, D. Research on Economic Operation of Cascade Small Hydropower Stations Within Plants Based on Refined Efficiency Models. Energies 2025, 18, 964. https://doi.org/10.3390/en18040964
Wei D, Feng C, Liu D. Research on Economic Operation of Cascade Small Hydropower Stations Within Plants Based on Refined Efficiency Models. Energies. 2025; 18(4):964. https://doi.org/10.3390/en18040964
Chicago/Turabian StyleWei, Daohong, Chunpeng Feng, and Dong Liu. 2025. "Research on Economic Operation of Cascade Small Hydropower Stations Within Plants Based on Refined Efficiency Models" Energies 18, no. 4: 964. https://doi.org/10.3390/en18040964
APA StyleWei, D., Feng, C., & Liu, D. (2025). Research on Economic Operation of Cascade Small Hydropower Stations Within Plants Based on Refined Efficiency Models. Energies, 18(4), 964. https://doi.org/10.3390/en18040964