Article

A Flexible Interconnected Distribution Network Power Supply Restoration Method Based on E-SOP

by
Lin Jiang
1,
Canbin Wang
1,
Wei Qiu
1,
Hui Xiao
2,* and
Wenshan Hu
2
1
Zhuhai Power Supply Bureau, Guangdong Power Grid Co., Ltd., Zhuhai 519000, China
2
School of Electricity and Automation, Wuhan University, Wuhan 430072, China
*
Author to whom correspondence should be addressed.
Energies 2025, 18(4), 954; https://doi.org/10.3390/en18040954
Submission received: 26 December 2024 / Revised: 24 January 2025 / Accepted: 28 January 2025 / Published: 17 February 2025
(This article belongs to the Special Issue Measurement Systems for Electric Machines and Motor Drives)

Abstract

:
To enhance the self-healing control capability of soft open points with energy storage (E-SOPs) and optimize the fault recovery performance in flexible interconnected distribution networks, this paper proposes a novel power supply restoration method based on E-SOP. The methodology begins with a comprehensive analysis of the E-SOP’s fundamental architecture and loss model. Subsequently, a dual-objective optimization function is formulated to maximize the sum of nodal active load restoration while minimizing network losses. The optimization problem is transformed into a second-order cone programming formulation under comprehensive operational constraints. To solve this complex optimization model, an innovative hybrid approach combining the Improved Whale Optimization Algorithm (IWOA) with second-order cone programming is developed. The proposed methodology is extensively validated using the IEEE 33-node test system. The experimental results demonstrate that this approach significantly enhances the power supply restoration capability of distribution networks while maintaining practical feasibility.

1. Introduction

The increasing depletion of fossil fuels coupled with the rapid development of new energy [1] has led to the extensive integration of distributed generation (DG) into power grids, presenting significant challenges to distribution network operation control and power output management [2]. The inherent randomness and uncertainty of DG output not only increases distribution networks’ operational complexity but also introduces various technical challenges, including intensified voltage fluctuations, reduced system stability, and the inadequacy of traditional power supply methods. As traditional distribution network operation modes prove insufficient for current demands, flexible interconnection technology has emerged as a crucial strategy for renewable energy integration. Compared to conventional systems, flexible interconnected distribution networks (FIDNs) can efficiently coordinate and control DG, flexible interconnection devices (FIDs), and reactive power compensation equipment, enabling resilient energy interconnection and enhanced power supply restoration capabilities [3,4,5].
Soft open points (SOPs), as power electronic devices installed in FIDNs [6], supersede traditional switching devices to facilitate closed-loop distribution networks’ operation, significantly contributing to load current balancing, power quality improvement, and voltage distribution optimization [7,8]. SOPs typically comprise two or more interconnected voltage source converters (VSCs), commonly implemented as back-to-back voltage source converters (B2B VSCs) in distribution grids. During normal operation, SOPs employ the PQ-VdcQ control model, while switching to V/f control during faults to provide voltage support and load restoration to affected areas. While fault self-healing is a crucial FIDN feature, the increasing DG integration poses higher demands on distribution networks’ self-healing capabilities. Moreover, as power restoration represents the final stage of fault self-healing, its optimization holds particular significance.
The current literature presents various approaches to distribution network power supply restoration [9,10]. Yu Y W et al. [11] developed a fault recovery model integrating multi-terminal SOPs with network reconfiguration, utilizing an Improved Particle Swarm Algorithm (IPSO) and second-order cone programming for optimal power supply scheme determination. Song Y et al. [12] proposed an SOP-based restoration method incorporating comprehensive distribution network constraints, employing second-order cone programming for the model’s transformation and solution. Zhao Y D [13] introduced a chance-constrained FIDN fault restoration model accounting for renewable energy uncertainty. Ji H R et al. [14] developed an SOP-based time-series islanding approach integrating wind and solar timing to enhance distribution network reliability.
Given the high cost of conventional SOPs, their integration with energy storage systems (ESSs) has emerged as a promising solution. Soft open points with energy storage (E-SOPs) combine SOPs’ current control capabilities with ESSs’ charging/discharging characteristics, enhancing distribution network current optimization while offering reduced size and cost compared to standalone SOPs and ESSs. This has led to extensive E-SOP applications in flexible distribution network studies [15]. Huang Z T et al. [16] applied E-SOPs to distribution network coordination planning, improving operational flexibility and economics. Li Y et al. [17] developed an E-SOP-based day-ahead–intraday optimization method, enhancing distribution network operational efficiency. While E-SOP applications are widespread, research on E-SOP-based FIDN power supply restoration remains limited. Although Hu Y F et al. [18] proposed an E-SOP-based islanding restoration method improving power supply restoration performance, their approach neglected the E-SOP loss model, whose accurate consideration could further enhance its restoration capabilities. Furthermore, while heuristic algorithms are susceptible to convergence at local optima, second-order cone programming, despite its ability to ensure global optimal solutions, exhibits limited computational efficiency. To address these limitations, this paper presents a hybrid IWOA–second-order cone methodology that combines the robust global search capabilities of IWOA with the enhanced local search efficiency of second-order cone programming, enabling the effective solution of large-scale power supply restoration problems in distribution networks.
This paper addresses critical gaps in FIDN fault recovery through the following contributions:
(1)
Development of a comprehensive E-SOP loss model with convex relaxation treatment;
(2)
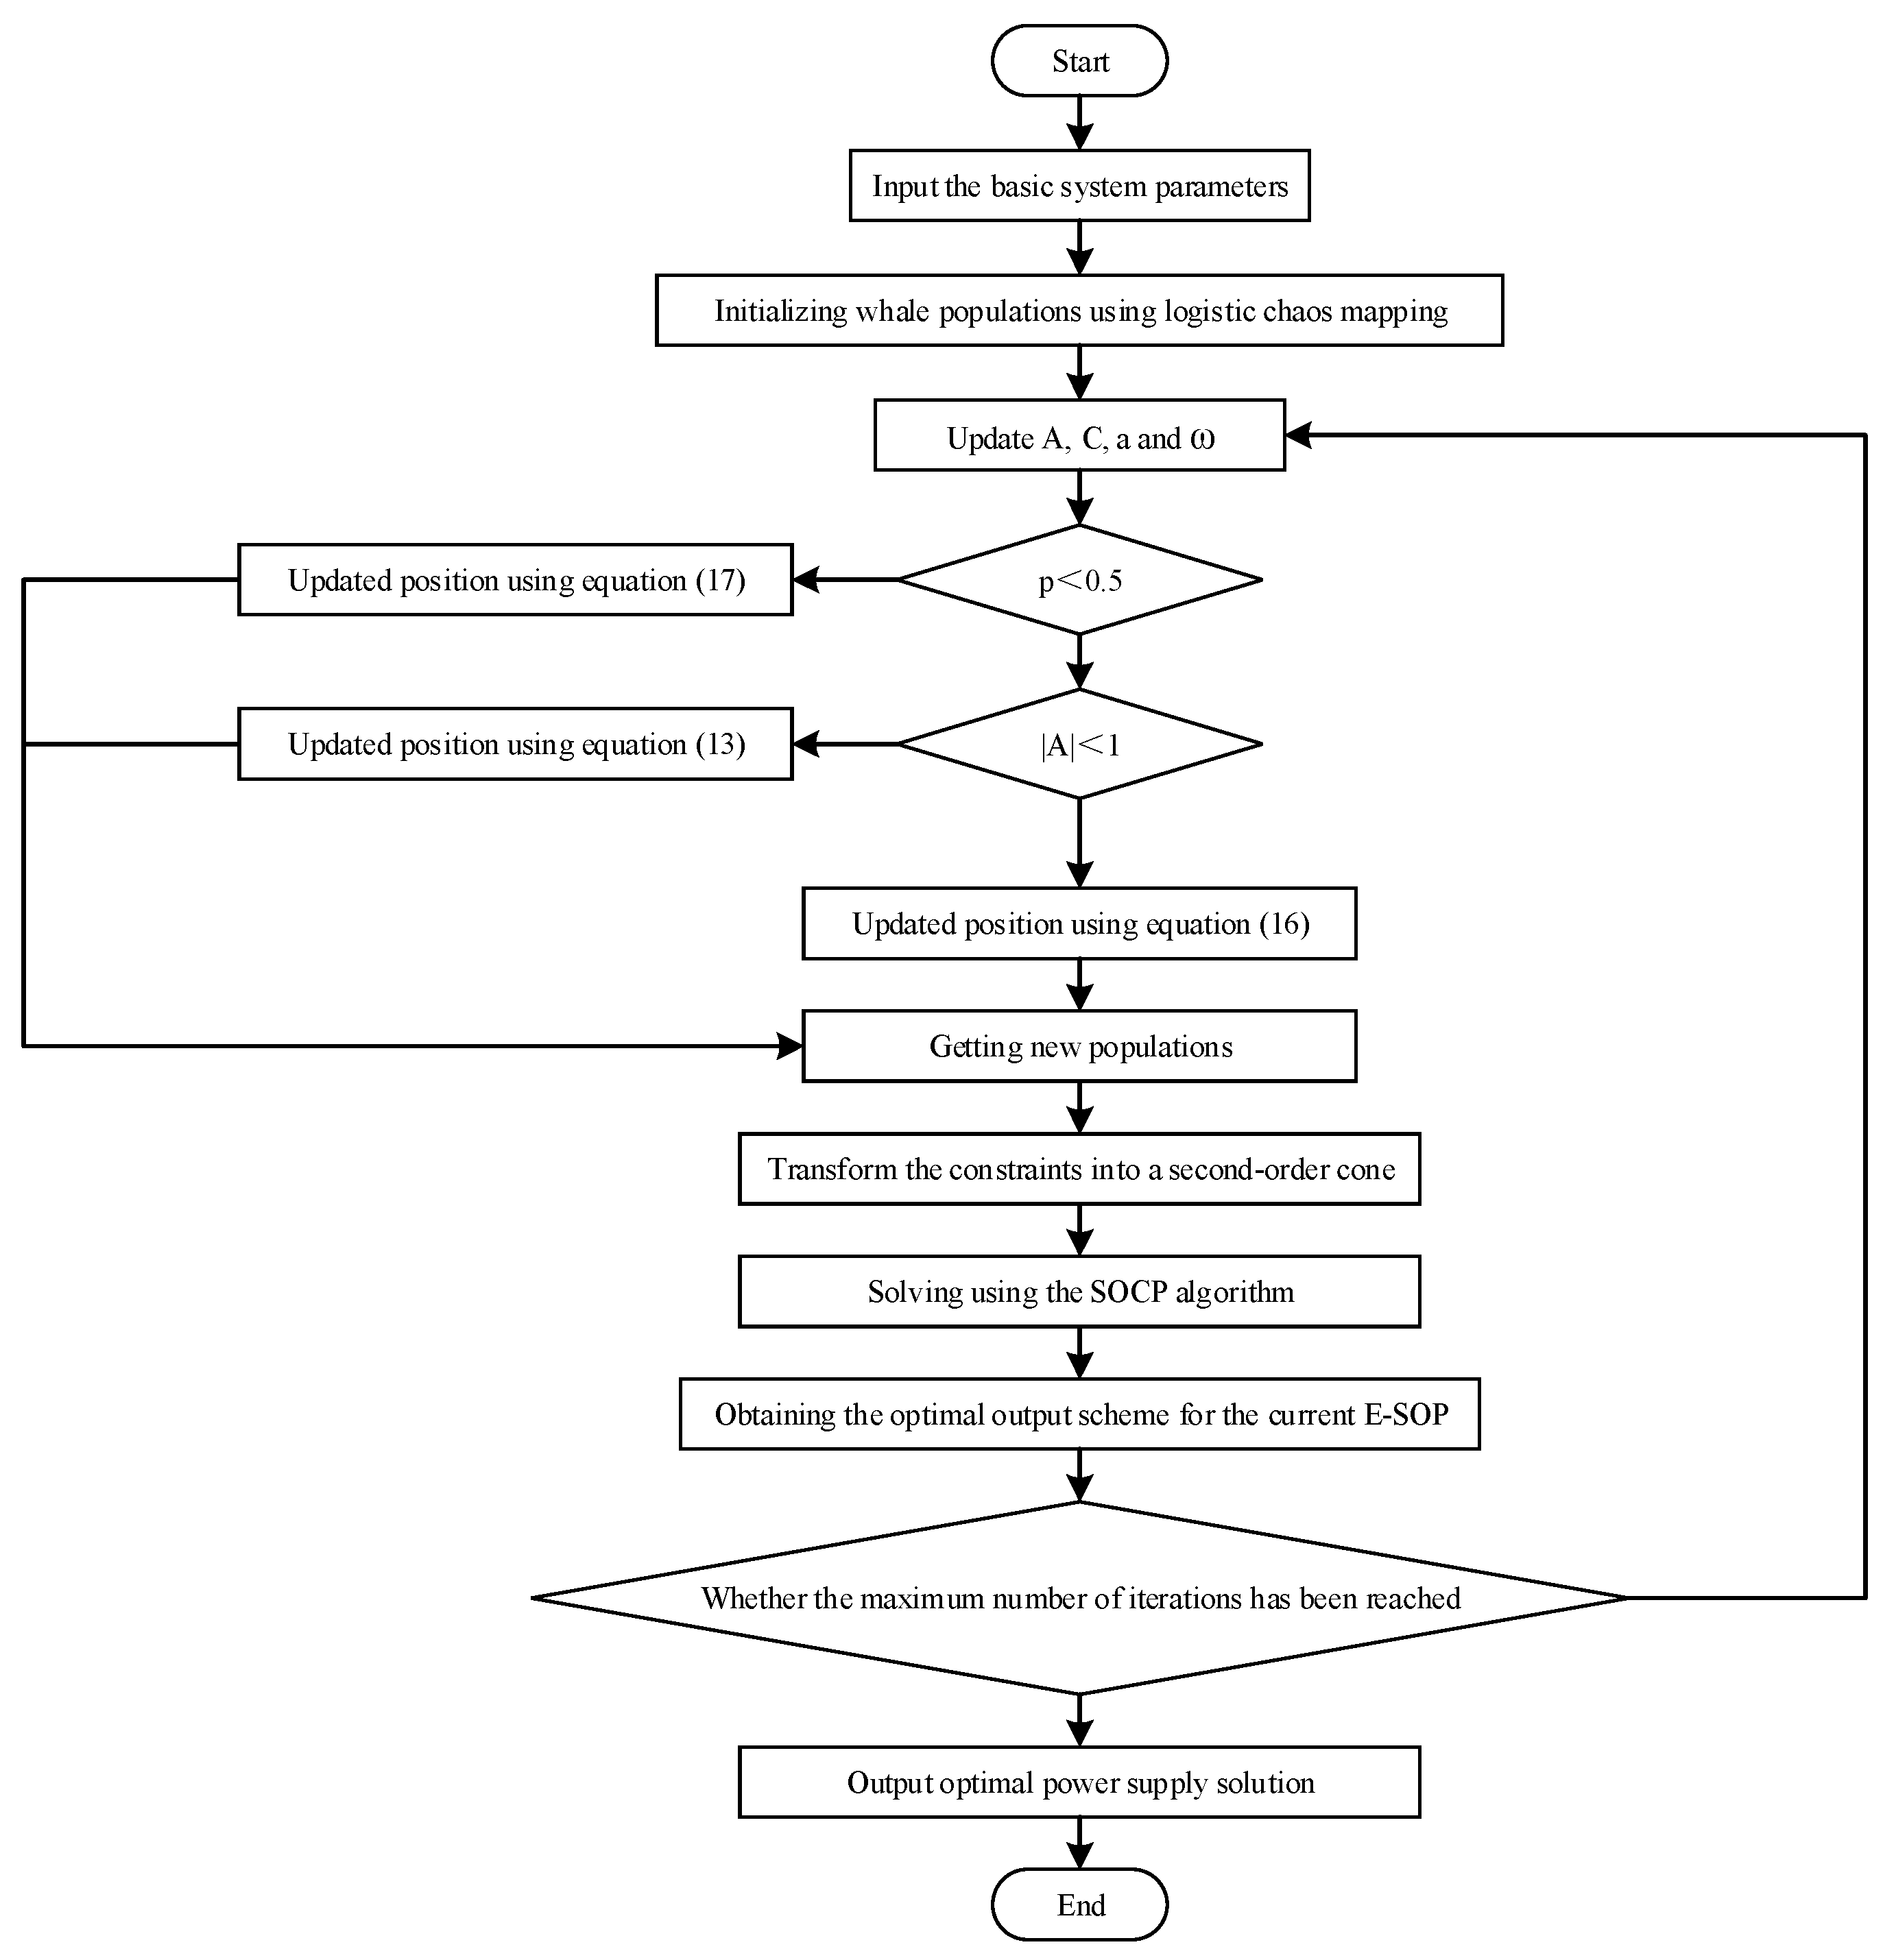
Implementation of an Improved Whale Optimization Algorithm (IWOA) integrated with second-order cone transformation for FIDN fault recovery optimization;
(3)
Demonstration of enhanced power supply restoration capabilities in complex fault scenarios.
The remainder of this paper is organized as follows: Section 2 presents the E-SOP basic structure and loss model. Section 3 formulates the objective function and constraints and introduces the hybrid IWOA–second-order cone transformation solution methodology. Section 4 establishes the E-SOP-based distribution network power supply restoration model. Section 5 presents a comprehensive case study using the IEEE 33-node system. Section 6 concludes the paper.

2. E-SOP Model Analysis

Traditional mechanical switches suffer from a limited operational lifecycle and inflexibility, impeding rapid power flow control. In contrast, E-SOPs can effectively replace these conventional switches, enabling continuous power regulation between feeders and enhancing distribution network security. The E-SOP architecture primarily comprises three critical components: an AC/DC converter, an energy storage system (ESS), and a DC/DC converter, as illustrated in Figure 1.
As power electronic devices, E-SOPs, similar to conventional soft open points (SOPs), incur operational losses. According to previous research [19], the loss model of a VSC can be approximated by a quadratic mathematical expression, as described in the following equation.
P l o s s S O P = a + a 0 S + a 1 S 2
where a, a0, and a1 represent the loss coefficients for different types of losses, S denotes the per-unit apparent power transmitted through the VSC, and Ploss represents the active power losses.
Consequently, the power losses in both the AC/DC converter and DC/DC converter of the E-SOP can be expressed by the following equations [20]:
P l o s s D C = a d c + a d c 1 | P D C | + a d c 2 ( P D C ) 2 P l o s s A D = a a d + a a d 1 S S O P + a a d 2 ( S S O P ) 2 S S O P = ( P S O P ) 2 + ( Q S O P ) 2
where  P l o s s D C  and  P l o s s A D  represent the power losses in the DC/DC converter and AC/DC converter, respectively; PDC denotes the active power transmitted through the DC/DC converter; and SSOP represents the apparent power of the AC/DC converter.

3. Power Supply Restoration Model with E-SOP and Its Cone Programming Transformation

To effectively solve the proposed power supply restoration model, this paper employs a hybrid optimization approach combining the Improved Whale Optimization Algorithm (IWOA) with mixed-integer second-order cone programming (MISOCP). The analysis begins with an examination of the objective function and constraints of the E-SOP-based power supply restoration model.

3.1. Objective Functions

While an E-SOP can provide a power supply to outage areas during distribution network faults, it simultaneously incurs internal power losses. Therefore, this paper establishes a dual-objective optimization model that maximizes the sum of restored nodal active loads while minimizing network losses. The mathematical formulations of these objectives are expressed as follows:
max f 1 = i Ω n α i λ i P i l o a d min f 2 = i j Ω b r i j I i j 2 + i Ω n P i , l o s s E S O P
where f1 represents the weighted summation of load restoration at each node, and f2 represents the power losses in distribution lines and the losses generated by E-SOP. αi represents the load restoration weight coefficient; λi denotes the restoration coefficient at node i, with λi∈[0,1]; Ωn is the set of nodes to be restored; Ωb represents the set of all branches in the system; ij represents the branch between nodes i and j; rij and Iij are the resistance and current of branch ij, respectively;  P i l o a d  denotes the active power at node i; and  P i , l o s s E S O P  represents the power losses generated by the E-SOP at node i.

3.2. System Constraints

During operation, an E-SOP must comply with both soft open points (SOPs) and ESS constraints. Taking the E-SOP output power direction as positive, the constraints are categorized as follows:
(a)
Establishing operational constraints for a SOP ensures its proper functioning and facilitates the maintenance of power balance within the system. These constraints serve as essential criteria for stable and reliable operation. SOP constraints encompass active power balance, power loss limitations, and capacity constraints, expressed by the following equations:
P i S O P + P j S O P + P D C + P l o s s E S O P = 0 P l o s s E S O P = P i , l o s s A D + P j , l o s s A D + P l o s s D C P i , l o s s A D = A i S O P ( P i S O P ) 2 + ( Q i S O P ) 2 P j , l o s s A D = A j S O P ( P j S O P ) 2 + ( Q j S O P ) 2 Q min S O P Q S O P Q max S O P P S O P 2 + Q S O P 2 S S O P
where i and j denote the node indices where the SOP connects to the distribution system;  P i S O P  and  P j S O P  denote the active power output at the i-side and j-side of the SOP;  Q i S O P  and  Q j S O P  represent the reactive power output at the i-side and j-side of the SOP;  Q max S O P  and  Q min S O P  denote the upper and lower bounds of VSC reactive power output;  S S O P  represents the VSC port capacity;  A i S O P  and  A j S O P  are the loss factors of AC/DC converters at the i-side and j-side; and  P i , l o s s A D  and  P j , l o s s A D  denote the AC/DC converter losses at sides i and j of the SOP.
(b)
The implementation of ESS constraints ensures their safe operation, maintains energy storage capacity within reasonable limits, and guarantees normal system operation. The ESS constraints can be classified into three categories: power balance constraints, charging/discharging constraints, and capacity constraints, which are formulated as follows:
P c E S S = P d c E S S + P D C 0 P c E S S β c P c , max E S S 0 P d c E S S β d c P d c , max E S S E t + 1 S O C = E t S O C + β c P c E S S δ c β d c P d c E S S δ d c 1 E t , min S O C E t S O C E t , max S O C
0 β c 1 0 β d c 1 β c + β d c 1
where βc and βcd are binary indicators for charging and discharging states, respectively (βc = 1 indicates the ESS charging state, βcd = 1 indicates the ESS discharging state);  P c E S S  and  P d c E S S  represent the charging and discharging power of ESSs, respectively;  E t S O C  denotes the energy level of the ESS at time t E t , max S O C  and  E t , min S O C  represent the upper and lower bounds of stored energy; and δc and δdc denote the charging and discharging efficiency coefficients, respectively.
(c)
Power Flow Constraints
Power flow constraints can ensure system security and facilitate optimal system operation. The system power flow constraints can be expressed by the following equations [21]:
P i = P i D G + P i E S O P λ i P i l o a d Q i = Q i D G + Q i E S O P λ i Q i l o a d i k Ω b P i k = j i Ω b ( P j i r j i I j i 2 ) + P i i k Ω b Q i k = j i Ω b ( Q j i x j i I j i 2 ) + Q i V j 2 = V i 2 2 ( r i j P i j + x i j Q i j ) + ( r i j 2 + x i j 2 ) I i j 2 I i j 2 V i 2 = P i j 2 + Q i j 2
where Vi represents the voltage magnitude at node I; Vj represents the voltage magnitude at node j; Pi and Qi denote the sum of injected active and reactive power at node i, respectively; xij is the reactance of branch ij; Pij and Qij represent the active and reactive power flow through branch ij P i D G  and  Q i D G  denote the active and reactive power output of distributed generation at node i Q i l o a d  represents the reactive power compensation at node i; and  P i E S O P  and  Q i E S O P  denote the active and reactive power provided by the E-SOP at node i.
(d)
System Operational Security Constraints
To ensure the secure operation of the flexible interconnected distribution network, the system must satisfy specific voltage and branch capacity constraints, as expressed in the following equations:
V i , min 2 V i 2 V i , max 2 I i , min 2 I i 2 I i , max 2
where Vi,max and Vi,min represent the upper and lower voltage limits at node i, respectively, and Ii,max and Ii,min denote the upper and lower current limits of branch i, respectively.
(e)
System Operational Security Constraints
To maintain the radial topology constraint of the distribution network, the following equation must be satisfied:
i j Ω b β i j = N 1
where βij is a binary variable indicating the status of branch ij (βij = 1 when the branch is closed, and βij = 0 when open), and N represents the total number of nodes in the system.

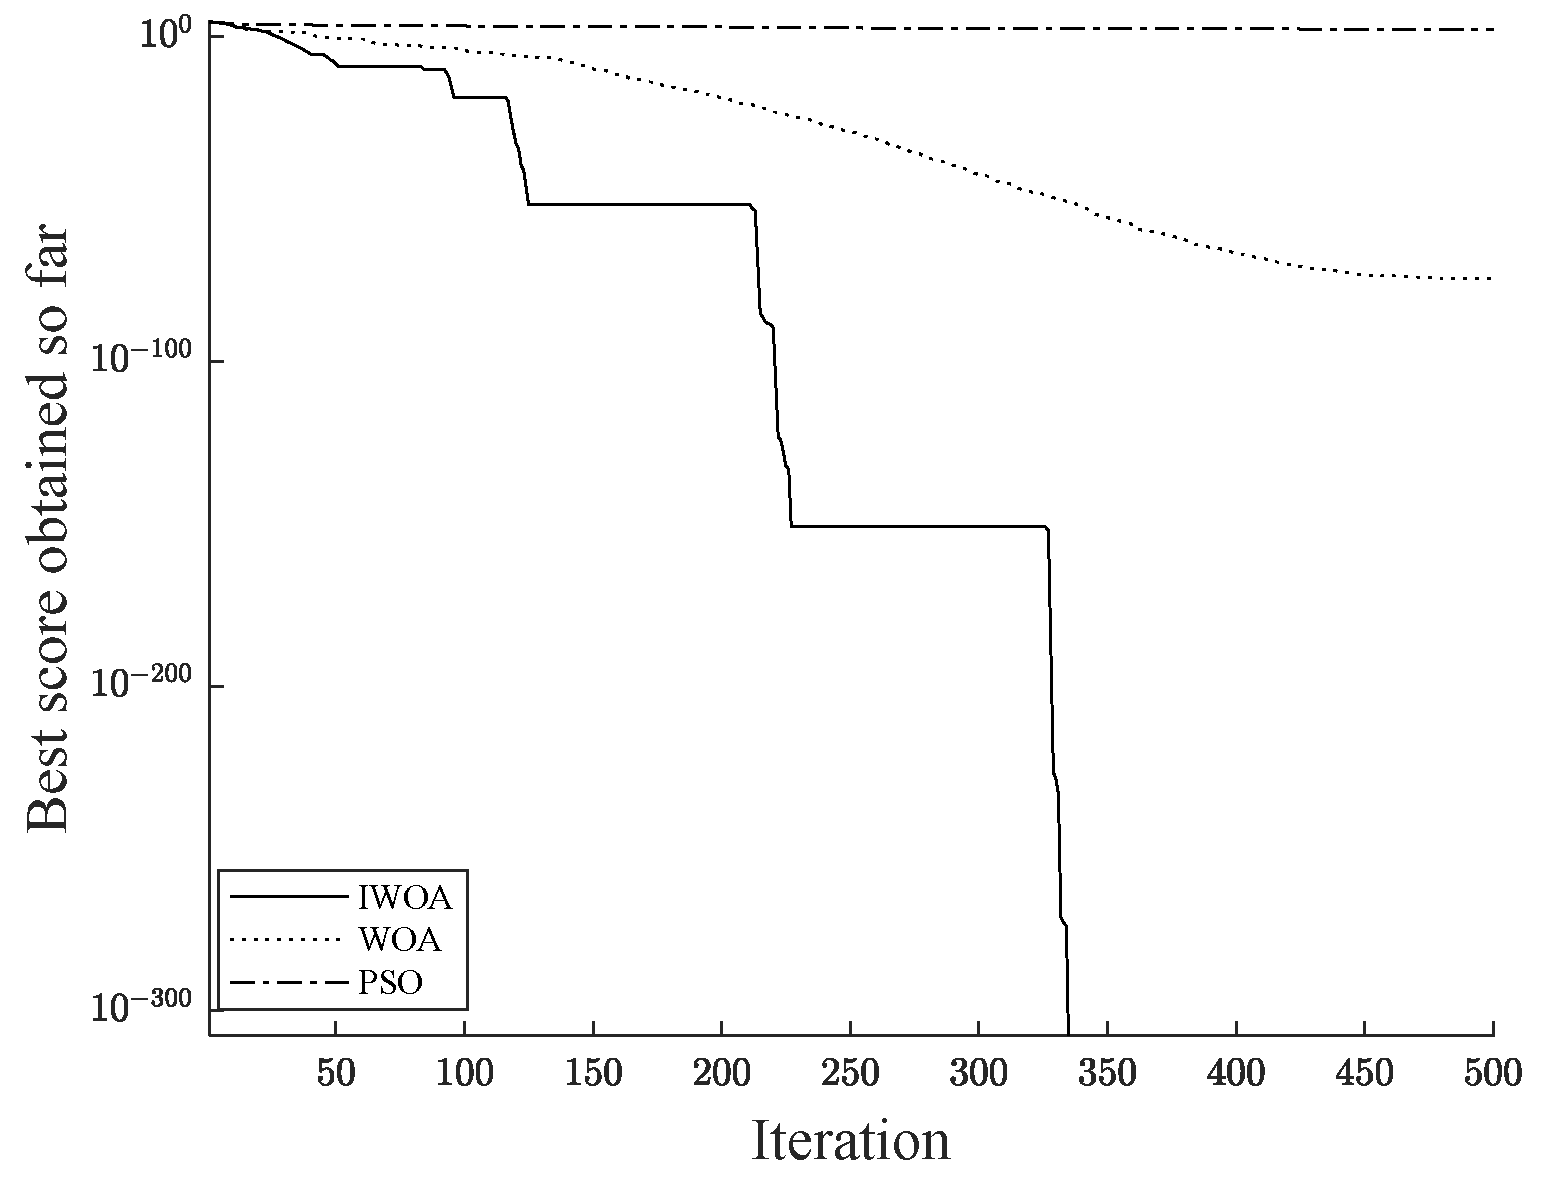
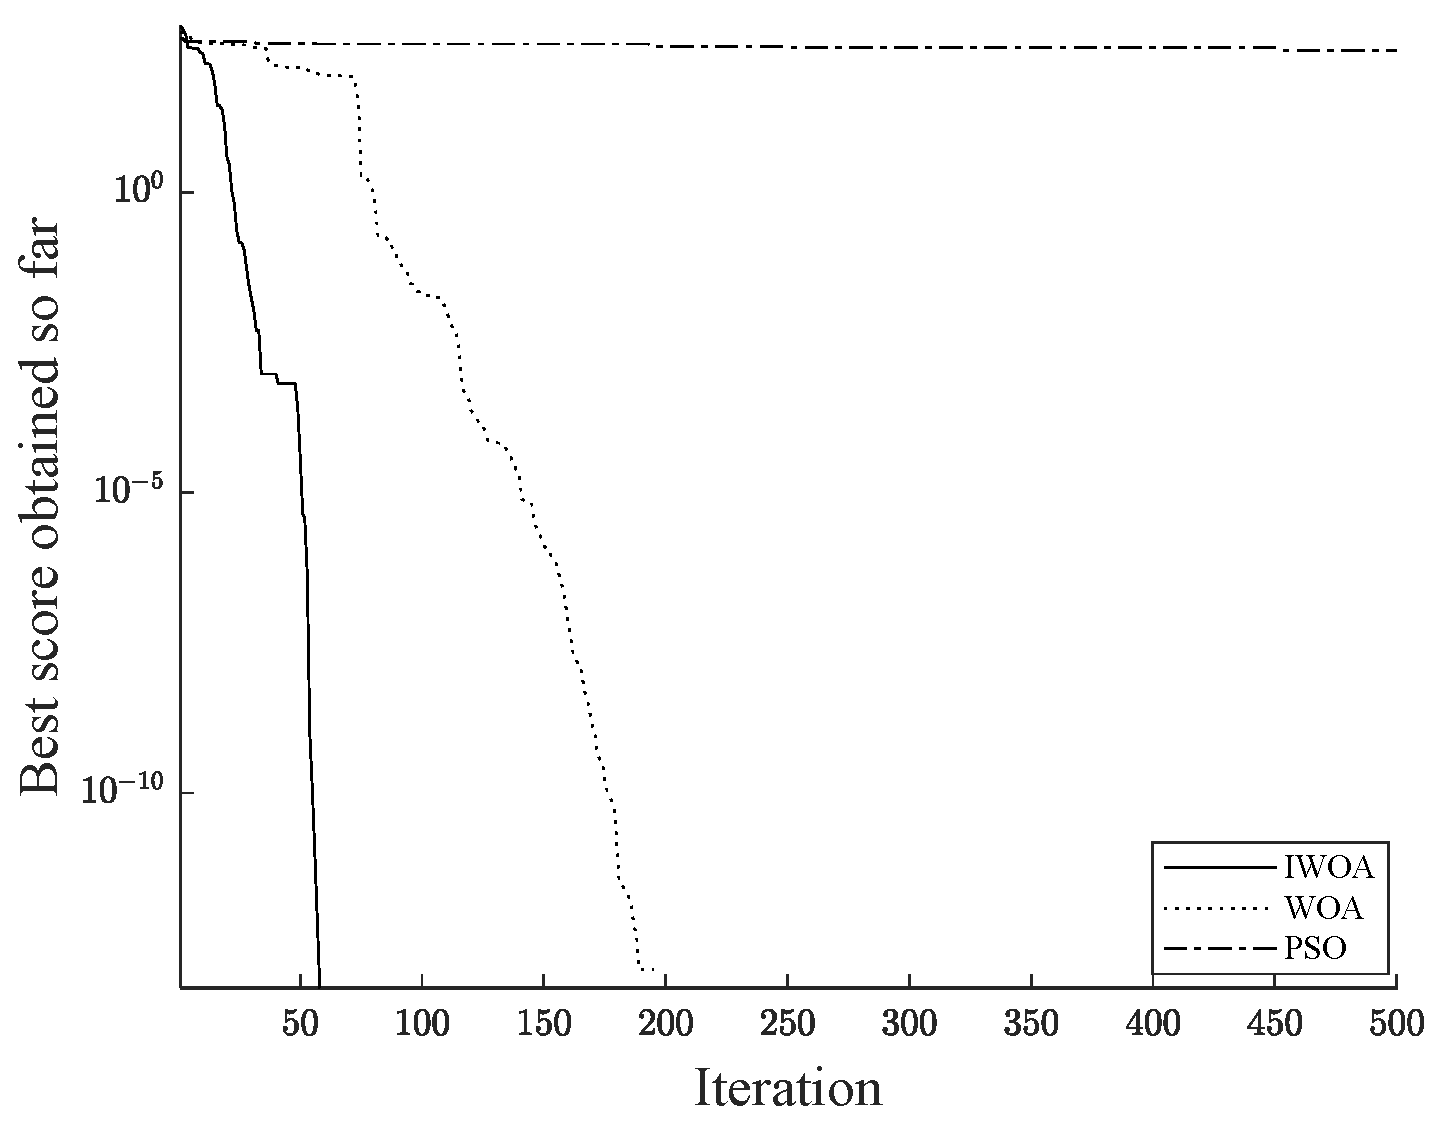
3.3. Improved Whale Optimization Algorithm

Inspired by whale foraging behavior, Mirjalili Seyedali et al. [22] proposed a metaheuristic Whale Optimization Algorithm (WOA) in 2016. The algorithm features simple parameters and excellent optimization capabilities. It consists of three main phases: encircling prey, bubble-net feeding, and prey searching. Each whale represents a feasible solution, and the WOA algorithm converges based on the position of the optimal solution, which forms its fundamental principle.
(a)
Encircling Prey
Within the search domain, whales locate and position their prey. Once the target position is determined, whales begin to encircle the prey. This process can be mathematically expressed by the following equations:
D = | C X p ( t ) X ( t ) | X ( t + 1 ) = X p ( t ) A D A = 2 a r 1 a C = 2 r 2 a = 2 2 t T
where X(t) represents the whale’s position; X(t + 1) represents the updated position of the whale; Xp(t) denotes the current optimal solution position; A and C are coefficient vectors; D represents the encircling step length; r1 and r2 are random numbers between 0 and 1; a is the shrinking coefficient that linearly decreases from 2 to 0 during iterations; t denotes the current iteration number; and T represents the maximum number of iterations.
(b)
Bubble-Net Feeding
Whales employ two hunting strategies: encircling prey and bubble-net feeding. During bubble-net feeding, position updates are expressed by a logarithmic spiral equation, which can be formulated as follows:
X ( t + 1 ) = D e b l cos ( 2 π l ) + X p ( t ) D = | X p ( t ) X ( t ) |
where D′ represents the distance between the whale and the optimal solution; b is the spiral parameter; and l is a random number between −1 and 1.
The selection of hunting strategy is determined by probability p. When p < 0.5, the whale adopts an encircling prey strategy; otherwise, it uses a bubble-net hunting strategy; this process can be expressed by the following equation:
X ( t + 1 ) = X p ( t ) A D , p < 0.5 D e b l cos ( 2 π l ) + X p ( t ) , p 0.5
(c)
Prey Searching
The whale’s position information is updated within the search space based on the positions of other individuals to achieve random search objectives, which can be mathematically expressed as follows:
D = | C X r a n d X | X ( t + 1 ) = X r a n d A D
where Xrand represents the position of a randomly selected whale.
Although the WOA algorithm demonstrates strong optimization capabilities, it remains susceptible to local optima convergence. Therefore, this paper proposes an improved WOA incorporating logistic chaotic mapping and position update weight strategies to enhance the algorithm’s ability to escape local optima, ensuring the effective handling of distribution network power supply restoration problems.
(a)
Logistic Chaotic Mapping
To enhance whale population diversity and mitigate the impact of initial value selection on algorithm performance, this paper employs logistic chaotic mapping for population initialization, which can be expressed as
z ( t + 1 ) = k z ( t ) ( 1 z ( t ) ) k [ 0 , 4 ] , z ( t ) ( 0 , 1 )
where k is the bifurcation parameter, z(t) represents the initial value, and z(t + 1) denotes the output value of logistic chaotic mapping.
(b)
Position Update Weight Strategy
During the hunting process, the WOA algorithm tends to converge to local optima. To balance the global search capability and local exploitation ability of the algorithm, a position update weighting strategy is implemented [23], which can be expressed as
ω = e 10 t T max
X ( t + 1 ) = ω X p ( t ) A D
X ( t + 1 ) = ω X p ( t ) + D e b l cos ( 2 π l )
where ω represents the adaptive weight factor.
To validate the effectiveness of the improved algorithm, three test functions (the Sphere function, Schwefel function, and Rastrigin function) were employed for experimentation and compared with the original WOA algorithm and Particle Swarm Optimization (PSO) algorithm. The mathematical expressions of the three test functions are
f 1 = i = 1 n x i 2
f 2 = i = 1 n | x i | + i = 1 n | x i |
f 3 = i = 1 n [ x i 2 10 cos ( 2 π x i ) + 10 ]
where n represents the dimension, and the optimal solution for all three test functions is 0. The proximity of the algorithm’s search results to zero indicates a superior optimization performance.
To investigate the impact of initial value selection on heuristic algorithms, 20 independent experiments were conducted for each algorithm on different test functions. To ensure experimental validity, the population size for all algorithms was set to 30, and the maximum number of iterations was set to 500. The representative optimization results of different algorithms on the three test functions are illustrated in Figure 2, Figure 3 and Figure 4, and the optimization results are presented in Table 1.
As demonstrated by the above figures and Table 1, the proposed initialization strategy effectively mitigates the impact of initial value selection. The IWOA algorithm exhibits superior optimization capability and stability compared to the WOA and PSO algorithms, validating the feasibility of the proposed method.

3.4. Second-Order Cone Model and Convex Relaxation Transformation

An analysis of the above objective functions and constraints reveals that the distribution network power supply restoration problem is inherently nonlinear, with multiple objectives and constraints. Therefore, this paper transforms this problem into a second-order cone model [24]; converting to a second-order cone model effectively handles nonlinear constraint problems, thereby improving computational efficiency and solution accuracy. The transformation process for E-SOP port capacity constraints can be expressed as
( P i S O P ) 2 + ( Q i S O P ) 2 2 P i , l o s s S O P 2 A i S O P 2 ( P j S O P ) 2 + ( Q j S O P ) 2 2 P j , l o s s S O P 2 A j S O P 2 ( P i S O P ) 2 + ( Q i S O P ) 2 2 S i S O P 2 2 ( P j S O P ) 2 + ( Q j S O P ) 2 2 S j S O P 2 2
2 P i j 2 Q i j I i j 2 V i 2 V i 2 + I i j 2
Following this transformation, the distribution network power supply restoration problem is converted into a second-order cone model, solvable using the mathematical tool CPLEX 12.10.
Furthermore, the E-SOP loss model requires transformation into second-order cone form using variable substitution and relaxation methods. The loss models for AC/DC and DC/DC converters can be expressed as
P l o s s D C = a d c + a d c 1 b d c 1 + a d c 2 b d c 2 P l o s s A D = a a d + a a d 1 b a d 1 + a a d 2 b a d 2 b d c 1 = | P D C | , b d c 2 = ( P D C ) 2 b a d 1 = | P A D | , b a d 2 = ( P A D ) 2
where bdc1, bdc2, bad1, and bad2 are auxiliary variables.
The convex relaxation of these auxiliary variables linearizes the loss model. The relaxation treatment for the AC/DC converter can be expressed as
P i S O P Q i S O P b a d 1 2 P i S O P 2 Q i S O P 1 b a d 2 1 + b a d 2
The relaxation treatment for the DC/DC converter can be expressed as
P i D C b d c 1 P i D C 2 P i D C 1 b d c 2 1 + b d c 2

4. Power Supply Restoration Model Based on E-SOP

To effectively solve the power supply restoration problem in flexible interconnected distribution networks, a hybrid optimization algorithm combining the Improved Whale Optimization Algorithm with mixed-integer second-order cone programming is proposed. The power supply restoration process for flexible interconnected distribution networks based on E-SOPs is illustrated in Figure 5, with the following main steps:
Step 1: Establish the power supply restoration structure based on E-SOPs and input the basic system parameters;
Step 2: Initialize the whale population using logistic chaotic mapping and initiate the model iteration;
Step 3: Update coefficient vectors A and C, shrinking coefficient a, and adaptive weight factor ω;
Step 4: First determine if probability p is less than 0.5. If not, update whale positions using Equation (17); if less than 0.5, check the magnitude of coefficient vector A. If |A| ≥ 1, update whale positions using equation (13); if |A| < 1, update whale positions using Equation (16);
Step 5: Obtain the updated population and transform the constraints into a mixed-integer second-order cone model for solution;
Step 6: Obtain the current optimal power dispatch scheme, and determine if the maximum iteration number is reached. If not, return to the iteration cycle; if reached, output the final optimal power supply scheme.

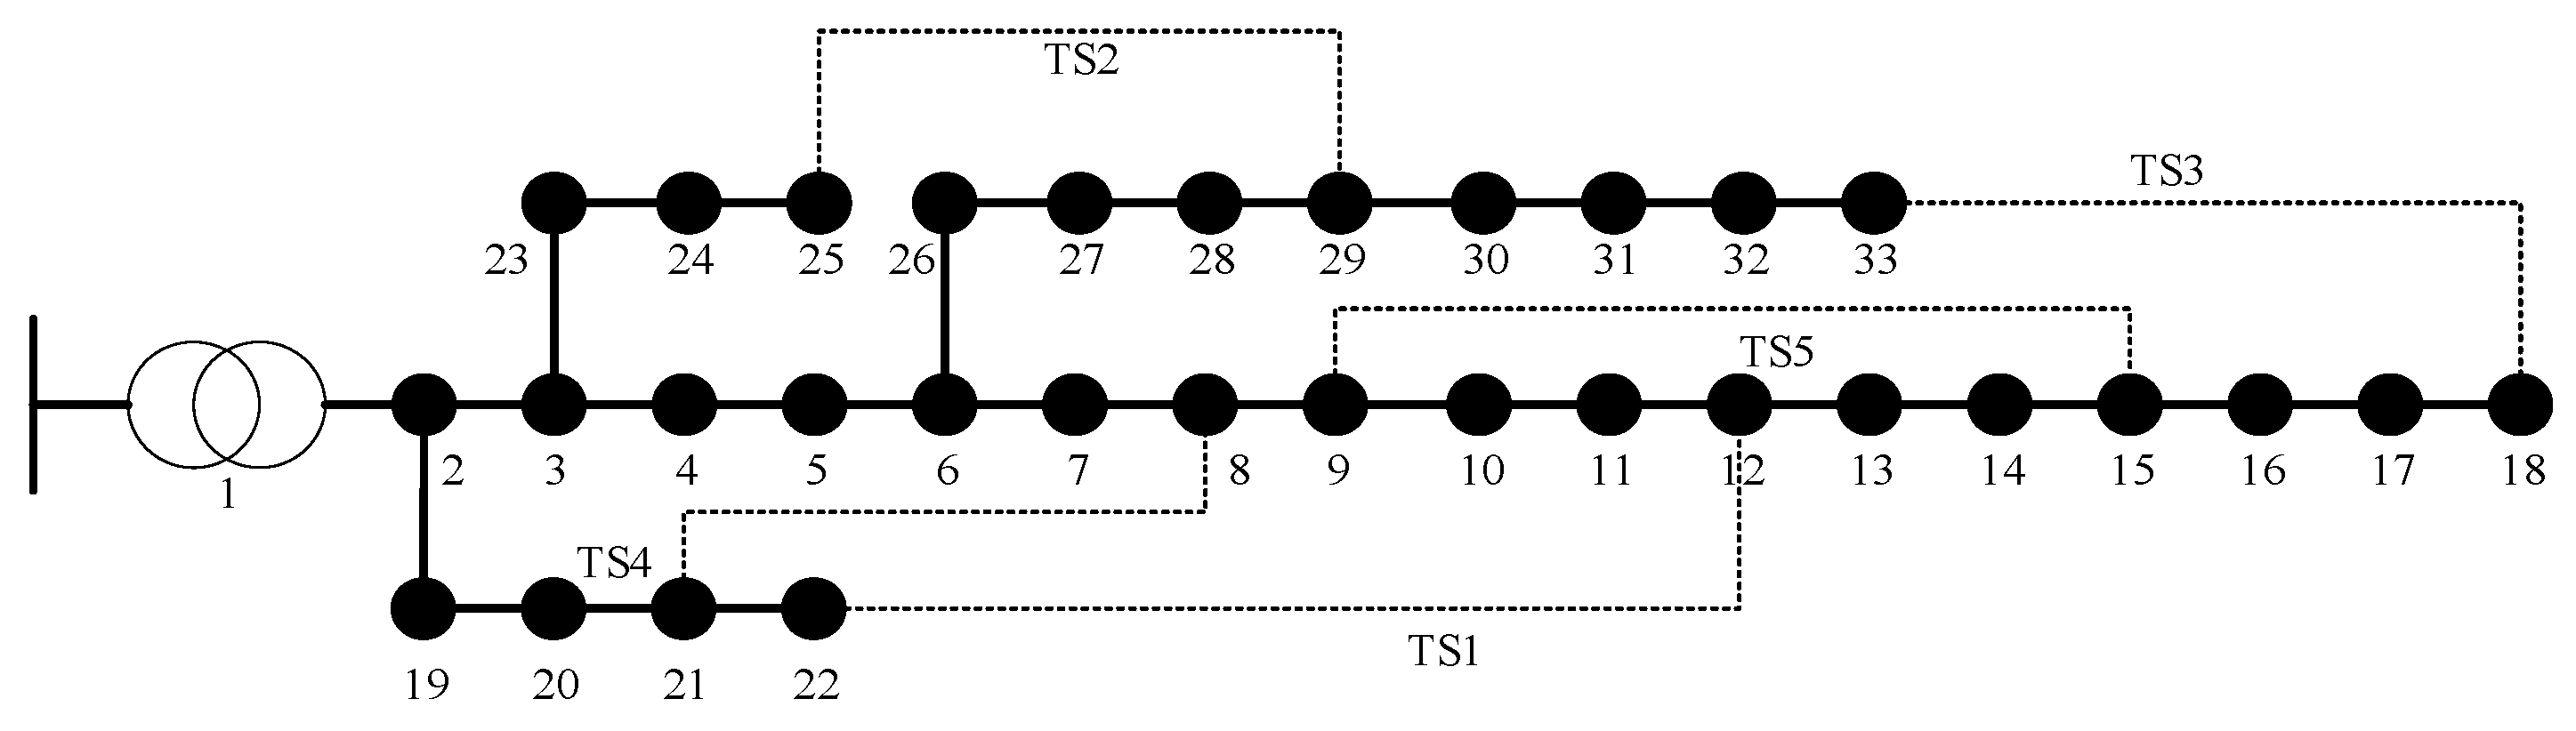
5. Case Study Analysis

5.1. Case Study Analysis (1)

To validate the effectiveness of the hybrid algorithm combining the IWOA (Improved Whale Optimization Algorithm) and second-order cone programming (SOCP) for power supply restoration problems, an experimental analysis was conducted based on the IEEE 33-node test system. All case studies were implemented in MATLAB 2022b with CPLEX solver integration. The experimental platform consisted of a Windows 11 operating system, equipped with a 13th Generation Intel® Core™ i5-13400F processor (Intel, Santa Clara, CA, USA) and an NVIDIA GeForce GTX 1660 Ti graphics card (NVIDIA, Santa Clara, CA, USA).
The IEEE 33-node network operates at a voltage level of 12.66 kV, with total active and reactive loads of 3715 kW and 2300 kVar, respectively. The topology of the IEEE 33-node test system is illustrated in Figure 6.
A permanent fault is assumed to occur between branches 5–6, resulting in power outages at nodes 6–18 and nodes 26–33, with a total load loss of 2055 kW. The per-unit voltage range is set to [0.95,1.05], and the load restoration weight coefficient αi is set to 100. The E-SOP replaces tie switch TS1 with a total capacity of 1MVA. The VSC connected to node 12 employs V/f control with V = 1.05 p.u. and f = 60 Hz, while the VSC at node 22 uses PQ control with p = −521.9 kW and Q = 1501.9 kVar. All intelligent algorithms are configured with a population size of 20 and maximum iterations of 50. The modified test system topology with E-SOP is shown in Figure 7.
To evaluate the feasibility of the proposed method, five scenarios are established:
Case 1: Power supply restoration using tie switches only;
Case 2: Power supply restoration through network reconfiguration;
Case 3: Power supply restoration using E-SOP replacing tie switch TS1;
Case 4: Power supply restoration using combined PSO algorithm and second-order cone optimization;
Case 5: Power supply restoration using combined WOA algorithm and second-order cone optimization;
Case 6: Power supply restoration using combined IWOA algorithm and second-order cone optimization.
The reconfigured network structure for Case 2 is illustrated in Figure 8.
The simulation results for distribution network power supply restoration are presented in Table 2. Taking the direction of node power injection as positive, the per-unit voltage profiles for the four scenarios are illustrated in Figure 9.
As evidenced by the results in Table 2 and Figure 9, Case 2 demonstrates a significantly improved power supply restoration compared to Case 1, which can be attributed to the network reconfiguration effectively enhancing the distribution network resilience [25]. Furthermore, Case 3 achieves an additional improvement in distribution network restoration, indicating that incorporating E-SOPs in fault recovery effectively enhances the self-healing capability of the distribution network. However, due to constraints in placement location and capacity, using E-SOPs alone cannot achieve complete load restoration. Cases 4, 5, and 6, which integrate intelligent algorithms with Case 3’s framework and employ second-order cone optimization, achieve higher levels of power supply restoration and superior voltage control capabilities. However, the introduction of intelligent algorithms results in slightly longer solution times compared to other approaches. This increased computation time is due to the intelligent optimization algorithms requiring multiple iterations to automatically search for optimal solutions, thereby maximizing restoration effectiveness. Moreover, the optimization scheme utilizing the IWOA algorithm achieves the best restoration results, demonstrating the feasibility of the proposed method.

5.2. Case Study Analysis (2)

To analyze the impact of DG integration on distribution network power supply restoration, photovoltaic (PV) systems are integrated into the E-SOP-equipped network. The PV installation locations and power ratings are shown in Table 3, and the modified test system topology with PV integration is illustrated in Figure 10.
Assuming a rated power output from the PV systems with a power factor of 1.0 and maintaining other parameters identical to the previous case study, the power supply restoration results after DG integration are presented in Table 4. The per-unit voltage profiles under different scenarios are shown in Figure 11.
The results from Table 4 and Figure 11 indicate that the integration of distributed generation provides power support to outage areas, thereby enhancing the power supply restoration capability of the distribution network.
Due to the inherent randomness in intelligent optimization algorithms, to investigate the impact of different initial values on their performance, 10 repetitive experiments were conducted for Case 4, Case 5, and Case 6. The optimal values, mean values, and standard deviations of load restoration were recorded. Table 5 summarizes the results of these 10 experiments.
As shown in Table 5, the hybrid algorithm combining the IWOA and second-order cone optimization demonstrates superior stability and better resilience to the impact of initial value selection on intelligent algorithms. This indicates the feasibility of the proposed method.

6. Conclusions

This paper addresses fault recovery in flexible interconnected distribution networks by first introducing the basic structure and loss model of E-SOPs, then considering E-SOP-related constraints and transforming them into a second-order cone model solved using CPLEX. An analysis conducted on the IEEE 33-node network yields the following main conclusions:
(a)
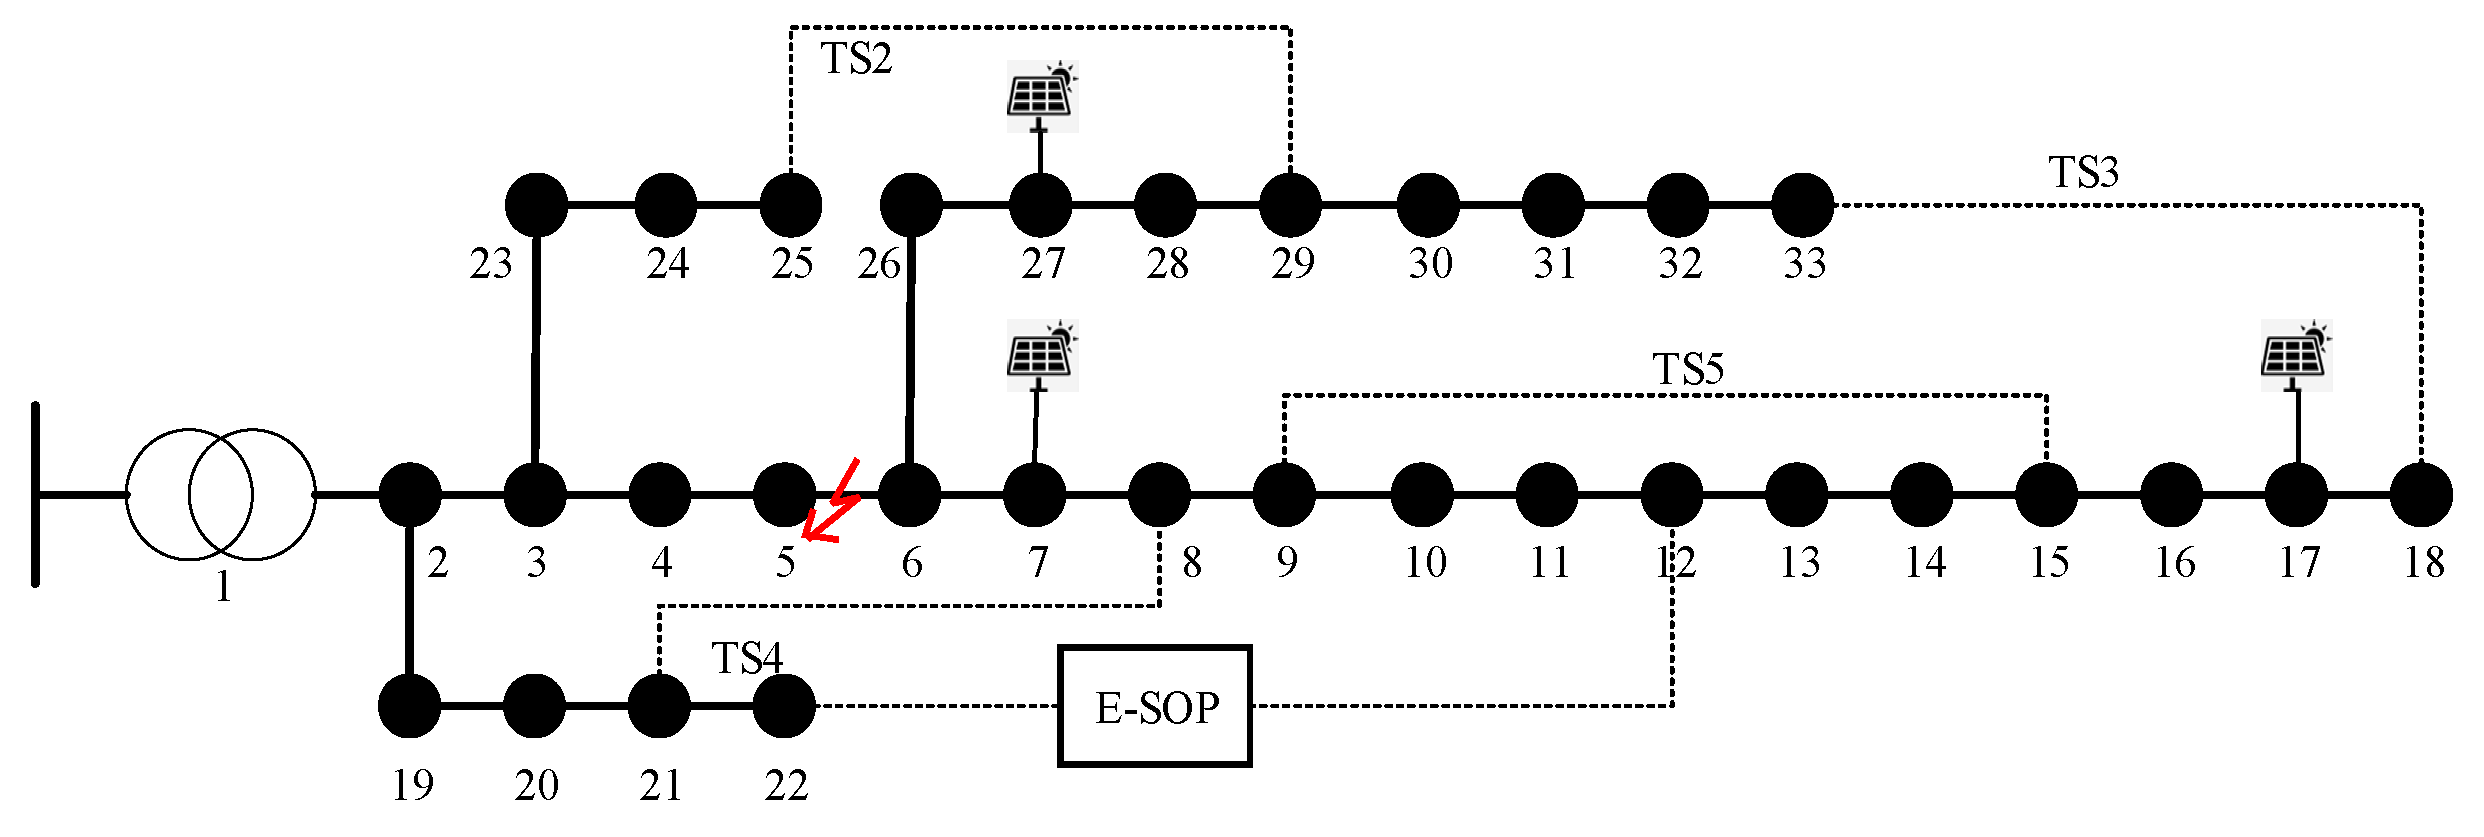
As a novel flexible regulation device, an E-SOP effectively enhances the power supply restoration capability of flexible interconnected distribution networks. Compared to traditional switching schemes and network reconfiguration approaches, E-SOP-based restoration demonstrates superior advantages. However, the restoration’s effectiveness is generally constrained by the device placement location and capacity limitations;
(b)
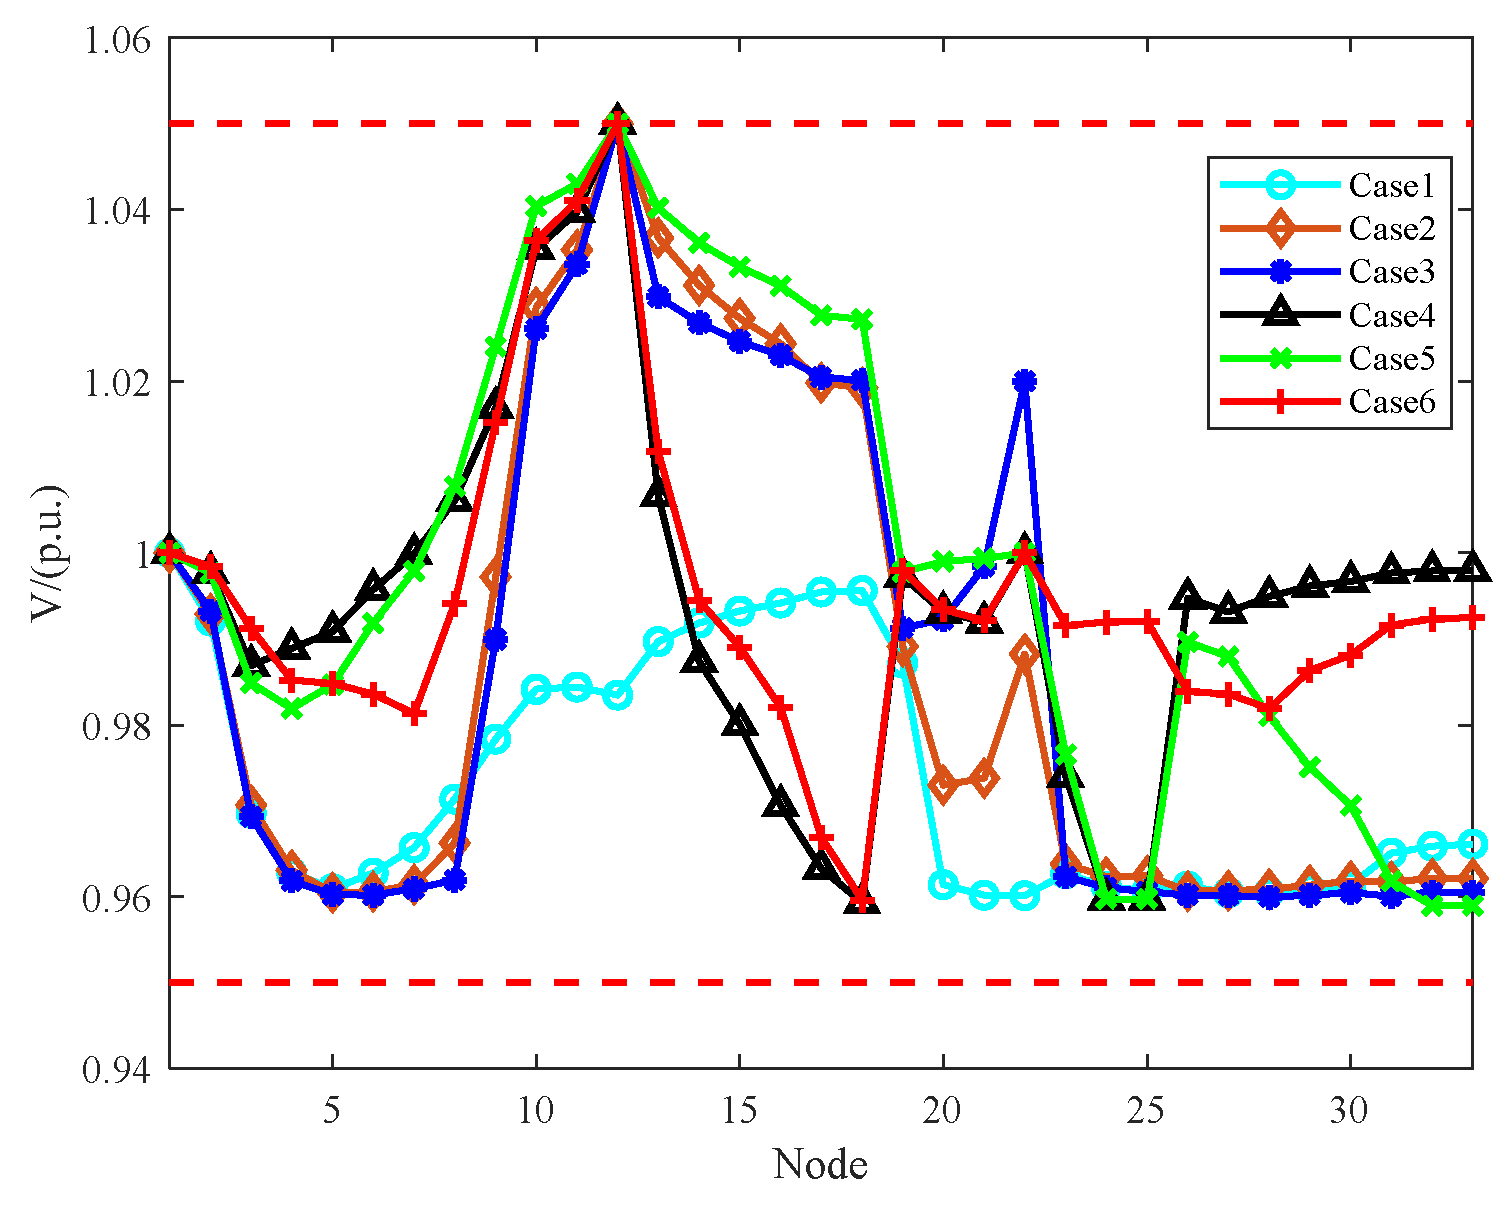
Incorporating intelligent algorithms into the E-SOP-based power supply restoration process significantly improves the restoration capability of distribution networks while achieving enhanced voltage control performance. Experimental results demonstrate that the proposed hybrid IWOA–second-order cone optimization method achieves superior restoration outcomes and exhibits improved stability across multiple independent runs, indicating that the proposed method better mitigates the impact of initial value selection;
(c)
The integration of distributed generation provides effective power support to outage areas, further enhancing system fault recovery performance. Case studies reveal that after photovoltaic integration, all restoration schemes achieve significantly improved recovery rates, particularly the IWOA–second-order cone hybrid algorithm approach, which achieves a system recovery rate of 93.0%. This indicates that the coordinated optimization of multiple flexible resources plays a crucial role in enhancing distribution networks’ self-healing capabilities.
Although the proposed method demonstrates excellent restoration performance, certain limitations exist. Firstly, the introduction of intelligent algorithms increases computational time. Secondly, the uncertainties associated with wind and solar power generation have not been considered. Therefore, future research will focus on addressing these challenges to further improve the power supply restoration capability of flexible interconnected distribution networks.

Author Contributions

Writing—Original Draft, L.J.; Methodology, C.W.; Resources, W.Q.; Conceptualization, H.X.; Writing—Review & Editing, W.H. and H.X.; Data Curation, L.J.; Formal Analysis, C.W.; Investigation, W.Q.; Software, W.Q.; Validation, H.X., W.Q. and W.H. All authors have read and agreed to the published version of the manuscript.

Funding

This research was supported by the National Natural Science Foundation of China (62073247). The project host is Wenshan Hu, and the project name is “Research on the mechanism of networked online experiment for the whole process of control system evolution”.

Data Availability Statement

The original contributions presented in this study are included in the article. Further inquiries can be directed to the corresponding author.

Conflicts of Interest

Authors Lin Jiang, Canbin Wang, and Wei Qiu were employed by Zhuhai Power Supply Bureau, Guangdong Power Grid Co., Ltd. The remaining authors declare that the research was conducted in the absence of any commercial or financial relationships that could be construed as a potential conflict of interest.

Abbreviations

IWOAImproved Whale Optimization Algorithm
E-SOPsoft open point with energy storage
DGdistributed generation
FIDNflexible interconnected distribution networks
FIDflexible interconnection devices
SOPsoft open point
VSCvoltage source converters
B2B VSCback-to-back voltage source converters
IPSOImproved Particle Swarm Algorithm
ESSenergy storage system
WOAWhale Optimization Algorithm

References

  1. Xia, W.; Ren, Z.; Qin, H.; Dong, Z.Y. A coordinated operation method for networked hydrogen-power-transportation system. Energy 2024, 296, 131026. [Google Scholar] [CrossRef]
  2. Pamshetti, V.B.; Singh, S.; Thakur, A.K.; Singh, S.P. Multistage coordination Volt/VAR control with CVR in active distribution network in presence of inverter-based DG units and soft open points. IEEE Trans. Ind. Appl. 2021, 57, 2035–2047. [Google Scholar] [CrossRef]
  3. Wang, C.; Sun, J.J.; Huang, M.; Zha, X.; Hu, W. Two-stage optimization for active distribution systems based on operating ranges of soft open points and energy storage system. J. Mod. Power Syst. Clean Energy 2023, 11, 66–79. [Google Scholar] [CrossRef]
  4. Li, P.; Ji, H.; Wang, C.; Zhao, J.; Song, G.; Ding, F.; Wu, J. Coordinated control method of voltage and reactive power for active distribution networks based on soft open point. IEEE Trans. Sustain. Energy 2017, 8, 1430–1442. [Google Scholar] [CrossRef]
  5. Xu, Z.P.; Liang, Y.S.; Li, H.F.; Gang, W.; Jia, L. Cloud-Edge Collaborative Optimization Algorithm for Fault Restoration of Flexible Interconnected Distribution Network. Autom. Electr. Power Syst. 2023, 47, 171–184. [Google Scholar]
  6. Liao, B.L.; Gao, Z.L.; Tang, J.Q.; Wu, Y.H.; Cheng, J. Active distribution network centralized direction protection based on graph theory. Smart Power 2019, 47, 55–62. [Google Scholar]
  7. Li, P.; Ji, H.R.; Wang, C.S.; Zhao, J.; Song, G.; Ding, F.; Wu, J. Optimal Operation of Soft Open Points in Active Distribution Networks Under Three-Phase Unbalanced Conditions. IEEE Trans. Smart Grid 2019, 10, 380–391. [Google Scholar] [CrossRef]
  8. Xu, B.; Xiong, G.J.; Ye, F.H. A Flexible Interconnection Strategy for Distribution Networks Based on Intelligent Soft-Open Point Configuration. Power Syst. Clean Energy 2023, 39, 86–96. [Google Scholar]
  9. Li, P.; Song, G.Y.; Ji, H.R.; Zhao, J.; Wang, C.; Wu, J. A Supply Restoration Method of Distribution System Based on Soft Open Point. In Proceedings of the IEEE Innovative Smart Grid Technologies, Melbourne, VIC, Australia, 28 November–1 December 2016; pp. 535–539. [Google Scholar]
  10. Sun, S.; Cong, W.; Sheng, Y.; Chen, M.; Wei, Z. Distributed Power Service Restoration Method of Distribution Network with Soft Open Point. In Proceedings of the 2020 IEEE/IAS Industrial and Commercial Power System, Asia (I&CPS Asia), Weihai, China, 13–15 July 2020; pp. 1616–1621. [Google Scholar]
  11. Yu, Y.W.; Yuan, X.F.; Xiong, W. A Power Supply Restoration Method for the Flexible Interconnected Distribution Network with Multi-Terminal Soft Open Point. Power Syst. Clean Energy 2021, 37, 75–85+90. [Google Scholar]
  12. Song, Y.; Sun, C.B.; Li, P.; Kai, Y.; Guanyu, S.; Chengshan, W. SOP Based Supply Restoration Method of Active Distribution Networks Using Soft Open Point. Proc. CSEE 2018, 38, 4390–4398+4639. [Google Scholar]
  13. Zhao, Y.; Xiong, W.; Yuan, X.; Zou, X. A fault recovery strategy of flexible interconnected distribution network with SOP flexible closed-loop operation. Int. J. Electr. Power Energy Syst. 2022, 142, 108360. [Google Scholar] [CrossRef]
  14. Ji, H.; Wang, C.; Li, P.; Song, G.; Wu, J. SOP-based islanding partition method of active distribution networks considering the characteristics of DG, energy storage system and load. Energy 2018, 155, 312–325. [Google Scholar] [CrossRef]
  15. Jiang, X.; Zhou, Y.; Ming, W.; Yang, P.; Wu, J. An overview of soft open points in electricity distribution networks. IEEE Trans. Smart Grid 2022, 13, 1899–1910. [Google Scholar] [CrossRef]
  16. Huang, Z.T.; Xu, Y.H.; Chen, L.; Ye, X. Coordinated planning method considering flexible resources of active distribution network and soft open point integrated with energy storage system. IET Gener. Transm. Distrib. 2023, 17, 5273–5285. [Google Scholar] [CrossRef]
  17. Li, Y.; Ling, F.; Qiao, X.B.; Zhong, J.J.; Cao, Y.J. Day-Ahead and Intra-Day Optimization of Flexible Interconnected Distribution System with Self-Energy Storage Based on the Grid-Side Resource Coordination. Trans. China Electrotech. Soc. 2024, 39, 758–773+923. [Google Scholar]
  18. Hu, Y.F.; Qian, F.; Li, H.L.; Liu, S.; Zhang, Q. Island fault recovery method of distribution network based on flexible interconnection device with energy storage. Distrib. Util. 2024, 41, 21–27. [Google Scholar]
  19. Sarantakos, I.; Peker, M.; Zografou-Barredo, N.-M.; Deakin, M.; Patsios, C.; Sayfutdinov, T. A robust mixed-integer convex model for optimal scheduling of integrated energy storage-soft open point devices. IEEE Trans. Smart Grid 2022, 13, 4072–4087. [Google Scholar] [CrossRef]
  20. He, J.F.; Zhang, Y.Z.; Zhang, T.; Mo, S.; Lu, Z.J. Multi-Time Scale Reactive Power Optimization Method for Flexible Interconnected Distribution Networks with Self-Energy Storage. South. Power Syst. Technol. 2024. Available online: http://kns.cnki.net/kcms/detail/44.1643.tk.20240730.1606.015.html (accessed on 27 January 2025).
  21. Baran, M.E.; Wu, F.F. Optimal capacitor placement on radial distribution systems. IEEE Trans. Power Deliv. 1989, 4, 725–734. [Google Scholar] [CrossRef]
  22. Mirjalili, S.; Lewis, A. The whale optimization algorithm. Adv. Eng. Softw. 2016, 95, 51–67. [Google Scholar] [CrossRef]
  23. Wu, X.L.; Hu, S.; Cheng, W. Multi-Objective Signal Timing Optimization Based on Improved Whale Optimization Algorithm. J. Kunming Univ. Sci. Technol. (Nat. Sci.) 2021, 46, 134–141. [Google Scholar]
  24. Ji, H.; Wang, C.; Li, P.; Zhao, J.; Song, G.; Wu, J. Quantified flexibility evaluation of soft open points to improve distributed generator penetration in active distribution networks based on difference-of-convex programming. Appl. Energy 2018, 218, 338–348. [Google Scholar] [CrossRef]
  25. Shi, Z.; Xu, Y.; Li, Z.; Xie, D.; Ghias, A.M.M. Resilience enhancement of a multi-energy distribution system via joint network reconfiguration and mobile sources scheduling. CSEE J. Power Energy Syst. 2024, 12, 1–12. [Google Scholar] [CrossRef]
Figure 1. Basic structure of E-SOP.
Energies 18 00954 g001
Figure 2. Optimization results of different algorithms on Test Function 1.
Energies 18 00954 g002
Figure 3. Optimization results of different algorithms on Test Function 2.
Energies 18 00954 g003
Figure 4. Optimization results of different algorithms on Test Function 3.
Energies 18 00954 g004
Figure 5. Flowchart of power supply restoration process based on E-SOP.
Energies 18 00954 g005
Figure 6. Topology of IEEE 33-node test system.
Energies 18 00954 g006
Figure 7. Modified test system topology with E-SOP.
Energies 18 00954 g007
Figure 8. Network configuration diagram of Case 2.
Energies 18 00954 g008
Figure 9. Node voltage distribution under different scenarios.
Energies 18 00954 g009
Figure 10. Modified test system topology with DG integration.
Energies 18 00954 g010
Figure 11. Node voltage distribution under different scenarios with DG integration.
Energies 18 00954 g011
Table 1. Optimization results for each algorithm.
AlgorithmBest Obtained ValueWorst Obtained ValueMean ValueStandard Deviation
IWOA0000
f1WOA5.84 × 10−841.42 × 10−721.35 × 10−73 4.12 × 10−73
PSO351.17 × 103 4.35 × 1022.73 × 102
IWOA0000
f2WOA3.54 × 10−576.1 × 10−503.61 × 10−511.35 × 10−50
PSO6.6347.720.511.5
IWOA0000
f3WOA0000
PSO1.56 × 1022.46 × 1021.95 × 102 26.8
Table 2. Distribution network power supply restoration results.
CasePower Outage/kWRestored Load/kWRecovery Rate/%Computation Time/sPower Loss Node
1 620.030.170.557–11, 13–18, 31–33
2 1275.062.040.709, 13–18, 32, 33
3 1373.566.840.5614–18, 32, 33
420551432.369.702.498, 12, 13, 15, 17, 28, 29
5 1510.173.482.4412, 15–18, 27, 31
6 1642.279.912.3711, 13, 15, 17, 27, 29
Table 3. PV integration locations and power ratings.
Node71727
Load/kW300200200
Table 4. Power supply restoration results after DG integration.
CasePower Outage/kWRestored Load/kWRecovery Rate/%
1 815.046.97
2 1425.069.34
3 1489.672.49
420551733.684.36
5 1850.390.04
6 1911.293.0
Table 5. Summary of operational results from different algorithms.
CaseBest Obtained Value/%Mean Value/%Standard Deviation
484.3680.34.55
590.0486.52.47
693.091.21.77
Disclaimer/Publisher’s Note: The statements, opinions and data contained in all publications are solely those of the individual author(s) and contributor(s) and not of MDPI and/or the editor(s). MDPI and/or the editor(s) disclaim responsibility for any injury to people or property resulting from any ideas, methods, instructions or products referred to in the content.

