Article

Federated Learning and Neural Circuit Policies: A Novel Framework for Anomaly Detection in Energy-Intensive Machinery

1
Dipartimento di Scienze Sociali Potiche e Cognitive, Università degli Studi di Siena, 53100 Siena, Italy
2
Sunlink Srl, 55100 Lucca, Italy
3
Dipartimento di Ingegneria dell’Informazione e Scienze Matematiche, Università degli Studi di Siena, 53100 Siena, Italy
*
Author to whom correspondence should be addressed.
Energies 2025, 18(4), 936; https://doi.org/10.3390/en18040936
Submission received: 21 November 2024 / Revised: 17 December 2024 / Accepted: 13 February 2025 / Published: 15 February 2025
(This article belongs to the Section A3: Wind, Wave and Tidal Energy)

Abstract

:
In the realm of predictive maintenance for energy-intensive machinery, effective anomaly detection is crucial for minimizing downtime and optimizing operational efficiency. This paper introduces a novel approach that integrates federated learning (FL) with Neural Circuit Policies (NCPs) to enhance anomaly detection in compressors utilized in leather tanning operations. Unlike traditional Long Short-Term Memory (LSTM) networks, which rely heavily on historical data patterns and often struggle with generalization, NCPs incorporate physical constraints and system dynamics, resulting in superior performance. Our comparative analysis reveals that NCPs significantly outperform LSTMs in accuracy and interpretability within a federated learning framework. This innovative combination not only addresses pressing data privacy concerns but also facilitates collaborative learning across decentralized data sources. By showcasing the effectiveness of FL and NCPs, this research paves the way for advanced predictive maintenance strategies that prioritize both performance and data integrity in energy-intensive industries.

1. Introduction

In recent years, the field of predictive maintenance has gained significant attention, particularly in industries where energy-intensive machinery plays a critical role. The ability to detect anomalies in equipment performance not only enhances operational efficiency but also reduces downtime and maintenance costs. This is especially pertinent in the leather tanning industry, where compressors are essential for various processes, consuming substantial energy and requiring meticulous monitoring to ensure optimal performance, as studies such as [1,2,3] witness. As the demand for sustainable practices increases, leveraging advanced machine learning techniques for predictive maintenance becomes a compelling need [4,5].
Federated learning (FL), first proposed by McMahan et al. [6], presents a novel paradigm that addresses the challenges associated with centralized data collection, particularly in industries where data privacy and security are paramount. By allowing multiple decentralized devices to collaboratively learn a shared model while keeping their data local, FL mitigates privacy concerns and reduces the risk of data breaches and increases learning efficiency [7,8,9,10,11].
This approach is particularly relevant for anomaly detection in energy-intensive systems, where sensitive operational data must be safeguarded. The integration of FL into predictive maintenance frameworks enables organizations to harness the collective intelligence of multiple machines without compromising data integrity.
Traditional approaches to anomaly detection often rely on recurrent neural networks (RNNs), such as Long Short-Term Memory (LSTM) networks [12]. While LSTMs have proven effective in capturing temporal dependencies within time-series data, they are inherently limited by their reliance on synthetic learning from historical patterns. This can lead to challenges in generalizing across varying operational conditions, especially when physical constraints govern system behavior. In contrast, Neural Circuit Policies (NCPs) offer a more sophisticated alternative by incorporating knowledge of physical limits and system dynamics into the learning process. NCPs leverage continuous-time modeling through ordinary differential equations (ODEs), enabling them to interpret system states more naturally and effectively.
The key innovation of this research lies in comparing the performance of NCPs with traditional LSTM methods in the context of anomaly detection for compressors used in leather tanning facilities. By demonstrating that NCPs outperform LSTMs due to their enhanced understanding of physical constraints, this study contributes to the growing body of literature advocating for more interpretable and robust machine learning models in industrial applications.
The implications of this research extend beyond theoretical advancements; they hold practical significance for industries reliant on energy-intensive machinery. As manufacturers strive to optimize resource utilization and minimize operational disruptions, implementing advanced predictive maintenance strategies becomes essential. The findings from this study will not only provide insights into the efficacy of NCPs over LSTMs but also pave the way for future research aimed at integrating federated learning frameworks with advanced machine learning techniques for real-time anomaly detection.
In this study, we aim to estimate the optimal value of the apparatus to maximize operational performance. It is important to clarify that, while anomaly detection may represent a relevant aspect, our primary focus is not just on it. In fact, we do not intend to conduct a direct comparison on the ability to detect anomalies, but rather to analyze key operational metrics such as energy consumption and reactive power. These parameters can serve as indicators of anomalies and are essential for assessing the operational efficiency of the apparatus. Indeed, our ultimate goal is to prevent anomalies before they occur, rather than merely detecting them after the fact.
As a consequence, our attention is directed towards estimating the evolution of crucial operational metrics to ensure optimal functioning of the apparatus, including anomaly detection. This approach opens us up to comparisons with models that integrate data from other sensors, such as temperature and vibration sensors, always with the goal of evaluating the optimal state of the equipment.
Thus, this paper seeks to illuminate the potential of federated learning combined with Neural Circuit Policies as a transformative approach to predictive maintenance in energy-intensive sectors. By focusing on compressors within leather tanning operations, we aim to contribute valuable knowledge that enhances both operational efficiency and sustainability in industrial practices.
This paper is structured as follows. Section 2 discusses the related work in anomaly detection and predictive maintenance. Section 3 details the dataset and the simulation setup. Moreover, it describes the methodology, including the implementation of LSTM and NCP models. Section 4 presents and discusses the experimental results. Finally, Section 5 collects some conclusions and delineates potential future perspectives.

2. Related Works in the Energy Domain

The intersection of anomaly detection and predictive maintenance has garnered significant attention in recent years, particularly in the context of energy-intensive machinery, such as compressors used in leather tanning industries. This section reviews the relevant literature that explores various methodologies, including federated learning, Long Short-Term Memory networks, and Neural Circuit Policies, emphasizing their application in predictive maintenance frameworks.
One of the pioneering works in this area is the study by [13], which investigated the use of LSTM networks for anomaly detection in industrial settings. The authors demonstrate that LSTMs can effectively model time-series data to predict equipment failures, thereby enhancing predictive maintenance strategies. However, they also acknowledge the limitations of LSTMs in capturing complex physical behaviors inherent in machinery operation.
In contrast, Hasani et al. [14] introduced Neural Circuit Policies as a novel approach that integrates knowledge of physical constraints into the learning process. Their research highlights how NCPs outperform traditional methods such as LSTMs by providing a more robust framework for understanding system dynamics. This capability is particularly beneficial for predictive maintenance applications where equipment behavior is influenced by various operational factors. Loy-Benitez et al. [15] studied the use of NCPs in predicting the concentration of PM 2.5 from measurements of outdoor and indoor air variables and show that NCPs yield the most accurate predictions compared to other neural methods, including LSTMs. Palma et al. [16] investigated their effectiveness in forecasting time series data for energy production and consumption and demonstrate that NCPs outperform LSTM networks offering superior predictive maintenance solutions.
The application of federated learning in predictive maintenance has also been explored extensively. For instance, ref. [17] proposed a federated learning framework that allows multiple devices to collaboratively learn from local data without compromising privacy. This approach is particularly relevant for industries where data security is paramount, such as leather tanning facilities. The authors demonstrate that federated learning can enhance anomaly detection capabilities while maintaining compliance with data protection regulations. Jithish et al. [18] and Shrestha et al. [19] implemented FL-based models, including LSTMs, to detect anomalous behaviors in a smart grid and show that the proposed architectures perform efficiently in terms of memory, CPU usage, bandwidth and power consumption. Federated LSTMs yield good performance also in predicting capacity degradation of lithium-ion batteries [20], dynamic processes in polymers [21], and cryptocurrency prices [22].
Moreover, a recent study by [23] emphasized the importance of real-time data analysis in predictive maintenance for distributed energy resources. The authors discuss how advanced machine learning techniques, including anomaly detection algorithms, can proactively identify potential issues before they escalate into costly failures. This aligns with the objectives of this paper, which seeks to leverage similar methodologies for compressors in leather tanning operations.
Thus, while traditional methods like LSTMs have laid the groundwork for anomaly detection in predictive maintenance, emerging approaches such as NCPs and federated learning present promising alternatives that address some of the inherent limitations of earlier models. This paper aims to build upon these foundational works by comparing the efficacy of NCPs against LSTMs within a federated learning framework specifically tailored for compressors used in leather tanning processes.

Research Gaps and Contributions

While the fields of anomaly detection and predictive maintenance have made significant strides, several research gaps remain unaddressed, particularly in the context of energy-intensive machinery such as compressors in the leather tanning industry:
  • Limited integration of physical constraints in machine learning models: Traditional methods like LSTM networks focus primarily on historical data patterns and often fail to account for the physical constraints and dynamics governing real-world machinery. This limitation can hinder generalization and interpretability across varying operational conditions.
  • Privacy concerns in centralized data collection: Most existing predictive maintenance frameworks rely on centralized data aggregation, raising significant privacy and security concerns, particularly in industrial settings where sensitive operational data is involved.
  • Lack of exploration of Federated Learning for industrial anomaly detection: Despite its potential to address data privacy challenges, FL remains underexplored in the context of energy-intensive systems, particularly in combination with advanced machine learning techniques such as NCPs.
  • Comparative analysis of NCPs and LSTMs in industrial applications: While NCPs have shown promise in various domains, their efficacy compared to traditional methods like LSTMs for anomaly detection in industrial machinery, specifically compressors, has not been systematically evaluated.
To address these gaps, this paper makes the following contributions:
  • We propose the integration of NCPs into predictive maintenance frameworks, demonstrating their ability to incorporate physical constraints and system dynamics for improved anomaly detection in energy-intensive machinery.
  • We leverage FL to enable collaborative learning across decentralized data sources, thereby enhancing anomaly detection while addressing data privacy and security concerns.
  • We conduct a comprehensive comparative analysis of NCPs and LSTMs, evaluating their performance in detecting anomalies in compressors used within leather tanning operations. Our results show that NCPs significantly outperform LSTMs in terms of accuracy and interpretability.
  • We validate the proposed approach through real-world simulations and datasets, highlighting its practical relevance and potential for application in industrial settings.
This research not only bridges existing gaps but also paves the way for advanced predictive maintenance strategies that prioritize performance, interpretability, and data integrity in energy-intensive industries.
Thus, while this paper addresses critical research gaps in anomaly detection and predictive maintenance for energy-intensive machinery, it is essential to underscore that our primary objective extends beyond mere detection. We aim to develop strategies that not only identify potential anomalies but also proactively prevent them from occurring. By focusing on the integration of physical constraints and advanced machine learning techniques, we seek to create a framework that enhances operational efficiency and sustainability. This approach aligns with the broader goal of predictive maintenance, which is to ensure optimal performance and reliability of industrial systems, ultimately reducing downtime and maintenance costs.

3. Materials and Methods

In this section, we outline the materials and methods employed in our study to evaluate the effectiveness of Neural Circuit Policies compared to Long Short-Term Memory networks within a federated learning framework for anomaly detection in compressors. We begin with a detailed description of the dataset used for training and testing our models in Section 3.1.
Following this, Section 3.2 presents the model architectures, focusing on the mathematical formulations and structural designs of the federated learning system, NCPs, and LSTMs. This comparison highlights how NCPs, grounded in differential equations, leverage a deeper understanding of the dynamics of a physical system, resulting in superior performance in detecting anomalies compared to traditional LSTM models.

3.1. Dataset Description

The dataset employed in this study consists of operational data collected from four compressors at a leather tanning facility located in Santa Croce sull’Arno, Italy. This facility was selected due to its significant energy consumption and the critical role that compressors play in its production processes. The choice of compressors with similar functions and characteristics ensures that our findings are relevant and can be generalized across comparable industrial settings.
Data collection was conducted with an hourly granularity, which is crucial for enabling timely interventions and facilitating a thorough analysis of energy consumption trends throughout the day. This level of detail allows for the identification of patterns that may indicate potential anomalies, thereby enhancing our predictive maintenance capabilities. The specific timeframe for data collection spans from March to June 2024. This period was chosen because it reflects full operational capacity, as the facility tends to operate at reduced levels during the summer months due to employee holidays. Consequently, data from March to June provide a more accurate representation of normal operational conditions, making it ideal for training and testing our models.
The dataset comprises several critical features that are instrumental in assessing compressor performance and detecting anomalies such as current (A), power factor (CosPhi), energy consumption (kWh), reactive energy (VARh), and voltage (V) (see Table 1).
These features are critical for our anomaly detection framework. For example, monitoring current levels helps identify deviations that may indicate potential electrical issues or inefficiencies in compressor operation. The power factor is particularly important as it reflects how effectively the compressors convert electrical energy into mechanical work; a low power factor could signal underlying problems that require attention. Energy consumption metrics provide insights into operational trends, enabling us to detect anomalies that could lead to costly downtimes or maintenance needs.
In addition to their role in detecting anomalies, these features are integral to our overarching goal of preventing issues before they arise. By closely monitoring current levels, power factor, and energy consumption metrics, we can not only identify existing inefficiencies but also predict potential failures. This proactive approach enables us to implement maintenance strategies that address issues early on, thereby minimizing the risk of costly downtimes and enhancing the overall reliability of compressor operations.
By utilizing this comprehensive dataset, our research aims to develop a robust predictive maintenance framework that enhances the reliability and efficiency of compressors in energy-intensive industrial applications. The integration of these features into our machine learning models will allow for a nuanced understanding of compressor behavior, ultimately contributing to improved operational performance, reduced maintenance costs, optimizing performance and sustainability, and ensuring that compressors operate within their ideal parameters and reducing the likelihood of unexpected breakdowns.

3.1.1. Data Pre-Processing

Data pre-processing is an essential phase in preparing the dataset for effective anomaly detection and predictive maintenance analysis. In this study, we structured our pre-processing efforts into two main phases: the aggregation of individual measurements from each compressor (Section Aggregation of Individual Measurements from Each Compressor) and the correction of anomalous values (Section Correction of Anomalous Values).

Aggregation of Individual Measurements from Each Compressor

The first phase involved began by establishing a comprehensive time frame for data collection, spanning from 17 March 2024 to 24 June 2024. As already said, this period was selected to capture full-capacity operational conditions, as the facility typically experiences reduced activity during the summer months due to employee vacations. By focusing on this time frame, we ensured that the dataset reflects normal operating behavior, which is crucial for training our predictive models.
Each compressor’s data were stored in a dictionary, where each key corresponds to a compressor name and each value contains a list of DataFrames representing individual measurements. This structure allows for efficient access and manipulation of data.
To ensure data integrity, we conducted several checks on the loaded datasets. We examined each measurement for duplicate timestamps and missing values (NaNs). These checks are crucial as duplicates can lead to erroneous conclusions about equipment performance, while missing values can disrupt model training and evaluation. The results of these integrity checks were compiled into DataFrames for easy reference and analysis. No dataset had either duplicates or missing values.
Following the integrity checks, we proceeded with the aggregation of measurements. We modified the names of the measurements to include their respective units for clarity and consistency. To facilitate analysis across all compressors, we generated a comprehensive timestamp index covering every hour within our specified date range. This ensured that all compressors had aligned time series data, making it easier to compare performance metrics across machines.
Finally, we saved the aggregated datasets for each compressor into a dictionary of DataFrames indexed by the machines’ names for further analysis. This structured approach to data pre-processing not only enhances the quality of our dataset but also lays a solid foundation for subsequent modeling efforts aimed at detecting anomalies in compressor operations. By ensuring that our data are clean, consistent, and well organized, we increase the reliability of our predictive maintenance framework and its ability to identify potential issues proactively.

Correction of Anomalous Values

The correction of anomalous values is a critical step in ensuring the reliability and the accuracy of the dataset used for predictive maintenance analysis. In this study, we focused on identifying and addressing outliers in key performance metrics for the compressors, specifically targeting the columns related to energy consumption and reactive energy.
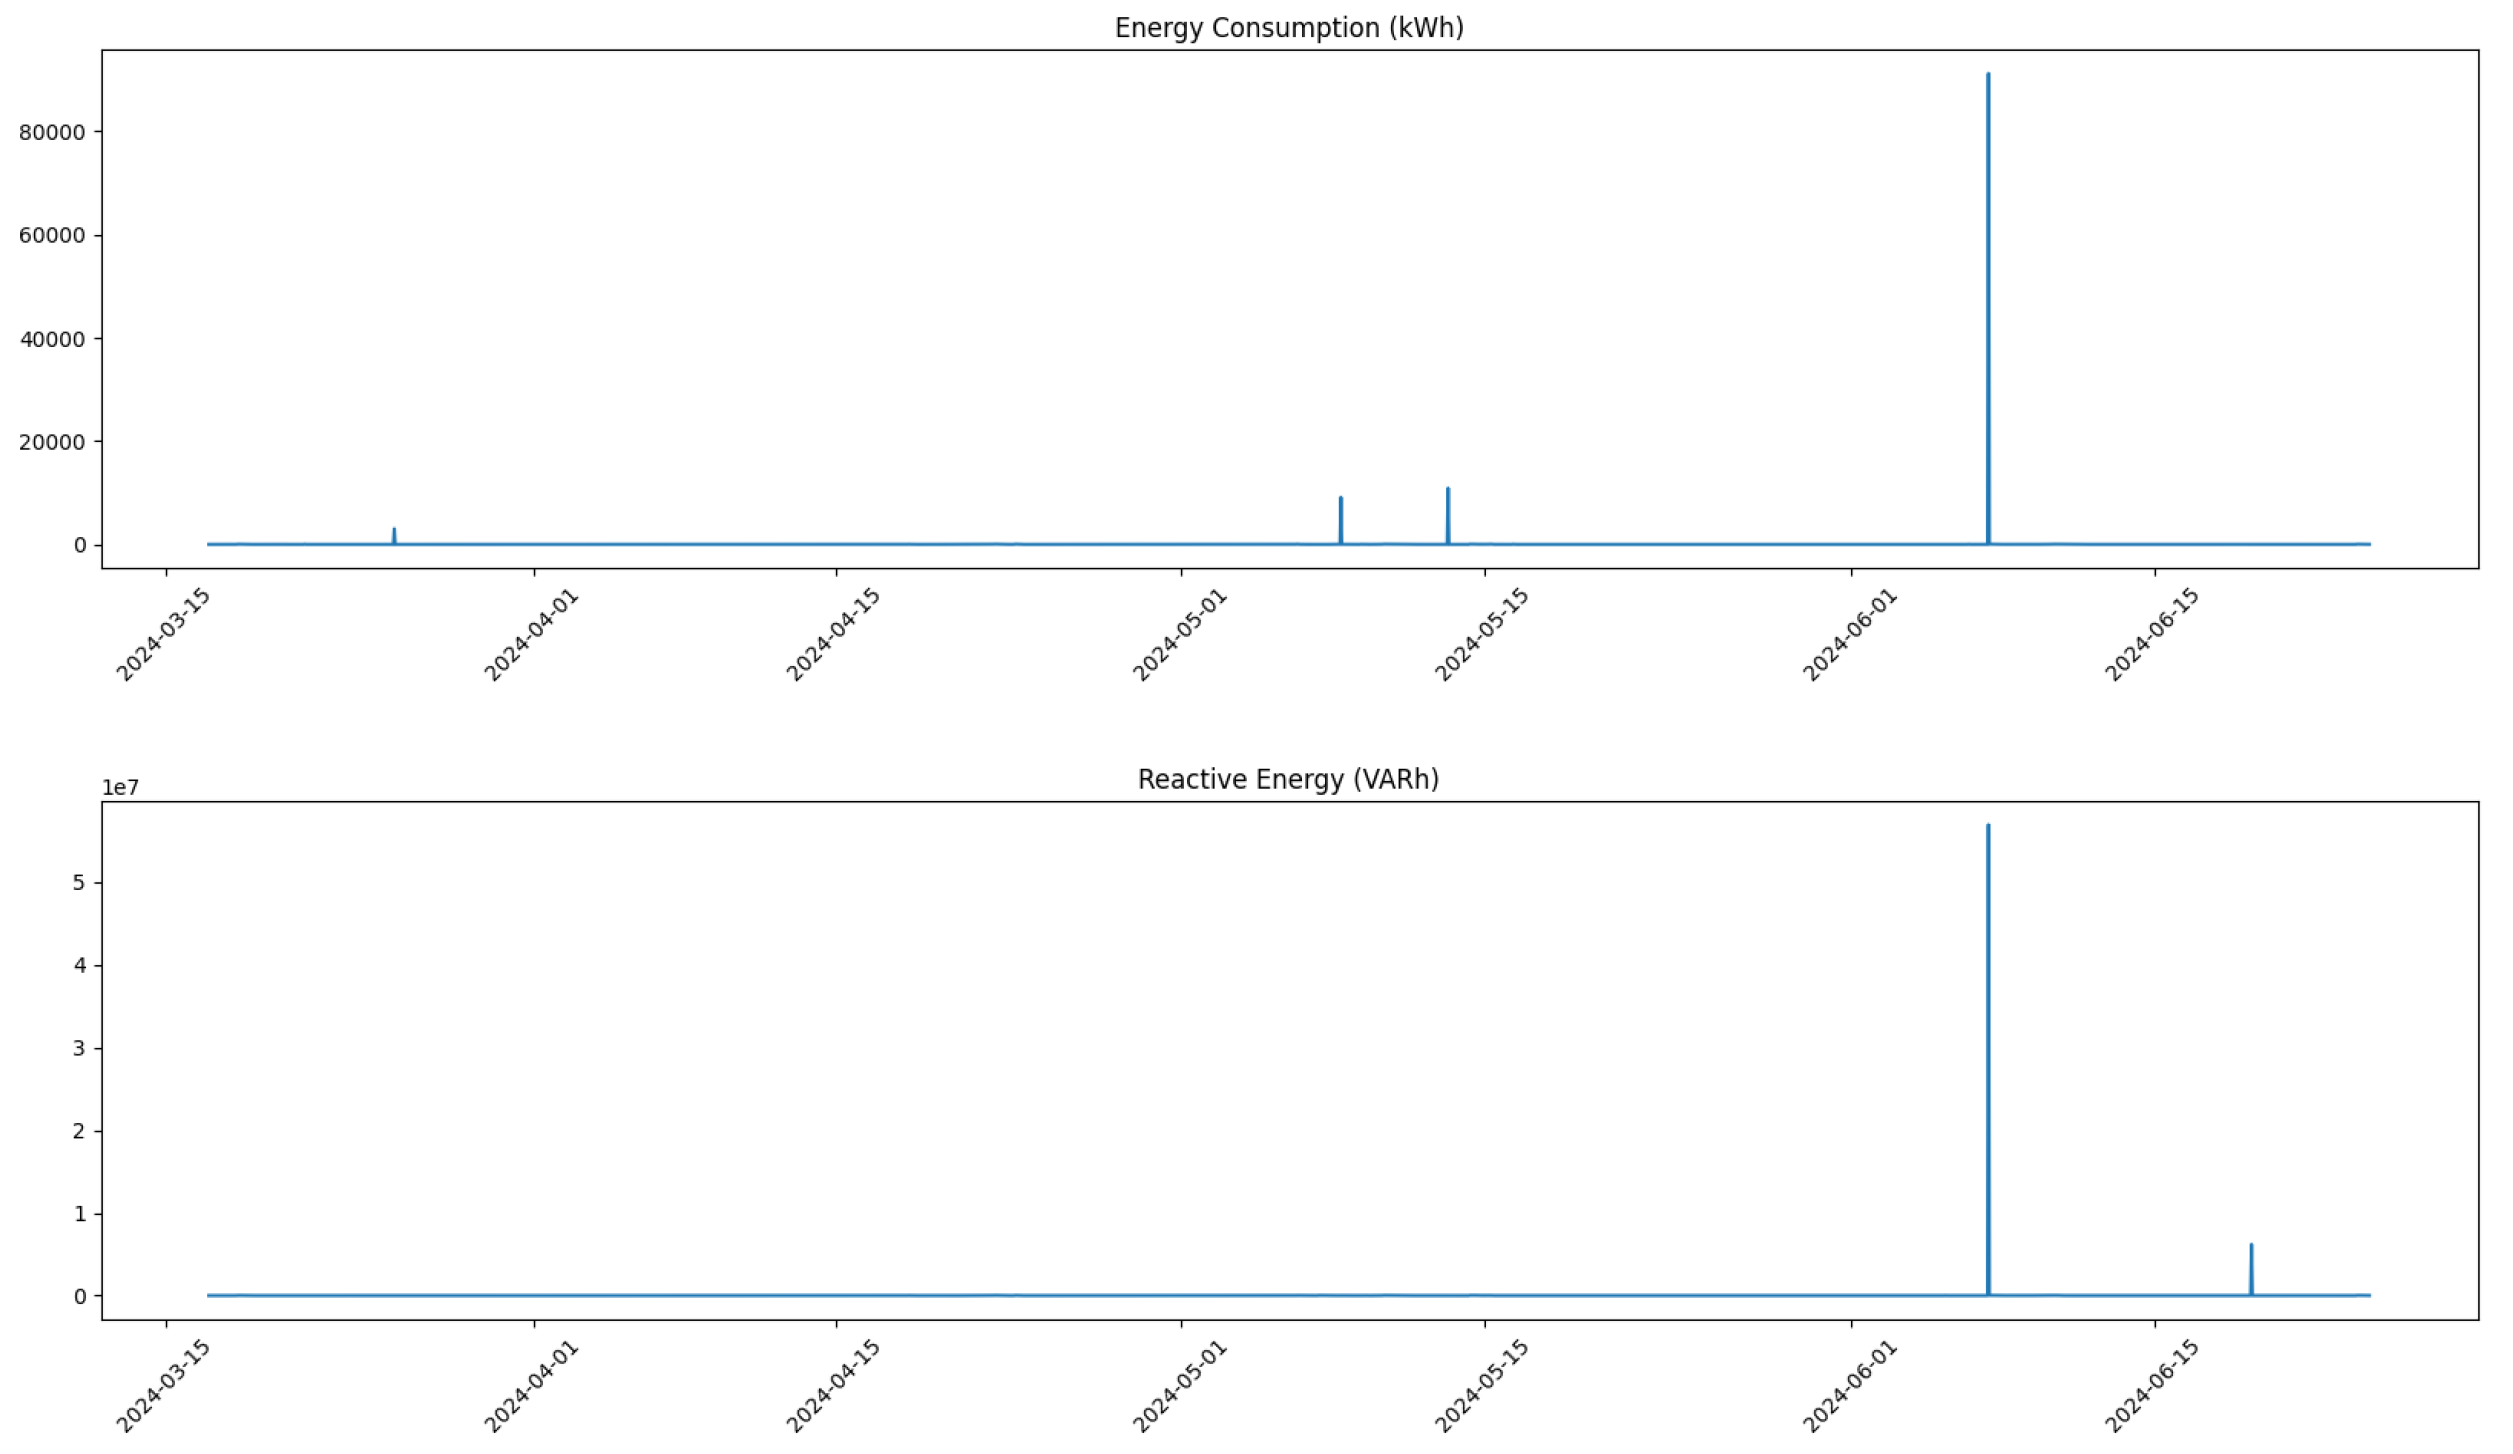
After data aggregation, we visualized the data of each column through plots. This not only provided insight into the overall trends and patterns but also helped the visual identification of potential outliers. Each feature was plotted against time, allowing us to observe fluctuations and irregularities that could indicate anomalous behavior.
For specific columns identified as problematic—namely, Energy Consumption (kWh) and Reactive Energy (VARh)—we established thresholds to define what constituted an anomalous value. For instance, any energy consumption exceeding 200 kWh or reactive energy exceeding 100,000 VARh was flagged as an outlier. This thresholding approach is grounded in domain knowledge regarding expected operational ranges for compressors; values outside these limits are likely indicative of sensor errors or abnormal operating conditions.
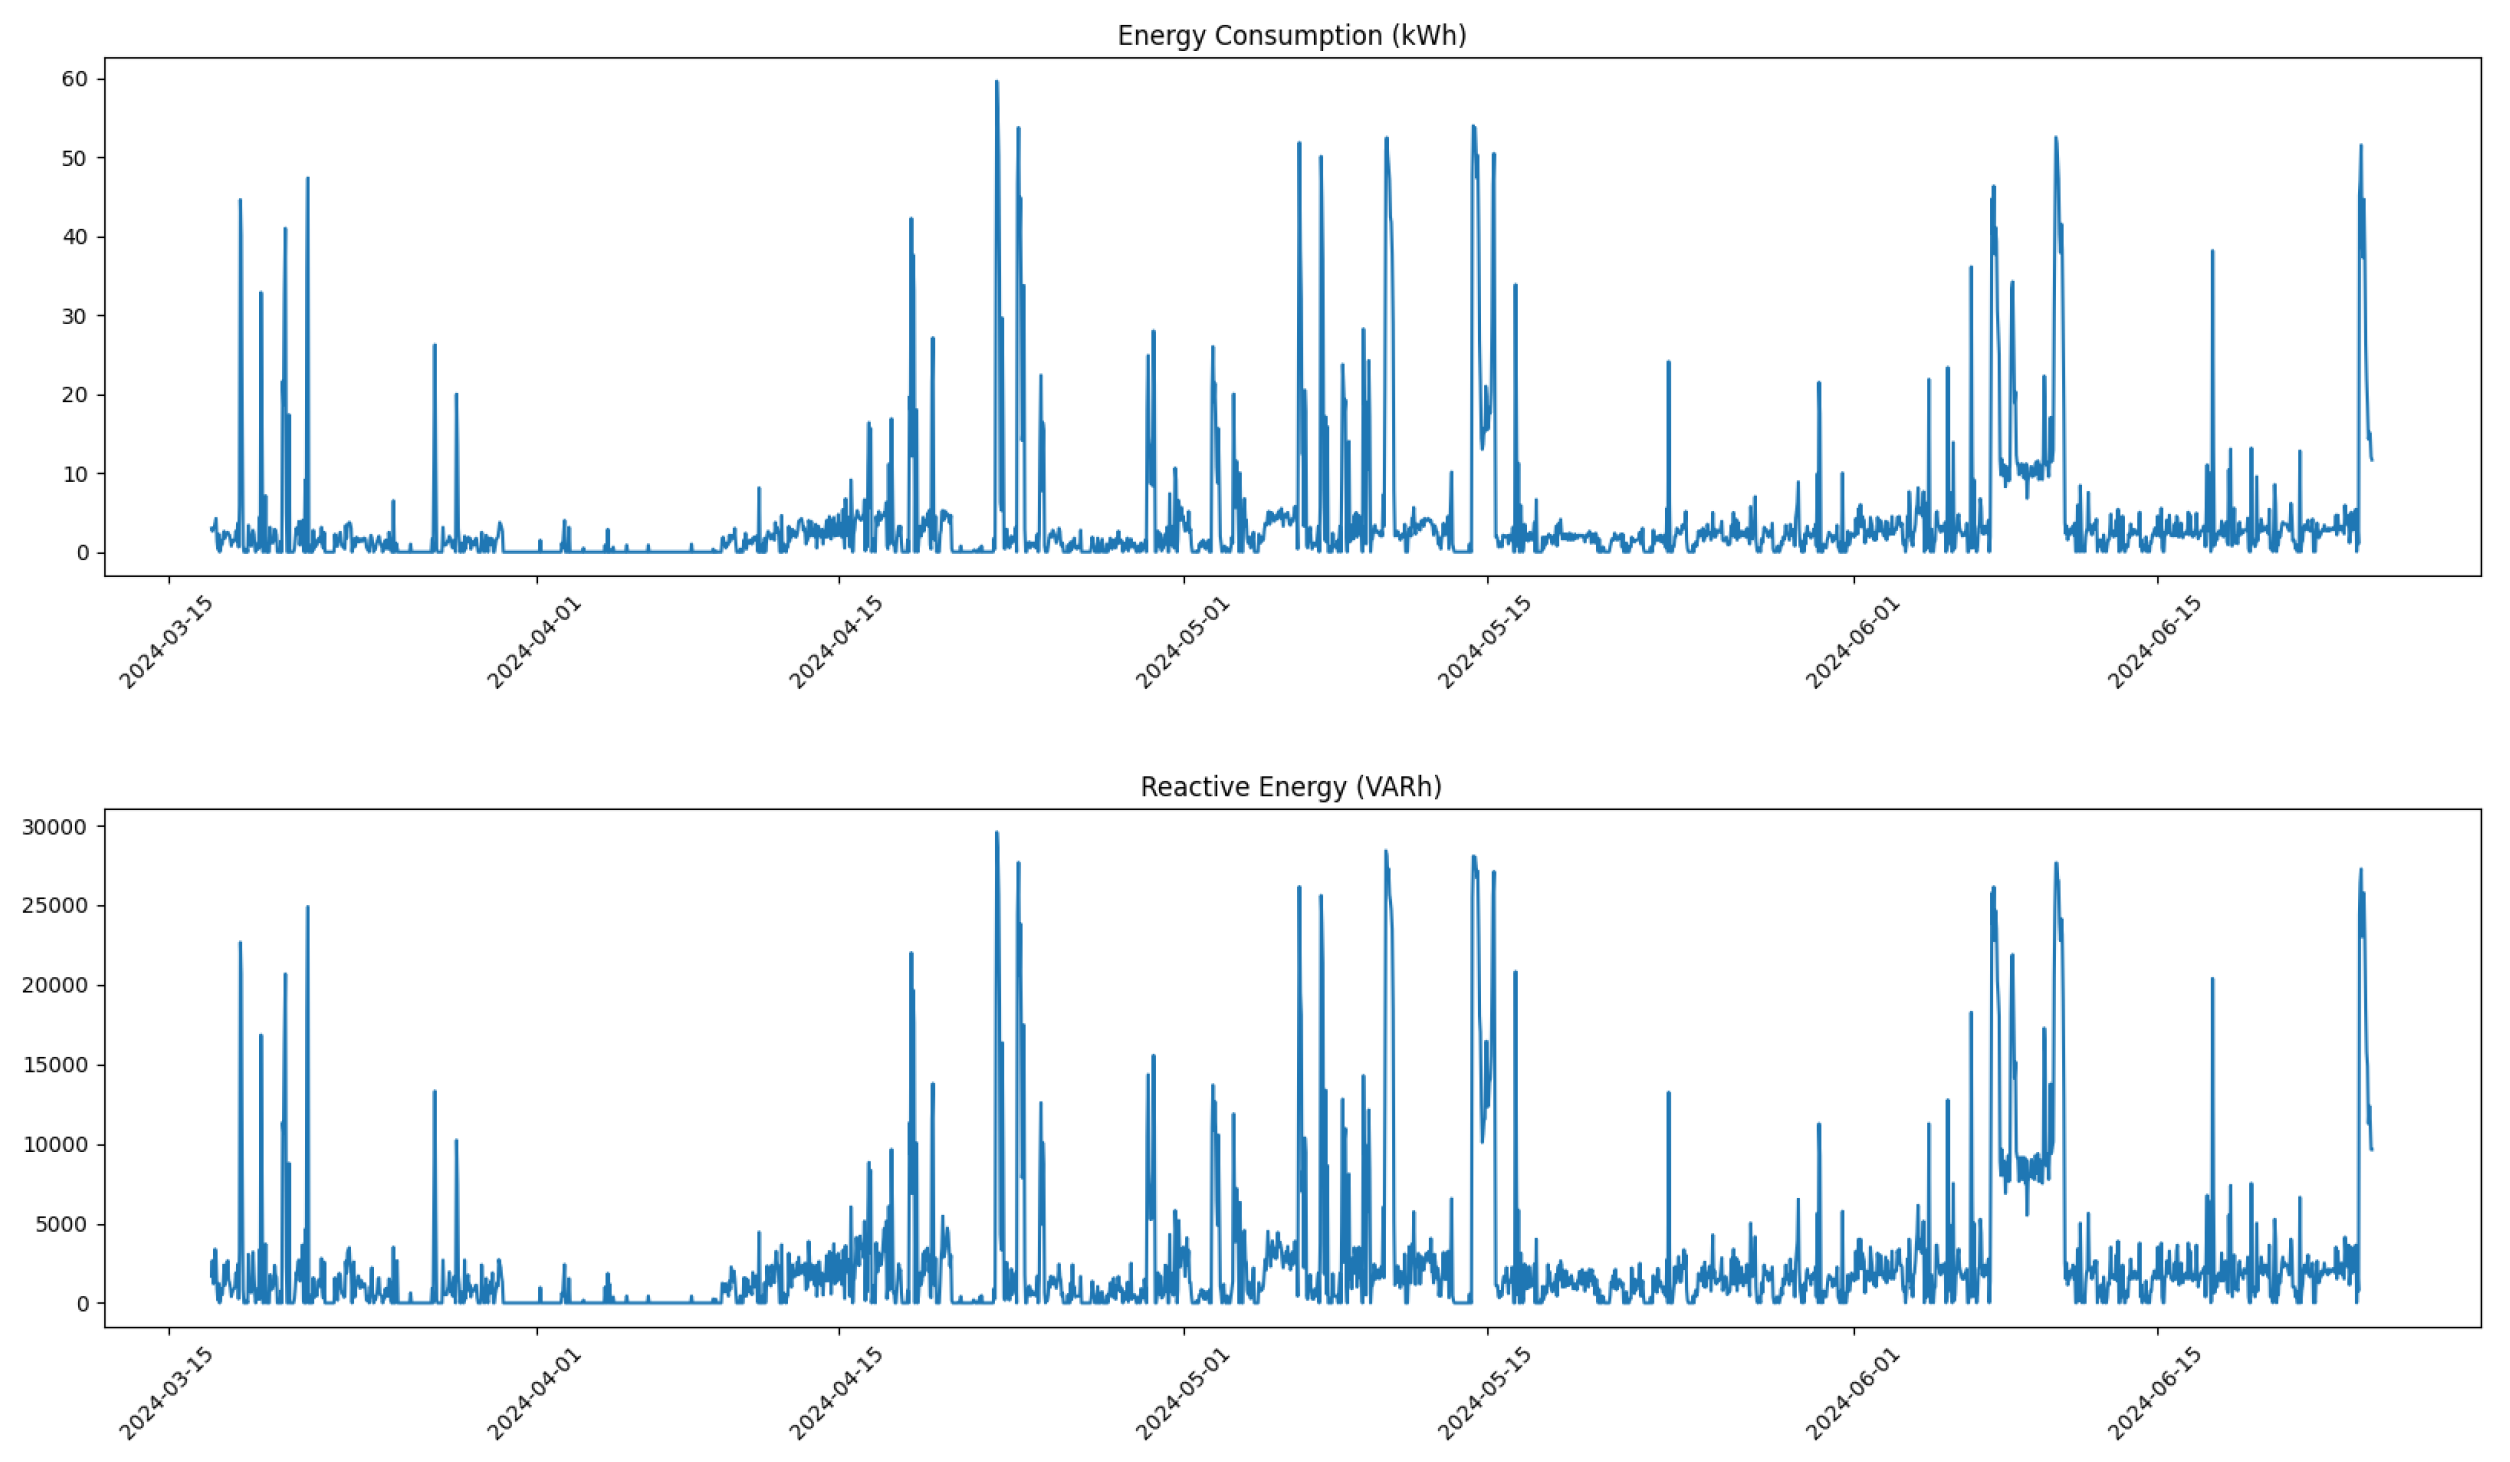
Once outliers were identified, we replaced them with NaN values to be filled using linear interpolation. This process ensures that our dataset remains robust while minimizing the impact of erroneous readings on our predictive models. Figure 1 and Figure 2 illustrate these distributions before and after the process of outliers removing.
Finally, after correcting for anomalies and ensuring data integrity, we saved each dataset into a separate Excel file for further use. By implementing these rigorous correction methods and visualizing both pre- and post-correction distributions, we enhance the quality of our dataset, thereby increasing the reliability of our predictive maintenance framework and its ability to detect potential issues within compressor operations effectively.
Thus, as part of the pre-processing phase, we performed a removal of certain outliers corresponding to physically implausible values of reactive energy and energy consumption for the machinery. These outliers were identified based on domain knowledge and statistical analysis. After removing these outliers, we filled in the gaps using linear interpolation, which helped maintain the continuity of the dataset while ensuring that the corrected values remained within a reasonable range.
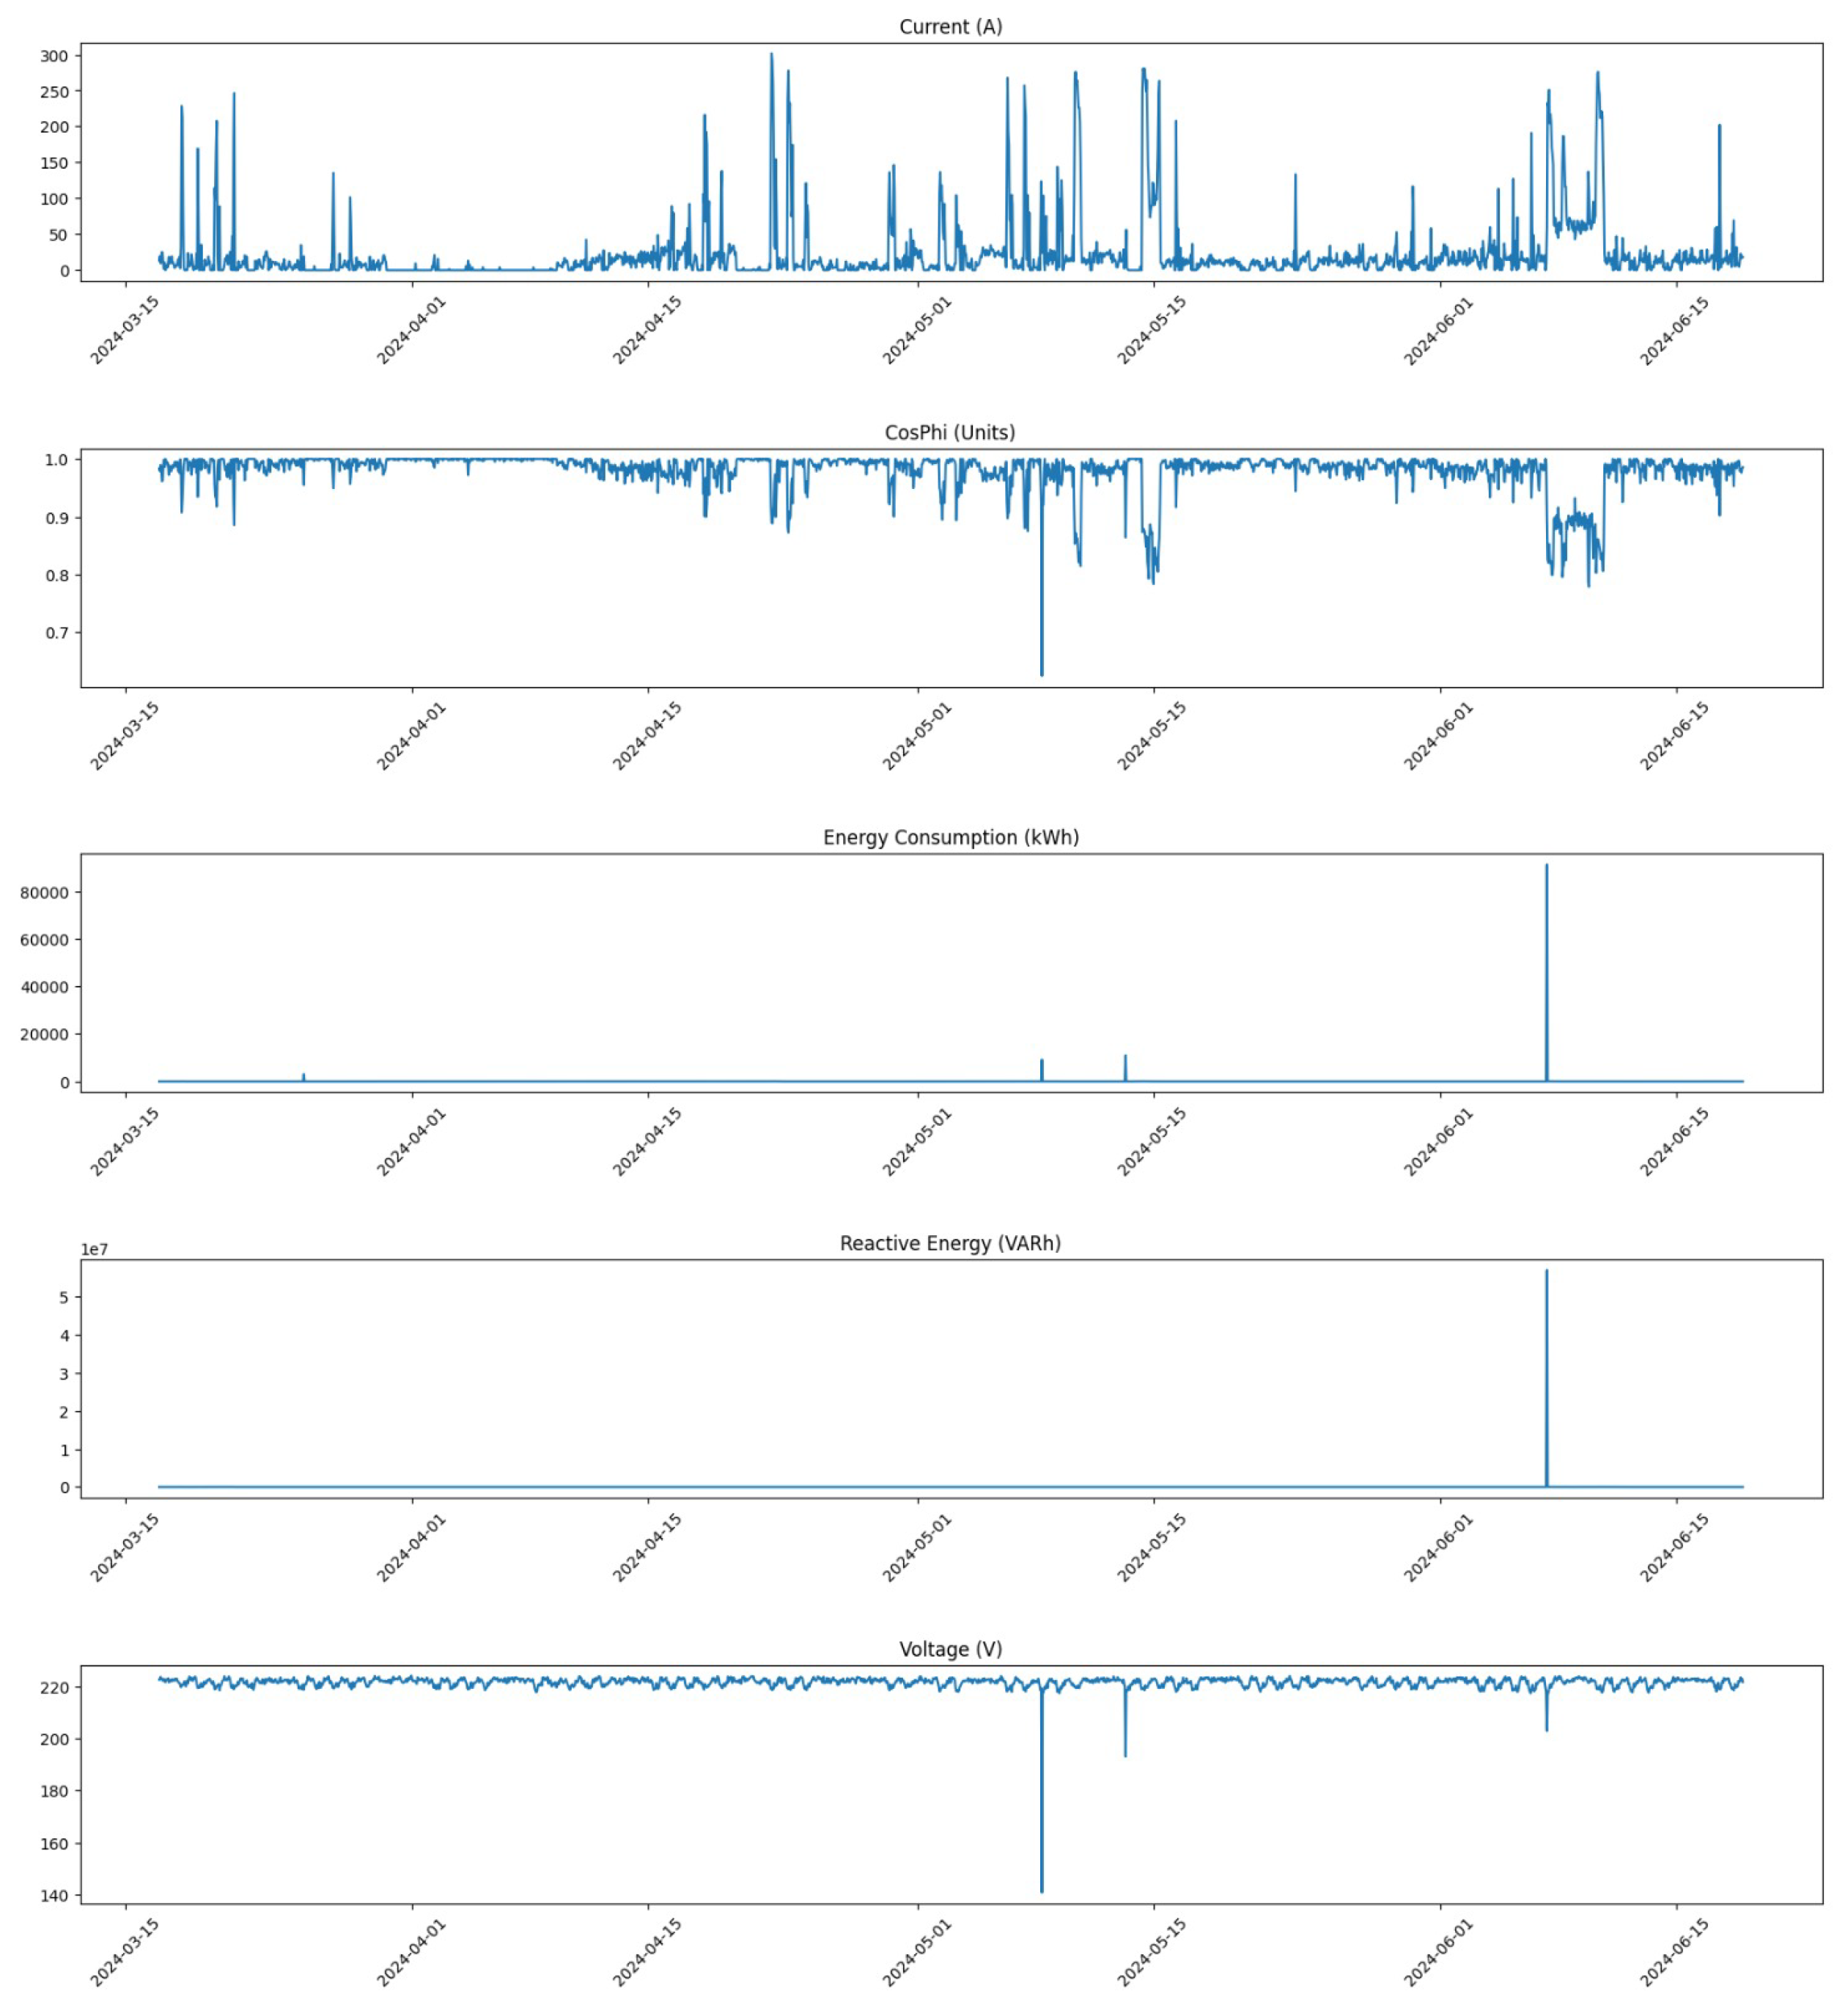
To illustrate the impact of these pre-processing steps, we present several figures showing the distribution of data for Compressor 1 before and after correction.
In Figure 3, we show the distribution of all feature values for Compressor 1 prior to any corrections. This figure highlights the presence of outliers that may skew analysis and predictions.
Following the correction process, Figure 4 illustrates the distribution of all feature values for Compressor 1 after corrections were applied. The removal of outliers and the application of linear interpolation result in a more normalized distribution, which is crucial for reliable predictive modeling.
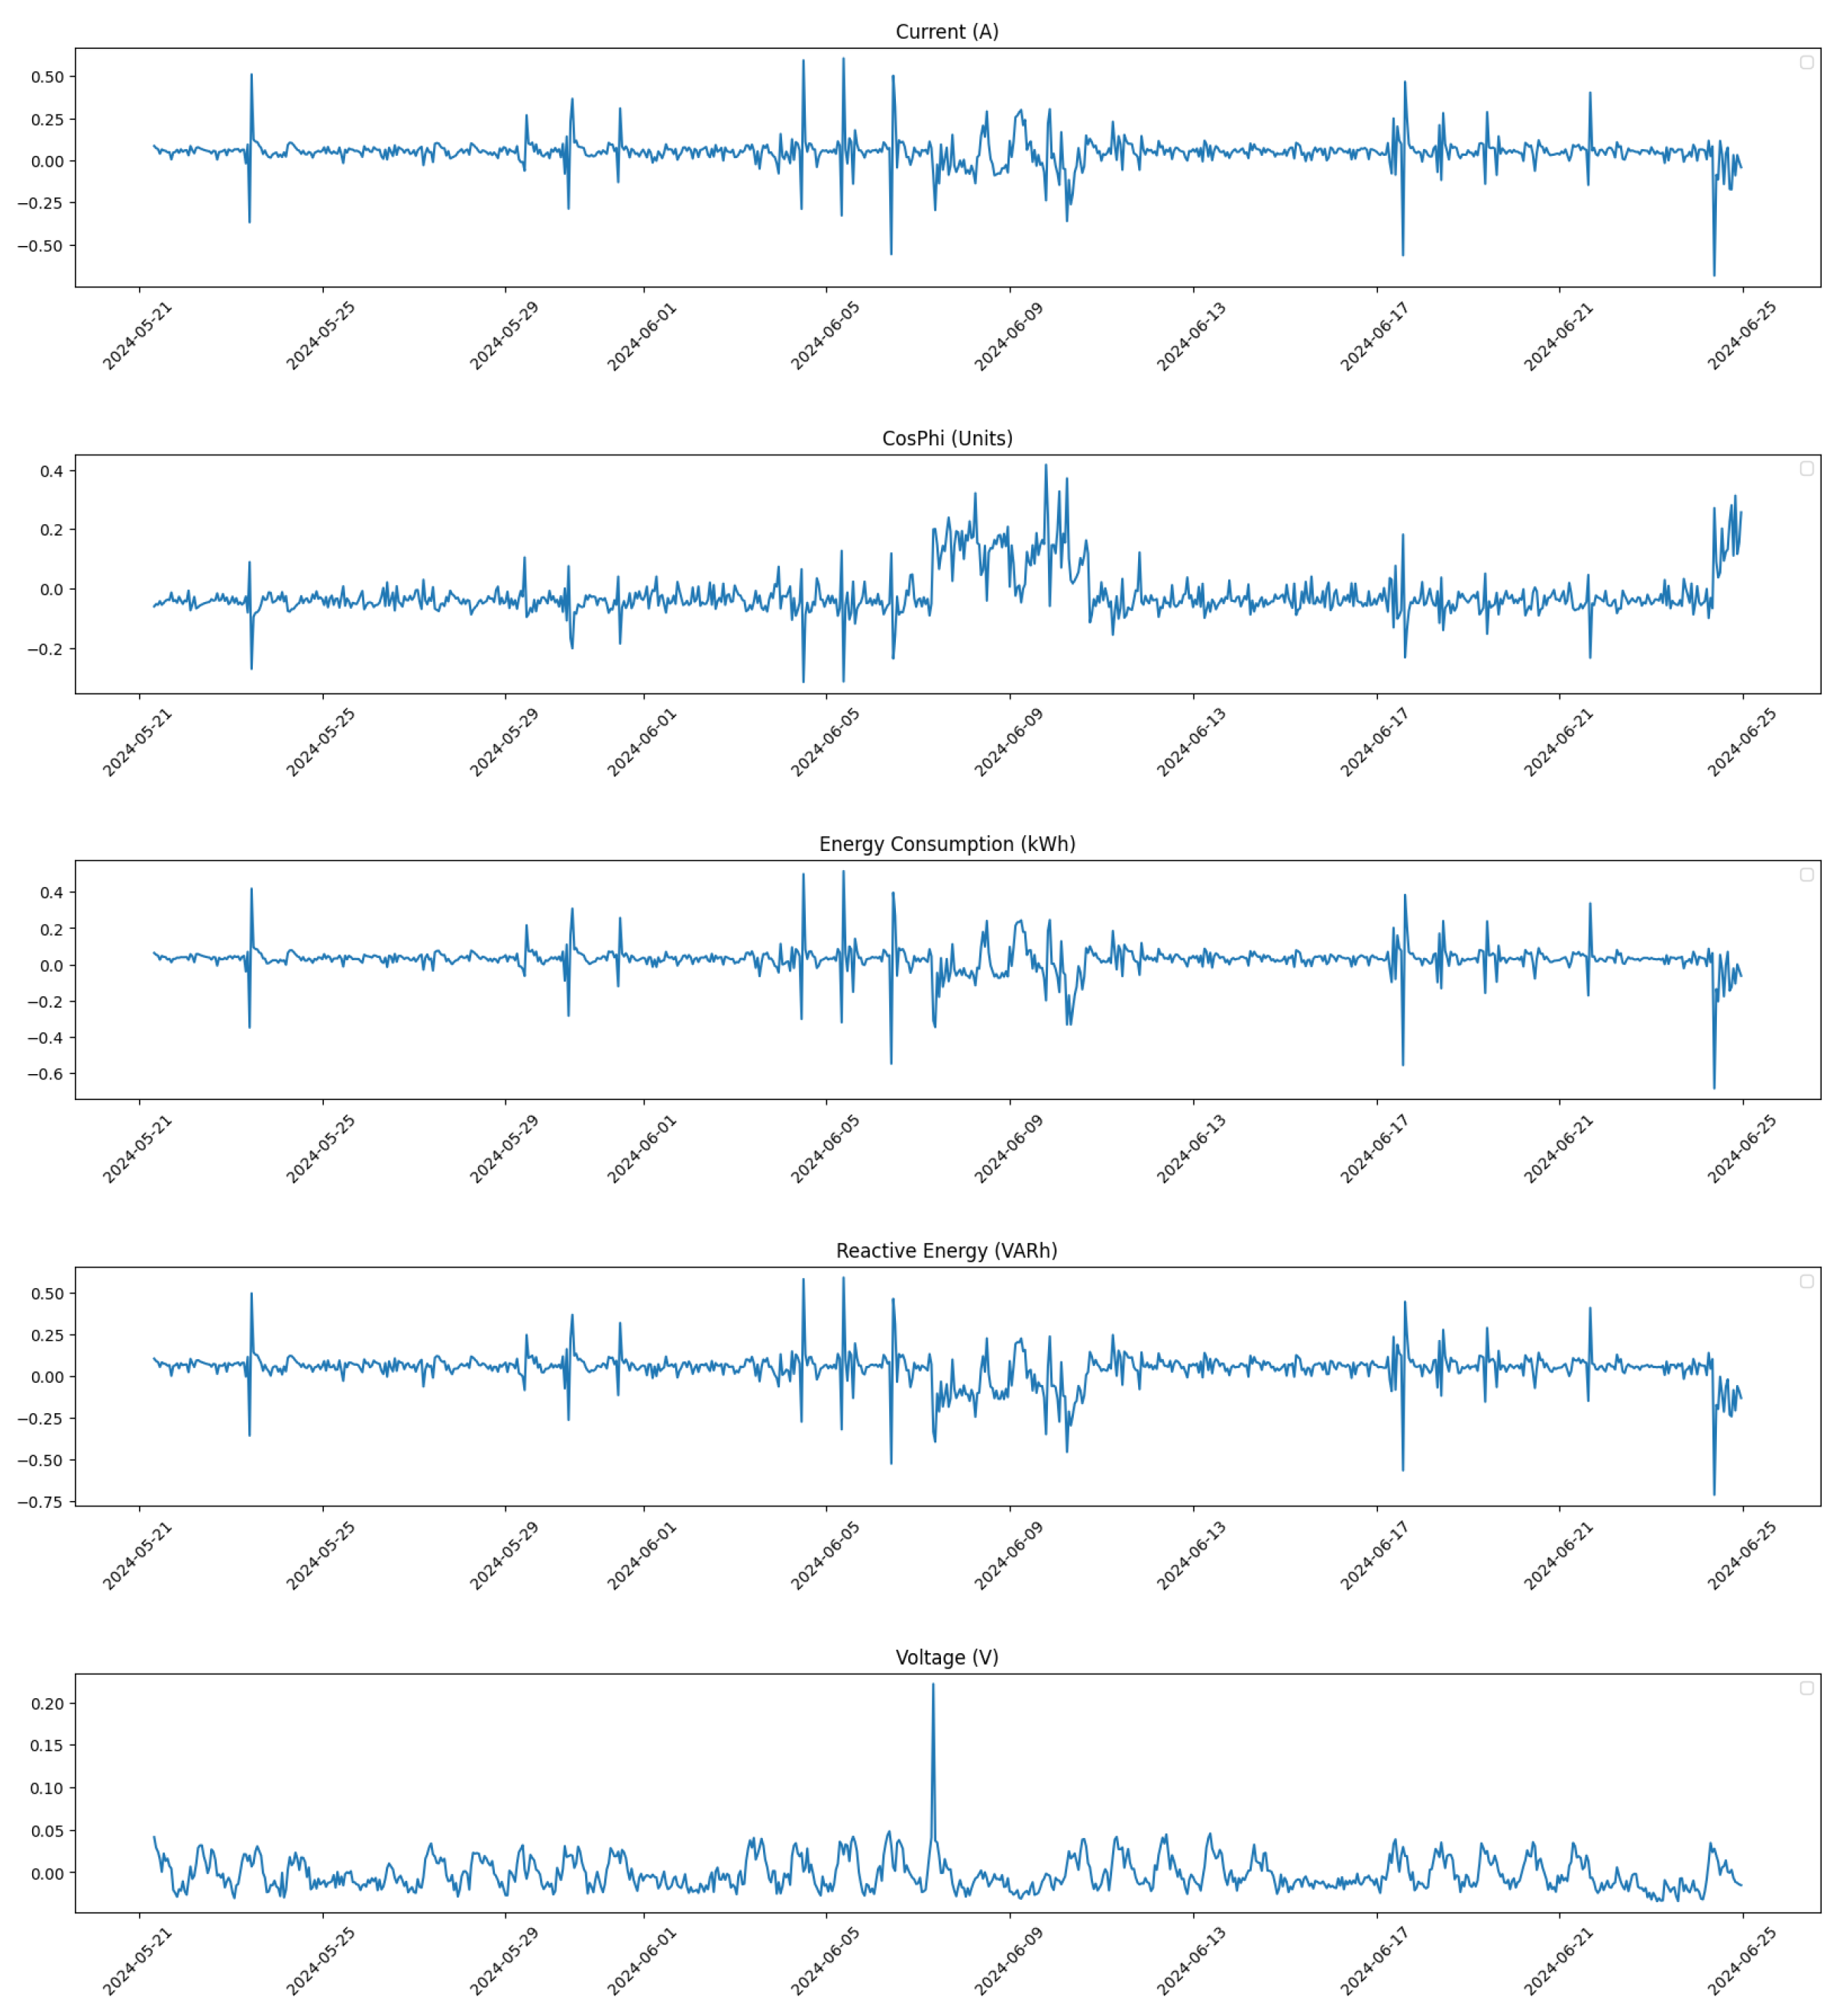
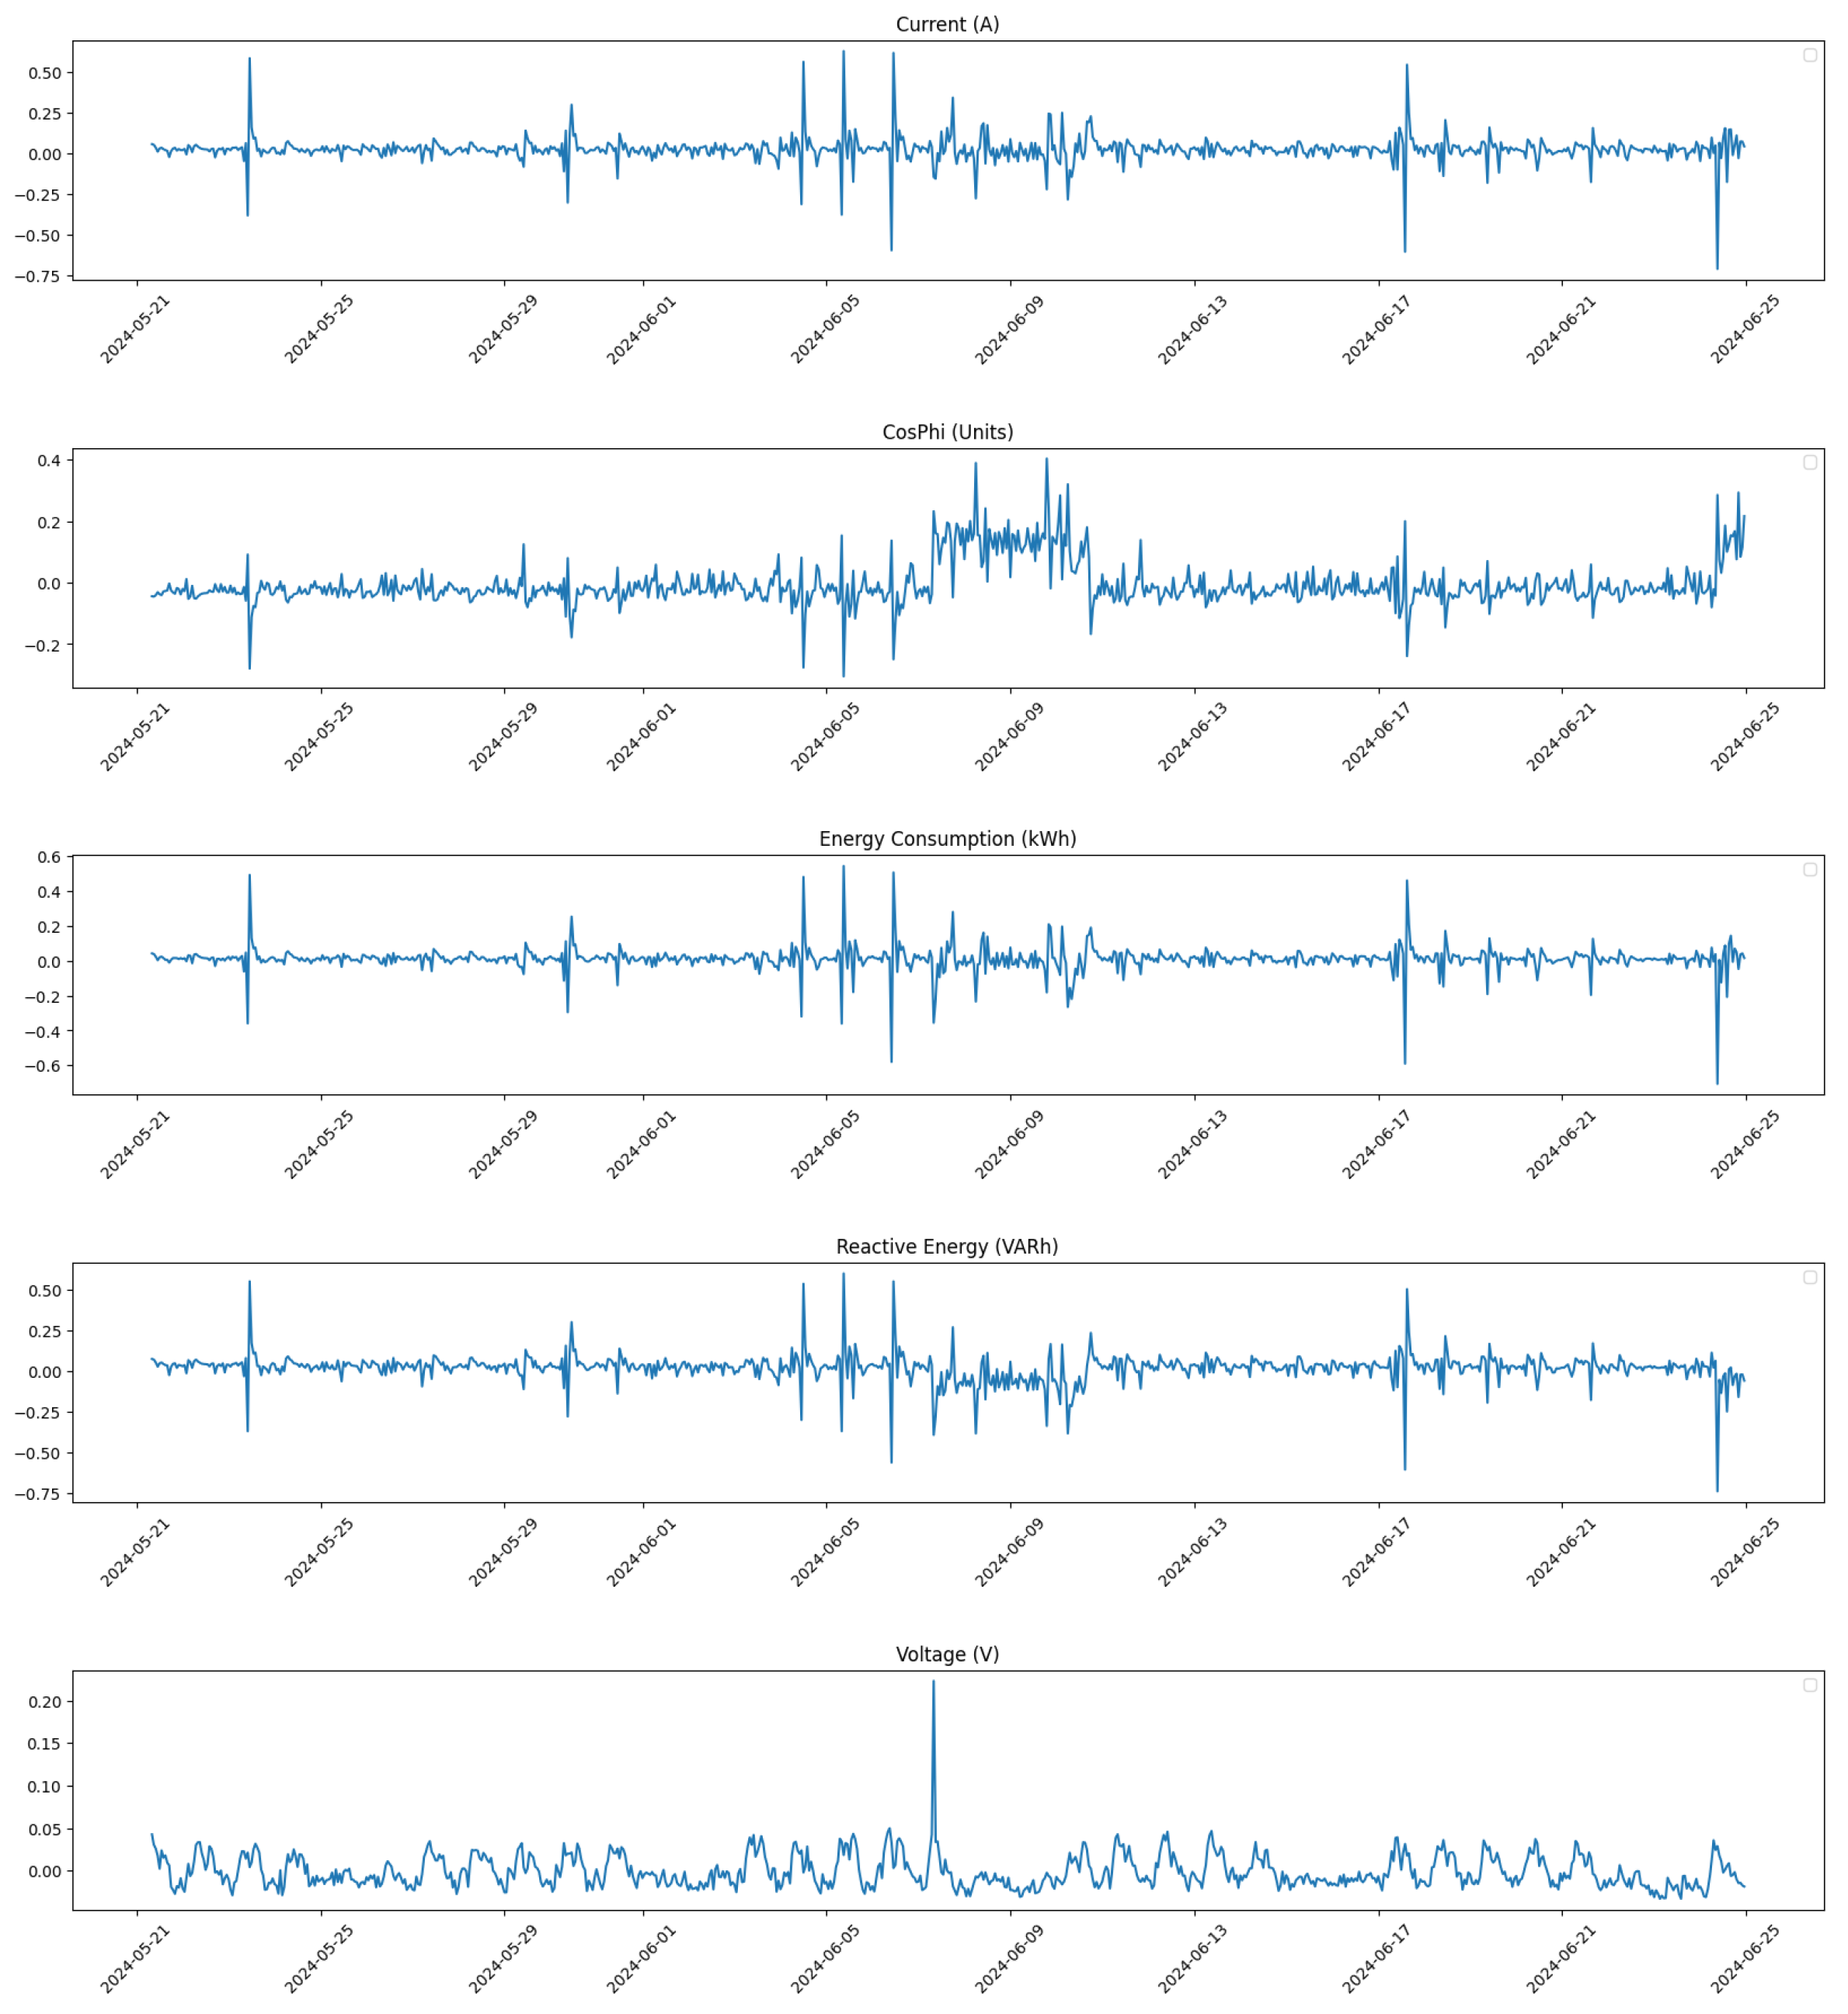
Additionally, we provide a focused analysis on specific time windows to further assess the impact of our corrections. 
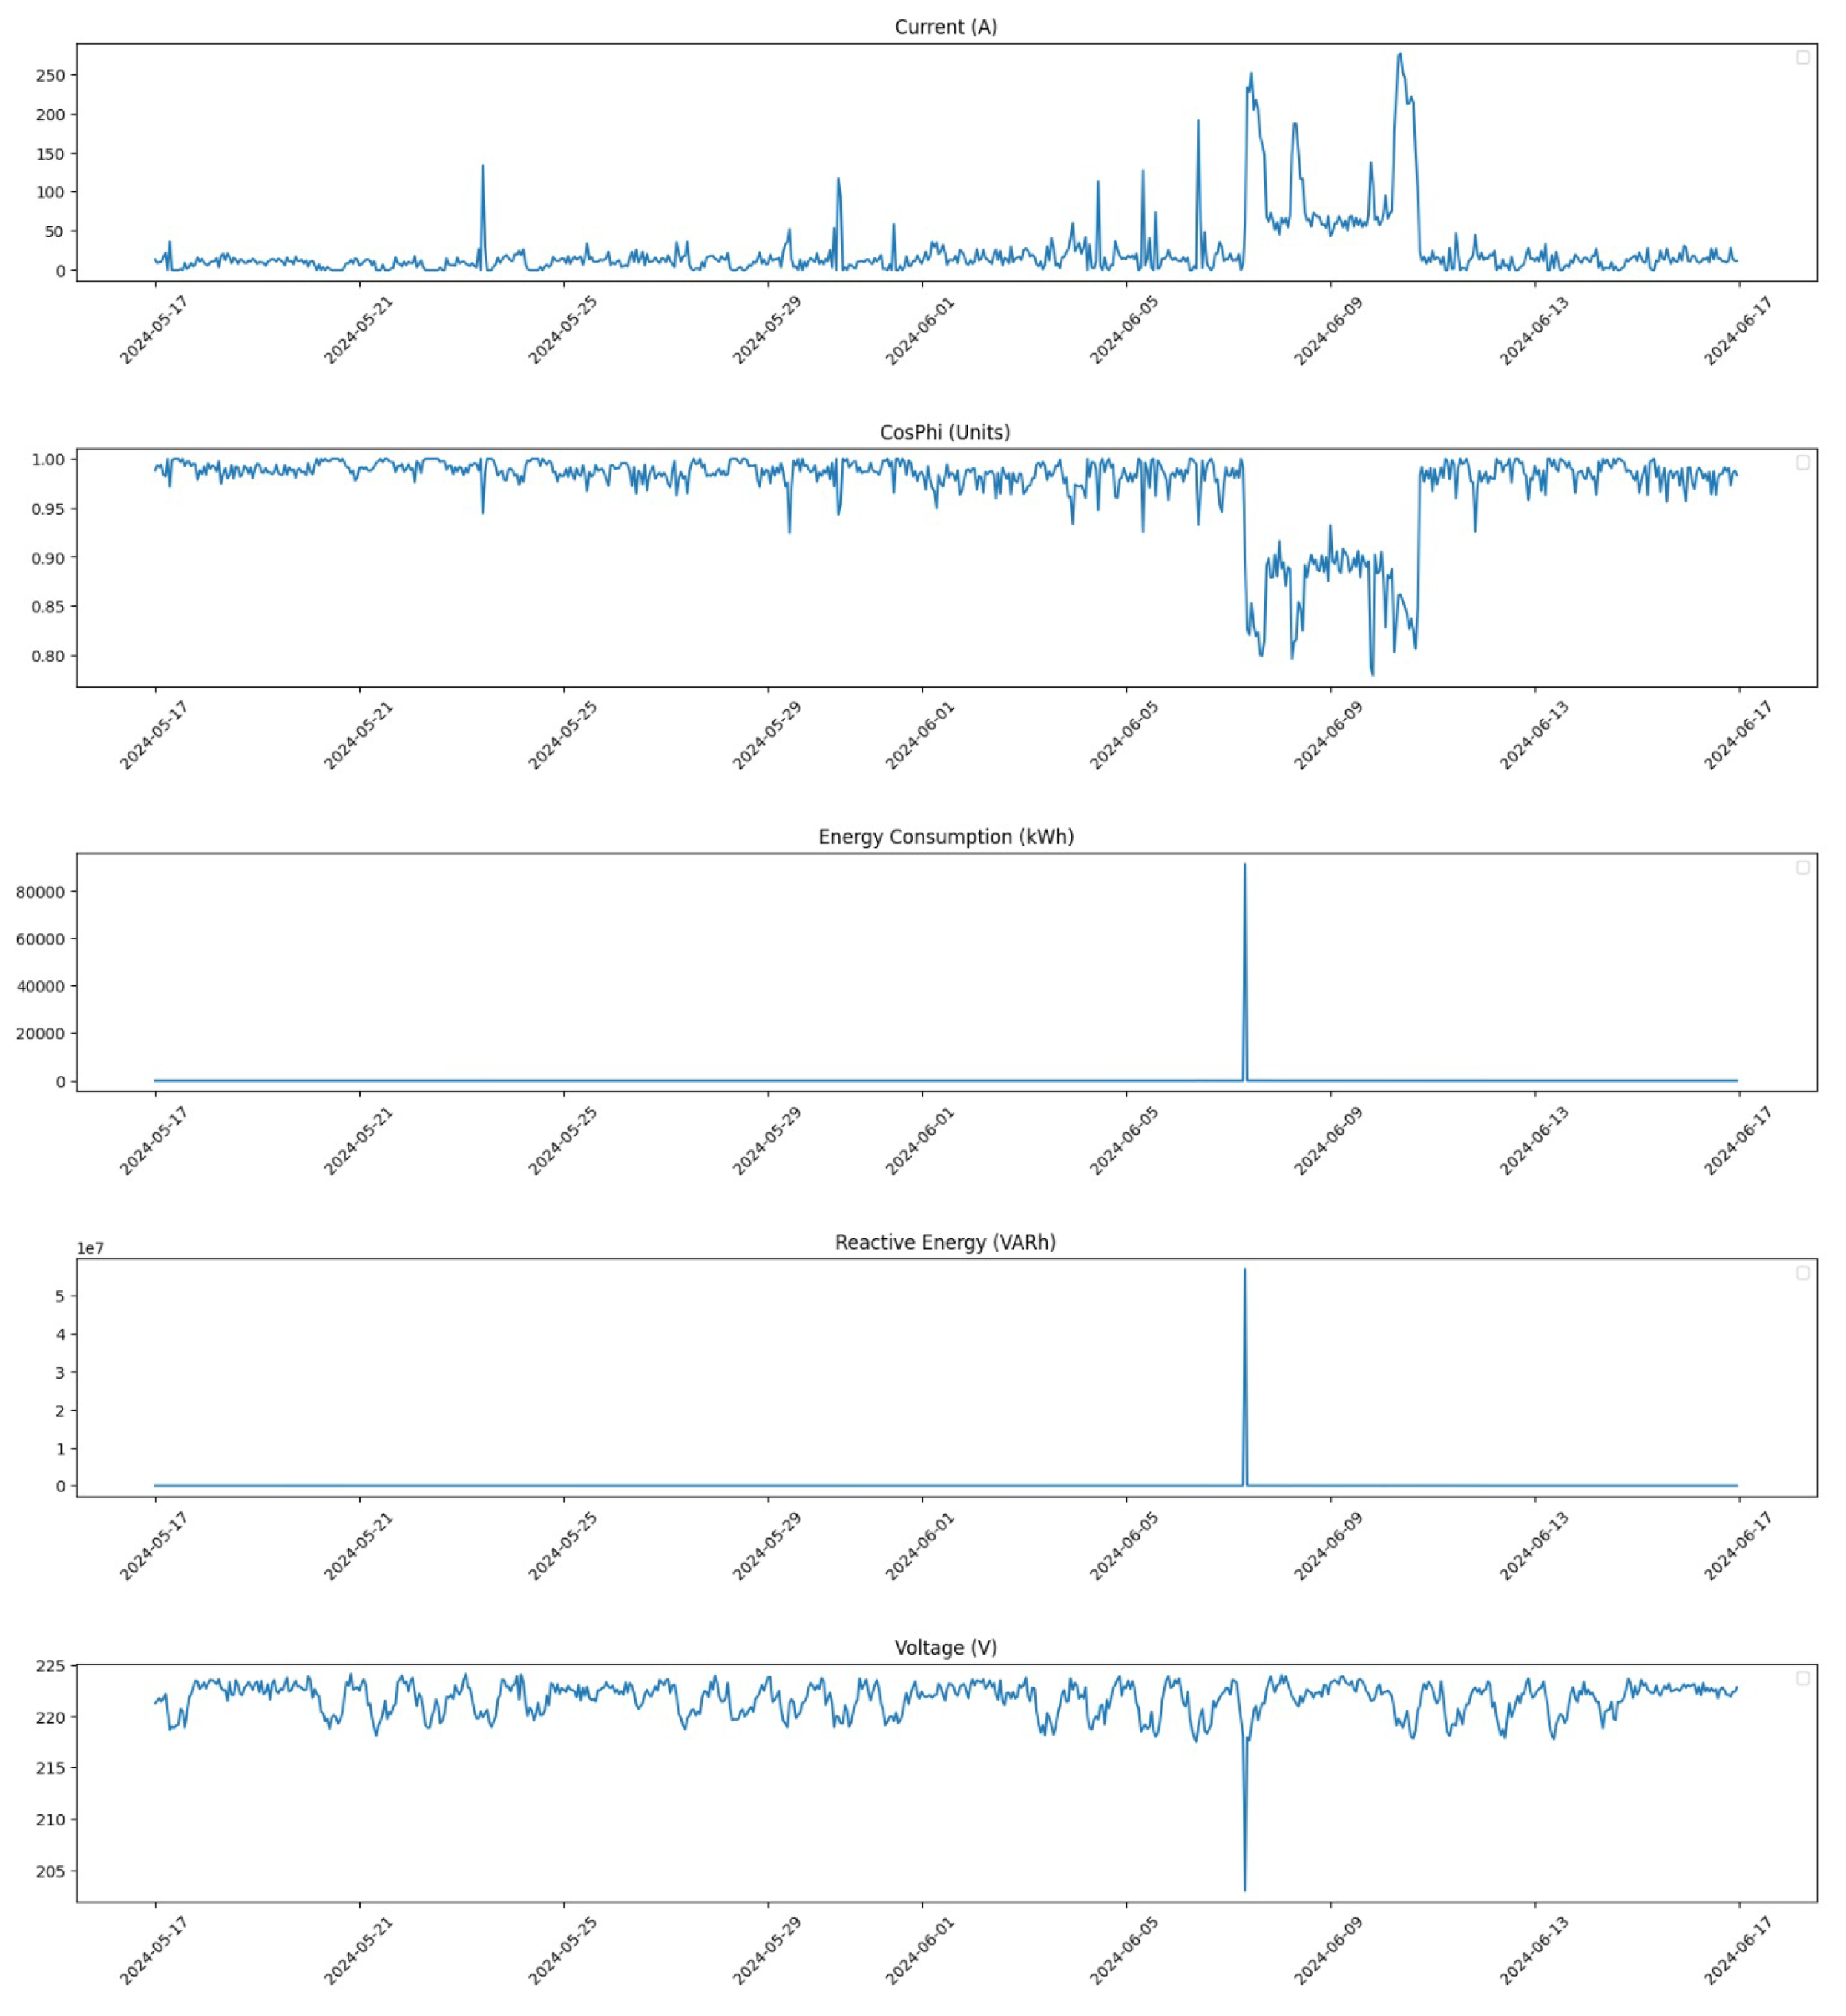
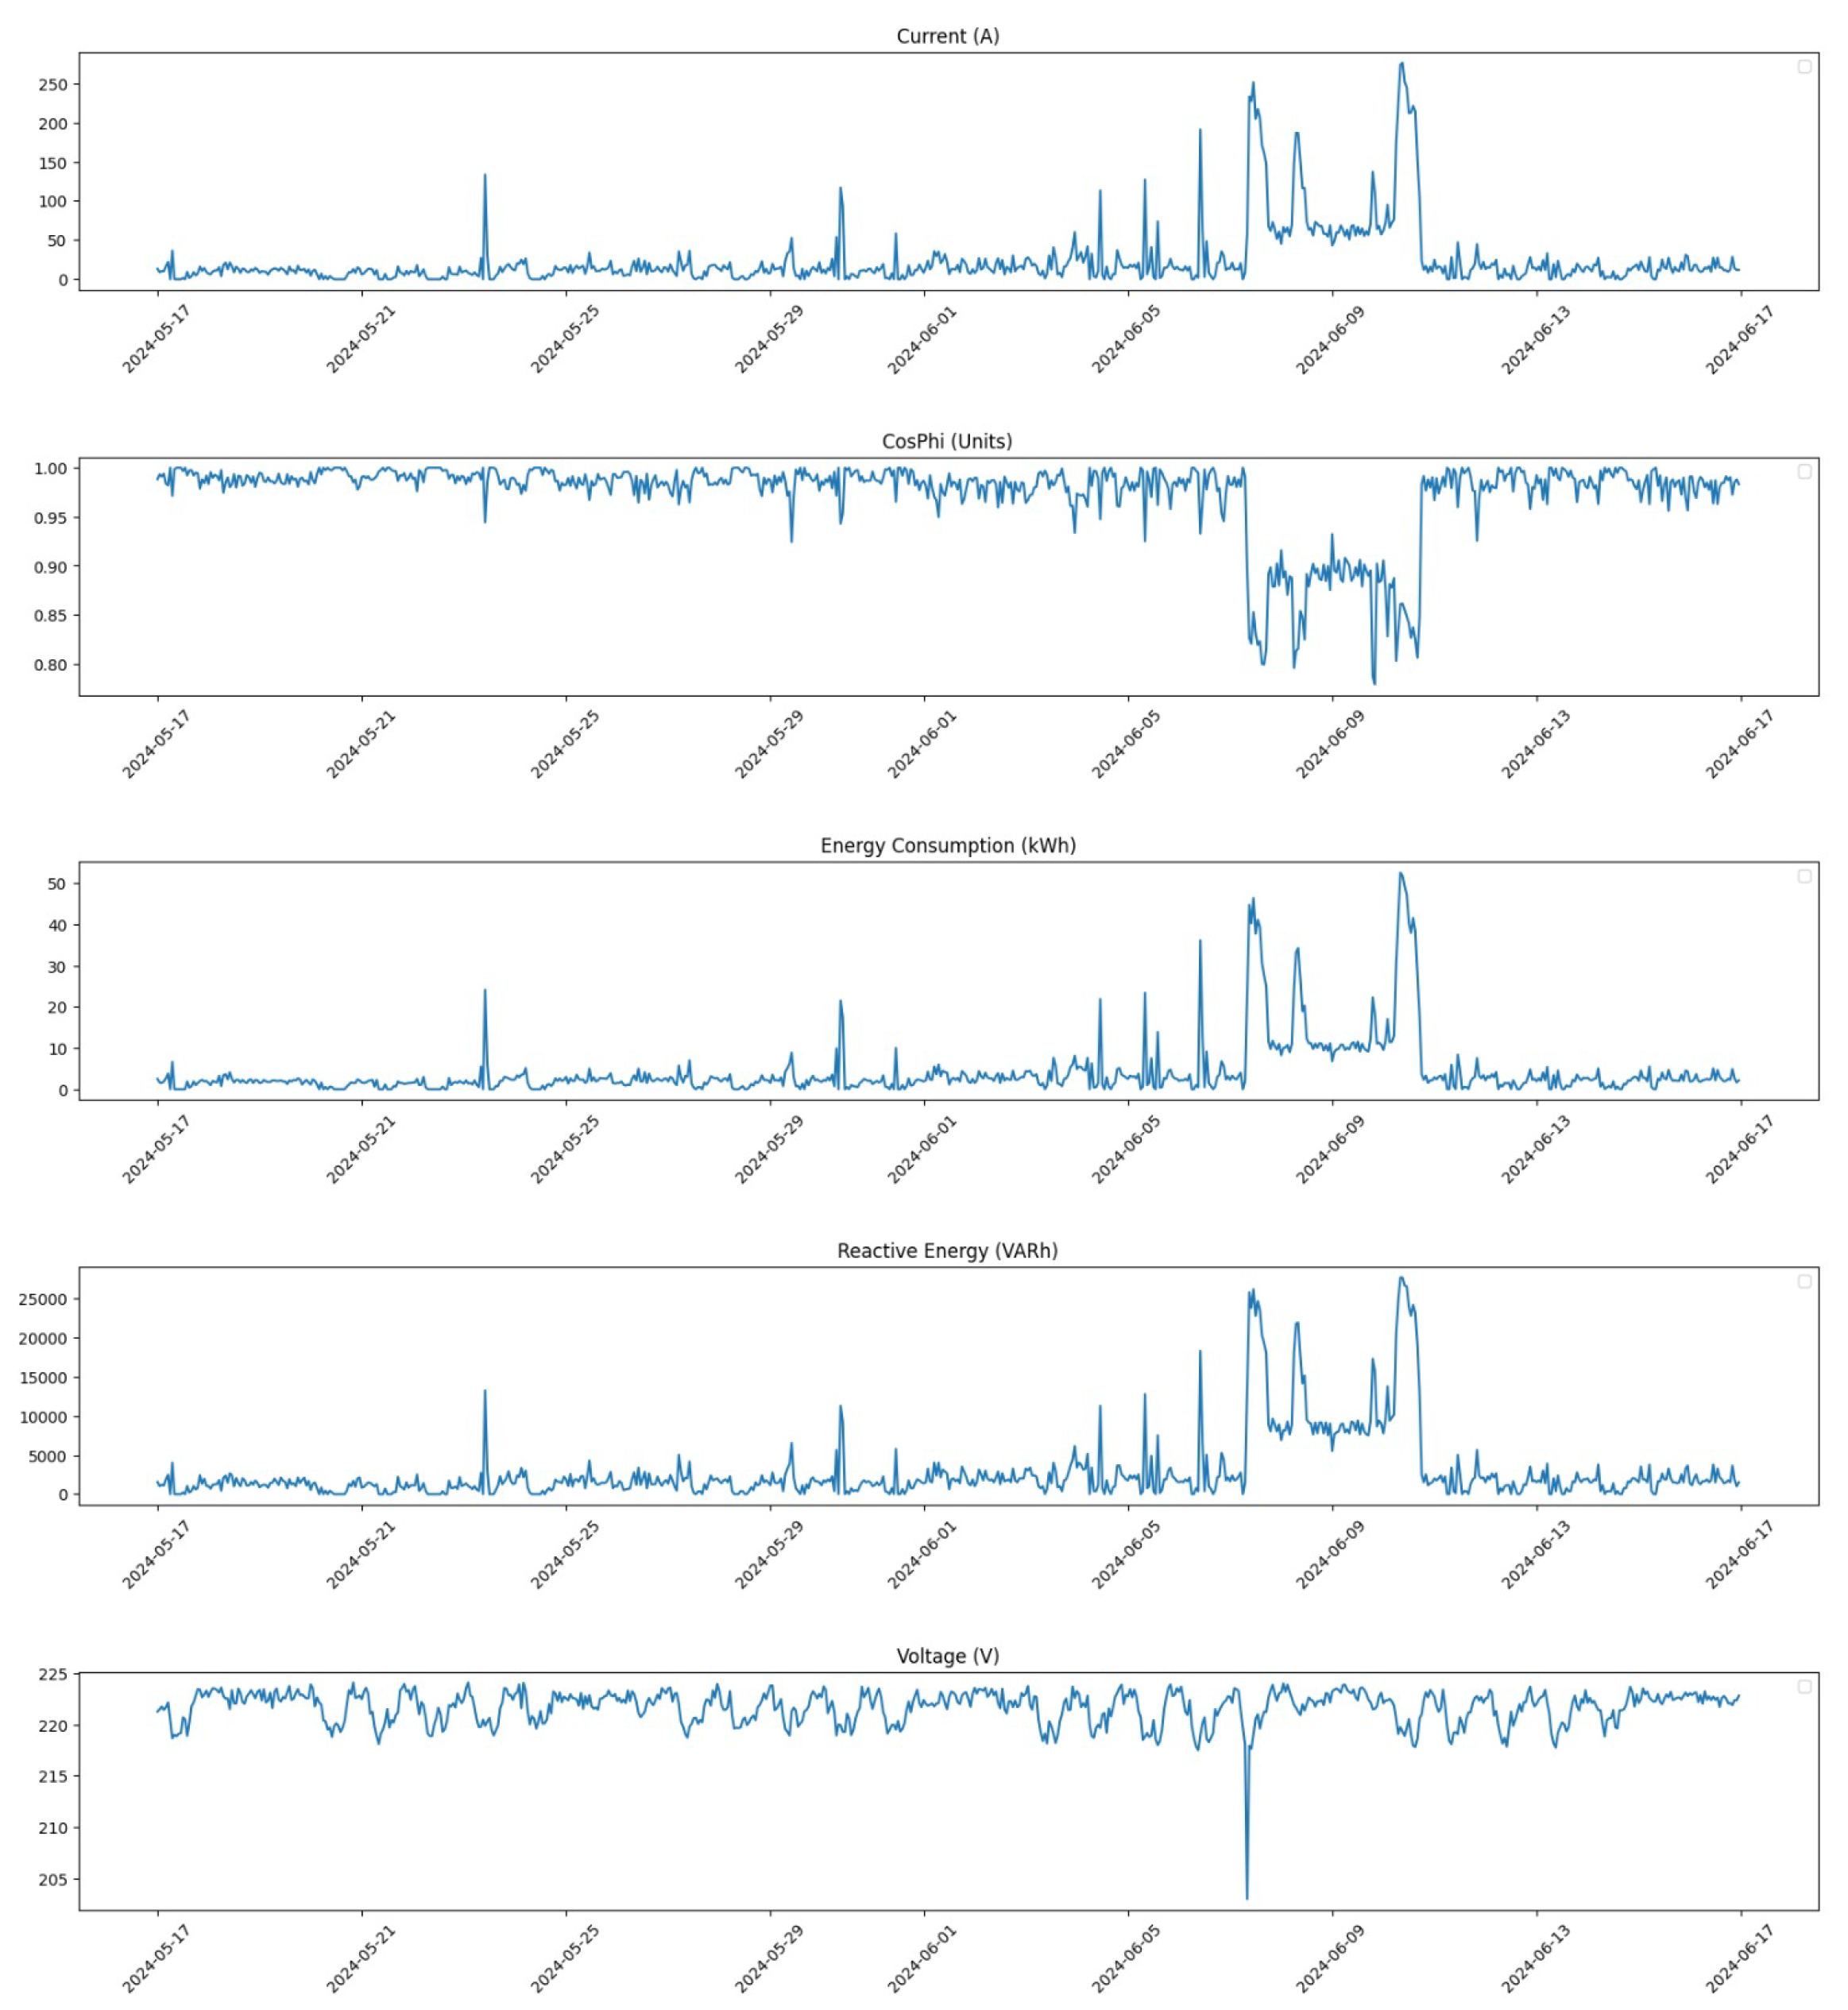
Figure 5 shows the distribution of all feature values within the time window from 17 May 2024 at 00:00 to 16 June 2024 at 23:00 before any corrections were made.
In contrast, Figure 6 presents the same time window after corrections were applied. The improvement in data distribution is evident, showcasing how our pre-processing steps have enhanced data integrity.
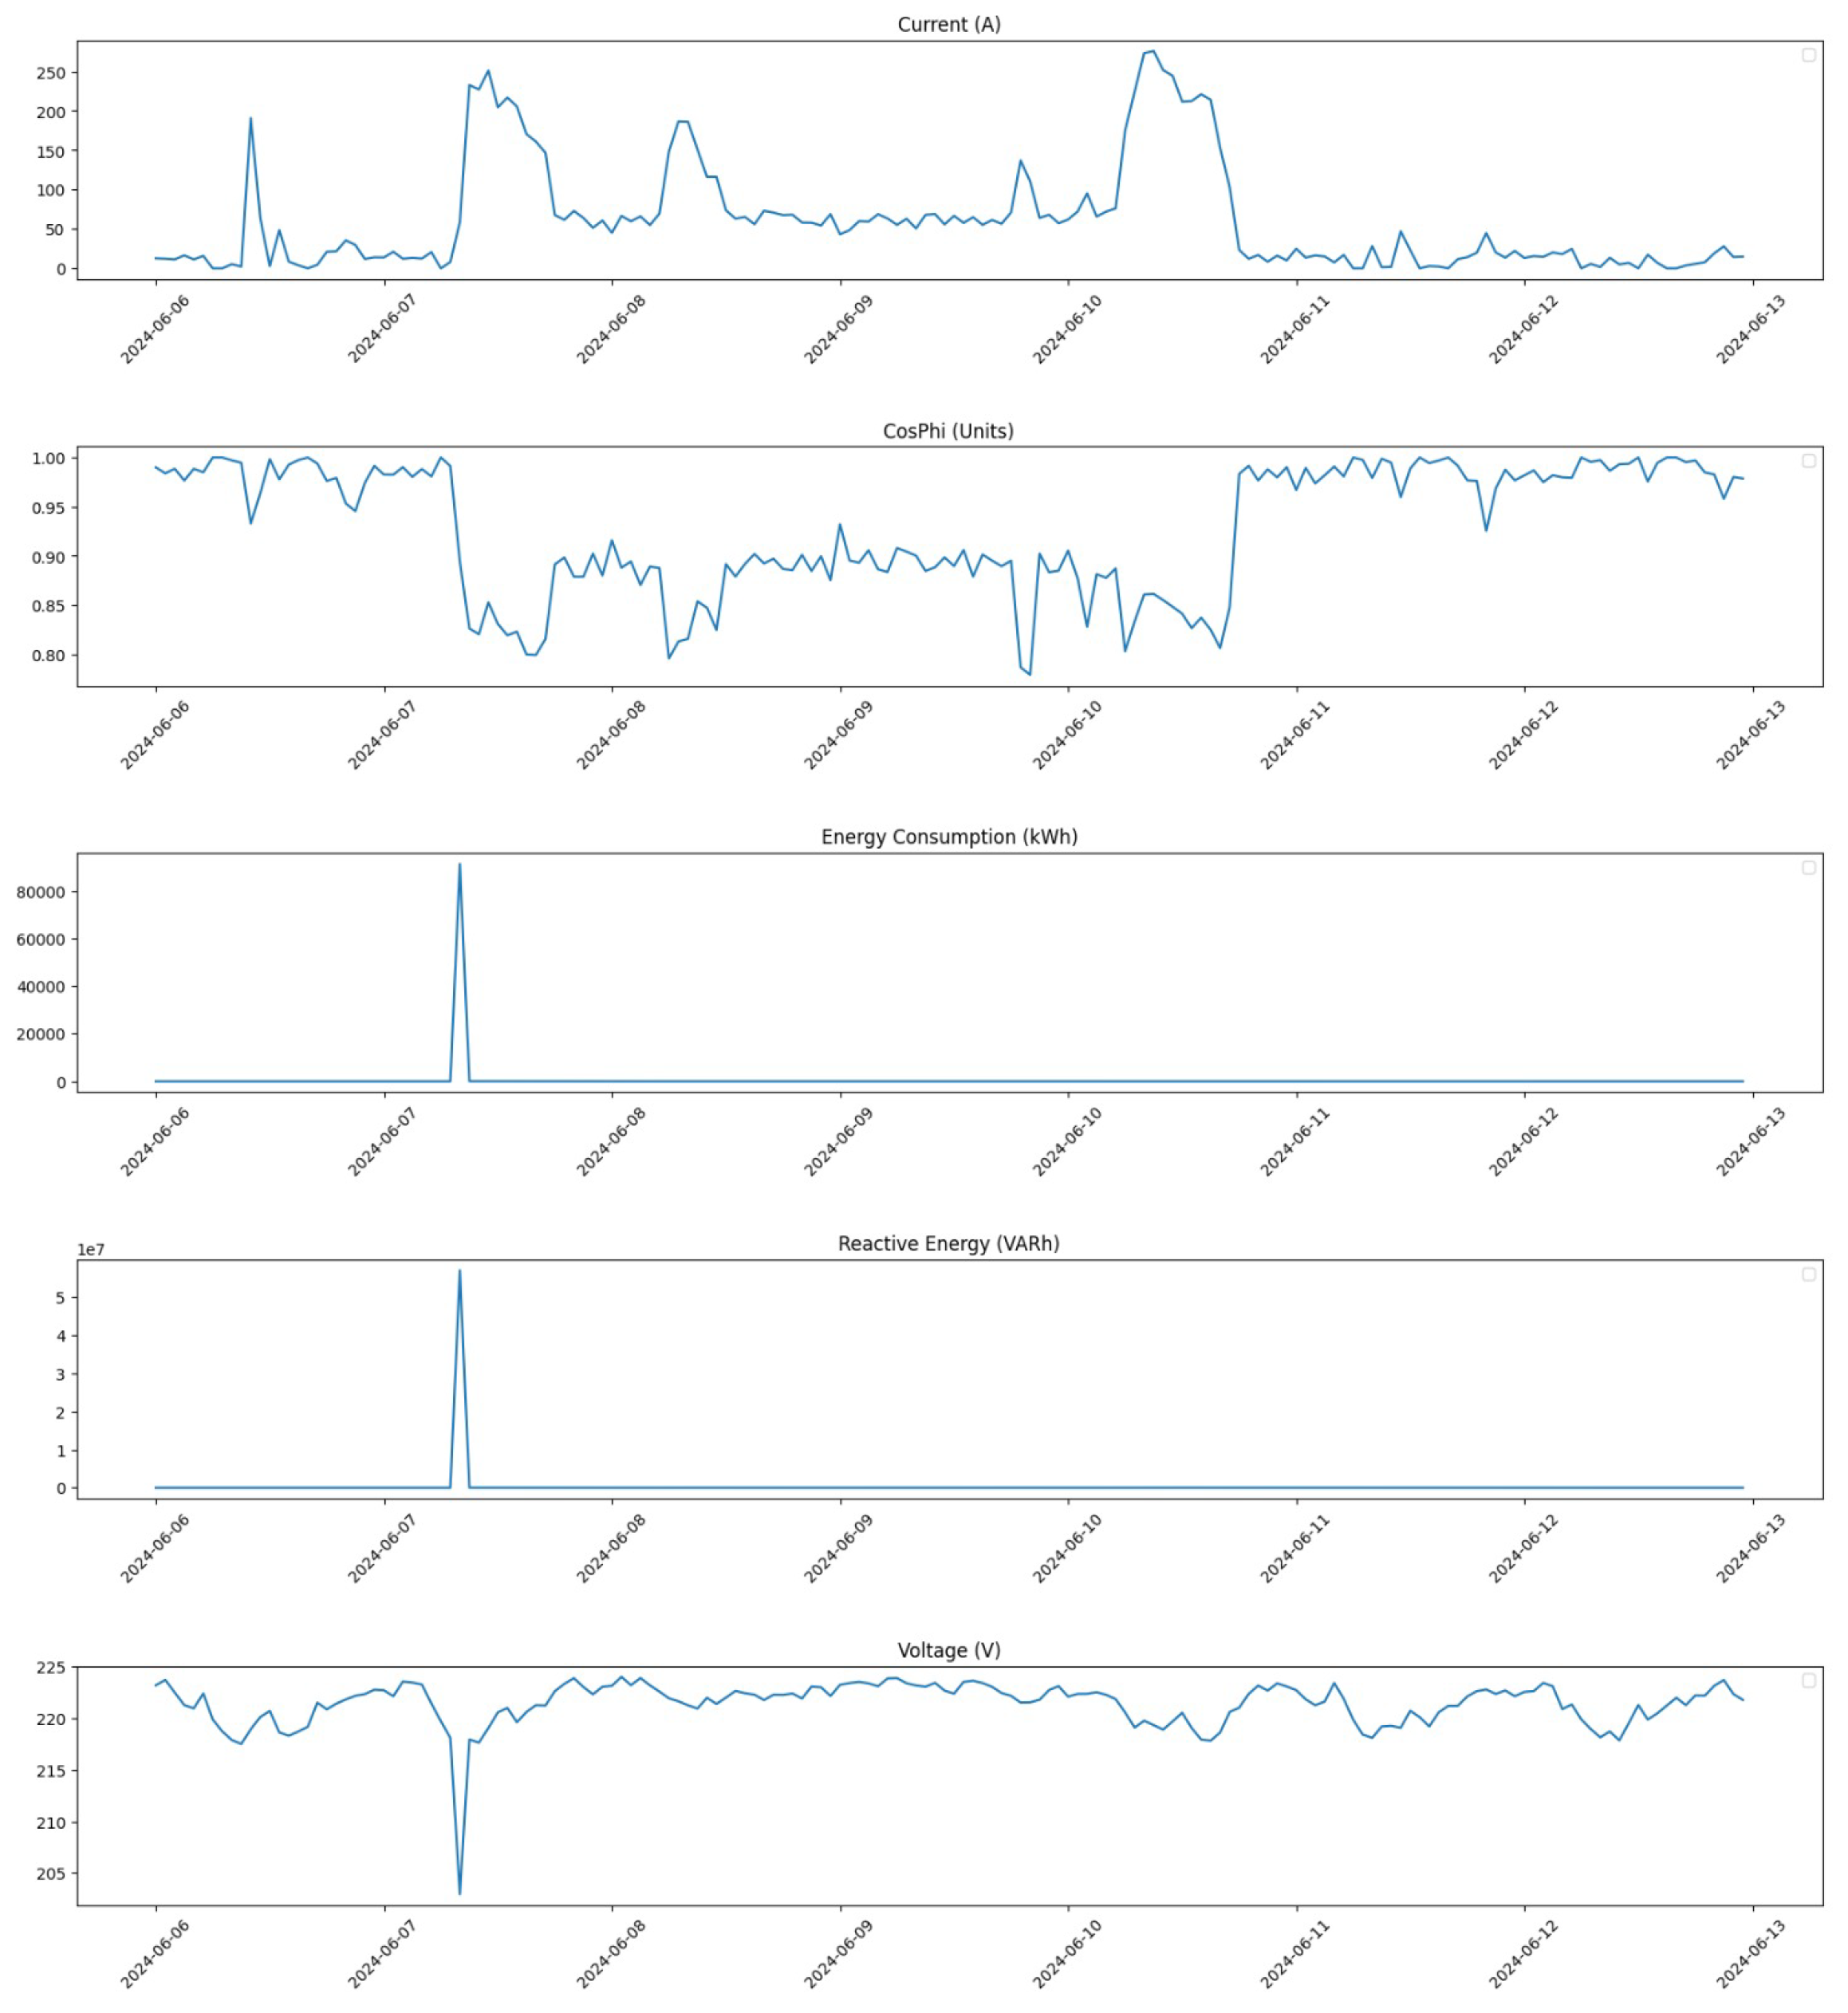
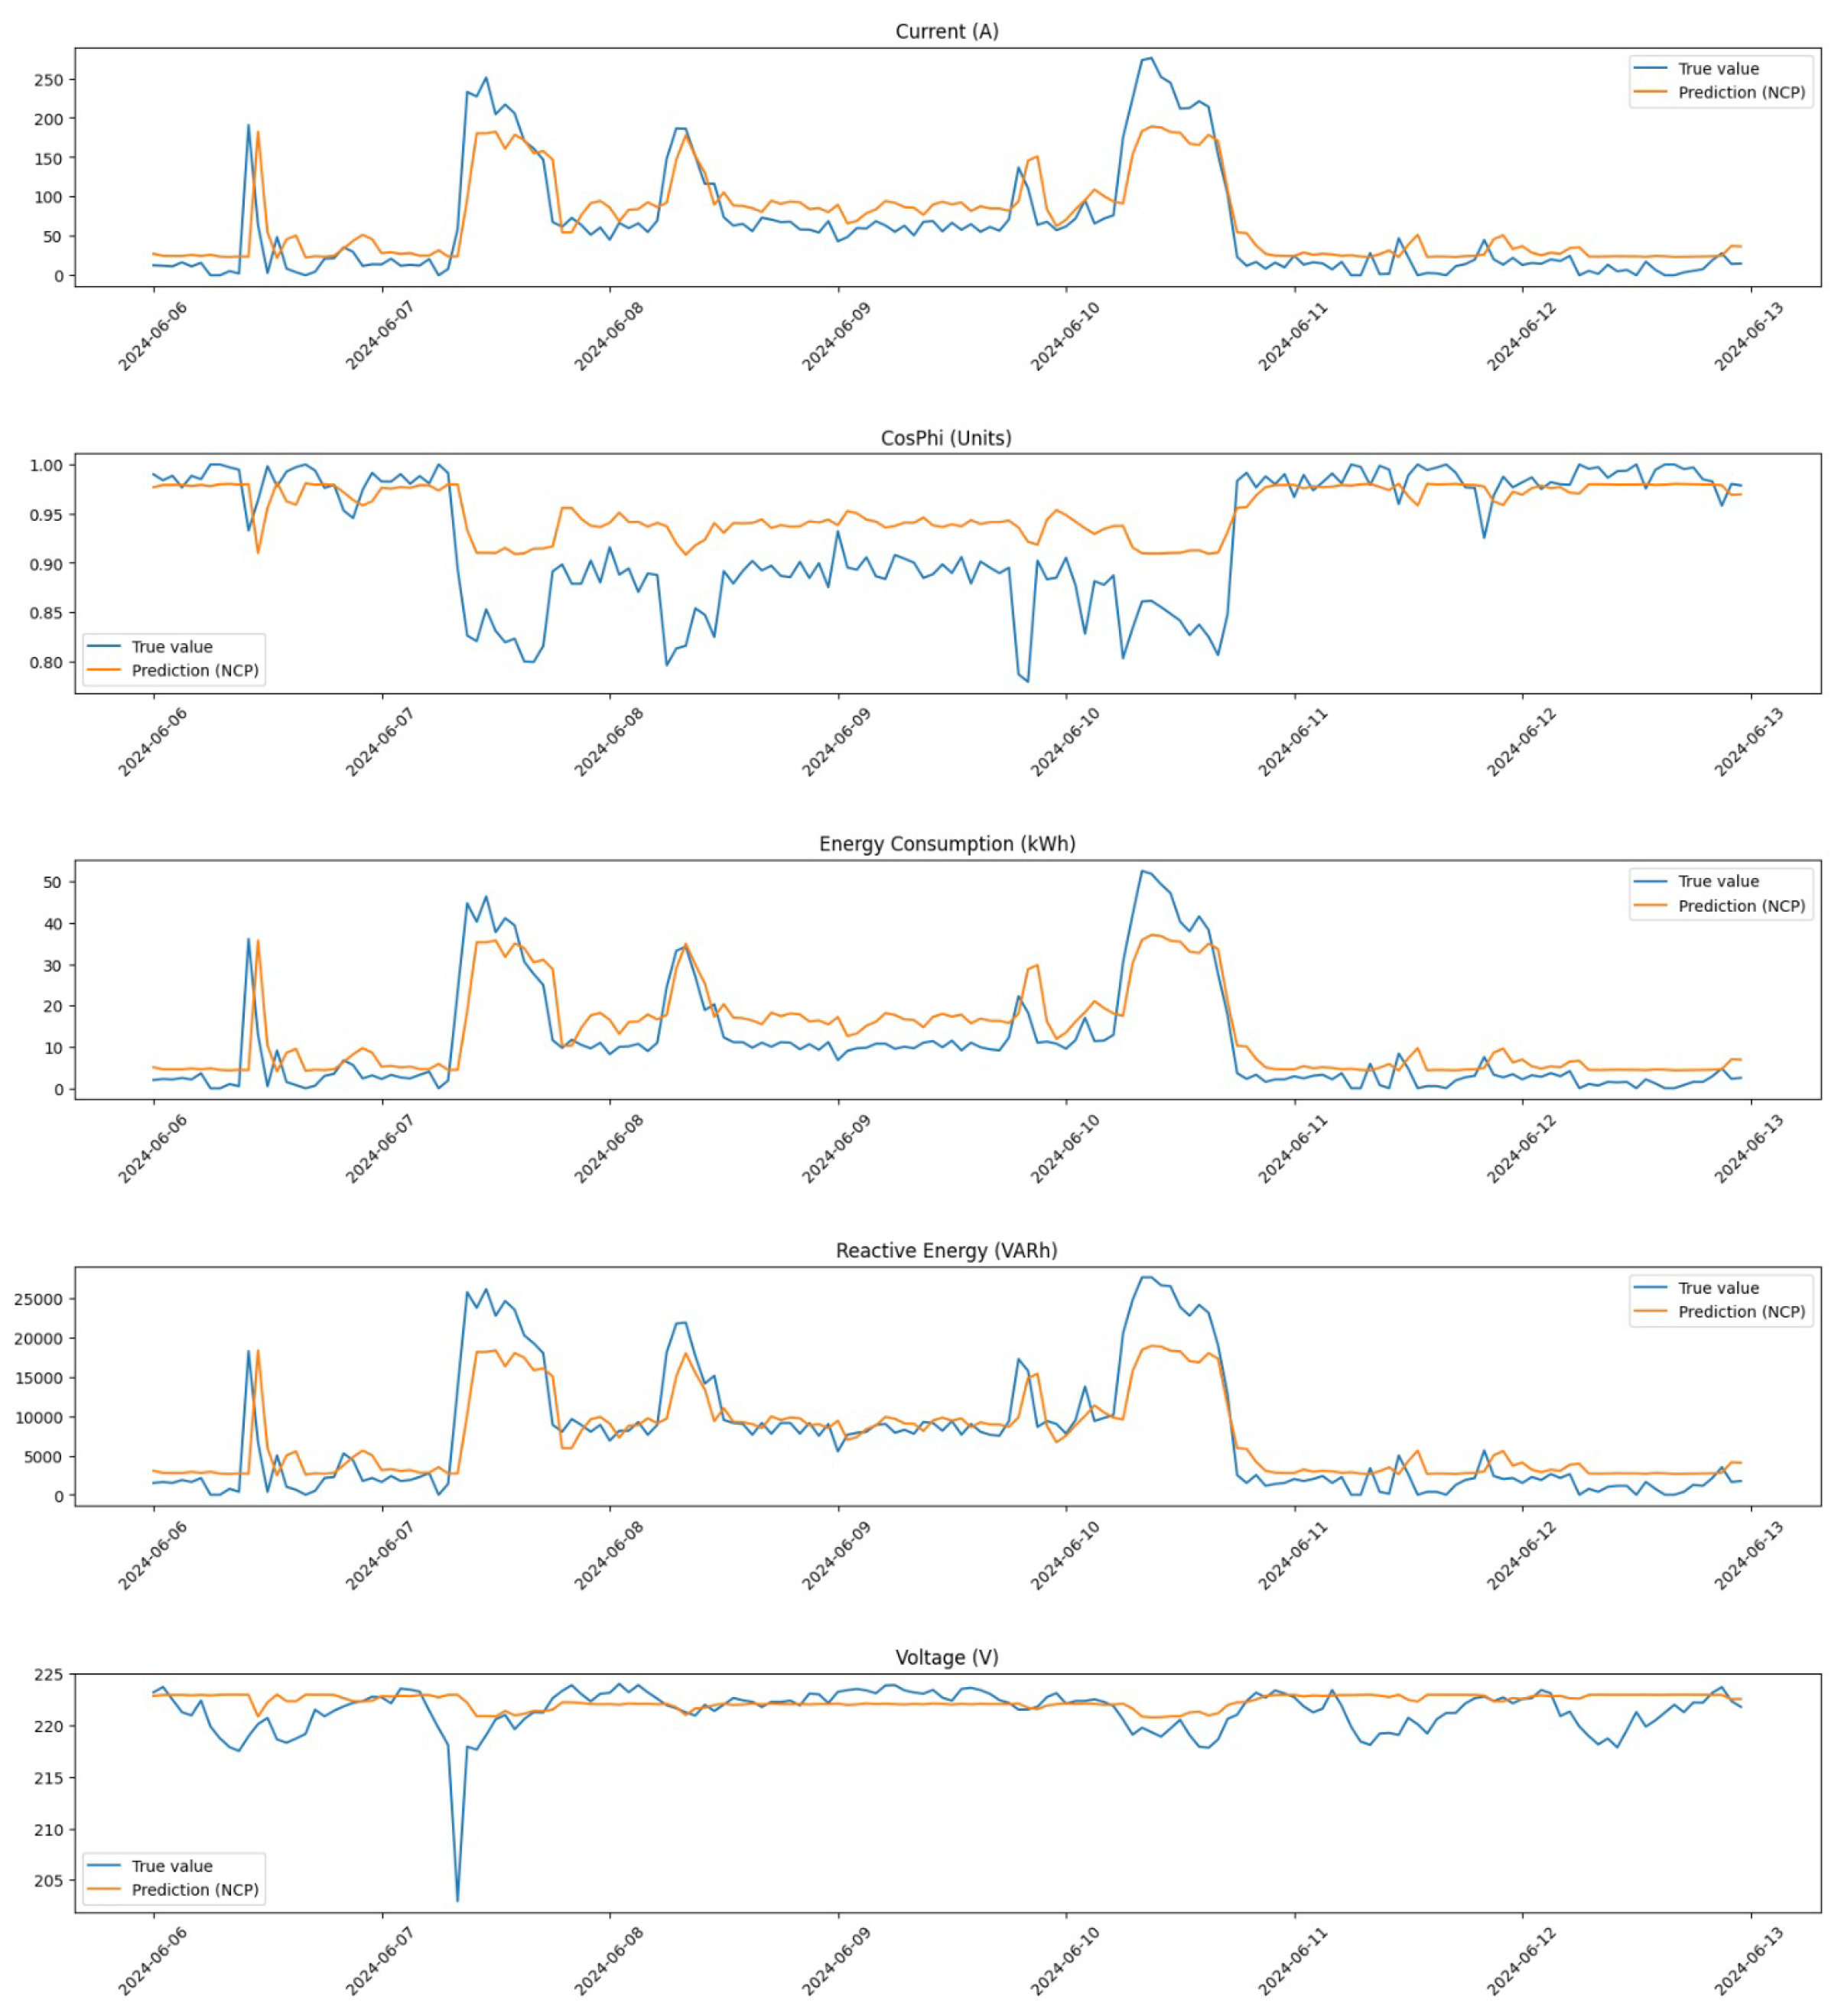
Furthermore, we zoom in on a critical period from 6 June 2024 at 00:00 to 12 June 2024 at 23:00 to analyze changes in detail. Figure 7 illustrates the distribution during this week before any corrections were implemented.
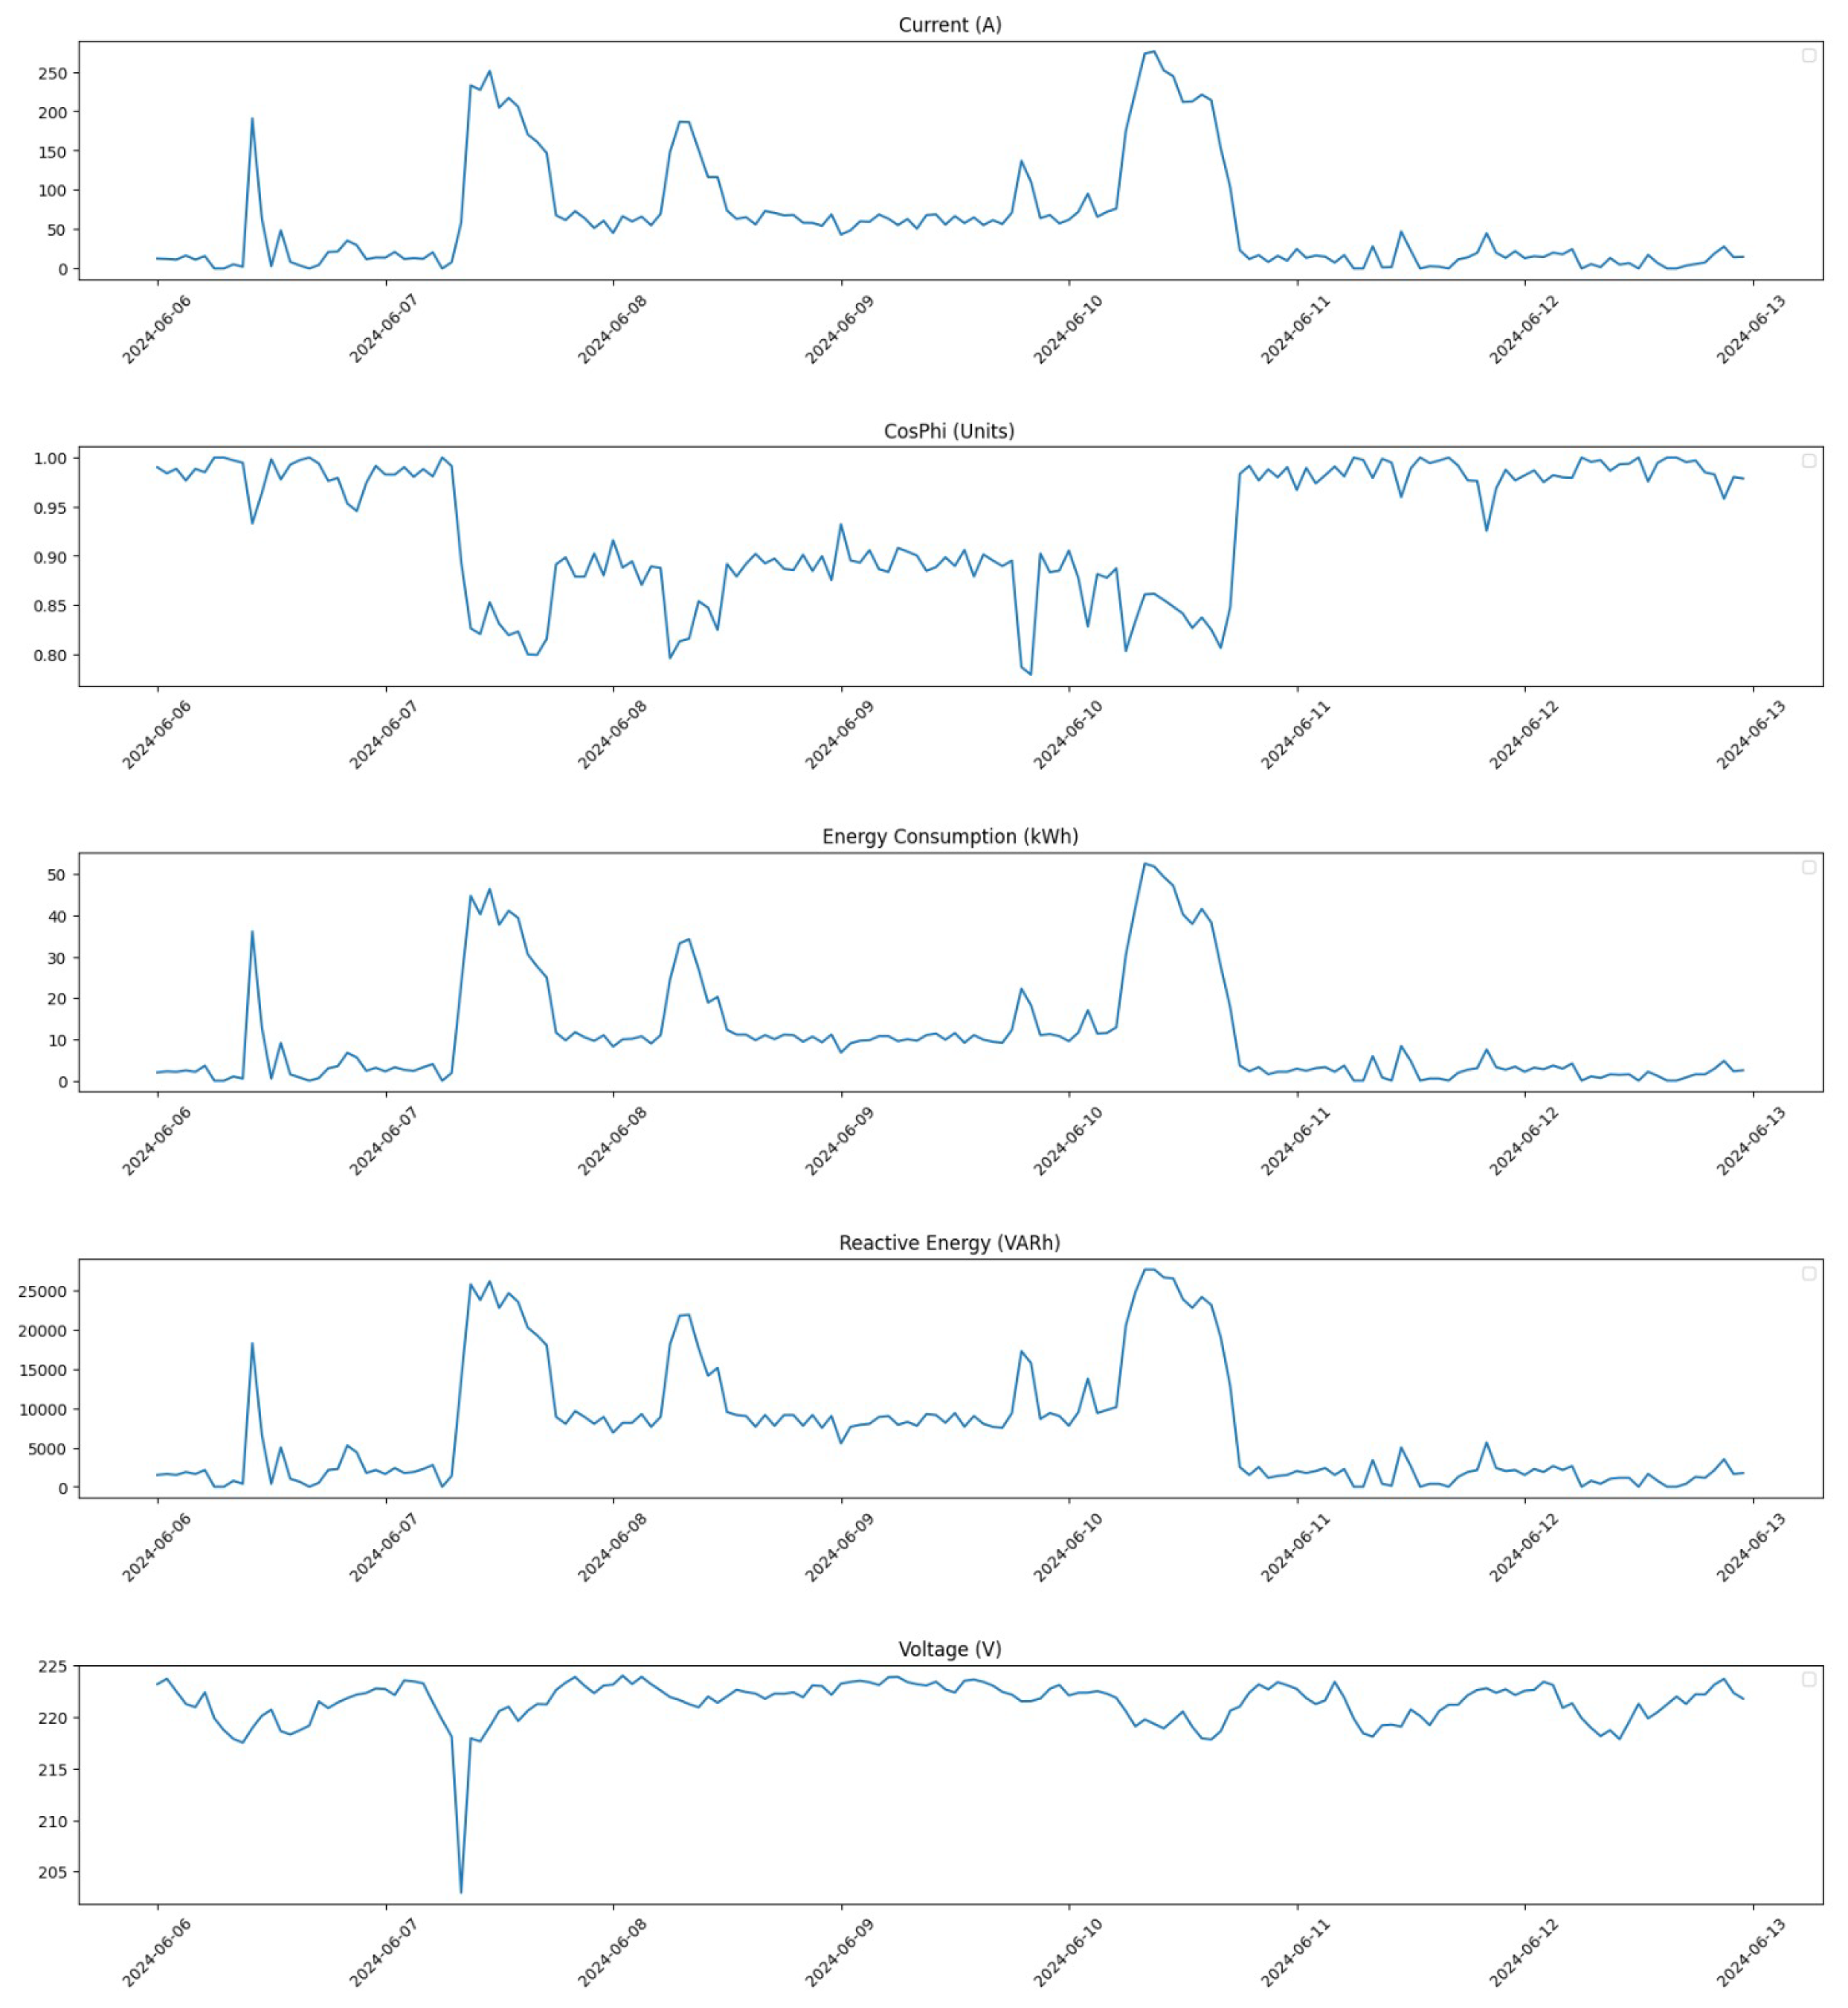
Finally, Figure 8 shows the distribution for the same period after applying our correction methods. This visualization highlights how effectively our pre-processing has addressed anomalies within this critical time frame.
These figures collectively demonstrate how our pre-processing efforts have significantly improved data quality across different time frames. By addressing outliers and applying linear interpolation where necessary, we have enhanced the dataset’s reliability for subsequent analysis and model training.

3.2. Model Architectures

In this subsection, we present the proposed model architecture designed for anomaly detection in compressors used in leather tanning operations. The primary objective of our architecture is to leverage advanced machine learning techniques, specifically Neural Circuit Policies and Long Short-Term Memory networks, within a federated learning framework. This dual approach aims to enhance the accuracy and interpretability of anomaly detection while addressing critical data privacy concerns inherent in industrial applications.
The architecture is structured to facilitate the integration of local models trained on decentralized data from multiple compressors. By utilizing federated learning, we ensure that sensitive operational data remain on-site, thereby preserving privacy while still benefiting from collaborative learning. The NCPs are particularly noteworthy as they incorporate knowledge of physical constraints through differential equations, allowing for a more nuanced understanding of the system dynamics compared to traditional LSTM models, which primarily rely on historical data patterns.
In the following paragraphs, we will detail the specific components of our model architecture, including the mathematical formulations for both NCPs and LSTMs, as well as the overall design of the federated learning framework. This comprehensive overview will highlight how our proposed architecture effectively combines these methodologies to achieve superior performance in detecting anomalies within compressor operations.

3.2.1. Federated Learning

Federated learning is a decentralized approach to machine learning that enables multiple clients to collaboratively train a shared model while keeping their data localized. This architecture is particularly beneficial in scenarios where data privacy is paramount, such as in industrial applications involving sensitive operational data from compressors in leather tanning facilities. The primary objective of employing FL in our system is to enhance predictive maintenance capabilities without compromising the confidentiality of the data.
In a typical FL setup, there exists a central server that coordinates the training process, while each client holds its own local dataset. Clients independently train their models on local data and subsequently share only the model parameters—rather than the raw data—with the server [24]. This method significantly mitigates privacy concerns, as sensitive information remains on the client side and is never transmitted over the network. By exchanging model updates instead of raw data, FL aligns with stringent data protection regulations, such as GDPR, making it an ideal choice for industries handling sensitive information.
From an architectural perspective, our FL framework consists of a server and multiple clients, each representing different compressors. The server orchestrates the training process by aggregating model updates from all participating clients. This aggregation can be performed using various strategies, such as averaging the parameters or employing more sophisticated techniques that account for the quality and relevance of each client’s contribution.
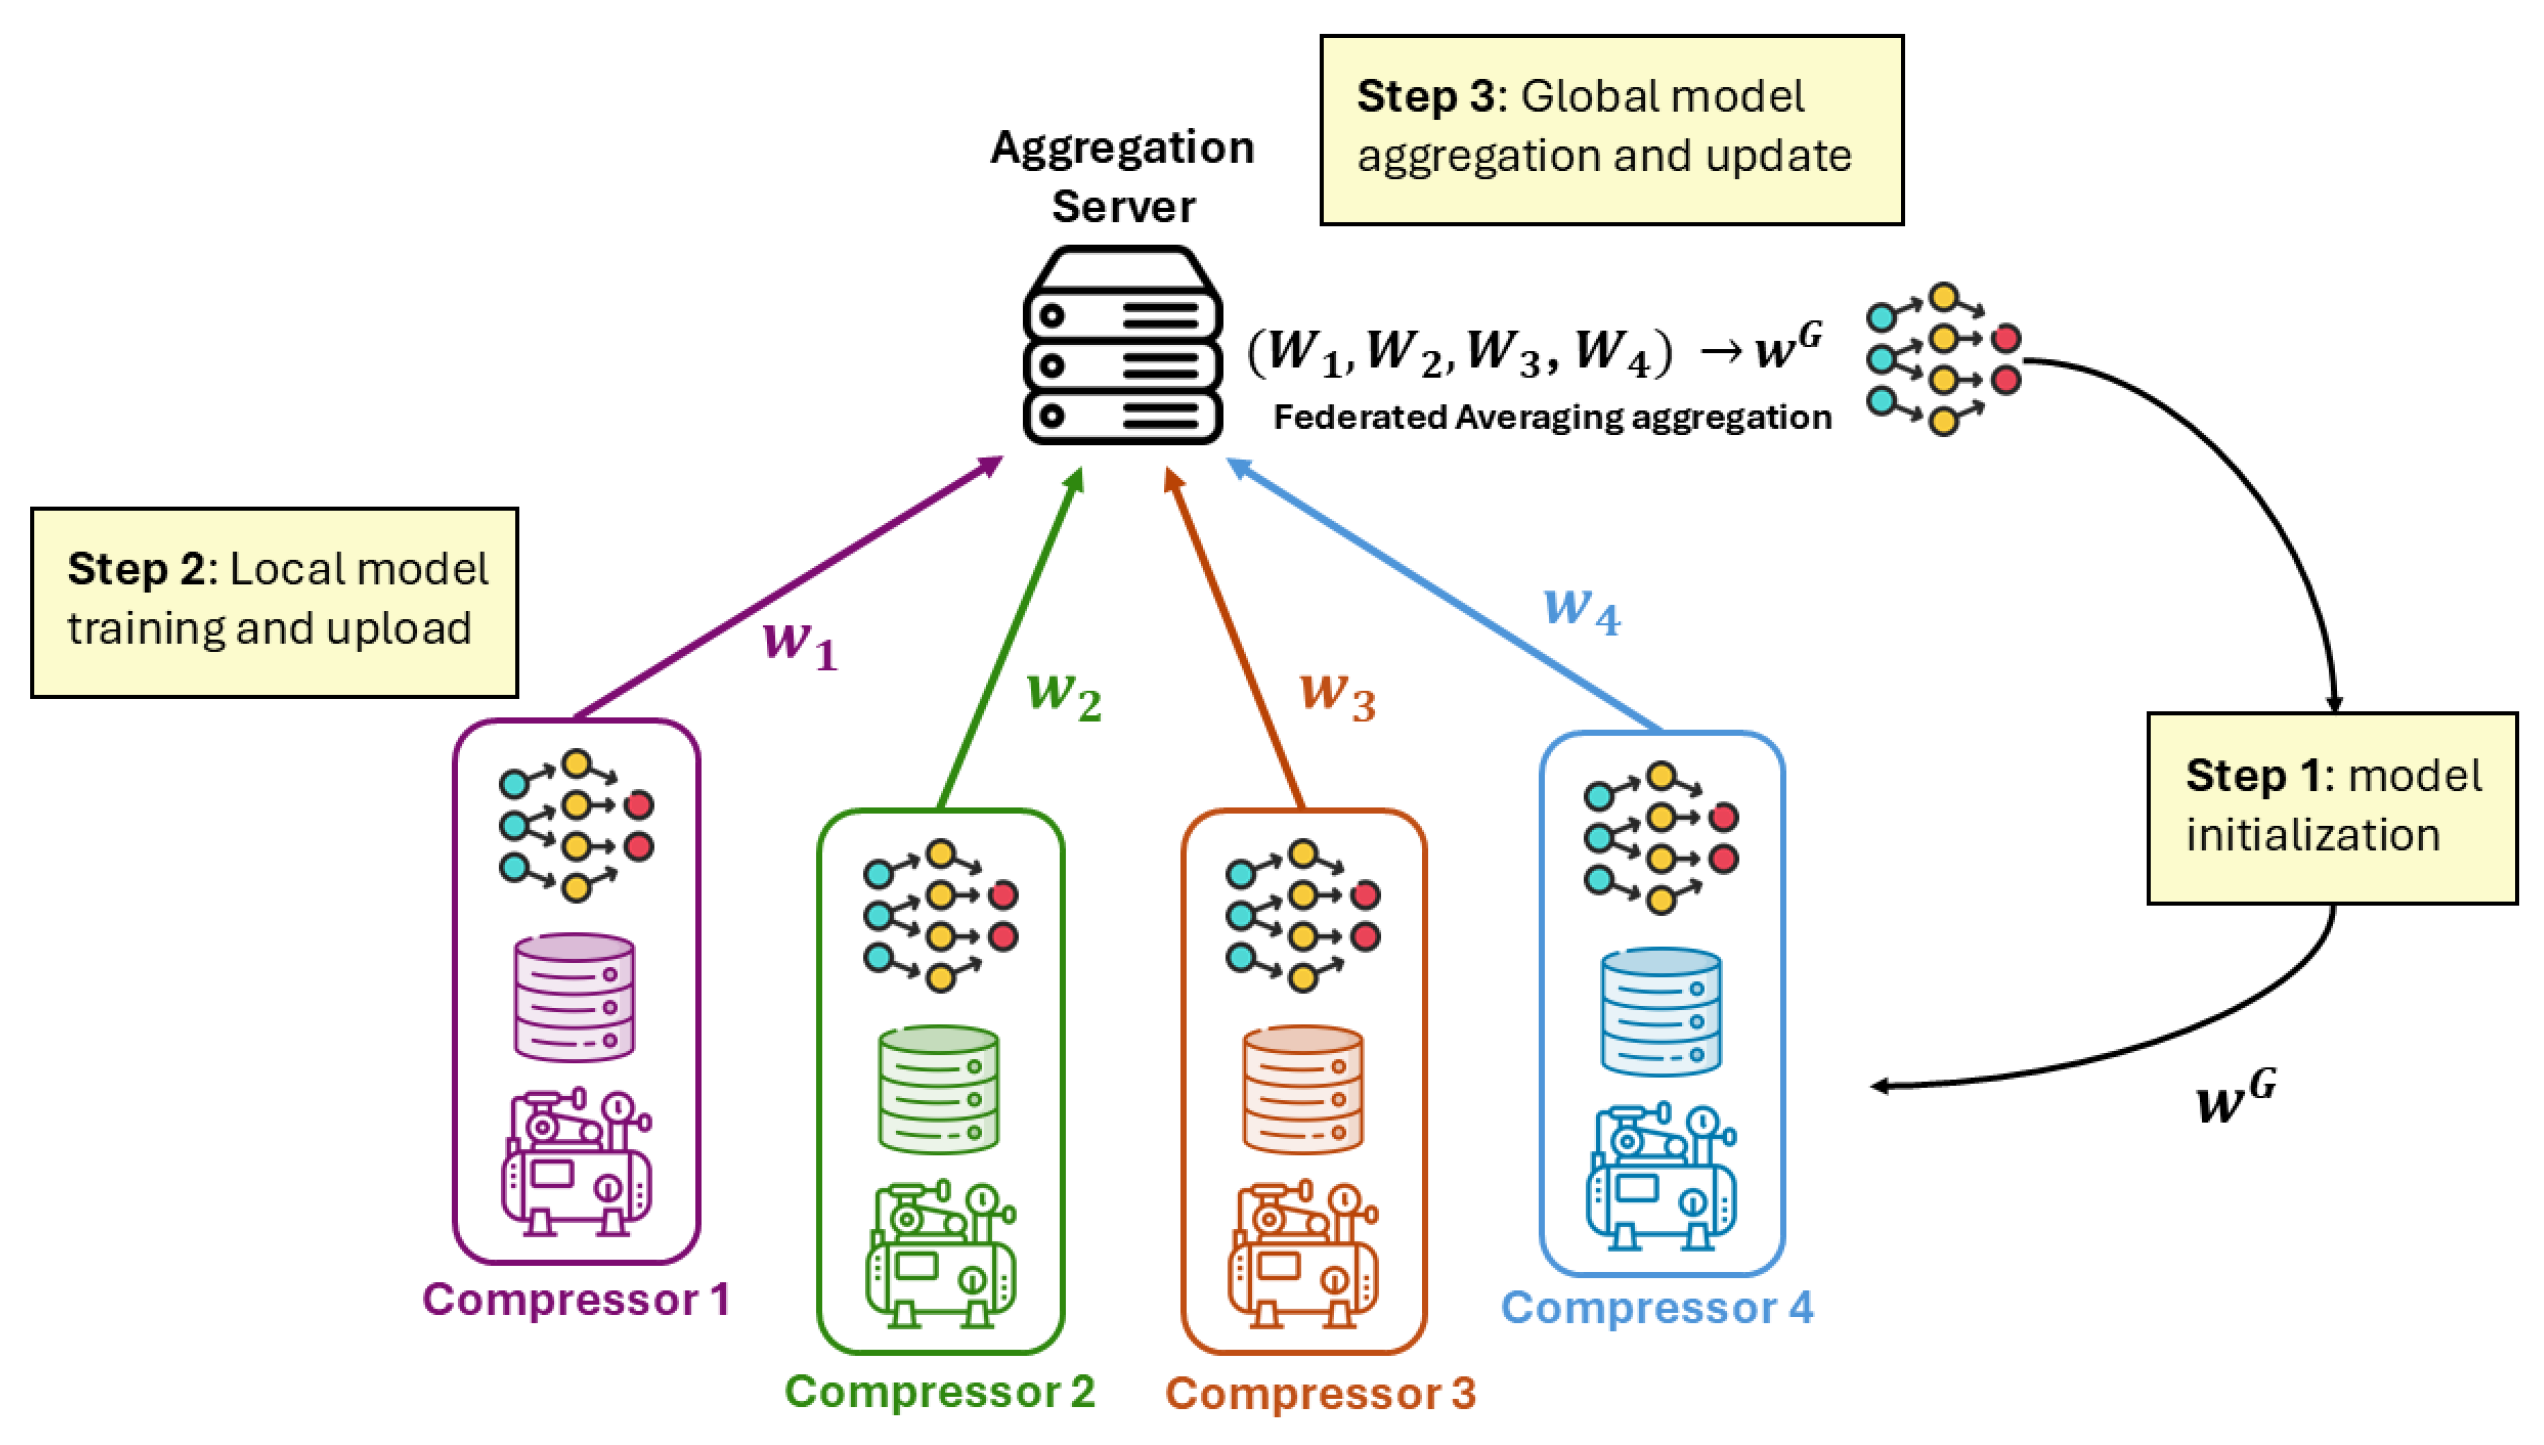
To provide a clearer understanding of the system architecture, we present a general block diagram that illustrates the connections between the different endpoints within our federated learning framework. This diagram visually represents how the server interacts with each client, highlighting the flow of information and the collaborative nature of the training process.
As shown in Figure 9, the federated learning process begins with clients downloading the current global model from the server at the start of each training round. Each client then independently trains this model using its own local dataset, allowing for personalized adaptation to specific operational conditions without compromising data privacy. Once training is complete, clients send only their computed weights back to the server, ensuring that sensitive local data remains secure and are not shared. The pseudo-code of the training process is shown in Algorithm 1.
Algorithm 1: Training process of FL
Input: model architecture M , number of rounds R, datasets D 1 , , D K
Output: trained weights θ of the global server’s model
 1:
Initialize the weights θ of the global server’s model
 2:
Uniquely assign a client to each dataset D i , i = 1 , , K
 3:
for  r o u n d = 1 R do
 4:
    Broadcast M with weights θ to all clients
 5:
    for  c l i e n t = 1 K  do
 6:
        Compute local weights θ c l i e n t by updating θ using D c l i e n t
 7:
        Send θ c l i e n t to the global server
 8:
    end for
 9:
    Update global weights: θ 1 K c l i e n t = 1 K θ c l i e n t
10:
end for
The server plays a crucial role in aggregating these received weights to update the global model, which is then redistributed to all clients at the beginning of the next round. This iterative process not only enhances model accuracy through collaborative learning but also preserves data privacy—a significant advantage in industrial settings where sensitive operational data may be involved.
In more details, our architecture consists of a central server and multiple clients, each representing a different compressor. The server is responsible for coordinating the training process, while each client independently trains a local model on its dataset. In our implementation, we utilized the Flower framework, which simplifies the setup of FL systems.
The server is initiated by running a script that starts the ‘server.py’ process. This server listens for incoming connections from clients and manages the aggregation of model parameters. Each client is represented by a separate process running ‘client.py’, which connects to the server and participates in the training process.
Each client loads its specific dataset corresponding to one of the compressors (e.g., “Compressor 1”, “Compressor 2”, etc.). The datasets are pre-processed locally to ensure they are ready for model training. This includes handling missing values and normalizing the data with the MinMax method. The clients then train their local models using TensorFlow (version 2.14.1), which allows them to learn from their unique datasets without sharing raw data with the server.
Mathematically, FL can be formalized as follows: let D k represent the dataset held by client k, and let θ denote the global model parameters. Each client k computes an update based on its local dataset:
θ k = θ k η F k ( θ k ) ,
where F k ( θ ) is the local loss function computed on D k , η is the learning rate, and F k ( θ k ) represents the gradient of the loss function with respect to the model parameters. After local training, each client sends its updated parameters θ k back to the server, which aggregates these updates to form a new global model [25]:
θ = 1 K k = 1 K θ k ,
where K is the total number of participating clients. This iterative process continues until convergence is achieved or a fixed number of rounds is reached.
The benefits of this federated architecture extend beyond privacy preservation; it also allows for efficient use of computational resources. Clients can train models tailored to their specific operational conditions without needing to centralize vast amounts of data. This decentralized approach not only enhances model robustness by incorporating diverse data distributions but also reduces network bandwidth usage since only model parameters are communicated.
Thus, FL provides a powerful framework for developing predictive maintenance solutions that prioritize data privacy while leveraging collaborative learning across multiple compressors. By integrating this architecture into our anomaly detection system, we aim to improve operational efficiency and reliability in energy-intensive industrial applications.

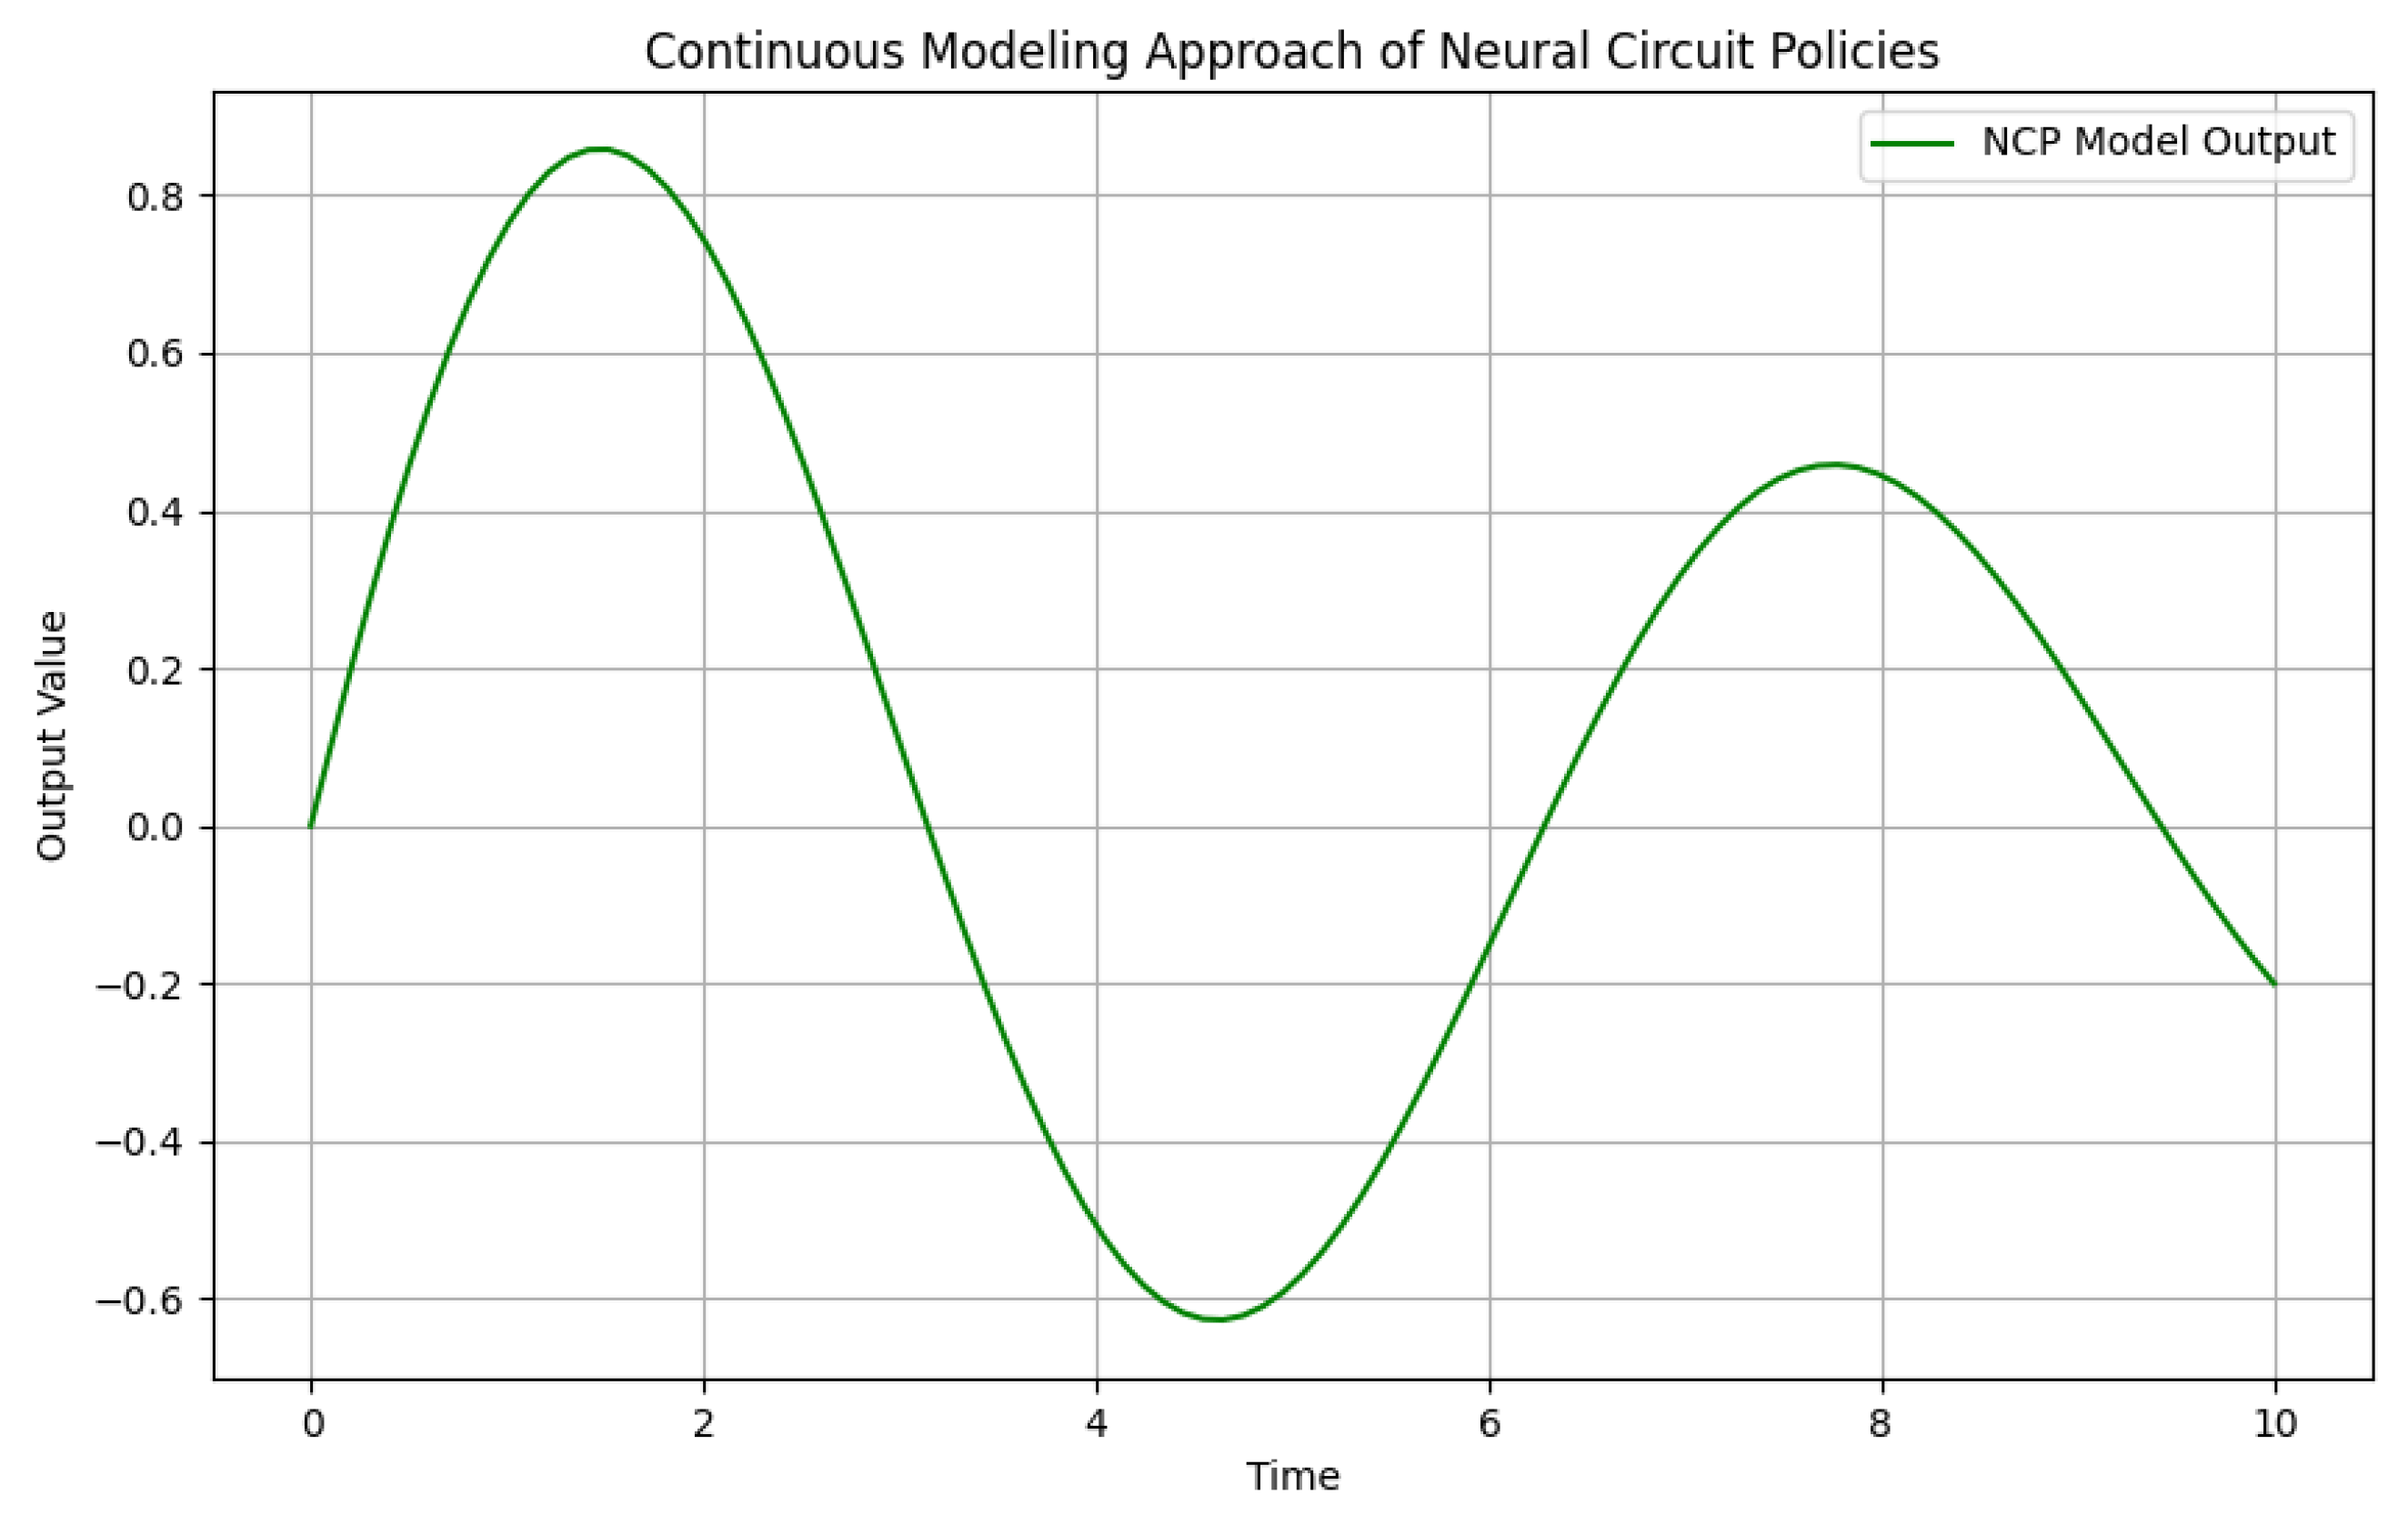
3.2.2. Neural Circuit Policies

Neural Circuit Policies, first proposed by Hasani et al. in [14], are a novel architecture designed to enhance anomaly detection in time series data, particularly in the context of predictive maintenance for compressors. Indeed, NCPs are structured to mimic biological neural circuits, allowing them to process information through interconnected nodes that represent different features of the input data. Each node in the NCP architecture is designed to capture specific aspects of the time series, enabling the model to learn intricate relationships between variables over time. This architecture is particularly advantageous for anomaly detection, as it facilitates the identification of deviations from expected patterns by analyzing how these nodes interact with each other.
Our implementation of NCPs leverages their ability to model complex temporal dependencies while incorporating knowledge of physical constraints, which is critical for accurately identifying anomalies in operational data.
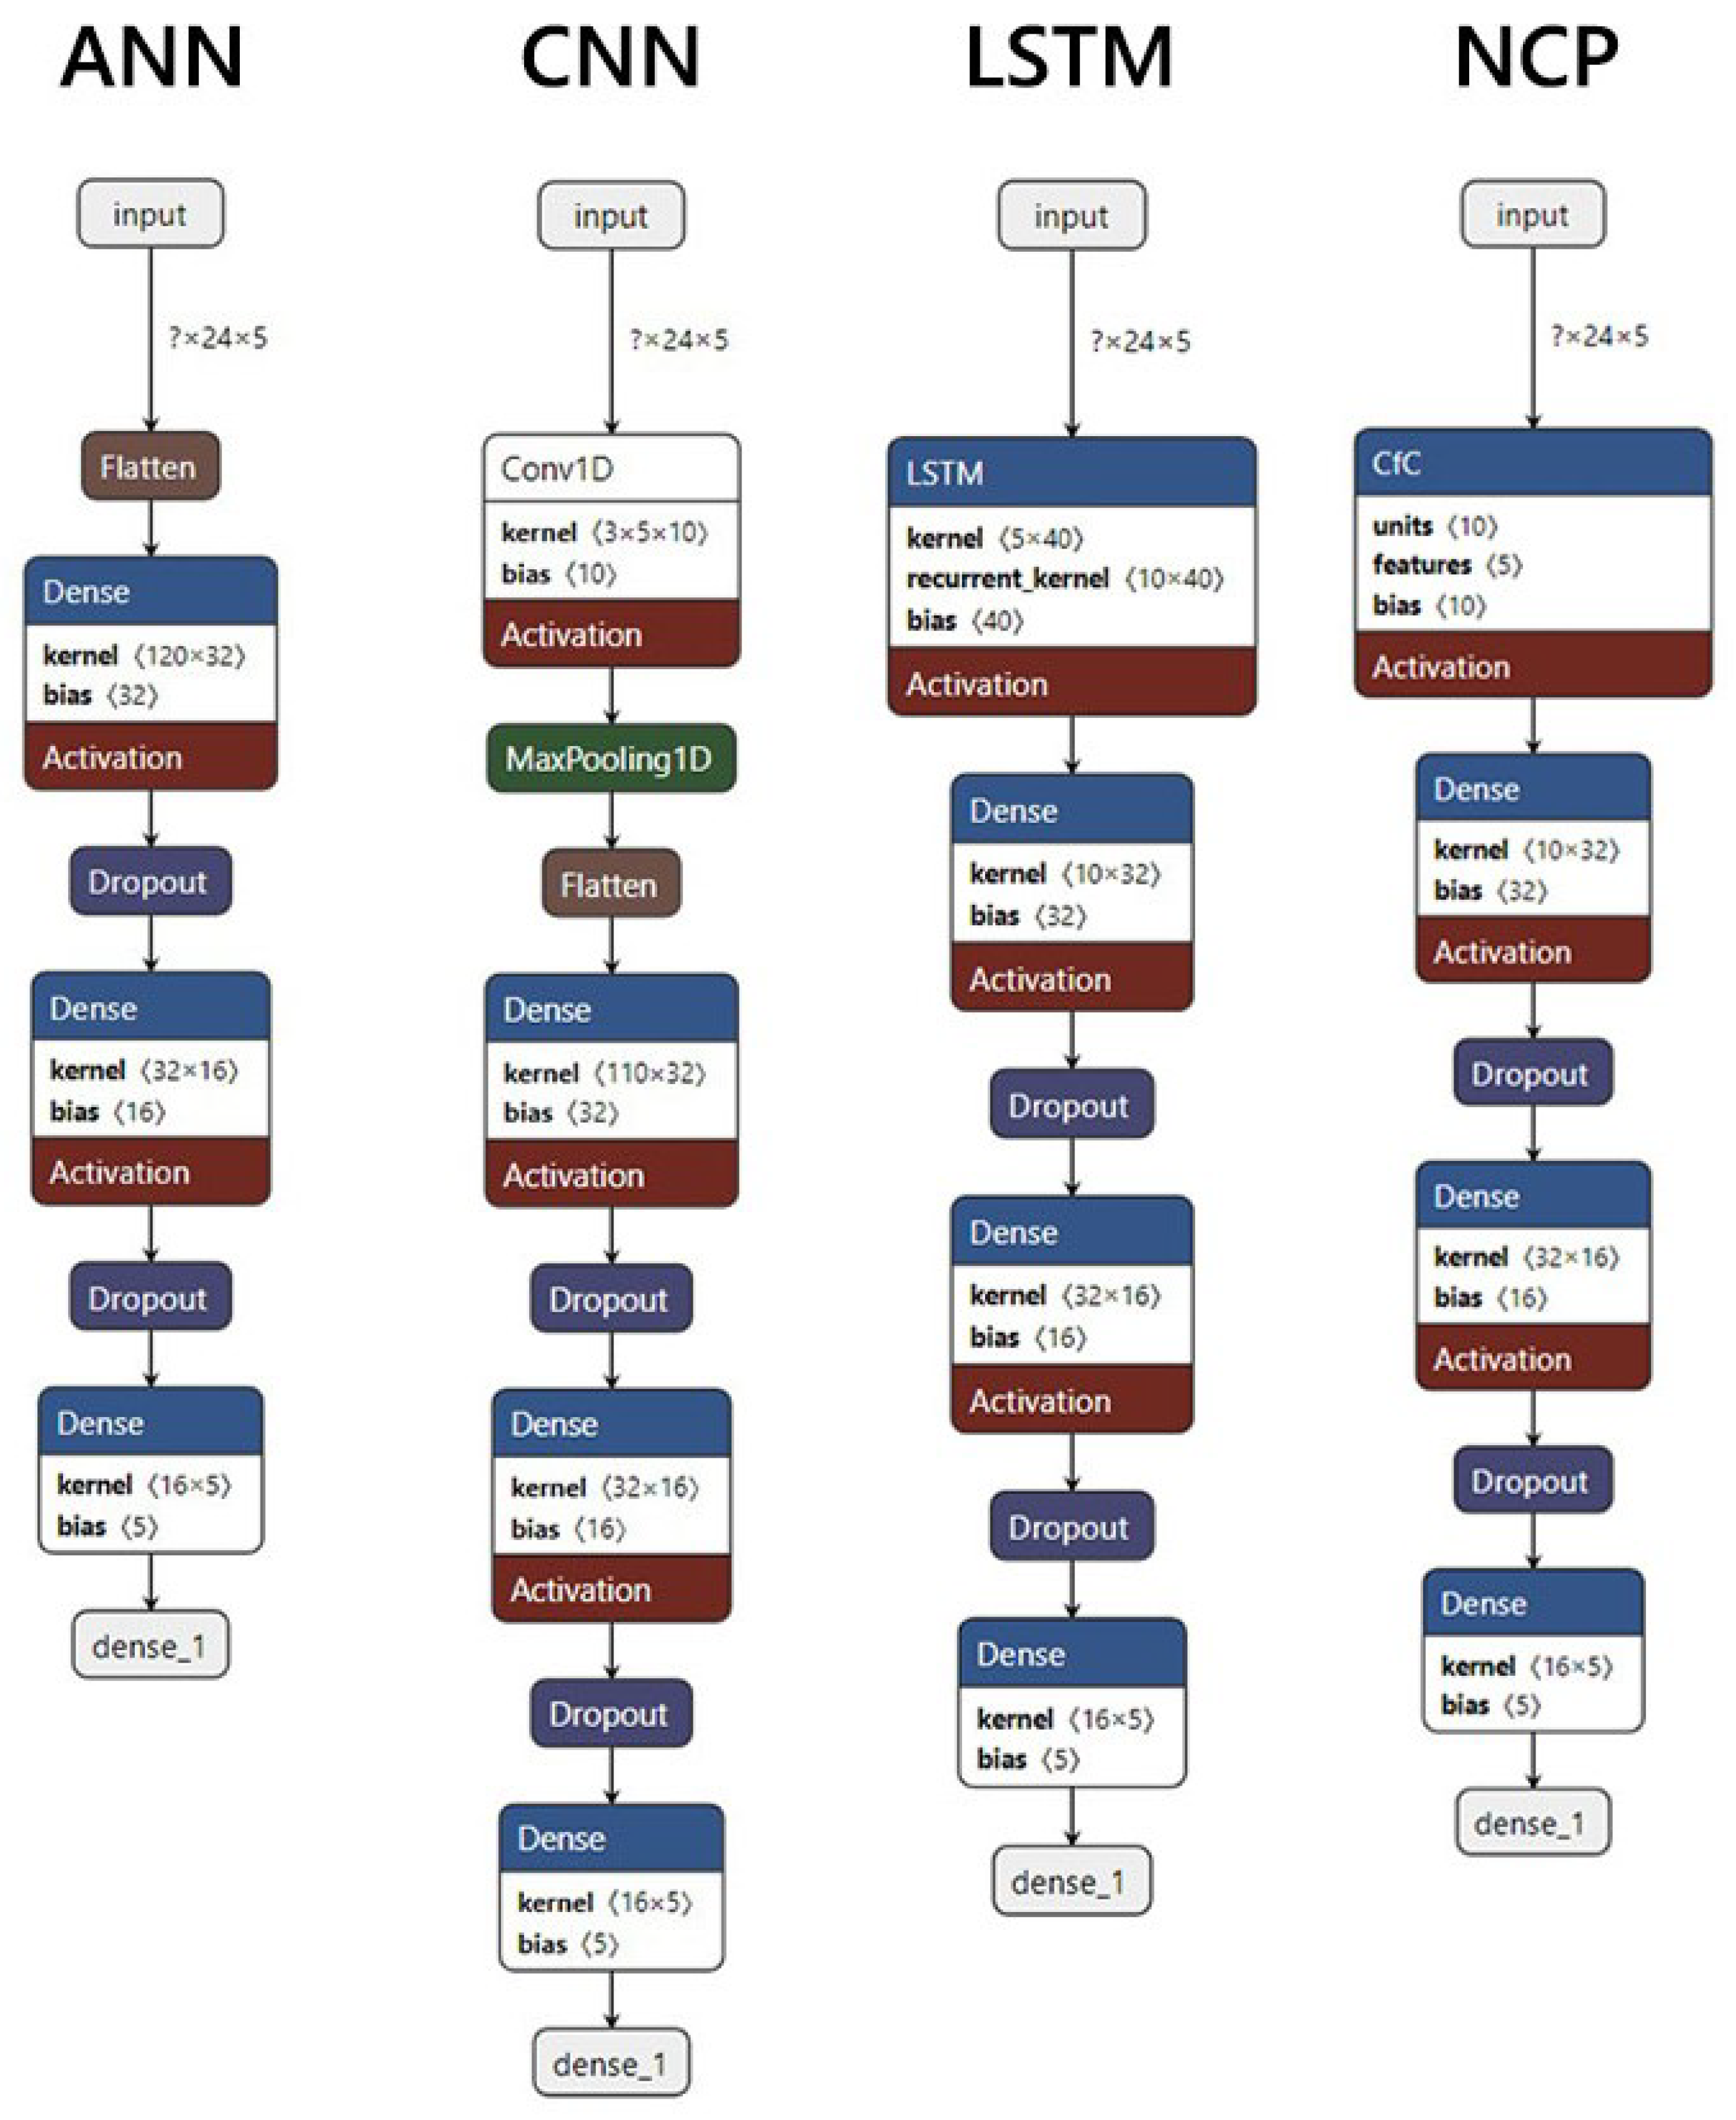
The architecture of our NCP model (see Figure 10) is structured to effectively process sequences of operational data from compressors. The model is defined using TensorFlow and consists of several key components:
  • Input Layer: The model begins with an input layer that accepts data shaped as sequences with a specified number of time steps (in our case, 24) and features (5). This structure allows the model to analyze the historical context of compressor operations over time.
  • NCP Layer (CfC): Central to our architecture is a closed-form continuous-time neural network (CfC) [26], a pivotal component of the NCP framework. The layer leverages feedback mechanisms to maintain a dynamic representation of the system’s state over time. This approach enables the model to effectively capture temporal dependencies and system dynamics, offering advantages over conventional recurrent architectures like LSTM networks, which primarily operate on discrete time intervals without adequately modeling continuous changes. The input–output expression of the CfC layer is an approximation of the closed-form solution of the Liquid Time Constant (LTC) system
    d x d t = w τ + f ( x , I , θ ) x ( t ) + A f ( x , I , θ ) ,
    where at a time step t, x ( t ) R d represents the state of a LTC with d cells, I ( t ) R m is an exogenous input to the system with m features, w τ R d is a time-constant parameter vector, A R d is a bias vector, f is a neural network parametrized by θ , and ⊙ is the Hadamard product.
  • Dense Layers: Following the CfC layer, we include some fully connected (dense) layers. The first dense layer has 32 units with a ReLU activation function, which introduces non-linearity into the model. This is followed by a dropout layer with a rate of 0.2 which prevents overfitting by randomly setting a fraction of input units to zero during training. Subsequent dense layers further refine the model’s output, ultimately producing predictions that correspond to the original feature set.
  • Output Layer: The final output layer consists of 5 units with a linear activation function, corresponding to our input features (current, power factor, energy consumption, reactive energy, and voltage). This configuration allows the model to predict these features directly based on learned patterns from historical data.
The mathematical foundation of NCPs provides several advantages for anomaly detection:
  • Continuous Dynamics: By employing differential equations within the LTC layer, NCPs can capture continuous changes in system states over time. This contrasts with traditional methods that discretize the time domain and may overlook important transitions between states.
  • Robustness to Noise: The interconnected nature of nodes within the NCP architecture enhances its robustness against noise and outliers in operational data. This is particularly important in industrial settings where sensor inaccuracies can lead to erroneous readings.
  • Interactivity Among Nodes: Each node in the NCP interacts dynamically with others, allowing for adaptive learning as new data streams are introduced. This interactivity helps in recognizing patterns that may indicate anomalies based on contextual information derived from multiple features.
Our NCP model is configured to handle multiple training channels simultaneously, enabling it to process data from different compressors concurrently. Each channel corresponds to a specific compressor’s dataset, allowing tailored learning while still contributing to a unified global model. This multi-channel capability ensures that the model can learn from diverse operational conditions across various machines, enhancing its generalization ability when detecting anomalies.
Thus, our implementation of Neural Circuit Policies provides a powerful framework for detecting anomalies in time series data through its innovative architecture and mathematical foundations. By integrating physical knowledge with advanced modeling techniques, NCPs enhance our ability to identify operational irregularities in compressors effectively. This makes them particularly suitable for predictive maintenance applications where timely detection of anomalies can lead to significant cost savings and improved operational efficiency.

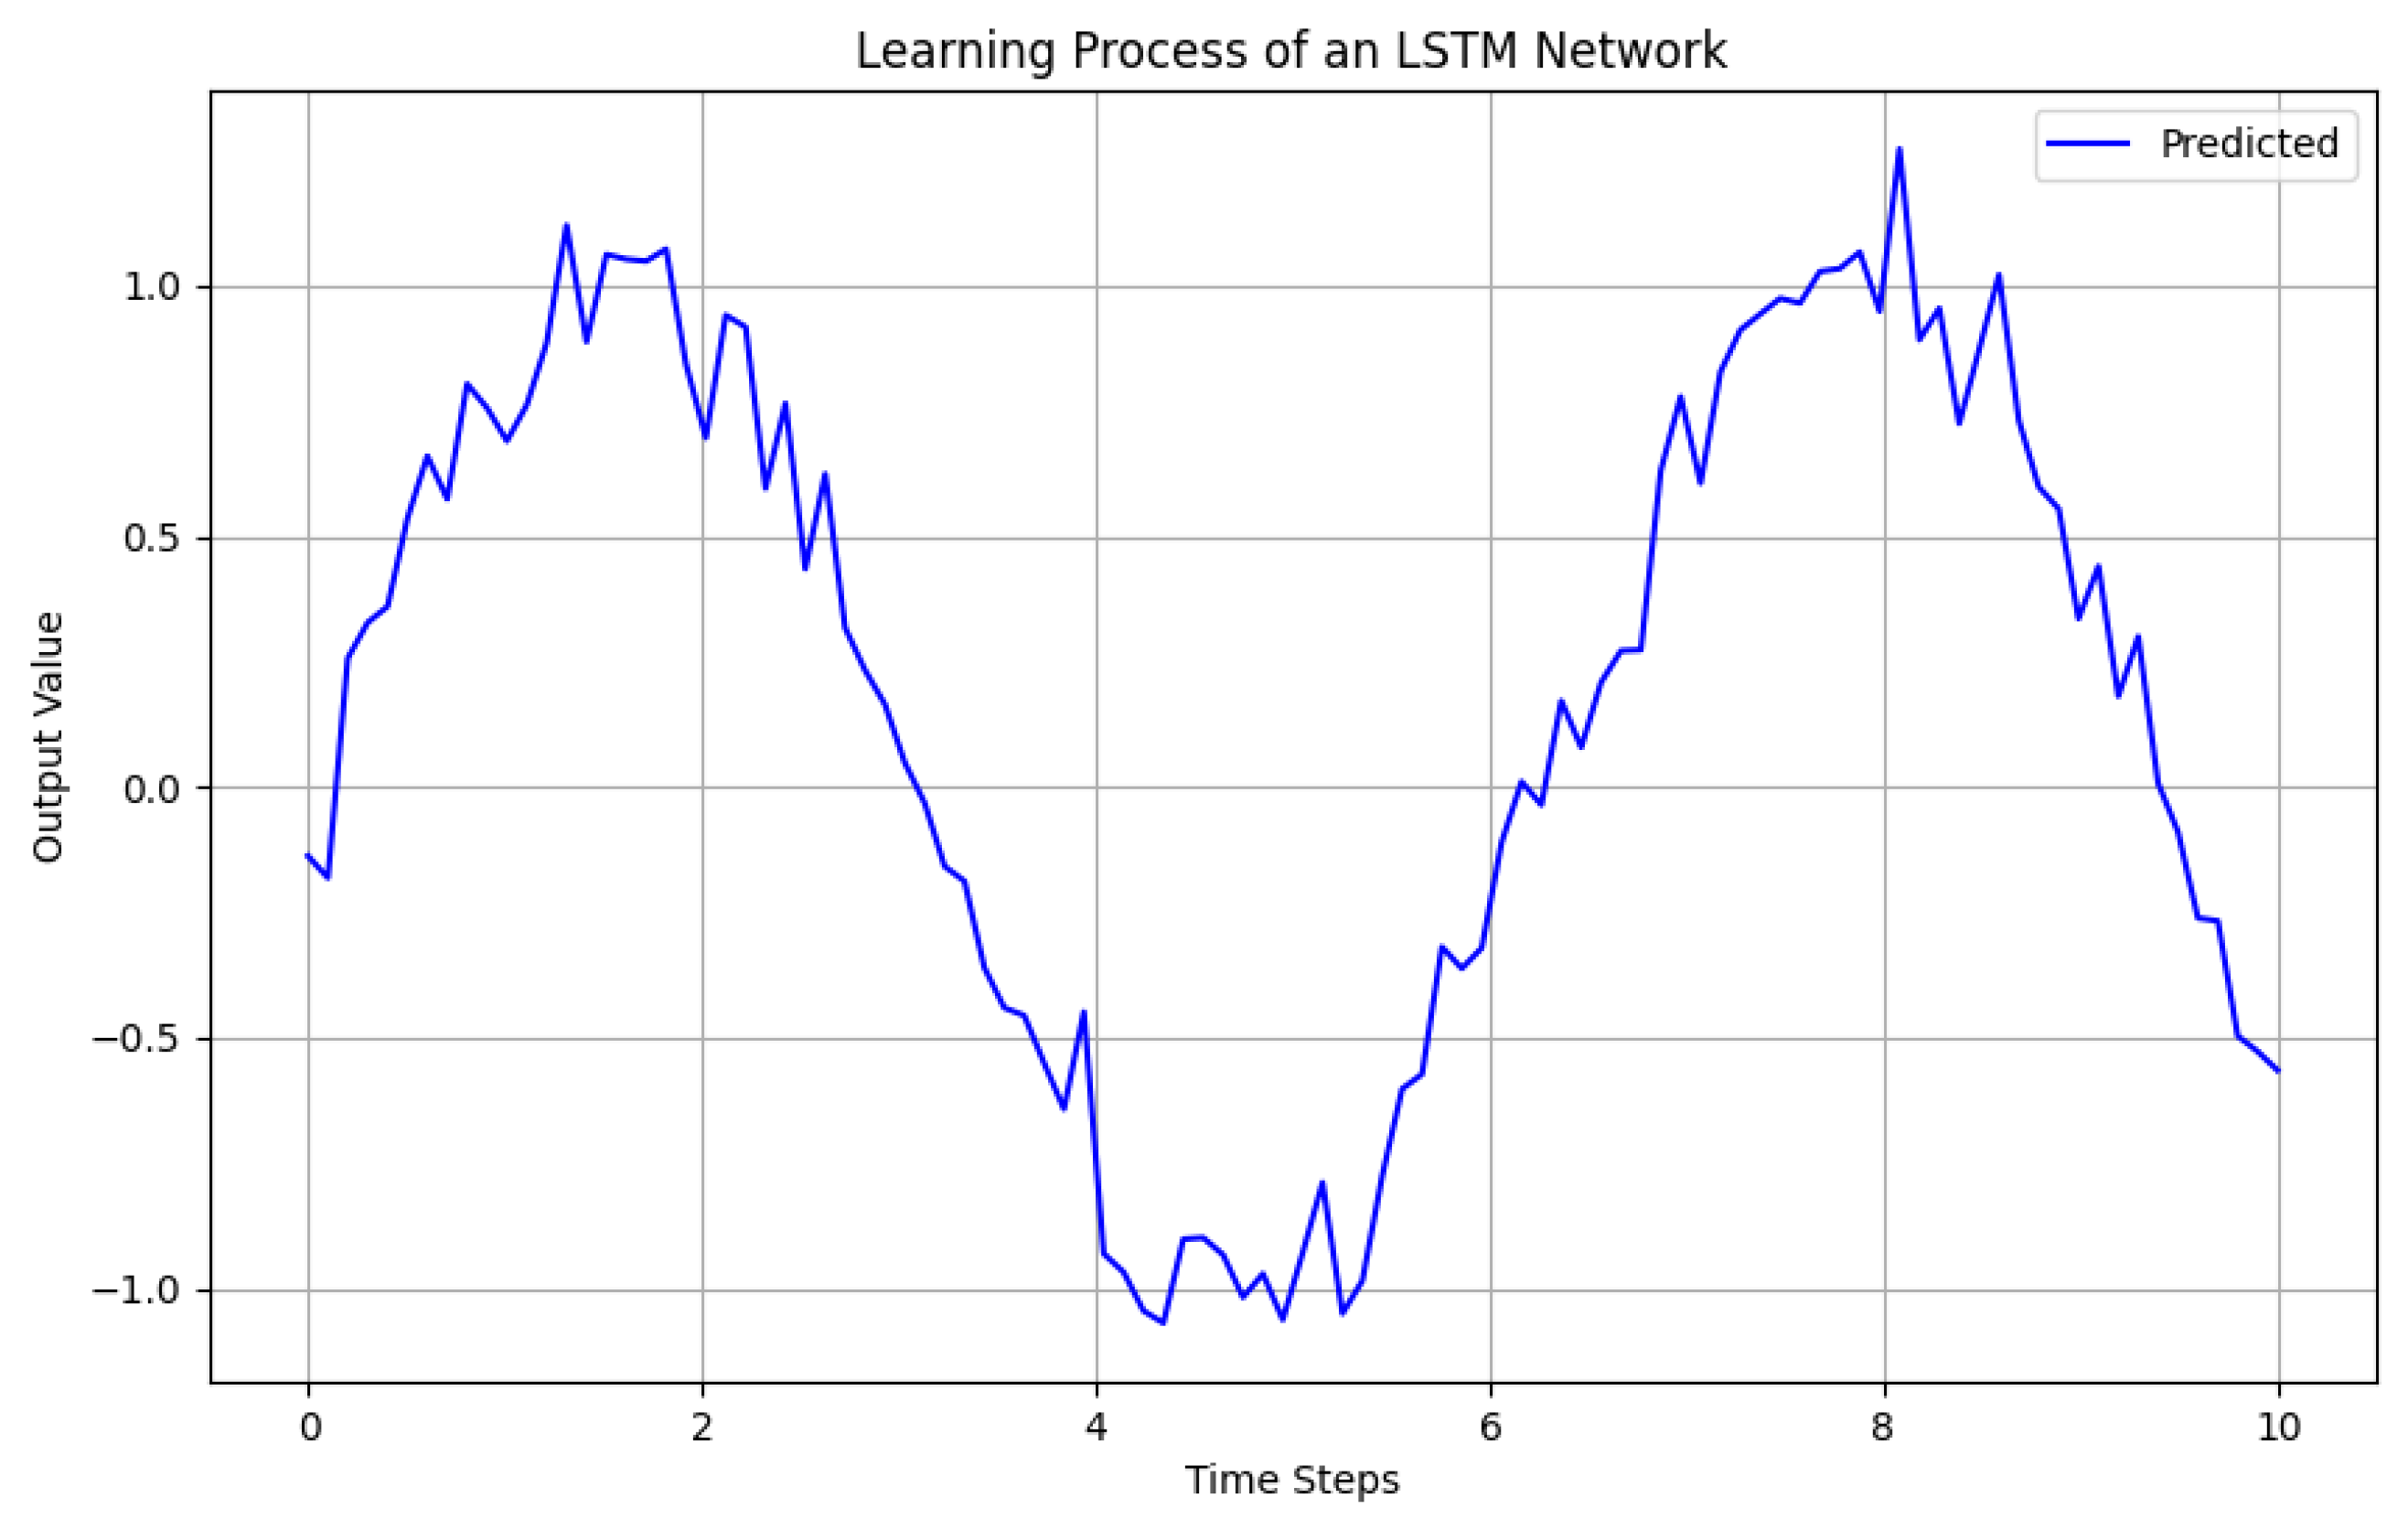
3.2.3. Long Short-Term Memory Networks

Long Short-Term Memory networks are a type of recurrent neural network (RNN) specifically designed to model sequential data and capture long-term dependencies. In our study, we implemented an LSTM architecture to detect anomalies in time-series data from compressors, providing a robust alternative to NCPs. The primary goal of using LSTMs is to leverage their ability to learn from historical sequences, making them suitable for applications where temporal patterns are critical.
The architecture of our LSTM model (see Figure 10) is structured using TensorFlow and consists of several key components:
  • Input Layer: The model begins with an input layer that accepts sequences shaped as ‘(timesteps, features)’, where ‘timesteps’ corresponds to the number of past observations (in our case, 24 h), and ‘features’ represents the different operational metrics being monitored (5 features in total).
  • LSTM Layer: the core of our architecture is a LSTM layer with 10 units and set to ‘return_sequences = False’, meaning it outputs only the final output for the entire sequence. This configuration allows the model to distill information from all time steps into a single representation that can be used for final predictions.
  • Dense and Dropout Layers: the layers after the LSTM are the same in the proposed NCP architecture.
  • Output Layer: as in our NCP model, the final output layer consists of 5 units with a linear activation function, corresponding to our input features (current, power factor, energy consumption, reactive energy, and voltage). This structure enables the model to predict these features based on learned patterns from historical data.
The mathematical foundation of LSTMs [27] provides several advantages for anomaly detection:
  • Memory cells: LSTMs utilize memory cells that maintain information over long periods, which is crucial for learning dependencies in sequential data. Each memory cell contains three gates: input, forget, and output gates that control the flow of information. The equations governing these gates can be expressed as follows:
    f t = σ ( W f · [ h t 1 , x t ] + b f ) ( forget gate ) , i t = σ ( W i · [ h t 1 , x t ] + b i ) ( input gate ) , o t = σ ( W o · [ h t 1 , x t ] + b o ) ( output gate ) , C t = f t * C t 1 + i t * C ˜ t ( cell state update ) h t = o t * tanh ( C t ) ( hidden state ) .
    Here, W f , W i , W o are weight matrices, b f , b i , b o are bias vectors, C t is the cell state at time t, and h t is the hidden state output.
  • Long-term dependencies: By effectively managing long-term dependencies through its gating mechanisms, LSTMs can learn complex temporal patterns that are crucial for detecting anomalies in compressor operations.
  • Robustness: LSTMs are inherently robust against issues such as vanishing gradients that often plague traditional RNNs. This robustness makes them particularly suitable for processing long sequences of operational data.
Similar to our NCP implementation, our LSTM model is designed to handle multiple training channels simultaneously. Each channel corresponds to a specific compressor’s dataset, enabling tailored learning while still contributing to a unified global model. This multi-channel capability allows the LSTM to learn from diverse operational conditions across various machines, enhancing its ability to generalize when detecting anomalies.
Thus, LSTM networks provide a powerful framework for detecting anomalies in time series data through their specialized architecture and mathematical foundations. By leveraging their ability to learn from historical sequences and manage long-term dependencies effectively, LSTMs enhance our capacity to identify operational irregularities in compressors. This makes them particularly suitable for predictive maintenance applications where timely detection of anomalies can lead to significant cost savings and improved operational efficiency.

3.3. Comparative Analysis of Federated Learning with Neural Circuit Policies and Long Short-Term Memory Networks

In the context of predictive maintenance, particularly for energy-intensive machinery, the choice of model architecture is crucial for effective anomaly detection. This subsection presents a theoretical comparative analysis between FL integrated with NCPs and FL combined with LSTM networks. The aim is to demonstrate that NCPs, grounded in differential equations, offer superior performance compared to the synthetic learning approach of LSTMs.

3.3.1. Theoretical Foundations

LSTM networks are designed to capture temporal dependencies in sequential data through a series of memory cells and gating mechanisms. They process information in discrete time in order to learn patterns from historical data effectively. However, this discrete framework can lead to limitations when modeling systems governed by continuous dynamics, as it may struggle to accurately represent real-world processes that unfold over time. LSTMs rely on their ability to remember past inputs and use this information to predict future outcomes, but they do so in a manner that can be less interpretable regarding the underlying physical processes involved.
In contrast, NCPs leverage ordinary differential equations to model system dynamics continuously. This approach allows NCPs to directly incorporate physical constraints and principles governing the behavior of the machinery being monitored. By modeling the state evolution of a system based on its physical laws, NCPs provide a more intuitive understanding of how different factors influence system performance over time. For instance, in energy systems, processes such as battery charging and discharging can be represented more naturally using ODEs rather than relying on discrete updates characteristic of LSTM networks.

3.3.2. Performance Implications

The implications of these theoretical differences are profound when it comes to model performance in predictive maintenance applications. NCPs’ ability to capture continuous dynamics enables them to generate more reliable forecasts that align closely with real-world constraints. While LSTMs may excel at capturing certain historical patterns, they can falter when faced with sudden changes or anomalies that deviate from learned behaviors. NCPs, on the other hand, can adapt more readily to such changes due to their grounding in physical laws.
Moreover, the interpretability of NCPs represents a significant advantage over LSTMs. The explicit representation of physical dynamics allows stakeholders to understand how various inputs affect system states and decisions made by the model. This transparency is particularly valuable in industrial settings where operators need to justify maintenance decisions based on model outputs.
To further illustrate these concepts, we present two figures: Figure 11 depicts the learning process of an LSTM network, while Figure 12 illustrates the continuous modeling approach of NCPs.
Thus, while both FL with NCPs and LSTM networks provide frameworks for anomaly detection in predictive maintenance, the theoretical foundations underpinning these models suggest that NCPs offer distinct advantages. Their reliance on differential equations enables them to model continuous processes more effectively and in a more interpretable way than LSTMs, which are constrained by their discrete-time approach.

3.4. Mathematical Justification for Model Selection

In our approach to anomaly detection for compressors in the leather tanning industry, we focused on comparing LSTM networks and NCPs within a federated learning framework. While various models exist in the literature for anomaly detection, such as Isolation Forest [28], Local Outlier Factor (LOF) [29], and Histogram-Based Outlier Score (HBOS) [30], we intentionally excluded these methods from our comparative analysis. This decision was based on several key considerations that highlight the unique requirements of our application.
To effectively analyze and model anomaly detection in compressors, it is essential to understand the unique characteristics of time-series data generated by these systems, which exhibit temporal dependencies and dynamic behaviors that significantly influence their operational performance.
Compressors generate time-series data characterized by temporal dependencies, which can be mathematically represented as follows:
X t = f ( X t 1 , X t 2 , , X t n ) + ϵ t ,
where X t is the observation at time t, f is a function capturing the relationship between current and past observations, and ϵ t represents noise in the system.
While LSTMs and NCPs are specifically designed to capture the temporal dependencies and continuous dynamics inherent in time-series data, traditional anomaly detection models such as Isolation Forest, LOF, and HBOS lack the necessary mechanisms to effectively analyze such data.
Isolation Forest operates by constructing random decision trees to isolate observations. The underlying assumption is that anomalies are easier to isolate than normal points. However, this method does not take into account the sequential nature of time-series data. Each observation’s context—i.e., its relationship with previous observations—is ignored, leading to potential misclassification of anomalies that may appear normal when considered in isolation but are anomalous in the context of their temporal sequence.
In particular, Isolation Forest isolates anomalies based on random partitions of data points but does not account for their temporal context:
D ( x ) = 2 E ( h ( x ) ) c ( n ) ,
where D ( x ) is the anomaly score for observation x, E ( h ( x ) ) is the expected path length to isolate point x, and c ( n ) is a normalization factor based on the number of observations.
Similarly, LOF measures the local density deviation of a given data point with respect to its neighbors. While it is effective for identifying outliers in static datasets, it fails to account for temporal correlations between observations. In time-series data, the significance of an observation can change dramatically based on its position in the sequence; thus, LOF’s reliance on local density alone is insufficient for capturing these dynamic relationships.
On the other hand, HBOS computes outlier scores based on the distribution of feature values within histograms. This approach is inherently static and does not consider the ordering of observations over time. As a result, HBOS may overlook critical patterns and trends that emerge from the temporal arrangement of data points, leading to inaccurate anomaly detection in scenarios where timing is crucial.
Thus, while Isolation Forest, LOF, and HBOS can be effective in certain contexts, their inability to model temporal dependencies makes them unsuitable for analyzing time-series data generated by compressors. In contrast, LSTMs and NCPs provide robust frameworks capable of capturing these essential dynamics, thereby enhancing the accuracy and reliability of anomaly detection in predictive maintenance applications.
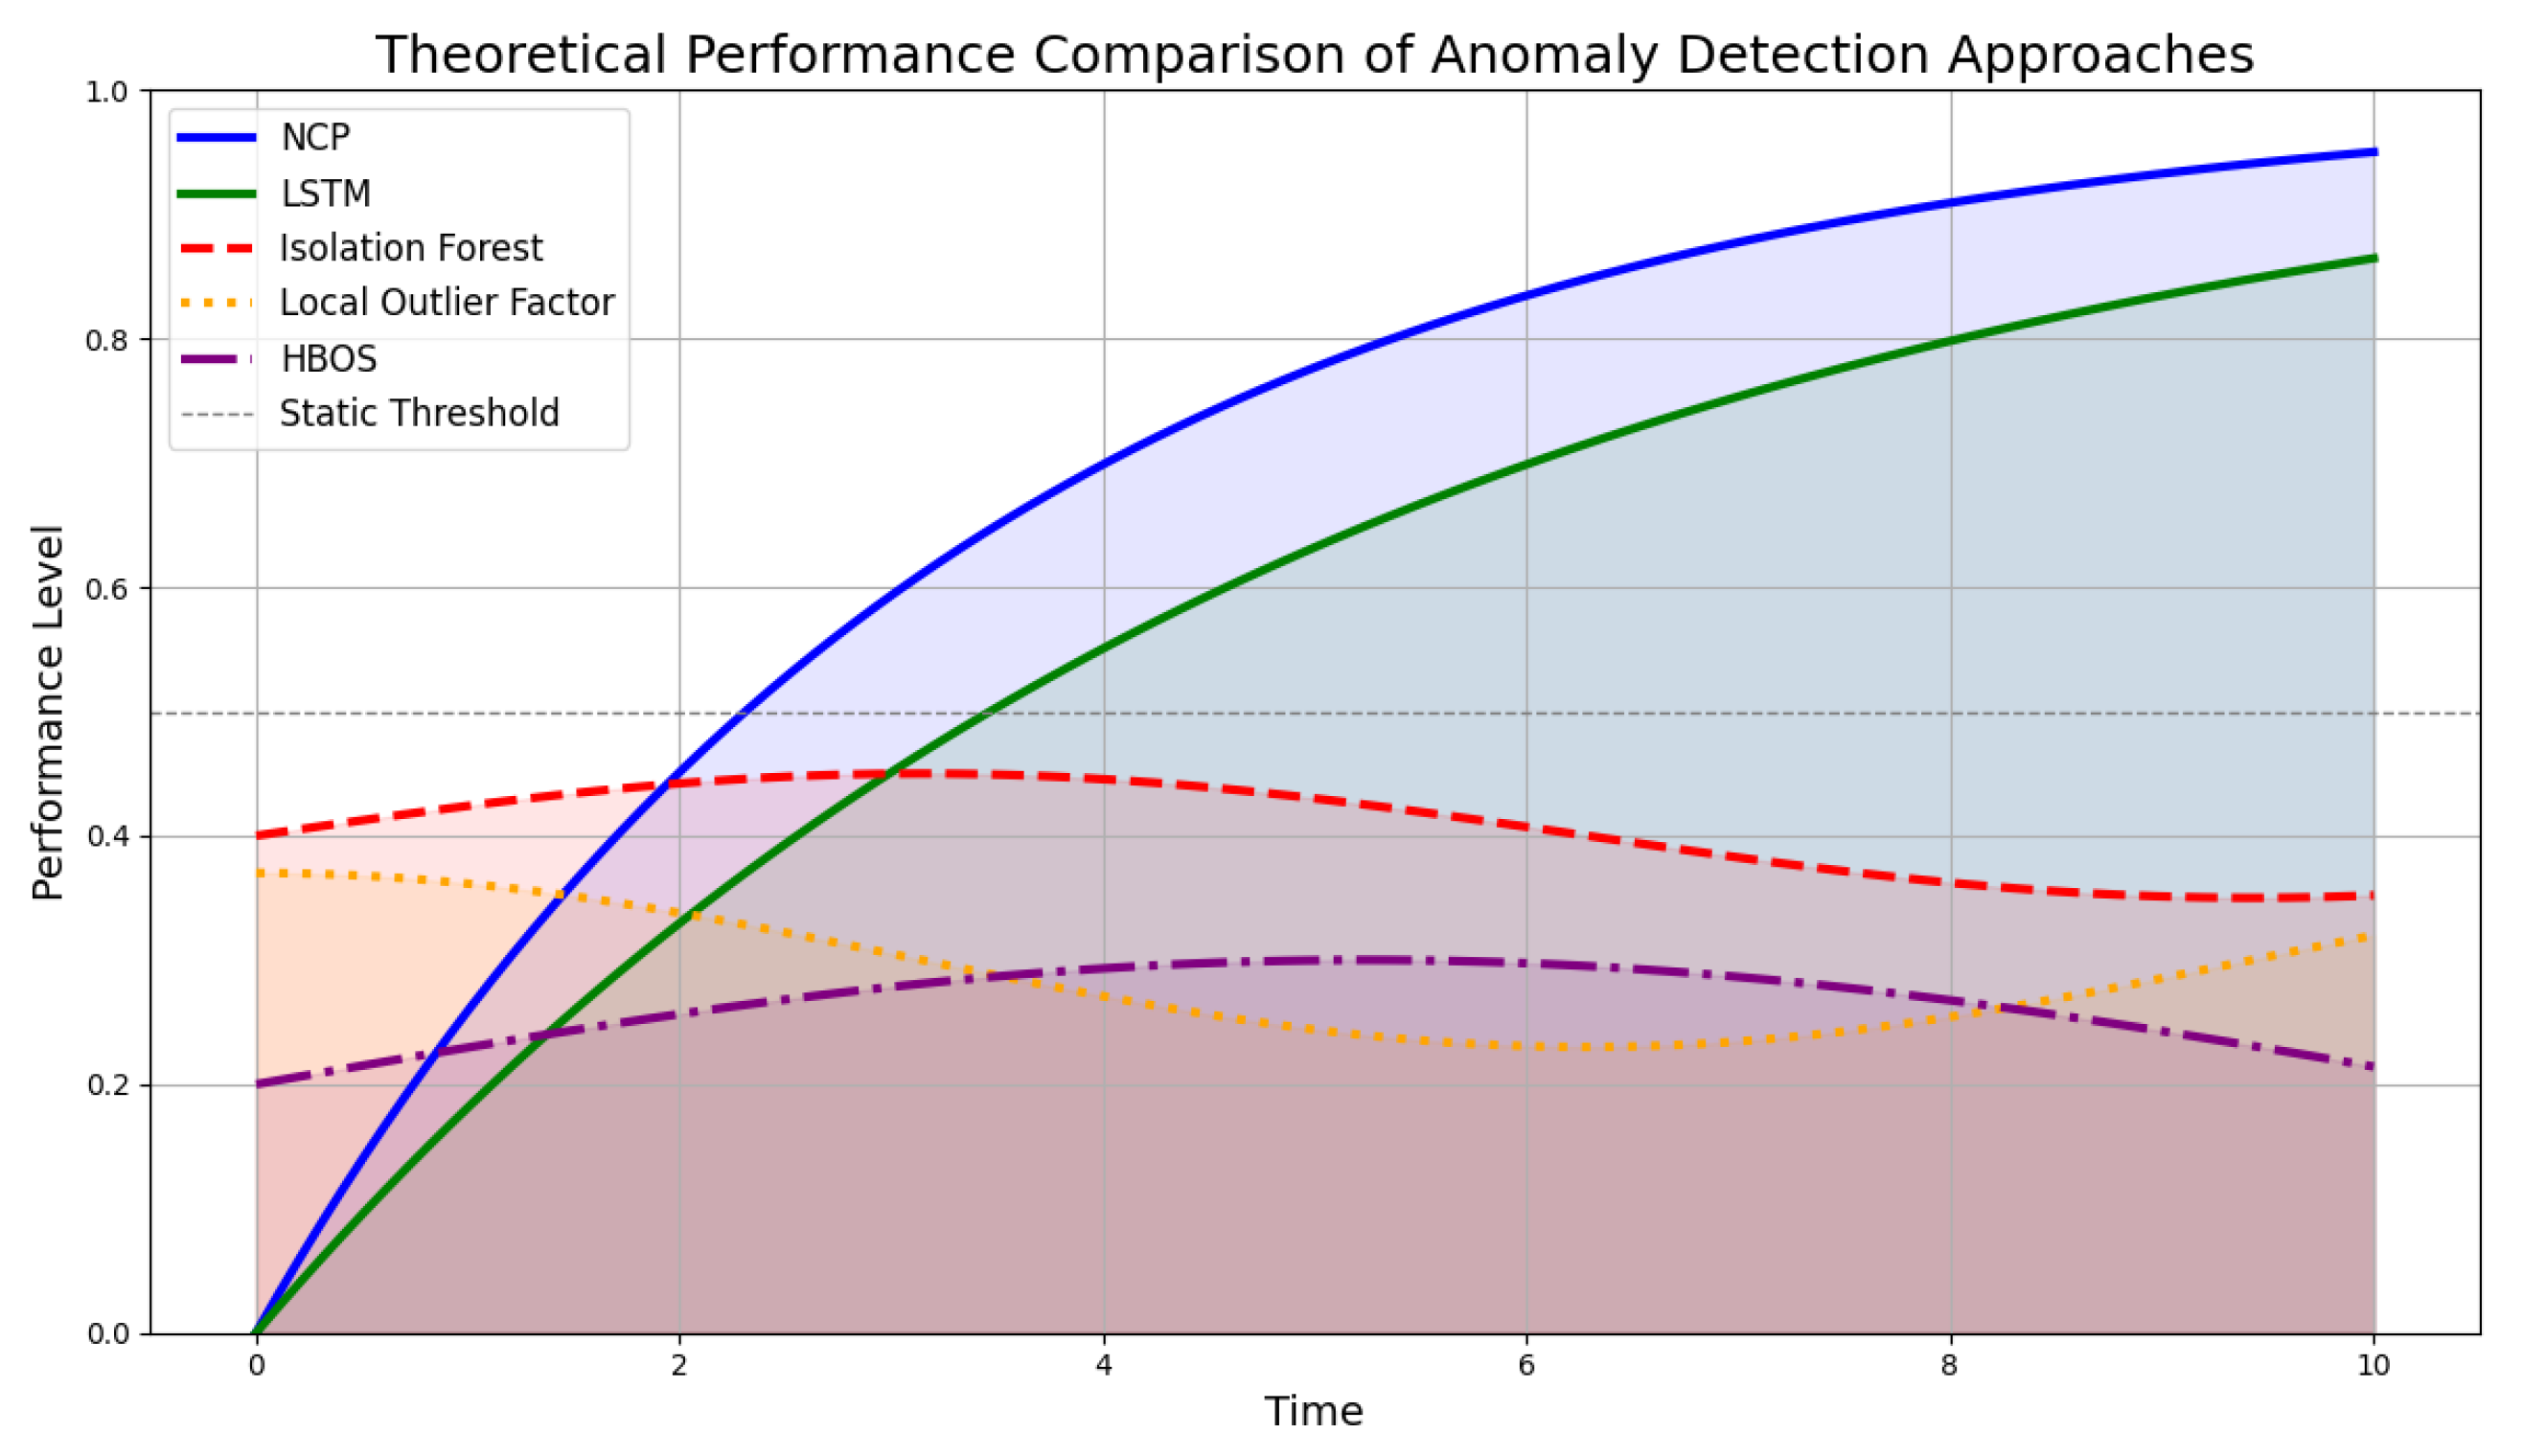
To effectively illustrate the theoretical differences in how various models approach anomaly detection in time-series data generated by compressors, we present a refined conceptual graph (see Figure 13). This graph simulates the performance characteristics of Long Short-Term Memory networks and Neural Circuit Policies compared to traditional anomaly detection methods such as Isolation Forest, Local Outlier Factor, and Histogram-Based Outlier Score (HBOS).
The curves represent the ability of each model to capture temporal dependencies over time. The LSTM curve demonstrates a gradual improvement in performance as it learns from sequential data, effectively adapting to changes and capturing patterns. This reflects the reality of time-series data where anomalies often evolve gradually rather than appearing abruptly. Similarly, the NCP curve reflects its strength in modeling continuous dynamics through differential equations, showcasing its capability to understand underlying physical processes. By leveraging mathematical representations of system behavior, NCPs can better anticipate shifts in operational conditions.
In contrast, the curves for traditional models indicate a relatively static performance that does not improve significantly over time due to their reliance on isolated observations without considering temporal context. The Isolation Forest curve exhibits minor fluctuations, highlighting its focus on identifying anomalies based solely on their distance from other points, rather than on any temporal progression. The Local Outlier Factor curve shows similar behavior, with slight variations reflecting local density changes but lacking a robust response to temporal trends. This limitation underscores its inability to track evolving patterns in data effectively. The HBOS curve follows a comparable trajectory, emphasizing its reliance on histogram-based scoring that fails to account for sequential dependencies. As a result, these traditional models may miss critical insights that arise from the temporal nature of the data.
This visualization emphasizes why LSTMs and NCPs are more suitable for analyzing time-series data in predictive maintenance applications. Their ability to learn from historical sequences allows for more accurate anomaly detection and ultimately leads to better decision-making in dynamic environments.

3.5. Comparison with Additional Machine Learning Models

To further substantiate our findings and provide a comprehensive evaluation of our proposed approach, we expanded our analysis to include comparisons with additional machine learning models, specifically Convolutional Neural Networks (CNNs) and Artificial Neural Networks (ANNs). This decision was motivated by the need to benchmark our Neural Circuit Policies against a broader spectrum of established models in the context of anomaly detection for compressors used in leather tanning facilities.
The inclusion of CNNs and ANNs in our comparative analysis is particularly relevant given their widespread application in various domains, including time series analysis and anomaly detection. CNNs, known for their ability to automatically extract spatial hierarchies of features through convolutional layers, can be effective in identifying patterns within time series data. On the other hand, ANNs provide a flexible architecture that can model complex relationships within data, making them suitable for capturing non-linear dependencies.
In our comparative analysis, we utilized a consistent set of experimental parameters across all models to ensure a fair evaluation of their performance in anomaly detection for compressors. The hyperparameters for our experiments included a batch size of 8, a learning rate of 0.005, 4 clients participating in the federated learning process, 50 epochs for training, and 5 rounds of training. Each input sequence consisted of 24 timesteps with 5 features, and we allocated 65% of the data for training purposes.
The architecture of the ANN was specifically designed to effectively capture the underlying patterns in the time series data. The model consists of an input layer that accepts sequences shaped according to the defined timesteps (24) and features (5). Following this, we implemented three dense layers with ReLU activation functions. The first two dense layers contain 32 neurons each, allowing the model to learn complex representations of the data. Each of these layers is followed by a dropout layer with a rate of 0.2 to mitigate overfitting by randomly deactivating a fraction of neurons during training. The final output layer consists of 5 neurons with a linear activation function, producing predictions for each feature. The flowchart outlining the structure and operation of the ANN is presented in Figure 10.
For the CNN, we adopted an architecture that leverages convolutional layers to automatically extract relevant features from the time series data. The model begins with an input layer that accepts sequences shaped according to the defined time steps (24) and features (5). This is followed by a 1D convolutional layer with 10 filters and a kernel size of 3, designed to capture local patterns in the data. After this convolutional layer, we include a max pooling layer with a pool size of 2 to reduce dimensionality while retaining essential features.
The flattened output from the pooling layer is then passed through two dense layers with ReLU activations containing 32 and 16 neurons. Each dense layer is followed by a dropout layer with a rate of 0.2 to enhance generalization. The final output layer consists of 5 neurons with a linear activation function, providing predictions for each feature.
The CNN architecture was chosen due to its proven effectiveness in capturing spatial hierarchies and local dependencies within sequential data, making it particularly suitable for time series analysis. By employing convolutional operations, we aimed to improve the model’s ability to identify patterns indicative of anomalies in compressor operations. The flowchart outlining the structure and operation of the ANN is presented in Figure 10.
We now present the results of our comparative analysis of the performance of NCPs, LSTM networks, CNNs, and ANNs in detecting anomalies in compressor operations. To evaluate the effectiveness of each model, we employed several performance metrics: Mean Squared Error (MSE), Mean Absolute Error (MAE), Root Mean Squared Error (RMSE), and the Coefficient of Determination (R2). These metrics have been chosen for their ability to provide a comprehensive understanding of model accuracy and predictive capability.
Each metric was chosen for its relevance to our specific problem:
  • Mean Squared Error (MSE): This metric quantifies the average squared differences between predicted and actual values. MSE is particularly useful in our context because it penalizes larger errors more heavily, which is critical in anomaly detection where significant deviations from expected operational metrics can indicate serious issues. By focusing on squared differences, MSE provides insights into the model’s overall accuracy and helps identify models that perform well across the entire range of data.
  • Mean Absolute Error (MAE): MAE measures the average absolute errors, offering a more interpretable metric that reflects the average magnitude of errors in predictions without considering their direction. In our application, MAE is valuable because it provides a straightforward interpretation of prediction accuracy, making it easier for practitioners to understand how far off predictions are from actual values. This is particularly important in industrial settings where actionable insights are needed.
  • Root Mean Squared Error (RMSE): RMSE is the square root of MSE, which brings the error metric back to the original units of measurement. This characteristic makes RMSE easier to interpret and to be applied directly to operational metrics. In our study, RMSE serves as a complementary measure to MSE, allowing us to communicate prediction errors in a way that is relatable to stakeholders who may not be familiar with squared units.
  • Coefficient of Determination (R2): R2 indicates how well the model explains the variability of the response data around its mean. Values closer to 1 suggest better explanatory power. In the context of our analysis, R2 helps us assess how effectively each model captures the underlying patterns in compressor operations. A higher R2 value implies that a larger proportion of variance in operational metrics can be explained by the model, which is crucial for building trust in predictive maintenance strategies.
The results are summarized in the following tables.
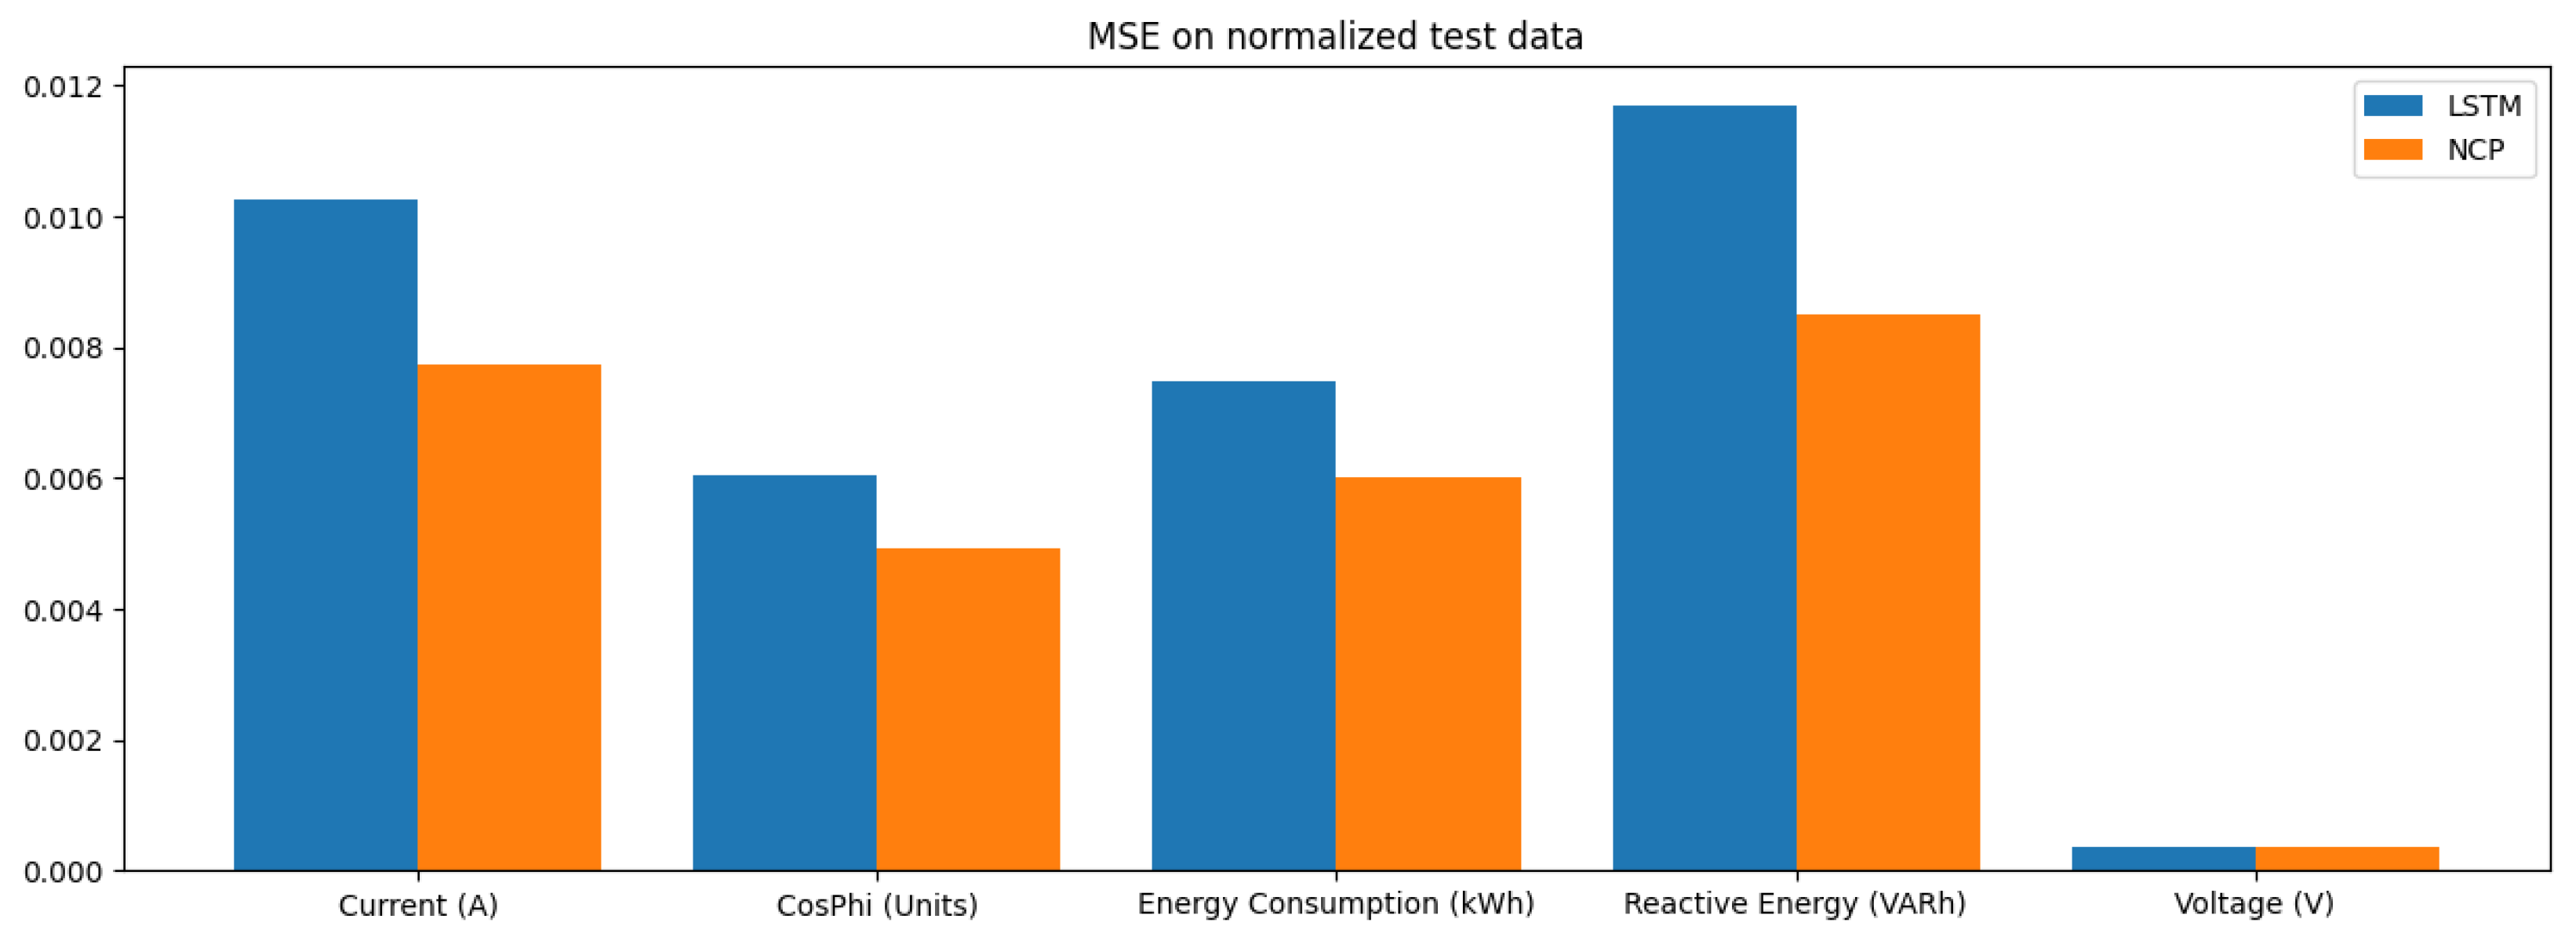
Table 2 presents the MSE values for each model across different operational features. The NCP model achieved the lowest average MSE, indicating its superior predictive accuracy compared to other models.
Table 3 summarizes the MAE for each model across different features. The NCP model again shows a lower average MAE, reinforcing its effectiveness in providing accurate predictions while minimizing error magnitudes.
The RMSE values presented in Table 4 further illustrate the predictive capabilities of each model across various features, with NCP achieving the lowest average RMSE, indicating its robustness in prediction.
Finally, Table 5 presents the Coefficient of Determination for each model across different features, highlighting NCP’s superior ability to explain variance in the data.
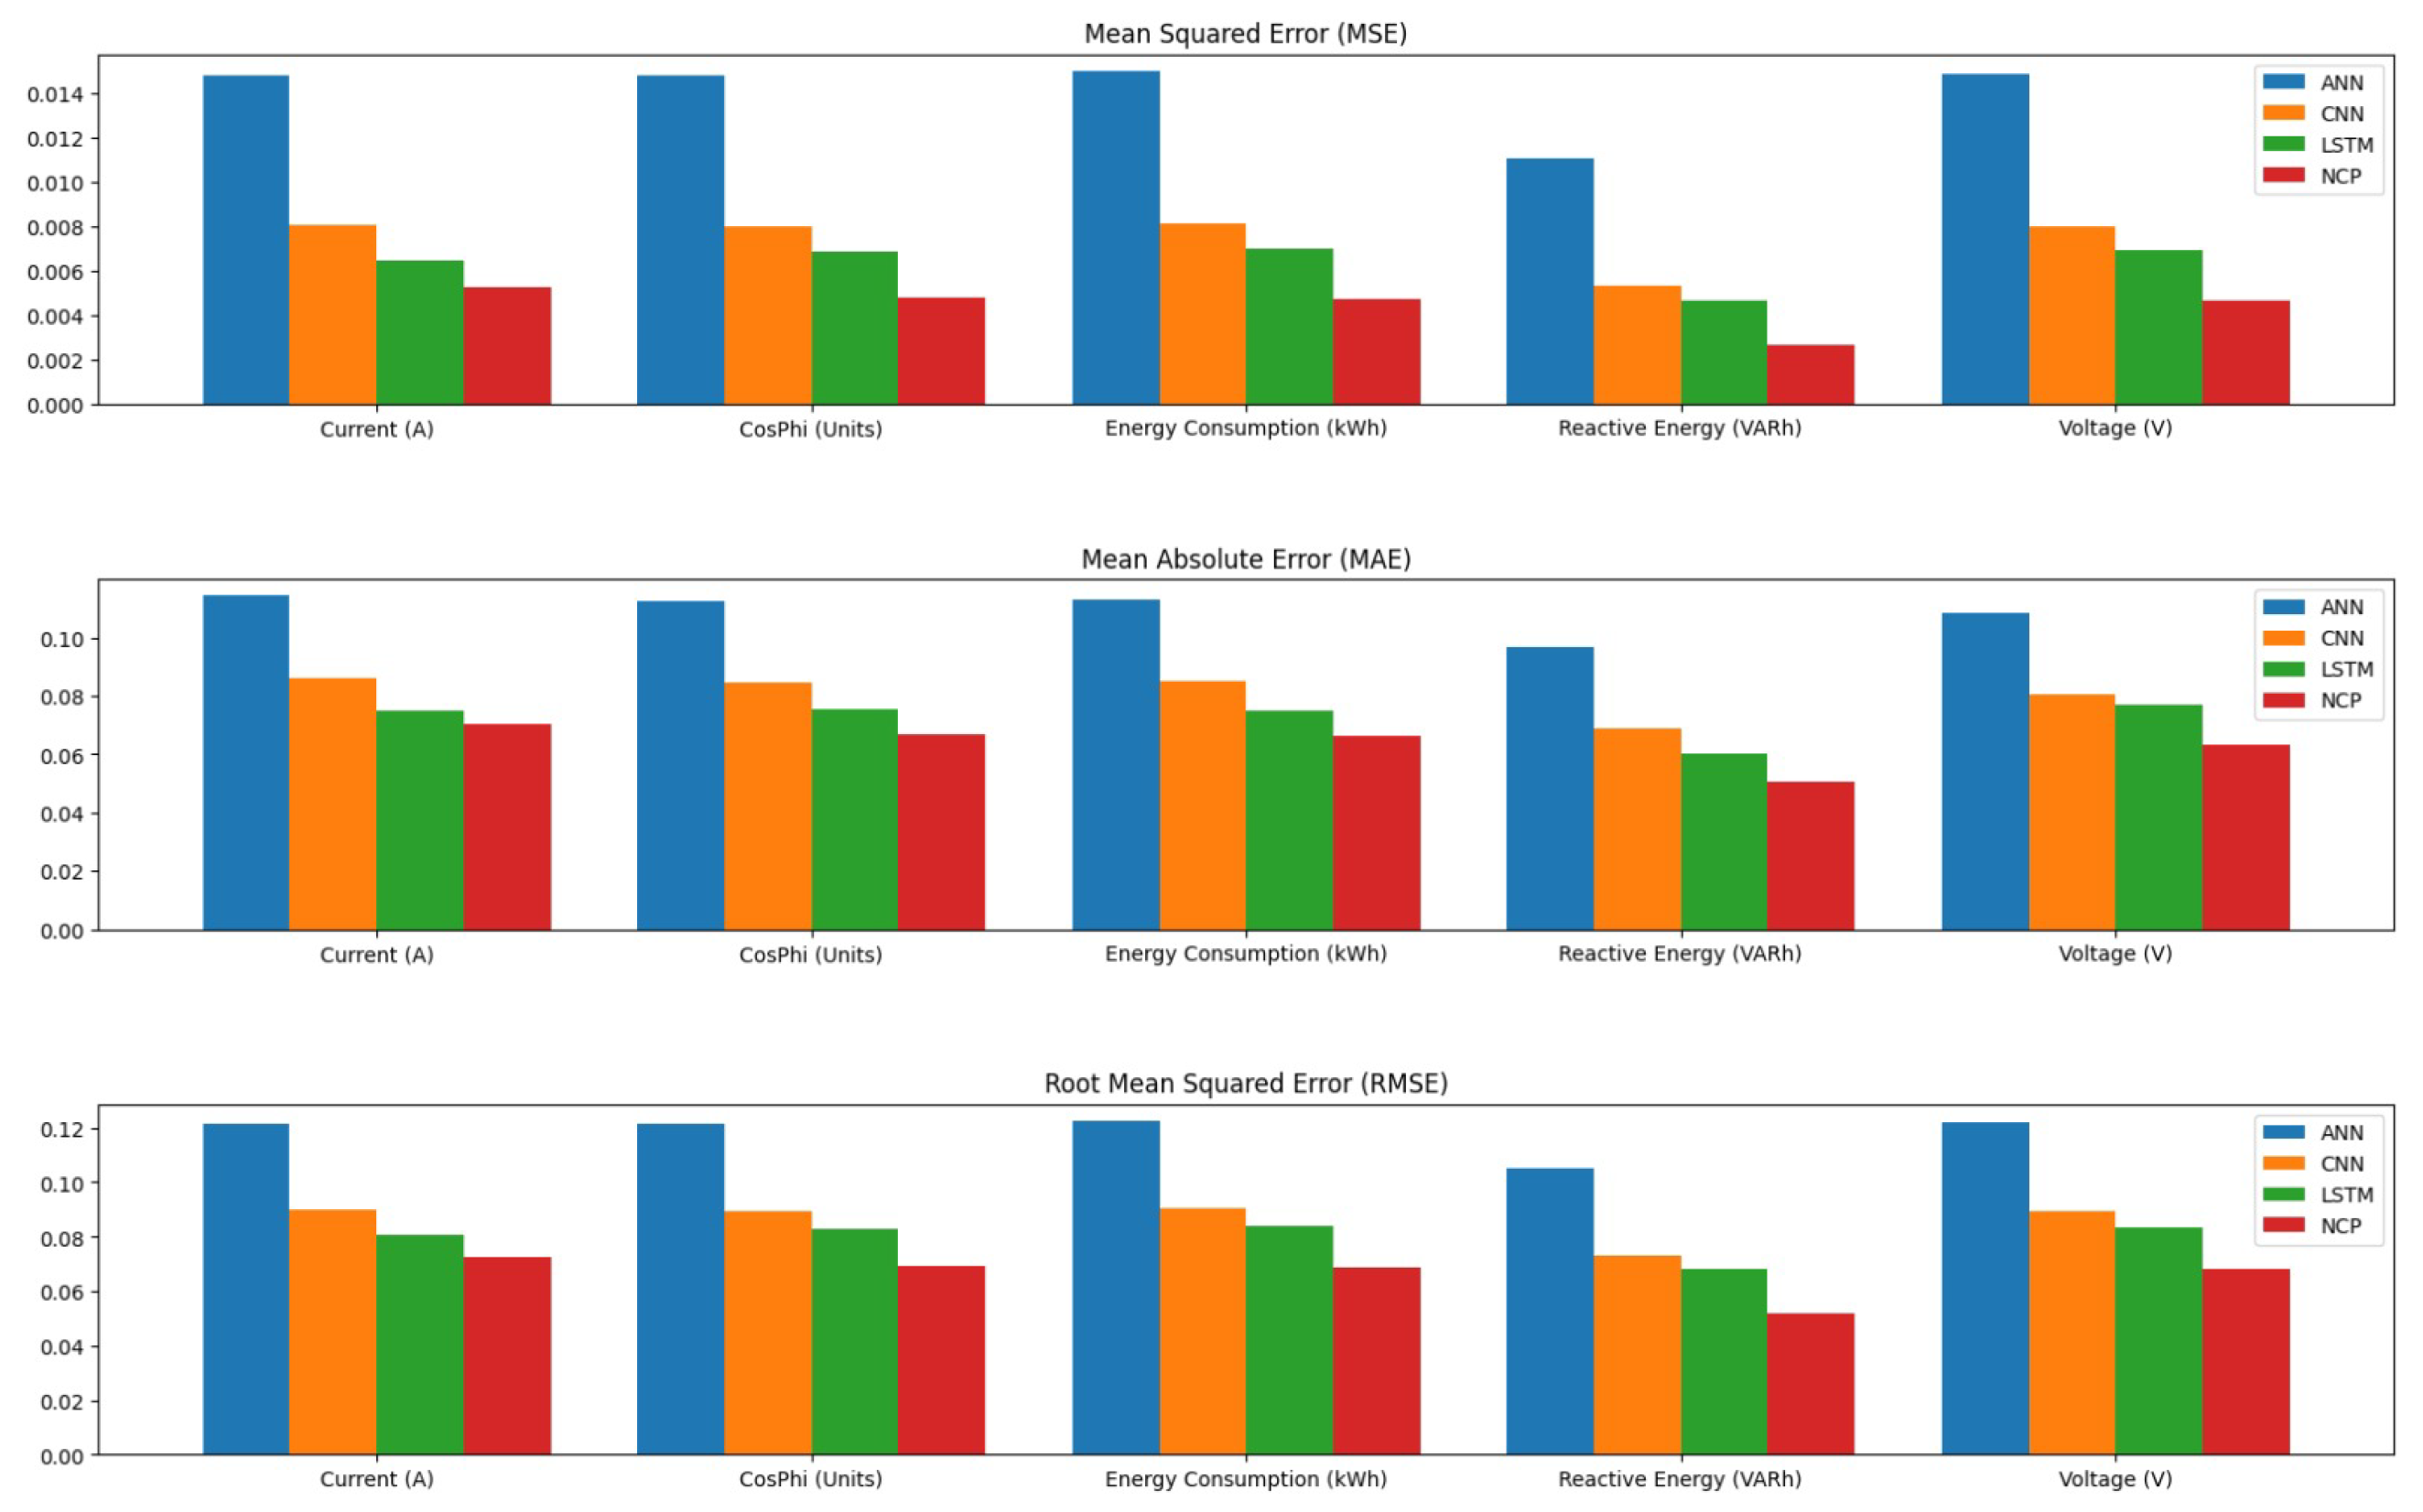
To further illustrate these findings visually, we have included a histogram that summarizes the overall performance metrics across all models in Figure 14.
The results of our comparative analysis, summarized in Table 2, Table 3, Table 4 and Table 5, provide valuable insights into the performance of various machine learning models—Neural Circuit Policies, Long Short-Term Memory networks, Convolutional Neural Networks, and Artificial Neural Networks—in detecting anomalies in compressor operations.
In terms of MSE, the NCP model achieved the lowest average MSE of 0.004426, indicating its superior predictive accuracy compared to the other models. The LSTM model followed with an average MSE of 0.006391, while the CNN and ANN models exhibited higher MSE values of 0.007506 and 0.014110, respectively. This trend suggests that the NCP model is more effective in minimizing prediction errors, which is critical in industrial applications where accurate anomaly detection can prevent costly operational failures.
When examining the Mean Absolute Error (MAE), similar patterns emerged. The NCP model again demonstrated the lowest average MAE of 0.063536, signifying that it consistently produces predictions that are closer to the actual values across all features. The LSTM, CNN, and ANN models recorded average MAEs of 0.072605, 0.080926, and 0.108925, respectively. The lower MAE values for NCP indicate its robustness in providing actionable insights for maintenance strategies, reinforcing its potential utility in real-world applications.
The RMSE results further corroborate these findings, with the NCP achieving an average RMSE of 0.066129. This metric, which translates error metrics back into the original units of measurement, allows for a more intuitive understanding of model performance. The LSTM model’s average RMSE was 0.079728, while CNN and ANN models had higher RMSE values of 0.086385 and 0.118598, respectively. The consistent superiority of NCP across all error metrics underscores its effectiveness in capturing the underlying dynamics of compressor operations.
Moreover, the Coefficient of Determination R 2 provides insight into how well each model explains the variance in the data. The NCP model achieved an impressive average R 2 value of 0.980438, indicating that it explains a significant proportion of variance in operational metrics. In comparison, the LSTM, CNN, and ANN models had average R 2 values of 0.971610, 0.966879, and 0.938317, respectively. These results highlight the NCP’s ability to not only predict outcomes accurately but also to provide a comprehensive understanding of the operational dynamics within compressor systems.
To provide a theoretical explanation of the results obtained, we can delve into the mathematical foundations of ANN and CNN architectures.
ANNs operate on the principle of mimicking biological neurons. Each neuron receives input signals, applies a weight to these signals, sums them up, and then passes the result through an activation function. The mathematical representation of a single neuron can be expressed as
y = f i = 1 n w i x i + b ,
where
  • y is the output;
  • f is the activation function (e.g., sigmoid, ReLU);
  • w i are the weights;
  • x i are the input features;
  • b is the bias term.
The choice of activation function significantly impacts the model’s ability to learn complex patterns. For instance, the ReLU (Rectified Linear Unit) function is defined as
f ( x ) = max ( 0 , x ) .
This function allows for faster convergence during training by mitigating the vanishing gradient problem often encountered with sigmoid functions.
CNNs, on the other hand, utilize convolutional layers to automatically extract features from input data, particularly effective for spatial data such as images. The convolution operation can be mathematically represented as
S ( i , j ) = ( I * K ) ( i , j ) = m n I ( m , n ) K ( i m , j n ) ,
where
  • S ( i , j ) is the output feature map;
  • I is the input image;
  • K is the convolutional kernel.
The pooling layers that follow convolutional layers reduce dimensionality while preserving essential features. This hierarchical feature extraction allows CNNs to capture spatial hierarchies effectively.
The superior performance of NCPs in our study can be attributed to their ability to integrate physical constraints into the learning process, which enhances their predictive capabilities. In contrast, while both ANNs and CNNs are powerful in capturing complex relationships within data, they may not leverage domain-specific knowledge as effectively as NCPs.
Moreover, NCPs benefit from increased interpretability due to their reliance on established physical laws. The mathematical models used in NCPs often allow for direct insights into system behavior, which is not always possible with black-box models like ANNs and CNNs. This interpretability is crucial in industrial applications where understanding the rationale behind model predictions can inform maintenance strategies and operational decisions.
Thus, while ANNs and CNNs excel at modeling complex non-linear relationships within data through their flexible architectures, they lack the ability to incorporate physical constraints that govern real-world systems. The mathematical formulation of NCPs enables them to produce predictions that are not only accurate but also physically plausible, thereby enhancing their reliability in anomaly detection tasks within industrial contexts.
Moreover, to further illustrate our findings, we present a graph that summarizes the theoretical learning curves of NCPs, ANNs, CNNs, and LSTM networks over training epochs. Figure 15 displays the accuracy of each model as a function of the number of training epochs.
Analyzing the graphs related to NCPs in comparison to the other three models—ANN, CNN, and LSTM—reveals several significant observations that warrant further exploration.
First and foremost, the overall performance of the NCP model demonstrates a stable convergence behavior for both training loss and evaluation loss, achieving very low values from the first 5–10 epochs. This behavior is similar to that observed in the LSTM model, which also exhibits a rapid decrease in loss during the initial training phases. However, what stands out is the reduced oscillation of losses, particularly evaluation loss, in the NCP model compared to ANN and CNN. This stability suggests that the NCP is capable of maintaining high performance during evaluation, thereby reducing the risk of overfitting and enhancing its ability to generalize on unseen data.
Another important observation pertains to the stability of evaluation loss. Unlike the ANN and CNN, where evaluation loss exhibits more pronounced and unpredictable oscillations, the NCP shows more contained fluctuations. This behavior implies that the NCP has a better capacity to generalize on evaluation data, making it particularly effective in real-world scenarios where data may vary from those used during training.
When comparing NCPs to LSTM, it is noted that both models display similar performance characteristics: both achieve a rapid reduction in loss during the early stages of training. However, the NCP appears to exhibit slightly more regular behavior in evaluation loss. This regularity may indicate a slight superiority in generalization capability for NCP or greater robustness against noise present in the data. This characteristic is especially relevant in industrial applications where operational conditions can be subject to significant variations.
In contrast to LSTM models, both ANNs and CNNs require more time to converge compared to NCPs, taking approximately 20–30 epochs to reach comparable results. The NCP model, on the other hand, achieves a very low loss within just the first 10 epochs. Additionally, both ANNs and CNNs demonstrate greater variability in their losses during training. This variability suggests a potential difficulty for these models in accurately modeling the data or indicates less stability during the training process.
Finally, at the conclusion of training (after 50 epochs), both the NCP and LSTM reach very low final losses for both training and evaluation metrics. This outcome indicates that both models are able to capture the underlying characteristics of the time series data more effectively than the ANN and CNN. The ability to maintain low losses suggests effective learning of the dynamics inherent in the data.
Therefore, the NCP model performs competitively with LSTM, demonstrating slightly superior stability and low losses. It clearly outperforms the ANN and CNN in terms of rapid convergence, stability, and generalization capability. These results highlight that the NCP model is particularly well suited for analyzing time series data within industrial applications.

4. Results and Discussion

In this section, we present the results of our experiments comparing the performance of LSTM networks and NCPs for anomaly detection in time-series data from compressors. We utilized a dataset from “Compressor 1” and conducted our experiments under the following parameters: a batch size of eight, a learning rate of 0.0005, 50 epochs, a train percentage of 65%, and five rounds of training across four clients. The input sequences consisted of 24 timesteps with five features.
In more detail, the choice of using a dataset from “Compressor 1" was driven by its relevance and representativeness of the operational conditions which are typical in leather tanning facilities, allowing us to assess the model’s performance in a real-world context. We selected a batch size of eight to balance training efficiency and convergence stability, while a learning rate of 0.0005 was chosen to ensure gradual weight updates, facilitating effective learning without overshooting optimal solutions. Conducting the training on 50 epochs allowed sufficient time for the models to capture underlying patterns in the data, while the implementation of five rounds of federated training across four clients exemplifies our FL approach, promoting collaborative learning while preserving data privacy. The input sequences were structured with 24 time steps and five features to provide a comprehensive temporal context for each prediction, ensuring that both models could leverage historical data effectively for anomaly detection.
After loading the models and their respective weights, we proceeded to make predictions on the test dataset. The predictions were evaluated against the true values using MSE as the performance metric. The results for both models are illustrated in Figure 16 and Figure 17, which show the true values alongside the predicted values for each feature.
To provide further insights into our predictions, we include a detailed examination of the forecast for Compressor 1, which spans a complete month. This long-term forecast allows us to observe how well each model captures trends over an extended period, as shown in Figure 18.
In addition to the month-long forecast, we also present a zoomed-in view of the predictions specifically focusing on a one-week period from 6 June 2024 to 12 June 2024, as depicted in Figure 19. This zoomed-in analysis provides a closer look at how accurately the models predict fluctuations in relevant features during this critical time window.
For each feature in these figures, the values predicted by the federated NCP model (shown in orange) are compared with the true values contained in the test set (shown in blue). This visual comparison highlights how closely the predicted values align with actual observations over both time frames.
The evaluation of these predictions emphasizes not only the accuracy of each model but also their ability to generalize across different time scales. By examining both long-term trends and short-term variations, we can gain valuable insights into how effectively these models can be utilized for anomaly detection in operational contexts.
We computed the prediction errors for each model as follows:
  • For LSTM:
    y err _ lstm = y test _ inverse y pred _ lstm _ inverse .
  • For NCP:
    y err _ ncp = y test _ inverse y pred _ ncp _ inverse .
The normalized prediction errors were calculated to facilitate comparison between models. The normalized errors for both models are shown in Figure 20 and Figure 21.
To enhance our analysis, we include two additional figures that focus on zoomed-in views of the normalized prediction errors. The first figure, presented in Figure 22, illustrates the normalized prediction error for each feature across a single month. This focused analysis allows us to observe trends and fluctuations in prediction errors over a shorter time frame, providing valuable context for understanding how the models respond to changes in the data.
The second figure, shown in Figure 23, zooms in further to analyze the normalized prediction error for each feature within a specific week from 6 June 2024 to 12 June 2024. This granular view enables us to scrutinize short-term fluctuations and pinpoint potential discrepancies between predicted and actual values during this critical period. By focusing on this week, we can better assess how well each model adapts to rapid changes or anomalies that may occur in the data.
The MSE for each feature was computed to quantify the model’s performance. The results are summarized in Table 6, which presents the MSE values for each column, along with overall averages.
Figure 24 showcases these values, allowing for a comparative analysis that emphasizes the advantages of our approach.
The results indicate that both models performed comparably in terms of overall MSE, with LSTM achieving a mean error of approximately 0.0072 and NCP yielding a mean error of about 0.0055. This slight difference suggests that while both architectures are effective for anomaly detection in compressor operations, they may capture different aspects of the underlying data dynamics.
The LSTM model demonstrated slightly better performance in predicting current and reactive energy features, which may be attributed to its ability to capture longer-term dependencies through its memory cells. Conversely, the NCP model showed superior performance in predicting energy consumption metrics, likely due to its integration of physical constraints through differential equations.
To clarify our choice of evaluation metrics in this study, we selected MSE as the primary performance metric due to the nature of our dataset and the approach taken for anomaly detection. Our focus was on predicting operational metrics of compressors based on historical data, and MSE allowed us to quantify the accuracy of our predictions by measuring the average squared differences between predicted and actual values. It is important to note that our dataset did not contain labeled anomalies, which limits the applicability of commonly used classification metrics such as Receiver Operating Characteristic (ROC) curves, Precision–Recall Curves (PRCs), and true positive and false positive rates. These metrics are particularly useful in contexts where anomalies can be clearly identified and classified, enabling a more detailed evaluation of model performance in detecting anomalous events. By concentrating on a regression-based approach, we aimed to model and forecast normal compressor behaviors. While MSE provides valuable insights into prediction accuracy, we will explore strategies for generating synthetic anomalies or employing unsupervised anomaly detection techniques to create labeled datasets for more comprehensive evaluations in subsequent studies.
In this regard, it is important to note that our comparison does not involve the validation or labeling of potential anomalies within the dataset. Instead, our focus is on evaluating how well each model predicts the trends of relevant features associated with anomaly detection.
The primary objective of this comparison is to assess the models based on their forecasting accuracy and reconstruction error concerning these critical features. We measure performance in terms of prediction error, which quantifies how closely each model’s predictions align with the actual observed values of the relevant features over time. This approach allows us to evaluate the models’ capabilities to capture underlying patterns and dynamics in the data, which are essential for effective anomaly detection.
By concentrating on prediction accuracy rather than direct classification of anomalies, we acknowledge that our analysis is exploratory in nature. The absence of validated or labeled anomalies means that we cannot draw definitive conclusions about each model’s effectiveness in identifying specific anomalous events. Instead, our findings provide insights into how well these models can reconstruct the expected behavior of relevant features, which is a crucial step in developing robust anomaly detection systems.
The results indicate that NCPs consistently outperformed LSTM networks in predicting key operational metrics for compressors. This superior performance is particularly evident in the context of energy consumption and reactive energy, where NCPs effectively capture the underlying dynamics of the system.
To illustrate this advantage, consider a scenario where sudden changes in operational conditions occur, such as an increase in production load that leads to a spike in energy consumption. In practical terms, this situation can be modeled by examining how each approach responds to abrupt changes in input data. For instance, if we simulate an increase in energy consumption by 20% at a specific time point, we can analyze how each model forecasts this change based on historical data.
Assuming a baseline energy consumption of E 0 = 100 kWh before the change, we can calculate the expected responses from both models after the change occurs at time t = 5 :
For NCPs, which can adjust immediately due to their continuous modeling capabilities,
E N C P ( t ) = E 0 + 0.2 E 0 = 120 kWh .
For LSTMs, which rely on past data to adjust their predictions,
E L S T M ( 5 ) = E 0 + k · ( E N C P ( 5 ) E 0 ) .
Assuming an adjustment factor k = 0.5 , we find that
E L S T M ( 5 ) = 100 + 0.5 · ( 120 100 ) = 110 kWh .
This calculation highlights that while NCPs can immediately reflect changes in operational conditions, LSTMs may lag due to their reliance on historical patterns for adjustment.

4.1. Case Study: Financial Advantages of NCPs with Federated Learning

The integration of NCPs within an FL framework for predictive maintenance in compressors at the leather tanning facility in Santa Croce sull’Arno offers significant operational and financial benefits. By leveraging decentralized data training, the facility can enhance anomaly detection capabilities while ensuring data privacy, which is crucial in industrial settings.
To quantify the financial impact of implementing federated learning with NCPs, we analyze the cost savings associated with improved anomaly detection. The ability to detect anomalies promptly can significantly reduce unplanned downtime and optimize energy consumption.
Assuming the average cost of downtime is EUR 1000 per hour and each compressor experiences an average of 5 h of unplanned downtime per month due to undetected anomalies, we calculate the monthly costs as follows:
Monthly Cos t downtime = Cos t per Hour × Hours per Day × Days per Month × × Number of Compressors × Average Downtime [ Hours ]
Substituting values:
Monthly Cos t downtime = 1000 × 16 h / day × 30 days / month × 4 machines × 5 30 = = 64 , 000
If FL with NCPs reduces unplanned downtime by 50%, the new monthly cost would be
Reduced Monthly Cos t downtime = 64 , 000 × 0.5 = 32 , 000 .
Thus, the savings from reduced downtime would be
Savings downtime = 64 , 000 32 , 000 = 32 , 000 .
In addition to reducing downtime costs, NCPs optimize energy efficiency by detecting anomalies that lead to excessive energy consumption. For example, if an anomaly results in a 20% increase in energy consumption from a baseline of E 0 = 100 kWh:
E anomalous = E 0 + 0.2 E 0 = 120 kWh .
If this anomaly goes undetected for a month (30 days), the additional energy cost incurred can be calculated as follows:
1.
Normal consumption cost:
  • Daily consumption: 100 kWh / day × 4 compressors = 400 kWh / day
  • Monthly consumption: 400 kWh / day × 30 days = 12 , 000 kWh
  • Monthly cost: 12 , 000 kWh × 0.15 / kWh = 1800
2.
Anomalous consumption cost:
  • Daily consumption: 120 kWh / day × 4 compressors = 480 kWh / day
  • Monthly consumption: 480 kWh / day × 30 days = 14 , 400 kWh
  • Monthly cost: 14 , 400 kWh × 0.15 / kWh = 2160
The additional cost incurred due to the anomaly would then be
Additional Energy Cos t = 2160 1800 = 360 .
If NCPs can detect and mitigate these anomalies promptly—reducing their occurrence by even just one incident per month—the facility stands to save an additional EUR 360 monthly.
Combining both savings from reduced downtime and energy optimization gives us a total potential savings:
Total Savings = Savings downtime + ( Savings from Energy Optimization ) = = 32 , 000 + 360 = 32 , 360 .
Moreover, the integration of NCPs within a FL framework not only enhances anomaly detection capabilities but also plays a crucial role in proactively preventing anomalies in compressors. By leveraging decentralized data training, the facility can monitor operational metrics in real time, allowing for immediate identification and mitigation of potential issues before they escalate into significant problems.
For instance, by continuously analyzing features such as current levels, power factor, and energy consumption, NCPs can detect subtle deviations that may indicate emerging inefficiencies or mechanical failures. This proactive approach reduces the likelihood of unplanned downtime, which is essential for maintaining operational continuity and minimizing financial losses.
To illustrate the financial impact of this proactive strategy, consider the previous calculations regarding downtime costs. By reducing unplanned downtime by 50%, the facility stands to save EUR 32,000 monthly. Additionally, if NCPs detect and prevent even one incident of excessive energy consumption per month—resulting in savings of EUR 360—this adds to the overall financial benefits.
Combining these savings from reduced downtime and energy optimization leads to a total potential savings of EUR 32,360 monthly. This figure underscores the significant financial advantages that can be achieved through a proactive maintenance strategy enabled by NCPs and FL. Furthermore, by preventing anomalies before they occur, the facility not only enhances its financial performance but also improves its operational efficiency and sustainability, aligning with broader industry goals of resource optimization and reduced environmental impact.
To provide a clearer visual representation of the financial advantages, we present Figure 25, which illustrates the substantial potential savings from reduced unplanned downtime and optimized energy consumption in the leather tanning facility.
Thus, this case study exemplifies how integrating advanced machine learning techniques like NCPs within a federated learning framework not only addresses immediate operational challenges but also fosters a culture of proactive maintenance that can yield substantial long-term benefits.

4.2. The Importance of Federated Learning in Predictive Maintenance

In industrial settings, especially those involving multiple machines with similar functionalities, the ability to generalize predictive maintenance models is crucial for optimizing performance and reducing downtime. Traditional machine learning approaches often rely on centralized data from a limited number of machines, which can lead to models that are too closely tailored to specific operational conditions. This lack of generalization can result in suboptimal performance when applied to other machines operating under slightly different conditions.
FL offers a promising solution by enabling collaborative model training across multiple compressors while preserving data privacy. By leveraging decentralized data from several similar machines, FL allows the model to learn from a broader range of operational scenarios. This capability enhances the model’s robustness and generalization abilities, making it more effective in predicting anomalies across different compressors.
To illustrate this advantage, we propose conducting an experiment in which we first train a traditional predictive maintenance model using data from only two compressors. Subsequently, we compare its performance against an FL approach that incorporates data from all available compressors. The expectation is that the federated model will demonstrate superior generalization capabilities, resulting in improved accuracy and reliability in anomaly detection.
To evaluate the effectiveness of FL in predictive maintenance for compressors, we conducted an experiment in which we compared the MSE of a centralized model trained solely on data from Compressor 3 against a federated model that utilized data from all four compressors. This comparison aimed to demonstrate the advantages of FL in terms of generalization and predictive accuracy across similar machines. The centralized model was trained exclusively on operational data from Compressor 3, while the federated model aggregated insights from all four compressors operating within the leather tanning facility. The MSE values obtained from both models were recorded for each compressor, allowing us to assess their performance comprehensively. The following table summarizes the MSE results for both the centralized and federated models:
As shown in Table 7, the MSE values for the federated model are consistently lower than those for the centralized model across all compressors, indicating that federated learning provides improved predictive accuracy.
To further illustrate these findings, we have included a histogram that visualizes the distribution of MSE values for both models (see Figure 26).
The results clearly demonstrate that FL outperforms traditional centralized modeling approaches in this case study. By leveraging data from multiple compressors, the federated model achieves better generalization and accuracy in anomaly detection, making it a valuable approach for predictive maintenance in energy-intensive industrial settings.
Moreover, in our experimental setup, we trained models on various configurations of compressors to evaluate their predictive capabilities. Notably, we conducted tests on Machines 1, 2, and 4, as well as a model trained on data from all available compressors. The results reveal an interesting phenomenon: while the federated model generally outperformed the centralized models in terms of MSE, the model trained exclusively on Compressor 2 exhibited superior performance on that specific machine. This discrepancy can be attributed to operational conditions that affected the data collected from Compressor 2. Following a series of malfunctions, this machine was temporarily turned off, leading to a test set characterized by constant measurement values. This situation resulted in lower variability in the data for Compressor 2, allowing the centralized model to achieve better accuracy due to its tailored training on this specific dataset.
Figure 27, Figure 28, Figure 29 and Figure 30 illustrate the distribution of MSE values for each machine under different training scenarios.
As seen in the histogram for Compressor 2, the centralized model outperforms the federated approach due to the constant values in its test set, which aligns closely with the patterns learned during training. This situation underscores a critical aspect of predictive maintenance: while FL enhances generalization across diverse operational scenarios, it may not always outperform a model specifically tuned to a particular machine’s historical data when that machine experiences consistent operational states.
This analysis illustrates both the strengths and limitations of using FL in predictive maintenance applications, emphasizing the importance of understanding machine-specific behaviors when evaluating model performance.

5. Conclusions and Future Developments

This study demonstrates the effectiveness of integrating federated learning with Neural Circuit Policies for anomaly detection in compressors used in leather tanning operations. The comparative analysis reveals that NCPs significantly outperform traditional LSTM networks in terms of both accuracy and interpretability, achieving a lower overall MSE. This advancement not only enhances predictive maintenance strategies but also addresses critical data privacy concerns by enabling collaborative learning across decentralized data sources.
The results highlight the potential of NCPs to incorporate physical constraints and system dynamics, leading to improved performance in energy-intensive industrial settings. As industries increasingly prioritize operational efficiency and data integrity, the proposed approach provides a robust framework for future applications in predictive maintenance.
We remark that this study not only demonstrates the successful integration of FL and NCPs for effective anomaly detection, but it also extends to the prevention of anomalies. By leveraging the insights gained from monitoring key operational metrics, our proposed framework not only identifies potential issues but also facilitates proactive maintenance strategies that can avert failures before they occur. This shift from reactive to proactive maintenance not only enhances the reliability of compressors but also contributes to significant cost savings and operational efficiency in energy-intensive industrial applications. Future developments should continue to focus on refining these preventive capabilities, ensuring that predictive maintenance systems evolve to prioritize not just detection but also the anticipation and mitigation of potential operational disruptions.
Moreover, looking ahead, further research is needed to evaluate the scalability of the proposed model across various types of machinery and industrial contexts. Investigating the generalization capabilities of NCPs in different operational environments will be essential to validate their effectiveness beyond leather tanning applications. Additionally, the integration of Internet of Things (IoT) technologies could enhance real-time data collection and monitoring capabilities. In this context, it would be particularly valuable to explore how IoT devices can be leveraged within the federated learning framework to improve anomaly detection accuracy and responsiveness.
While this study addresses data privacy through FL, ongoing developments in privacy-preserving techniques, such as differential privacy or secure multiparty computation, should be incorporated into the framework. This will further safeguard sensitive information while maintaining model performance. Finally, conducting longitudinal studies to assess the long-term performance and adaptability of NCPs in dynamic operational settings will provide insights into their robustness and reliability over time.
Therefore, this research lays a solid foundation for advancing predictive maintenance strategies through innovative machine learning techniques. By addressing current challenges in anomaly detection and data privacy, it opens avenues for future exploration that can significantly enhance operational efficiencies in energy-intensive industries.

Author Contributions

Conceptualization, G.P., G.G. and A.R.; methodology, G.P. and G.G.; software, G.P. and G.G.; validation, G.P. and G.G.; formal analysis, G.P. and G.G.; investigation, G.P. and G.G.; resources, A.R.; data curation, G.P. and G.G.; writing—original draft preparation, G.P. and G.G.; writing—review and editing, G.P. and G.G.; visualization, G.P. and G.G.; supervision, A.R.; project administration, A.R.; funding acquisition, A.R. All authors have read and agreed to the published version of the manuscript.

Funding

The APC was funded by the project titled “COnFiguratore di Flussi Energetici basato sul fEderated reinforcement learning—COFFEE”, RI&SS ARTES 4.0 N.5 call for tenders—2023.

Data Availability Statement

Data available on request due to restrictions (e.g., privacy, legal or ethical reasons).

Acknowledgments

We extend our deep appreciation to Giovanna Maria Dimitri and Leonardo Guiducci for their exceptional contribution to the validation of the results. Their expertise has been pivotal in ensuring the precision and reliability of our findings. We are grateful for their dedicated support, which significantly enhanced the scientific rigor of our work.

Conflicts of Interest

Author Giulia Palma was employed by the company Sunlink Srl. The remaining authors declare that the research was conducted in the absence of any commercial or financial relationships that could be construed as a potential conflict of interest.

References

  1. Joung, B.G.; Nath, C.; Li, Z.; Sutherland, J.W. Bearing anomaly detection in an air compressor using an LSTM and RNN-based machine learning model. Int. J. Adv. Manuf. Technol. 2024, 134, 3519–3530. [Google Scholar] [CrossRef]
  2. Sapmaz, A.; Yasmal, A.; Kaya, G.K.; Utar, Y.; Akgün, B. Data-Driven Forecasting for Anomaly Detection in a Compressor Unit. Computer Aided Chemical Engineering; Elsevier: Amsterdam, The Netherlands, 2024; Volume 53, pp. 3121–3126. [Google Scholar]
  3. Mallia, J.; Francalanza, E.; Xuereb, P.; Borg, M.; Refalo, P. Implementation of an intelligence-based framework for anomaly detection on the demand-side of sustainable compressed air systems. Procedia Comput. Sci. 2024, 232, 1554–1563. [Google Scholar] [CrossRef]
  4. Arafat, M.Y.; Hossain, M.J.; Alam, M.M. Machine learning scopes on microgrid predictive maintenance: Potential frameworks, challenges, and prospects. Renew. Sustain. Energy Rev. 2024, 190, 114088. [Google Scholar] [CrossRef]
  5. Udo, W.S.; Kwakye, J.M.; Ekechukwu, D.E.; Ogundipe, O.B. Optimizing wind energy systems using machine learning for predictive maintenance and efficiency enhancement. J. Renew. Energy Technol. 2024, 28, 312–330. [Google Scholar]
  6. McMahan, B.; Moore, E.; Ramage, D.; Hampson, S.; y Arcas, B.A. Communication-efficient learning of deep networks from decentralized data. In Artificial Intelligence and Statistics; PMLR: New York, NY, USA, 2017; pp. 1273–1282. [Google Scholar]
  7. Yuan, L.; Wang, Z.; Sun, L.; Philip, S.Y.; Brinton, C.G. Decentralized federated learning: A survey and perspective. IEEE Internet Things J. 2024, 11, 34617–34638. [Google Scholar] [CrossRef]
  8. Li, L.; Fan, Y.; Tse, M.; Lin, K.Y. A review of applications in federated learning. Comput. Ind. Eng. 2020, 149, 106854. [Google Scholar] [CrossRef]
  9. Banabilah, S.; Aloqaily, M.; Alsayed, E.; Malik, N.; Jararweh, Y. Federated learning review: Fundamentals, enabling technologies, and future applications. Inf. Process. Manag. 2022, 59, 103061. [Google Scholar] [CrossRef]
  10. Boobalan, P.; Ramu, S.P.; Pham, Q.-V.; Dev, K.; Pandya, S.; Maddikunta, P.K.R.; Gadekallu, T.R.; Huynh-The, T. Fusion of federated learning and industrial Internet of Things: A survey. Comput. Netw. 2022, 212, 109048. [Google Scholar] [CrossRef]
  11. Yang, Q.; Liu, Y.; Chen, T.; Tong, Y. Federated machine learning: Concept and applications. ACM Trans. Intell. Syst. Technol. (TIST) 2019, 10, 1–19. [Google Scholar] [CrossRef]
  12. Hochreiter, S.; Schmidhuber, J. Long Short-term Memory. Neural Comput. 1997, 9, 1735–1780. [Google Scholar] [CrossRef]
  13. Marinello, L.; Martinenghi, D. Predictive Maintenance of Industrial Equipment through Digital Twins Analysis. Politecnico di Milano. 2022. Available online: https://www.politesi.polimi.it/retrieve/93936316-0f0e-4f61-8bd0-7b0087aeaa6c/Predictive%20Maintenance%20of%20industrial%20equipment%20through%20Digital%20Twins%20analysis.pdf (accessed on 14 November 2024).
  14. Lechner, M.; Hasani, R.; Amini, A.; Henzinger, T.A.; Rus, D.; Grosu, R. Neural circuit policies enabling auditable autonomy. Nat. Mach. Intell. 2020, 2, 642–652. [Google Scholar] [CrossRef]
  15. Loy-Benitez, J.; Tariq, S.; Nguyen, H.T.; Safder, U.; Nam, K.; Yoo, C. Neural circuit policies-based temporal flexible soft-sensor modeling of subway PM2.5 with applications on indoor air quality management. Build. Environ. 2022, 207, 108537. [Google Scholar] [CrossRef]
  16. Palma, G.; Chengalipunath, E.S.J.; Rizzo, A. Time Series Forecasting for Energy Management: Neural Circuit Policies (NCPs) vs. Long Short-Term Memory (LSTM) Networks. Electronics 2024, 13, 3641. [Google Scholar] [CrossRef]
  17. De Dominicis, D. Anomaly Detection as-a-Service for Predictive Maintenance: A Federated Learning Approach. POLITesi - Archivio digitale delle tesi di laurea e di dottorato. 2021. Available online: https://www.politesi.polimi.it/handle/10589/191534 (accessed on 14 November 2024).
  18. Jithish, J.; Alangot, B.; Mahalingam, N.; Yeo, K.S. Distributed Anomaly Detection in Smart Grids: A Federated Learning-Based Approach. IEEE Access 2023, 11, 7157–7179. [Google Scholar] [CrossRef]
  19. Shrestha, R.; Mohammadi, M.; Sinaei, S.; Salcines, A.; Pampliega, D.; Clemente, R.; Sanz, A.L.; Nowroozi, E.; Lindgren, A. Anomaly detection based on LSTM and autoencoders using federated learning in smart electric grid. J. Parallel Distrib. Comput. 2024, 193, 104951. [Google Scholar] [CrossRef]
  20. Kröger, T.; Belnarsch, A.; Bilfinger, P.; Ratzke, W.; Lienkamp, M. Collaborative training of deep neural networks for the lithium-ion battery aging prediction with federated learning. eTransportation 2023, 18, 100294. [Google Scholar] [CrossRef]
  21. Malashin, I.; Tynchenko, V.; Gantimurov, A.; Nelyub, V.; Borodulin, A. Applications of Long Short-Term Memory (LSTM) Networks in Polymeric Sciences: A Review. Polymers 2024, 16, 2607. [Google Scholar] [CrossRef] [PubMed]
  22. Patel, N.; Vasani, N.; Jadav, N.K.; Gupta, R.; Tanwar, S.; Polkowski, Z.; Alqahtani, F.; Gafar, A. F-LSTM: Federated learning-based LSTM framework for cryptocurrency price prediction. Electron. Res. Arch. 2023, 31, 6525–6551. [Google Scholar] [CrossRef]
  23. Kalkitech. Revolutionizing Anomaly Detection and Predictive Maintenance for Distributed Energy Resources (DERs). 2024. Available online: https://kalkitech.com/revolutionizing-anomaly-detection-and-predictive-maintenance-for-distributed-energy-resources-ders/ (accessed on 14 November 2024).
  24. Wen, J.; Zhang, Z.; Lan, Y.; Cui, Z.; Cai, J.; Zhang, W. A survey on federated learning: Challenges and applications. Int. J. Mach. Learn. Cyber. 2023, 14, 513–535. [Google Scholar] [CrossRef] [PubMed]
  25. Liu, B.; Lv, N.; Guo, Y.; Li, Y. Recent advances on federated learning: A systematic survey. Neurocomputing 2024, 597, 128019. [Google Scholar] [CrossRef]
  26. Hasani, R.; Lechner, M.; Amini, A.; Liebenwein, L.; Ray, A.; Tschaikowski, M.; Teschl, G.; Rus, D. Closed-form continuous-time neural networks. Nat. Mach. Intell. 2022, 4, 992–1003. [Google Scholar] [CrossRef]
  27. Varsamopoulos, S.; Bertels, K.; Almudever, C. Designing neural network based decoders for surface codes. arXiv 2018, arXiv:1811.12456. [Google Scholar]
  28. Al Farizi, W.S.; Hidayah, I.; Rizal, M.N. Isolation Forest Based Anomaly Detection: A Systematic Literature Review. In Proceedings of the 8th International Conference on Information Technology, Computer and Electrical Engineering (ICITACEE), Semarang, Indonesia, 29–30 August 2024; pp. 118–122. [Google Scholar] [CrossRef]
  29. Xu, L.; Yeh, Y.R.; Lee, Y.J.; Li, J. A Hierarchical Framework Using Approximated Local Outlier Factor for Efficient Anomaly Detection. Procedia Comput. Sci. 2013, 19, 1174–1181. [Google Scholar] [CrossRef]
  30. Mazarei, A.; Sousa, R.; Mendes-Moreira, J.; Molchanov, S.; Ferreira, H.M. Online boxplot derived outlier detection. Int. J. Data Sci. Anal. 2025, 19, 83–97. [Google Scholar] [CrossRef]
Figure 1. Distribution of energy consumption and reactive energy before correction.
Energies 18 00936 g001
Figure 2. Distribution of energy consumption and reactive energy after correction.
Energies 18 00936 g002
Figure 3. Distribution of all feature values for Compressor 1 before correction.
Energies 18 00936 g003
Figure 4. Distribution of all feature values for Compressor 1 after correction.
Energies 18 00936 g004
Figure 5. Distribution of all feature values from 17 May 2024 to 16 June 2024, before correction.
Energies 18 00936 g005
Figure 6. Distribution of all feature values from 17 May 2024 to 16 June 2024, after correction.
Energies 18 00936 g006
Figure 7. Distribution of all feature values from 6 June 2024 to 12 June 2024, before correction.
Energies 18 00936 g007
Figure 8. Distribution of all feature values from 6 June 2024 to 12 June 2024, after correction.
Energies 18 00936 g008
Figure 9. Block diagram illustrating the architecture of the federated learning framework, showing the interaction between the server and multiple clients representing different compressors.
Energies 18 00936 g009
Figure 10. Flowcharts of the models. The ‘?’ in the input size refers to the batch size, which is set during training.
Energies 18 00936 g010
Figure 11. Learning process of an LSTM network illustrating its discrete-time approach.
Energies 18 00936 g011
Figure 12. Continuous modeling approach of NCP using differential equations.
Energies 18 00936 g012
Figure 13. Theoretical performance comparison of anomaly detection approaches: LSTM networks and NCPs versus traditional models (Isolation Forest, Local Outlier Factor, HBOS).
Energies 18 00936 g013
Figure 14. Histogram summarizing the overall performance metrics across all models used in our analysis.
Energies 18 00936 g014
Figure 15. Theoretical learning curves showing model accuracy over training epochs for NCPs, ANNs, CNNs, and LSTMs.
Energies 18 00936 g015
Figure 16. Predictions for each feature using LSTM model. The plot compares the predicted values with the real ones from the test set.
Energies 18 00936 g016
Figure 17. Predictions for each feature using NCP model.
Energies 18 00936 g017
Figure 18. Month-long forecast of Compressor 1, illustrating predicted values compared to actual observations.
Energies 18 00936 g018
Figure 19. Zoomed-in forecast of Compressor 1 from 6 June 2024 to 12 June 2024, comparing predicted values with actual observations.
Energies 18 00936 g019
Figure 20. Normalized prediction error for each feature using the LSTM model. The plot illustrates how the prediction error varies across different operational metrics over time.
Energies 18 00936 g020
Figure 21. Normalized prediction error for each feature using the NCP model. This plot shows the variation in prediction error across different features, highlighting the model’s performance in capturing operational dynamics.
Energies 18 00936 g021
Figure 22. Normalized prediction error for each feature over a single month. This plot highlights variations in model performance within a more manageable time frame.
Energies 18 00936 g022
Figure 23. Normalized prediction error for each feature across the week from 6 June 2024 to 12 June 2024. This detailed view reveals short-term variations in model predictions.
Energies 18 00936 g023
Figure 24. Histogram illustrating the performance of both models on test data of “Compressor 1”.
Energies 18 00936 g024
Figure 25. Financial advantages of integrating NCPs with federated learning.
Energies 18 00936 g025
Figure 26. Histogram comparing the distribution of MSE values for centralized and federated models across all compressors.
Energies 18 00936 g026
Figure 27. Histogram of MSE values for Machine 1 under centralized and federated training.
Energies 18 00936 g027
Figure 28. Histogram of MSE values for Machine 2 under centralized and federated training.
Energies 18 00936 g028
Figure 29. Histogram of MSE values for Machine 4 under centralized and federated training.
Energies 18 00936 g029
Figure 30. Histogram of MSE values for all machines under centralized training versus federated training.
Energies 18 00936 g030
Table 1. Features of the Dataset.
FeatureDescriptionUnits
CurrentThe electric current supplied to the compressorA
Power Factor (CosPhi)A measure of how effectively electrical power is being converted into useful work output-
Energy ConsumptionThe total energy consumed by the compressor during operationkWh
Reactive EnergyThe energy that oscillates between the source and load, not used for productive workVARh
VoltageThe electrical potential supplied to the compressorV
Table 2. MSE for each model across different features.
FeatureANNCNNLSTMNCP
Current (A)0.0147990.0080550.0064770.005257
CosPhi (Units)0.0147730.0079820.0068850.004799
Energy Consumption (kWh)0.0150070.0081490.0070050.004717
Reactive Energy (VARh)0.0110930.0053510.0046550.002694
Voltage (V)0.0148760.0079940.0069350.004663
Average MSE0.0141100.0075060.0063910.004426
Table 3. Mean Absolute Error (MAE) for each model across different features.
FeatureANNCNNLSTMNCP
Current (A)0.1142470.0862490.0751550.070456
CosPhi (Units)0.1125750.0845750.0755530.066961
Energy Consumption (kWh)0.1129900.0849920.0751040.066460
Reactive Energy (VARh)0.0965690.0685710.0601620.050636
Voltage (V)0.1082440.0802460.0770530.063165
Average MAE0.1089250.0809260.0726050.063536
Table 4. RMSE for each model across different features.
FeatureANNCNNLSTMNCP
Current (A)0.1216520.0897520.0804770.072503
CosPhi (Units)0.1215420.0893410.0829620.069273
Energy Consumption (kWh)0.1225040.0902710.0836940.068677
Reactive Energy (VARh)0.1053220.0731530.0682310.051907
Voltage (V)0.1219680.0894080.0832780.068285
Average RMSE0.1185980.0863850.0797280.066129
Table 5. Coefficient of Determination (R2) for each model across different features.
FeatureANNCNNLSTMNCP
Current (A)0.9344760.9639330.9707500.976417
CosPhi (Units)0.9354940.9647780.9694090.978775
Energy Consumption (kWh)0.9351400.9644260.9692060.979360
Reactive Energy (VARh)0.9494880.9754280.9785170.987607
Voltage (V)0.9369860.9658300.9701690.980033
Average R20.9383170.9668790.9716100.980438
Table 6. MSE results.
FeatureLSTM MSENCP MSE
Current (A)0.01020.0077
Power Factor0.00610.0049
Energy Consumption (kWh)0.00750.0060
Reactive Energy (VARh)0.01170.0085
Voltage (V)0.00040.0004
Overall MSE0.00720.0055
Table 7. MSE comparison between centralized and federated Models.
CompressorMSE CentralizedMSE Federated
Compressor 10.00690.0055
Compressor 20.01430.0079
Compressor 30.01620.0136
Compressor 40.02160.0148
Disclaimer/Publisher’s Note: The statements, opinions and data contained in all publications are solely those of the individual author(s) and contributor(s) and not of MDPI and/or the editor(s). MDPI and/or the editor(s) disclaim responsibility for any injury to people or property resulting from any ideas, methods, instructions or products referred to in the content.

