Abstract
In response to escalating global energy demand and climate change mitigation needs, natural gas hydrates (NGHs) are gaining prominence as a clean energy source. The CO2 replacement method is an innovative NGH extraction technique that reduces reservoir risks and enables CO2 sequestration. However, our understanding of the dynamics and control parameters in the hydrate replacement process is limited. This study pioneers a kinetic analysis and conceptual model for a CO2-driven hydrate replacement, dividing the process into three spatial realms and sequential stages. We identify the optimal injection temperature range for standard NGH reservoirs and highlight the interplay between the gas injection rate and bottom-hole pressure on CH4 yield. Our findings offer insights on how to optimize production efficiency and gas separation, advancing CO2 replacement technology for NGHs.
1. Introduction
Natural gas hydrates (NGHs), characterized by substantial reserves and a high energy content, are being recognized as a significant new energy resource in the 21st century. Notably, China is estimated to process 1.26 × 10¹⁴ m3 of NGHs, underscoring the critical importance of research on the exploitation of NGHs for enhancing national energy security. Among various production techniques, the depressurization method, thermal stimulation, chemical inhibitor injection, and gas replacement methods are prominent [1,2,3,4]. The CO2 replacement method is especially noteworthy due to its minimal impact on the reservoir’s structural integrity and its potential role in preventing reservoir collapse [5]. Moreover, this method offers a feasible pathway for CO2 sequestration, thus contributing to carbon neutrality objectives.
Following the introduction of the CO2 replacement method by the American researcher Ebinuma [6] in 1993, there has been a marked increase in global scholarly efforts. Scholars have employed techniques such as molecular dynamics, Raman spectroscopy, experimental studies, and numerical simulation models to establish the feasibility of CO2 replacement in the extraction of NGHs and elucidate the underlying mechanisms. Ohgaki et al. [7] performed comparative analyses of CH4 and CO2 diffusion in hydrates, preliminarily establishing the kinetic potential of replacement. Wang et al. [8] assessed the efficiency of CO2 replacement in NGHs under various temperatures and pressures, finding that elevated temperatures and pressures enhance the reaction, thereby confirming the viability of the method. Zhou et al. [9], through the analysis of hydrate phase diagrams and geothermal gradients, identified an optimal replacement zone delineated by several key lines. Furthermore, Zhou et al. [10] noted that CO2 microemulsions are more effective than liquid CO2 in facilitating replacement. Wang et al. [11] employed Raman spectroscopy to monitor the CO2 replacement process in hydrates, discerning a two-stage mechanism comprising an initial rapid reaction phase followed by a sustained reaction phase.
In a numerical simulation, Uddin et al. [12] employed CMG STARS to explore CO2 hydrate formation in geological reservoirs via gas injection, revealing its capability to trap CO2 and highlighting the challenges in hydrate formation for geological CO2 sequestration. Qanbari et al. [13] also used CMG STARS to assess deep-sea sediments for CO2 storage, finding that HFZ and NBZ act as thermodynamic barriers against CO2 migration, thus enabling long-term CO2 sequestration. Janicki’s team [14] combined STARS and HyReS to study methane recovery from gas hydrates and CO2 storage as hydrates, showing that depressurization and CO2 injection can enhance methane recovery and reduce CO2 emissions. Wang et al. [15] utilized STARS and HyReS to investigate the simultaneous recovery of methane and storage of CO2 as hydrates, emphasizing the impact of gas diffusion through hydrates and the influence of initial conditions on the efficiency of the process. Shanling Zhang et al. [16] utilized the CMG-STARS, 2020 edition software to study the numerical simulation of natural gas hydrate extraction by combining depressurization with CO2 replacement. The research indicates that the well bottom pressure, the pressure differential between injection and production, and the injection temperature significantly impact methane extraction and CO2 sequestration, with optimal conditions leading to maximum methane production and efficient CO2 storage.
However, research into the CO2-CH4 hydrate replacement method remains nascent [17,18], with no comprehensive kinetic model yet developed to describe the process comprehensively. There is an urgent need for further in-depth exploration of the complex mechanisms of CO2 replacement, hydrate storage, decomposition, and critical control parameters. This article analyzes the kinetic experimental data related to natural gas hydrates and CO2 hydrates. Based on these experiments, a numerical simulation model for CO2 replacement in natural gas hydrates has been developed using the CMG software, 2020 edition. Additionally, the study explores the production characteristics and spatial distribution of the CO2 replacement process in natural gas hydrates, as well as the factors influencing conventional CO2 replacement. The goal is to describe the intrinsic mechanisms driving CO2 replacement in natural gas hydrates.
2. The Fundamental Kinetics of CO2 Replacement in NGHs Systems
Sloan et al. [17] established experimental phase diagrams for CO2 and CH4 hydrates, as depicted in Figure 1. The phase boundaries are defined by equilibrium lines for the CH4 hydrate, the CO2 hydrate, and the gas–liquid equilibrium for CO2 and CH4. These lines segregate the diagram into four sectors: Area A, Area B, Area C, and Area D. Notably, in Areas A and B, the equilibrium line for the CH4 hydrate is positioned above that of the CO2 hydrate. This configuration suggests that injecting CO2 into geological formations under specific temperature and pressure conditions initiates the decomposition of NGHs. This decomposition releases CH4 and water, and concurrently, CO2 interacts with the liberated water to form the CO2 hydrate. The delineation of Areas A and B in the phase diagram highlights the thermodynamic viability of replacing NGHs with CO2, proposing a viable method.
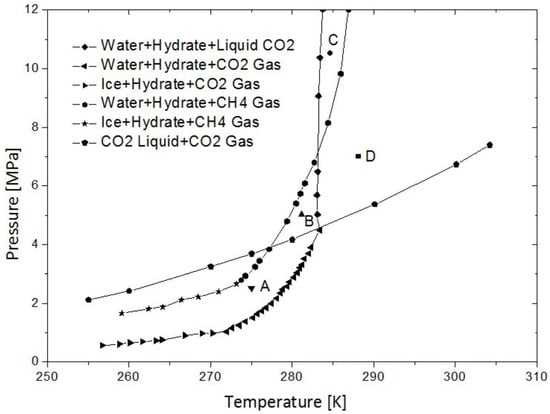
Figure 1.
Phase equilibrium diagram for CO2 and CH4 hydrates [18].
Scholars propose that the interaction between CO2 and NGHs induces a transition from a stable to an unstable state [19,20,21,22]. The interaction destabilizes the hydrate’s cage-like structure, facilitating the breakdown and subsequent release of CH4 and water molecules. Simultaneously, CO2 molecules form hydrates by engaging with water molecules via van der Waals forces. Due to their larger size, CO2 molecules are confined to the larger cavities, while water molecules, influenced by the hydrogen bonding memory effect, recombine with CH4 to form smaller cavities. This cyclic process persists until the reaction concludes. Uchina et al. [20], Kim et al. [23], and Sun et al. [24] investigated the CO2 replacement process in natural gas hydrates using in-situ Raman spectroscopy and experimental methods, developing kinetic models for decomposition and formation. However, significant variations were observed in the reported activation energies and pre-exponential factors among different studies. This study therefore surveyed and calculated these parameters for CH4 and CO2 hydrates, with the results summarized in Table 1, Table 2, Table 3 and Table 4. The analysis of these tables leads to the following conclusions:

Table 1.
Activation energy for the formation of NGHs.

Table 2.
Activation energy for the decomposition of NGHs.

Table 3.
Activation energy for the formation of the CO2 hydrate.

Table 4.
Activation energy for the decomposition of the CO2 hydrate.
- The activation energy of NGHs increases with the inclusion of more CH4 molecules in the cavities.
- Different types of NGHs exhibit varying activation energies; hydrate formation in carbon or glass beads typically has a lower activation energy compared with NGHs. Although the Structure I hydrate usually presents a lower activation energy than Structure II, some results suggest the opposite, which may be attributed to variations in experimental methodologies and data interpretation.
- The decomposition rate of NGHs diminishes as temperatures approach the freezing point (260–270 K), resulting in an increased activation energy due to the inherent stabilizing mechanisms of the hydrate.
- The influence of NaCl on the activation energy of NGHs remains unclear, with the potential to either decrease or increase the energy, suggesting that its effect is situational and requires further investigation.
3. Simulation Models
3.1. Model Assumptions
The model integrates five distinct components: three gaseous phases—carbon dioxide (CO2), methane (CH4), and water (H2O)—and two solid phases, which include methane hydrate (CH4·H2O) and carbon dioxide hydrate (CO2·H2O). It simulates the CO2 replacement of CH4·H2O, encompassing the decomposition of CH4·H2O, the synthesis and phase transitions of CO2·H2O, and the associated heat and mass transfer dynamics. The model framework is built on several assumptions:
- (1)
- It includes solid, liquid, and gaseous phases, assuming that the fluid flow adheres to Darcy’s law.
- (2)
- It excludes the influence of inhibitors and the effect of salinity on gas hydrate stability.
- (3)
- It accounts for heat conduction and convection, alongside hydrate decomposition and formation.
- (4)
- It omits the formation of ice from free water.
- (5)
- It assumes that the decomposition and formation of gas hydrates are predominantly governed by reaction kinetics.
- (6)
- It posits that NGHs are present in the formation as a solid, with the saturation relationship: Sw + Sg = 1, where Sw represents water saturation and Sg denotes gas saturation.
3.2. Mathematical Model
TOUGH-HYDRATE, v1.2 edition and CMG-STARS, 2020 edition are the primary software tools utilized for simulating the extraction of NGHs [16]. CMG-STARS models complex reservoir dynamics and facilitates the simulation of chemical reactions in a non-equilibrium state, thus supporting various hydrate recovery techniques. It is easier to use and features enhanced post-processing capabilities compared with TOUGH-HYDRATE. Investigating the CO2 hydrate replacement process is complex and challenging through conventional experimental approaches. CMG-STARS effectively visualizes this process and has been chosen for studying CO2 hydrate replacement. Here, we use the CMG-STARS software to simulate the process of carbon dioxide displacing natural gas hydrates.
The chemical equations that describe the formation and decomposition of NGHs and CO2 hydrate are presented in (1) and (2), respectively.
The kinetic equations for the decomposition of both CO2 hydrate and NGHs are presented in (3).
where is rate of NGH decomposition, mol/min; is the hydrate decomposition rate constant mol/(m2∙Pa∙s); is the activation energy for the decomposition, kJ/mol; R is the ideal gas constant, J/(mol∙K); T is temperature; is density, kg/m3; is porosity; S is saturation; the subscript ‘w’ and ‘h’ correspond to water and hydrate; K is the gas–liquid equilibrium constant; is the mole fraction of CH4 in the gas phase, %.
The mass conservation equation is given in (4)–(6).
where is density, kg/m3; is porosity; is saturation; is flow rate, m/s; the subscript ‘w’, ‘h’, and ‘g’ correspond to water, hydrate, and gas.
When the reservoir rock is classified as water-wet, the Brooks–Corey equation is applied to determine the phase infiltration parameters. This model, outlining the phase infiltration behavior for both gas and water, is presented in (7) and (8).
where is the relative permeability, dimensionless; is the maximum relative permeability, dimensionless; is the relative permeability decreasing index, dimensionless; is the bound water saturation; is the bound gas saturation.
The simulation employs the Kozeny equation to clarify the relationship between porosity and permeability, as expressed in (9) and (10).
where is the current porosity, dimensionless; is the original porosity, dimensionless; is the current permeability, mD; is the original permeability, mD.
4. Numerical Model Settings
4.1. Numerical Model Configuration
The simulation of the CO2 replacement process in NGH reservoirs utilizes the CMG-STARS software. It specifically targets the decomposition of NGHs and the subsequent CO2 hydrate formation. The computational domain, segmented into a grid of 5 m × 5 m × 5 m dimensions, consists of 4000 cells arranged in a 20 × 20 × 10 geometric configuration. Injection and production utilize a staggered well pattern. The model designates a CO2 injection rate of 10,000 m3/d, with an injection temperature and pressure of 10.15 °C and 10 MPa, respectively. The production well bottom-hole pressure is maintained at 4.5 MPa, ceasing production when the gas production declines below 2000 m3/d. Additional model specifics are illustrated in Figure 2, and Table 5 presents a detailed list of the reservoir properties. We will simulate the replacement process of different types of natural gas hydrates in the next article based on the conclusions of the second part by modifying the parameters related to the activation energy. Here, the decomposition activation energy for natural gas hydrates and carbon dioxide hydrates is 89.6 kJ/mol.
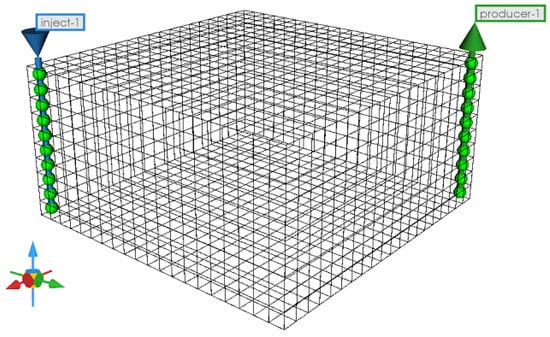
Figure 2.
Numerical model for CO2 replacement in a conventional NGH reservoir.

Table 5.
NGH reservoir properties.
4.2. Simulation Scenarios
To clarify the factors influencing the CO2 replacement process in conventional NGHs, multiple simulations were executed to evaluate the effects of the gas injection rate, the injected gas temperature, and the bottom-hole pressure on the displacement efficiency. The gas injection rates under consideration are 10,000 m3/d, 7000 m3/d, 5000 m3/d, 2000 m3/d, and 1000 m3/d. The injection temperatures assessed are 30 °C, 20 °C, 10.15 °C, 5 °C, and 0 °C. The bottom-hole pressures investigated are 7 MPa, 6 MPa, 5 MPa, 4.5 MPa, and 2 MPa. The results of the detailed analysis are presented below.
5. Results and Discussion
5.1. Analysis of the Production Dynamics of CO2 Replacement in a Conventional NGH Reservoir
Figure 3 and Figure 4, respectively, illustrate the cumulative graphs of the injection and production rates throughout the CO2 replacement process in NGHs. Figure 5 and Figure 6 depict the average temperature and the concentration distribution graphs of conventional NGHs. A visual analysis of these figures segments the replacement process into three distinct stages: Stage I (lasting 51 days), Stage II (spanning 158 days), and Stage III (extending over 944 days of production).
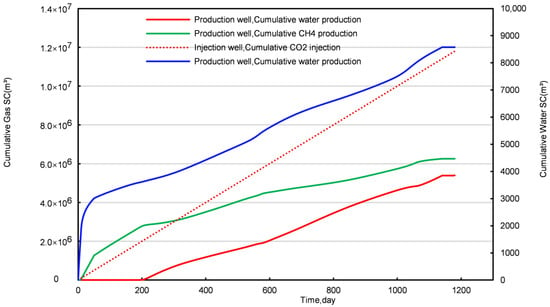
Figure 3.
Cumulative injection and production curves for a conventional NGH reservoir.
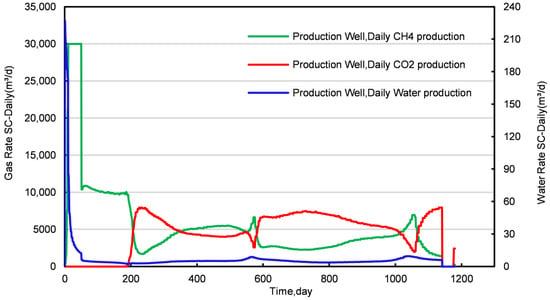
Figure 4.
Daily injection and production curves for a conventional NGH reservoir.
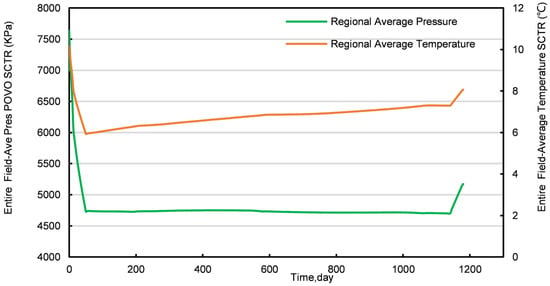
Figure 5.
Average temperature and pressure profiles of a conventional NGH reservoir.
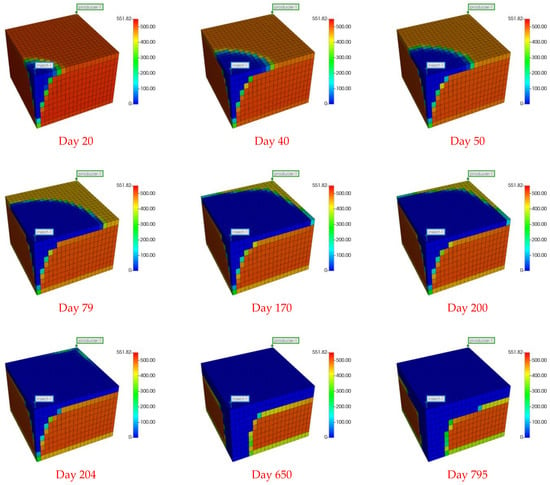
Figure 6.
NGH concentration field graph across different stages. Stage I (top row), Stage II (middle row), Stage III (bottom row).
In Stage I, the production from the conventional NGH reservoir features substantial daily water production, peaking at 226 m3/d. As the production progresses, the daily water production notably declines, whereas the daily CH4 production increases. On the 15th day, tCH4 production reaches a peak of 30,000 m3/d, which is sustained until the 51st day, followed by a subsequent decline. Figure 6 and Figure S1 show that the NGH concentration near the production well decreases significantly more than near the injection well during this phase, suggesting that pressure reduction plays a greater role in CH4 production than the CO2 replacement process. After replacement, the concentration and temperature fields show an elongated “nail-like” distribution, with the vertical expansion of the temperature and CH4 concentration fields being more pronounced than the horizontal. Additionally, there is a general downward trend in both the average pressure and temperature within the conventional NGH reservoir, with a temperature increase only near the injection well, attributed to CO2 hydrate formation, which releases more heat than NGH decomposition, thereby cooling most areas of the reservoir.
In Stage II, both CH4 and water production decline yet remain relatively stable. CH4 production averages around 10,000 m3/d, with water production at approximately 5 m3/d. The analysis of Figure 6 and Figure S1 reveals that this phase sees expanding areas of increased temperature, reflecting the growth of the CO2 hydrate formation zone and a decrease in the CH4 hydrate concentration. Notably, the spatial distribution of CO2 hydrate formation in Stage II differs markedly from Stage I, forming an “inverted thumbtack” shape with a broader upper and narrower lower section. A superimposition effect is observed in the upper layer of the replacement zone, where the process primarily occurs. This configuration results from the lower density of gaseous CO2, which drives its ascent to the upper layer, thus concentrating the replacement zone into the observed inverted “thumbtack” pattern.
Stage III is characterized by the initial breakthrough of injected CO2, leading to a fluctuating pattern in daily CH4 and CO2 production. An increase relationship is observed: an increase in daily CO2 production correlates with a decrease in CH4 production, and vice versa. To elucidate this dynamic, samples were obtained from four locations within the first stratum of the NGH reservoir at distances of 75 m, 90 m, 95 m, and 121 m from the injection point. The concentration profiles of CO2 and CH4 molar fractions at these locations are illustrated in Figure 7 and Figure 8.
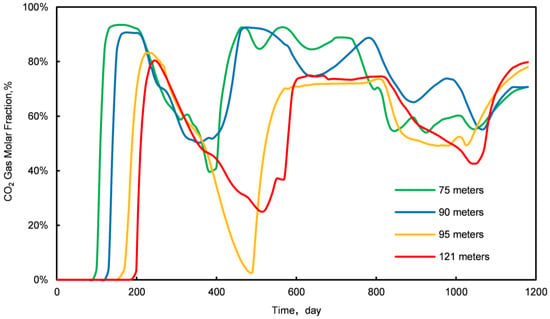
Figure 7.
Variation curves of CO2 molar fractions at four different sampling locations.
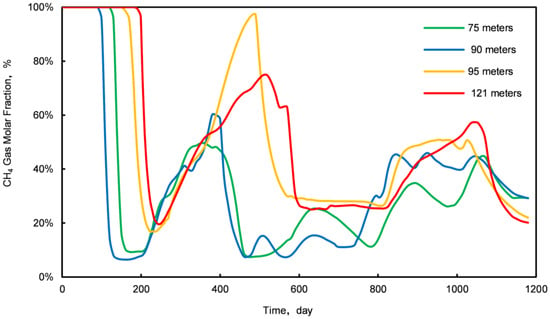
Figure 8.
Variation curves of CH4 molar fractions at four different sampling locations.
The analysis of Figure 7 and Figure 8 indicates a competitive relationship between CO2 and CH4 molar fractions during Stage III: a reduction in the CO2 molar fraction is paralleled by an enhancement in the CH4 molar fraction, and vice versa. This interaction occurs as excessive injected CO2 displaces natural gas, which is then released back into the formation post breakthrough. Thus, controlling the rate of injected CO2 is crucial for optimizing the CO2 replacement process in conventional NGH reservoirs.
5.2. Analysis of the Spatial Characteristics of CO2 Displacement in a Conventional NGH Reservoir
The spatial distribution of the CO2 replacement process within the NGH reservoir is characterized by three distinct regions: the competitive gas zone, the replacement domain, and the depressurization sector, as illustrated in Figure 9. Figure 10, Figure 11, Figure 12 and Figure 13 show the detailed visual data on permeability, the molar fraction distributions of CO2 and CH4 at various distances—75 m, 90 m, 95 m, and 121 m—from the injection well in the upper stratum of the conventional NGH reservoir, as well as the changes in the formation temperature.
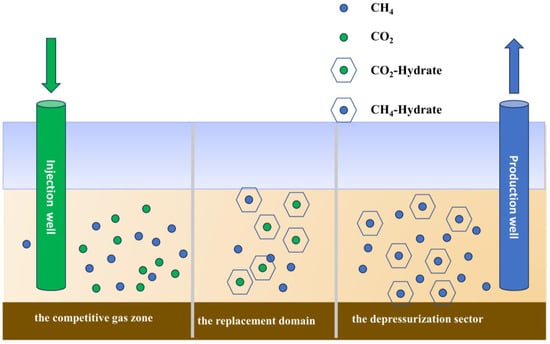
Figure 9.
Graph of the CO2 replacement zone in conventional NGH reservoir reactions.
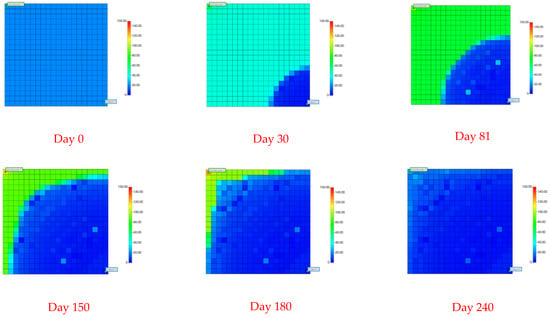
Figure 10.
Graph showing the distribution of permeability in a conventional NGH reservoir.
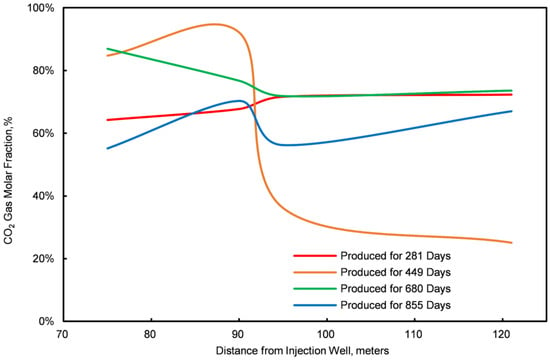
Figure 11.
Graph of the CO2 molar fractions at four different points.
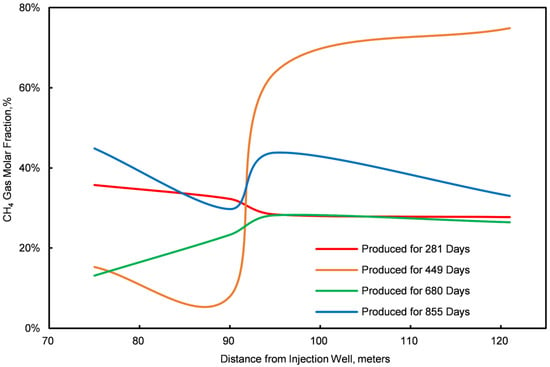
Figure 12.
Graph of the CH4 molar fractions at four different points.
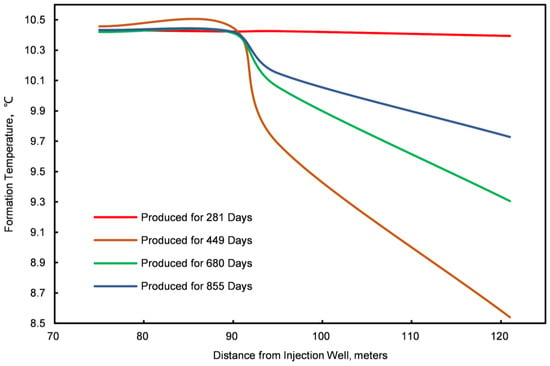
Figure 13.
Formation temperature graph for four locations.
- (1)
- Analysis of the spatial profile in the depressurization sector.
The initiation of a depressurization sector occurs near the production well due to the decreasing surrounding pressure. This zone significantly impacts a wide area, possibly extending to the injection well. As illustrated in Figure 6, Figure 10, Figure 11, Figure 12 and Figure 13, deploying conventional NGHs within this zone leads to several critical observations.
- ①
- Within the depressurization sector, the reservoir pressure of conventional NGHs falls below the phase equilibrium curve required for stability. This decline triggers the decomposition of NGHs into water and CH4, resulting in a marked reduction in the NGH concentration and a corresponding decrease in the water saturation in the affected area.
- ②
- The depressurization process is associated with a temperature decrease in the conventional NGH reservoir. This cooling is attributed to the endothermic nature of NGH decomposition, which absorbs heat from the surrounding formation, thus lowering the reservoir temperature.
- ③
- Post decomposition, an increase in the formation permeability is noted. The decomposition process enlarges the contact area between particles, creating greater pore spaces and enhancing the formation porosity.
- (2)
- Analysis of the spatial characteristics in the replacement domain.
The replacement domain is located at the forefront of the injected gas, forming a relatively narrow band. Initially, this zone expands in a conical pattern; however, as the replacement process progresses, it assumes a sector-like shape. The vertical extent of the affected region gradually contracts, while the horizontal span widens. By the mid-to-late stages of the replacement process, the zone retains some vertical reach, although the horizontal extent remains more pronounced. As illustrated in Figure 6, Figure 10, Figure 11, Figure 12 and Figure 13, the observations indicate that NGHs within the replacement domain exhibit distinctive characteristics:
- ①
- There is a gradual decrease in the concentration of NGHs, accompanied by a steady increase in the CO2 hydrate concentration and a corresponding reduction in the water saturation. This shift is attributed to the thermodynamic stability of the CO2 hydrate, which promotes replacement reactions with NGHs.
- ②
- A significant increase in the formation temperature is observed within the replacement domain. The formation of the CO2 hydrate is an exothermic process that releases more heat than the decomposition of the CH4 hydrate absorbs, resulting in elevated temperatures in this region.
- ③
- Additionally, a gradual decrease in the formation permeability is noted within the replacement domain. This reduction is due to the decreased contact area between particles following CO2 hydrate formation, which narrows the pore spaces and consequently lowers both the porosity and permeability.
- (3)
- Analysis of the spatial characteristics of the gas competition zone.
In the initial phase of the replacement process, the gas competition zone is delineated by a conical shape that extends both horizontally and vertically. As the process progresses, this zone tends to widen laterally, while its vertical dimension remains relatively unchanged. Figure 6, Figure 10, Figure 11, Figure 12 and Figure 13 provide visual data that highlight the unique characteristics of this zone.
- ①
- Within this region, CO2 and CH4 compete spatially; a decrease in the mole fraction of CO2 is associated with an increase in CH4, and vice versa. This interaction results from maintaining a constant bottom-hole pressure with a fixed total gas output, establishing a zero-sum dynamic between the two gases.
- ②
- The mole fractions of CO2 and CH4 are influenced by temperature. At 10.5 °C, the mole fraction of CO2 peaks, whereas CH4 reaches its minimum. In contrast, at 8.6 °C, the minimum mole fraction of CO2 and the maximum of CH4 are observed. According to Figure 1, the conditions at 10.5 °C and 4.5 MPa correspond to Region C of the phase diagram, where the CO2 hydrate phase is predominant. This suggests that CH4 is more likely to replace the CO2 hydrate, leading to higher CO2 and lower CH4 mole fractions. Conversely, at 8.6 °C and the same pressure, the conditions align within Region B, where NGHs predominate over the CO2 hydrate. This implies that CO2 is more likely to displace NGHs, reflecting the competitive gas interactions noted in this zone.
5.3. Effect of Gas Injection Rate
Cumulative production graphs for CH4, CO2, and water are depicted in Figures S2–S4 for varying gas injection rates. These figures establish a direct correlation between the gas injection rate of CO2 and the cumulative production of CH4, CO2, and water. An increased gas injection rate results in earlier CO2 breakthroughs at the production well. For example, at an injection rate of 1000 m3/d, cumulative CH4 production totals 2 × 10⁶ m3, with negligible CO2 production and a cumulative water production of 4800 m3. In contrast, at an injection rate of 10,000 m3/d, cumulative production escalates to 6.3 × 10⁶ m3 for CH4, 5.5 × 10⁶ m3 for CO2, and 8600 m3 for water, compared with an injection volume of 1.08 × 10⁷ m3.
Based on the data presented in Figure 14, it can be observed that during the initial 40 days of production, the methane-to-water ratio and methane yield remain consistent across various injection rates. This suggests that methane production during this phase is predominantly derived from methane released through the depressurization process. As the production period extends, the methane-to-water ratio tends to increase, yet it remains relatively stable at an injection rate of 1000 m3/d. At lower injection velocities, methane and water are produced in proportion, indicating that insufficient gas injection fails to effectively displace the methane. Upon integrating the data from Figure 14 and Figures S2–S4, it is evident that at an injection rate of 10,000 m3/d, while the methane production is maximized, the concurrent water production is also significantly higher. This leads to a decrease in the gas-to-water ratio in the later stages, which is conducive to the expulsion of methane from the reservoir in the later phases of production. Although a higher CO2 injection rate can result in increased methane production, an excessive injection rate may cause the premature breakthrough of CO2, thereby increasing the costs associated with subsequent gas separation. Consequently, the optimization of the injection rate is of paramount importance for enhancing the recovery rate of conventional natural gas hydrate reservoirs and reducing the costs of gas separation. The judicious selection of injection rates can balance methane production with water generation, prevent premature CO2 breakthrough, and ultimately maximize economic efficiency.
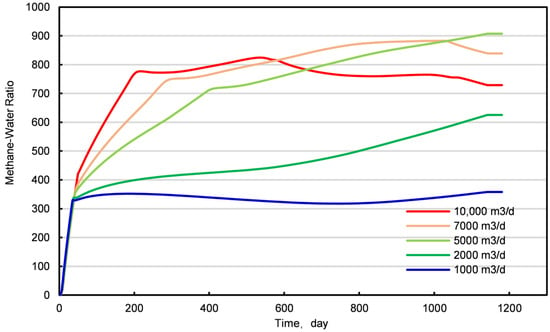
Figure 14.
The ratio of methane to water at different injection rates.
5.4. Effect of CO2 Temperature
Figures S5–S7 depict the cumulative production curves for CH4, CO2, and water under varying injection temperatures. The analysis of these figures reveals that the maximal cumulative volumes of CH4 and CO2 are obtained at an injection temperature of 10.15 °C, with volumes reaching 6.2 × 10⁶ m3 and 6.0 × 10⁶ m3, respectively. Notably, the second highest CH4 production occurs at 5 °C, with subsequent decreases noted at 20 °C and 30 °C; the lowest production is observed at 0 °C. Additionally, a direct relationship exists between the injection temperature and CO2 production, with elevated temperatures resulting in increased CO2 production.
In the early stages of natural gas hydrate production, the influence of varying injection temperatures on methane yield is not significant, with the methane-to-water ratio and methane production remaining consistent over the first 100 days (Figure 15 and Figures S5–S7). This phenomenon suggests that during the initial production phase, the temperature of the injected carbon dioxide does not affect methane production. However, as the production process continues, the methane-to-water ratio exhibits a trend of increasing initially and then decreasing, with the curve at an injection temperature of 0 °C being notably higher than at other temperatures and its decline phase being shorter.
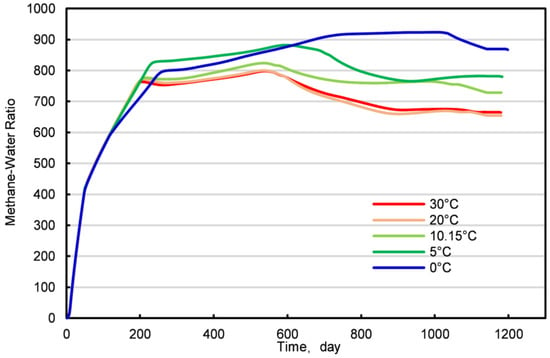
Figure 15.
The ratio of methane to water under different injection temperatures.
Further analysis indicates that the optimal injection temperature range for natural gas hydrates is 5–10 °C, with the effect of temperature on the displacement effect being complex. When the injection temperature is relatively high, the production well yields larger amounts of CO2 and CH4. Conversely, at lower injection temperatures, the production of CO2 and CH4 is smaller. The presence of a gas competition zone leads to a competitive relationship between CO2 and CH4, which under certain production pressure differentials, manifests as a “zero-sum” dynamic. Therefore, when the production well’s CO2 yield is high, the CH4 yield decreases, and vice versa. When the injection temperature is too low, the reaction rate slows down, limiting the ability to displace CH4, which explains the lower methane production in the production well at an injection temperature of 0 °C.
In summary, the injection temperature has a significant impact on methane production and displacement effects. While the temperature has little effect on methane production in the initial stage of production, its influence on the methane-to-water ratio and production becomes apparent as the production time extends. Therefore, in practical operations, the injection temperature should be adjusted according to specific conditions to optimize methane production and displacement efficiency. This finding has important theoretical and practical significance for the efficient exploitation of natural gas hydrates.
5.5. Effect of Bottom-Hole Pressure
Figures S8–S10 illustrate the cumulative production curves for CH4, CO2, and water across different bottom-hole pressures. The analysis of these figure indicates an inverse relationship between the bottom-hole pressure and the cumulative production of CO2 and CH4, as well as water. Elevated bottom-hole pressures correlate with delayed CO2 breakthroughs, whereas reduced pressures result in earlier breakthroughs at the production well. For example, at a bottom-hole pressure of 7 MPa, the cumulative production values measure 7.2 × 10⁵ m3 for CO2, 5.1 × 10⁶ m3 for CH4, and 6426 m3 for water. At 4 MPa, these values rise to 5.4 × 10⁶ m3 for CO2, 6.2 × 10⁶ m3 for CH4, and 9377 m3 for water. Notably, at the minimum pressure of 2 MPa, the cumulative CH4 production escalates rapidly but is short-lived, enduring only 140 days due to enhanced decomposition.
From Figure 16, it is evident that as the bottom-hole pressure decreases, the slope of the methane-to-water ratio increases, indicating that the lower the bottom-hole pressure, the faster the decomposition rate of the natural gas hydrate. When the bottom-hole pressure was 2 MPa, methane production ceased by the 32nd day. This phenomenon arises from an insufficient interaction between the injected CO2 and NGHs under low bottom-hole pressures, leading to premature migration towards the production well and early CO2 breakthrough. In such cases, the depressurization effect dominates, increasing the cumulative outputs of CH4 and water. Consequently, establishing an optimal bottom-hole pressure is essential when employing the CO2 replacement method in NGH reservoir development to avert formation collapse and early CO2 breakthrough.
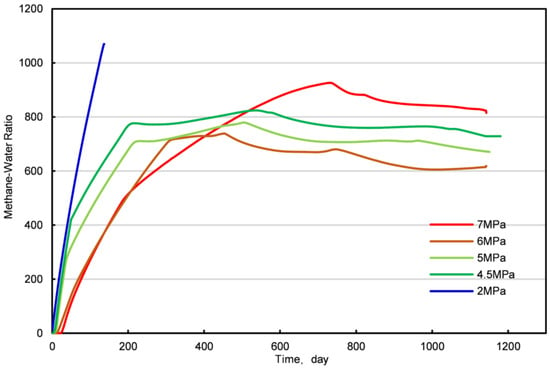
Figure 16.
The ratio of methane to water under different bottom-hole pressures.
6. Conclusions
This study represents a significant leap forward in the understanding of the CO2 replacement of natural gas hydrates (NGHs), introducing innovative aspects and addressing key hot topics in the field. By employing a synergistic blend of experimental and numerical simulation methods, we have:
- Developed a groundbreaking conceptual model for CO2-driven hydrate replacement, providing a robust framework to comprehend the complex kinetics of hydrate decomposition and CO2 hydrate formation, which has been a major knowledge gap in the scientific community.
- Unveiled the optimal injection temperature range of 5–10 °C for standard NGH reservoirs, a critical parameter that maximizes CH4 production efficiency and minimizes the environmental impact, offering practical guidance for real-world extraction operations.
- Highlighted the intricate relationship between the gas injection rate and the bottom-hole pressure, demonstrating their combined influence on CH4 yield and presenting a balanced optimization strategy that enhances production and economic efficiency while reducing gas separation costs.
- Advanced the theoretical foundation for CO2 replacement technology in NGH extraction, contributing to the ongoing discourse on unconventional gas resources and offering valuable insights for future research and development endeavors. This study’s innovative approach and focus on hot topics position it at the forefront of NGH research, paving the way for more efficient and sustainable energy extraction practices.
Supplementary Materials
The following supporting information can be downloaded at: https://www.mdpi.com/article/10.3390/en18040924/s1, Figure S1: Temperature Field Graph for conventional NGHs Reservoir by Stage Stage Ⅰ (Top Row) Stage Ⅱ (Middle Row) Stage Ⅲ (Bottom Row); Figure S2: Cumulative CH4 production at the production well for different gas injection rates; Figure S3: Cumulative CO2 production at the production well for different gas injection rates; Figure S4: Cumulative water production at the production well with different gas injection rates; Figure S5: Cumulative CH4 production at the production well under different injection temperatures; Figure S6: Cumulative CO2 production at the production well under different injection temperatures; Figure S7: Cumulative water production at the production well for different injection temperatures; Figure S8: Cumulative CH4 production at the production well under different downhole pressure conditions; Figure S9: Cumulative CO2 production at the production well at different downhole pressures; Figure S10: Cumulative water production from the production well at different downhole pressures;
Author Contributions
Conceptualization, Q.Z.; methodology, H.J.; software, Y.Z. and G.C.; validation, H.J.; formal analysis, Q.Z.; investigation, H.J., Y.Z. and Z.W.; resources, S.Y.; data curation, Y.Z.; writing—original draft preparation, Y.Z.; writing—review and editing, Z.W.; visualization, S.Y.; supervision, Z.W.; project administration, G.C.; funding acquisition, G.C. and Q.Z. All authors have read and agreed to the published version of the manuscript.
Funding
This paper is supported by the China National Science and Technology Major Project: “Research and Demonstration of Key Technologies for the Whole Industry Chain of Carbon Dioxide Large-scale Capture, Enhanced Oil Recovery, and Storage” (2021ZZ01).
Data Availability Statement
Restrictions apply to the datasets. The datasets presented in this article are not readily available because the data are part of an ongoing study.
Conflicts of Interest
The authors declare no conflict of interest.
References
- Li, J.; Ye, J.; Qin, X.; Qiu, H.; Wu, N.; Lu, H.; Xie, W.; Lu, J.; Peng, F.; Xu, Z.; et al. The first offshore natural gas hydrate production test in South China Sea. China Geol. 2018, 1, 5–16. [Google Scholar] [CrossRef]
- Chandrasekharan Nair, V.; Gupta, P.; Sangwai, J.S. Natural Gas Production from a Marine Clayey Hydrate Reservoir Formed in Seawater Using Depressurization at Constant Pressure, Depressurization by Constant Rate Gas Release, Thermal Stimulation, and Their Implications for Real Field Applications. Energy Fuels 2019, 33, 3108–3122. [Google Scholar] [CrossRef]
- Yang, L.; Liu, Y.; Zhang, H.; Xiao, B.; Guo, X.; Wei, R.; Xu, L.; Sun, L.; Yu, B.; Leng, S.; et al. The status of exploitation techniques of natural gas hydrate. Chin. J. Chem. Eng. 2019, 27, 2133–2147. [Google Scholar] [CrossRef]
- Wu, P.; Li, Y.; Sun, X.; Liu, W.; Song, Y. Mechanical Characteristics of Hydrate-Bearing Sediment: A Review. Energy Fuels 2021, 35, 1041–1057. [Google Scholar] [CrossRef]
- Liu, Z.; Xu, J.; Li, H.; Li, S.; Fan, X. Numerical Investigation of CO2 Storage Capacity via Hydrate in Deep-Sea Sediments. Energy Fuels 2023, 37, 18996–19010. [Google Scholar] [CrossRef]
- Ebinuma, T. Method for Dumping and Disposing of Carbon Dioxide Gas and Apparatus Therefor; NKK Corporation: Tokyo, Japan, 1993. [Google Scholar]
- Ohgaki, K.; Takano, K.; Sangawa, H.; Matsubara, T.; Nakano, S. Methane Exploitation by Carbon Dioxide from Gas Hydrates—Phase Equilibria for CO2-CH4 Mixed Hydrate System. J. Chem. Eng. Jpn. 1996, 29, 478–483. [Google Scholar] [CrossRef]
- Wang, J.; Guo, X.; Chen, G.; Li, Z.; Yang, L. Experimental Research on Methane Recovery from Natural Gas Hydrate by Carbon Dioxide Replacement. J. Chem. Eng. Chin. Univ. 2007, 4, 715–719. [Google Scholar]
- Zhou, X.; Fan, S.; Liang, D.; Du, J. Determination of appropriate condition on replacing methane from hydrate with carbon dioxide. Energy Convers. Manag. 2008, 49, 2124–2129. [Google Scholar] [CrossRef]
- Zhou, X.; Fan, S.; Liang, D.; Du, J. Replacement of Methane from Quartz Sand-Bearing Hydrate with Carbon Dioxide-in-Water Emulsion. Energy Fuels 2008, 22, 1759–1764. [Google Scholar] [CrossRef]
- Wang, F. Mirco-Experimental Study on Replacement of CH4 Hydrate by Use of CO2. Ph.D. Thesis, China University of Geosciences, Wuhan, China, 2015. [Google Scholar]
- Uddin, M.; Coombe, D.; Wright, F. Modeling of CO2-Hydrate Formation in Geological Reservoirs by Injection of CO2 Gas. J. Energy Resour. Technol. 2008, 130, 032502. [Google Scholar] [CrossRef]
- Qanbari, F.; Pooladi-Darvish, M.; Hamed Tabatabaie, S.; Gerami, S. Storage of CO2 as hydrate beneath the ocean floor. Energy Procedia 2011, 4, 3997–4004. [Google Scholar] [CrossRef]
- Janicki, G.; Schlüter, S.; Hennig, T.; Lyko, H.; Deerberg, G. Simulation of Methane Recovery from Gas Hydrates Combined with Storing Carbon Dioxide as Hydrates. J. Geol. Res. 2011, 2011, 462156. [Google Scholar] [CrossRef]
- Wang, Y.; Dong, B.; Zhang, L.; Li, W.; Song, Y. Numerical simulation of CH4 recovery from gas hydrate using gaseous CO2 injected into porous media. J. Nat. Gas Sci. Eng. 2021, 95, 104199. [Google Scholar] [CrossRef]
- Zhang, S.; Ma, Y.; Xu, Z.; Zhang, Y.; Liu, X.; Zhong, X.; Tu, G.; Chen, C. Numerical simulation study of natural gas hydrate extraction by depressurization combined with CO2 replacement. Energy 2024, 303, 131998. [Google Scholar] [CrossRef]
- Sloan, E.D., Jr.; Koh, C.A. Clathrate Hydrates of Natural Gases, 3rd ed.; CRC Press: Boca Raton, FL, USA, 2007. [Google Scholar]
- Zhao, J.; Xu, K.; Song, Y.; Liu, W.; Lam, W.; Liu, Y.; Xue, K.; Zhu, Y.; Yu, X.; Li, Q. A Review on Research on Replacement of CH4 in Natural Gas Hydrates by Use of CO2. Energies 2012, 5, 399–419. [Google Scholar] [CrossRef]
- Ota, M.; Abe, Y.; Watanabe, M.; Smith, R.L.; Inomata, H. Methane recovery from methane hydrate using pressurized CO2. Fluid Phase Equilibria 2005, 228–229, 553–559. [Google Scholar] [CrossRef]
- Uchida, T.; Ikeda, I.Y.; Takeya, S.; Kamata, Y.; Ohmura, R.; Nagao, J.; Zatsepina, O.Y.; Buffett, B.A. Kinetics and Stability of CH4–CO2 Mixed Gas Hydrates during Formation and Long-Term Storage. ChemPhysChem 2005, 6, 646–654. [Google Scholar] [CrossRef]
- Zhang, Y.; Cui, M.; Li, D.; Xin, G. Microscopic Insights and Optimization of the CH4–CO2 Replacement in Natural Gas Hydrates. ACS Omega 2022, 7, 47239–47250. [Google Scholar] [CrossRef] [PubMed]
- Liu, T.; Wu, P.; Chen, Z.; Li, Y. Review on Carbon Dioxide Replacement of Natural Gas Hydrate: Research Progress and Perspectives. Energy Fuels 2022, 36, 7321–7336. [Google Scholar] [CrossRef]
- Kim, H.C.; Bishnoi, P.R.; Heidemann, R.A.; Rizvi, S.S.H. Kinetics of methane hydrate decomposition. Chem. Eng. Sci. 1987, 42, 1645–1653. [Google Scholar] [CrossRef]
- Sun, C.; Chen, G.; Guo, T.; Lin, W.; Chen, J. Kinetics of methane hydrate decomposition. J. Chem. Ind. Eng. 2002, 9, 899–903. [Google Scholar]
- Huang, W.; Fan, S.; Peng, H.; Liang, D.; Li, D. Kinetics of methane hydrate formation in mixture of ice powders and sand. J. Chem. Ind. Eng. 2007, 6, 1439–1444. [Google Scholar]
- Wang, X.; Schultz, A.J.; Halpern, Y. Kinetics of Methane Hydrate Formation from Polycrystalline Deuterated Ice. J. Phys. Chem. A 2002, 106, 7304–7309. [Google Scholar] [CrossRef]
- Tian, L.; Tang, C.; Fan, S. Formation of Natural Gas Hydrates from Ice on the Surface of Glass Ball. Low-Carbon Chem. Chem. Eng. 2006, 6, 28–33+39. [Google Scholar]
- Liu, J.; Yan, L.; Cheng, G.; Guo, T. Kinetics of Methane Hydrate Dissociation in Active Carbon. Acta Chim. Sin. 2002, 8, 1385–1389+1348. [Google Scholar]
- Vysniauskas, A.; Bishnoi, P.R. A kinetic study of methane hydrate formation. Chem. Eng. Sci. 1983, 38, 1061–1072. [Google Scholar] [CrossRef]
- Li, B.; Li, X.-S.; Li, G. Kinetic studies of methane hydrate formation in porous media based on experiments in a pilot-scale hydrate simulator and a new model. Chem. Eng. Sci. 2014, 105, 220–230. [Google Scholar] [CrossRef]
- Li, J. Transport Mechanisms of Heat and Mass During the Decomposition of Natural Gas Hydrate. Ph.D. Thesis, China University of Petroleum, Beijing, China, 2020. [Google Scholar]
- Clarke, M.; Bishnoi, P.R. Determination of the activation energy and intrinsic rate constant of methane gas hydrate decomposition. Can. J. Chem. Eng. 2001, 79, 143–147. [Google Scholar] [CrossRef]
- Myshakin, E.M.; Jiang, H.; Warzinski, R.P.; Jordan, K.D. Molecular Dynamics Simulations of Methane Hydrate Decomposition. J. Phys. Chem. A 2009, 113, 1913–1921. [Google Scholar] [CrossRef] [PubMed]
- Tian, L.; Fan, S.; Hao, W. Methane Hydrate Dissociation at Normal Pressure. J. Wuhan Univ. Techol. 2006, 7, 23–26. [Google Scholar]
- Clarke, M.A.; Bishnoi, P.R. Measuring and modelling the rate of decomposition of gas hydrates formed from mixtures of methane and ethane. Chem. Eng. Sci. 2001, 56, 4715–4724. [Google Scholar] [CrossRef]
- Cheng, H. Reservoir Simulation of Gas Production from Natural Gas Hydrate Sediments. Master’s Thesis, China University of Petroleum (East China), Dongying, China, 2008. [Google Scholar]
- Li, K.; Chen, B.; Song, Y.; Yang, M. Molecular dynamics simulation of the effects of different thermodynamic parameters on methane hydrate dissociation: An analysis of temperature, pressure and gas concentrations. Fluid Phase Equilibria 2020, 516, 112606. [Google Scholar] [CrossRef]
- English, N.J.; Johnson, J.K.; Taylor, C.E. Molecular-dynamics simulations of methane hydrate dissociation. J. Chem. Phys. 2005, 123, 244503. [Google Scholar] [CrossRef]
- Li, Z. Natural Gas Hydrate Replacement Development and Utilization; Central South University Press: Changsha, China, 2021; pp. 120–123. [Google Scholar]
- Lin, W. Basic Researches Related to Gas Storage in the Form of Hydrate; China University of Petroleum: Beijing, China, 2004. [Google Scholar]
- Uddin, M.F.M.; Coombe, D.A. Kinetics of CH4 and CO2 hydrate dissociation and gas bubble evolution via MD simulation. J. Phys. Chem. A 2014, 118, 1971–1988. [Google Scholar] [CrossRef] [PubMed]
- Liang, M.; Chen, G.; Sun, C.; Yan, L.; Liu, J.; Ma, Q. Experimental and Modeling Study on Decomposition Kinetics of Methane Hydrates in Different Media. J. Phys. Chem. B 2005, 109, 19034–19041. [Google Scholar] [CrossRef] [PubMed]
- Malegaonkar, M.B.; Dholabhai, P.D.; Bishnoi, P.R. Kinetics of carbon dioxide and methane hydrate formation. Can. J. Chem. Eng. 1997, 75, 1090–1099. [Google Scholar] [CrossRef]
- Lee, J.-W.; Chun, M.-K.; Lee, K.-M.; Kim, Y.-J.; Lee, H. Phase equilibria and kinetic behavior of CO2 hydrate in electrolyte and porous media solutions: Application to ocean sequestration of CO2. Korean J. Chem. Eng. 2002, 19, 673–678. [Google Scholar] [CrossRef]
- Clarke, M.A.; Bishnoi, P.R. Determination of the intrinsic kinetics of CO2 gas hydrate formation using in situ particle size analysis. Chem. Eng. Sci. 2005, 60, 695–709. [Google Scholar] [CrossRef]
- Fukumoto, A.; Sean, W.-Y.; Sato, T.; Yamasaki, A.; Kiyono, F. Estimation of dissociation rate constant of CO2 hydrate in water flow. Greenh. Gases Sci. Technol. 2015, 5, 169–179. [Google Scholar] [CrossRef]
- Wang, J.; Li, A.; Liu, F.; Luo, Z. Experimental study on in situ dissociation kinetics of CO2 hydrate in pure water and water/sediments systems. Greenh. Gases Sci. Technol. 2021, 11, 331–341. [Google Scholar] [CrossRef]
- Clarke, M.A.; Bishnoi, P.R. Determination of the intrinsic rate constant and activation energy of CO2 gas hydrate decomposition using in-situ particle size analysis. Chem. Eng. Sci. 2004, 59, 2983–2993. [Google Scholar] [CrossRef]
- Sun, C.; Ma, C.; Chen, G.; Guo, T. Kinetics of decomposition for carbon dioxide hydrate. J. Univ. Pet. China 2001, 3, 8–10+7. [Google Scholar]
Disclaimer/Publisher’s Note: The statements, opinions and data contained in all publications are solely those of the individual author(s) and contributor(s) and not of MDPI and/or the editor(s). MDPI and/or the editor(s) disclaim responsibility for any injury to people or property resulting from any ideas, methods, instructions or products referred to in the content. |
© 2025 by the authors. Licensee MDPI, Basel, Switzerland. This article is an open access article distributed under the terms and conditions of the Creative Commons Attribution (CC BY) license (https://creativecommons.org/licenses/by/4.0/).