Article

Two-Stage Dual-Level Dispatch Optimization Model for Multiple Virtual Power Plants with Electric Vehicles and Demand Response Based on a Stackelberg Game

1
School of Electric and Information Engineering, Yunnan Minzu University, Kunming 650500, China
2
Institute of Unmanned Autonomous Systems, Yunnan Minzu University, Kunming 650500, China
*
Author to whom correspondence should be addressed.
Energies 2025, 18(4), 896; https://doi.org/10.3390/en18040896
Submission received: 4 January 2025 / Revised: 7 February 2025 / Accepted: 8 February 2025 / Published: 13 February 2025
(This article belongs to the Section E: Electric Vehicles)

Abstract

With the continuous increase in the number of electric vehicles (EVs) and the rapid development of demand response (DR) technology, the power grid faces unprecedented challenges. A two-stage dual-level dispatch optimization model of multiple virtual power plants based on a Stackelberg game is proposed in this paper. In the day-ahead stage, a two-layer optimization scheduling model is established, where the EV layer optimizes its actions for maximum comprehensive user satisfaction, while the VPP layer optimizes its actions for minimal operating costs and interaction power, determining the scheduling arrangements for each distributed energy resource. In the intraday stage, a Stackelberg game model is constructed with the distribution network operator (DNO) as the leader, aiming to maximize profits, and the VPP as the follower, aiming to minimize its own operational costs, with both parties engaging in a game based on electricity prices and energy consumption strategies. In the simulation case study, the effectiveness of the constructed model was verified. The results show that the model can effectively reduce user costs, thereby increasing the comprehensive satisfaction of EV users by 20.7% and reducing VPP operating costs by 13.37%.

1. Introduction

In recent years, distributed energy resources have developed rapidly due to their economic, flexible, and environmentally friendly characteristics, and their proportion in the power system has been gradually increasing. However, distributed energy resources are mostly renewable energy sources such as wind and photovoltaic resources, whose intermittent output and limited predictability continue to increase the peak-regulation pressure on the power system. On the other hand, due to the continuous development in charging and energy storage technology, electric vehicles, which are in line with the trend of low carbon emissions, will become the future development trend of the automotive industry. However, due to the strong randomness of electric vehicle charging time and the increase in load caused by the large number of electric vehicles connected to power, without proper coordination and scheduling, the combination of the increase in the proportion of renewable energy and the increase in the number of EV charging loads will amplify the imbalance of the power grid, thereby affecting the stability of its operation. Therefore, new solutions are needed to improve the charging and discharging efficiency of electric vehicles and ensure the stable operation of the power system.
Starting from a single stakeholder’s perspective, has conducted numerous studies on aspects such as power dispatching in VPPs [1], bidding models [2], and so on. Cao et al. [3] proposed a method combining Latin hypercube sampling and K-means clustering to address the uncertainty of wind and solar energy output. Kasaei et al. [4] aimed to minimize the total operating cost of VPPs within 24 h and proposed a metaheuristic optimization algorithm to manage the output of various distributed energy resources.
In terms of optimization problems related to EVs, orderly optimization of EV charging and discharging behaviors can help alleviate the power supply pressure on microgrids and smooth the load curve [5,6,7,8]. Sun et al. [9] studied the optimized design of fast-charging stations for EVs with wind power, photovoltaic generation, and energy storage systems, determining the capacity configuration of components and power scheduling strategies. Rezaei et al. [10] proposed a new model for energy and reserve management of microgrids in the presence of EVs, optimizing the social welfare of microgrids while reliably meeting the driving needs of EV owners. Hu et al. [11] proposed a real-time scheduling method for microgrids using the flexibility of cluster EV charging and discharging to suppress photovoltaic power fluctuations. Correia et al. [12] proposed an assessment of the technical and economic impacts of a building-level microgrid, considering photovoltaic generation, battery energy storage, and the use of electric vehicles in a vehicle-to-building (V2B) system. Regarding customer satisfaction, Chen et al. [13] proposed a multi-objective optimization model for microgrids combined with different types of distributed generation units, and they introduced user satisfaction after optimization to prove the rationality of the mathematical model. Wang et al. [14] proposed a two-stage scheduling strategy for large EVs, solved by a particle swarm algorithm, and considered users’ satisfaction and willingness to participate in scheduling. Tang et al. [15] proposed to optimize solutions with the comprehensive satisfaction of users having various flexible loads as the objective function, fully considering the comfort and economy of users.
In recent years, bi-level optimization and multi-objective optimization have garnered widespread attention in the optimization scheduling of VPPs. Li et al. [16] proposed a two-layer partition optimization scheduling strategy for EV charging and discharging. The fluctuation curve of the power grid system during charging and discharging periods is minimized by the upper layer scheduling model, considering the dispatchability of EVs and the willingness of users to achieve the lowest user-side cost. Liu et al. [17] proposed a two-layer real-time scheduling model for microgrids based on the Approximate Future Cost Function (AFCF). Pandey et al. [18] used the Multi-Objective Black Widow Optimization (MOBWO) algorithm to solve the multi-objective optimization scheduling problem of VPPs considering various renewable energy sources, achieving maximum profit and minimum emissions while satisfying relevant constraints.
Game theory has been extensively applied in the field of electrical engineering. Wang et al. [19] studied the use of game theory to analyze the balance of interests between different entities within and between VPPs. Yin et al. [20] considered prosumers operating as VPPs, where secondary prosumers respond to the pricing signals set by the upper level, linearizing a two-stage robust Stackelberg game model and solving it using the CC&G algorithm. Özge E et al. [21] proposed a Stackelberg game approach where prosumers can dynamically change between buyer and seller roles according to the pricing strategy of the microgrid operator at each time interval, while formulating energy consumption strategies to play a more active role in the microgrid. In the model described by Fu et al. [22], microgrids set charging prices for electricity and discharging prices for electric vehicles based on the supply and demand of electricity to achieve maximum benefits. Users, acting as followers, formulate their electricity usage and discharging strategies according to the electricity prices to achieve the highest level of electricity satisfaction and the lowest costs. Cao et al. [23] proposed a Stackelberg game model for competition among multiple virtual power plants, where operators act as leaders by optimizing prices to guide the energy trading of each VPP. Each VPP, acting as a follower, optimizes the internal aggregation units and loads based on the published prices and uses a Kriging metamodel to solve its own energy scheduling model.
In summary, traditional VPP optimization strategies often overlook real-time requirements, especially when facing the challenges posed by multiple VPPs and the diverse economic and energy needs of multiple stakeholders. To enhance the economic efficiency and stability of VPPs, it is crucial to propose new optimization strategies to better manage operational costs and resource scheduling. Therefore, a bi-level, two-stage optimization strategy for VPPs is proposed. In the day-ahead stage, the urgency index (UI) of each EV connected to the grid is calculated based on its stored energy, and the charging mode is determined through this UI. The EV layer fully considers the benefits of participating in energy interactions, aiming to maximize the comprehensive satisfaction of car owners’ cost expenditure and travel. Based on the optimized EV charging and discharging plan, the VPP layer aims to minimize the fluctuation of power interaction with the main grid and the comprehensive operation cost, using a multi-objective particle swarm optimization algorithm to determine the scheduling arrangements of various distributed energy resources. In the intraday stage, taking the optimization results from the day-ahead stage as a reference, a Stackelberg game model with the DNO as the leader and multiple VPPs as followers is established to balance the interests of the DNO and the VPPs. Rolling optimization is carried out based on this model. In the simulation examples, the effectiveness of the proposed model is verified. The results show that the model can meet the different needs of multiple stakeholders.
In brief, the main contributions of this study are as follows:
(1)
A two-layer, two-stage multi-objective optimization scheduling model based on Stackelberg game theory has been proposed.
(2)
Based on the UI of each EV, the corresponding charging mode is selected, and the optimization is carried out with comprehensive satisfaction, better meeting EV users’ needs and increasing their enthusiasm for participating in VPP scheduling.
(3)
Based on the day-ahead stage, a Stackelberg game equilibrium algorithm based on a Kriging metamodel is proposed; this algorithm not only achieves the purpose of protecting the privacy of the VPP but also meets the different needs of multiple stakeholders.
The structure of this paper is as follows: Section 2 introduces the structure of the VPPs and the DNO, Section 3 discusses the day-ahead two-layer scheduling model, Section 4 discusses the intraday Stackelberg game scheduling model, Section 5 is a case analysis, and Section 6 is a summary of the paper.

2. VPP Multi-Time-Scale Optimization Scheduling Framework

This paper considers that the aggregation units of a VPP include gas turbines (GTs), wind turbines (WTs), photovoltaic (PV) units, energy storage systems (ESSs), EVs, and residential loads, all of which are uniformly controlled and managed by an Energy Management System (EMS). Based on forecasts of electricity prices, wind generation, and PV generation, and in accordance with the rules of the electricity market, the EMS formulates corresponding strategies to control the output of GTs, the charging and discharging of EVs, the charging and discharging of ESSs, DR behaviors, and bidding in the electricity market. This approach aims to minimize the operational costs of the VPP [24,25].
In the day-ahead stage, at the EV layer, the EMS collects the grid connection time, disconnection time, and driving distance of EVs and selects different charging modes according to the UIs of the EVs. EV users determine the charging and discharging plan with the goal of maximizing comprehensive user satisfaction based on electricity prices and pass it on to the VPP layer. The VPP layer, based on the optimized EV charging and discharging plan, aims to minimize the VPP operation cost and interaction power to determine the scheduling arrangements of various flexible resources in each period of the day-ahead stage, in order to enhance the system’s ability to cope with uncertainty. The specific structure is shown in Figure 1.
During the intraday stage, the DNO sets the purchase and sale prices of electricity. VPPs with surplus electricity will sell the excess amount to the DNO according to the electricity price, while VPPs lacking electricity will purchase the required amount from the DNO at the purchase price to make up for the shortfall. The DNO, based on the interaction of VPP electricity, will trade with the electricity market at the grid connection price and the grid electricity price, using the price difference between the two to gain profits. To balance the interests of the DNO and the VPPs, a Stackelberg game model with the DNO as the leader and the VPPs as the followers is established, aiming for maximum revenue for the DNO and minimum operating costs for the VPPs. The model is then solved to achieve the optimal results for both parties under an equilibrium solution. The trading mechanism is shown in Figure 2.

3. The Day-Ahead Optimization Model for Virtual Power Plants

3.1. EV Layer

EVs select appropriate charging modes based on their UIs. When the fast-charging mode is chosen, EV users only consider charging, and they disconnect from the grid when the predetermined departure time or desired battery level is reached. When the slow-charging mode is selected, EV users charge and discharge according to their preferences; while meeting their own driving needs, they maximize their own benefits through discharging. Due to the different requirements of the two charging modes, in this paper, users who choose the fast-charging mode do not participate in intraday scheduling and are charged based on the day-ahead market optimization results to maximize driving satisfaction [26,27,28].

3.1.1. Charging Mode Selection

In the charging and discharging mode of home-based EVs, EV owners start charging when they return home from work and stop charging when they are ready to leave for work. According to a large quantity of statistical data, the probability density function of the start and end times for EV charging and discharging follows a normal distribution, as shown in Equations (1) and (2) for the arrival time and departure time of EVs, respectively.
f ( t c ) = 1 2 π σ c exp ( t c + 24 μ c ) 2 2 σ c 2 , 0 < t c μ c 12 1 2 π σ c exp ( t c μ c ) 2 2 σ c 2 , μ c 12 < t c 24
f ( t d i s ) = 1 2 π σ d i s exp ( t d i s μ d i s ) 2 2 σ 2 , 0 < t d i s μ + 12 1 2 π σ d i s exp ( t d i s 24 μ d i s ) 2 2 σ d i s 2 , μ d i s + 12 < t d i s 24
Using the Monte Carlo sampling method, an EV charging and discharging model can be established from Equations (1) and (2), where μ c = 18, σ c = 3, μ d i s = 8, and σ d i s = 3.2. From Figure 3, it can be seen that home-based EVs connected to the VPP during the 16–19 h period leave the VPP during the 7–9 h period.
In the proposed electric vehicle charging scheduling model, all electric vehicles are scheduled based on their charging needs. In this section, an indicator is defined to reflect the urgency of electric vehicle charging demands, and the charging mode is selected based on the UI.
t i r e m = t d i s t c
t i r e m represents the remaining time periods during which the i-th EV can continue to be connected to the VPP, and charging actions and charging scheduling strategies are arranged within these remaining time periods.
The UI is defined as follows:
U I i = ( t i r e m · Δ T ) P i , t s l o w , c · η i s l o w , c ( S i E V , min S i E V , c o n ) E i E V
P i , t c = P i , t s l o w , c , if U I 0 P i , t f a s t , c , if U I < 0
When U I i < 0 , it indicates that the charging demand of the i-th EV is urgent, and the fast-charging mode is selected. At this time, the EV charges only to meet its own charging needs, considering only travel satisfaction as its objective function. When U I i 0 , it indicates that the charging demand of the i-th EV is not urgent, and the slow-charging mode is selected. The EV can charge and discharge according to the scheduling of the VPP while meeting its own charging needs and optimizing its objective function based on comprehensive satisfaction.

3.1.2. Objective Function

Taking into account the economic benefits and travel satisfaction of EV users, the optimization is aimed at the comprehensive satisfaction of users.
max θ i = 1 N i i = 1 N i ( α 1 θ i , 1 + α 2 θ i , 2 )
(1)
The cost satisfaction of the i-th EV
θ i , 1 = 1 t = 1 T C t E V C i min C i max C i min
Equation (8) represents the charging and discharging costs as well as the battery degradation costs for EV users.
C t E V = P i , t c · λ t b u y + P i , t s l o w , d · λ t s e l l + C c h a n g e E max P i , t c + P i , t s l o w , d
(2)
The travel satisfaction of the i-th EV
θ i , 2 = 1 t = 1 T P i , t m , max P i , t c + P i , t s l o w , d t = 1 T P i , t m , max P i , t m , min
When the vehicle owner charges indiscriminately for convenience of travel, the owner’s travel satisfaction is maximized, that is, θ i , 2 = 1 . When the vehicle owner charges or discharges without considering travel convenience in pursuit of minimizing their own cost expenditure, that individual’s travel satisfaction is minimized, that is, θ i , 2 = 0 .

3.1.3. Constraints

(1)
The constraints for the fast-charging mode are as follows:
u i , t c = 1 , t = t i c t i e n d 0 , o t h e r s
t i e n d = min t i d , S i E V , max S i E V , c o n E i E V P i , t f a s t , c · η i f a s t , c · Δ T + t i c
0 P i , t f a s t , c P i , t f a s t , c , max · u i , t c
S i , t E V , f a s t E i E V = S i , t 1 E V , f a s t E i E V + P i , t f a s t , c · η i f a s t , c E i d i t r
Equation (11) represents that electric vehicles choosing the fast charging mode reach the required stored energy or the departure time during the charging period.
(2)
The constraints for the slow-charging mode are as follows:
S i E V , min S i , t E V , s l o w S i E V , max
0 P i , t s l o w , c P i , t s l o w , c , max u i , t s l o w , c
0 P i , t s l o w , d P i , t s l o w , d , max u i , t s l o w , d
u i , t s l o w , c + u i , t s l o w , d u i , t I
S i , t E V , s l o w E i E V = S i , t 1 E V , s l o w E i E V + P i , t s l o w , c · η i s l o w , c P i , t s l o w , d η i s l o w , d E i d i t r
Equation (17) indicates that the EV cannot charge and discharge simultaneously.

3.2. VPP Layer

3.2.1. Objective Function

To minimize the impact on the main grid and achieve economic operation, the optimization goal is to minimize the VPP’s own operating costs and the fluctuation of the interaction power with the DNO [29,30,31,32,33].
(1)
Minimum VPP Operating Cost
The objective function consists of four parts, representing the transaction costs with the DNO costs C t m , the gas turbine costs C t g t , the energy storage charging and discharging costs C t c , and the demand response costs C t D R .
min C j v p p = t = 1 T ( C t g t + C t c + C t m + C t D R )
C t g t = s N s k s u s , t o + a g s , t + b + λ s s u s , t s + λ s d u s , t d
C t c = g t sec λ t b u y g t se d λ t s e l l
The DR cost is the compensation paid by the VPP to users for load interruption. Considering the different impact levels of various load interruption amounts on users, the compensation price is linked to the load interruption level; the higher the interruption level, the higher the compensation price.
C t D R = m = 1 N m λ m i l L m , t i l
C t m = P t b u y λ t b u y S t se l l λ t s e l l
(2)
Minimization of Interactive Power
min C grid = 1 T 1 t = 1 T ( P t b u y + S t s e l l ) P g r i d a v
P g r i d a v = 1 T t = 1 T ( P t b u y + S t s e l l )

3.2.2. Constraints

(1)
Gas Turbine Constraints
u i , t o u i , t 1 o u i , t s
u i , t 1 o u i , t o u i , t d
g i min u i , t o g i , t g i max u i , t o
r i d g i , t g i , t 1 r i u
Equations (26) and (27) are the start–stop time constraints for the gas turbine.
(2)
Energy Storage Constraints
S min S t S max
0 g t sec u t sec · g sec max
0 g t se d u t se d · g se d max
u t sec + u t se d 1
(3)
Demand Response Constraints
0 L m , t i l L m , t i l , max
L t i l = m = 1 N m L m , t i l
L t 1 i l + L t i l L c , max
t = 1 T L t i s = t = 1 T L t s
0 L t i s L t i s , max
Equation (36) prevents the decline in user comfort caused by maintaining a high utilization rate of interruptible loads; Equation (37) ensures that the transferable load meets the required electricity consumption on the trading day.
(4)
Interactive Power Constraints
0 P j , t V P P , b u y G · u t G
0 P j , t V P P , s e l l G · ( 1 u t G )
P j , t V P P , b u y , P j , t V P P , s e l l 0
p j , t V P P = P j , t V P P , b u y P j , t V P P , s e l l
(5)
Power Balance Constraints
w = 1 N w g w , t w + v = 1 N v g v , t l + s = 1 N s g s , t + i = 1 N i P i , t s l o w , d + P j , t V P P , b u y + g t se d = L t + i = 1 N i P i , t f a s t , c + i = 1 N i P i , t s l o w , c + P j , t V P P , se l l + g t se c
L t = L t f i x + m = 1 N m L m , t i l , max L t i l + L t i s

4. Intraday Optimization Model for Virtual Power Plants

4.1. Leader (DNO) Dynamic Pricing Utility Model

The DNO sets the electricity purchase price λ t D I , b u y and electricity sale price λ t D I , s e l l for the VPP at various times, with the optimization goal of maximizing its own revenue.

Charging Mode Selection

max C D N O = t = 1 T λ t w , s e l l P t D N O , s λ t w , b u y P t D N O , b + j N j λ t D I , s e l l P j , t V P P , s e l l λ t D I , b u y P j , t V P P , b u y
To ensure the balance of supply and demand relationships between VPPs, the following constraints are established:
P t D N O = j = 1 N j P j , t V P P , b u y P j , t V P P , s e l l
P t D N O is the total electrical energy that the operator trades with the electricity market after consolidating the purchase and sales volumes of various VPPs. When P t D N O > 0 , it means that electricity is being purchased from the market; when P t D N O < 0 , it indicates that electricity is being sold to the market.
To prevent problem degradation and avoid direct transactions between VPPs and the power grid, it should be ensured that the electricity prices set by the DNO meet the following constraints:
λ t w , s e l l λ t D I , s e l l λ t D I , b u y λ t w , b u y
In Equation (47), the DNO sets the VPP electricity purchase price lower than the grid electricity price—and the electricity sale price higher than the grid connection price—to ensure that each VPP, in order to minimize its own operating costs, will choose to transact with the DNO.

4.2. The Utility Model for Energy Scheduling of the Follower VPPs

Each VPP optimizes its output plan for each period according to the electricity prices set by the DNO in order to minimize its own operating costs.

4.2.1. VPP Utility Function

min C j V P P = t = 1 T ( C t g t + C t c + C t E V + C t m + C t D R )

4.2.2. Constraints

The VPP constraints are given by Equations (14)–(18) and (26)–(44).

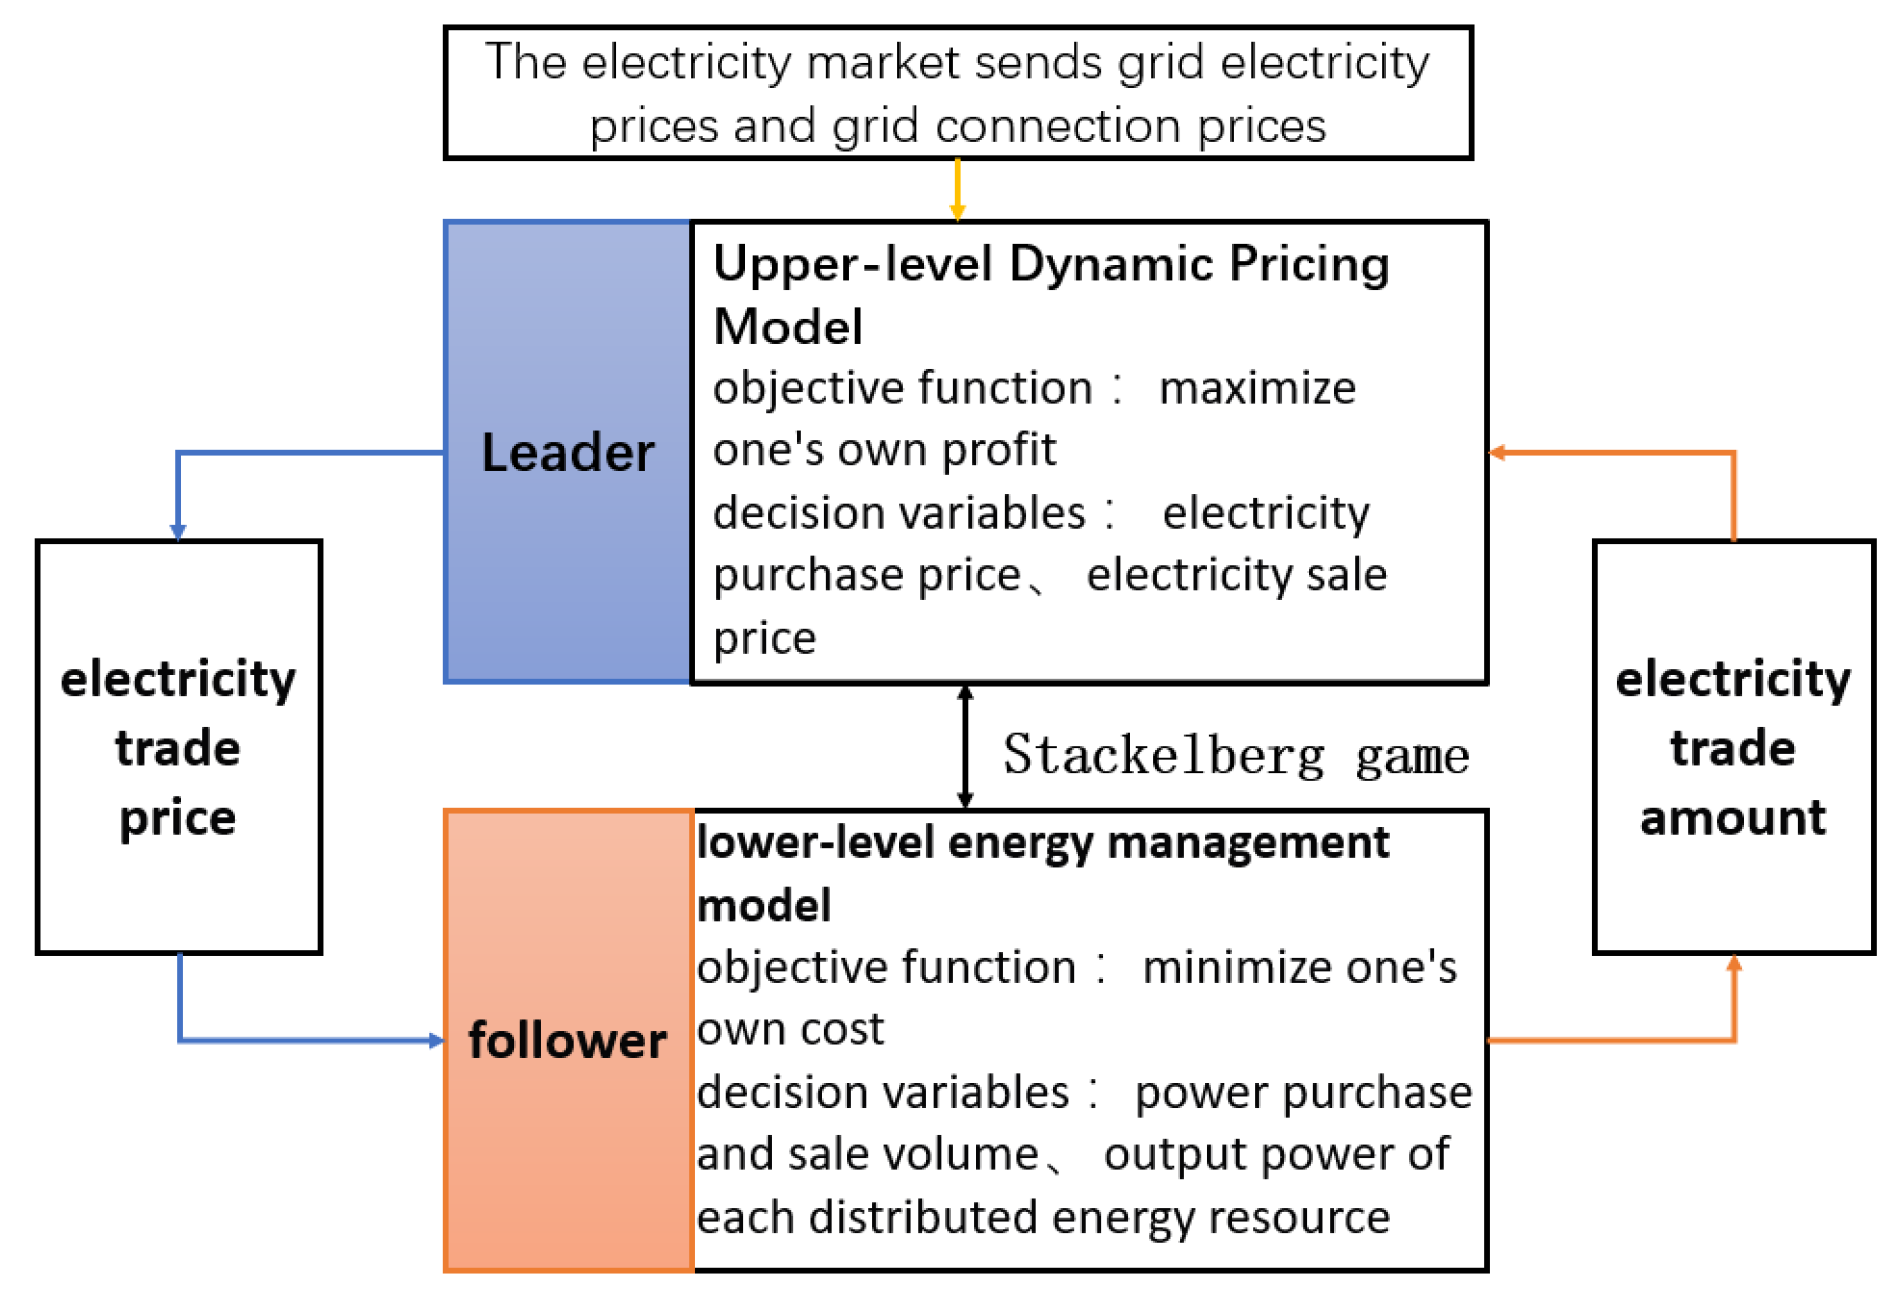
4.3. Stackelberg Game Model

The Stackelberg game model proposed in this paper takes the DNO as the leader and the VPP cluster as the follower, each optimizing its decisions based on its respective utility function (Equations (45) and (48)). In the game, the leader sets the electricity price strategy and communicates it to the follower, who then makes charging and discharging plans based on this strategy. Both parties continuously optimize and iterate until a Nash equilibrium is reached [34,35,36]. The Stackelberg game is executed at every time slot. The structure of the game model described in this paper is shown in Figure 4.
This Stackelberg game can be described as follows:
Ω = D N O V P P X D N O λ t D I , b u y , λ t D I , s e l l , X V P P P j , t V P P , s e l l , P j , t V P P , b u y C D N O , C j V P P
In Equation (49), the DNO and the VPP are the two participants in the Stackelberg game; X D N O and X V P P are their respective strategy sets.
Both parties in the game independently optimize and iterate to reach a Nash equilibrium solution (denoted by *) that meets the needs of both parties, and all strategies comply with the aforementioned constraints. A proof of the existence of such an equilibrium is in Appendix A.
P D N O * = arg max C D N O P t D N O , s , P t D N O , b u y , λ t D I , b u y , * , λ t D I , s e l l , *
P V P P * = arg min C j V P P g w , t w , g v , t l , g s , t , P i , t s l o w , d , P i , t s l o w , c , P i , t f a s t , c , g t sec , g t se d , L t i l , L t i s , P j , t s e l l , * , P j , t b u y , *
The DNO constraints are given by Equations (46) and (47). The VPP constraints are given by Equations (14)–(18) and (26)–(44).
Equation (50) represents that the DNO earns more revenue by setting reasonable electricity prices. Equation (51) represents that a VPP trades with the DNO based on the electricity prices set by the DNO.

5. Case Study Discussion

5.1. Model Parameters

To verify the aforementioned models, this paper constructs a test system consisting of three VPPs, each VPP including a gas turbine, an energy storage unit, a wind turbine, a photovoltaic unit, demand response, and 1000 EVs. The parameters of each distributed energy resource can be found in Appendix A. The interruptible load is divided into three levels, with compensation prices for each level set at 100/MWh, 150/MWh, and 200/MWh, respectively. The first level of interruptible load is set at 15% of the total load, the second level at 10%, and the third level at 8%. It is assumed that each VPP has 1000 EVs. The upper and lower limits of EV battery capacity are set at 95% and 15% of the battery capacity, respectively. The fast charging power is 30% of the battery capacity, while the slow-charging and slow-discharging power is 20% of the battery capacity, with charging and discharging efficiency both at 90%.
For the day-ahead stage, the model constructed in this paper is classified as a MILP model, which has clear mathematical logic and strong convergence. The optimal solution can be obtained through exact mathematical algorithms. Therefore, this paper uses MATLAB R2023a to call the CPLEX solver in the YALMIP R20230622 toolbox for solving. For the intraday stage, a dynamic Kriging metamodel equilibrium solving algorithm combined with a particle swarm algorithm is used for solving. The specific solving process can be found in reference [37]. The whole optimization framework for VPPs is summarized in Figure 5.

5.2. Results and Analysis

5.2.1. Day-Ahead Optimization Results of the Electric Vehicle Layer

To verify the effectiveness of the day-ahead electric vehicle layer model, the EV situation in VPP1 is used for validation, and the following three strategies’ scheduling results are compared:
Strategy EV1: Electric vehicles charge in a disorderly manner, according to the users’ own intentions.
Strategy EV2: Solutions are optimized to maximize the driving satisfaction of EV users, achieving orderly charging and discharging of EVs.
Strategy EV3: EVs first select a charging mode based on the UI and then carry out orderly charging and discharging with the goal of maximizing comprehensive satisfaction.
As shown in Figure 6, the charging time of electric vehicles is mainly concentrated in the periods from 2:00 to 8:00 and 18:00 to 24:00, which corresponds to when users connect to the distribution network upon returning home from work and then leave in the morning to go to work. In Strategy EV1, users start charging when they return home from work and charge in a disorderly manner according to their own wishes, leading to increased energy supply pressure on the VPP. In Strategy EV2, electric vehicles are charged only with the goal of driving satisfaction; accordingly, car owners choose to charge during periods with low electricity prices within the connection period, and they stop charging after meeting their own operational needs, resulting in a load curve similar to the original load. Strategy EV3 meets the EV users’ pursuit of economic compensation and comfort. EV users discharge when the electricity prices are high and charge when the prices are low to gain more benefits, effectively achieving “peak clipping and valley filling”.
As shown in Figure 7, in Strategy EV2, EVs charge to the desired stored energy level based on electricity prices and no longer participate in scheduling. In Strategy EV3, discharging EVs will cause some battery degradation, and EV owners will only participate in the VPP’s optimized scheduling when the economic subsidy exceeds the battery degradation cost.
Table 1 shows a comparison of data after scheduling with three strategies. The orderly charging behavior of EVs can effectively alleviate the power supply pressure on the system during peak times. Among the strategies, Strategy EV3 plays an important role in reducing the peak-to-valley difference and can reduce user expenses to a certain extent. At the same time, as the optimization goals become more comprehensive, Strategy EV3 results in higher user satisfaction than Strategy EV2.

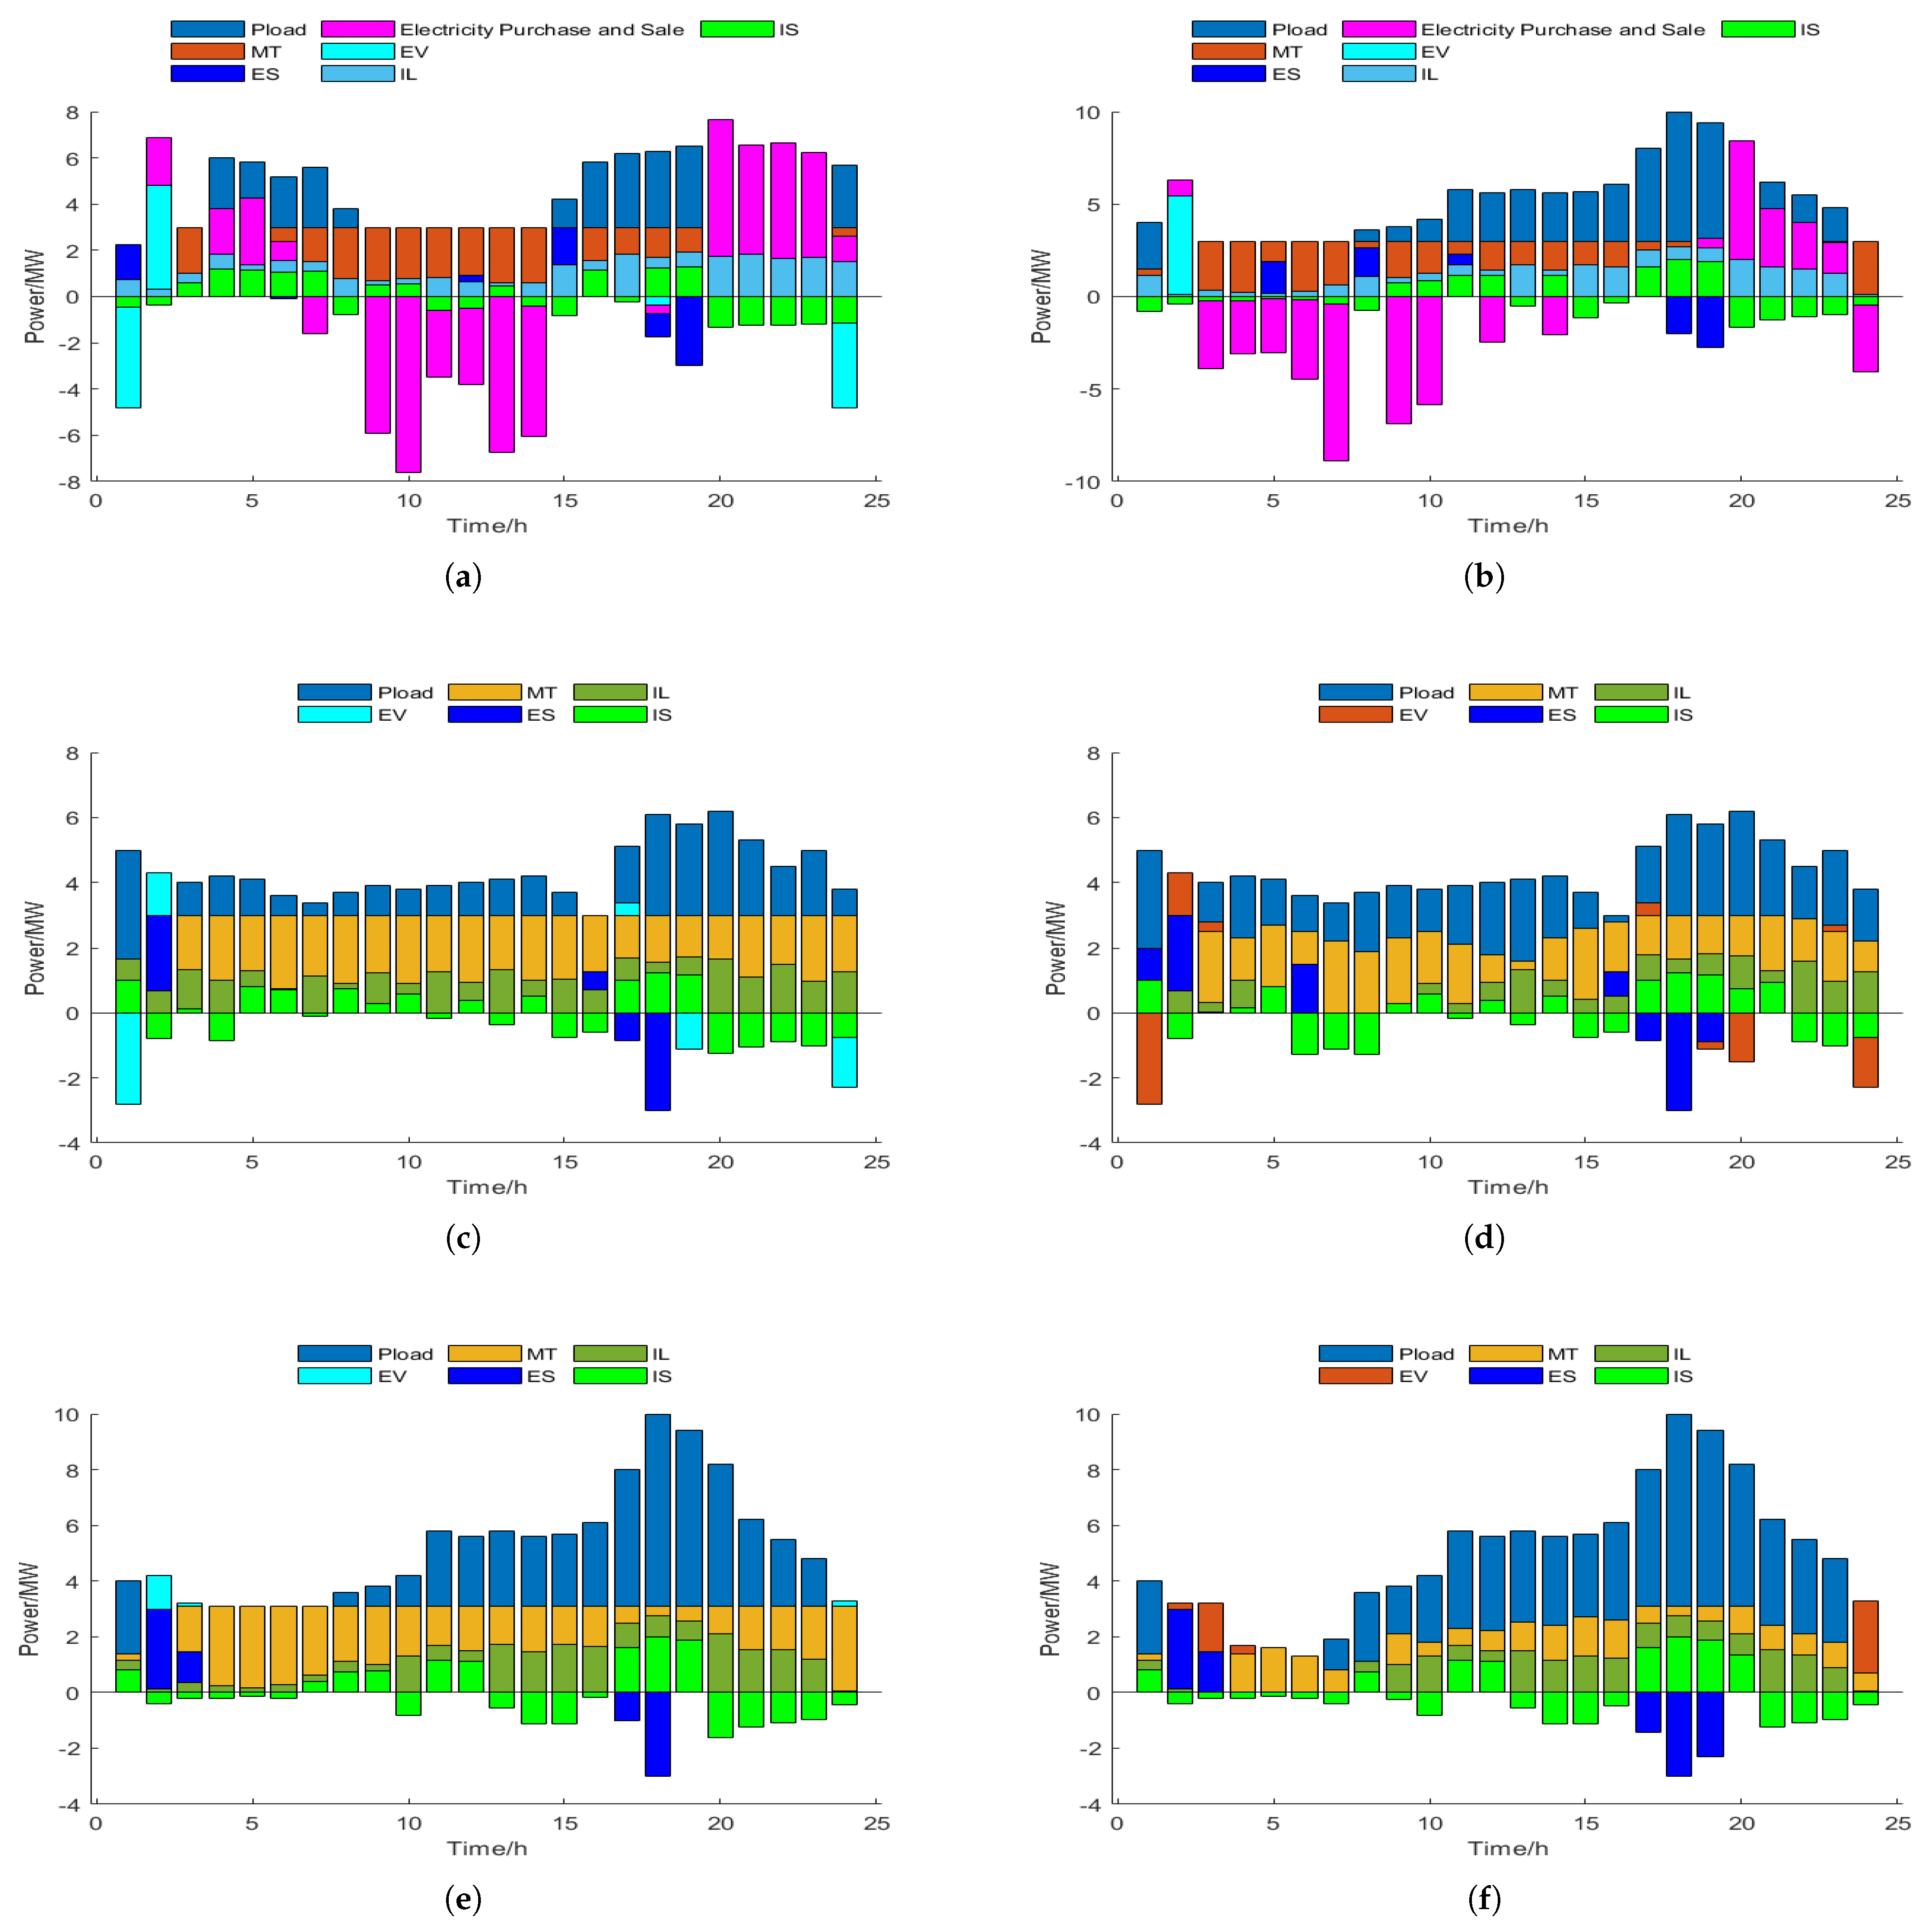
5.2.2. Day-Ahead VPP Layer Optimization Results

The optimal EV charging and discharging power obtained from the optimization in Strategy EV3 is passed to the VPP layer, and together with the basic load, photovoltaic output, and wind power output in the VPP layer, it forms the net load. Based on this net load, the VPP dispatches the internal controllable distributed power sources, uses the particle swarm algorithm to solve the dual-objective function, and sets different day-ahead optimization scheduling plans for comparison.
Strategy VPP4: This optimization scheduling model only considers the minimization of VPP cost.
Strategy VPP5: This optimization scheduling model only considers the minimization of VPP interaction power.
Strategy VPP6: A multi-objective particle swarm algorithm is used to solve the day-ahead multi-objective optimization model of the VPP.
Figure 8 and Figure 9 indicate that the period from 4:00 to 8:00 is a peak time for basic load energy consumption, a period when gas turbines and energy storage play a significant role in energy supply. Additionally, the VPP interrupts some interruptible loads without affecting user comfort. At the same time, transferable loads are shifted from periods with high electricity prices to periods with low electricity prices, saving on the VPP’s operating costs. From 9:00 to 15:00, photovoltaic power generation is at its peak, and with the help of interruptible and transferable loads, the VPP can discharge during high electricity price periods to generate revenue. From 18:00 to 22:00, although it is also a peak period for electricity consumption, wind power output and photovoltaic output are abundant. After optimization at the electric vehicle layer, the load side can better absorb the output of new energy sources. The VPP will purchase electricity at low prices to meet energy demands.

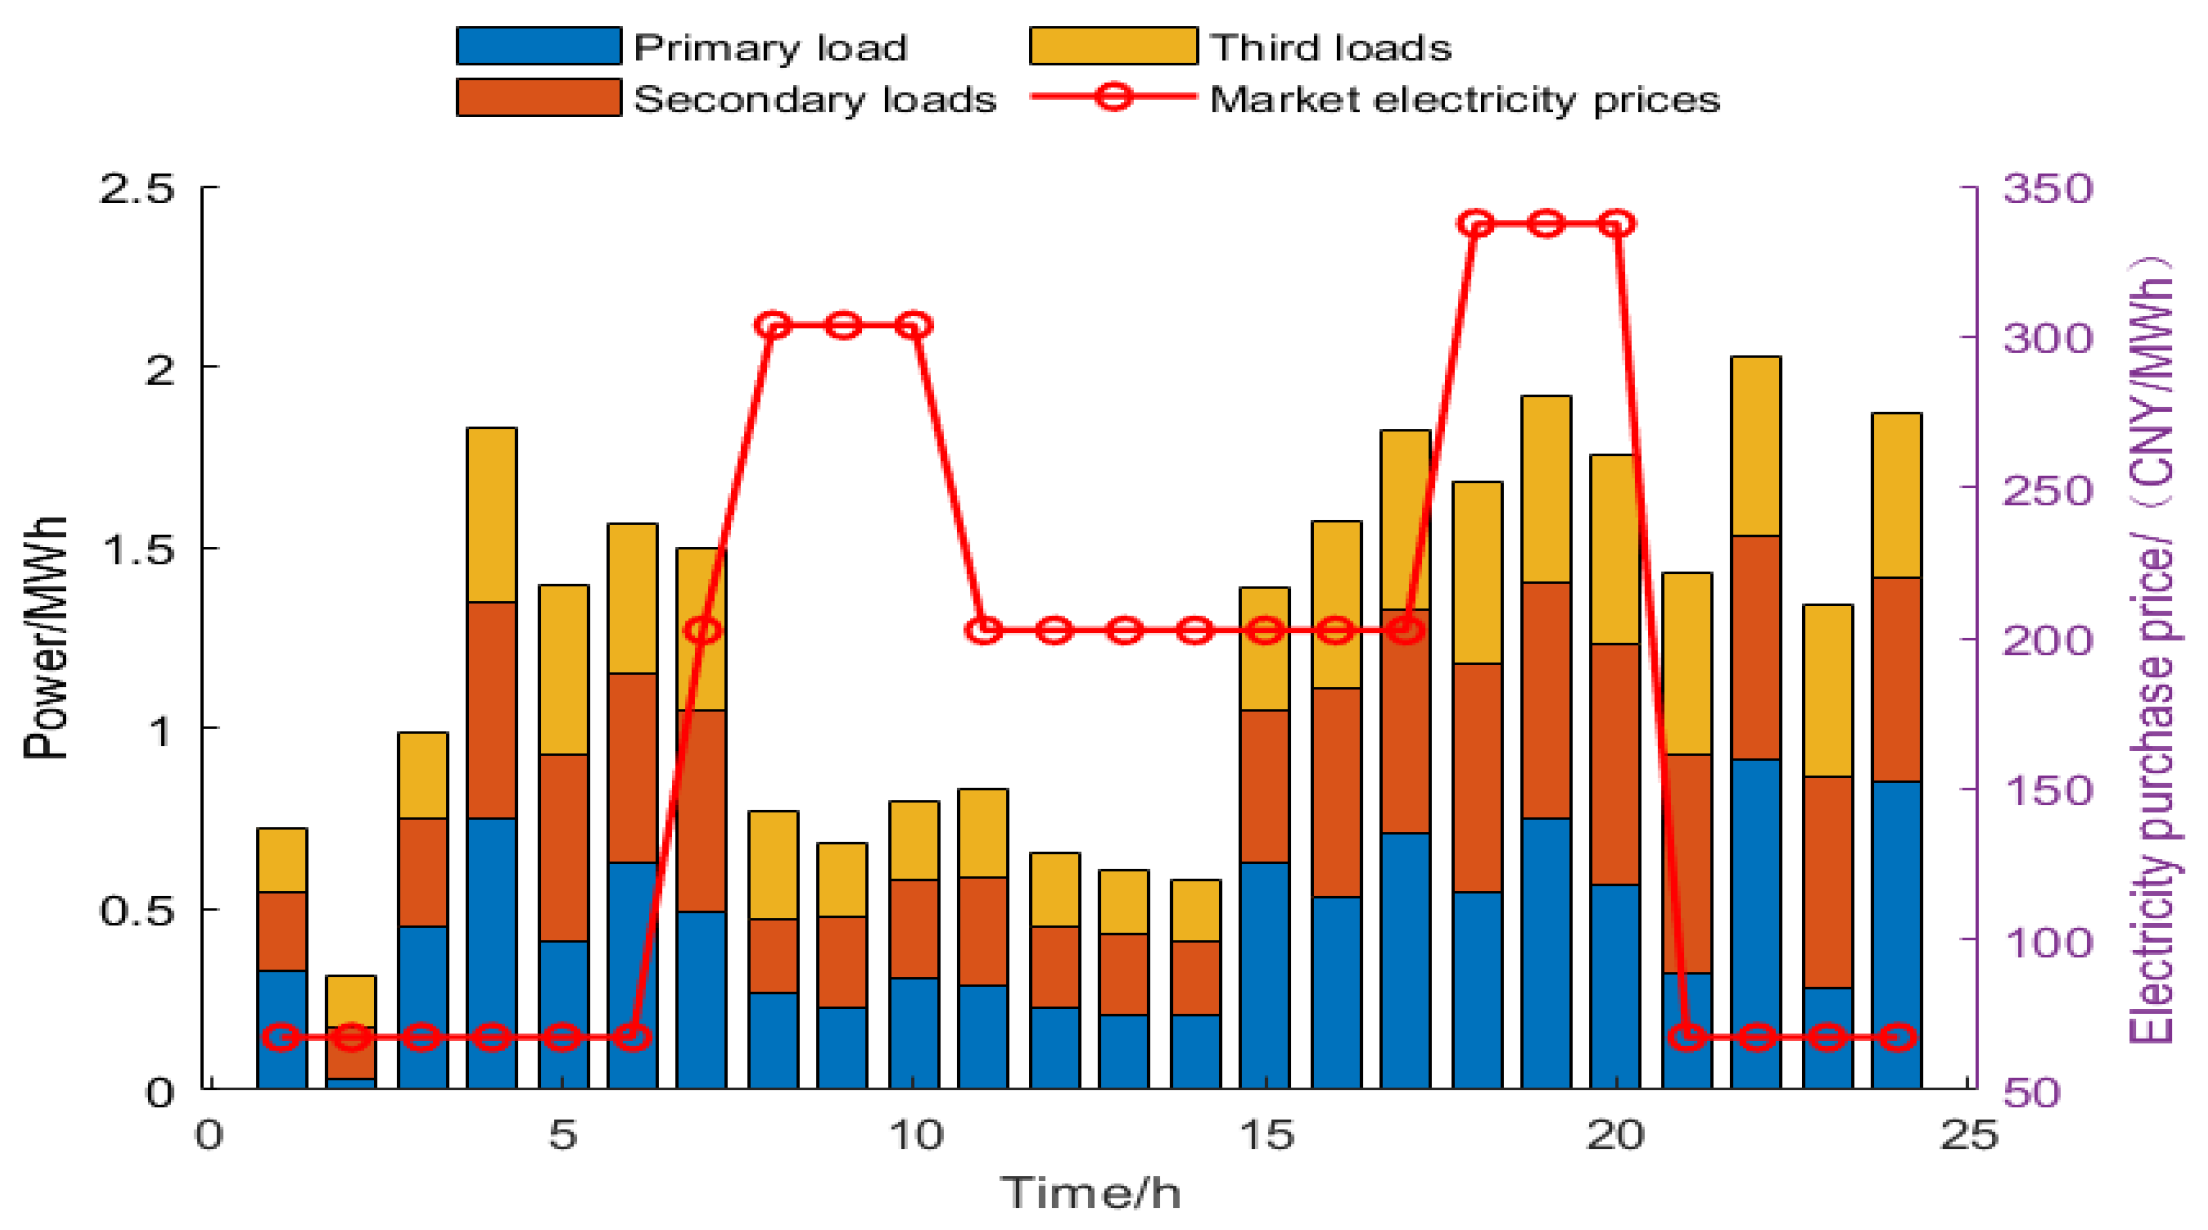
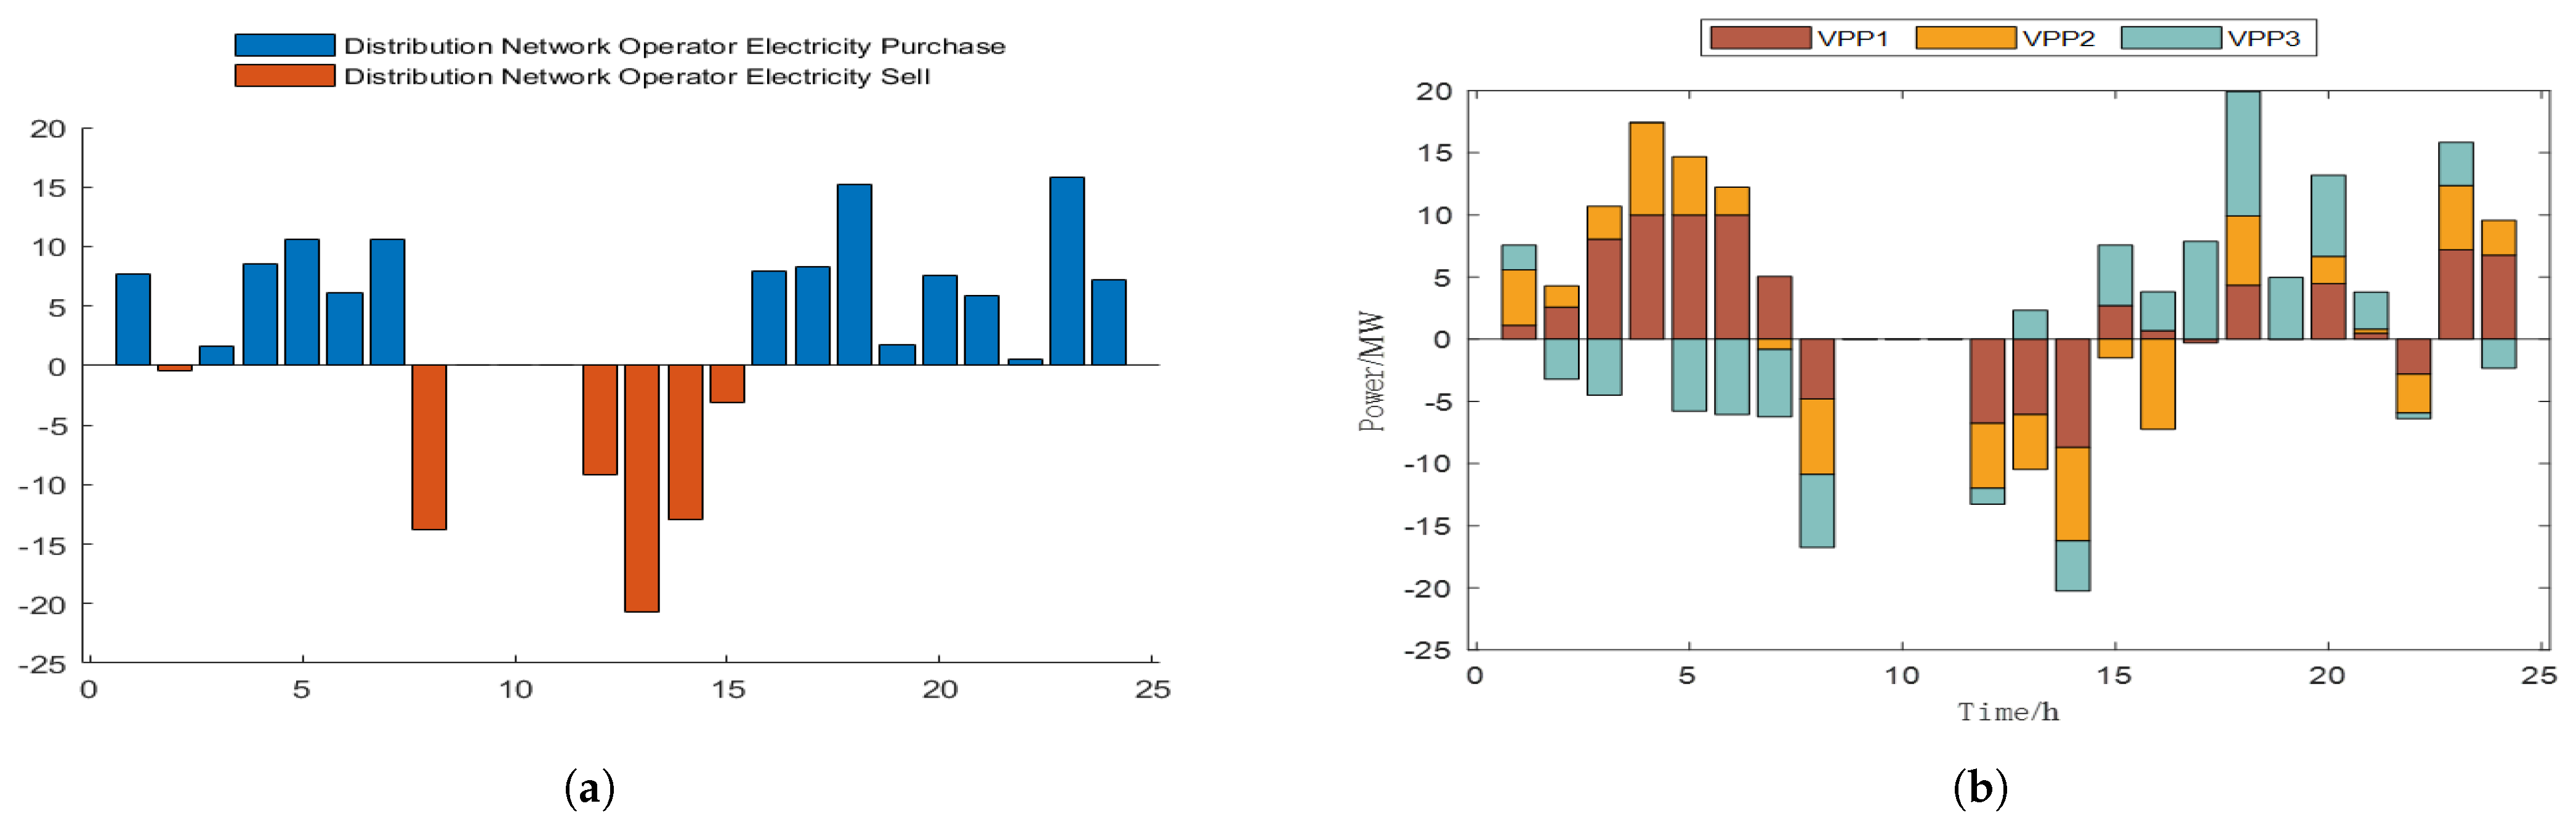
5.2.3. Intraday Optimization Scheduling Results

Based on the intraday forecast curve of the VPP and the optimization results from Strategy VPP6, the following two operational strategies were selected to verify the effectiveness of the multi-VPP Stackelberg game model proposed in this paper:
Framework 1: The DNO does not participate in the optimization scheduling, and the VPPs directly transact with the power grid. Each VPP engages in non-cooperative game theory to optimize their actions for minimum operating costs.
Framework 2: The DNO optimizes electricity pricing and employs the Stackelberg game model proposed in this paper.
The electricity purchase and sale prices set by the operator are shown in Figure 10. Figure 11 illustrates the electricity transaction quantities between the DNO and the electricity market. Figure 11 shows the transaction situation between each VPP and the DNO. Figure 12 represents the electricity transaction quantities of each VPP directly with the electricity market. In Figure 11, each VPP has three states: if the transaction quantity is greater than 0, it indicates that the VPP is purchasing electricity from the DNO; if the transaction quantity is less than 0, it indicates that the VPP is selling electricity to the DNO; if the transaction quantity is equal to 0, it means that the VPP’s internal supply and demand are balanced. At this point, if the DNO changes the electricity price, it may cause the VPP to increase its purchase or sale of electricity.
Figure 11 and Figure 12 indicate that compared to Framework 1, in Framework 2, the DNO increases the shared electricity volume among VPPs and the moments of sharing by adjusting electricity prices, thereby reducing the transaction volume with the power market and increasing the operator’s revenue.
During the period from 9:00 to 11:00, all VPPs have a supply greater than the demand, with no electricity sharing. To ensure revenue, the DNO should set the electricity sale price close to the grid connection price for these periods. Similarly, from 15:00 to 24:00, all VPPs purchase electricity from the DNO, which should set the purchase price close to the grid price to ensure its own economic benefits.
Between 1:00 and 8:00, there are VPPs in various states, overall showing a supply shortage. The DNO needs to purchase a small amount of electricity from the power market to meet the electricity demands of each VPP. At this time, the sale price should be increased to encourage VPPs with excess electricity to sell more. Between 4:00 and 7:00, VPP1 has insufficient electricity. Due to the lower electricity prices in Framework 2, VPP1’s electricity purchases have also increased compared to Framework 1. Between 12:00 and 15:00, VPP1 transitions from a balance of electricity to a surplus, thereby increasing the sharing of electricity with other VPPs. By purchasing electricity during low-price periods and selling during high-price periods, each VPP can not only meet its own energy needs but also gain more revenue.
During the period from 16:00 to 24:00, there are VPPs in various states, but overall, there is a supply shortage. The DNO needs to purchase electricity from the power market to meet the power demand of the VPPs. At this time, the DNO can guide the VPPs with surplus electricity and the self-balanced VPPs to sell more electricity by raising the electricity selling price to meet the demand of the electricity-deficient VPPs. During the period from 19:00 to 22:00, in response to the selling price, the status of each VPP changes from self-balance or an electricity deficiency to an electricity surplus, increasing the amount of electricity sold. Moreover, the overall status of the VPPs changes from buying electricity to selling electricity. During the period within the 23:00 h, on the basis of raising the selling price, the DNO further reduces the purchase price, which increases the volumes of purchased electricity for VPP1 and VPP2 and increases the volume of electricity shared among VPPs.
In summary, the DNO sets electricity prices based on the operating status of the VPPs to increase the sharing of electricity among VPPs and reduce the volume of transactions with the electricity market, which can effectively alleviate the pressure on the electricity market. The VPPs purchase and sell electricity according to the electricity prices set by the DNO to meet their own needs and reduce their operating costs.
Taking VPP1 as an example, the output of various distributed energy resources within the VPP under two strategies was analyzed, as shown in Figure 13. Compared with Framework 1, during the periods of 1:00–7:00 and 15:00–18:00, the electricity purchase price in Framework 2 is lower, allowing the VPP to meet its own demand by purchasing electricity from the outside, and the output of the gas turbine is correspondingly reduced. The charging power of the energy storage systems increases, and a large number of home-based EVs are connected at this time, with their owners choosing to charge them during periods with low electricity prices to save on their own charging costs. During the periods of 12:00–14:00 and 19:00–22:00, the higher electricity selling price leads to an increase in the output power of the gas turbine, and both energy storage systems and EVs discharge to gain revenue. Through the joint action of interruptible and transferable loads, the VPP can sell more electricity during periods with high electricity prices, thus obtaining more revenue. Each VPP adjusts the output of its internal distributed energy resources in response to the electricity trading prices set by the DNO, thereby minimizing its own costs.
The operating costs of the VPP under the two frameworks are shown in Table 2, with the unit being CNY 10,000. It can be seen that under Framework 2, the DNO effectively increased its own revenue by optimizing the internal transaction electricity prices, with the distribution network operator’s revenue being 15.3728 * CNY 10,000. Since the electricity purchase price set by the DNO is not higher than the grid electricity price and the electricity sale price is not lower than the grid connection price, the cost of the VPP has also decreased.
It can be seen that under Framework 1, which directly trades with the electricity market, there is no interaction between the VPPs, and the costs are increased significantly compared to Framework 2. The strategy proposed in this paper allows each VPP to trade electricity based on the purchase and sale prices set by the DNO. After meeting their own energy needs, the VPPs can increase their revenue by selling electricity. The DNO earns profits from the price difference, and all parties achieve satisfactory results.

6. Conclusions

Based on the VPP optimization scheduling model with electric vehicle participation, a UI is proposed to categorize electric vehicles. In the day-ahead stage, a hierarchical optimization is proposed according to different stakeholders’ interests. The EV layer considers the comprehensive satisfaction of car owners and optimizes the charging and discharging plan of EVs. The VPP layer adjusts the output of controllable distributed energy resources to reduce the comprehensive cost and interaction fluctuation of the VPP, aiming for a win–win situation. In the intraday stage, a Stackelberg game model is established between the DNO and each VPP to study the energy management methods of multiple VPPs. Through case analysis, the following conclusions are drawn:
(1)
The proposed comprehensive satisfaction model makes the charging and discharging of EVs more rational, effectively reducing the peak-to-valley difference of the load curve.
(2)
In the day-ahead scheduling stage, both the economic aspect of the VPPs and the demand for interactive power are considered, which can reduce the interaction with the distribution network and further reduce the operating cost of the VPPs while ensuring economical and low-carbon operation.
(3)
In the established Stackelberg game model, the DNO maximizes its own interests by optimizing the purchase and sale electricity prices to promote electricity sharing between VPPs. Each VPP aims to minimize operating costs, and the optimized transaction electricity will affect the operator’s electricity price setting. The operator can guide the VPP to reasonably purchase and sell electricity through dynamic pricing, and there is a game of interests between the two.
(4)
The two-stage, two-layer optimization scheduling model proposed in this paper optimizes multi-objective day-ahead scheduling to determine the output of each distributed energy resource. In the intraday scheduling stage, taking the day-ahead scheduling results as a reference, the model further optimizes the electricity prices and the output of distributed energy resources, thereby effectively achieving a win–win situation.

Author Contributions

In this article, J.T. was responsible for software, writing (original draft), data management, and methodology; X.L. was responsible for funding acquisition, investigation, data management, formal analysis, supervision, and writing (review and editing). All authors have read and agreed to the published version of the manuscript.

Funding

This work is supported by the Yunnan Fundamental Research Projects (202401CF070073) and the Yunnan Provincial Department of Education Science Research Fund Project (2024J0540).

Data Availability Statement

The original contributions presented in the study are included in the article; further inquiries can be directed to the corresponding author.

Conflicts of Interest

The study was conducted without any commercial or financial relationship that could be construed as a potential conflict of interest.

Nomenclature

α 1 ,  α 2                              weight coefficients for θ i , 1 , θ i , 2
a, bcost coefficients
C i max , C i min maximum and minimum expense that EV owners can afford
C c h a n g e battery replacement cost
d i t r distance traveled by the EV during time period t
E i E V battery capacity of the EV
E i energy demand of the EV
E max maximum charging and discharging capacity of the EV
Gmaximum amount of electricity that the VPP can buy or sell in the DNO
g w , t w , g v , t s power output of the w-th wind turbine and v-th photovoltaic unit
g s , t output of the s-th gas turbine during time period t
g t sec charging amount of the energy storage system during time period t
g t se d discharging amount of the energy storage system during time period t
g s max , g s min maximum and minimum power outputs of the s-th gas turbine
g sec max , g se d max maximum charging and discharging rates of the energy storage system
k s fixed cost of the s-th gas turbine
L m , t i l amount of interrupted load at level m during time period t
L m , t i l , max upper limit of the load interruption amount for the m-th level
L t i l amount of load interrupted for the m-th level during time period t
L c , max maximum amount of load that can be interrupted
L t i s amount of shifted load after transfer during time period t
L t s amount of load that can be shifted during time period t
L t i s , max upper limit of the shifted load during time period t
L t , L t f i x total load and fixed load during time period t
N i ,   N s ,   N m ,   N w ,   N v numbers of EVs, GTs, interruption levels, wind turbines, and PV units
P i , t s l o w , c , P i , t f a s t , c slow-charging and fast-charging power of the EV
P i , t s l o w , d slow-discharging power of the EV
P i , t m , max , P i , t m , min maximum and minimum power of the EV for travel satisfaction
P i , t f a s t , c , max maximum fast-charging power of the i-th EV at time t
P i , t s l o w , c , m a x , P i , t s l o w , d , m a x maximum charging and discharging rates of the i-th EV
P t b u y , P t se l l amounts of electricity set by the VPP one day ahead for purchase and sale
P g r i d a v average transaction power during the dispatch cycle
P t D N O , b , P t D N O , s volumes of electricity purchased and sold by the DNO from/to the grid
P j , t V P P , b u y , P j , t V P P , s e l l volumes of electricity purchased and sold by the VPP from/to the DNO
r i u , r i d upward and downward ramp rates of the s-th gas turbine
S i E V , min , S i E V , max lower and upper bounds of the SOC at which the EV stops charging
S i E V , c o n state of the SOC of the i-th EV when it connects to the VPP
S i , t E V , f a s t , S i , t E V , s l o w amounts of energy stored by the i-th EV in fast- and slow-charging modes
S t energy stored at time t
S max , S min maximum and minimum values of energy storage
t c , t d i s arrival time and departure time of the EV
u i , t s l o w , c , u i , t s l o w , d binary variables indicating whether the EV is charging or discharging
u i , t I whether the i-th EV is connected to the grid during time period t
u s , t o , u s , t s , u s , t d GT is operating, starting, or stopping during time period t
u t sec , u t se d charging and discharging states of the energy storage at time t
u t G state of the VPP—buying or selling electricity
η i s l o w , c , η i f a s t , c slow- and fast-charging efficiency of the EV
η i s l o w , d slow-discharging efficiency of the EV
λ t b u y , λ t s e l l electricity purchase and sale prices set by the DNO in the day-ahead stage
λ t w , s e l l , λ t w , b u y grid-connected electricity price and grid electricity price
λ s s , λ s d start-up and shut-down costs of the gas turbine
λ m i l compensation price for the m-th level of interrupted load
λ t D I , b u y , λ t D I , s e l l electricity purchase and sale prices set for the VPP by the DNO

Appendix A

The proof of the existence of equilibrium solutions in a Stackelberg game mainly falls into the following three aspects: the strategy space of participants is a non-empty, compact, and convex set; given the upper-level strategy, the equilibrium solution of the lower-level non-cooperative game exists; given the lower-level strategy, the optimal solution to the upper-level optimization problem exists.
In the Stackelberg game model established in this paper, the strategy space of each participant is determined by linear constraints, which are obviously non-empty, compact, and convex sets. For the lower-level cooperative game, the utility function of the VPP consists of five parts, each of which is a linear function. Therefore, based on the transaction price, the utility function of the lower-level non-cooperative game is a quasi-convex function, and an equilibrium solution exists. The utility function of the upper-level participant is also a linear function, which is obviously a quasi-concave function, and its optimization problem has an optimal solution. In summary, the Stackelberg game model established in this paper has a Nash equilibrium solution.
Table A1. Gas turbine parameters.
SubjectVPP1VPP2VPP3
Maximum/Minimum Output Power3/1.33/1.53.1/1.2
Upward/Downward Ramp Rate Power1.5/1.51.5/1.51.4/1.4
Start/Stop Cost101010
Fixed Cost100150150
Figure A1. Wind and photovoltaic output of different VPPs per period: (a,b) is VPP1, (c,d) is VPP2, (e,f) is VPP3.
Energies 18 00896 g0a1
Table A2. EV parameters.
SubjectVPP1VPP2VPP3
Battery Replacement Cost19,380816011,900
Maximum Charging/Discharging Capacity1,000,000900,000700,000
Initial/Final Stored Energy8.42/10.754.68/5.685.58/25.22
Travel Period9/158/177/9
Driving Distance221120
Figure A2. (a,b) Day-ahead scheduling of different VPPs using strategy VPP6. (c,d) Intraday VPP2 in different scheduling frameworks. (e,f) Intraday VPP3 in different scheduling frameworks.
Energies 18 00896 g0a2

References

  1. Mnatsakanyan, A.; Kennedy, S.W. A novel demand response model with an application for a virtual power plant. IEEE Trans. Smart Grid 2014, 6, 230–237. [Google Scholar] [CrossRef]
  2. Zhou, Y.; Sun, G.; Huang, W.; Xu, Z.; Wei, Z.; Zhang, H.; Chu, Y. Strategic bidding model for virtual power plant in different electricity markets considering electric vehicles and demand response. Power Syst. Technol. 2017, 41, 1759–1767. [Google Scholar]
  3. Cao, W.; Yu, J.; Xu, M. Optimization Scheduling of Virtual Power Plants Considering Source-Load Coordinated Operation and Wind–Solar Uncertainty. Processes 2023, 12, 11. [Google Scholar] [CrossRef]
  4. Javad Kasaei, M.; Gandomkar, M.; Nikoukar, J. Optimal operational scheduling of renewable energy sources using teaching–learning based optimization algorithm by virtual power plant. J. Energy Resour. Technol. 2017, 139, 062003. [Google Scholar] [CrossRef]
  5. Liu, J.; Zhuge, C.; Tang, J.H.C.G.; Meng, M.; Zhang, J. A spatial agent-based joint model of electric vehicle and vehicle-to-grid adoption: A case of Beijing. Appl. Energy 2022, 310, 118581. [Google Scholar] [CrossRef]
  6. Das, R.; Wang, Y.; Busawon, K.; Putrus, G.; Neaimeh, M. Real-time multi-objective optimisation for electric vehicle charging management. J. Clean. Prod. 2021, 292, 126066. [Google Scholar] [CrossRef]
  7. Yao, E.; Liu, T.; Lu, T.; Yang, Y. Optimization of electric vehicle scheduling with multiple vehicle types in public transport. Sustain. Cities Soc. 2020, 52, 101862. [Google Scholar] [CrossRef]
  8. Tu, R.; Gai, Y.J.; Farooq, B.; Posen, D.; Hatzopoulou, M. Electric vehicle charging optimization to minimize marginal greenhouse gas emissions from power generation. Appl. Energy 2020, 277, 115517. [Google Scholar] [CrossRef]
  9. Sun, B. A multi-objective optimization model for fast electric vehicle charging stations with wind, PV power and energy storage. J. Clean. Prod. 2021, 288, 125564. [Google Scholar] [CrossRef]
  10. Rezaei, N.; Khazali, A.; Mazidi, M.; Ahmadi, A. Economic energy and reserve management of renewable-based microgrids in the presence of electric vehicle aggregators: A robust optimization approach. Energy 2020, 201, 117629. [Google Scholar] [CrossRef]
  11. Hu, J.; Zhou, H.; Li, Y. Real-time dispatching strategy for aggregated electric vehicles to smooth power fluctuation of photovoltaics. Power Syst. Technol. 2019, 43, 2552–2560. [Google Scholar]
  12. Correia, A.F.; Moura, P.; de Almeida, A.T. Technical and economic assessment of battery storage and vehicle-to-grid systems in building microgrids. Energies 2022, 15, 8905. [Google Scholar] [CrossRef]
  13. Chen, H.; Gao, L.; Zhang, Z. Multi-objective optimal scheduling of a microgrid with uncertainties of renewable power generation considering user satisfaction. Int. J. Electr. Power Energy Syst. 2021, 131, 107142. [Google Scholar] [CrossRef]
  14. Wang, X.; Sun, C.; Wang, R.; Wei, T. Two-stage optimal scheduling strategy for large-scale electric vehicles. IEEE Access 2020, 8, 13821–13832. [Google Scholar] [CrossRef]
  15. Tang, W.; Gao, F. Optimal operation of household microgrid day-ahead energy considering user satisfaction. High Volt. Eng. 2017, 43, 140–148. [Google Scholar]
  16. Li, T.; Jin, S.; Li, G.; Zhou, B.; Wang, Y.; Hu, S. Double-Layer Optimal Scheduling Strategy for Charging and Discharging of Electric Vehicles Considering Cluster Schedulability. In Proceedings of the 2022 First International Conference on Cyber-Energy Systems and Intelligent Energy (ICCSIE), Shenyang, China, 14–15 January 2023; IEEE: Piscataway, NJ, USA, 2023; pp. 1–6. [Google Scholar]
  17. Liu, C.; Zhang, H.; Shahidehpour, M.; Zhou, Q.; Ding, T. A two-layer model for microgrid real-time scheduling using approximate future cost function. IEEE Trans. Power Syst. 2021, 37, 1264–1273. [Google Scholar] [CrossRef]
  18. Pandey, A.K.; Jadoun, V.K.; Sabhahit, J.N. Real-time peak valley pricing based multi-objective optimal scheduling of a virtual power plant considering renewable resources. Energies 2022, 15, 5970. [Google Scholar] [CrossRef]
  19. Wang, Y.; Ai, X.; Tan, Z.; Yan, L.; Liu, S. Interactive dispatch modes and bidding strategy of multiple virtual power plants based on demand response and game theory. IEEE Trans. Smart Grid 2015, 7, 510–519. [Google Scholar] [CrossRef]
  20. Yin, S.; Ai, Q.; Li, Z.; Zhang, Y.; Lu, T. Energy management for aggregate prosumers in a virtual power plant: A robust Stackelberg game approach. Int. J. Electr. Power Energy Syst. 2020, 117, 105605. [Google Scholar] [CrossRef]
  21. Erol, Ö.; Filik, Ü.B. A Stackelberg game approach for energy sharing management of a microgrid providing flexibility to entities. Appl. Energy 2022, 316, 118944. [Google Scholar] [CrossRef]
  22. Fu, B.; Chen, M.; Fei, Z.; Wu, J.; Xu, X.; Gao, Z.; Wu, Z.; Yang, Y. Research on the stackelberg game method of building micro-grid with electric vehicles. J. Electr. Eng. Technol. 2021, 16, 1637–1649. [Google Scholar] [CrossRef]
  23. Cao, J.; Yang, D.; Dehghanian, P. Co-optimization of multiple virtual power plants considering electricity-heat-carbon trading: A Stackelberg game strategy. Int. J. Electr. Power Energy Syst. 2023, 153, 109294. [Google Scholar] [CrossRef]
  24. Lin, H.; Dang, J.; Zheng, H.; Yao, L.; Yan, Q.; Yang, S.; Guo, H.; Anvari-Moghaddam, A. Two-stage electric vehicle charging optimization model considering dynamic virtual price-based demand response and a hierarchical non-cooperative game. Sustain. Cities Soc. 2023, 97, 104715. [Google Scholar] [CrossRef]
  25. Azarhooshang, A.; Sedighizadeh, D.; Sedighizadeh, M. Two-stage stochastic operation considering day-ahead and real-time scheduling of microgrids with high renewable energy sources and electric vehicles based on multi-layer energy management system. Electr. Power Syst. Res. 2021, 201, 107527. [Google Scholar] [CrossRef]
  26. Wang, Z.; Jochem, P.; Fichtner, W. A scenario-based stochastic optimization model for charging scheduling of electric vehicles under uncertainties of vehicle availability and charging demand. J. Clean. Prod. 2020, 254, 119886. [Google Scholar] [CrossRef]
  27. Yin, W.; Ming, Z.; Wen, T. Scheduling strategy of electric vehicle charging considering different requirements of grid and users. Energy 2021, 232, 121118. [Google Scholar] [CrossRef]
  28. Liu, L.; Zhou, K. Electric vehicle charging scheduling considering urgent demand under different charging modes. Energy 2022, 249, 123714. [Google Scholar] [CrossRef]
  29. Wang, J.; Zhang, F.; Liu, H.; Ding, J.; Gao, C. Interruptible load scheduling model based on an improved chicken swarm optimization algorithm. CSEE J. Power Energy Syst. 2020, 7, 232–240. [Google Scholar]
  30. Yang, H.; Zhang, S.; Zeng, J.; Tang, S.; Xiong, S. Future of sustainable renewable-based energy systems in smart city industry: Interruptible load scheduling perspective. Sol. Energy 2023, 263, 111866. [Google Scholar] [CrossRef]
  31. Yang, M.; Sun, L.; Wang, J. Multi-objective optimization scheduling considering the operation performance of islanded microgrid. IEEE Access 2020, 8, 83405–83413. [Google Scholar] [CrossRef]
  32. Khalili, T.; Nojavan, S.; Zare, K. Optimal performance of microgrid in the presence of demand response exchange: A stochastic multi-objective model. Comput. Electr. Eng. 2019, 74, 429–450. [Google Scholar] [CrossRef]
  33. Jani, A.; Karimi, H.; Jadid, S. Multi-time scale energy management of multi-microgrid systems considering energy storage systems: A multi-objective two-stage optimization framework. J. Energy Storage 2022, 51, 104554. [Google Scholar] [CrossRef]
  34. Dong, X.; Li, X.; Cheng, S. Energy management optimization of microgrid cluster based on multi-agent-system and hierarchical Stackelberg game theory. IEEE Access 2020, 8, 206183–206197. [Google Scholar] [CrossRef]
  35. Li, B.; Zhao, R.; Lu, J.; Xin, K.; Huang, J.; Lin, G.; Chen, J.; Pang, X. Energy management method for microgrids based on improved Stackelberg game real-time pricing model. Energy Rep. 2023, 9, 1247–1257. [Google Scholar] [CrossRef]
  36. Liang, N.; He, X.; Tan, J.; Pan, Z.; Zheng, F. Stackelberg game-based optimal scheduling for multi-community integrated energy systems considering energy interaction and carbon trading. Int. J. Electr. Power Energy Syst. 2023, 153, 109360. [Google Scholar] [CrossRef]
  37. Tang, J.; Wang, D.; Jia, H.; Zhang, Y.; Xiong, J. Optimal economic operation of active distribution networks based on hybrid algorithm of surrogate model and particle swarm optimization. Autom. Electr. Power Syst. 2018, 42, 95–103. [Google Scholar]
Figure 1. Configuration and hierarchical optimization of a VPP.
Energies 18 00896 g001
Figure 2. Energy exchange relationships.
Energies 18 00896 g002
Figure 3. Probability graph of EV: (a) is connection times, (b) is departure times.
Energies 18 00896 g003
Figure 4. Framework of Stackelberg game model.
Energies 18 00896 g004
Figure 5. Optimization framework for VPPs.
Energies 18 00896 g005
Figure 6. Load curves under different strategies.
Energies 18 00896 g006
Figure 7. EV Scheduling in VPP1: (a) is Strategy EV2; (b) is Strategy EV3.
Energies 18 00896 g007
Figure 8. Day-ahead scheduling results of VPP1 with Strategy VPP6.
Energies 18 00896 g008
Figure 9. Optimized results of interruptible load data for each period.
Energies 18 00896 g009
Figure 10. Electricity transaction prices.
Energies 18 00896 g010
Figure 11. (a) Volume of electricity transactions between the DNO and the power market. (b) Volume of electricity shared among VPPs in Framework 2.
Energies 18 00896 g011
Figure 12. Output of each VPP in Framework 1.
Energies 18 00896 g012
Figure 13. Scheduling results of VPP1 under different Frameworks: (a) is framework 1, (b) is framework 2.
Energies 18 00896 g013
Table 1. Comparison of data after scheduling with three strategies.
StrategyEV1EV2EV3
Total Cost/CNY 10,000496.8204.6256.6
Load Peak-to-Valley Difference/MW6.35.64.6
Comprehensive Satisfaction0.3250.4770.658
Table 2. Cost situation of VPPs under different frameworks.
SubjectFramework 1Framework 2
VPP137.00532.056
VPP243.34742.611
VPP341.91140.155
Disclaimer/Publisher’s Note: The statements, opinions and data contained in all publications are solely those of the individual author(s) and contributor(s) and not of MDPI and/or the editor(s). MDPI and/or the editor(s) disclaim responsibility for any injury to people or property resulting from any ideas, methods, instructions or products referred to in the content.

