Article

Designing a Photovoltaic–Wind Energy Mix with Energy Storage for Low-Emission Hydrogen Production

1
Department of Transportation and Informatics, WSEI University, 20-209 Lublin, Poland
2
Department of Power Engineering and Transportation, Faculty of Production Engineering, University of Life Sciences in Lublin, 20-612 Lublin, Poland
*
Authors to whom correspondence should be addressed.
Energies 2025, 18(4), 846; https://doi.org/10.3390/en18040846
Submission received: 30 December 2024 / Revised: 4 February 2025 / Accepted: 10 February 2025 / Published: 11 February 2025
(This article belongs to the Special Issue Optimal Control of Wind and Wave Energy Converters)

Abstract

:
In the introduction to this article, a brief overview of the generated energy and the power produced by the photovoltaic systems with a peak power of 3 MWp and different tilt and orientation of the photovoltaic panels is given. The characteristics of the latest systems generating energy by wind turbines with a capacity of 3.45 MW are also presented. In the subsequent stages of the research, the necessity of balancing the energy in power networks powered by a mix of renewable energy sources is demonstrated. Then, a calculation algorithm is presented in the area of balancing the energy system powered by a photovoltaic–wind energy mix and feeding the low-emission hydrogen production process. It is analytically and graphically demonstrated that the process of balancing the entire system can be influenced by structural changes in the installation of the photovoltaic panels. It is proven that the tilt angle and orientation of the panels have a significant impact on the level of power generated by the photovoltaic system and, thus, on the energy mix in individual hourly intervals. Research has demonstrated that the implementation of planned design changes in the assembly of panels in a photovoltaic system allows for a reduction in the size of the energy storage system by more than 2 MWh. The authors apply actual measurement data from a specific geographical context, i.e., from the Lublin region in Poland. The calculations use both traditional statistical methods and probabilistic analysis. Balancing the generated power and the energy produced for the entire month considered in hourly intervals throughout the day is the essence of the calculations made by the authors.

1. Introduction

In an era of growing energy demand and the need to reduce greenhouse gas emissions, renewable energy sources (RESs) are becoming a key element of the energy transition [1]. In the third decade of the 21st century, humans can draw energy from many renewable sources available on land and at sea [2]. Photovoltaics (PV) [3] and wind turbines [4] are currently among the most popular RES technologies. Despite their obvious advantages, balancing energy in the power system, the stability of which is crucial for the reliable operation of the grid, remains a challenge [5,6]. Solar and wind energy are considered as rather unstable sources which are heavily dependent on the weather conditions [7]. Photovoltaic systems work best on sunny days, reaching peak production at noon, but their efficiency decreases during cloud cover, and they cease work at night [8]. Wind turbines generate energy depending on the wind speed, which means that production is variable both on an hourly and daily scale. This variability causes difficulties in ensuring the continuity of energy supply and requires the use of advanced power balancing technologies [9]. Energy balancing methods in a mix based on PV and wind are as follows:
  • Energy storage. Energy storage systems, such as lithium-ion batteries, allow for the storage of surplus generated energy during periods of high production and its use during periods of energy shortage [10]. Energy storage technologies in the form of compressed air (CAES) or hydrogen (Power-to-Gas) are also being developed [11].
  • Integration with flexible energy sources [12]. Mix balancing requires combining unstable RESs with more predictable energy sources, such as gas or hydroelectric power plants [13]. These can act as power reserves in the event of a drop in PV and wind generation.
  • Digital solutions and smart grids (Smart Grid). Advanced network management systems enable dynamic control of energy flows [14]. By using predictive algorithms, it is possible to optimize the operation of the network depending on the forecasts of the energy production from RES and the demand of the recipients [15,16].
  • Diversification of location and scale [17,18]. Distributed photovoltaic systems and wind farms located in different parts of the country can partially compensate for local differences in the weather conditions [19].
Balancing the energy mix based on PV and wind turbines is technically feasible but requires an integrated approach [20]. Investments in energy storage, intelligent grid management systems, and flexible backup sources are key [21]. In the long term, the development of such technologies will contribute to the creation of a stable, sustainable, and ecological energy system. Photovoltaic systems and wind turbines play an essential role in the decarbonization of the energy sector [22]. Although balancing the mix dominated by these sources is a challenge, the development of storage technologies, smart grids, and forecasting gives hope for its full integration [23]. An example of investment in renewable energy sources in the form of photovoltaic systems and wind turbines is shown in Figure 1. Energy transformation is an ongoing process; however, the direction of the change is unmistakably positive.
Poland is the fifth largest producer of hydrogen in the world and the third largest in Europe, but it is mainly gray hydrogen. A significant part of this hydrogen is produced in Zakłady Azotowe in Puławy for the production of ammonia and artificial fertilizers, which in itself is an excellent base for the development of innovative technologies in the field of green hydrogen [24]. The Lublin region is also characterized by human capital in the form of highly qualified specialists and graduates of technical and natural science universities, has industrial traditions, and, crucial for green hydrogen, is characterized by excellent conditions for the development of renewable energy sources.
Despite its great potential, the technologies for producing green hydrogen are not yet mature enough to give this energy carrier an economic justification, i.e., to allow it to compete with fuels based on hydrocarbons or gray hydrogen in industry [25]. In connection with this, active actions are being taken in the Lublin region in Poland to create a supply of green hydrogen at the place of its future use, and preparations are being made for the implementation of the following:
  • Infrastructure for the distribution of power from renewable energy sources located in the region to future locations for the production of green hydrogen [26].
  • Creation of infrastructure for the production of green hydrogen on an industrial and municipal scale, importantly located near future hydrogen recipients [27].
The infrastructure for the distribution of power, referred to above, has been internally called the half-ring of the Lublin Hydrogen Valley and, according to the currently implemented project, has a length of up to 100 km [28]. According to the assumptions of the main investor, the half-ring of the Lublin Hydrogen Valley will be open to connecting the renewable energy sources and energy storage facilities and to power the electrolyzers belonging to external entities [29]. The idea of the half-ring as an open integrator of green hydrogen technology is to create economies of scale through joint effort; to create a strong substantive, technical, and production base for hydrogen technologies in the region; and to disperse the risk of innovation among all partners. The business goal of the half-ring is to optimize the entire value chain aimed at reducing the price of produced hydrogen [30]. Due to sharing the same connection infrastructure by many RES installations, energy storage facilities, and many electrolyzer installations connected to the half-ring, their CAPEX savings will be able to translate into a reduction in the cost of producing a unit of electricity, which, in the case of green hydrogen, is its main price-setting factor [31]. In addition, the half-ring will enable, regardless of the location of RES sources, the production of hydrogen directly at the recipient, i.e., without losses on compression, expansion, and transport [32] and without the need to invest in the construction and operation of expensive infrastructure for this purpose [33,34]. Savings related to balancing and transmitting electricity within the half-ring will be very beneficial for the price of hydrogen and for all participants in the Lublin Hydrogen Valley half-ring [35].
The availability of renewable energy around the world means it already plays a leading role in the decarbonization of the energy sector [36]. A thorough review of the scientific literature and the state of the art in the market shows that hybrid solar–wind power systems have been the main solutions to the challenges centered around reliable power supply, sustainability, and energy costs for several years [37]. However, there are still various challenges in the renewable energy industry, especially with regard to limited peak periods. According to the authors, the main challenges for hybrid solar–wind systems at present are overproduction, enabling policies, and storage of electricity.
In balancing networks powered by RES, it is very important to have an appropriate strategy for managing the energy produced and consumed. Nordström et al. [38], conducting case studies from several countries around the world, prove that there is no “one size fits all” approach to continuous balancing with high shares of Variable Renewable Energy. The main challenges depend on the system capacity and its connection possibilities, available technologies, and basic balancing principles. According to the authors, in the case of energy systems performing energy balancing with fine time granularity close to real time, the main challenge is frequency balancing at low levels of inertia. In the case of other systems considered, the main emphasis is on operating the system in the most economically viable way. However, the most important conclusion from the presented analyses should be the pursuit of engaging more technologies in order to contribute to continuous balancing.
Shavolkin et al. [39] proposed to improve the operation of a hybrid solar–wind system by equipping it with an energy storage with control of the power drawn from the network. The aim of the research was to increase the degree of use of energy from own renewable sources for self-consumption purposes while limiting the degree of battery discharge, taking into account deviations in the load schedule and generation of energy sources in relation to the calculated (forecasted) values. A mathematical 24 h model of energy processes was developed, taking into account the error in estimating the state of charge of the energy storage. The results of modeling using archive data on generation from renewable sources confirm the effectiveness of the proposed solutions.
The challenges of power balancing processes in power grids depend largely on the geographical location of the system and the prevailing conditions for renewable energy production. Fang et al. [40] assessed the potential and temporal complementarity of wind and solar energy in the northwestern provinces of China. Using the ERA5 reanalysis data on wind speed and solar irradiance, an assessment was conducted to determine the potential and spatial distribution of wind and solar energy in these provinces.
Nefabas et al. presented an hourly dispatch model to analyze the challenges of balancing the system and curtailing wind power in the future Ethiopian power grid system [41]. The model presented by the authors was validated using historical data and used to analyze the grid system in 2030 under different scenarios. The influence of hydropower generation in network balancing was considered.
Boubii et al. noticed a gap in existing renewable energy systems, especially in the area of stability and efficiency under variable environmental conditions [42]. This helped to develop a new hybrid system combining photovoltaic (PV) and wind energy. The novelty of this study lies in the adopted methodological approach, integrating dynamic modeling with a sophisticated control mechanism. The mechanism presented in this paper is a combination of model predictive control (MPC) and particle swarm optimization (PSO). It is designed to take into account the fluctuations inherent to PV and wind energy sources.
In addition, a new trend has emerged that is very helpful in balancing energy systems. This is the virtual power plant (VPP), which can play a very important role in energy system management, offering dynamic solutions to the challenges of renewable energy integration, grid stability, and demand management [43]. Today, PPVs are sophisticated devices that combine a variety of energy assets, including solar panels, wind turbines, battery storage systems, and demand response units.
Singh et al. [44] proposed the use of advanced machine learning algorithms, in particular support vector regression. This resulted in significant improvement in the efficiency and reliability of power systems. The SVR algorithm utilizes extensive archival data in the form of energy production, detailed weather patterns, and dynamic network load conditions. The aim of this advanced modeling was to accurately forecast the energy production from renewable energy sources. The authors’ approach allowed for increased grid stability by better balancing supply and demand, mitigating the variability and irregularity of the generated power from renewable energy sources. Many authors promote more balanced integration of renewable energy into the microgrid, contributing to cleaner, more resilient, and efficient energy infrastructure. The results of such studies provide valuable insights into the development of smart energy systems capable of adapting to changing conditions, paving the way for future innovations in energy management.
Many publications indicate the need to coordinate the use of hydrogen technologies and electricity in order to change the direction and shape of energy use in the power grid [45]. Electrolytic systems for hydrogen production are quite demanding receivers of electricity, while hydrogen fuel cells are very good generators of electricity. Therefore, hydrogen technologies can be used to balance power grids in the area of energy supply and reception. Moreover, hydrogen is a good medium for storing energy for longer periods ranging from several weeks to several months. The above literature analysis shows that the research presented in the article is consistent with global trends in balancing power grids powered by RESs using hydrogen technologies and energy storage systems. The computational algorithm presented in the article fills the gap in the research results consisting of the accurate calculation of the size of the energy storage system using statistical and probabilistic methods. The authors follow current trends in science and in the commercialization of research results in the form of new technologies appearing on the market. Participation in the Intersolar Europe 2024 trade fair in Munich allowed us to notice that the offer of companies selling energy storage for RES systems is already extensive. However, the price of both small home energy storage (up to 20 kWh capacity) and large industrial ESS (over 1 MWh) remains relatively high. Therefore, the size of the energy storage must be calculated precisely, and its cost must be included in the business plan of the entire investment. RES developers must develop and present such calculations to the banks that are financing such multi-million investments. This article presents an algorithm that allows to balance the energy produced in the photovoltaic–wind mix and calculate the size of the energy storage system needed. Moreover, the methods of influencing the performance of each RES (photovoltaic system and wind turbine) are presented, which confirms that it is possible to construct the performance of the photovoltaic–wind mix. The measurement data from the real systems were employed for calculations and analyses. The power generated by a wind turbine with a maximum power of 3.45 MW was supplemented by the power generated by a photovoltaic system with a peak power of 3 MWp. Two variants of panel assembly in a photovoltaic system were presented and compared. The first one includes the traditional method of assembly towards the south (because the system under study is located in Poland on the northern hemisphere of the Earth), which allows to maximize the amount of energy produced. The second variant consists of the assembly of panels in a direction close to east–west, which is used to balance the power networks powered by RESs. This article presents precise statistical and probabilistic calculations of the power generated by individual energy sources and their mix. A major achievement is the analytical presentation of the process of power balancing and determining the size of the energy storage system. The authors argue that it is possible to have a structural influence on the construction and performance of photovoltaic systems, which may have a significant impact on the power balancing of the entire system and contribute to reducing the capacity of the energy storage system.

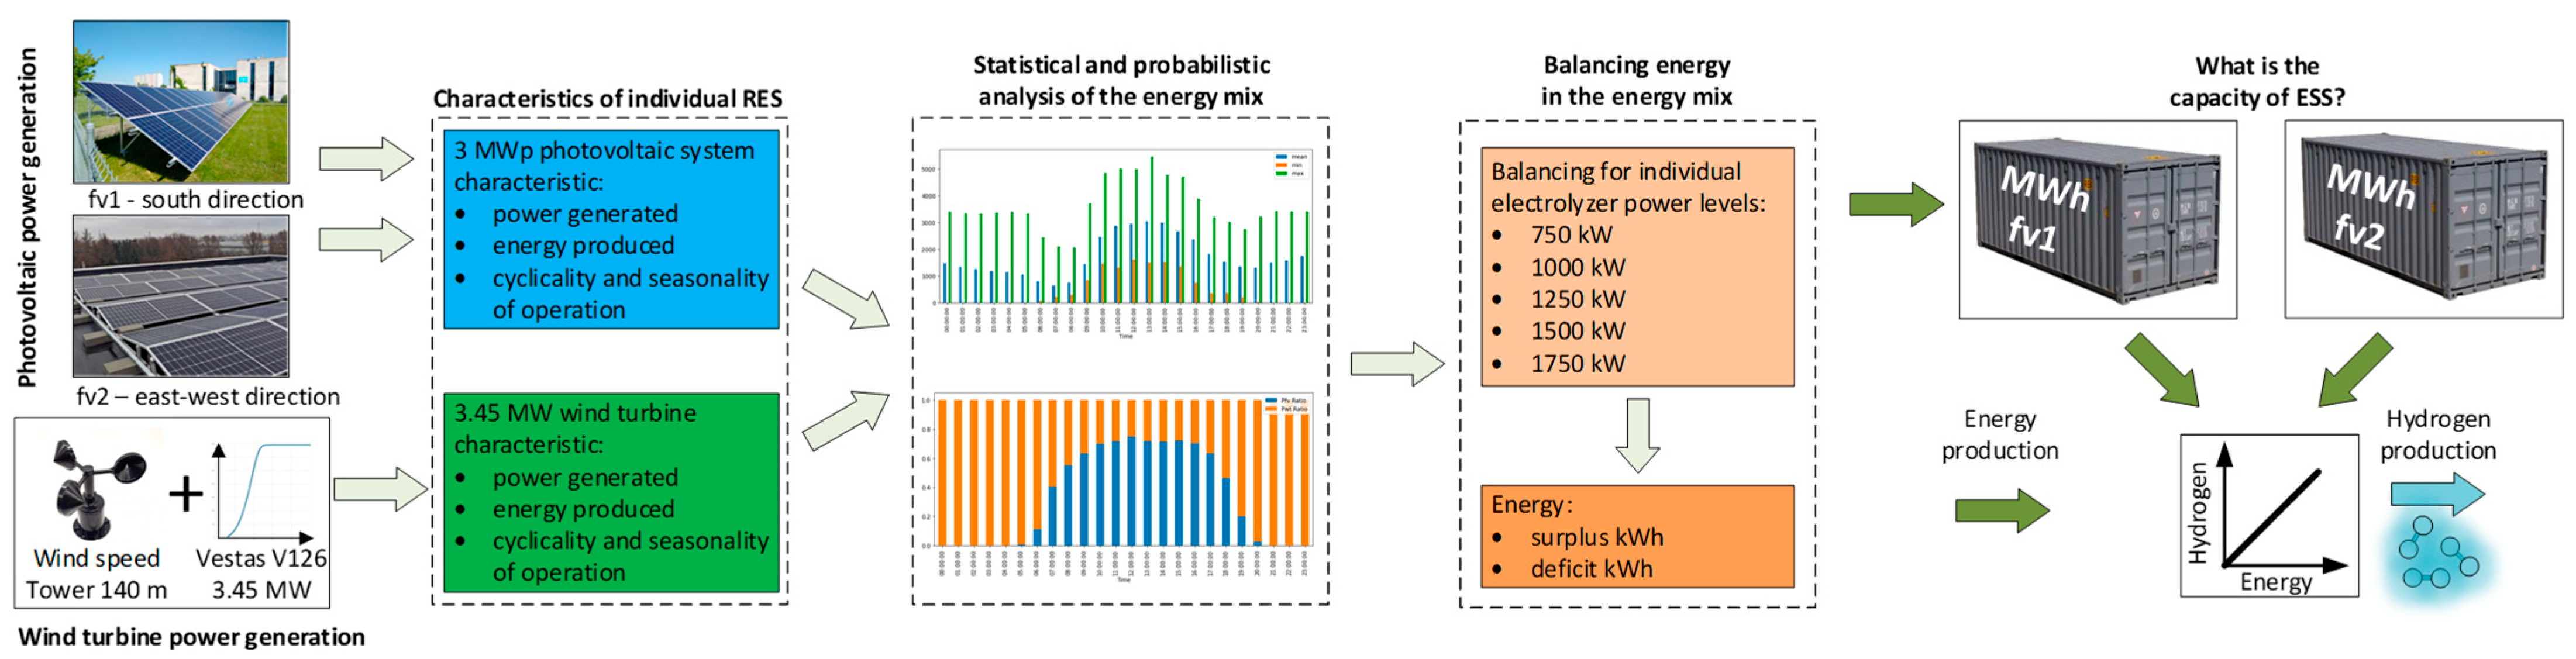
2. Materials and Methods

The authors used the Anaconda3 2024.10-1 platform in their research. It is a comprehensive open-source platform designed for Python users working in the fields of data analysis, machine learning, and broadly defined computational sciences. Due to its comprehensiveness and user-friendliness, Anaconda has become one of the most popular tools among data scientists, software engineers, and researchers. The Anaconda platform provides everything one needs to start working with the data, both the Python interpreter itself and a wide set of libraries and tools that are necessary for processing, analyzing, and visualizing the data. Any user can commence work immediately, avoiding the need to manually install libraries such as NumPy, pandas, Matplotlib, or Scikit-learn. Anaconda includes over 1500 built-in libraries, which allow for starting projects quickly without worrying about compatibility issues or installing additional packages. The authors used the Anaconda platform for Python 3.7 programming because of their familiarity with this programming environment. The platform uses the Conda package manager, which allows for easy installation, updating, and management of packages and their dependencies. It works independently of the system package manager, which reduces the risk of conflicts. The authors value Anaconda for its ability to quickly launch Jupyter Notebook v7 for working with interactive code, data analysis, and visualizations. Anaconda has a large user community and rich documentation, which makes it easy to troubleshoot and learn.
Figure 2 graphically depicts the data processing algorithm used in this article. The calculations were performed for a 3.45 MW wind turbine and for two design variants of the photovoltaic systems.
The variant termed fv1 (in Figure 2) concerns the installation of panels in the south direction, while the variant fv2 concerns the installation of panels in the direction close to east–west. In the first phase, the characteristics of individual RES sources were made, taking into account the generated power, produced energy, and cyclicality and seasonality in the operation of the systems. Then, statistical and probabilistic analyses related to the generation of power and energy production for the created energy mixes (for two variants of the photovoltaic panel arrangement fv1 and fv2) were presented. Probabilistic calculations are of particular importance, since they allow to determine both the generated power and the amount of energy produced with accuracy to the probability distribution. The next phase of the research included the process of balancing the energy production system from the photovoltaic–wind mix, taking into account the energy receivers in the form of hydrogen generation systems. The process of balancing the energy production and reception system was presented for several power levels of hydrogen electrolyzers. In this way, the amount of excess energy and its deficit in individual hourly intervals of the day were calculated. Energy surplus and deficit modeling allowed us to determine the size of the energy storage system required. The final discussion includes determining the impact of individual PV system design variants on the amount of hydrogen produced from the PV–wind mix.

3. Component Characteristics

In this section, the authors characterize all the components of the low-emission hydrogen production system using a mix of renewable energy sources and an energy storage. Particular attention is paid to the influence of the geographical and construction context on the performance of the entire system. The geographical context includes the exact selection of the location for the wind turbine and the photovoltaic system. The engineering context includes the selection of the power of individual sources, the selection of components for their construction, and aspects related to the tilt angle and azimuth of the photovoltaic panels. The authors attempt to prove in an analytical and graphical way that it is possible to design a system for generating energy from RESs, which affects the size of the energy storage and the amount of low-emission hydrogen produced.

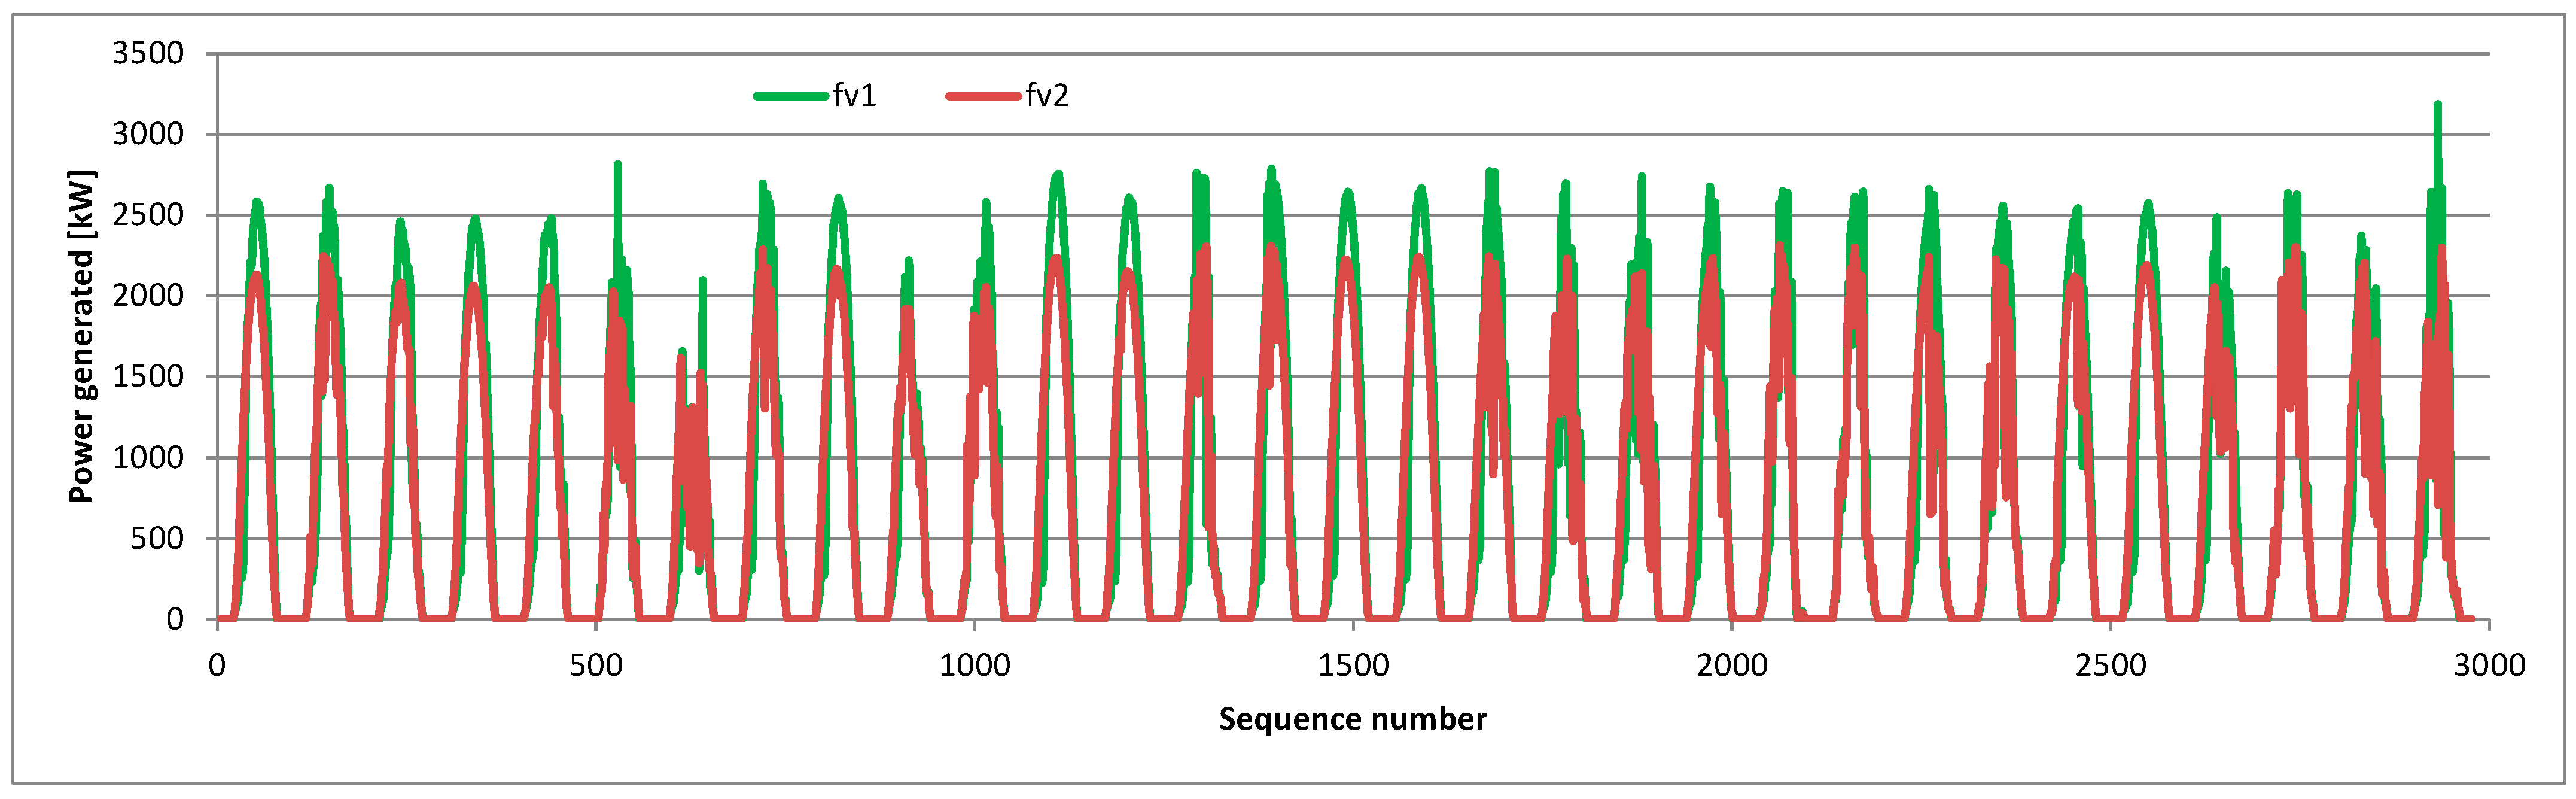
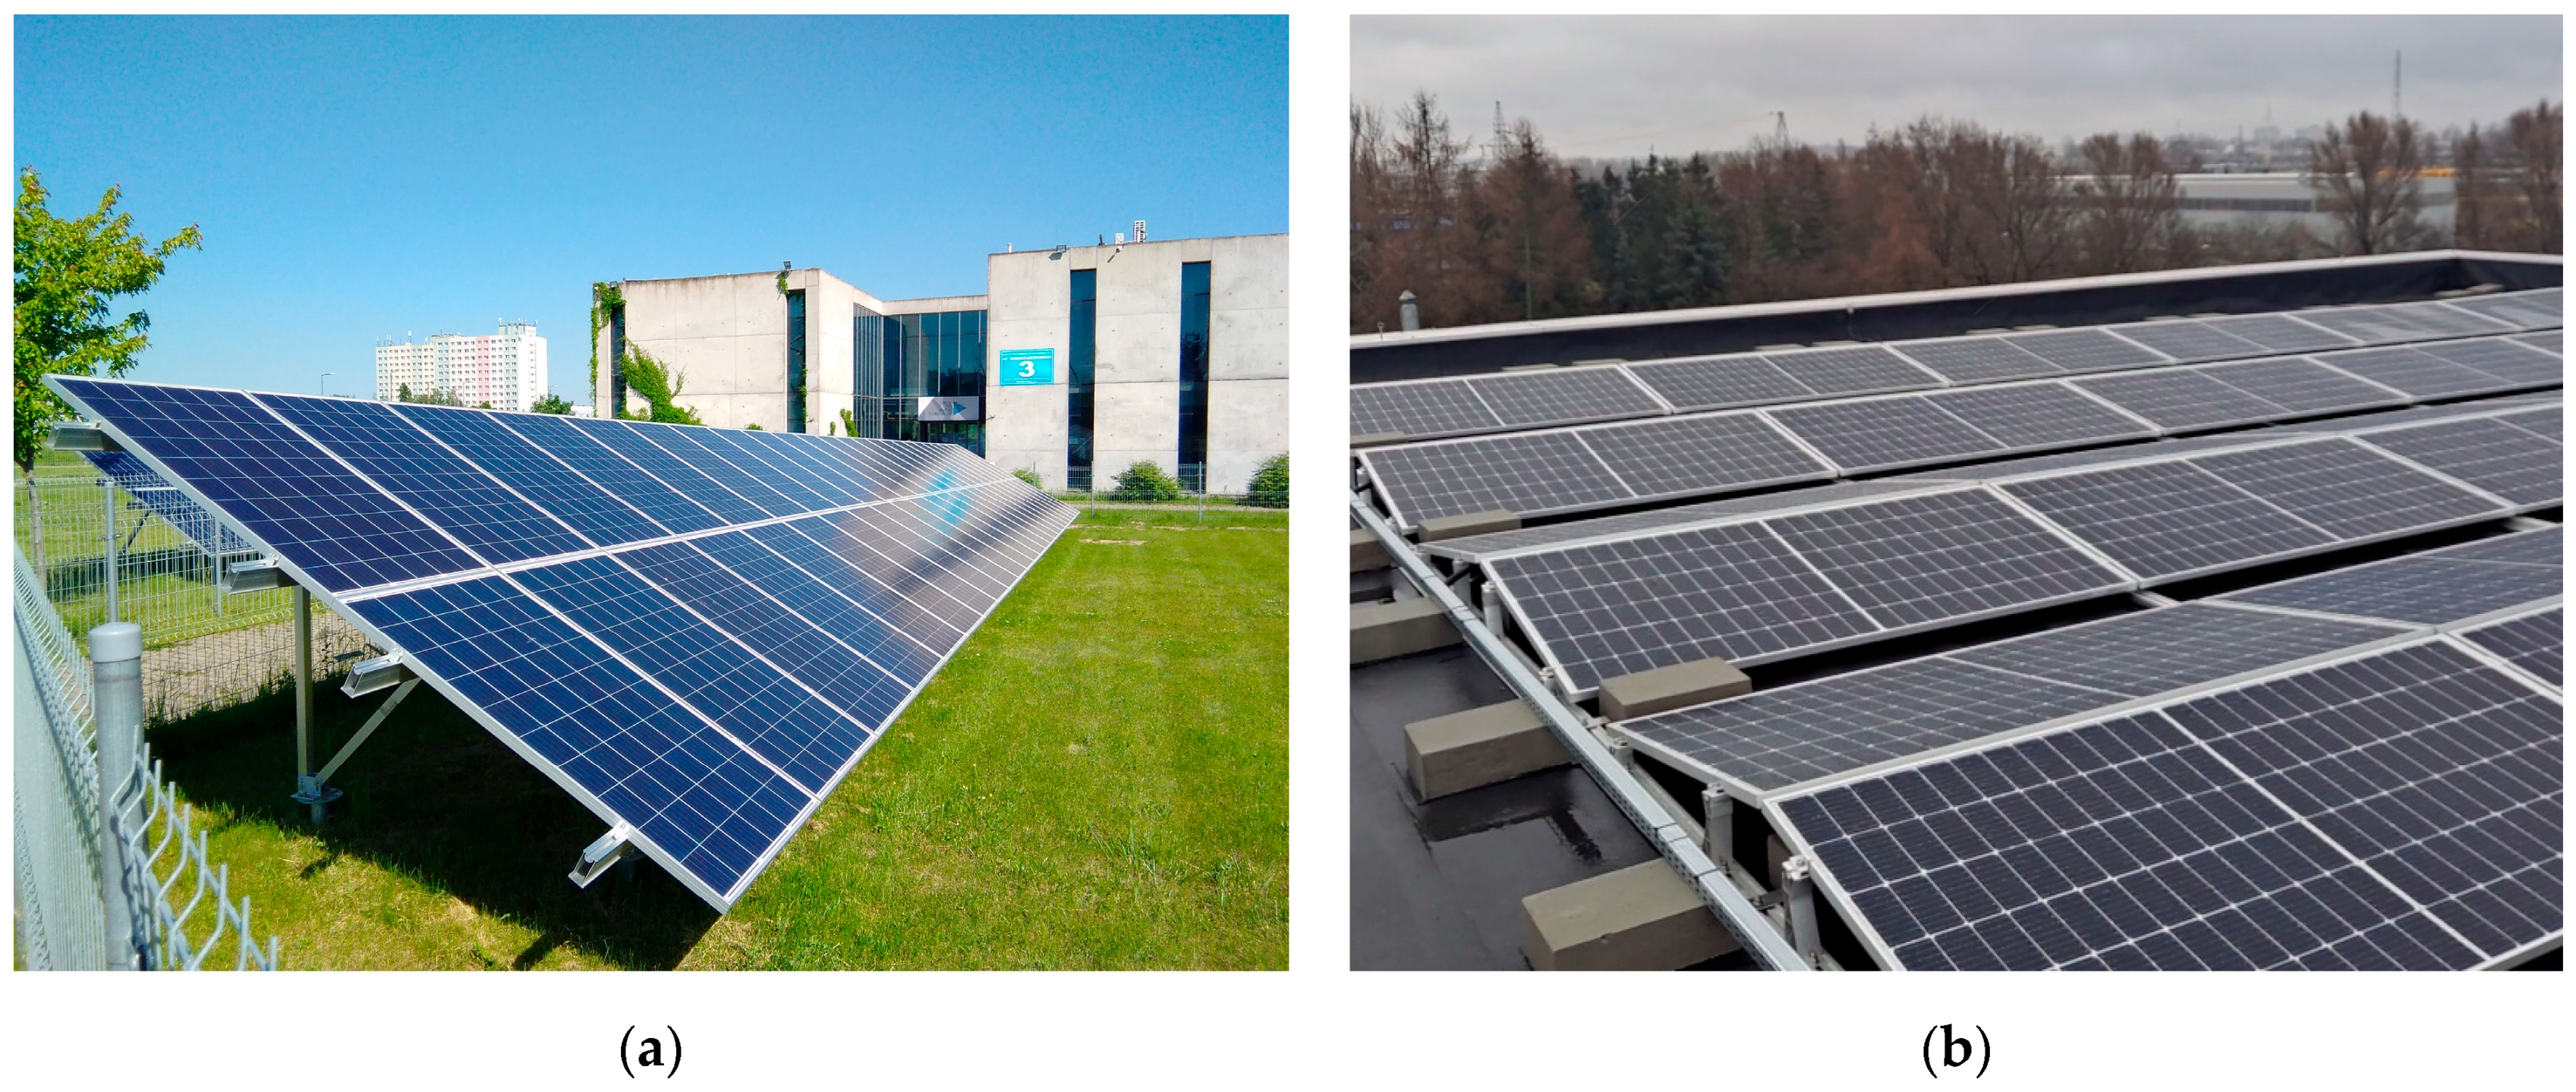
3.1. Power Generation by Photovoltaic Systems

The location of the photovoltaic system has a huge impact on its performance in the form of instantaneous generated power and the amount of energy produced. The decision to build a photovoltaic system in a given country in the world is of particular importance. The longitude and latitude of the photovoltaic system location (called the geographic context) determine the amount of electricity produced in individual months and has been the subject of many scientific works. The geographic context primarily affects the seasonality of the overlap of seasons and the height of the sun above the horizon, which affects the length of the day and, thus, the amount of energy produced. However, even within a small country, the geographic context can have a dozen or so percent impact on the performance of a photovoltaic system. This is due to the different local climatic conditions related to sunlight, cloudiness, and wind conditions. Photovoltaic systems located in Poland near Lublin are characterized by several percent higher efficiency than those located in the vicinity of nearby Warsaw (located 170 km away).
The Lublin region has the best solar conditions in Poland, and this is confirmed by the data on the amount of energy produced from the peak power of installed photovoltaic systems. In our region, 1200 kWh of energy can be obtained from 1 kWp of installed power, as shown in Figure 3.
Figure 4 depicts two time series describing the generation of instantaneous power by two photovoltaic systems that differ in the engineering context. The first one (fv1) is a classic approach to ground mounting of the photovoltaic systems facing exactly south (Lublin in Poland is located in the northern hemisphere) with an optimal tilt angle of 40°. The peak power of the fv1 photovoltaic system is 3 kWp. Its performance has been scaled to a peak power of 3 MWp to achieve an appropriate level to the power of the wind turbine. The second engineering context (fv2) includes the installation of photovoltaic systems on flat roofs of buildings. The panels are mounted towards the east and west at a small angle of 15°, azimuth 295°. The physical appearance of both variants of the development is shown in Figure 5. It was decided to present such a comparative analysis in order to confirm the possibility of shaping the generated power by photovoltaic systems during the day.
The differences in power generation during the day by both systems are shown in Figure 6. The system mounted on the roof starts generating power significantly earlier than the ground system. However, it achieves significantly lower maximum power at high noon. The authors’ task is to compare and describe quantitatively the differences in the operation of both systems and the impact of these differences on energy balancing in the low-emission hydrogen production system and on the size of the energy storage system needed for this.
The first analytical method used to describe the similarity (or lack thereof) of measurement data is their mutual correlation. The correlation is presented in Figure 7.
The difference in energy production between south-facing and east- and west-facing photovoltaic systems is due to the characteristics of solar radiation and the angle of incidence of sunlight during the day. South-facing panels achieve the highest efficiency in the northern hemisphere regions because of the following:
  • They maximize the total amount of energy reaching the panels during the day.
  • Production peaks at noon, when the sun is at the highest point in the sky and the angle of incidence of sunlight is most optimal.
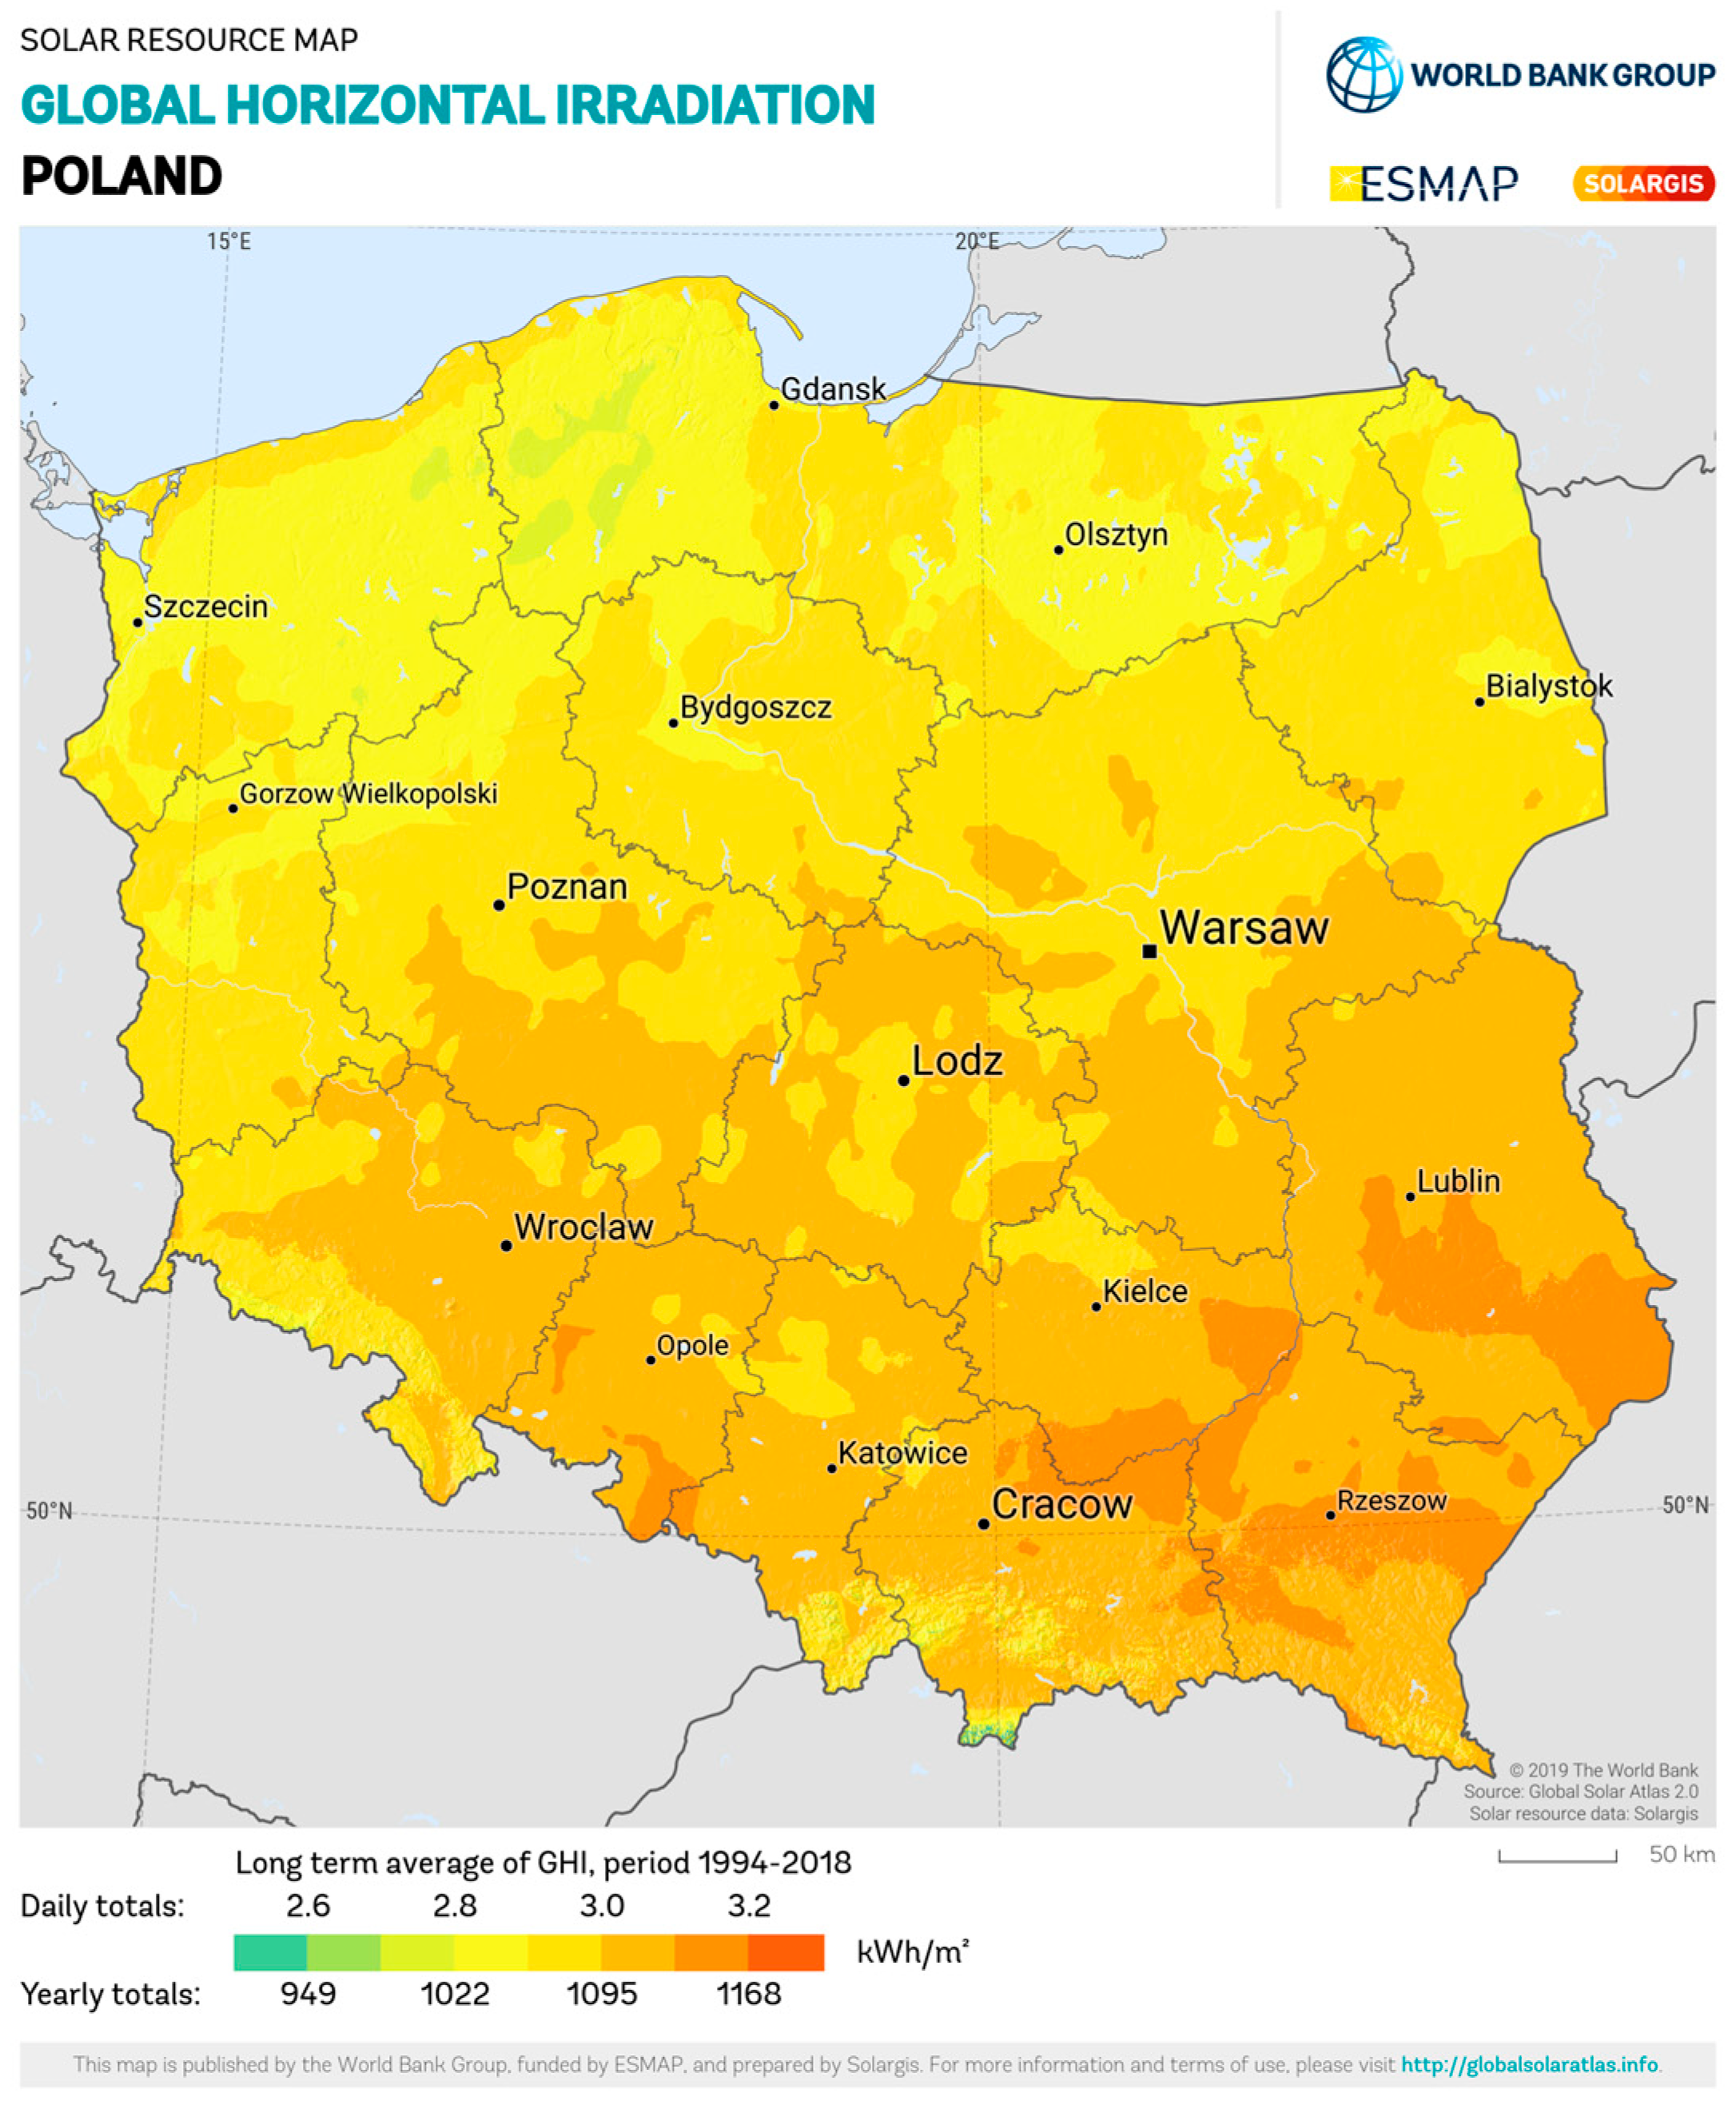
  • The typical annual production for a well-optimized system in Poland is around 1000–1200 kWh per kWp.
East- and west-facing panels generate energy at different times of the day:
  • East: energy production is maximum in the morning and decreases in the afternoon.
  • West: production increases in the afternoon and decreases in the morning.
  • These systems spread production better throughout the day but do not achieve as high total production as south-facing systems.
The typical annual production for such systems in Poland is around 900–1000 kWh per kWp, which is 10–15% lower than for south-facing panels. The differences in production during the day for both solutions are as follows:
  • For south-facing PV panels: they generate peak power at noon, which often coincides with periods of high energy demand, but production before noon and in the afternoon is much lower.
  • For east- and west-facing PV panels: production is more evenly distributed throughout the day, which can better match consumer demand in the morning (east) and afternoon (west).
Although the energy production is lower, the east–west orientation has some advantages:
  • Optimal use of space: on flat roofs, east–west systems can accommodate more panels because there is no need to maintain large spacing between rows (less shading problems).
  • Better match to demand: in some cases, the production spread better meets the needs of households and businesses.
The optimal orientation depends on your energy consumption profile and local conditions. If your energy needs are concentrated at certain times of the day, the orientation can be adjusted to maximize efficiency during these times of the day.
The course of the mean hourly power generated by the fv2 photovoltaic system during the entire month of May 2024 is shown in Figure 8.
Further analyses will be conducted for an energy mix consisting of a 3.45 MW wind turbine and a 3 MWp peak photovoltaic system with different panel orientations (south—fv1 and east–west—fv2).

3.2. Generating Power with Wind Turbines

In the case of wind turbines, the key decision is whether they are to be installed on land or offshore. Offshore and onshore wind turbines differ in many ways, mainly due to their location and environmental conditions [47]. Offshore wind turbines are characterized by the following features [48,49]:
  • They are usually located far from the coast, where winds are stronger and more stable.
  • Extreme environmental conditions, such as salt water, moisture, and strong waves, require additional protection against corrosion.
  • The infrastructure must be resistant to the effects of sea currents, waves, and potential ice.
Onshore wind turbines are characterized as follow:
  • They are located on hills, on open plains, or in mountainous regions where winds are sufficiently strong.
  • Less extreme environmental conditions, which reduces construction and maintenance costs.
Wind turbines installed at sea are usually larger than onshore ones, with rotors with diameters exceeding 200 m [50]. The power of a single turbine can reach up to 15–20 MW, which is necessary to use expensive infrastructure. Smaller turbines are usually installed on land, with rotor diameters of 100–150 m. Their typical power is 1.5–4 MW [51].
Investments in turbine systems installed at sea are characterized by higher construction and installation costs, mainly due to the need to use ships, deep-sea foundations, and underwater infrastructure [52]. Maintenance and service are also more expensive, requiring specialist equipment, e.g., service vessels [53]. Land-based wind turbines are characterized by lower construction and service costs, with easier access to the turbines and lower technological requirements. Land-based investment is cheaper to implement, but it is more difficult to find suitable locations with good wind conditions [54].
Land-based and offshore wind turbines also differ significantly in terms of efficiency. Offshore turbines are characterized by a higher capacity utilization factor (40–60%) as a result of more stable winds [55]. They also have a smaller impact on the local community, for example, in the form of noise [56,57]. Wind turbines installed on land have a lower capacity factor (20–40%) due to more variable winds [58]. They also have a greater impact on the landscape and local communities (e.g., noise, impact on animals). Offshore wind turbines are more expensive but have a greater potential for energy production, while onshore turbines are cheaper and easier to maintain, but they are limited by local wind and social conditions [59]. The choice of technology depends on the energy and budget goals of the project [60].
Similarly to the case of insolation, the Lublin region has good wind conditions [61]. In almost all general studies, wind conditions are indicated as rather favorable, as shown in Figure 9. However, in the local context, they are favorable and allow for obtaining an annual power factor of 30 to 35%.
Figure 10 presents a time series of power generated by the wind turbine during the month of May. The data were obtained as a result of processing wind speed measurements on a 140 m high measuring tower. Wind speeds were mean values measured in 10 min time intervals. As a result of sampling measurements in such time intervals, almost 4500 records were obtained during the entire month of May. The measured wind speed was used to calculate the power generated by the Vestas 3.45 MW turbine (Vestas Wind Systems A/S, Aarhus, Denmark) using its characteristics. A wind turbine with the assumed power is currently operating at the location of the measuring tower. The course of generated power clearly shows that the measured wind speeds repeatedly allow the turbine to operate at maximum power. Calculations show that during a month, the wind turbine is able to produce 729.663 kWh of energy at a mean wind speed of 6.4 m/s. The monthly power factor is therefore 28%. The authors’ experience shows that May is a rather average month for wind energy production. May is not a representative month characterizing the production of a given turbine in a given location throughout the year. It was chosen at random to present the possibilities of balancing the energy produced in the photovoltaic–wind mix.
The course of the mean hourly power generated by the 3.45 MW wind turbine during the entire sample month of May is shown in Figure 11. The graph below covers a daily time window.

4. Results

Photovoltaic and wind system operators and managers typically analyze the performance of their systems over a one-month period. This is usually the period of settlement with the energy supplier for the energy taken by the customer and delivered to the power grid. A period of one month is also long enough that the daily performance of photovoltaic and wind systems can be treated as invariant within the scope of seasonality [63]. Figure 12 depicts the hourly mean values of power generated by a 3 MWp peak photovoltaic system oriented east–west and a 3.45 MW wind turbine and their mix.
Data on the generation of these two RESs and their mix were subjected to traditional statistical analysis, and quantile calculations were made [63]. Quantile analysis carries a lot of information for people involved in power balancing in the power grid because its results were calculated with accuracy to the probability distribution. The data presented in Table 1 show that in an hourly perspective covering the entire month of operation, the wind turbine is a much more stable source of energy than the photovoltaic system. The probability that the power generated by the photovoltaic system will be equal to or less than 372.26 kW is 50%. With almost 30% probability, the power produced will be equal to 0 kW. It should be noted that the mean hourly values of generated power during the entire month of May are still being considered.
The hourly power values generated by the mix of a 3 MWp peak east–west-oriented PV system and a 3.45 MW wind turbine are shown in a box plot in Figure 13. The box plot shows the distribution of the data using several key statistical measures. The box plot contains Minima and Maxima (non-outlier values), Lower Quartile (Q1), Median, and Upper Quartile (Q3). This tool is useful for quick analysis of the distribution of the data, detecting asymmetries, and identifying outliers.
Figure 14 represents the share in the energy mix of the mean hourly power values generated by a 3 MWp peak photovoltaic system oriented to the south (fv1) and a 3.45 MW wind turbine. Figure 15 shows the share in the energy mix of the mean hourly power values generated by a 3 MWp peak photovoltaic system oriented to the east–west (fv2) and a 3.45 MW wind turbine.
A comparison of the data presented in Figure 14 and Figure 15 clearly indicates that there were increases in the share of photovoltaic energy in the mix at 6:00 a.m. (from 11 to 20%), at 7:00 a.m. (from 40 to 58%), at 8:00 a.m. (from 50 to 74%), and at 9:00 a.m. (from 63 to 72%). Then, we observe the decline in the share of photovoltaic energy in the mix at 10:00 a.m. (from 70 to 69%), at 11:00 a.m. (from 72 to 69%), at 12:00 p.m. (from 75 to 72%), etc. The largest percentage of the decrease occurred at 6:00 p.m. (from 46 to 39%). These data clearly indicate that, as a result of the east–west orientation of the photovoltaic system, the share of energy from it in the energy mix increased significantly in the morning hours. The share of energy coming from this photovoltaic system simultaneously decreased by several percent from 10:00.
The share of the mean hourly power values generated by a 3 MWp peak photovoltaic system oriented east–west (fv2) and a 3.45 MW wind turbine in the energy mix in a standardized form in the range 0–1 is presented in Figure 16.
The balancing of energy in the power grid is not influenced only by the amount of energy produced from the photovoltaic–wind mix. In this complicated process, the load on the network, which results from the type of electrical receivers used, is of great importance. In this article, the only receiver will be the low-emission hydrogen generation system. It usually takes the form of an ISO container-mounted water electrolyzer in alkaline, PEM, or, increasingly, AEM technology [64]. This section of the article will present the simulations related to the use of energy obtained from the previously presented photovoltaic–wind energy mix to power low-emission hydrogen production systems with a capacity of 750 to 1750 kW [65]. Figure 17 shows the probability of powering the hydrogen generation system with energy from the photovoltaic–wind mix. Table 2 presents the same data but in tabular form. Their analysis shows that the energy produced in the mix is sufficient to power the selected load levels needed to power water electrolyzers at specific hours of the day. For example, in the hourly interval marked as 14:00, the energy from the mix is able to supply with probability 1 electrolyzers operating at all possible power levels from 750 to 1750 kW. However, it is already able to supply with probability 1 electrolyzer powers of 750, 1000, and 1250 kW between 10:00 and 14:00. For some analyses, it is more convenient to present the calculation results in tabular form. In the case of a probability of less than 1, it means that the energy from the mix is not sufficient to meet the energy demand of the green hydrogen generation systems. The missing energy must be drawn from the power grid. Significant amounts of energy are clearly missing at night, in the morning, and in the evening. From this shape of the graph, we immediately conclude that the excess energy produced from the mix should be stored and returned to the hydrogen generation process when required.

5. Discussion

The Python programming language tool can generate very useful graphs to visualize the energy balancing strategies in power systems. For example, Figure 18 presents the excess and the deficit of energy production from the mix on an hourly basis for different levels of the electrical load.
Table 3 summarizes both the overproduction and the deficit in energy production in the photovoltaic–wind mix over the daily period. Table 3 also includes the results of their modeling.
The balancing characteristic of the energy system powered by the photovoltaic–wind mix for different external load levels is presented in Figure 19. Both graphical visualization and mathematical calculations allow for the precise calculation of the point of intersection of the characteristic with the x-axis. Perfect balancing occurs for the receiver power of 1724.38 kW for (fv1) and 1683.58 kW for (fv2). The receiver power needed for ideal energy balance for variant (fv2) decreased as a result of the photovoltaic system (fv2) producing smaller amounts of energy during the day. This situation will affect the smaller amount of green hydrogen produced during the day. However, this is only less than 2.5% of production.
Figure 20 shows the characteristics of energy surplus and deficit for individual power levels of hydrogen electrolyzers. From the graphical presentation and mathematical calculations, it is evident that for the ideal balancing point of 1724.38 kW, the surplus energy and the deficit energy are equal and have values of 7409 kWh. The simplest and most accurate interpretation of the obtained results is that they constitute an ideal calculation of the energy capacity of the required energy storage. For variant (fv2), the same calculations were made, and the energy storage capacity was 5391 kWh. This means a fairly large decrease compared to the energy storage system (ESS) capacity for variant (fv1).

6. Conclusions

This article was introduced with a brief description of the generated energy and power produced by the photovoltaic systems with a peak power of 3 MWp and different tilt and orientation of photovoltaic panels. The characteristics of the latest systems for generating energy by wind turbines were also presented. In the subsequent stages, the necessity of balancing energy in power networks powered by a mix of renewable energy sources was demonstrated. Then, a calculation algorithm was presented in the area of balancing the energy system powered by a photovoltaic–wind energy mix and powering the low-emission hydrogen production process. It was analytically and graphically demonstrated that the process of balancing the entire system can be influenced by structural changes in the installation of the photovoltaic panels. It was proven that the tilt angle and orientation of the panels have a significant impact on the level of power generated by the photovoltaic system and thus by the energy mix in individual hourly intervals. It is worth emphasizing that the authors used the actual measurement data from a specific geographical context, i.e., from the Lublin region in Poland. Both traditional statistical methods and probabilistic analysis were employed in the calculations. This means that the results obtained were accurate to the probability distribution. Balancing the generated power and the energy produced for the entire month considered in hourly intervals throughout the day is the essence of the calculations made by the authors. The results obtained can be the basis for conceptual assumptions and economic analyses related to investments in the design and creation of new renewable energy generation capacities for the production of low-emission hydrogen. Based on the calculations and analyses carried out, the following conclusions can be drawn:
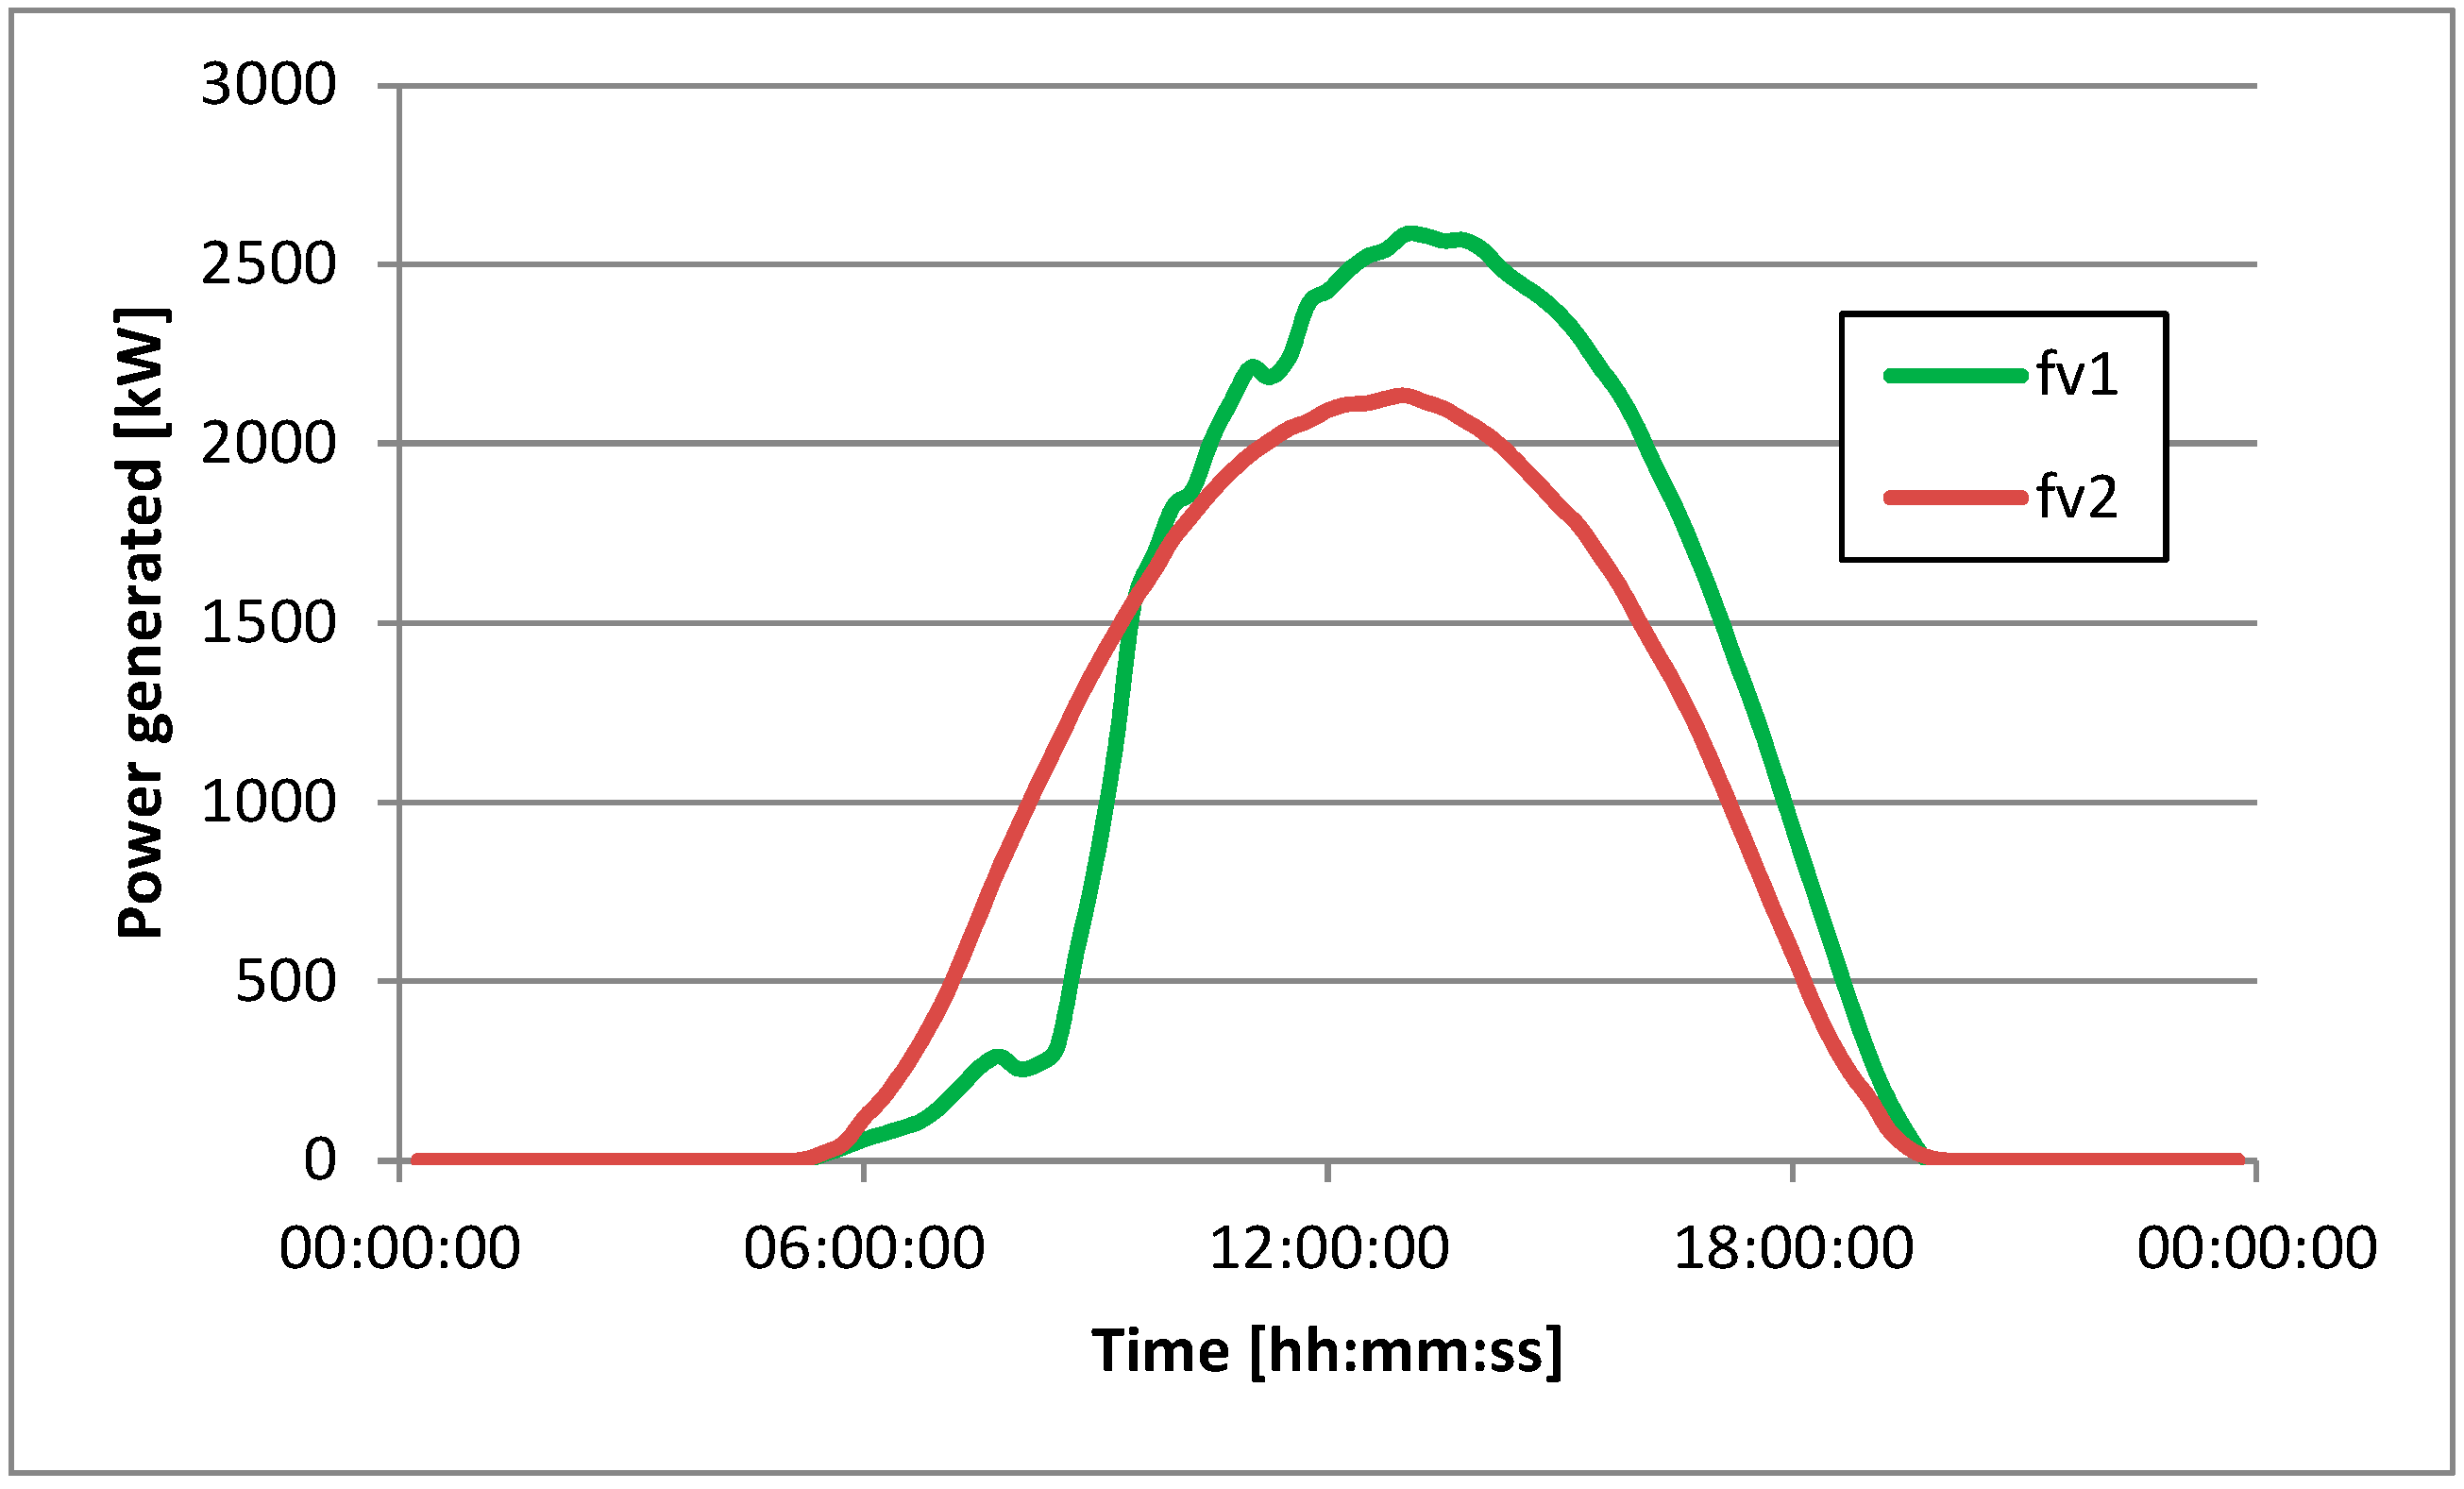
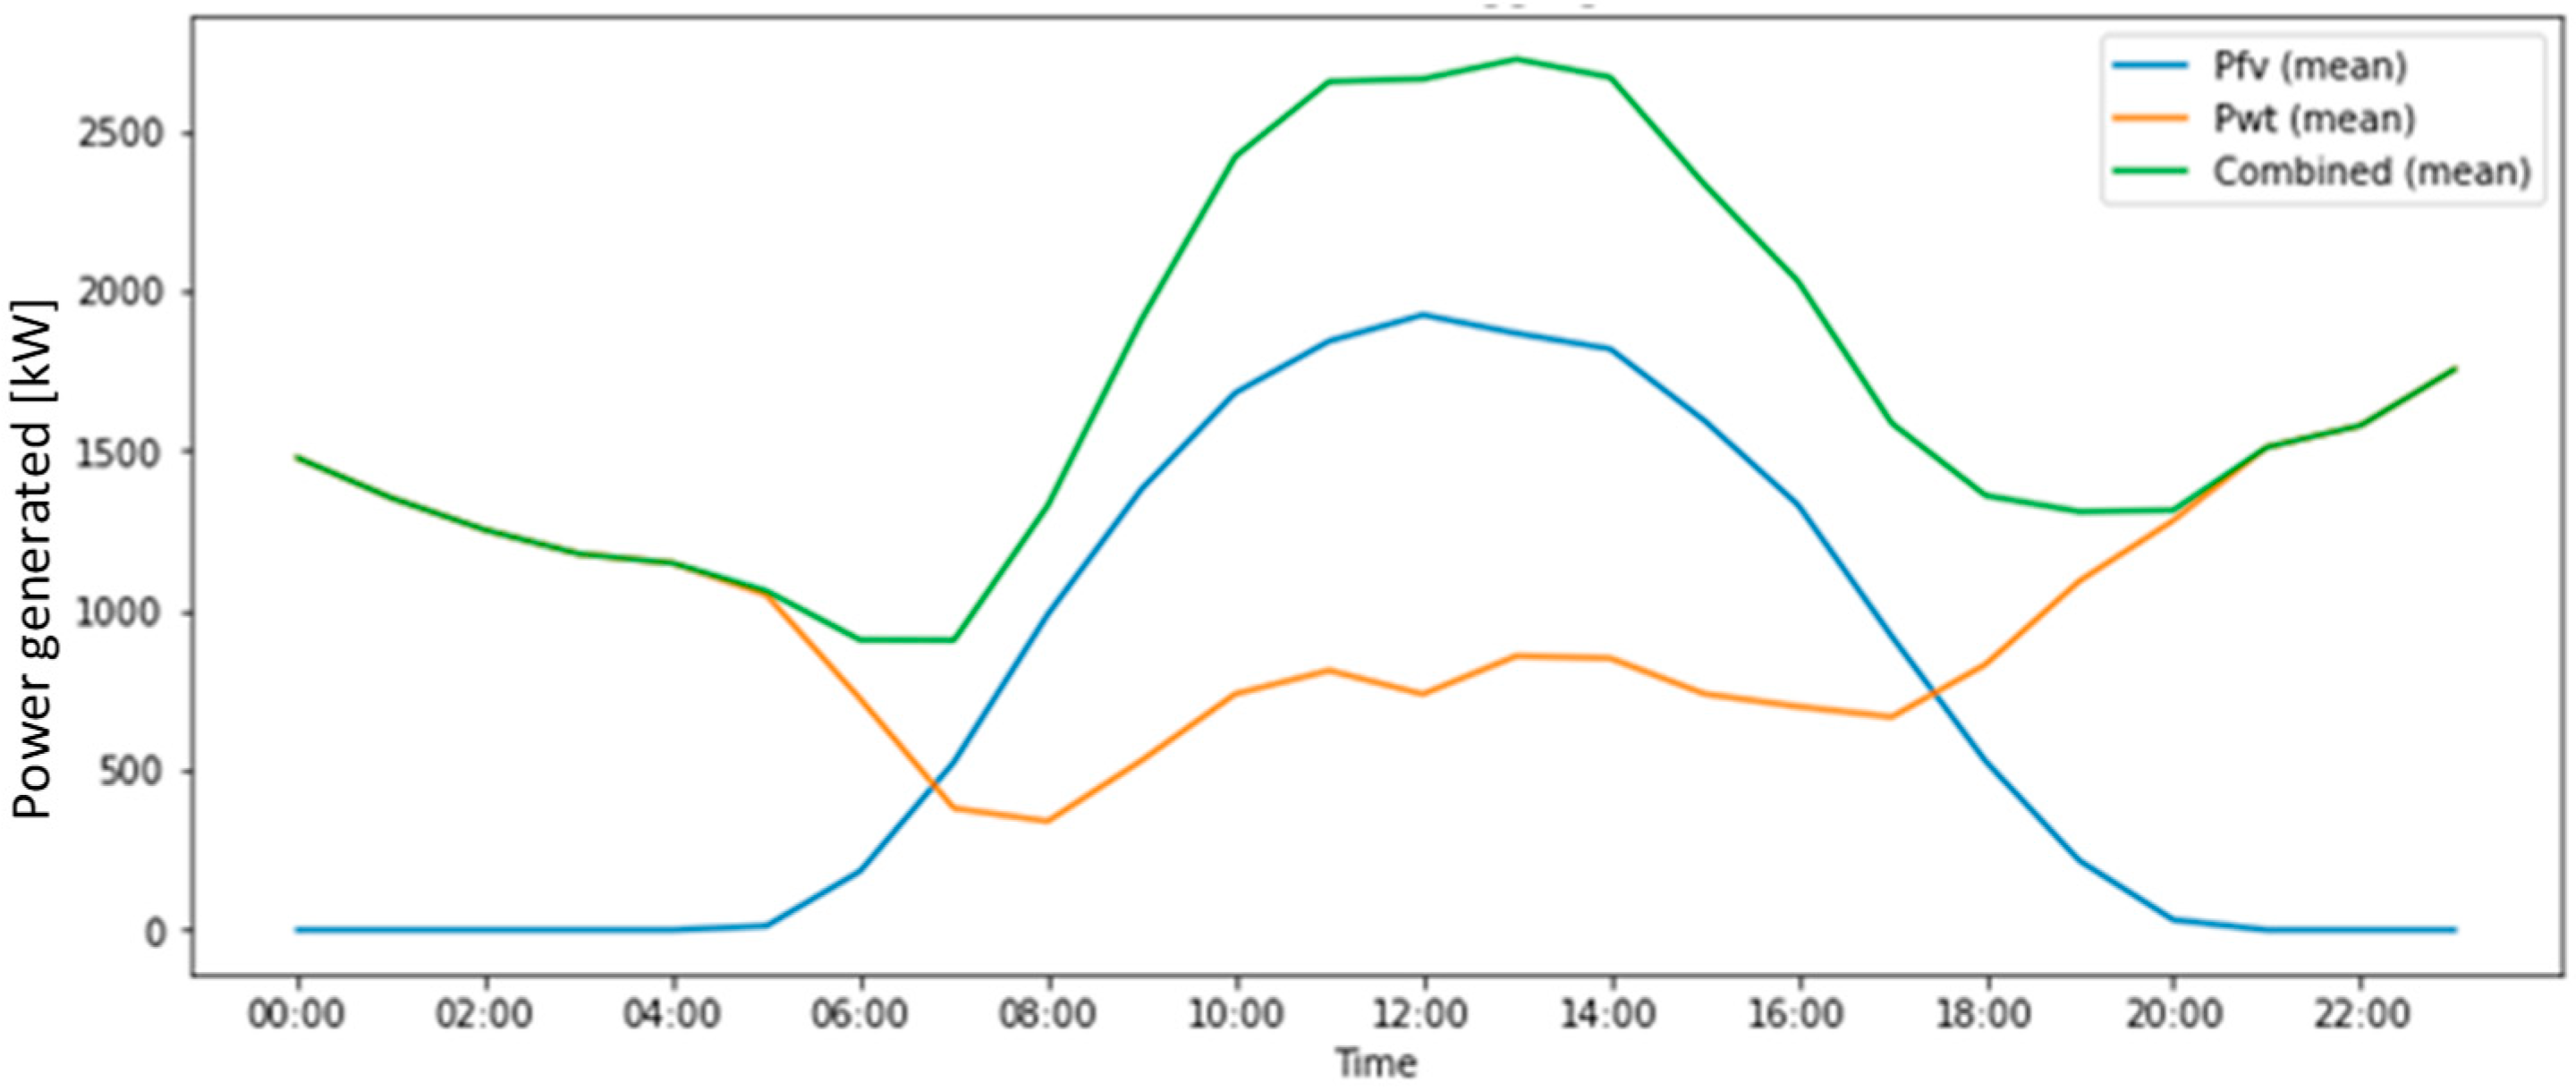
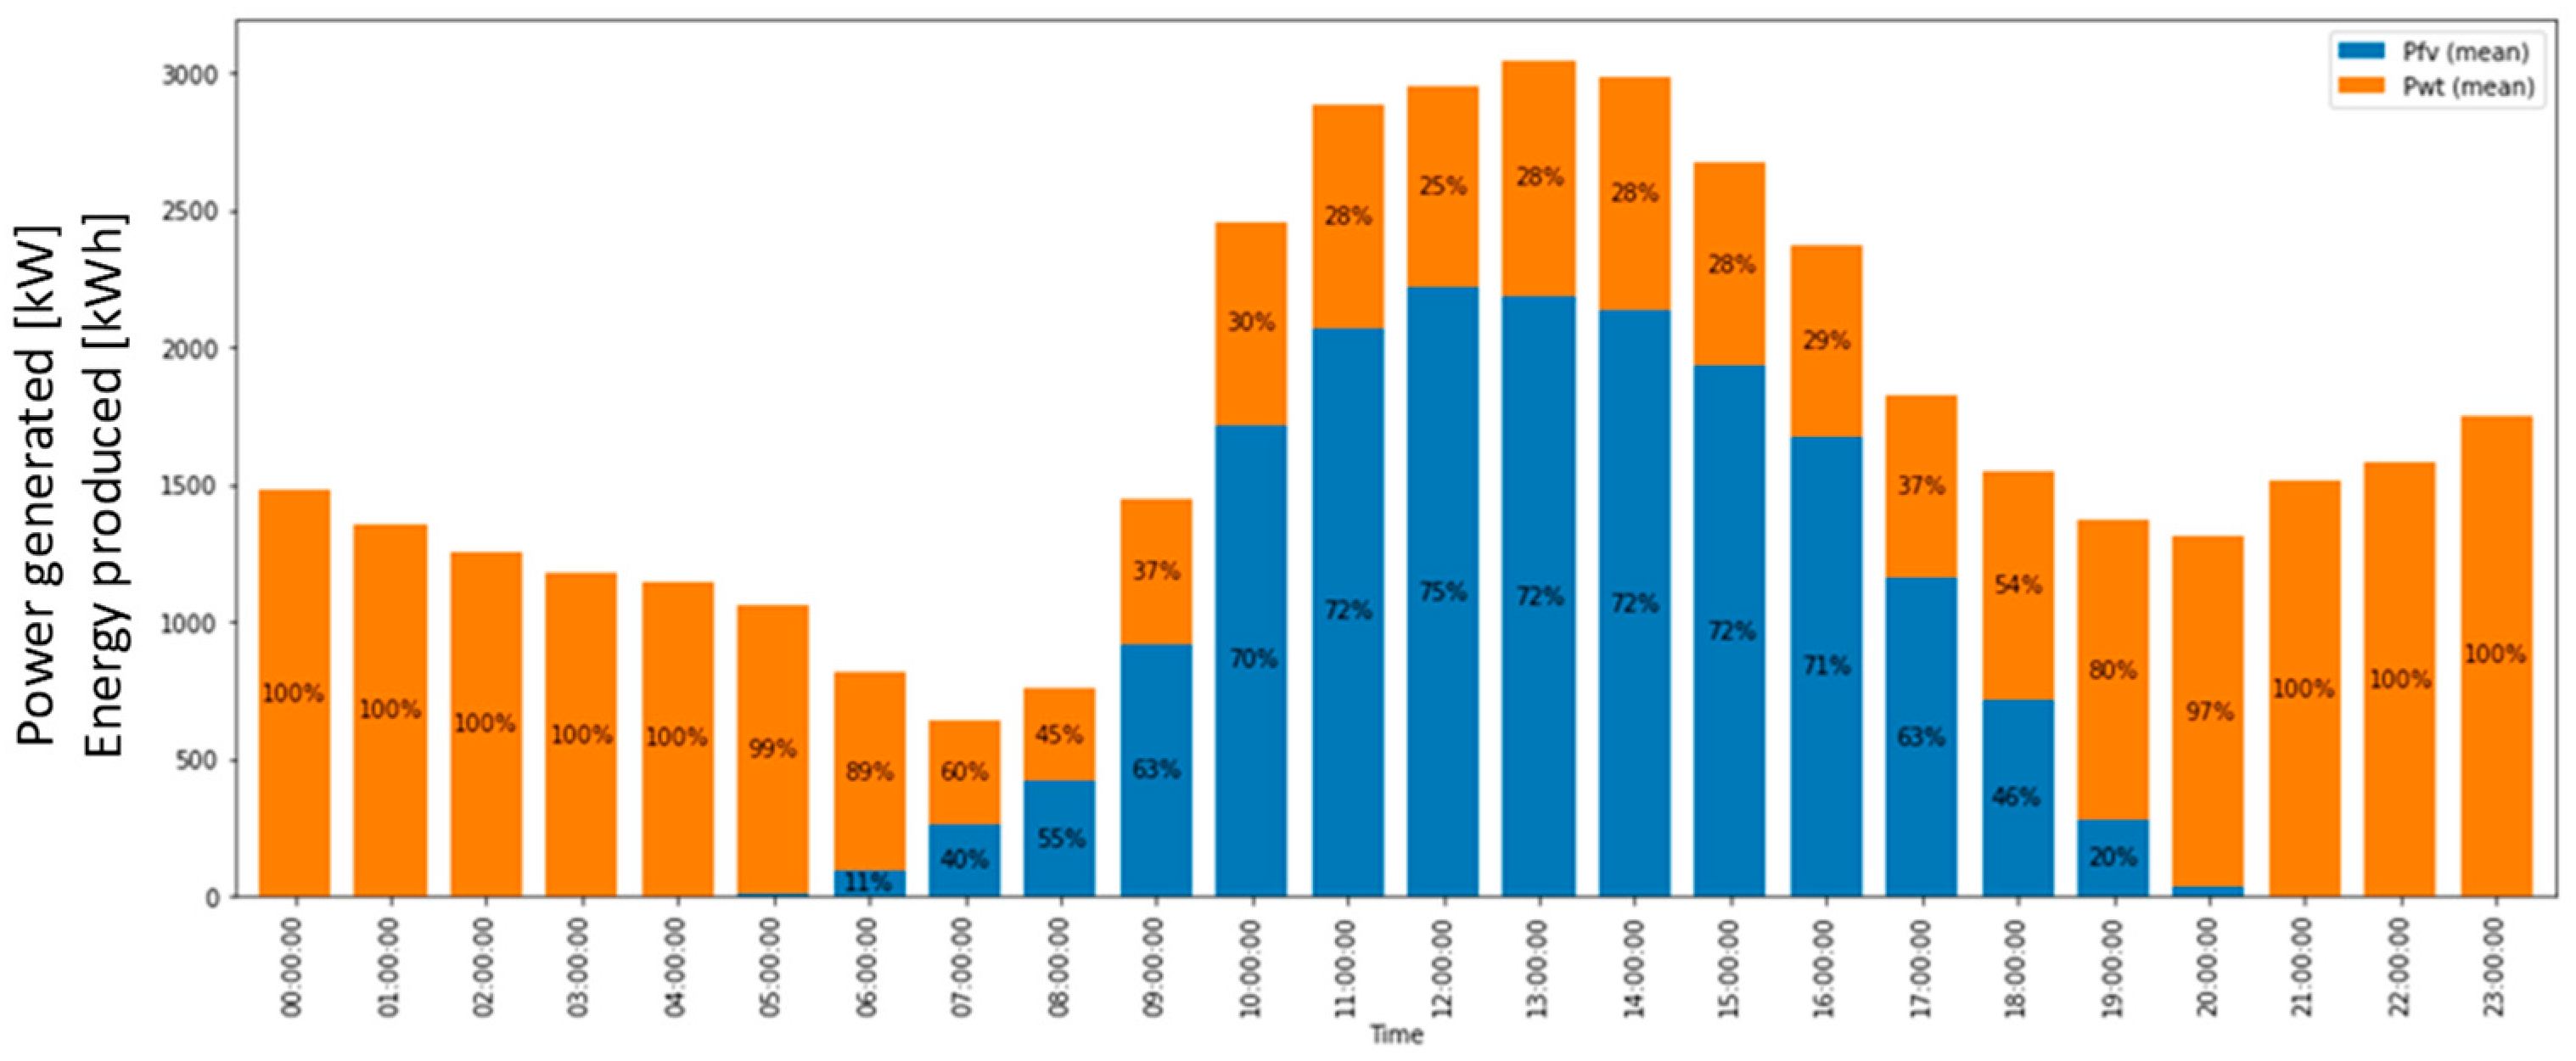
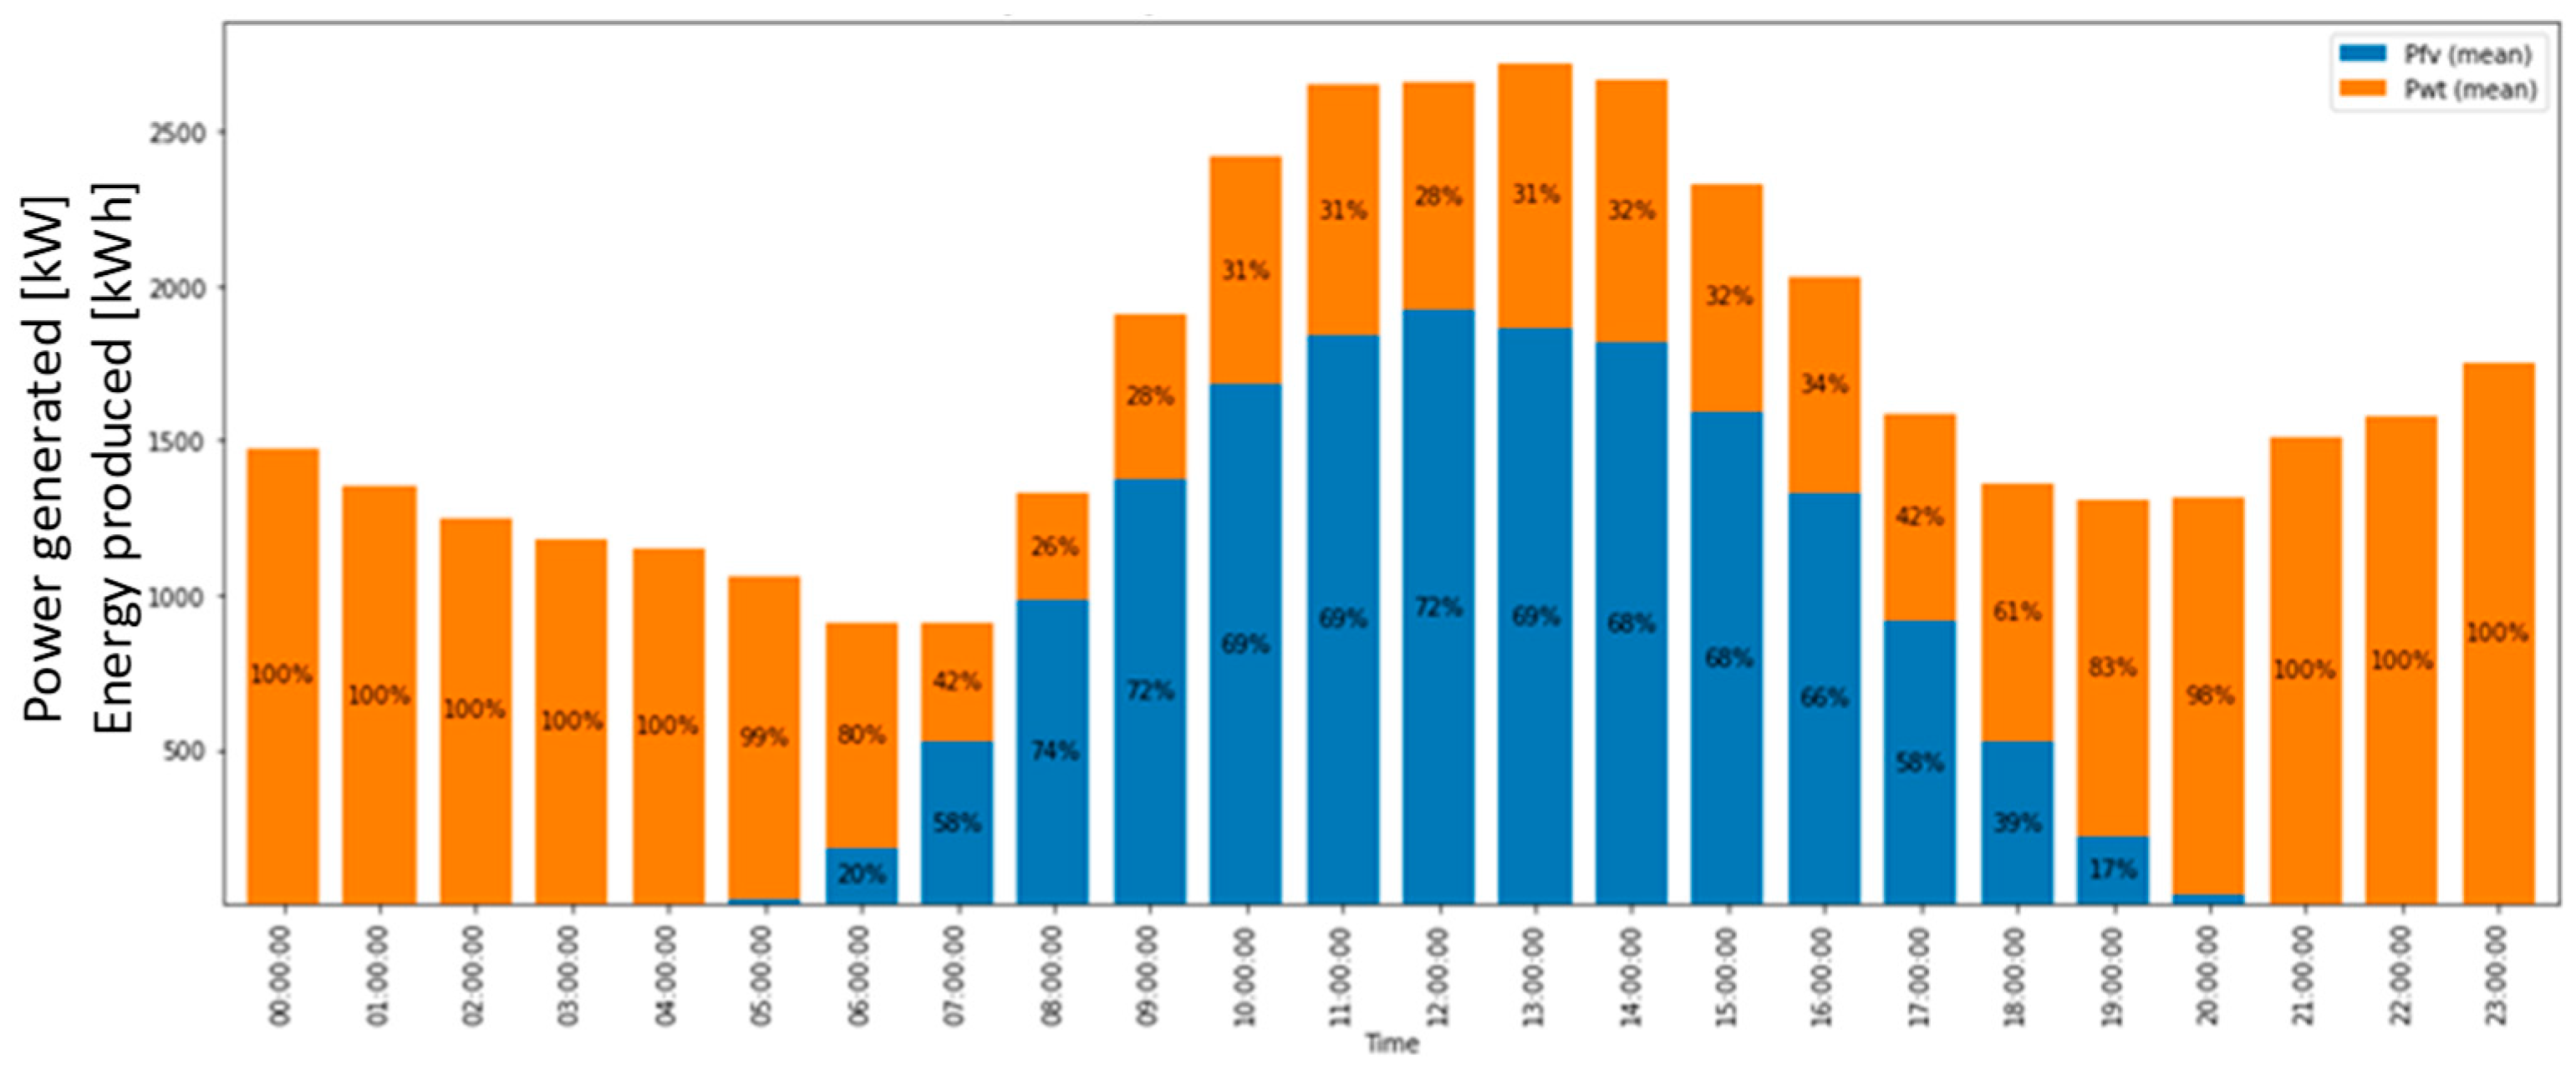
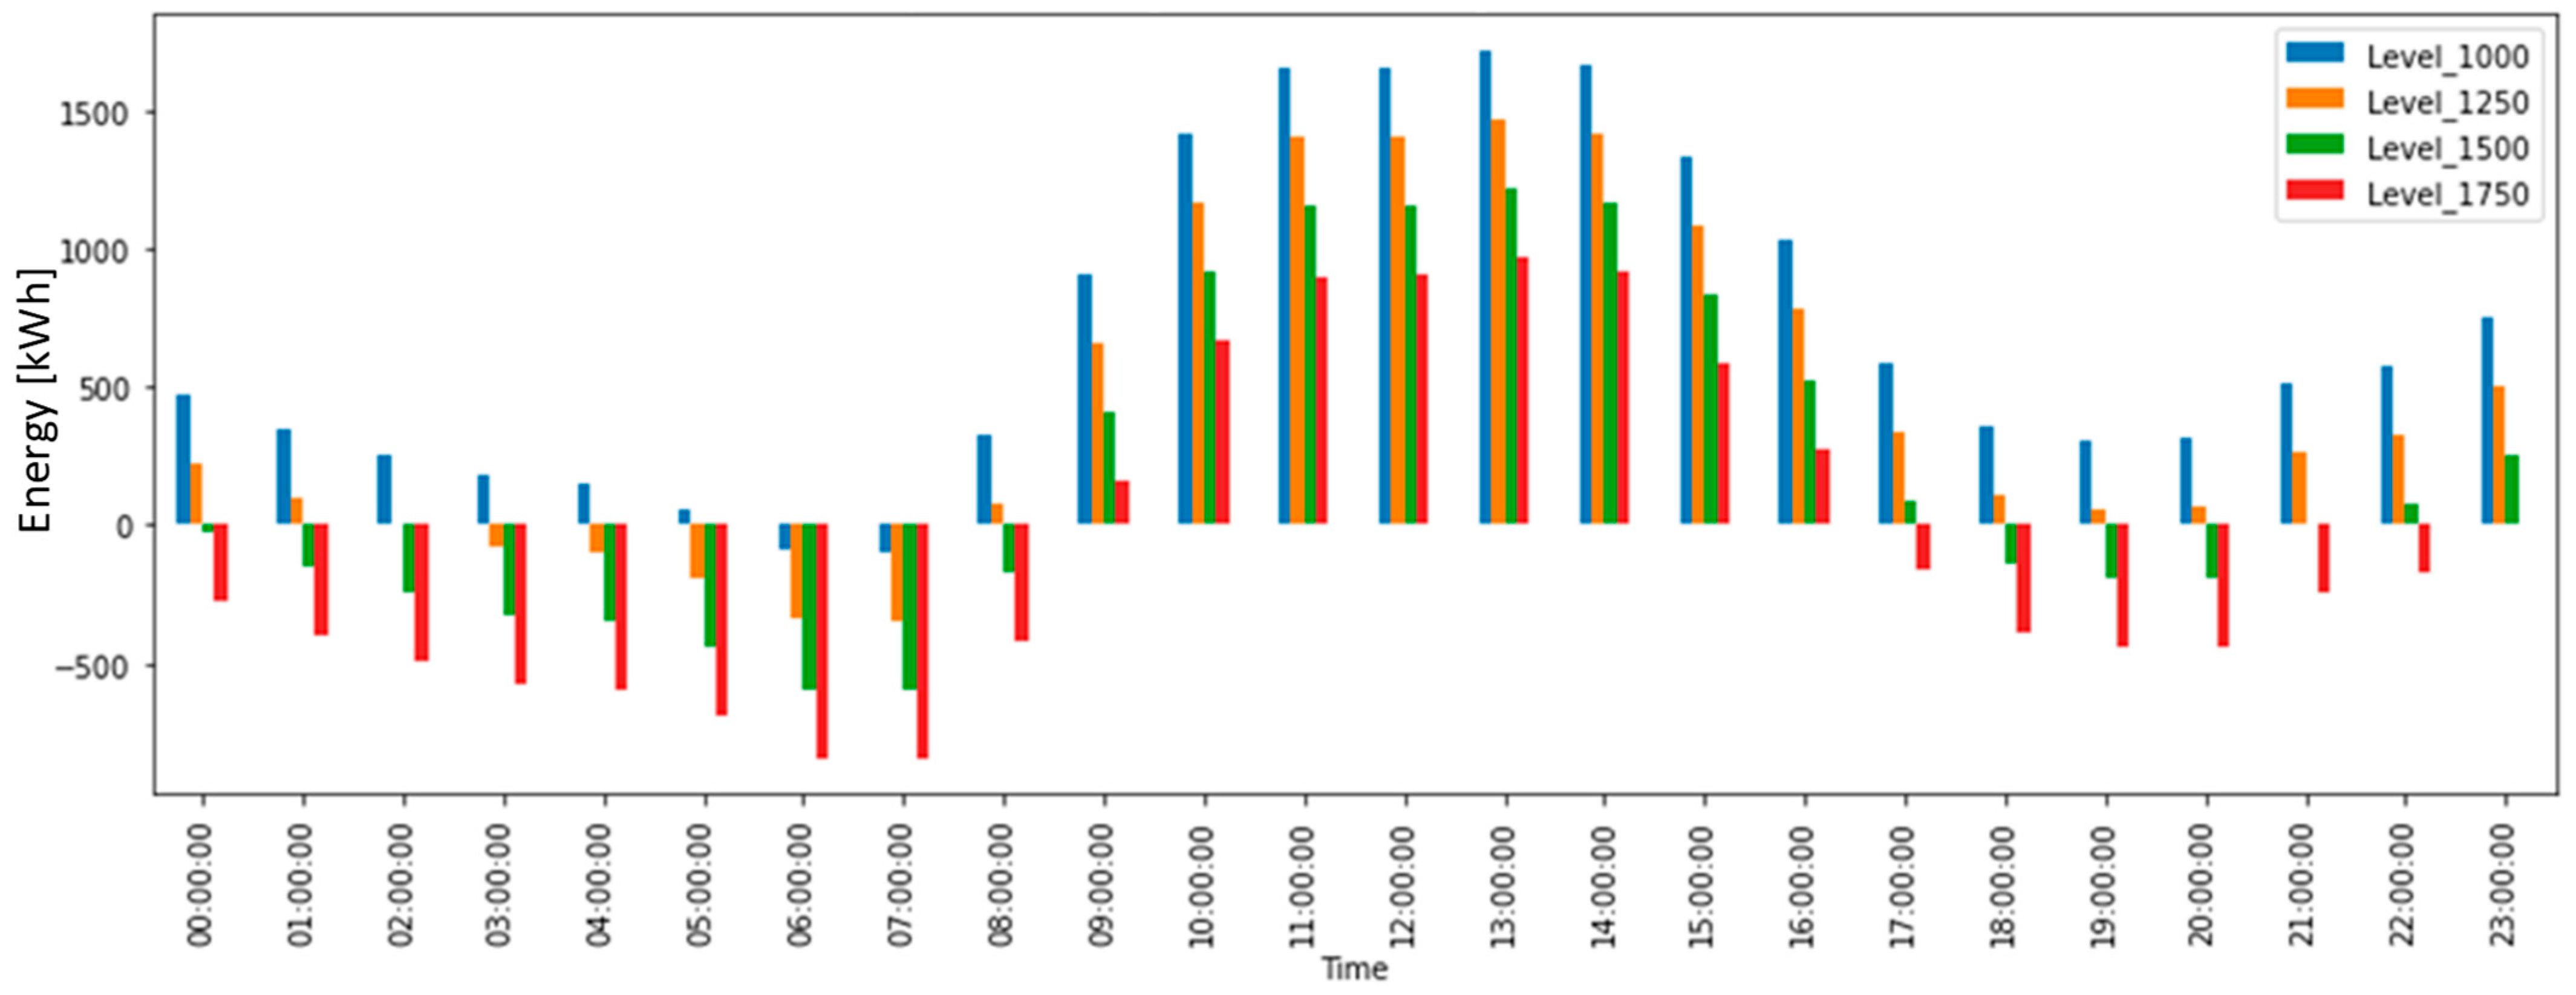
  • The orientation of photovoltaic panels in the east–west direction significantly affects the amount of energy produced in individual hourly intervals compared to the orientation of the panels to the south. As a result of the orientation of the panels in the east–west direction, a significant increase in the share of energy from the photovoltaic system in the energy mix was observed in the hourly interval from 6:00 to 9:00 and a slight decrease in the remaining hours. However, it is worth noting that the hourly interval of the increase in production falls on the morning peak hours, when the cost of energy drawn from the power grid is very high.
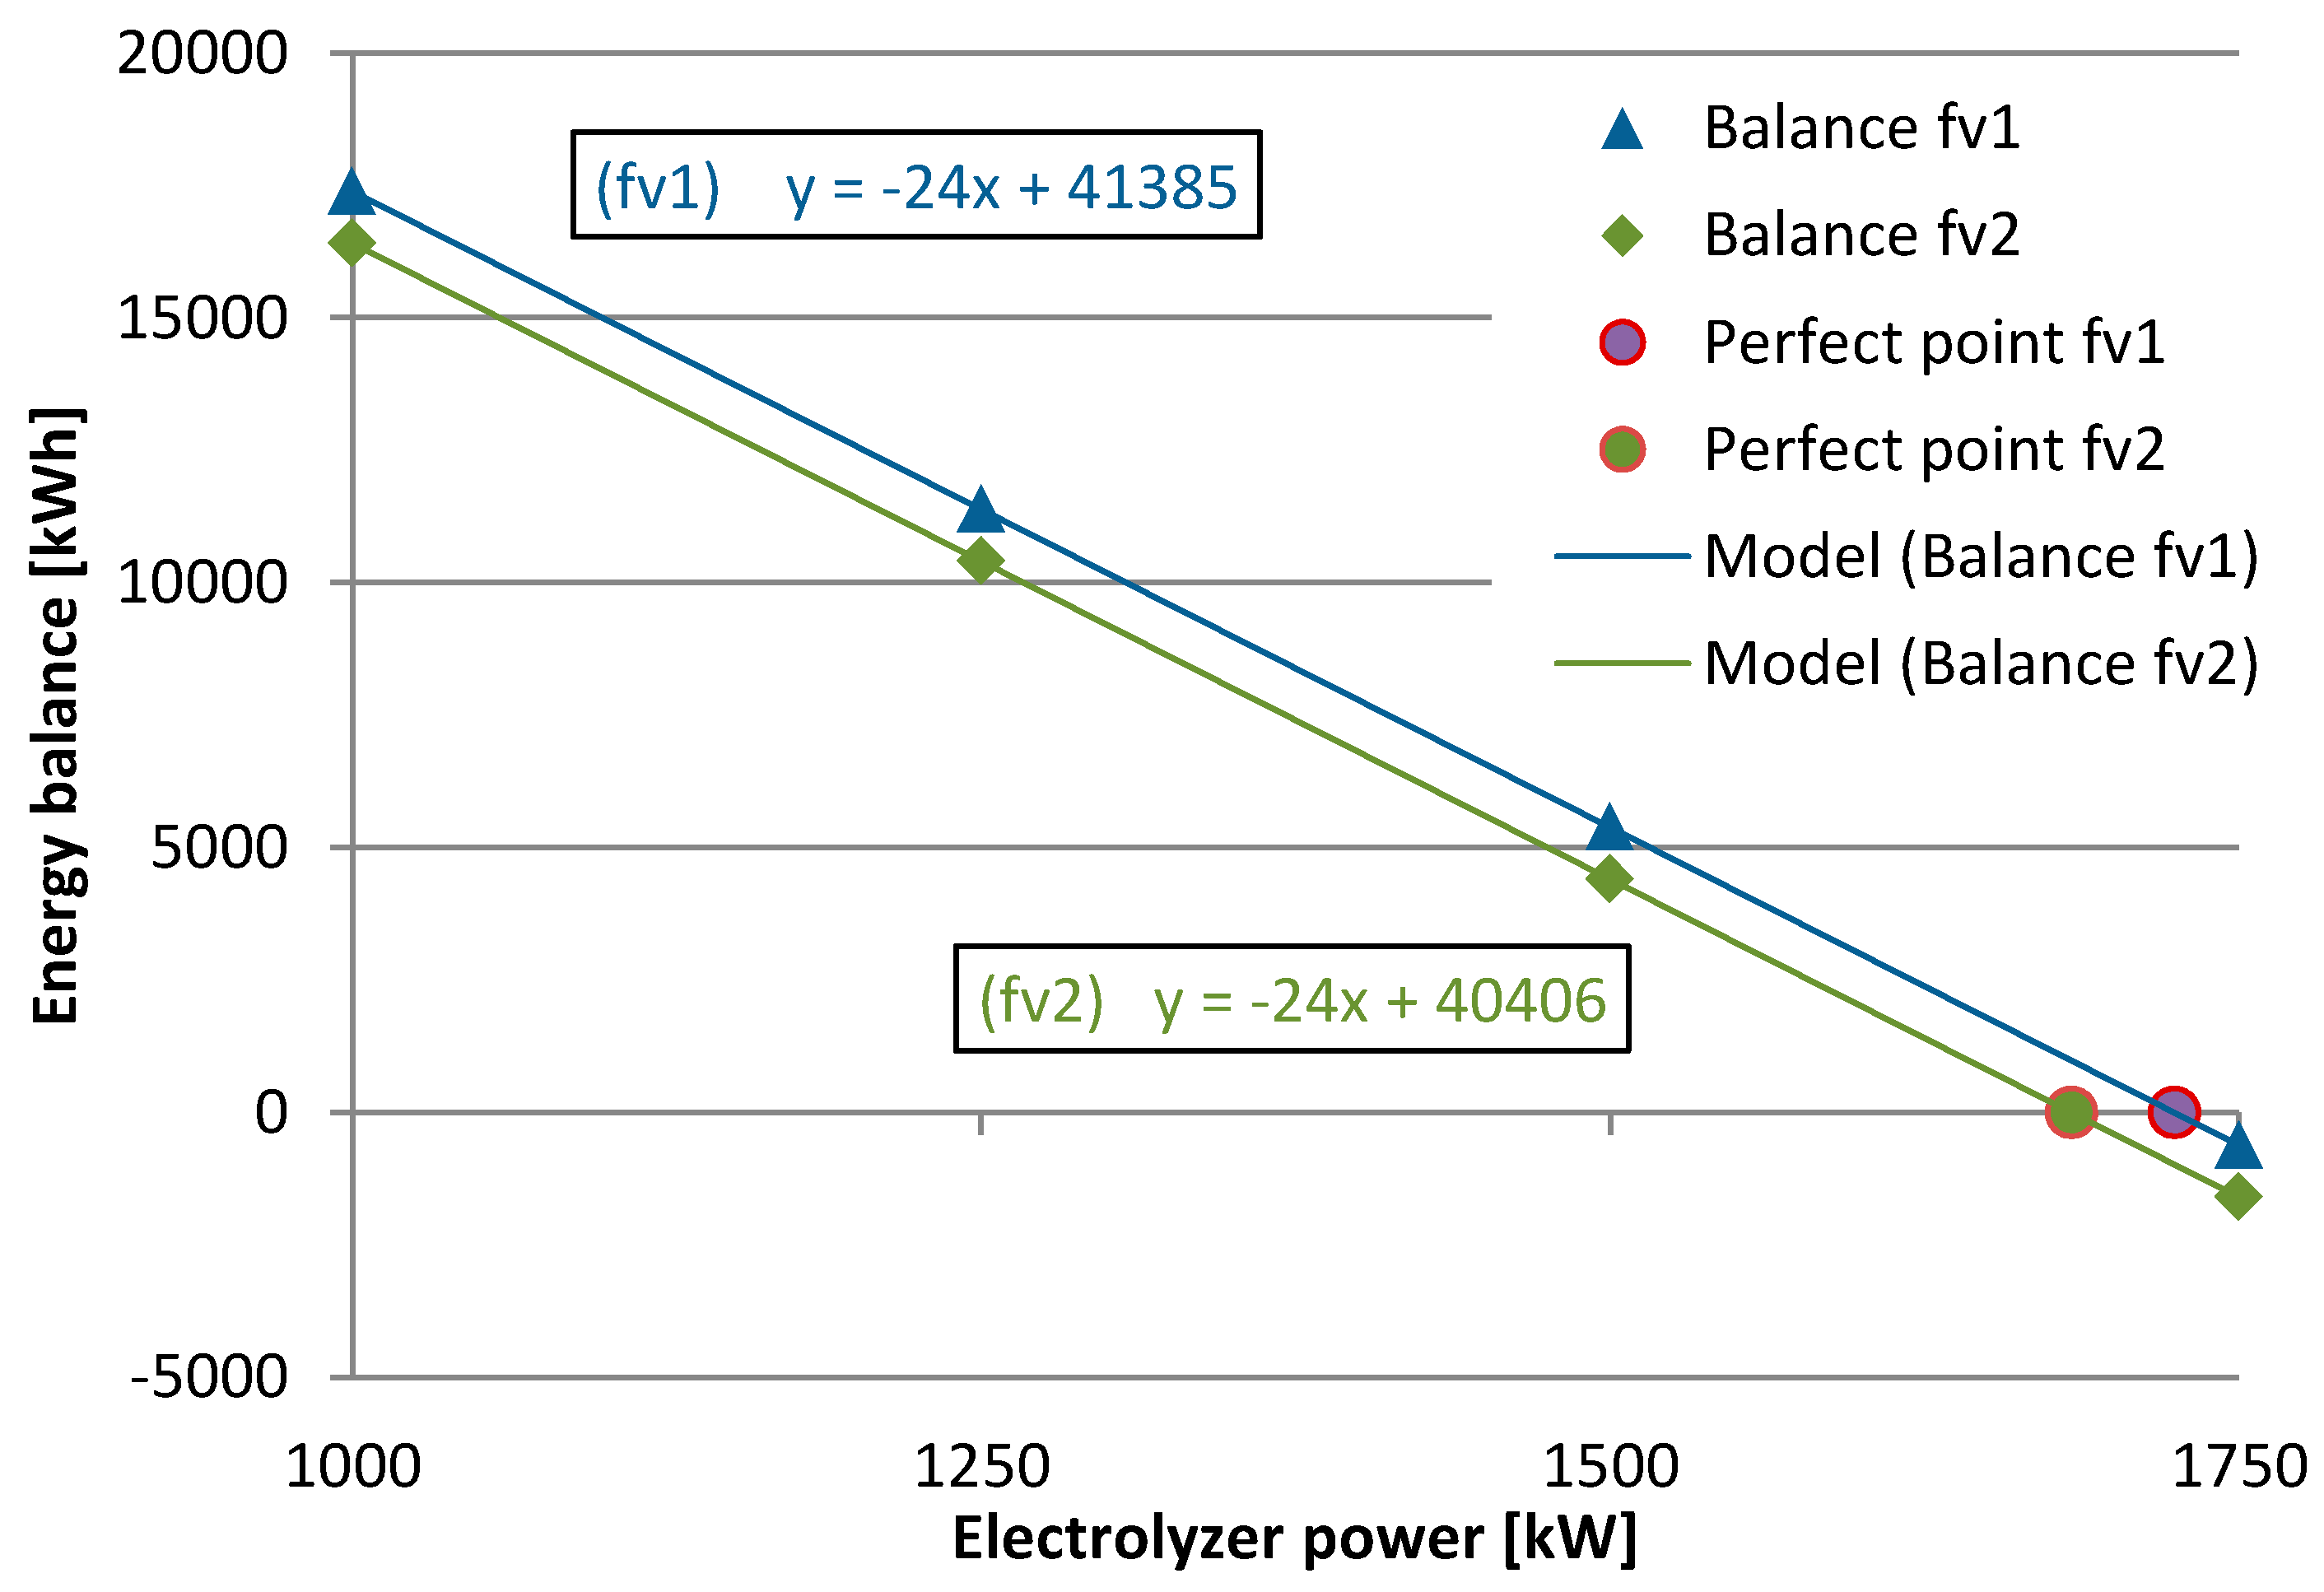
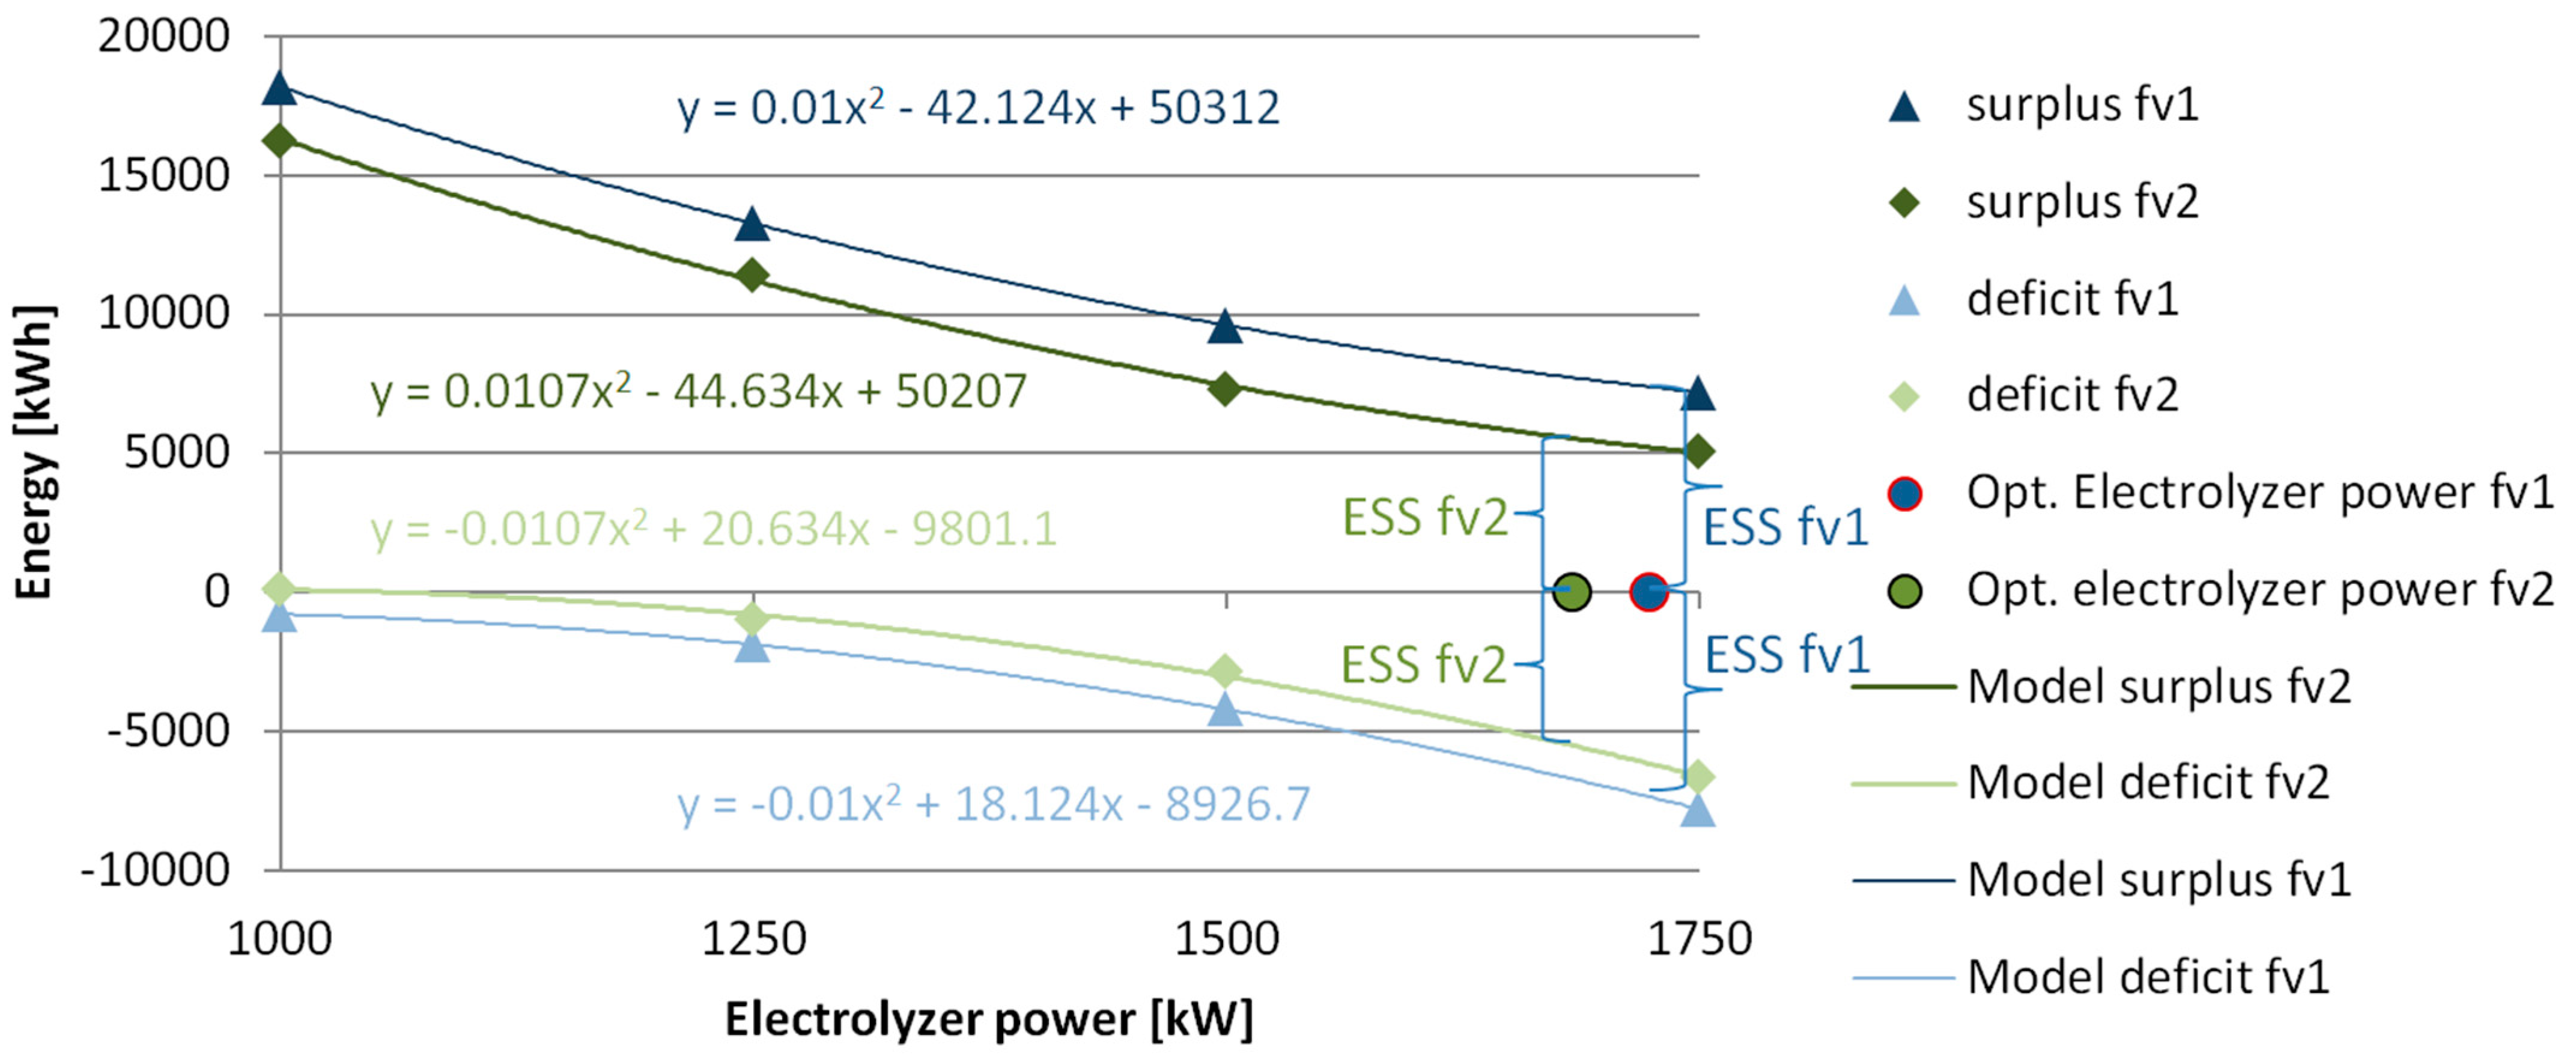
  • As a result of the orientation of the panels in the east–west direction, the power of the powered electrolyzers needed for perfect system balancing was reduced by less than 2.5%. This will reduce the production of green hydrogen by less than 1 kg per day. However, as a result of the orientation of the panels in the east–west direction, better energy balancing in the system was achieved, and the required energy storage system was reduced by over 27% from 7409 kWh to 5391 kWh. In this way, the thesis put forward at the beginning of this article that a structural influence on the construction and performance of photovoltaic systems is possible, having a very large impact on the power balancing of the entire system and contributing to the reduction in the capacity of the energy storage system, was positively verified. This means that it is possible to design the performance of the photovoltaic–wind mix for the production of low-emission hydrogen.
According to the authors, in the future, the presented analyses should be extended to include economic calculations. By assigning the cost of energy drawn from the network and energy returned to the network by the energy mix to individual time intervals, specific amounts related to earning on effective balancing of the energy network can be obtained. According to the applied calculation algorithm, it is worth performing the analyses for all months of the year, because the article made calculations for only one month of the year.

Author Contributions

Conceptualization, A.M. (Arkadiusz Małek) and A.M. (Andrzej Marciniak); methodology, A.M. (Andrzej Marciniak); software, A.M. (Andrzej Marciniak); validation, A.M. (Arkadiusz Małek), A.M. (Andrzej Marciniak) and A.D.; formal analysis, A.M. (Andrzej Marciniak); investigation, A.M. (Arkadiusz Małek); resources, A.M. (Arkadiusz Małek), T.S.; data curation, A.D.; writing—original draft preparation, A.M. (Arkadiusz Małek) and A.D., T.S.; writing—review and editing, A.M. (Arkadiusz Małek), A.D. and T.S.; visualization, A.M. (Andrzej Marciniak); supervision, A.M. (Arkadiusz Małek), A.D. and T.S.; project administration, A.M. (Arkadiusz Małek) and A.D.; funding acquisition, A.D. All authors have read and agreed to the published version of the manuscript.

Funding

This research received no external funding.

Data Availability Statement

The original contributions presented in this study are included in the article; further inquiries can be directed to the corresponding author.

Conflicts of Interest

The authors declare no conflicts of interest.

References

  1. Hoody, P.; Chiasson, A.; Brecha, R.J. The Transition to a Renewable Energy Electric Grid in the Caribbean Island Nation of Antigua and Barbuda. Energies 2023, 16, 6206. [Google Scholar] [CrossRef]
  2. Lian, J.; Fu, Q.; Cui, L.; Liu, R.; Guo, B. Offshore Renewable Energy. J. Mar. Sci. Eng. 2024, 12, 749. [Google Scholar] [CrossRef]
  3. Qiu, Z.; Tian, Y.; Luo, Y.; Gu, T.; Liu, H. Wind and Photovoltaic Power Generation Forecasting for Virtual Power Plants Based on the Fusion of Improved K-Means Cluster Analysis and Deep Learning. Sustainability 2024, 16, 10740. [Google Scholar] [CrossRef]
  4. Seward, W.; Chi, L.; Qadrdan, M.; Allahham, A.; Alawasa, K. Sizing, economic and reliability analysis of photovoltaics and energy storage for an off-grid power system in Jordan. IET Energy Syst. Integr. 2023, 5, 393–404. [Google Scholar] [CrossRef]
  5. Gryniewicz-Jaworska, M. Analysis of the Selection of Compensation Devices Determining the Reactive Power Balance of Wind Farms. Adv. Sci. Technol. Res. J. 2020, 14, 30–36. [Google Scholar] [CrossRef]
  6. Gryniewicz-Jaworska, M. Application of Heuristic Optimization for the Selection of Parameters of the Generation System and Reactive Power Consumption of Wind Farms. Adv. Sci. Technol. Res. J. 2020, 14, 9–14. [Google Scholar] [CrossRef]
  7. Dolge, K.; Blumberga, D. Transitioning to Clean Energy: A Comprehensive Analysis of Renewable Electricity Generation in the EU-27. Energies 2023, 16, 6415. [Google Scholar] [CrossRef]
  8. Małek, A.; Dudziak, A.; Caban, J.; Matijošius, J. Probabilistic Analysis of Low-Emission Hydro-gen Production from a Photovoltaic Carport. Appl. Sci. 2024, 14, 9531. [Google Scholar] [CrossRef]
  9. Małek, A.; Marciniak, A.; Bednarczyk, T. Probabilistic Analysis of Electricity Production from a Photovoltaic–Wind Energy Mix for Sustainable Transport Needs. Sustainability 2024, 16, 10164. [Google Scholar] [CrossRef]
  10. Li, N.; Lukszo, Z.; Schmitz, J. An approach for sizing a PV–battery–electrolyzer–fuel cell energy system: A case study at a field lab. Renew. Sustain. Energy Rev. 2023, 181, 113308. [Google Scholar] [CrossRef]
  11. Burian, O.; Dančová, P. Compressed Air Energy Storage (CAES) and Liquid Air Energy Storage (LAES) Technologies—A Comparison Review of Technology Possibilities. Processes 2023, 11, 3061. [Google Scholar] [CrossRef]
  12. Loza, B.; Minchala, L.I.; Ochoa-Correa, D.; Martinez, S. Grid-Friendly Integration of Wind Energy: A Review of Power Forecasting and Frequency Control Techniques. Sustainability 2024, 16, 9535. [Google Scholar] [CrossRef]
  13. Clifton, A.; Kilcher, L.; Lundquist, J.K.; Fleming, P. Using machine learning to predict wind tur-bine power output. Environ. Res. Lett. 2013, 8, 024009. [Google Scholar] [CrossRef]
  14. Güven, A.F.; Yücel, E. Sustainable energy integration and optimization in microgrids: Enhancing efficiency with electric vehicle charging solutions. Electr. Eng. 2024. [Google Scholar] [CrossRef]
  15. Tsai, W.-C.; Hong, C.-M.; Tu, C.-S.; Lin, W.-M.; Chen, C.-H. A Review of Modern Wind Power Generation Forecasting Technologies. Sustainability 2023, 15, 10757. [Google Scholar] [CrossRef]
  16. Jency, W.G.; Judith, J.E. Homogenized Point Mutual Information and Deep Quantum Reinforced Wind Power Prediction. Int. Trans. Electr. Energy Syst. 2022, 2022, 3686786. [Google Scholar] [CrossRef]
  17. Gil-García, I.C.; García-Cascales, M.S.; Fernández-Guillamón, A.; Molina-García, A. Categorization and Analysis of Relevant Factors for Optimal Locations in Onshore and Offshore Wind Power Plants: A Taxonomic Review. J. Mar. Sci. Eng. 2019, 7, 391. [Google Scholar] [CrossRef]
  18. Möller, M.C.; Krauter, S. Investigation of Different Load Characteristics, Component Dimensioning, and System Scaling for the Optimized Design of a Hybrid Hydrogen-Based PV Energy System. Hydrogen 2023, 4, 408–433. [Google Scholar] [CrossRef]
  19. Olczak, P.; Matuszewska, D. Energy Storage Potential Needed at the National Grid Scale (Poland) in Order to Stabilize Daily Electricity Production from Fossil Fuels and Nuclear Power. Energies 2023, 16, 6054. [Google Scholar] [CrossRef]
  20. Lee, Y.H.; Jeong, I.W.; Sung, T.H. An Assessment of the Optimal Capacity and an Economic Evaluation of a Sustainable Photovoltaic Energy System in Korea. Sustainability 2021, 13, 12264. [Google Scholar] [CrossRef]
  21. Aldosari, O.; Ali, Z.M.; Abdel Aleem, S.H.E.; Mostafa, M.H. Optimizing microgrid performance: Strategic integration of electric vehicle charging with renewable energy and storage systems for total operation cost and emissions minimization. PLoS ONE 2024, 19, e0307810. [Google Scholar] [CrossRef] [PubMed]
  22. Li, Y.; Dong, Z. Coordinated optimization of source-grid-load-storage for wind power grid-connected and mobile energy storage characteristics of electric vehicles. IET Gener. Transm. Distrib. 2024, 18, 1528–1547. [Google Scholar] [CrossRef]
  23. Li, D.; Shao, Z.; Huang, W.; Zhang, B.; He, J.; Liu, X. Optimal power–heat–carbon scheduling strategy for interconnected heterogeneous multi-microgrid considering hydrogen fuel cell vehicles. PLoS ONE 2024, 19, e0301333. [Google Scholar] [CrossRef] [PubMed]
  24. Available online: https://pulawy.grupaazoty.com/ (accessed on 20 December 2024).
  25. Di Micco, S.; Romano, F.; Jannelli, E.; Perna, A.; Minutillo, M. Techno-economic analysis of a multienergy system for the co-production of green hydrogen, renewable electricity and heat. Int. J. Hydrogen Energy. 2023, 48, 31457–31467. [Google Scholar] [CrossRef]
  26. Perna, A.; Jannelli, E.; Di Micco, S.; Romano, F.; Minutillo, M. Designing, sizing and economic feasibility of a green hydrogen supply chain for maritime transportation. Energy Convers. Management. 2023, 278, 116702. [Google Scholar] [CrossRef]
  27. Duan, L.; Taylor, G.; Lai, C.S. Solar–Hydrogen-Storage Integrated Electric Vehicle Charging Stations with Demand-Side Management and Social Welfare Maximization. World Electr. Veh. J. 2024, 15, 337. [Google Scholar] [CrossRef]
  28. Available online: https://lpnt.pl/biuletyn/biuletyn-lpnt-4-2023/ (accessed on 20 December 2024).
  29. Afanasiev, A.; Kandinskaia, O.; Eminidou, S.; Sousanis, A. Hydrogen Valley in Cyprus: Insights and Strategies for Citizen Engagement. Sustainability 2025, 17, 804. [Google Scholar] [CrossRef]
  30. Lu, Z.; Li, Y.; Zhuo, G.; Xu, C. Configuration Optimization of Hydrogen-Based Multi-Microgrid Systems under Electricity Market Trading and Different Hydrogen Production Strategies. Sustainability 2023, 15, 6753. [Google Scholar] [CrossRef]
  31. Janocha, M.J.; Ong, M.C.; Lee, C.F.; Chen, K.; Ye, N. Reference Power Cable Models for Floating Offshore Wind Applications. Sustainability 2024, 16, 2899. [Google Scholar] [CrossRef]
  32. Bartolucci, L.; Cennamo, E.; Cordiner, S.; Mulone, V.; Pasqualini, F.; Tatangelo, C. Hydrogen Fuel Cell Hybrid Electric Vehicles: The Impact of Commercial Vehicle Fleets on the Penetration of Renewable Energy Sources. J. Phys. Conf. Ser. 2022, 2385, 012079. [Google Scholar] [CrossRef]
  33. Shahabuddin, M.; Rhamdhani, M.A.; Brooks, G.A. Technoeconomic Analysis for Green Hydrogen in Terms of Production, Com-pression, Transportation and Storage Considering the Australian Perspective. Processes 2023, 11, 2196. [Google Scholar] [CrossRef]
  34. Konrad, J.; Bernt, A.O.; Hofmann, P. Life cycle assessment of MHP (Mobile Hydrogen Powersupply), an off-grid system to charge battery electric vehicles. Int. J. Life Cycle Assess. 2023, 28, 304–319. [Google Scholar] [CrossRef]
  35. Villena-Ruiz, R.; Honrubia-Escribano, A.; Gómez-Lázaro, E. Solar PV and Wind Power as the Core of the Energy Transition: Joint Integration and Hybridization with Energy Storage Systems. Energies 2023, 16, 2917. [Google Scholar] [CrossRef]
  36. Babaremu, K.; Olumba, N.; Chris-Okoro, I.; Chuckwuma, K.; Jen, T.-C.; Oladijo, O.; Akinlabi, E. Overview of Solar–Wind Hy-brid Products: Prominent Challenges and Possible Solutions. Energies 2022, 15, 6014. [Google Scholar] [CrossRef]
  37. Nordström, H.; Söder, L.; Flynn, D.; Matevosyan, J.; Kiviluoma, J.; Holttinen, H.; Vrana, T.K.; van der Welle, A.; Mo-rales-España, G.; Pudjianto, D.; et al. Strategies for Continuous Balancing in Future Power Systems with High Wind and Solar Shares. Energies 2023, 16, 5249. [Google Scholar] [CrossRef]
  38. Shavolkin, O.; Shvedchykova, I.; Kolcun, M.; Medved’, D. Improvement of a Hybrid Solar-Wind System for Self-Consumption of a Local Object with Control of the Power Consumed from the Grid. Energies 2023, 16, 5851. [Google Scholar] [CrossRef]
  39. Fang, W.; Yang, C.; Liu, D.; Huang, Q.; Ming, B.; Cheng, L.; Wang, L.; Feng, G.; Shang, J. Assessment of Wind and Solar Power Potential and Their Temporal Complementarity in China’s Northwestern Provinces: Insights from ERA5 Reanalysis. Energies 2023, 16, 7109. [Google Scholar] [CrossRef]
  40. Nefabas, K.L.; Mamo, M.; Söder, L. Analysis of System Balancing and Wind Power Curtailment Challenges in the Ethiopian Power System under Different Scenarios. Sustainability 2023, 15, 11400. [Google Scholar] [CrossRef]
  41. Boubii, C.; Kafazi, I.E.; Bannari, R.; El Bhiri, B.; Bossoufi, B.; Kotb, H.; AboRas, K.M.; Emara, A.; Nasiri, B. Synergizing Wind and Solar Power: An Advanced Control System for Grid Stability. Sustainability 2024, 16, 815. [Google Scholar] [CrossRef]
  42. Abdelkader, S.; Amissah, J.; Abdel-Rahim, O. Virtual power plants: An in-depth analysis of their advancements and im-portance as crucial players in modern power systems. Energy Sustain. Soc. 2024, 14, 52. [Google Scholar] [CrossRef]
  43. Singh, A.R.; Kumar, R.S.; Bajaj, M.; Khadse, C.B. Machine learning-based energy management and power forecasting in grid-connected microgrids with multiple distributed energy sources. Sci. Rep. 2024, 14, 19207. [Google Scholar] [CrossRef] [PubMed]
  44. Dai, S.; Shen, P.; Deng, W.; Yu, Q. Hydrogen Energy in Electrical Power Systems: A Review and Future Outlook. Electronics 2024, 13, 3370. [Google Scholar] [CrossRef]
  45. Cai, X.; Wang, Y.; Xu, B.; Feng, J. Performance and Effect of Load Mitigation of a Trailing-Edge Flap in a Large-Scale Offshore Wind Turbine. J. Mar. Sci. Eng. 2020, 8, 72. [Google Scholar] [CrossRef]
  46. Available online: https://solargis.com/resources/free-maps-and-gis-data?locality=poland.Solarresourcemap©2021Solargis (accessed on 7 February 2025).
  47. Tumse, S.; Bilgili, M.; Yildirim, A.; Sahin, B. Comparative Analysis of Global Onshore and Offshore Wind Energy Characteristics and Potentials. Sustainability 2024, 16, 6614. [Google Scholar] [CrossRef]
  48. Das, P.; Amin, S.M.M.; Lipu, M.S.H.; Urooj, S.; Ashique, R.H.; Al Mansur, A.; Islam, M.T. Assessment of Barriers to Wind Energy Development Using Analytic Hierarchy Process. Sustainability 2023, 15, 15774. [Google Scholar] [CrossRef]
  49. Pender, K.; Bacharoudis, K.; Romoli, F.; Greaves, P.; Fuller, J. Feasibility of Natural Fibre Usage for Wind Turbine Blade Com-ponents: A Structural and Environmental Assessment. Sustainability 2024, 16, 5533. [Google Scholar] [CrossRef]
  50. Bošnjaković, M.; Katinić, M.; Santa, R.; Marić, D. Wind Turbine Technology Trends. Appl. Sci. 2022, 12, 8653. [Google Scholar] [CrossRef]
  51. Liang, X.; Li, Z.; Han, X.; Fu, S.; Zhu, W.; Pu, T.; Sun, Z.; Yang, H.; Shen, W. Study on Aerodynamic Performance and Wake Characteristics of a Floating Offshore Wind Turbine in Wind–Wave Coupling Field. Sustainability 2024, 16, 5324. [Google Scholar] [CrossRef]
  52. Wang, Y.; Xu, C.; Yu, M.; Huang, Z. Lightweight Design of Vibration Control Devices for Offshore Substations Based on Inerters. Sustainability 2024, 16, 3385. [Google Scholar] [CrossRef]
  53. Olczak, P.; Surma, T. Energy Productivity Potential of Offshore Wind in Poland and Cooperation with Onshore Wind Farm. Appl. Sci. 2023, 13, 4258. [Google Scholar] [CrossRef]
  54. Backhus, J.; Rao, A.R.; Venkatraman, C.; Padmanabhan, A.; Kumar, A.V.; Gupta, C. Equipment Health Assessment: Time Series Analysis for Wind Turbine Performance. Appl. Sci. 2024, 14, 3270. [Google Scholar] [CrossRef]
  55. Bošnjaković, M.; Hrkać, F.; Stoić, M.; Hradovi, I. Environmental Impact of Wind Farms. Environments 2024, 11, 257. [Google Scholar] [CrossRef]
  56. Narayanamoorthy, S.; Ramya, L.; Kang, D.; Baleanu, D.; Kureethara, J.V.; Annapoorani, V. A new extension of hesitant fuzzy set: An application to an offshore wind turbine technology selection process. IET Renew. Power Gener. 2021, 15, 2340–2355. [Google Scholar] [CrossRef]
  57. Gkeka-Serpetsidaki, P.; Skiniti, G.; Tournaki, S.; Tsoutsos, T. A Review of the Sustainable Siting of Offshore Wind Farms. Sustainability 2024, 16, 6036. [Google Scholar] [CrossRef]
  58. Kiyoki, S.; Yoshida, S.; Rushdi, M.A. Estimation of Hub Center Loads for Individual Pitch Control for Wind Turbines Based on Tower Loads and Machine Learning. Electronics 2024, 13, 3648. [Google Scholar] [CrossRef]
  59. Talarek, K.; Knitter-Piątkowska, A.; Garbowski, T. Wind Parks in Poland—New Challenges and Perspectives. Energies 2022, 15, 7004. [Google Scholar] [CrossRef]
  60. Zamanidou, A.; Giannakopoulos, D.; Pappa, D.; Pitsilis, V.; Makropoulos, C.; Manolitsis, K. Day-ahead scheduling of a hybrid renewable energy system based on generation forecasting using a deep-learning approach. Energy Sci. Eng. 2023, 11, 1688–1704. [Google Scholar] [CrossRef]
  61. Fovell, R.G.; Capps, S.B. Sustained Wind Forecasts from the High-Resolution Rapid Refresh Model: Skill Assessment and Bias Mitigation. Atmosphere 2025, 16, 16. [Google Scholar] [CrossRef]
  62. Davis, N.N.; Badger, J.; Hahmann, A.N.; Hansen, B.O.; Mortensen, N.G.; Kelly, M.; Larsén, X.G.; Olsen, B.T.; Floors, R.; Lizcano, G.; et al. The Global Wind Atlas: A high-resolution dataset of climatologies and associated web-based application. Bull. Am. Meteorol. Soc. 2023, 104, E1507–E1525. [Google Scholar] [CrossRef]
  63. Krakauer, N.Y.; Cohan, D.S. Interannual Variability and Seasonal Predictability of Wind and Solar Resources. Resources 2017, 6, 29. [Google Scholar] [CrossRef]
  64. Ma, B.; Zheng, J.; Xian, Z.; Wang, B.; Ma, H. Optimal Operation Strategy for Wind–Photovoltaic Power-Based Hydrogen Production Systems Considering Electrolyzer Start-Up Characteristics. Processes 2024, 12, 1756. [Google Scholar] [CrossRef]
  65. Lyu, S.; Miu, H.; Yuan, X.; Wang, M.; Zeng, F.; Pan, Y. Electric Vehicle Charging Guidance Strategy with Dual-Incentive Mechanisms for Charging and Discharging. Electronics 2024, 13, 4676. [Google Scholar] [CrossRef]
Figure 1. Components of the photovoltaic and wind energy mix located in the Lublin region in Poland.
Energies 18 00846 g001
Figure 2. Data flow diagram.
Energies 18 00846 g002
Figure 3. Solar exposure conditions in Poland and their impact on the performance of photovoltaic systems [46].
Energies 18 00846 g003
Figure 4. Time series of power generated every 15 min by the photovoltaic systems with different panel mounting orientations during the entire month of May 2024.
Energies 18 00846 g004
Figure 5. Various engineering contexts of panel assembly in photovoltaic systems: (a) photovoltaic panels mounted towards the south; (b) photovoltaic panels mounted in the east–west direction.
Energies 18 00846 g005
Figure 6. Daily course of generated power by photovoltaic systems with different panel mounting directions on 1 May 2024.
Energies 18 00846 g006
Figure 7. Correlation in the generated power by photovoltaic systems with different orientation of photovoltaic panels.
Energies 18 00846 g007
Figure 8. The course of the mean hourly power generated by the fv2 photovoltaic system during the entire month of May 2024.
Energies 18 00846 g008
Figure 9. Wind conditions in the Lublin region in Poland [62].
Energies 18 00846 g009
Figure 10. Time series of power generated by a wind turbine during the month of May [9].
Energies 18 00846 g010
Figure 11. The course of the mean hourly power generated by the 3.45 MW wind turbine during the entire sample month of May [9].
Energies 18 00846 g011
Figure 12. Mean hourly power generated by a 3 MWp peak east–west oriented photovoltaic system and a 3.45 MW wind turbine and their mix in May 2024.
Energies 18 00846 g012
Figure 13. Hourly values of the power generated by the mix of a 3 MWp peak east–west-oriented PV system and a 3.45 MW wind turbine in box plot form.
Energies 18 00846 g013
Figure 14. Share in the energy mix of mean hourly values of power generated by a 3 MWp peak photovoltaic system oriented towards the south (fv1) and a 3.45 MW wind turbine [9].
Energies 18 00846 g014
Figure 15. Share in the energy mix of mean hourly values of power generated by a 3 MWp peak photovoltaic system oriented east–west (fv2) and a 3.45 MW wind turbine.
Energies 18 00846 g015
Figure 16. Share in the energy mix of mean hourly values of power generated by a 3 MWp peak photovoltaic system oriented east–west (fv2) and a 3.45 MW wind turbine—standardized presentation in the range 0–1.
Energies 18 00846 g016
Figure 17. Probability of generating individual power levels from a solar–wind mix.
Energies 18 00846 g017
Figure 18. Excess and deficit energy production from the mix on an hourly basis for different electrical load levels.
Energies 18 00846 g018
Figure 19. Balancing characteristics of an energy system powered by a photovoltaic–wind mix for different external load levels.
Energies 18 00846 g019
Figure 20. Characteristics of energy surplus and deficit for individual power levels of hydrogen electrolyzers.
Energies 18 00846 g020
Table 1. Basic statistics and quantiles for individual renewable energy sources and their combinations.
CountryMeanStdMin10%20%30%40%50%60%70%80%90%95%99%Max
Pfv24.00701.58767.690.000.000.000.0262.59371.26840.461335.101628.421834.471862.381910.591923.91
Pwt24.00981.98381.12340.18571.07713.29738.33815.31853.631082.671184.001308.771499.951567.791713.211753.61
Combined24.001683.56594.34906.091086.541221.411312.261352.761493.211583.531921.282367.062659.172666.062710.452723.47
Table 2. Probability of generating individual power levels from a solar–wind mix.
Time00:0001:0002:0003:0004:0005:0006:0007:0008:0009:0010:0011:0012:0013:0014:0015:0016:0017:0018:0019:0020:0021:0022:0023:00
Level_7500.690.610.580.580.610.550.480.520.971.001.001.001.001.001.001.000.970.970.840.770.680.710.770.77
Level_10000.690.520.520.480.520.350.320.320.871.001.001.001.001.001.001.000.900.840.680.610.580.580.740.77
Level_12500.560.480.420.350.290.260.260.160.390.971.001.001.001.001.000.970.900.650.480.420.480.550.520.68
Level_15000.530.420.420.290.290.230.190.060.230.840.970.971.000.941.000.900.810.480.390.390.450.520.520.61
Level_17750.380.350.320.260.190.190.160.060.130.350.900.900.970.901.000.810.580.390.260.260.290.480.450.48
Table 3. Energy balance for individual levels of generated power from the solar–wind mix.
LevelEnergy Surplus [kWh]Energy Deficit [kWh]Balance
[kWh]
Energy Surplus (Model) [kWh]Energy Surplus (Model) [kWh]
Level_100016,265.17140.3716,273132.916,265.17
Level_125011,380.81−975.2711,133.25−727.3511,380.81
Level_15007271.36−2865.827331−2925.17271.36
Level_17505074.42−6668.884866.25−6460.355074.42
Level_1683.58 5391−5391
Disclaimer/Publisher’s Note: The statements, opinions and data contained in all publications are solely those of the individual author(s) and contributor(s) and not of MDPI and/or the editor(s). MDPI and/or the editor(s) disclaim responsibility for any injury to people or property resulting from any ideas, methods, instructions or products referred to in the content.

