
Preparation and Characterization of Ru-Based Catalyst for Power to Gas Applications

 , , and
Abstract
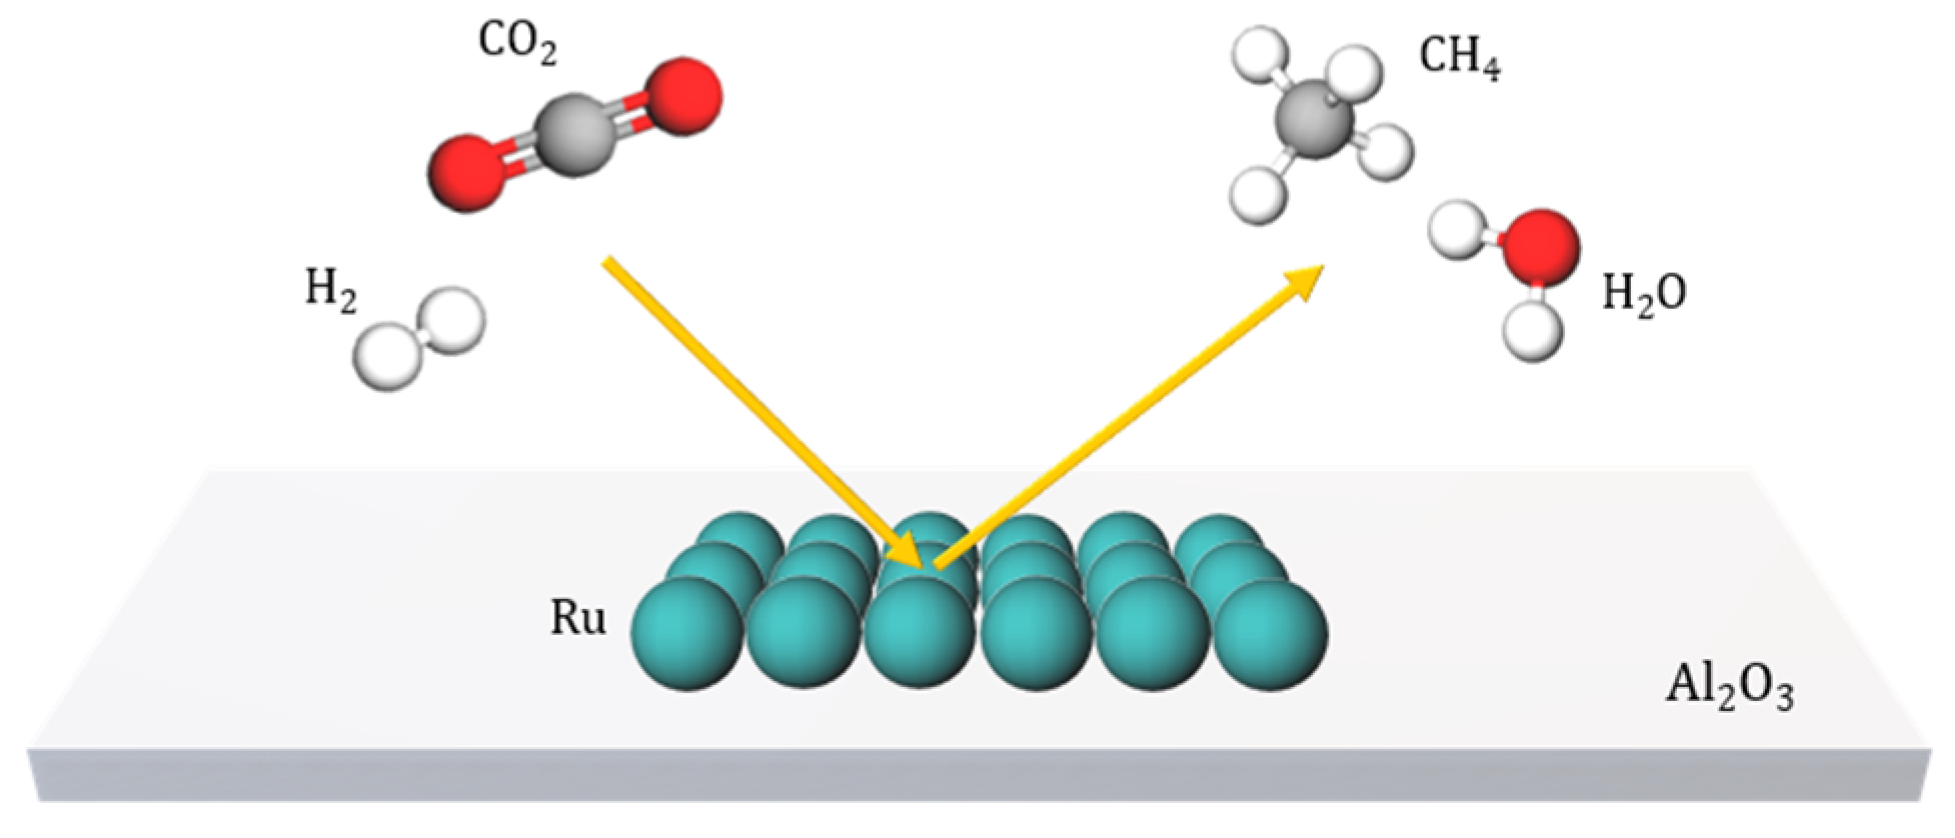
1. Introduction
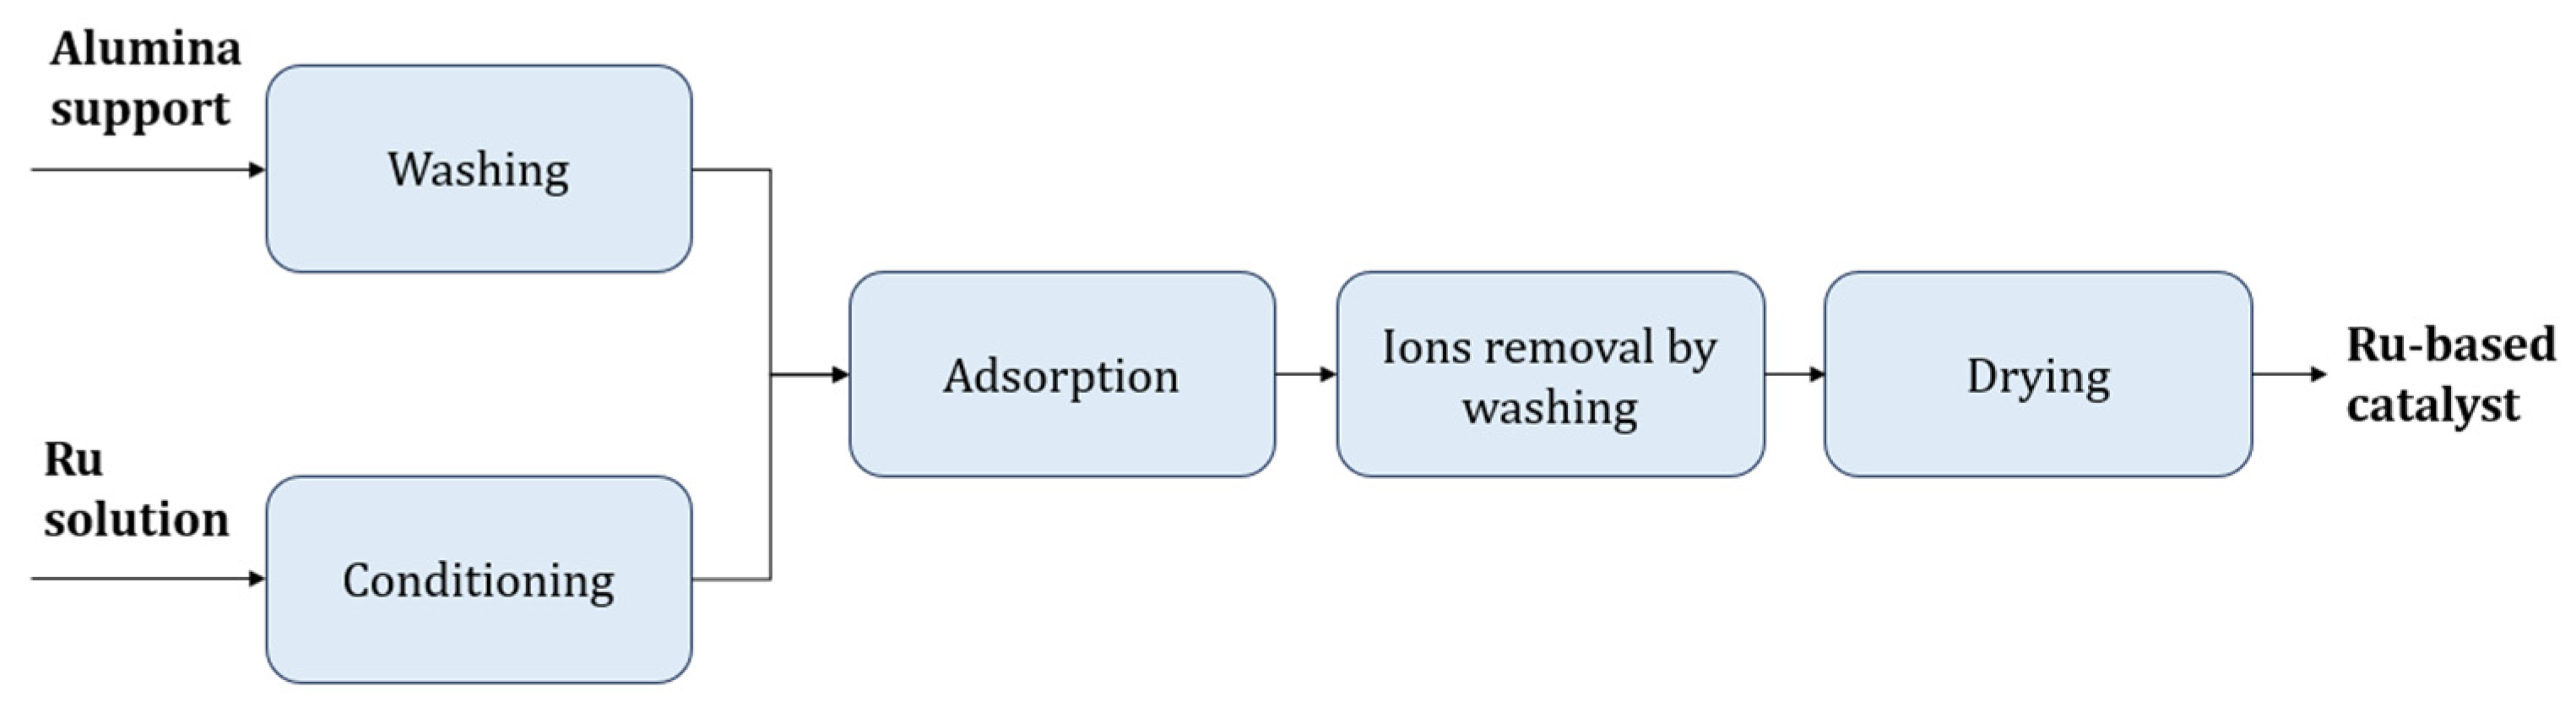
2. Catalyst Preparation on the Laboratory and Pilot Plant Scale
3. Characterization of the Catalyst
3.1. ICP-OES
3.2. Chloride Analysis
3.3. Free and Tapped Bulk Density
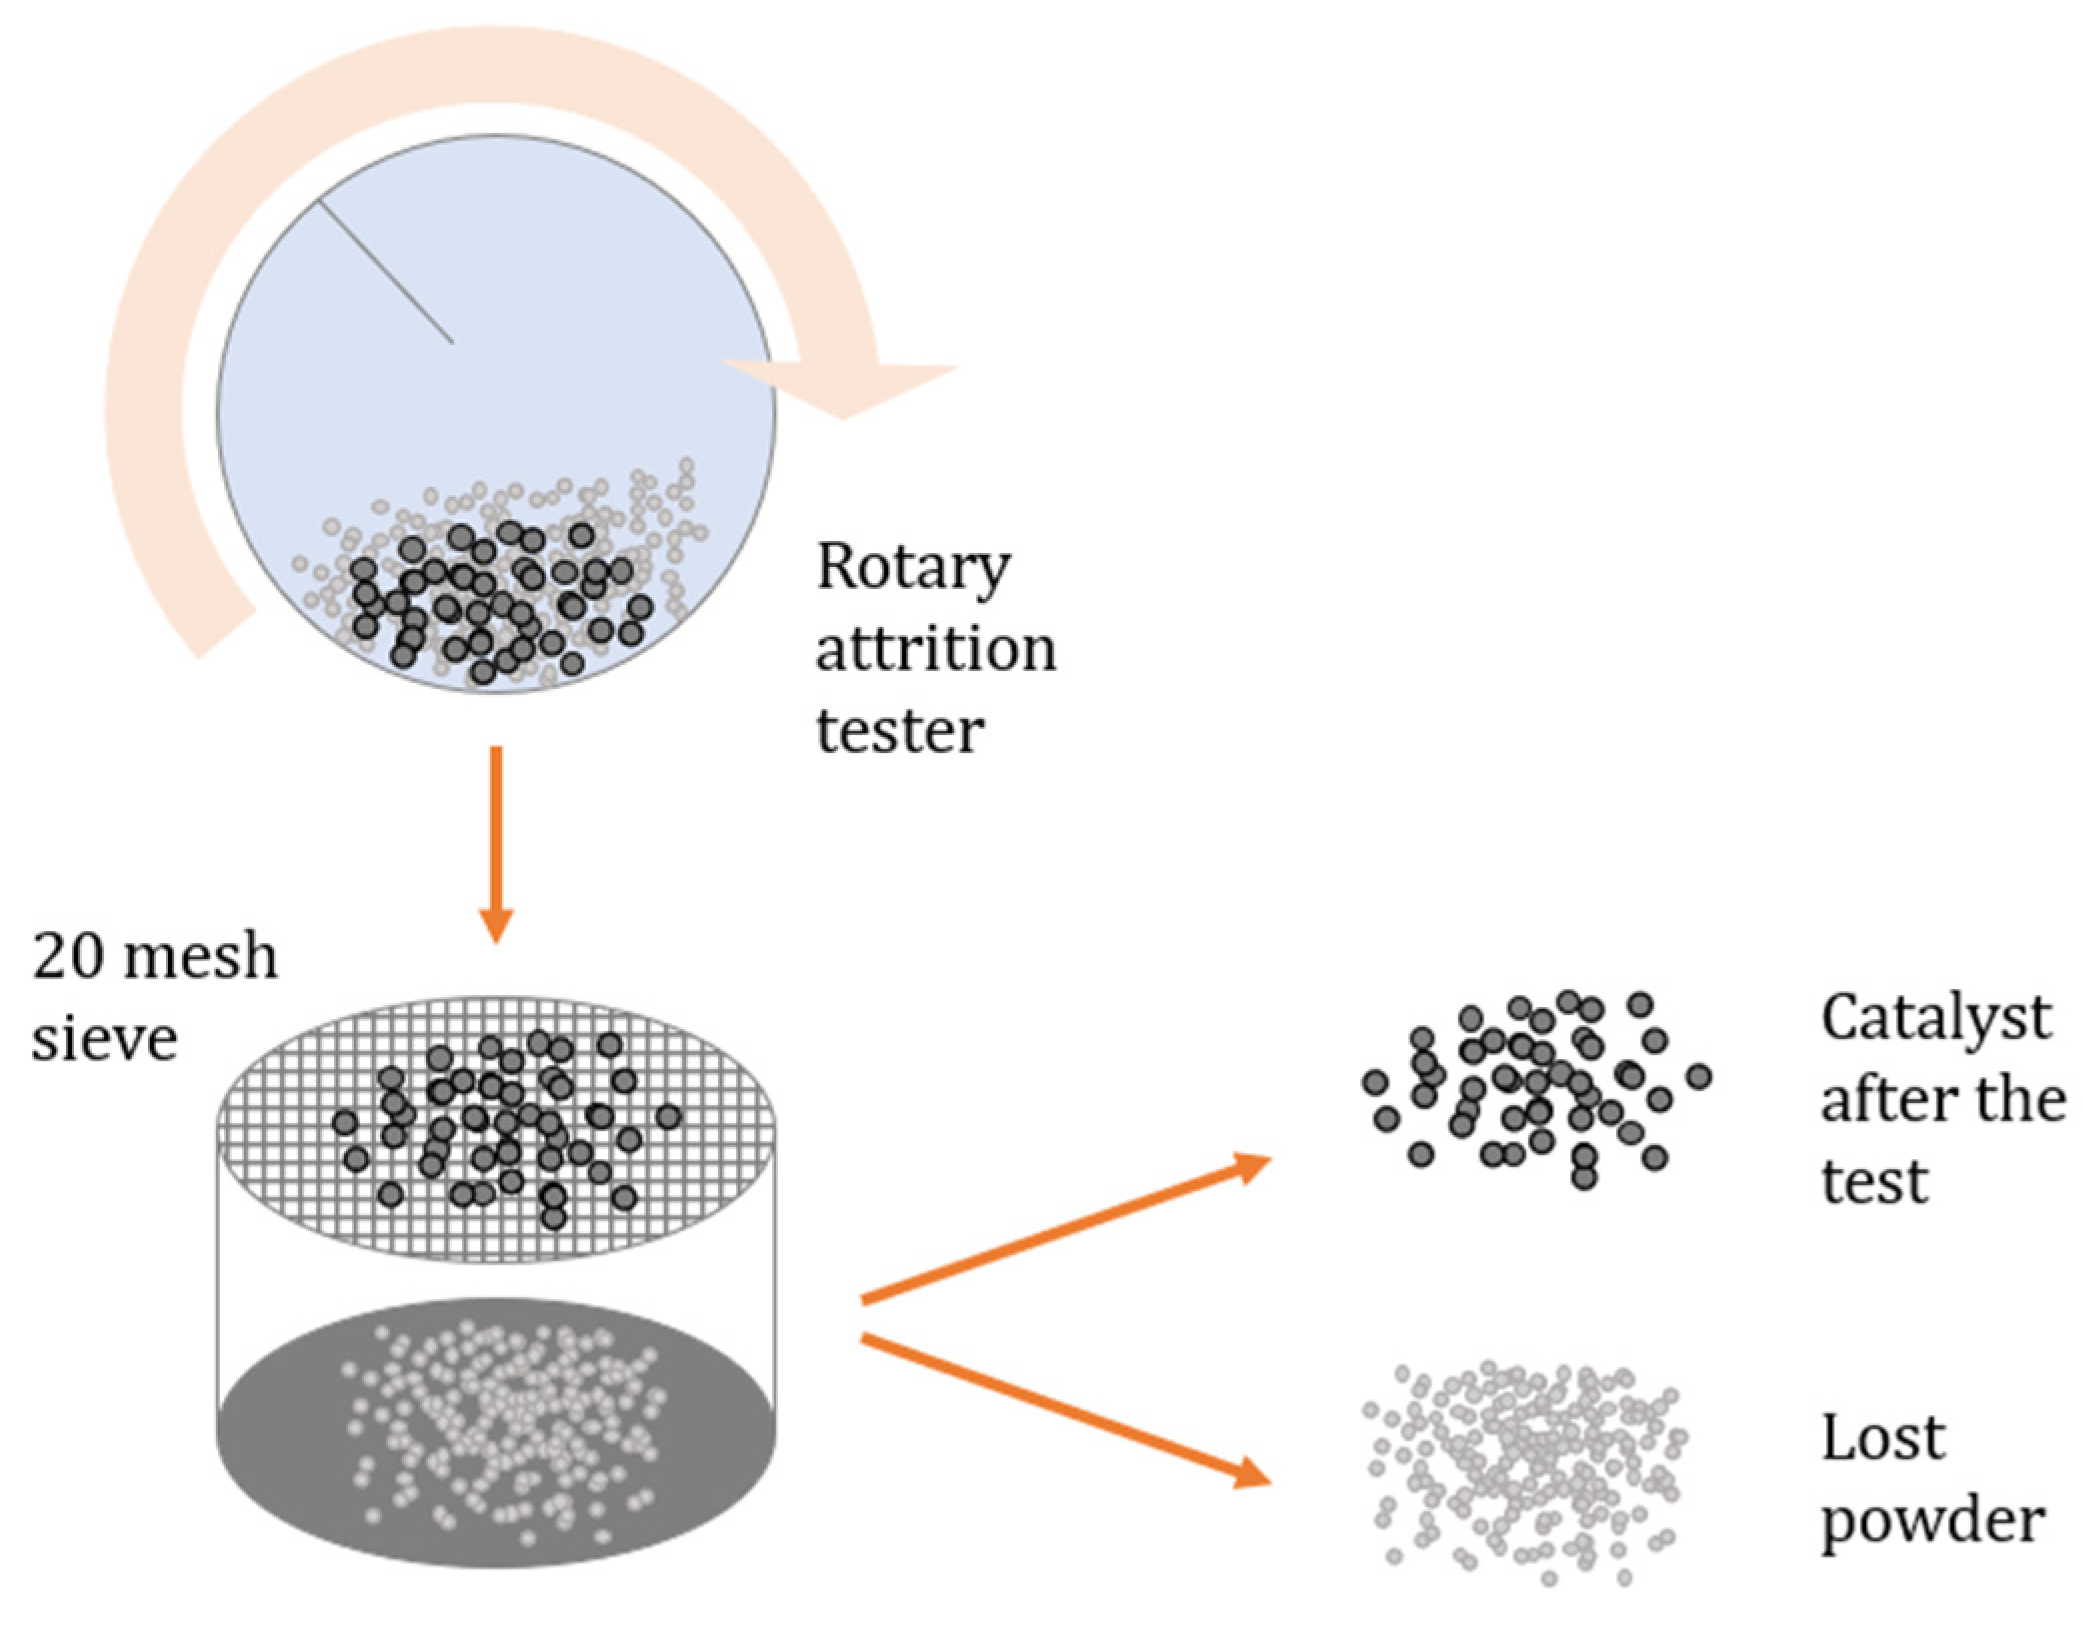
3.4. Attrition Loss
3.5. Crushing Test
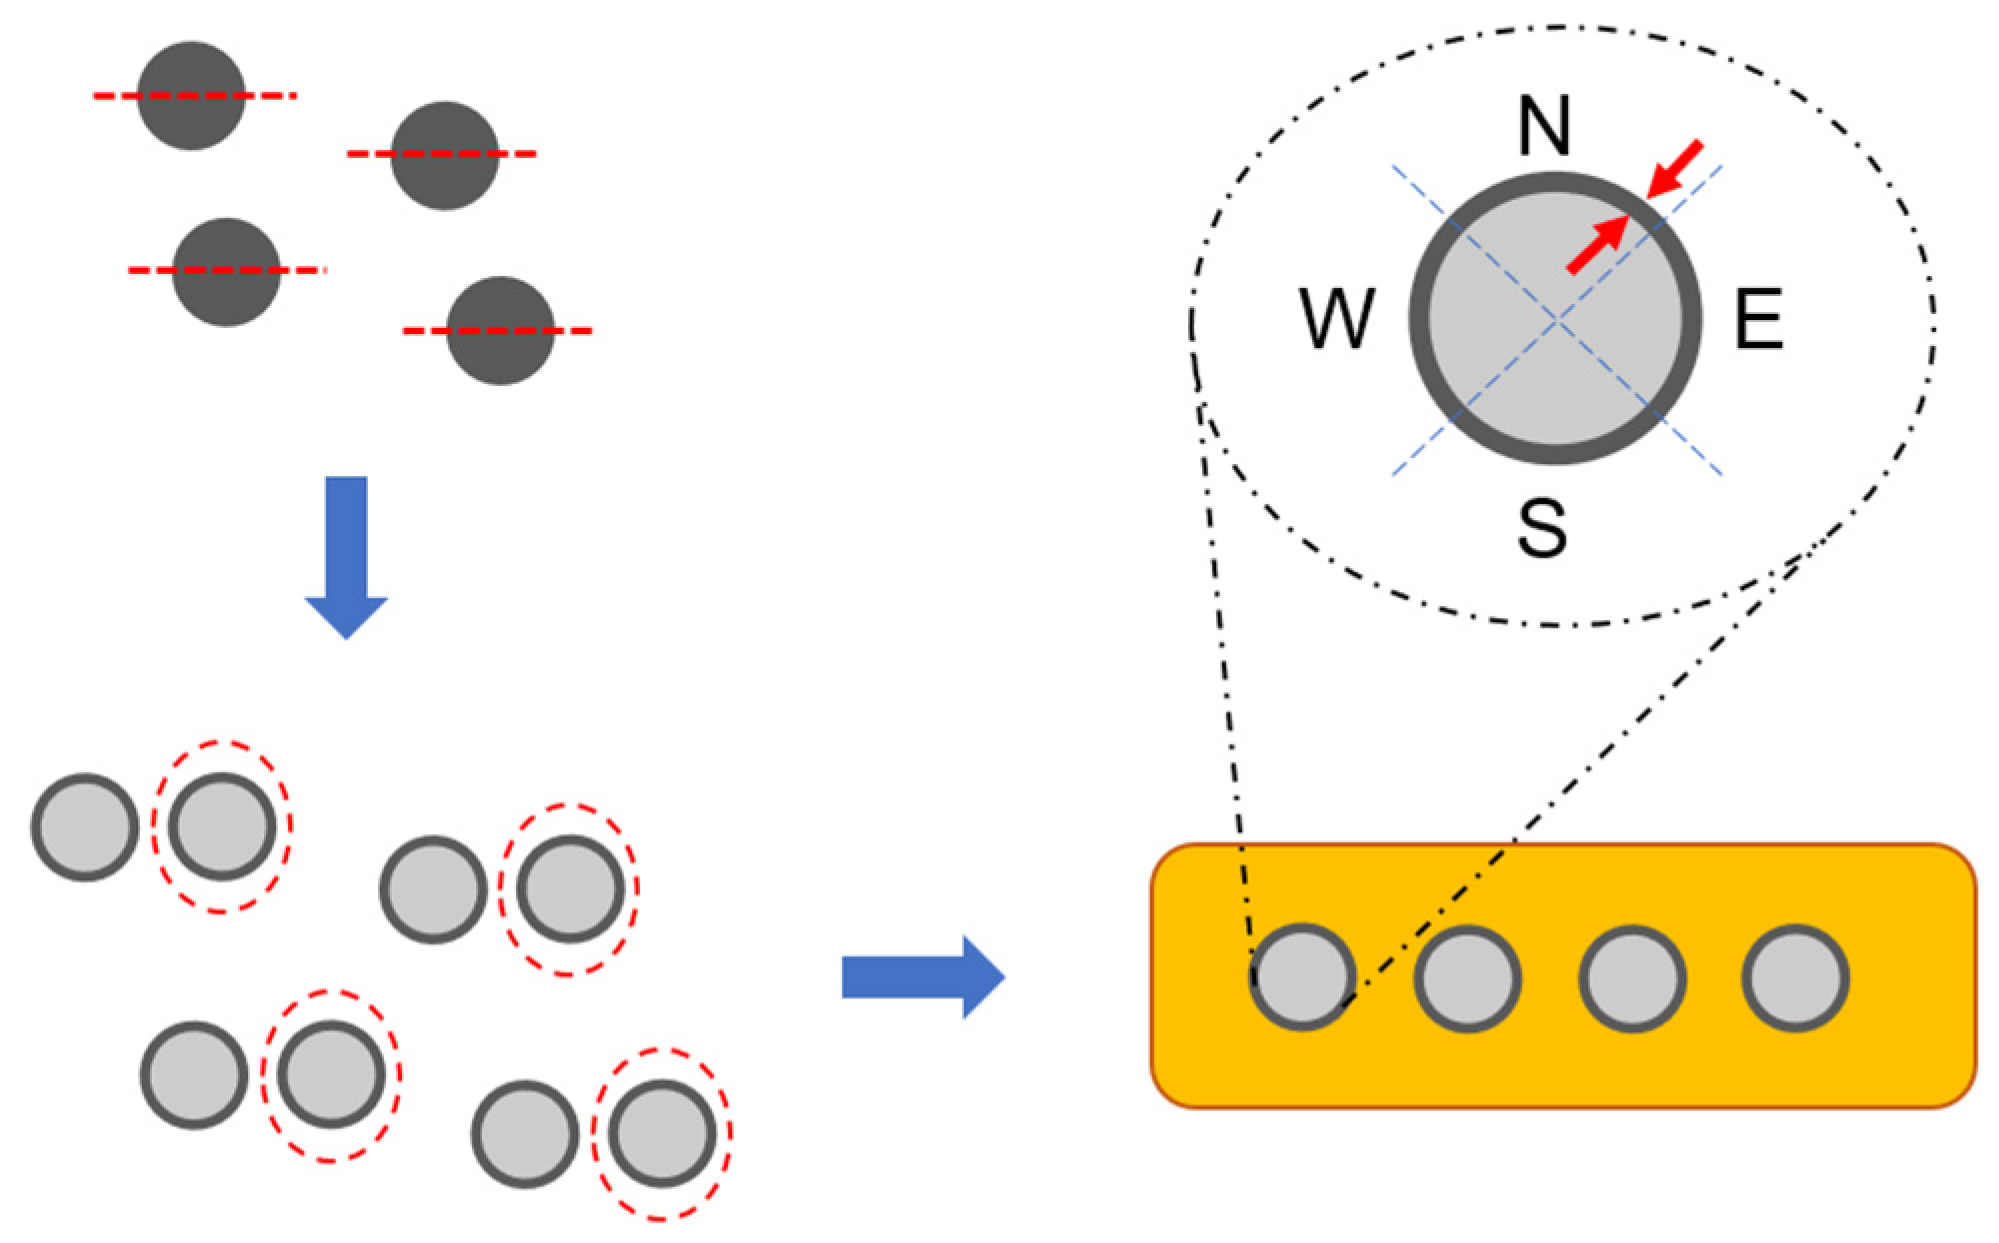
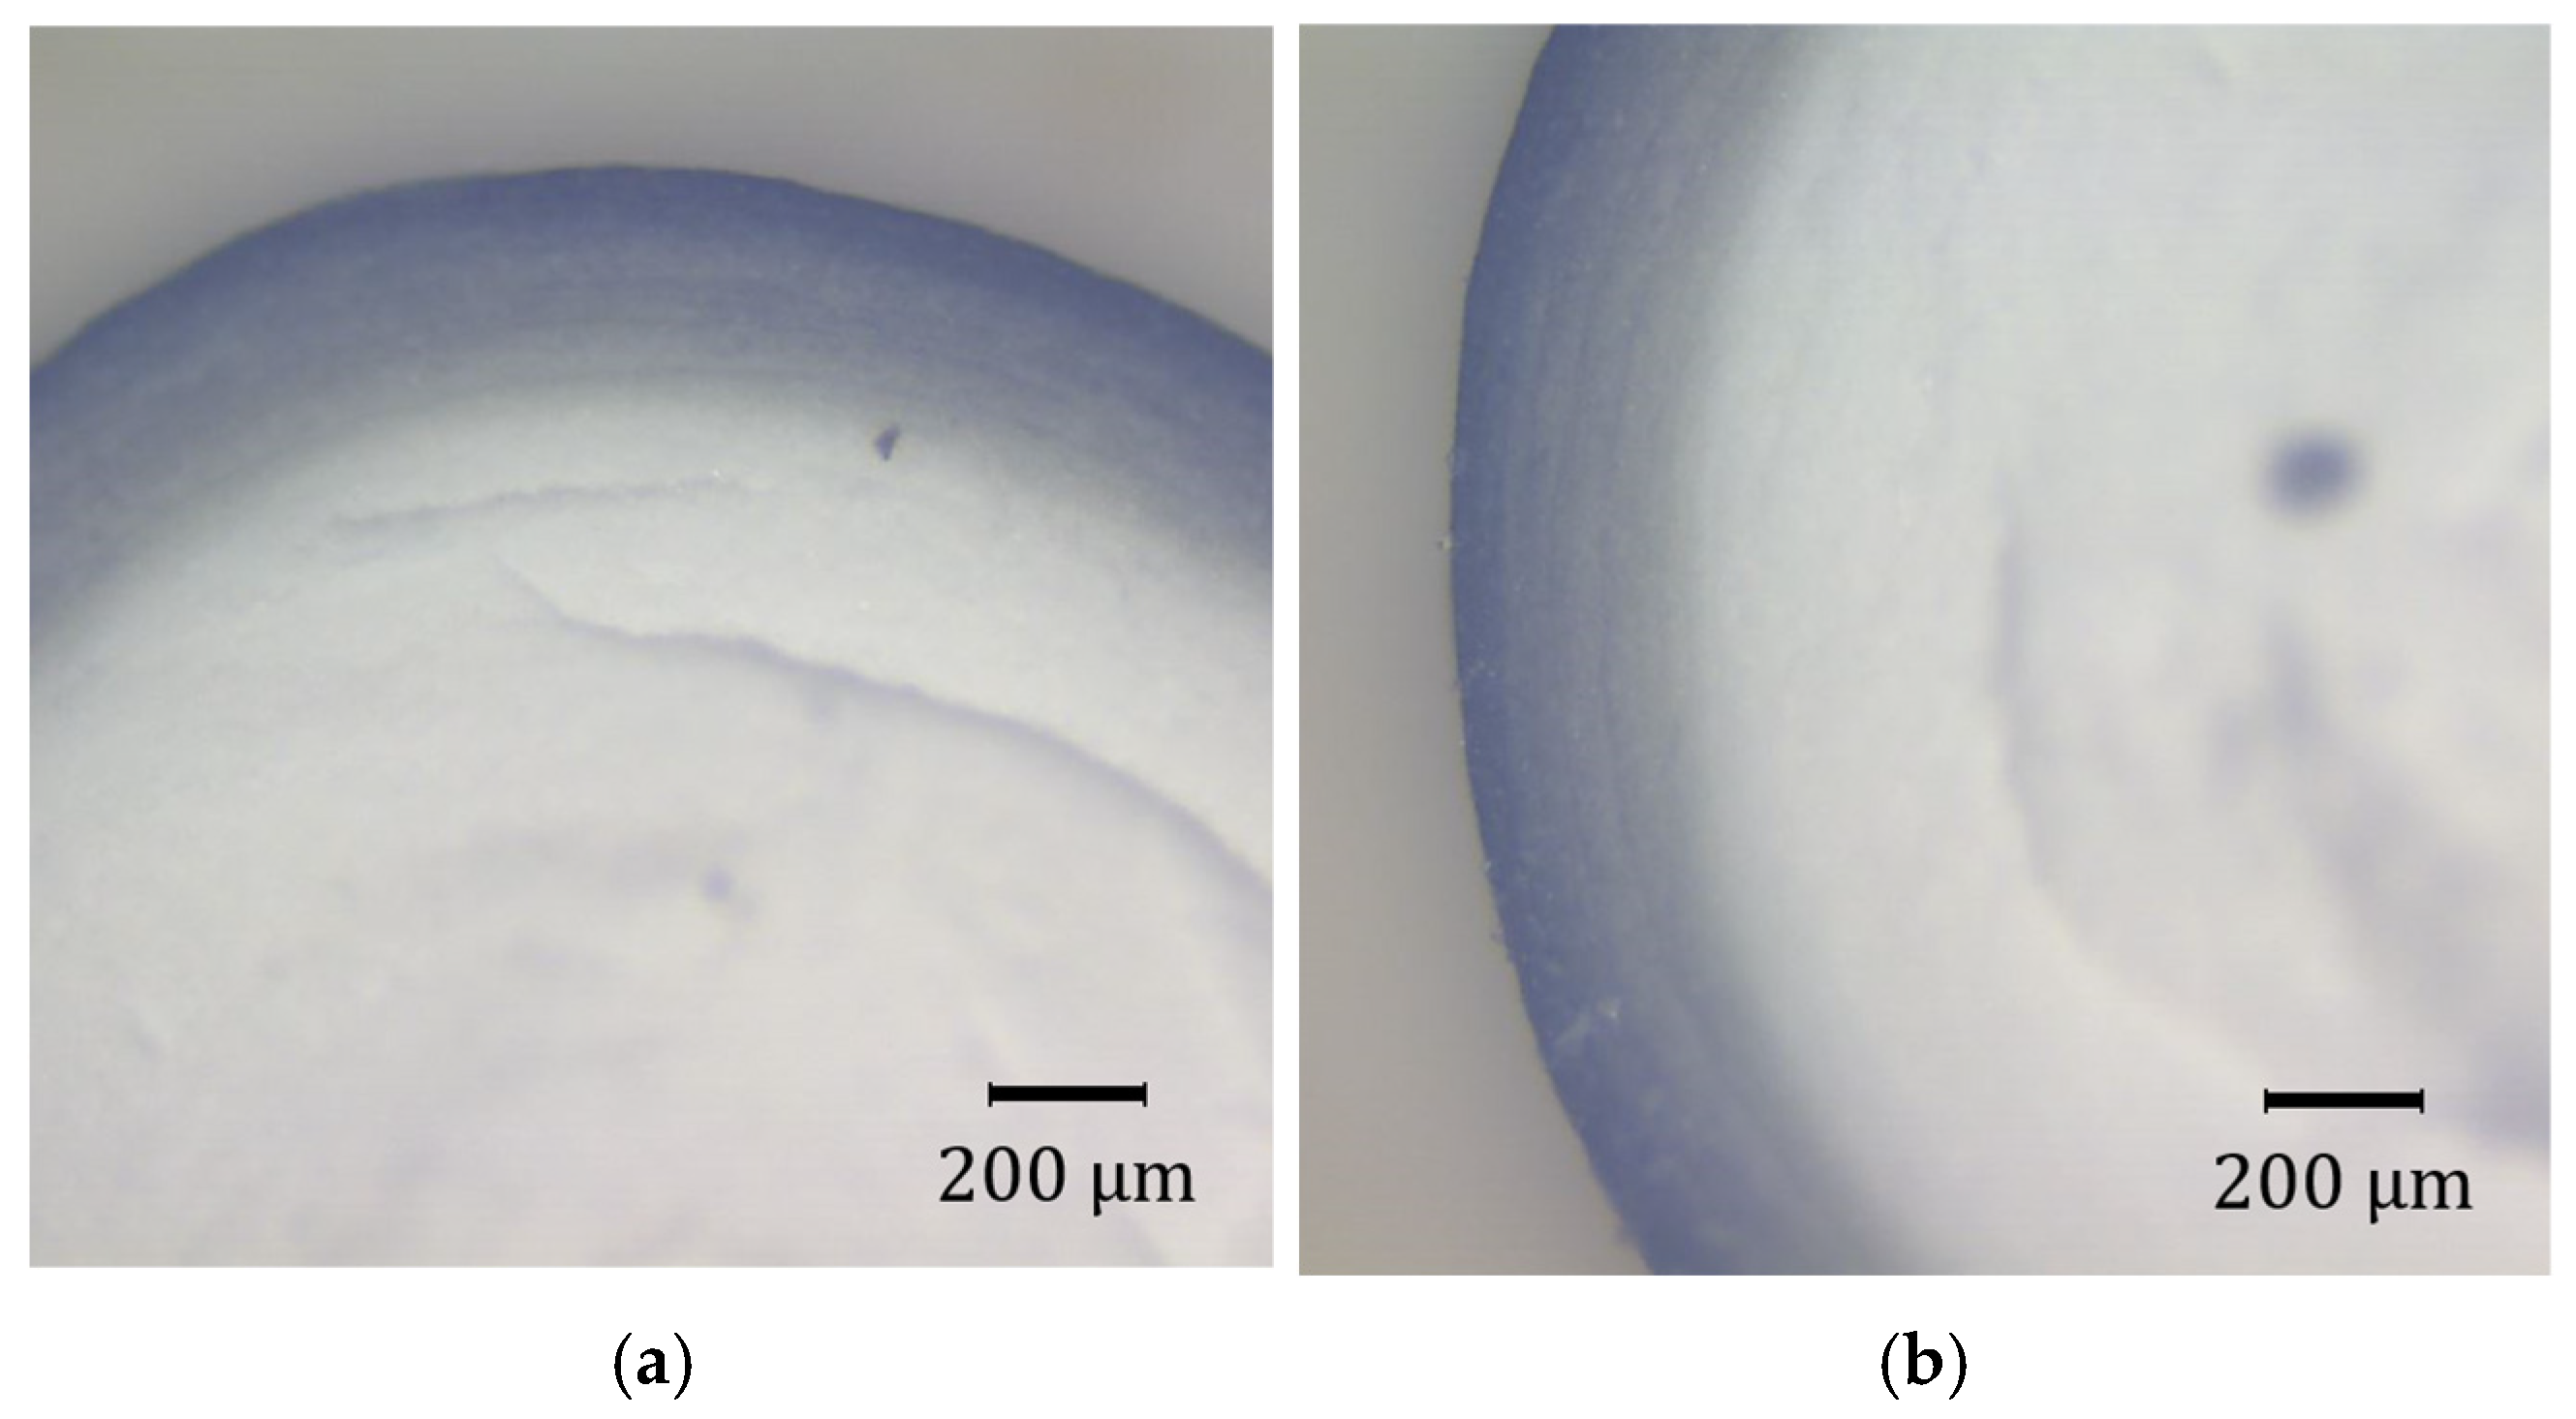
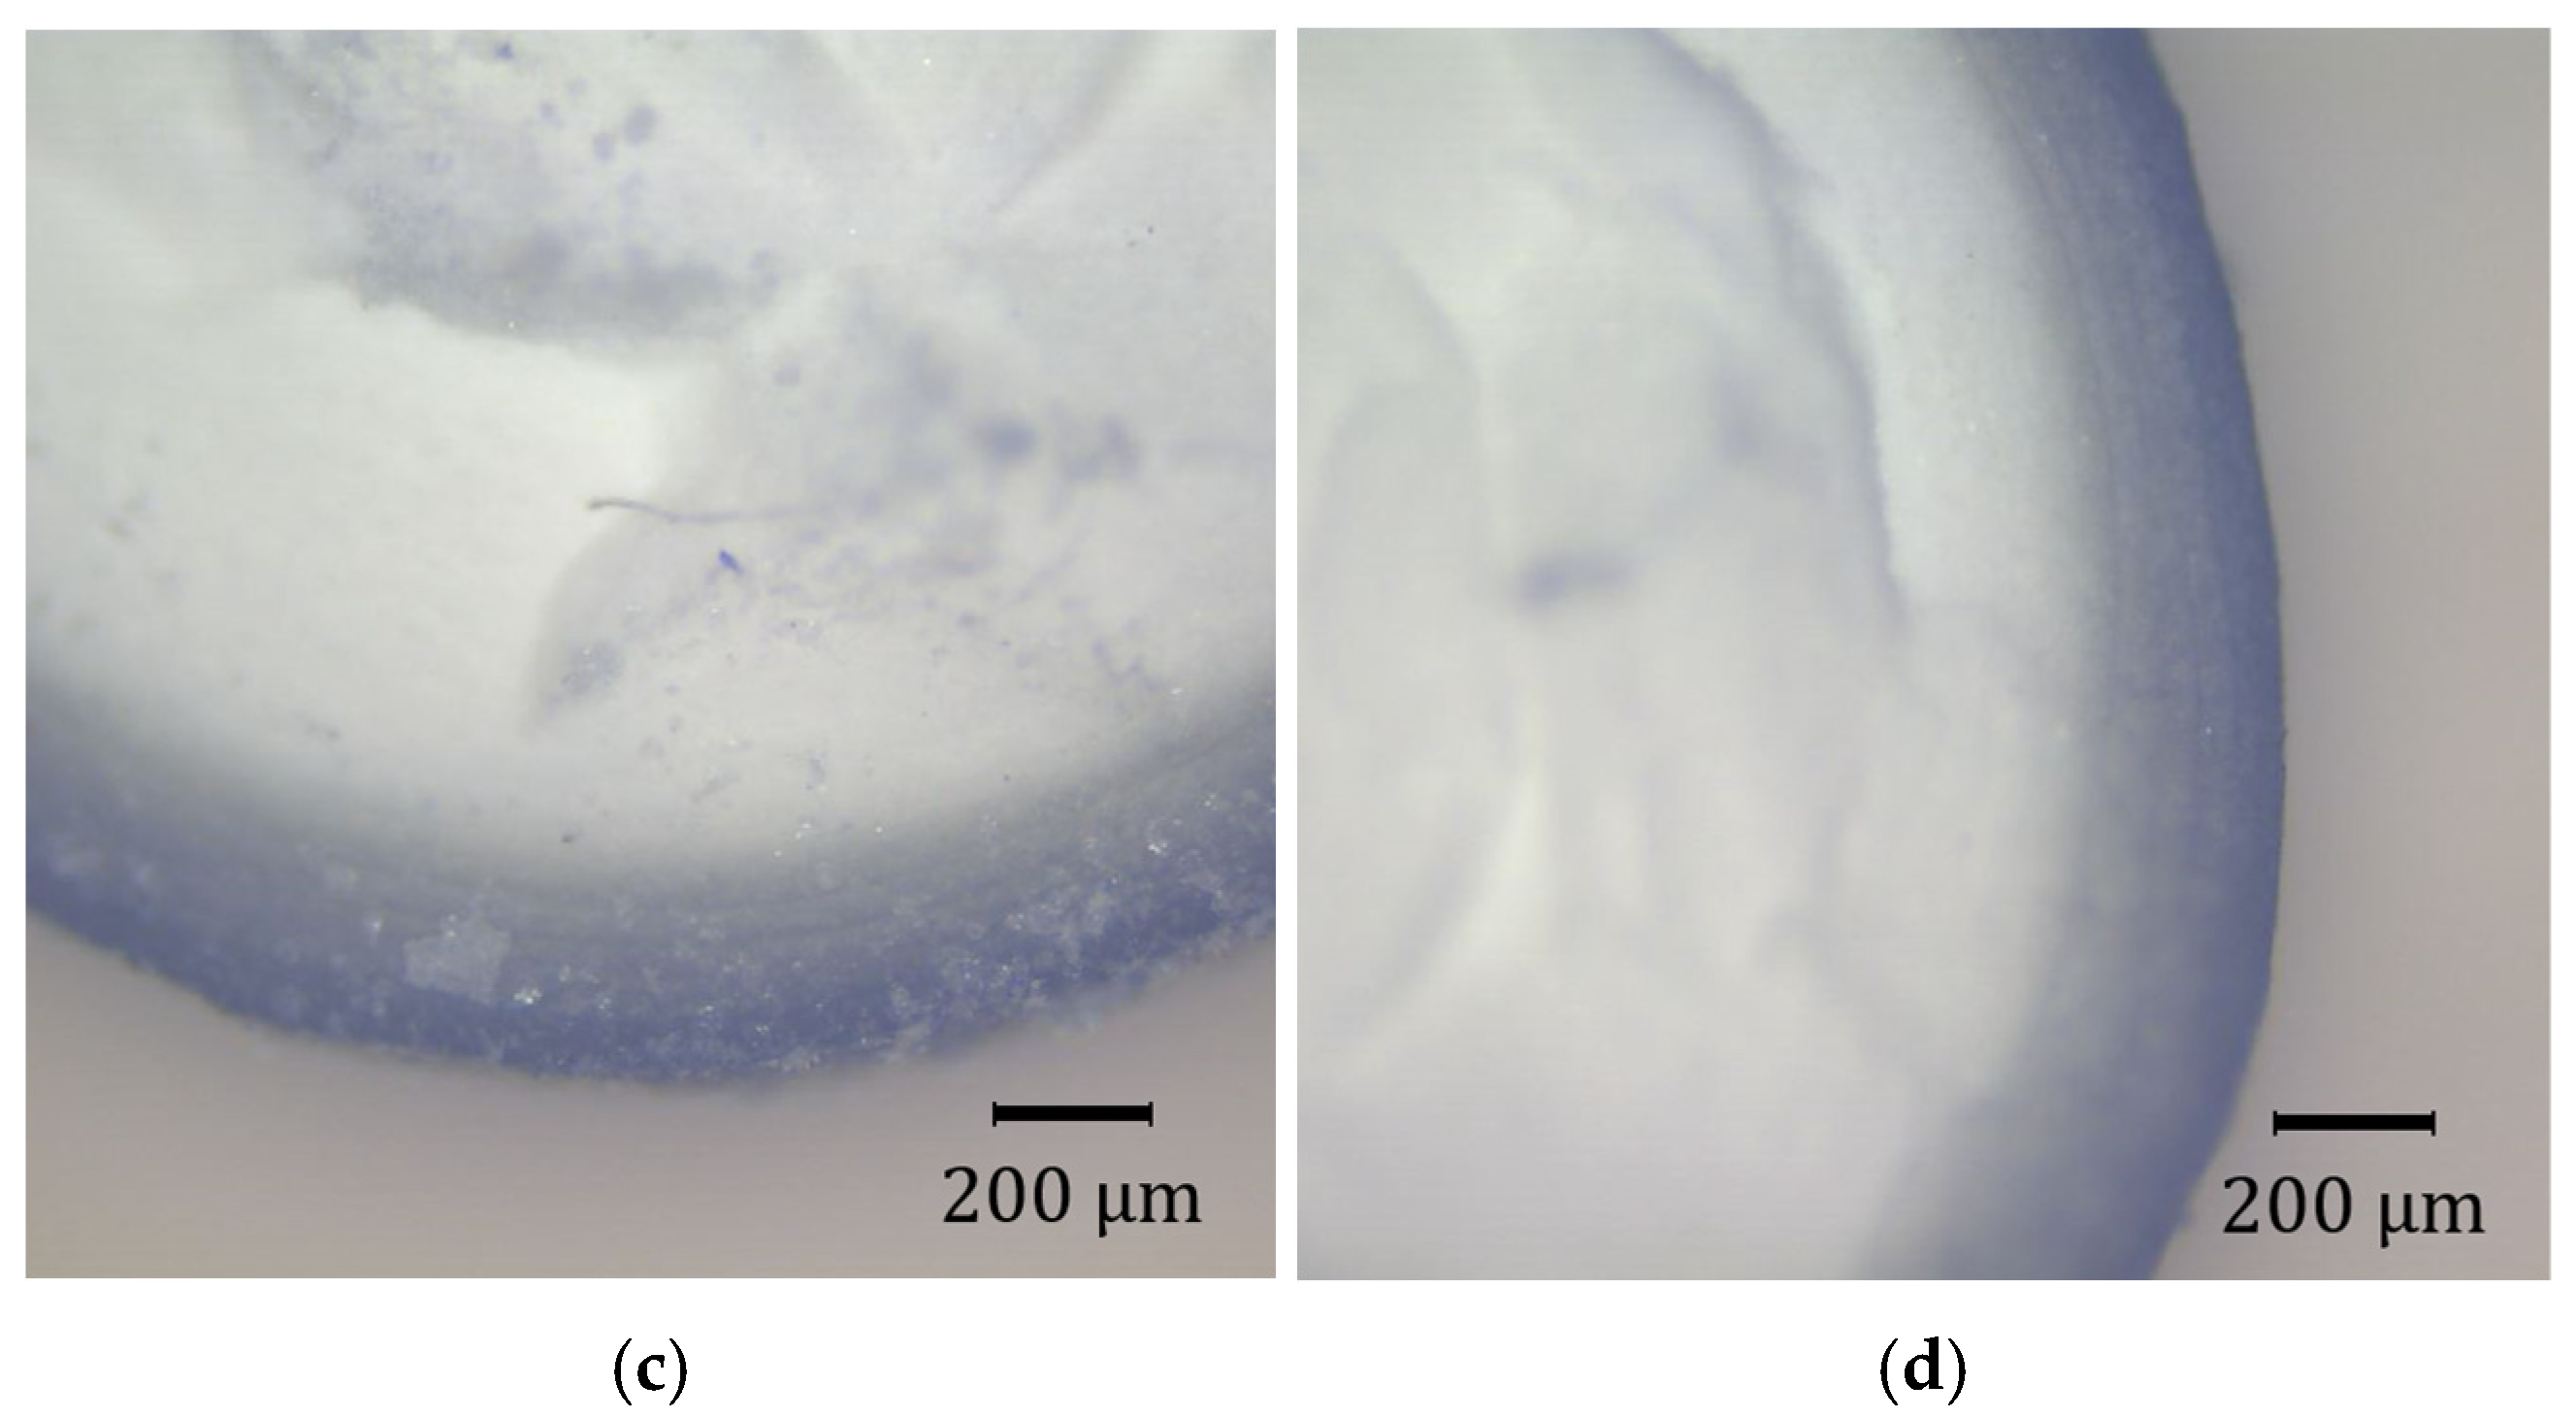
3.6. Precius Metal Penetration (PMP) Analysis
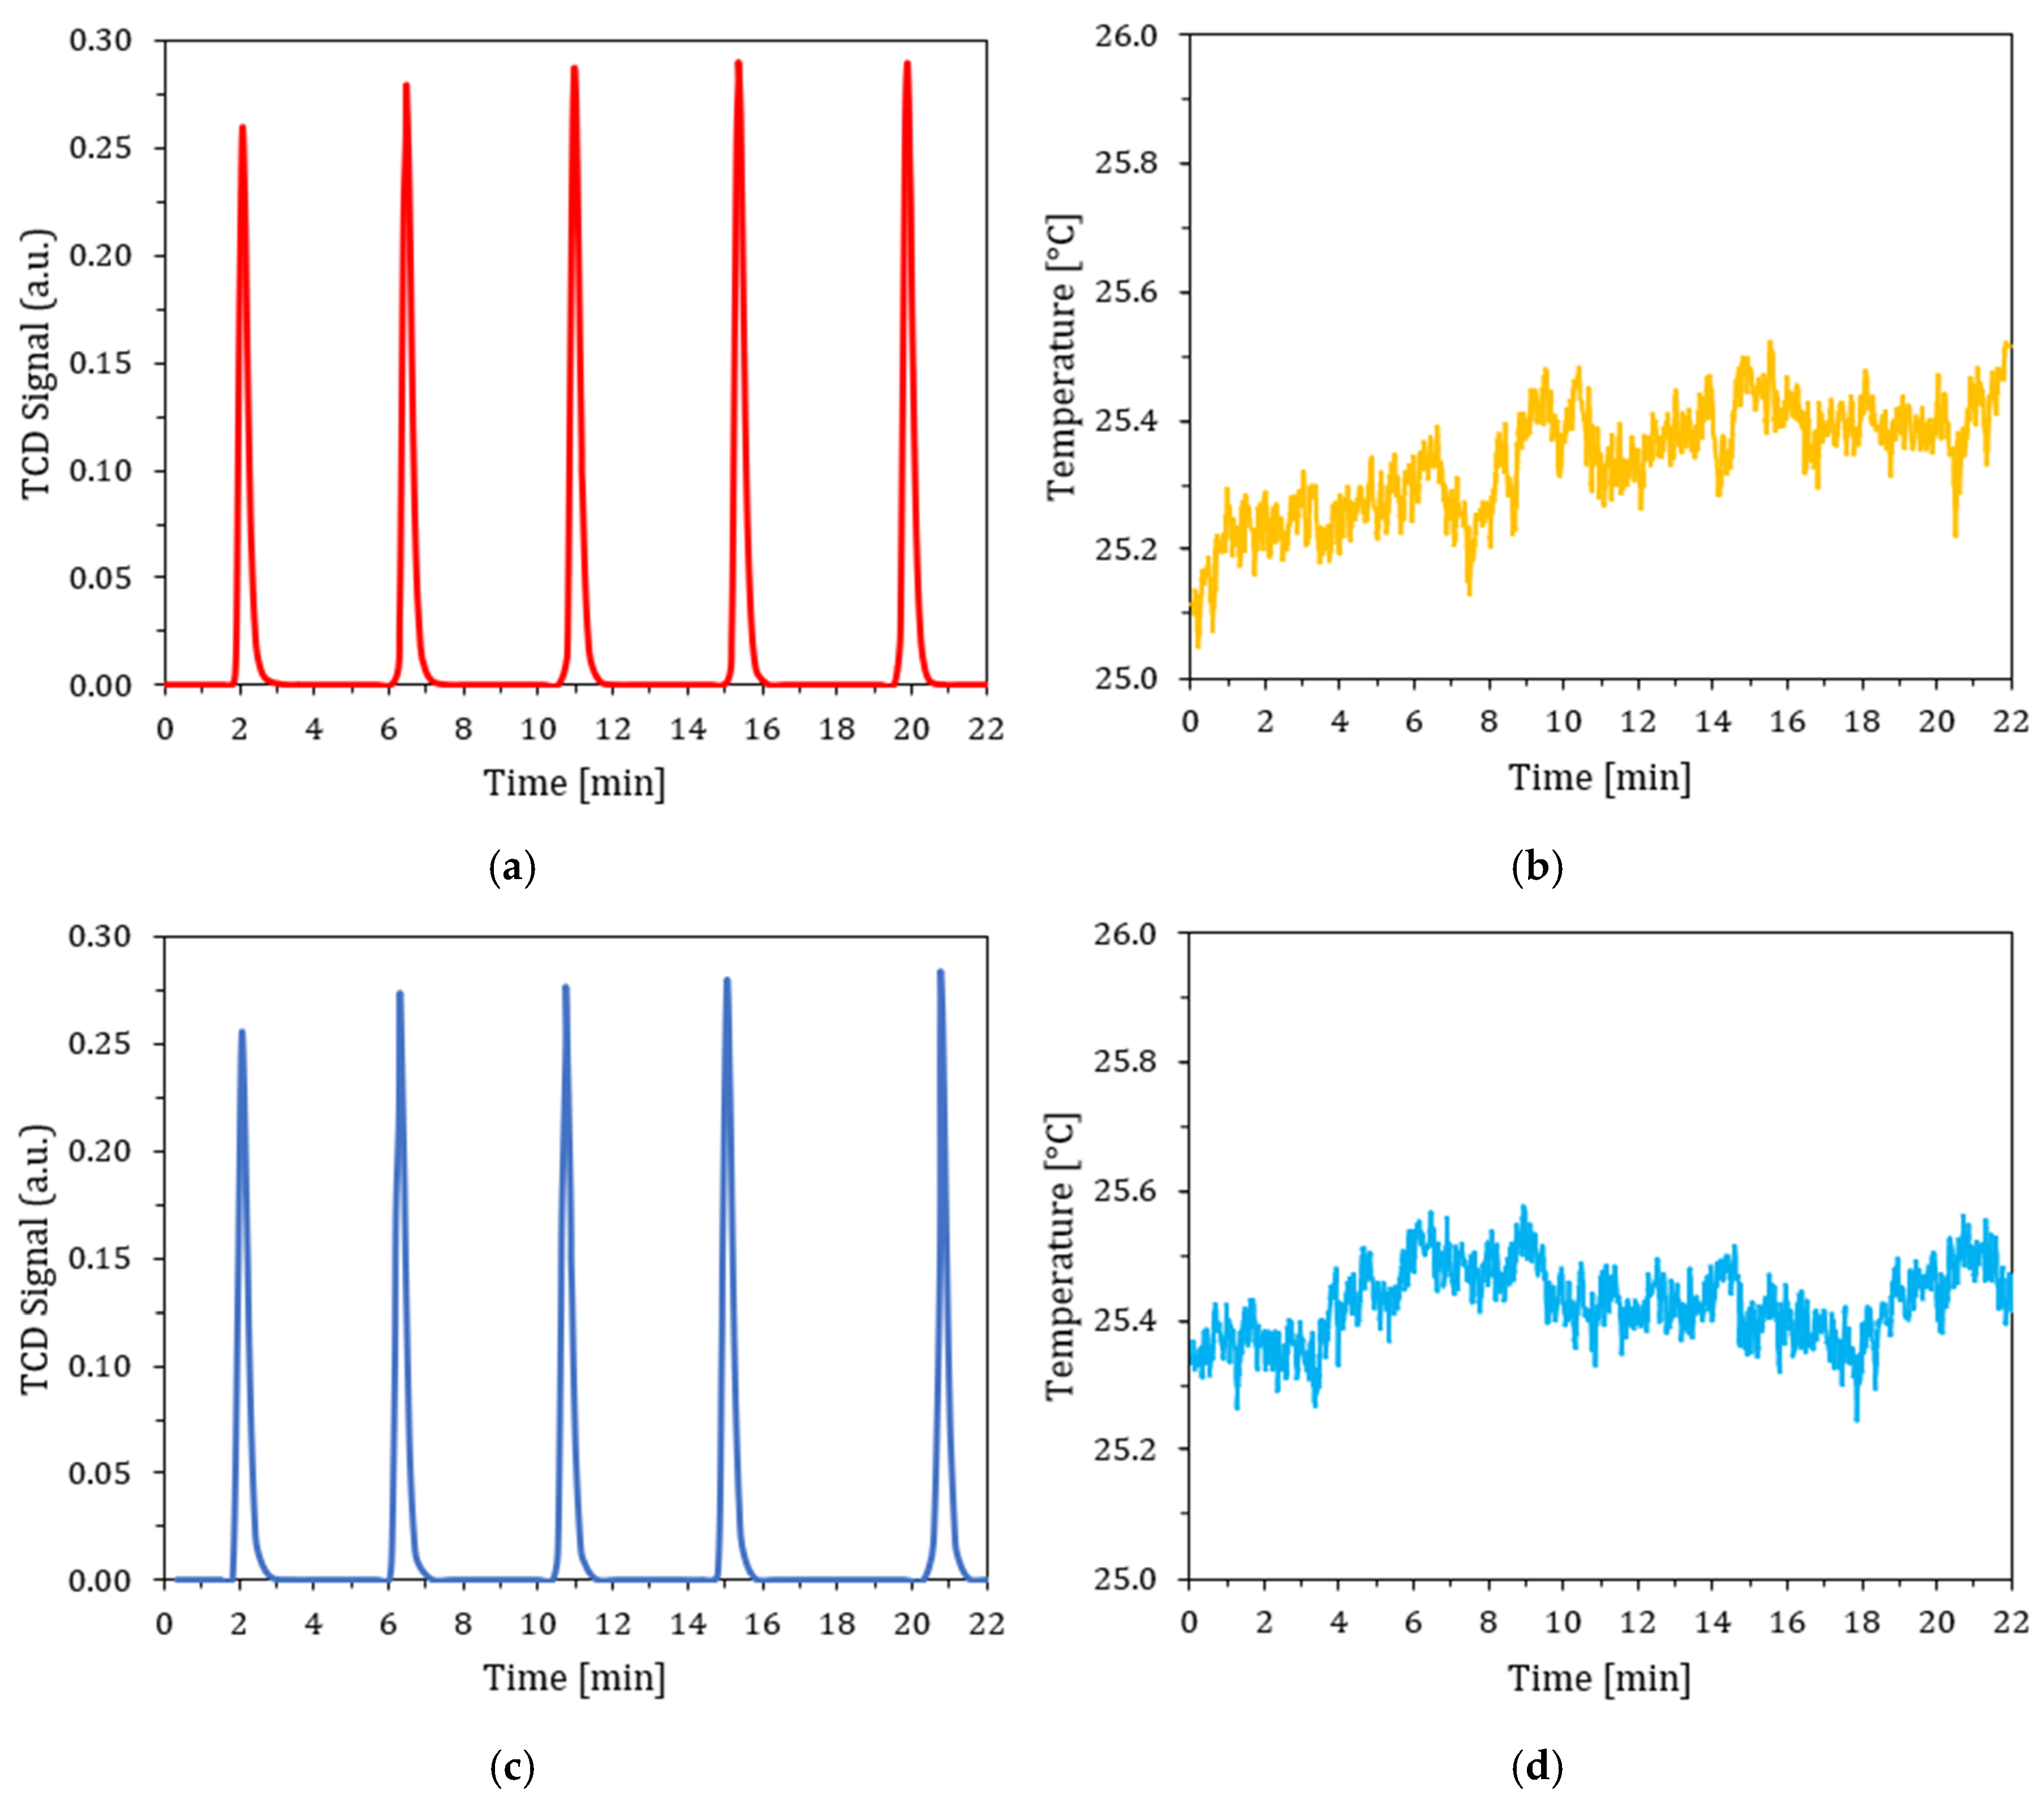
3.7. Chemisorption Test and Metal Surface Area (MSA)
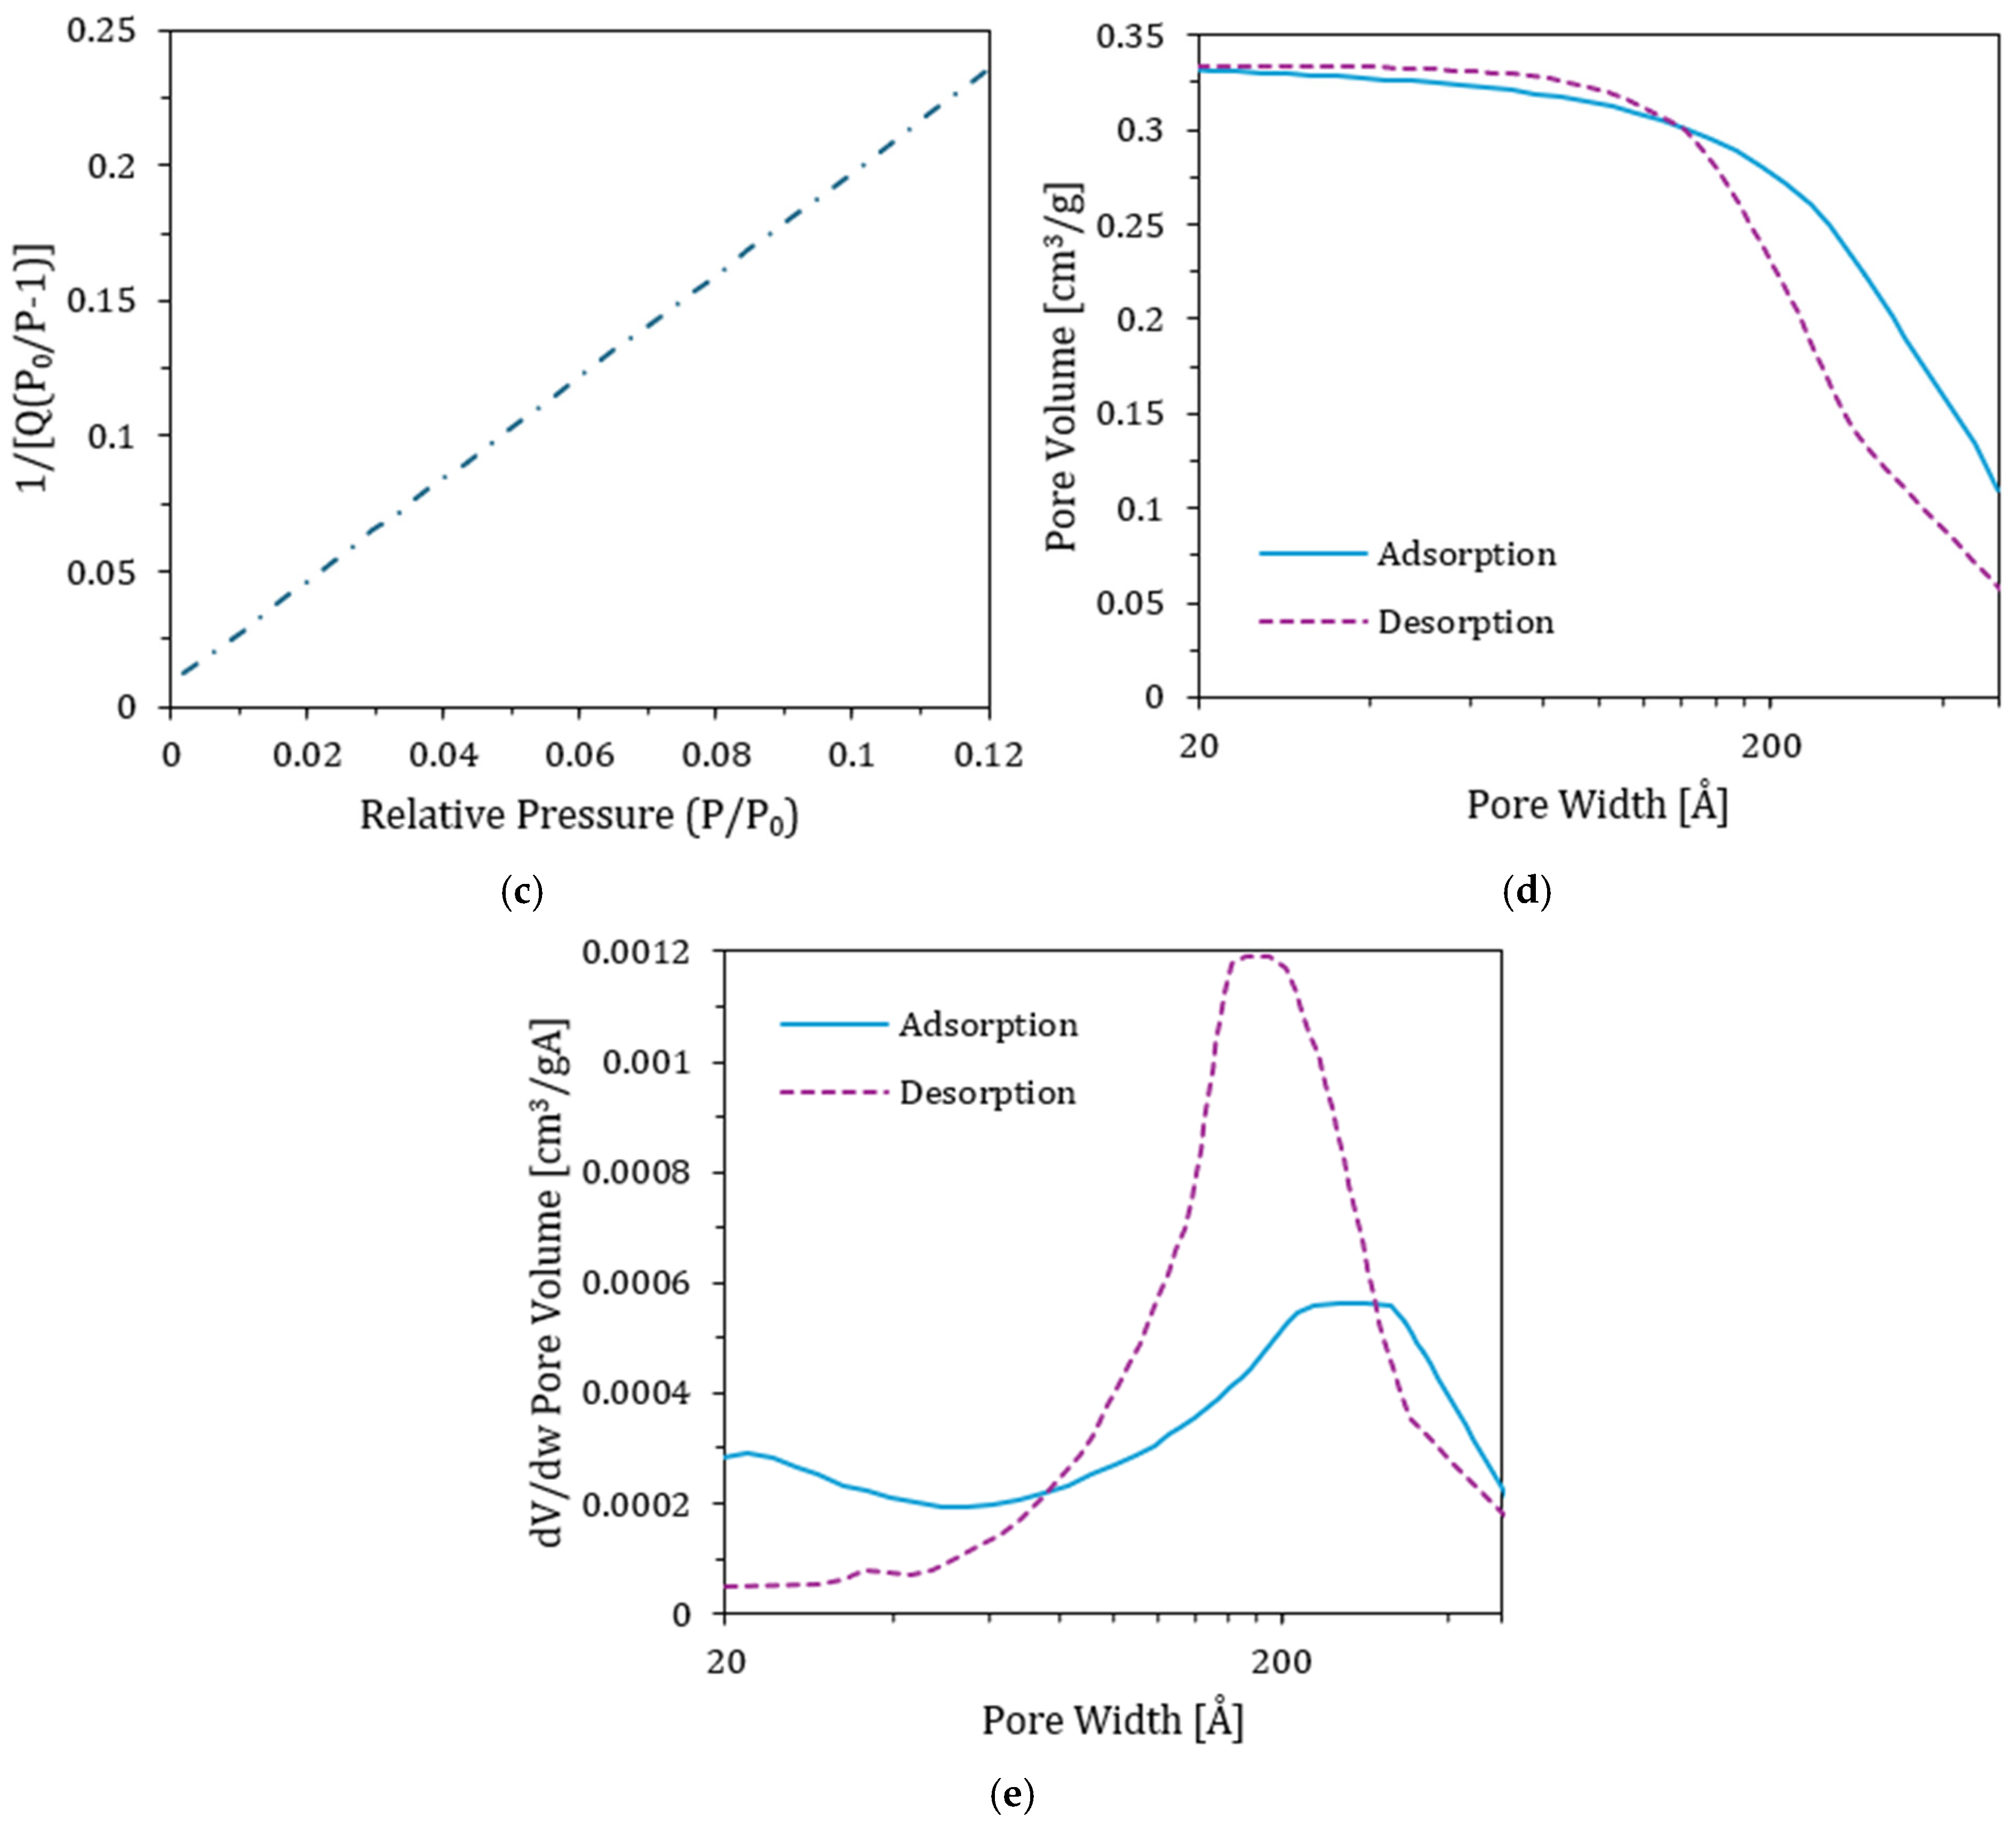
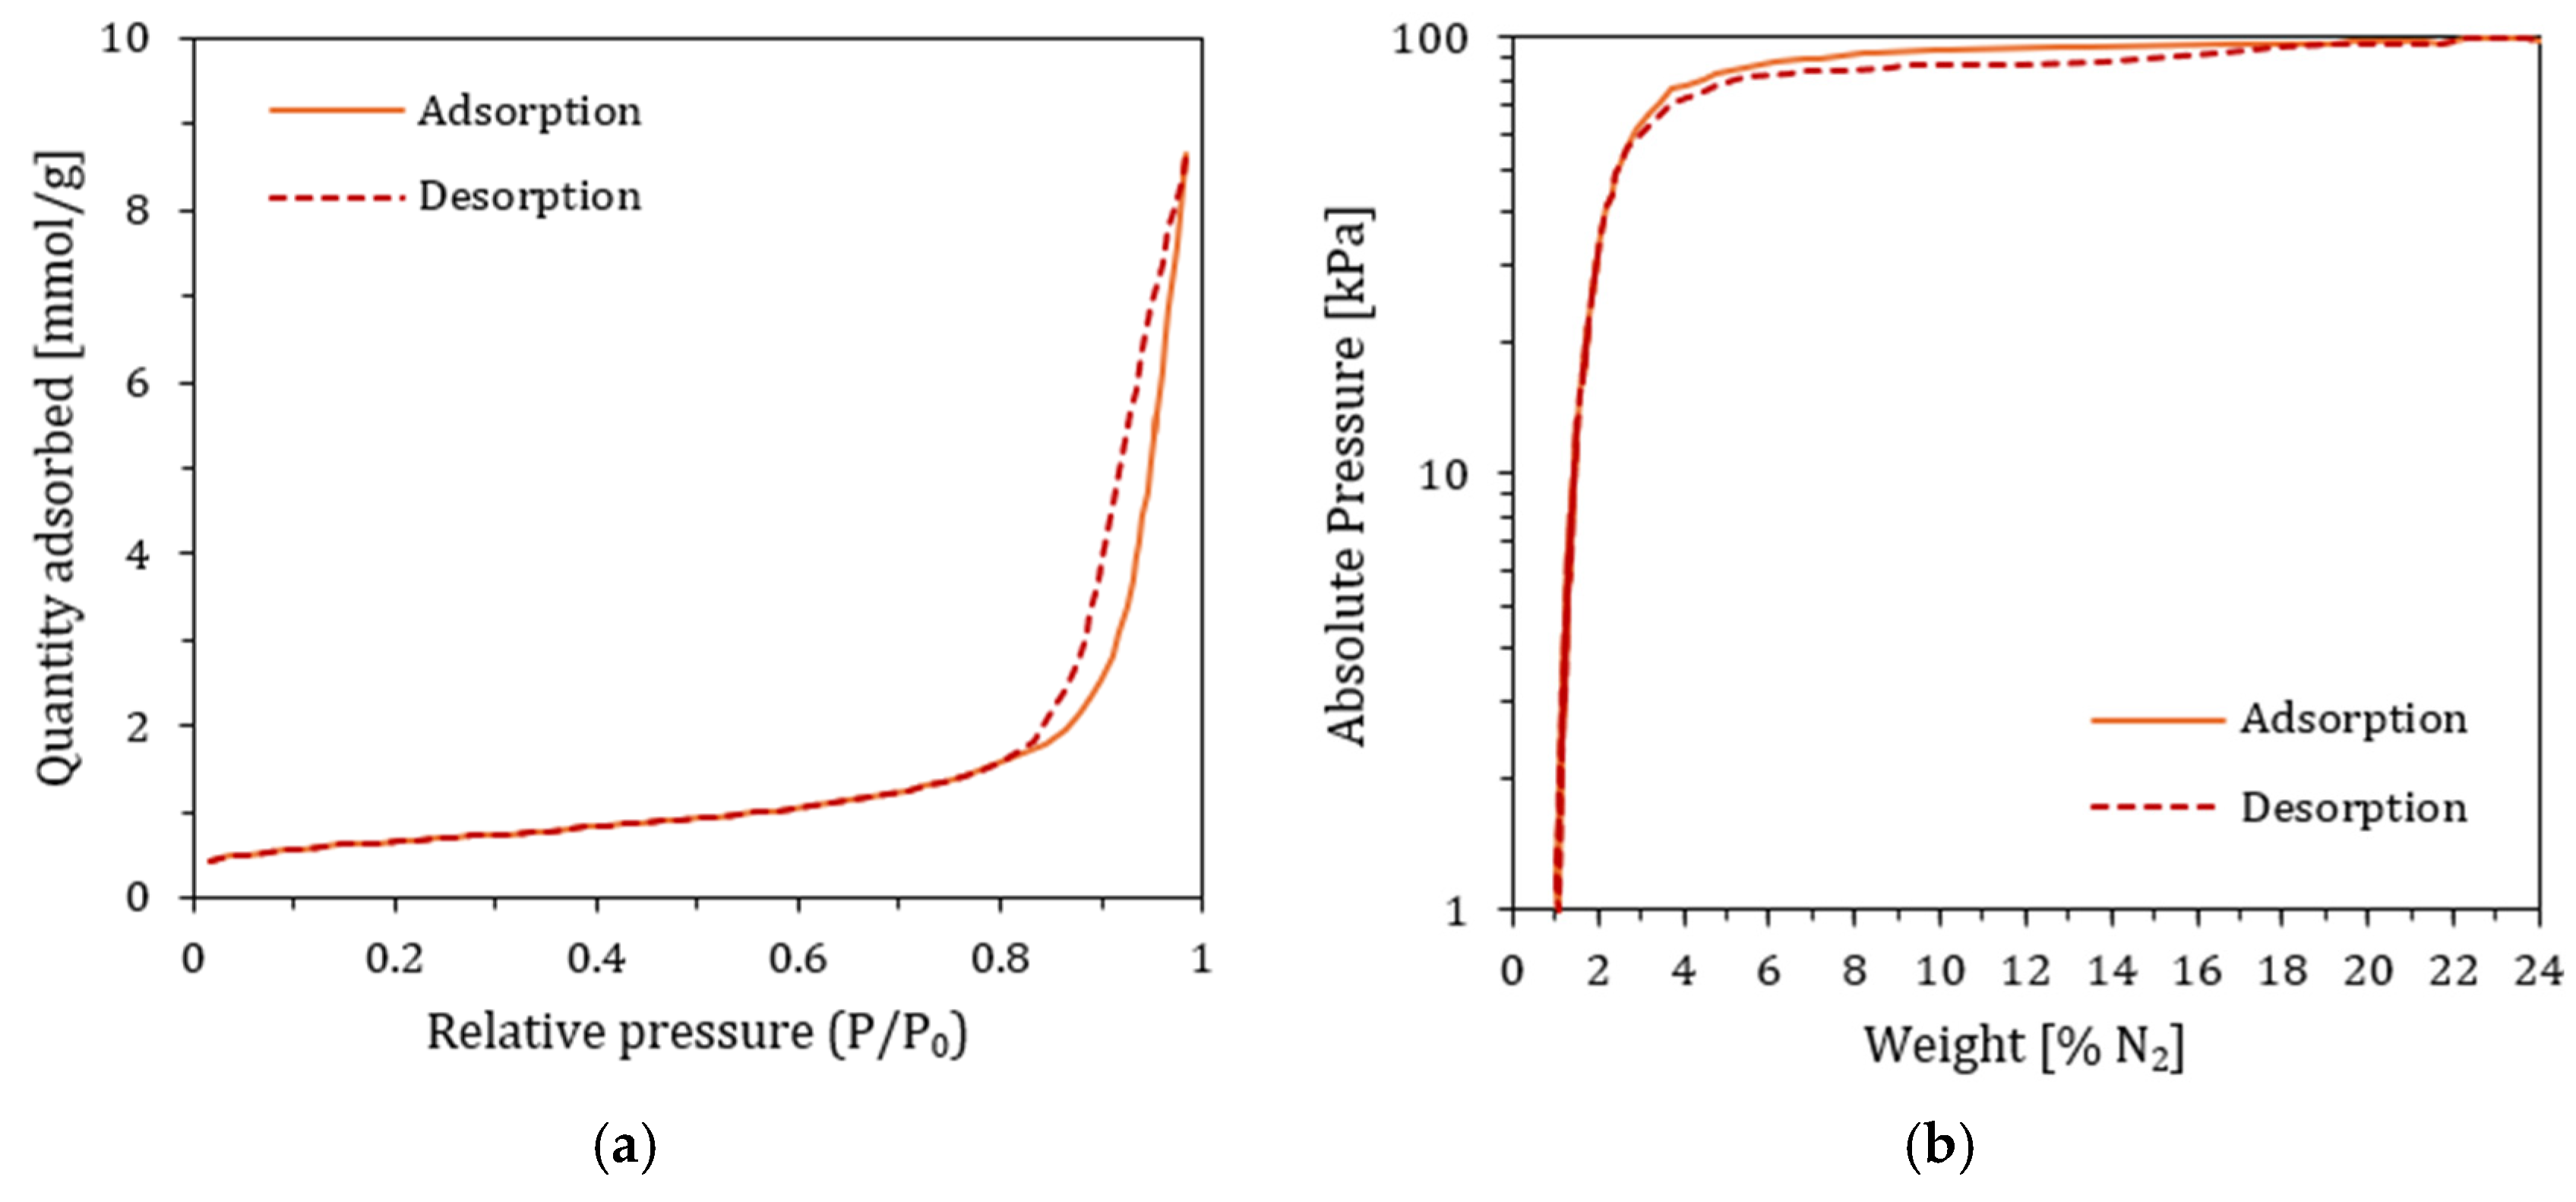
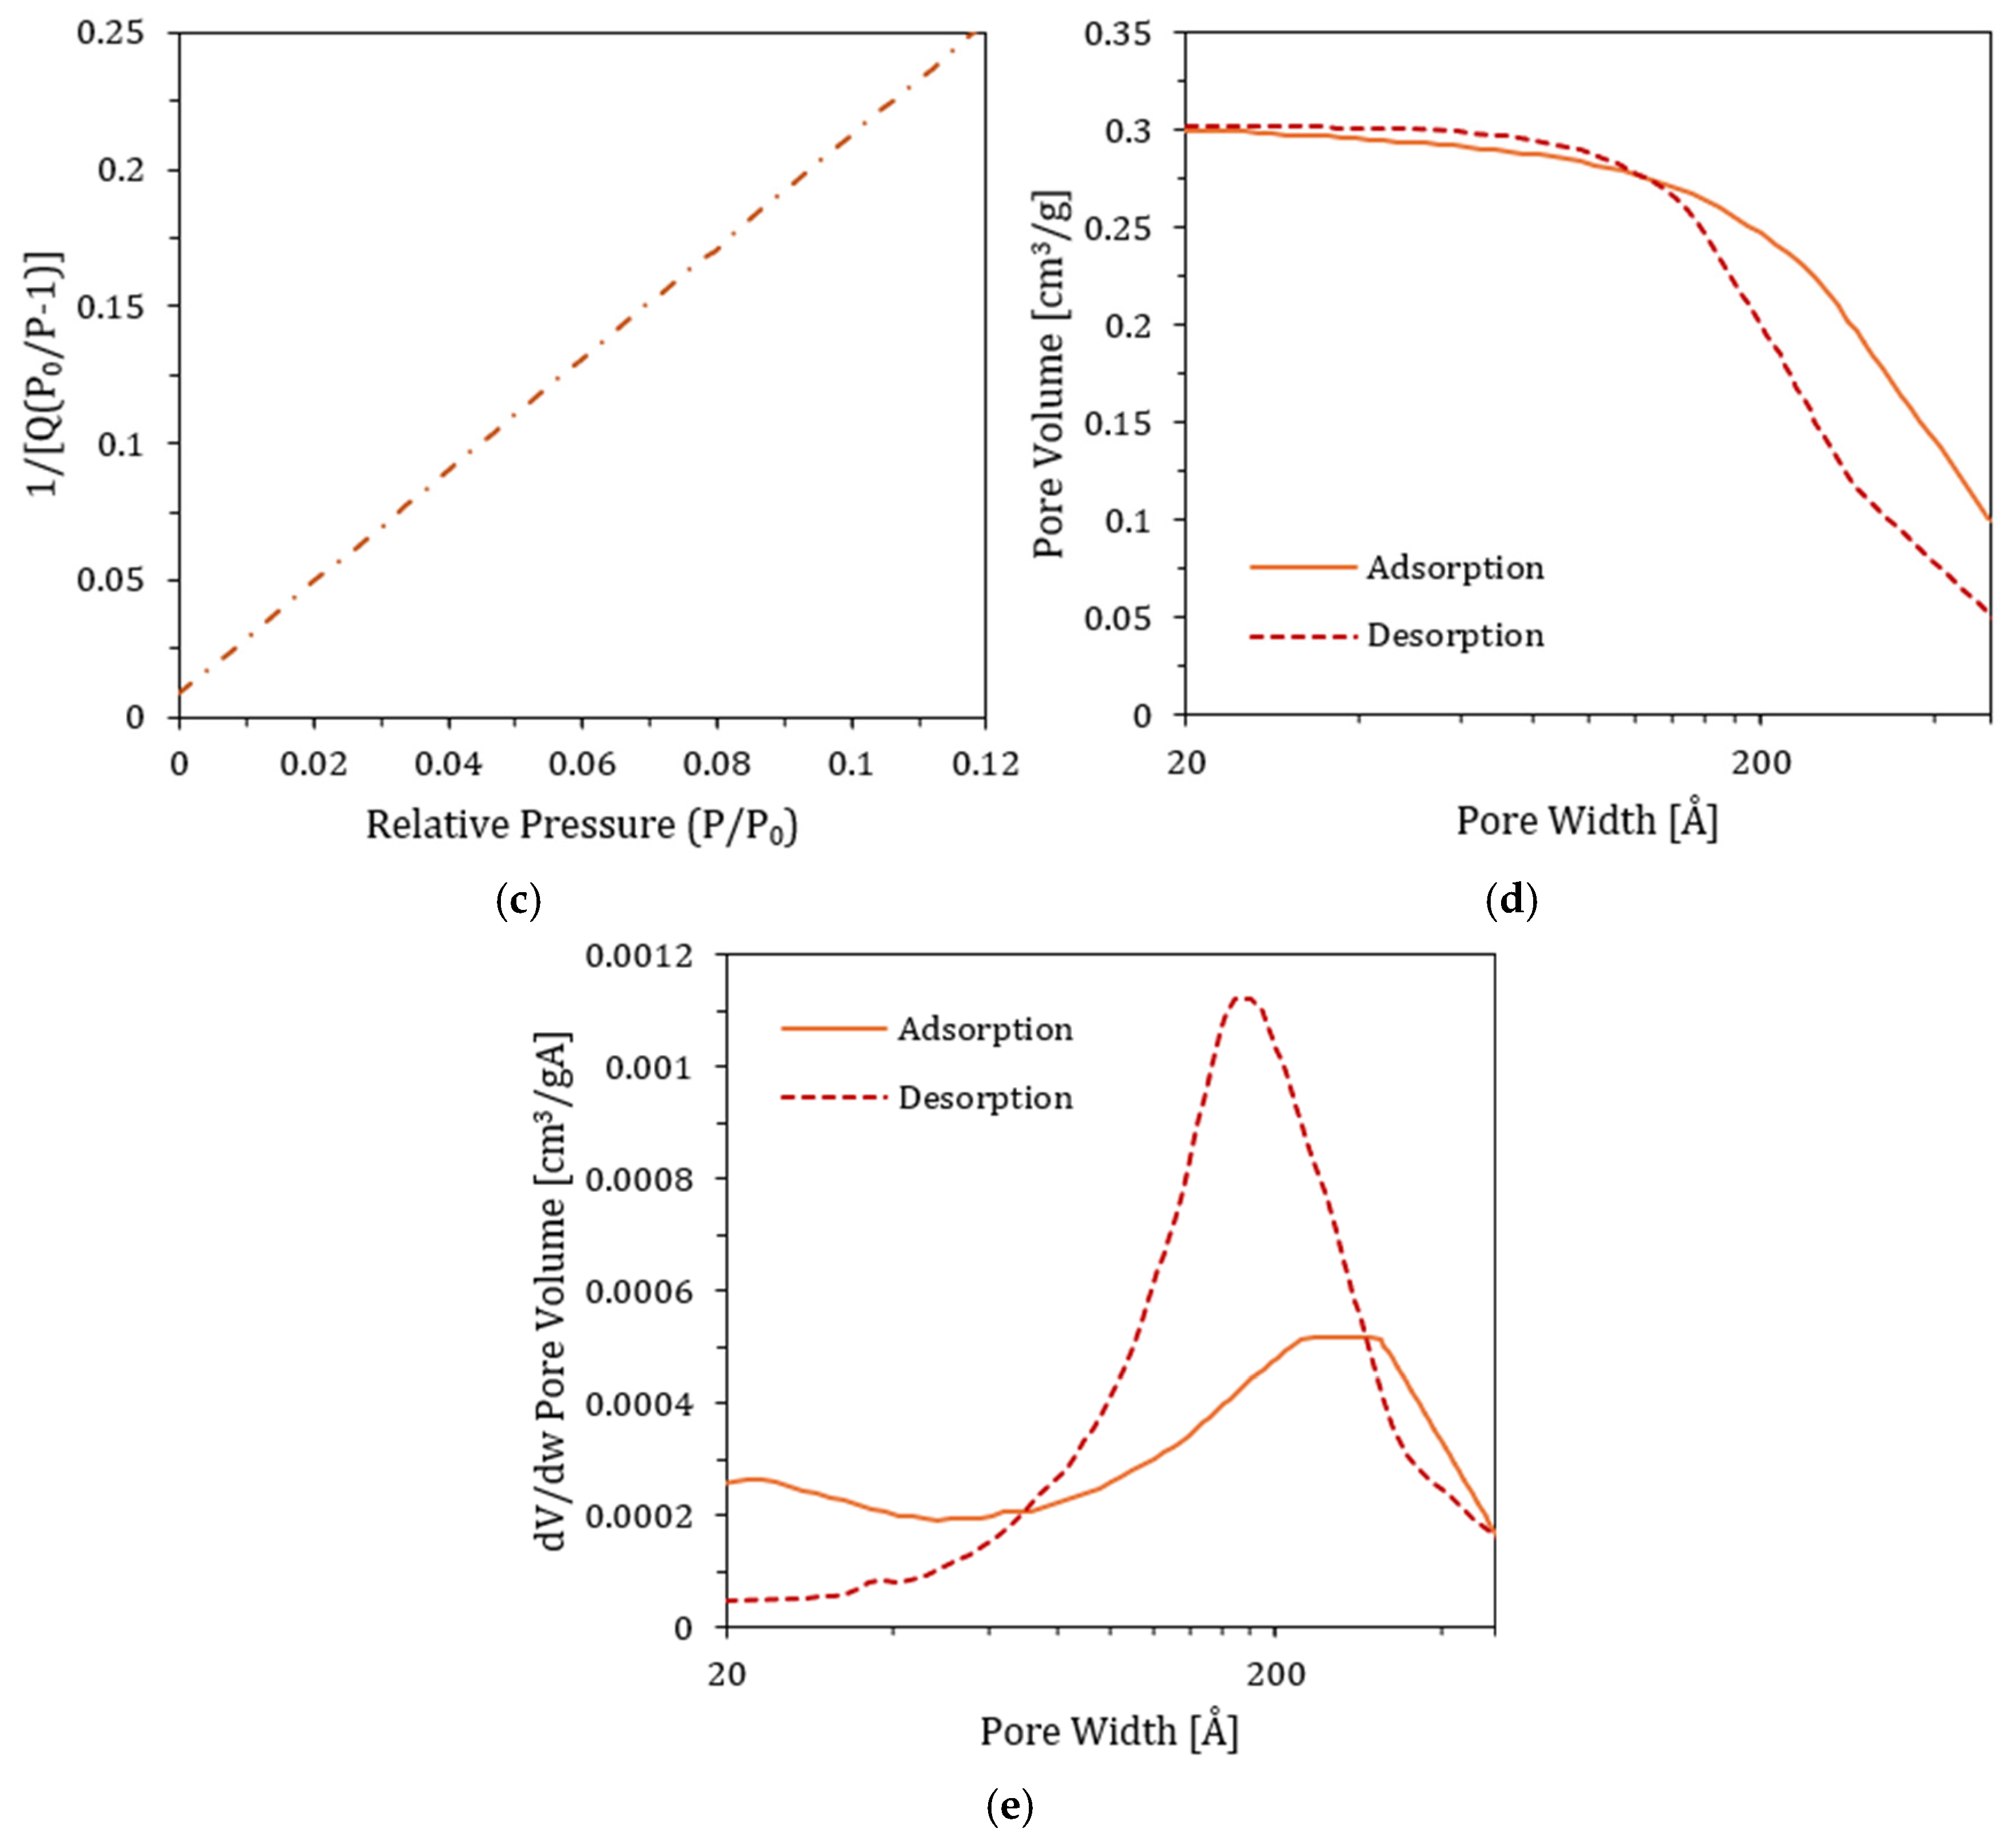
3.8. Physisorption Test and Total Surface Area (TSA)
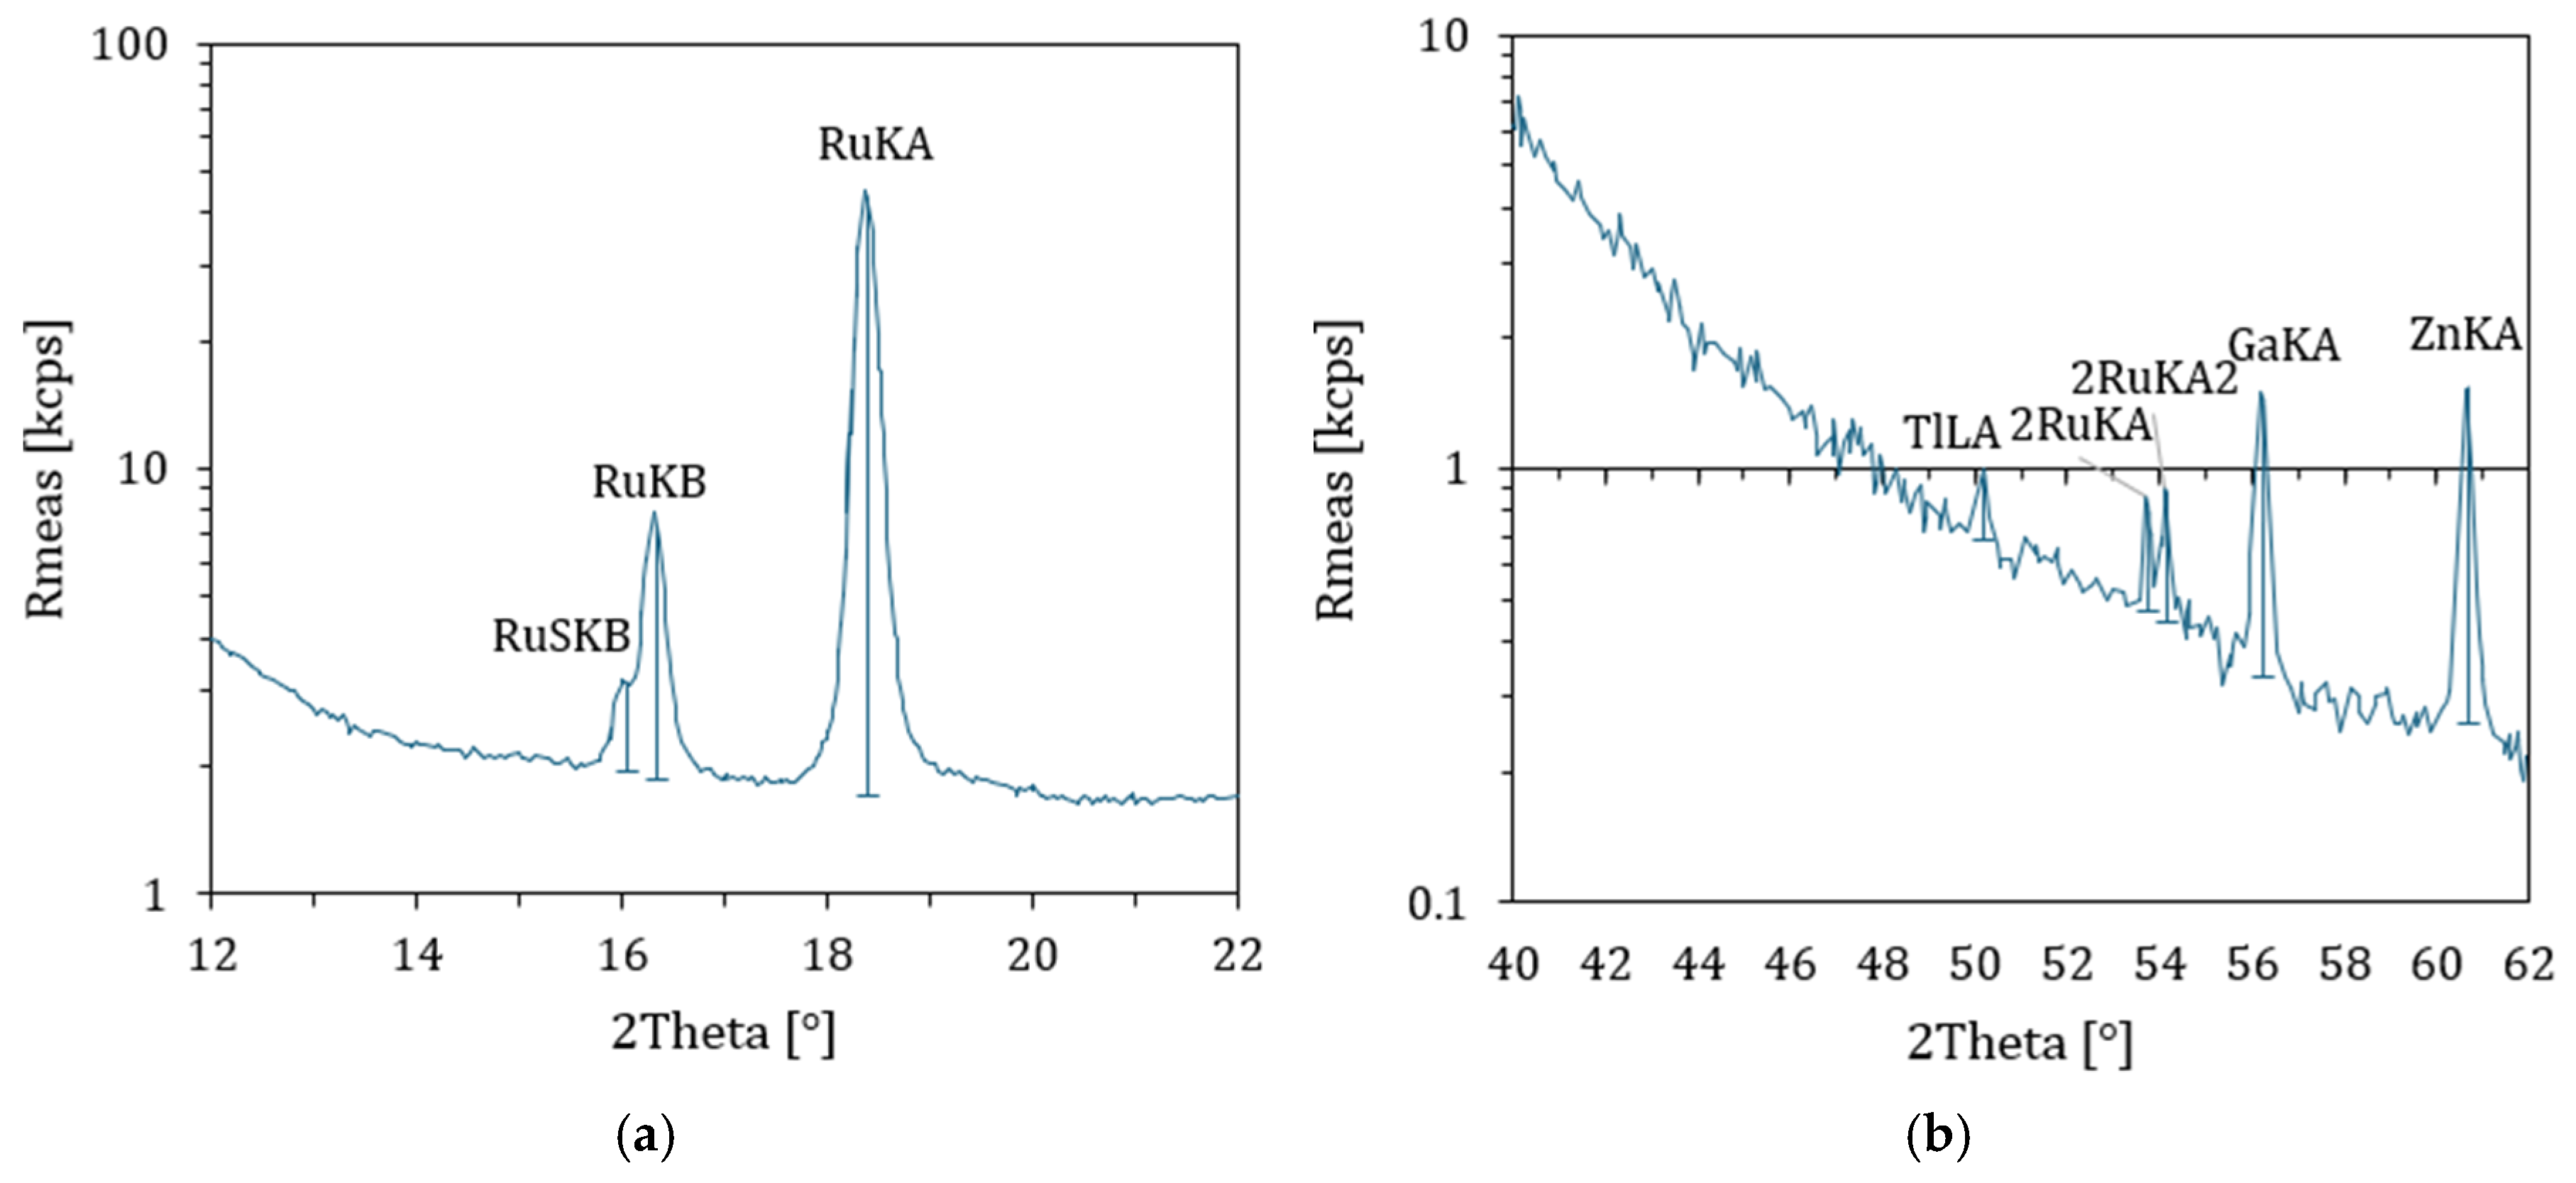
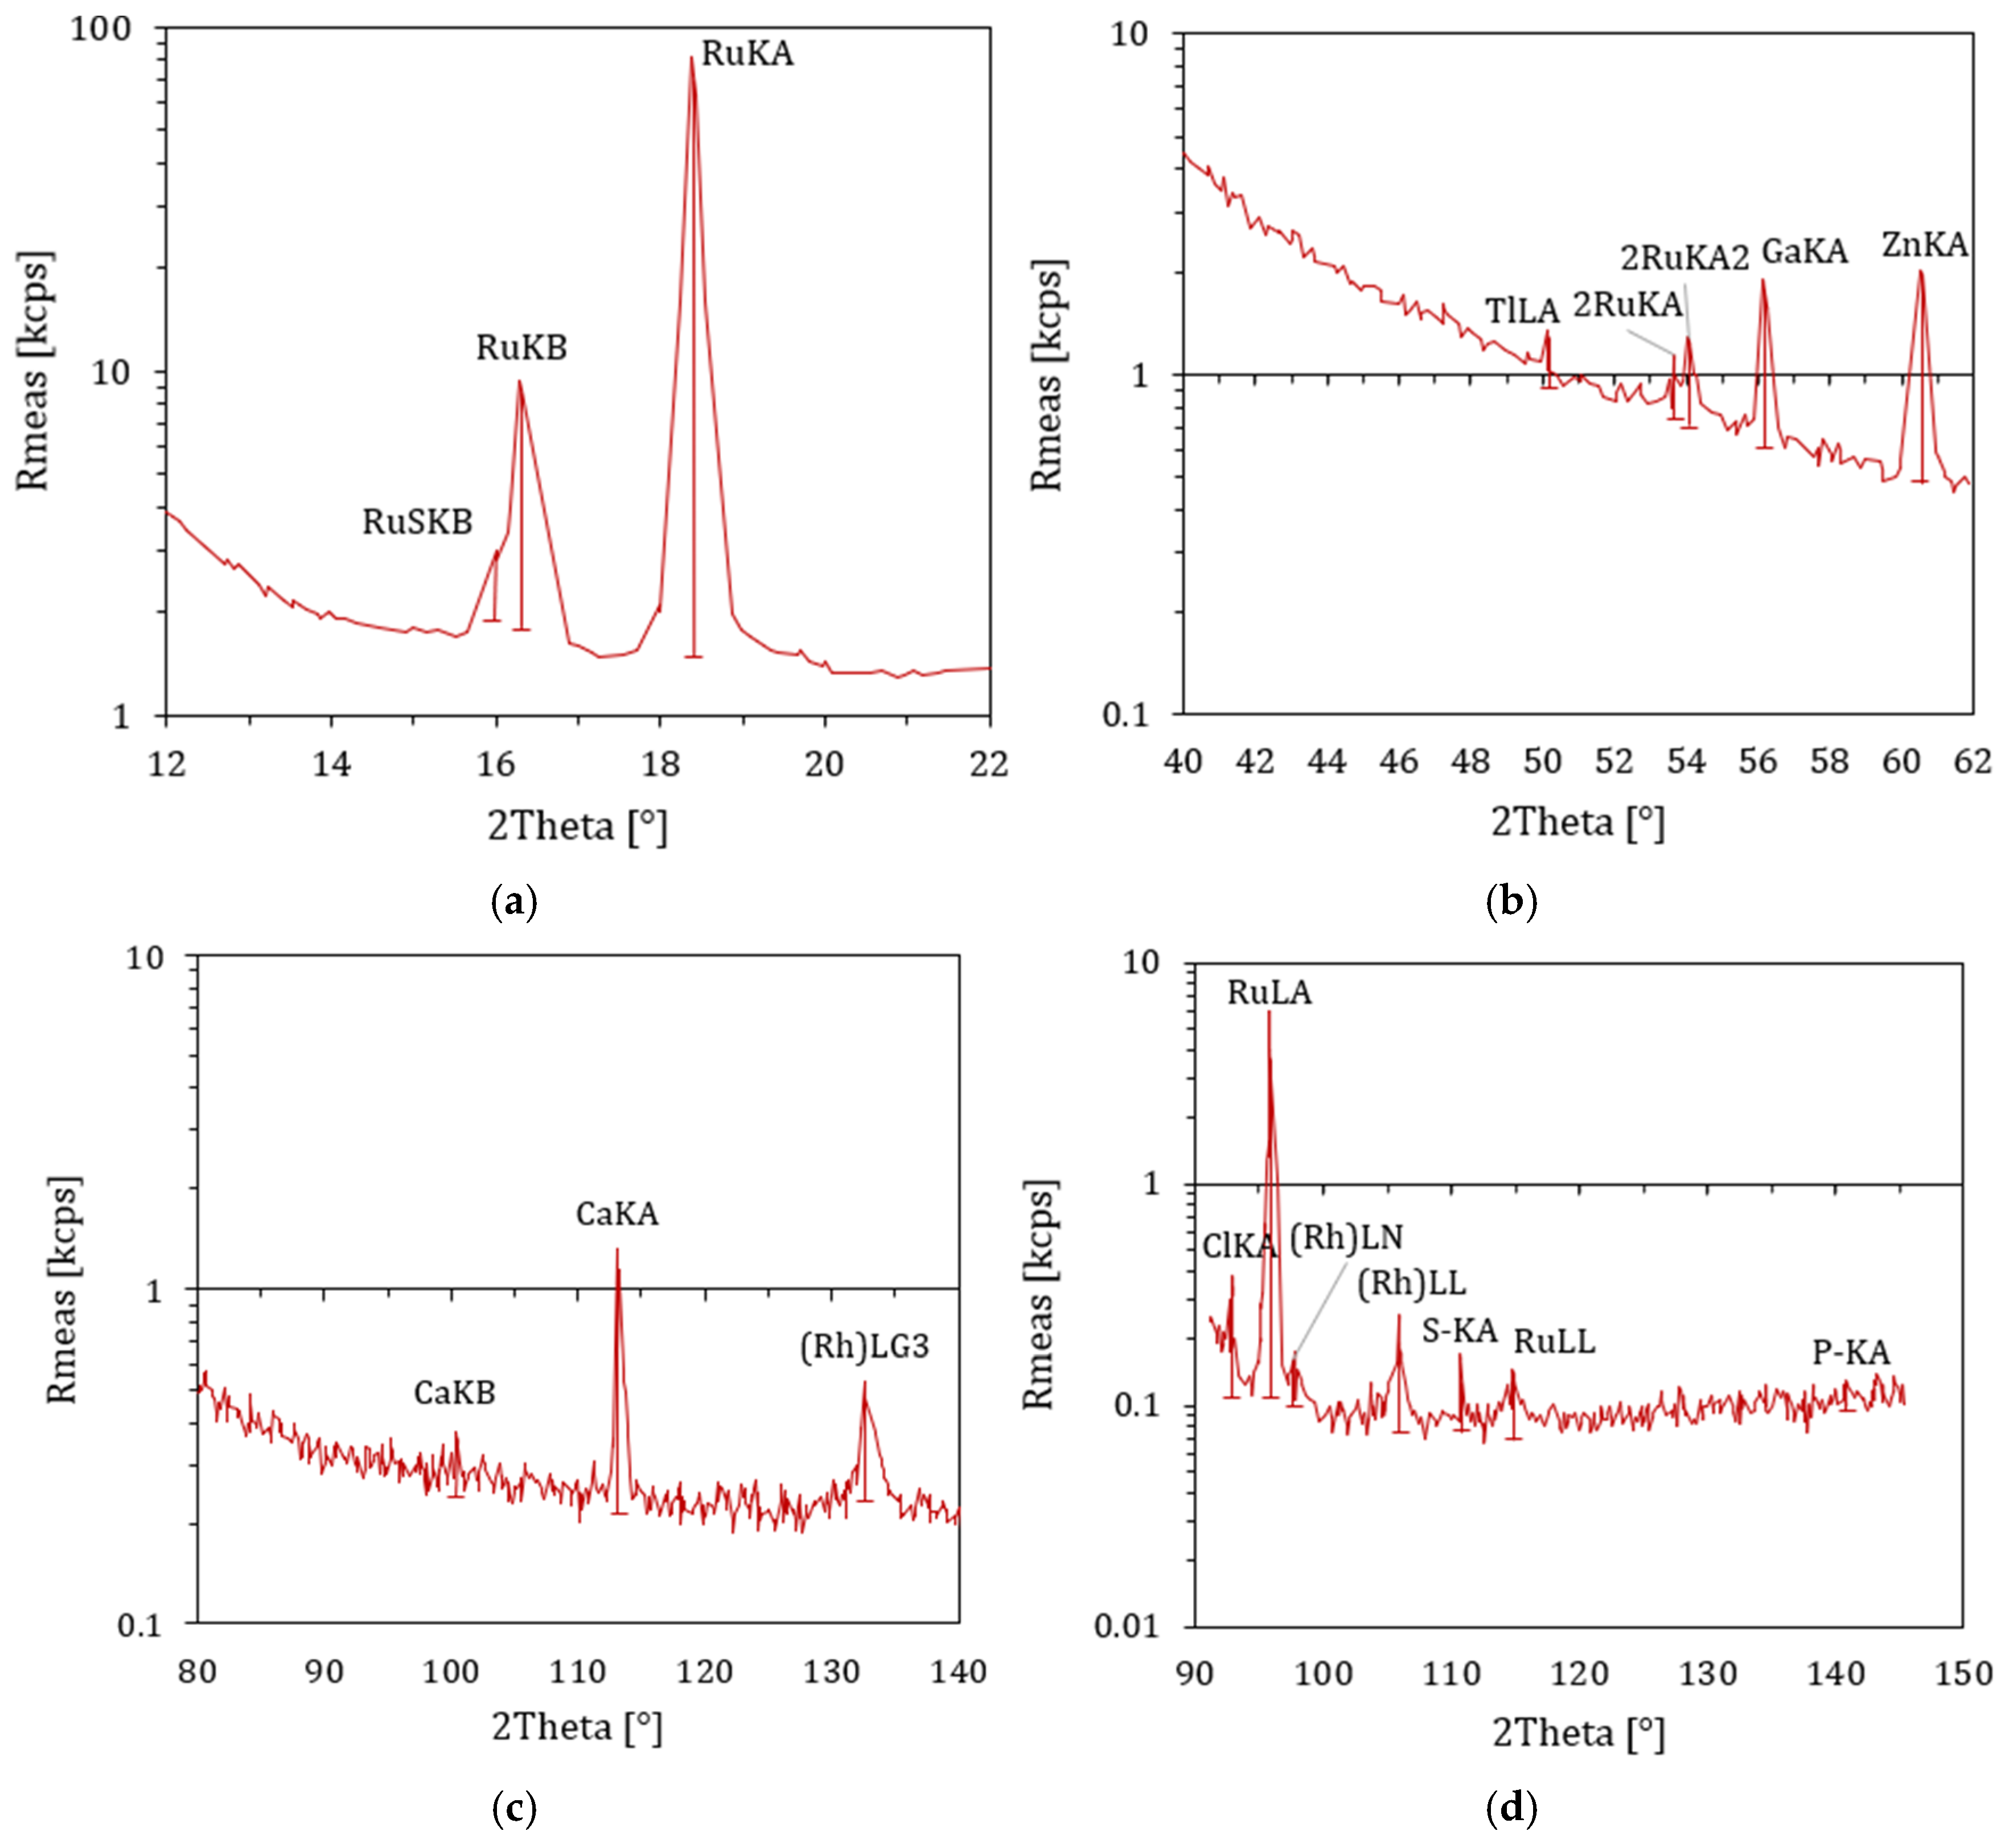
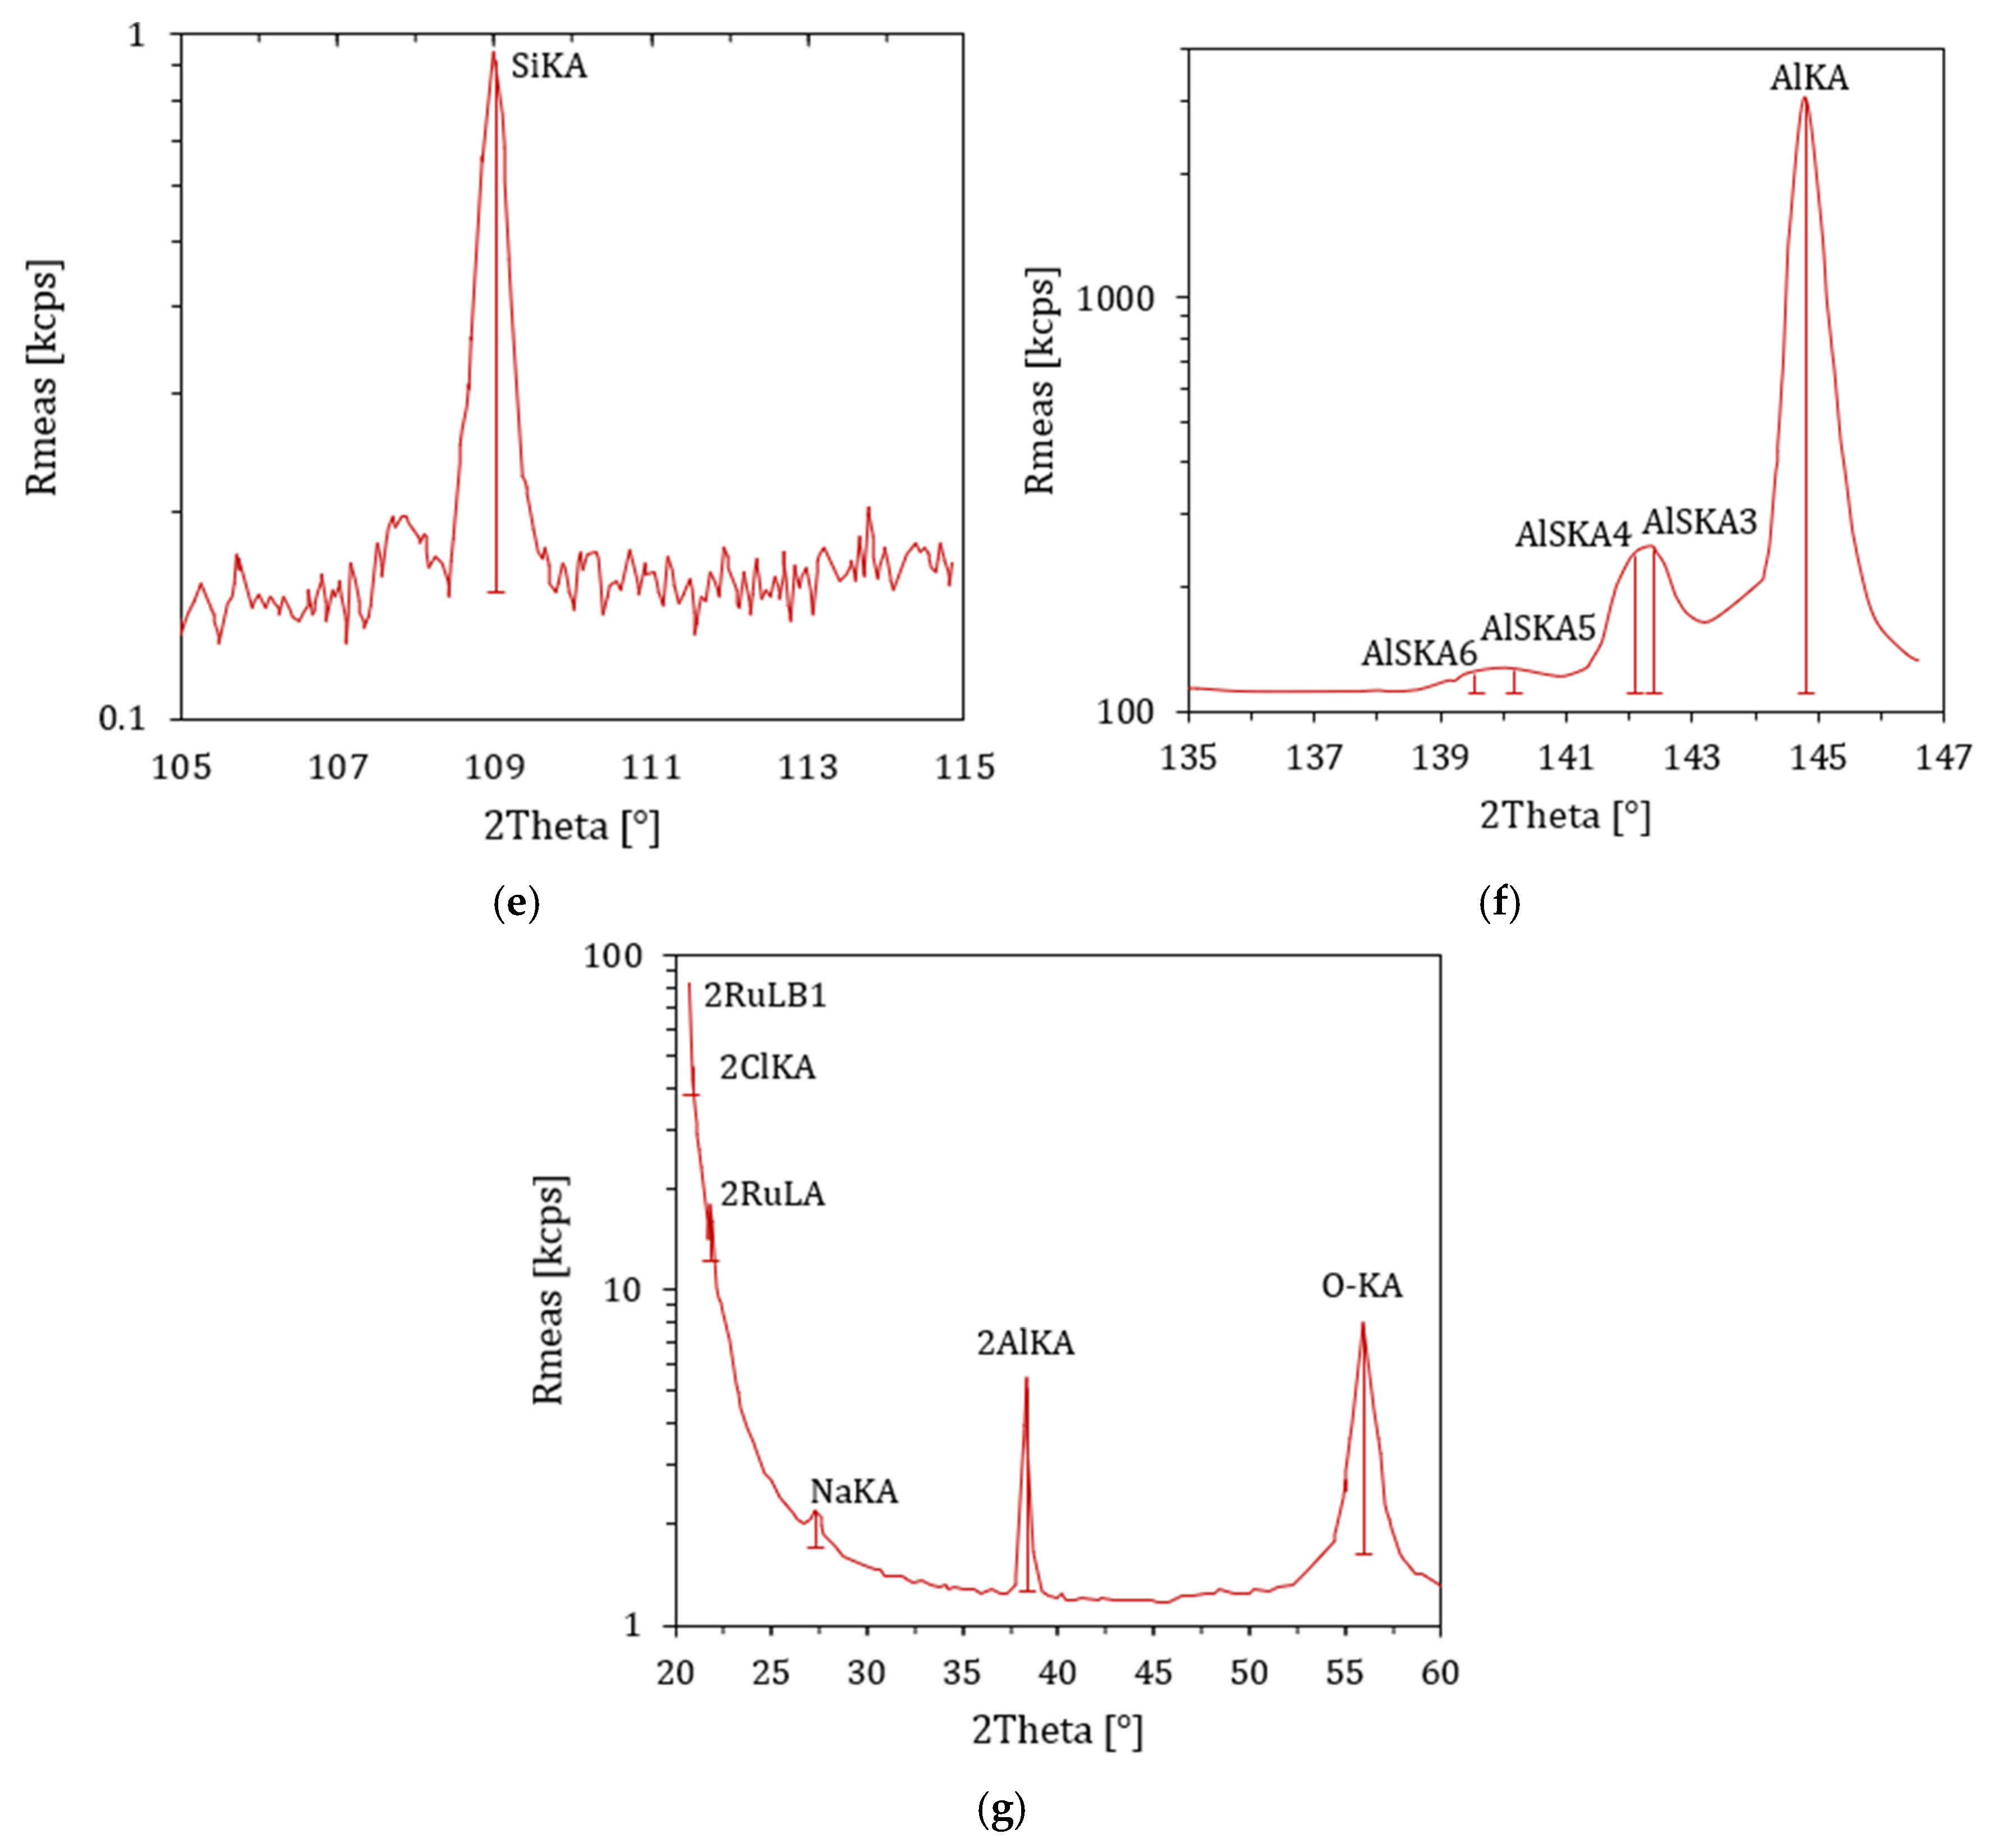
3.9. XRF
3.10. Carbon and Sulphur Analysis
4. Results and Discussion
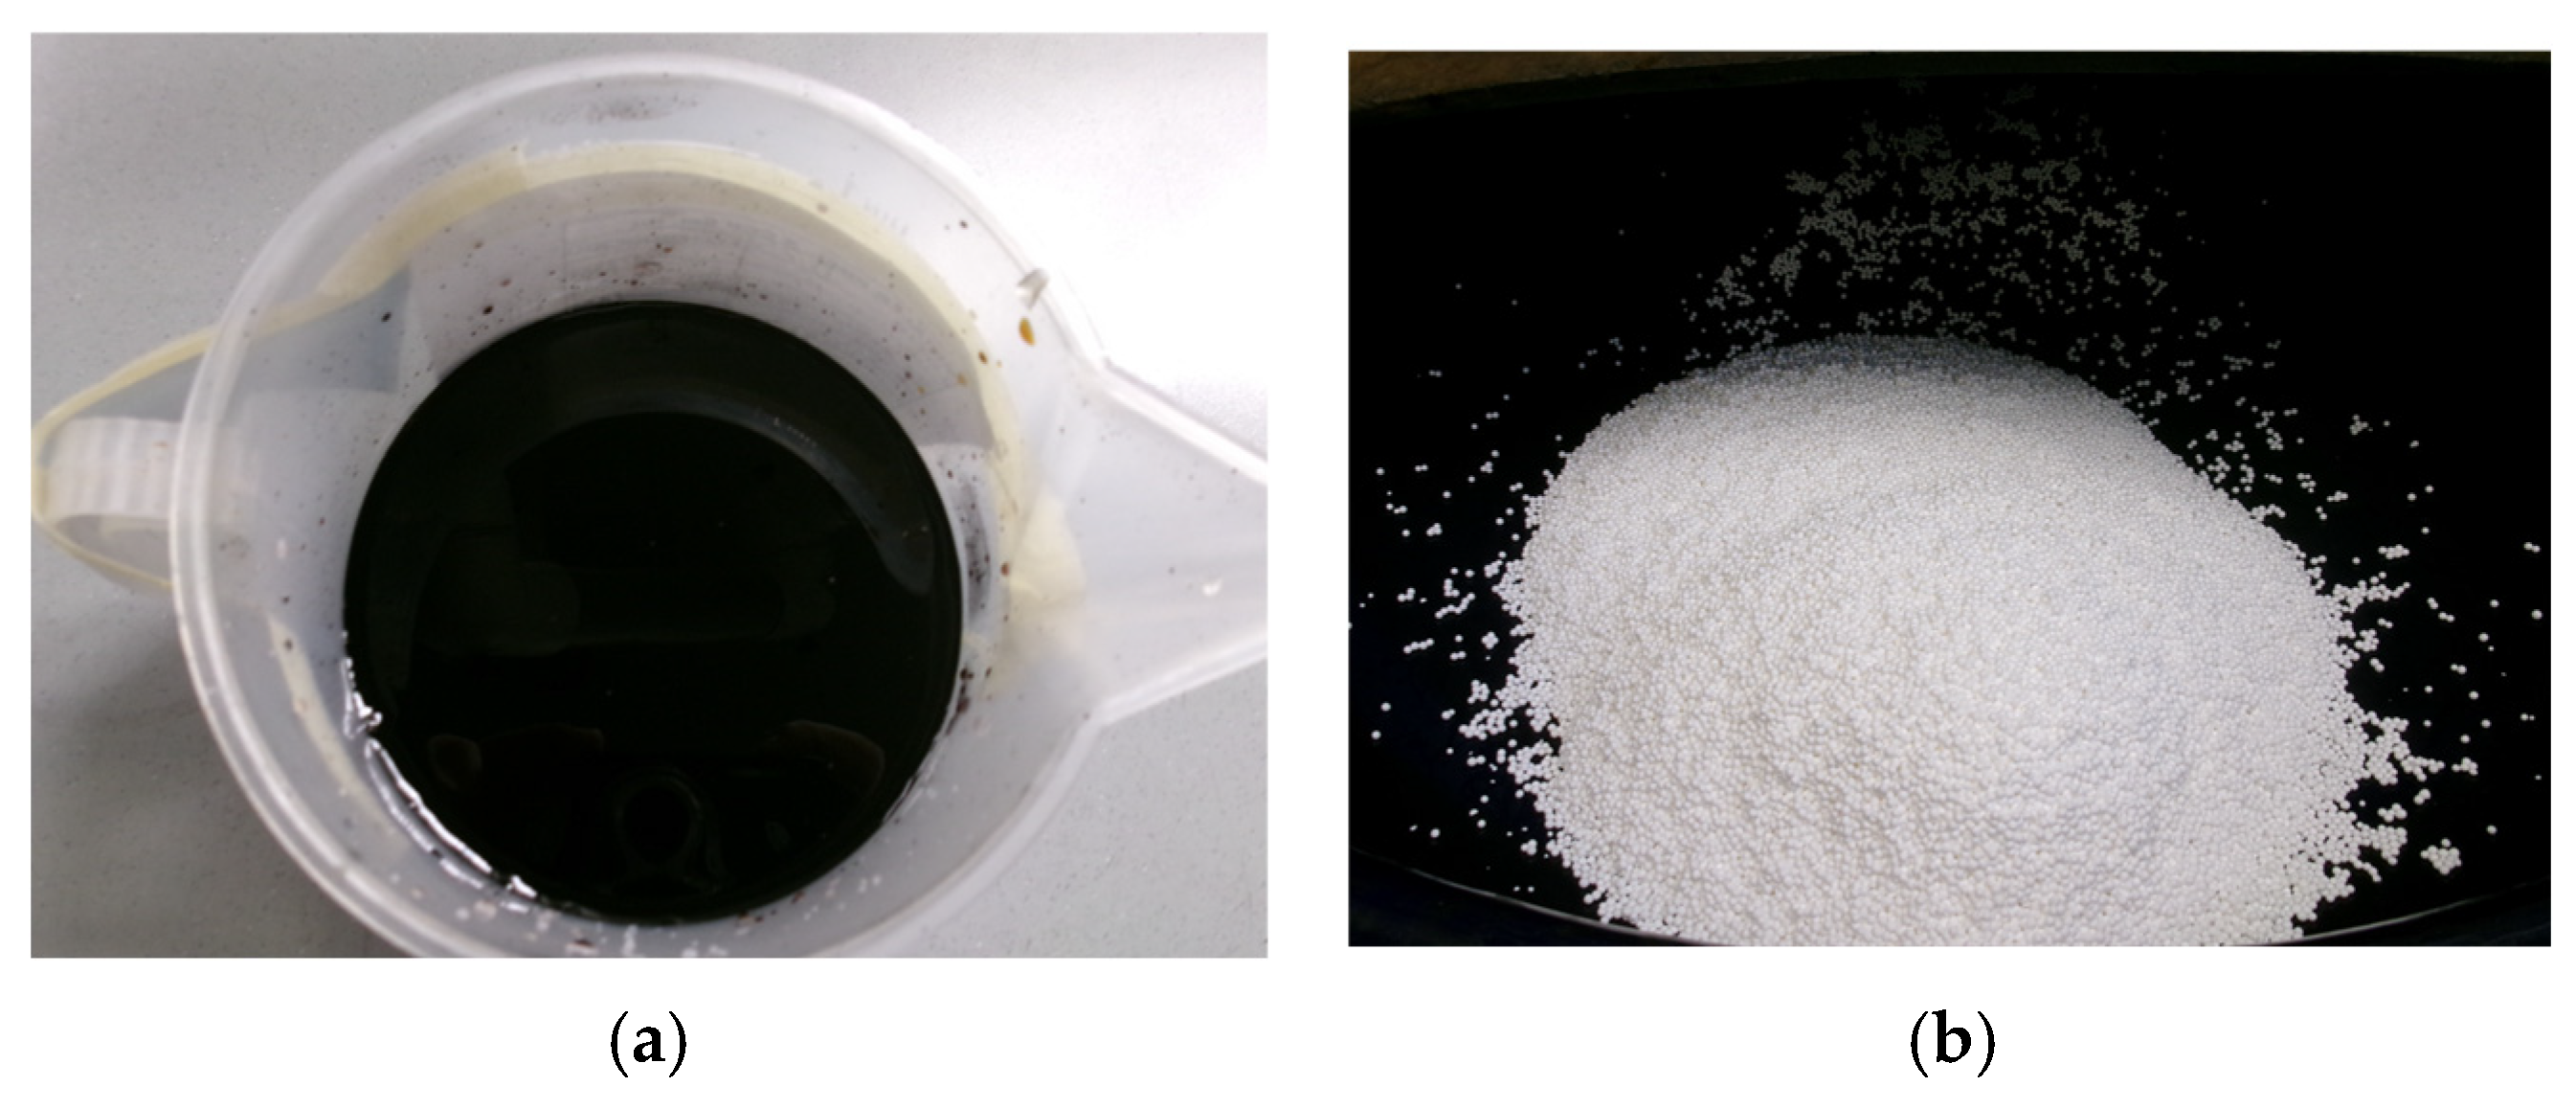
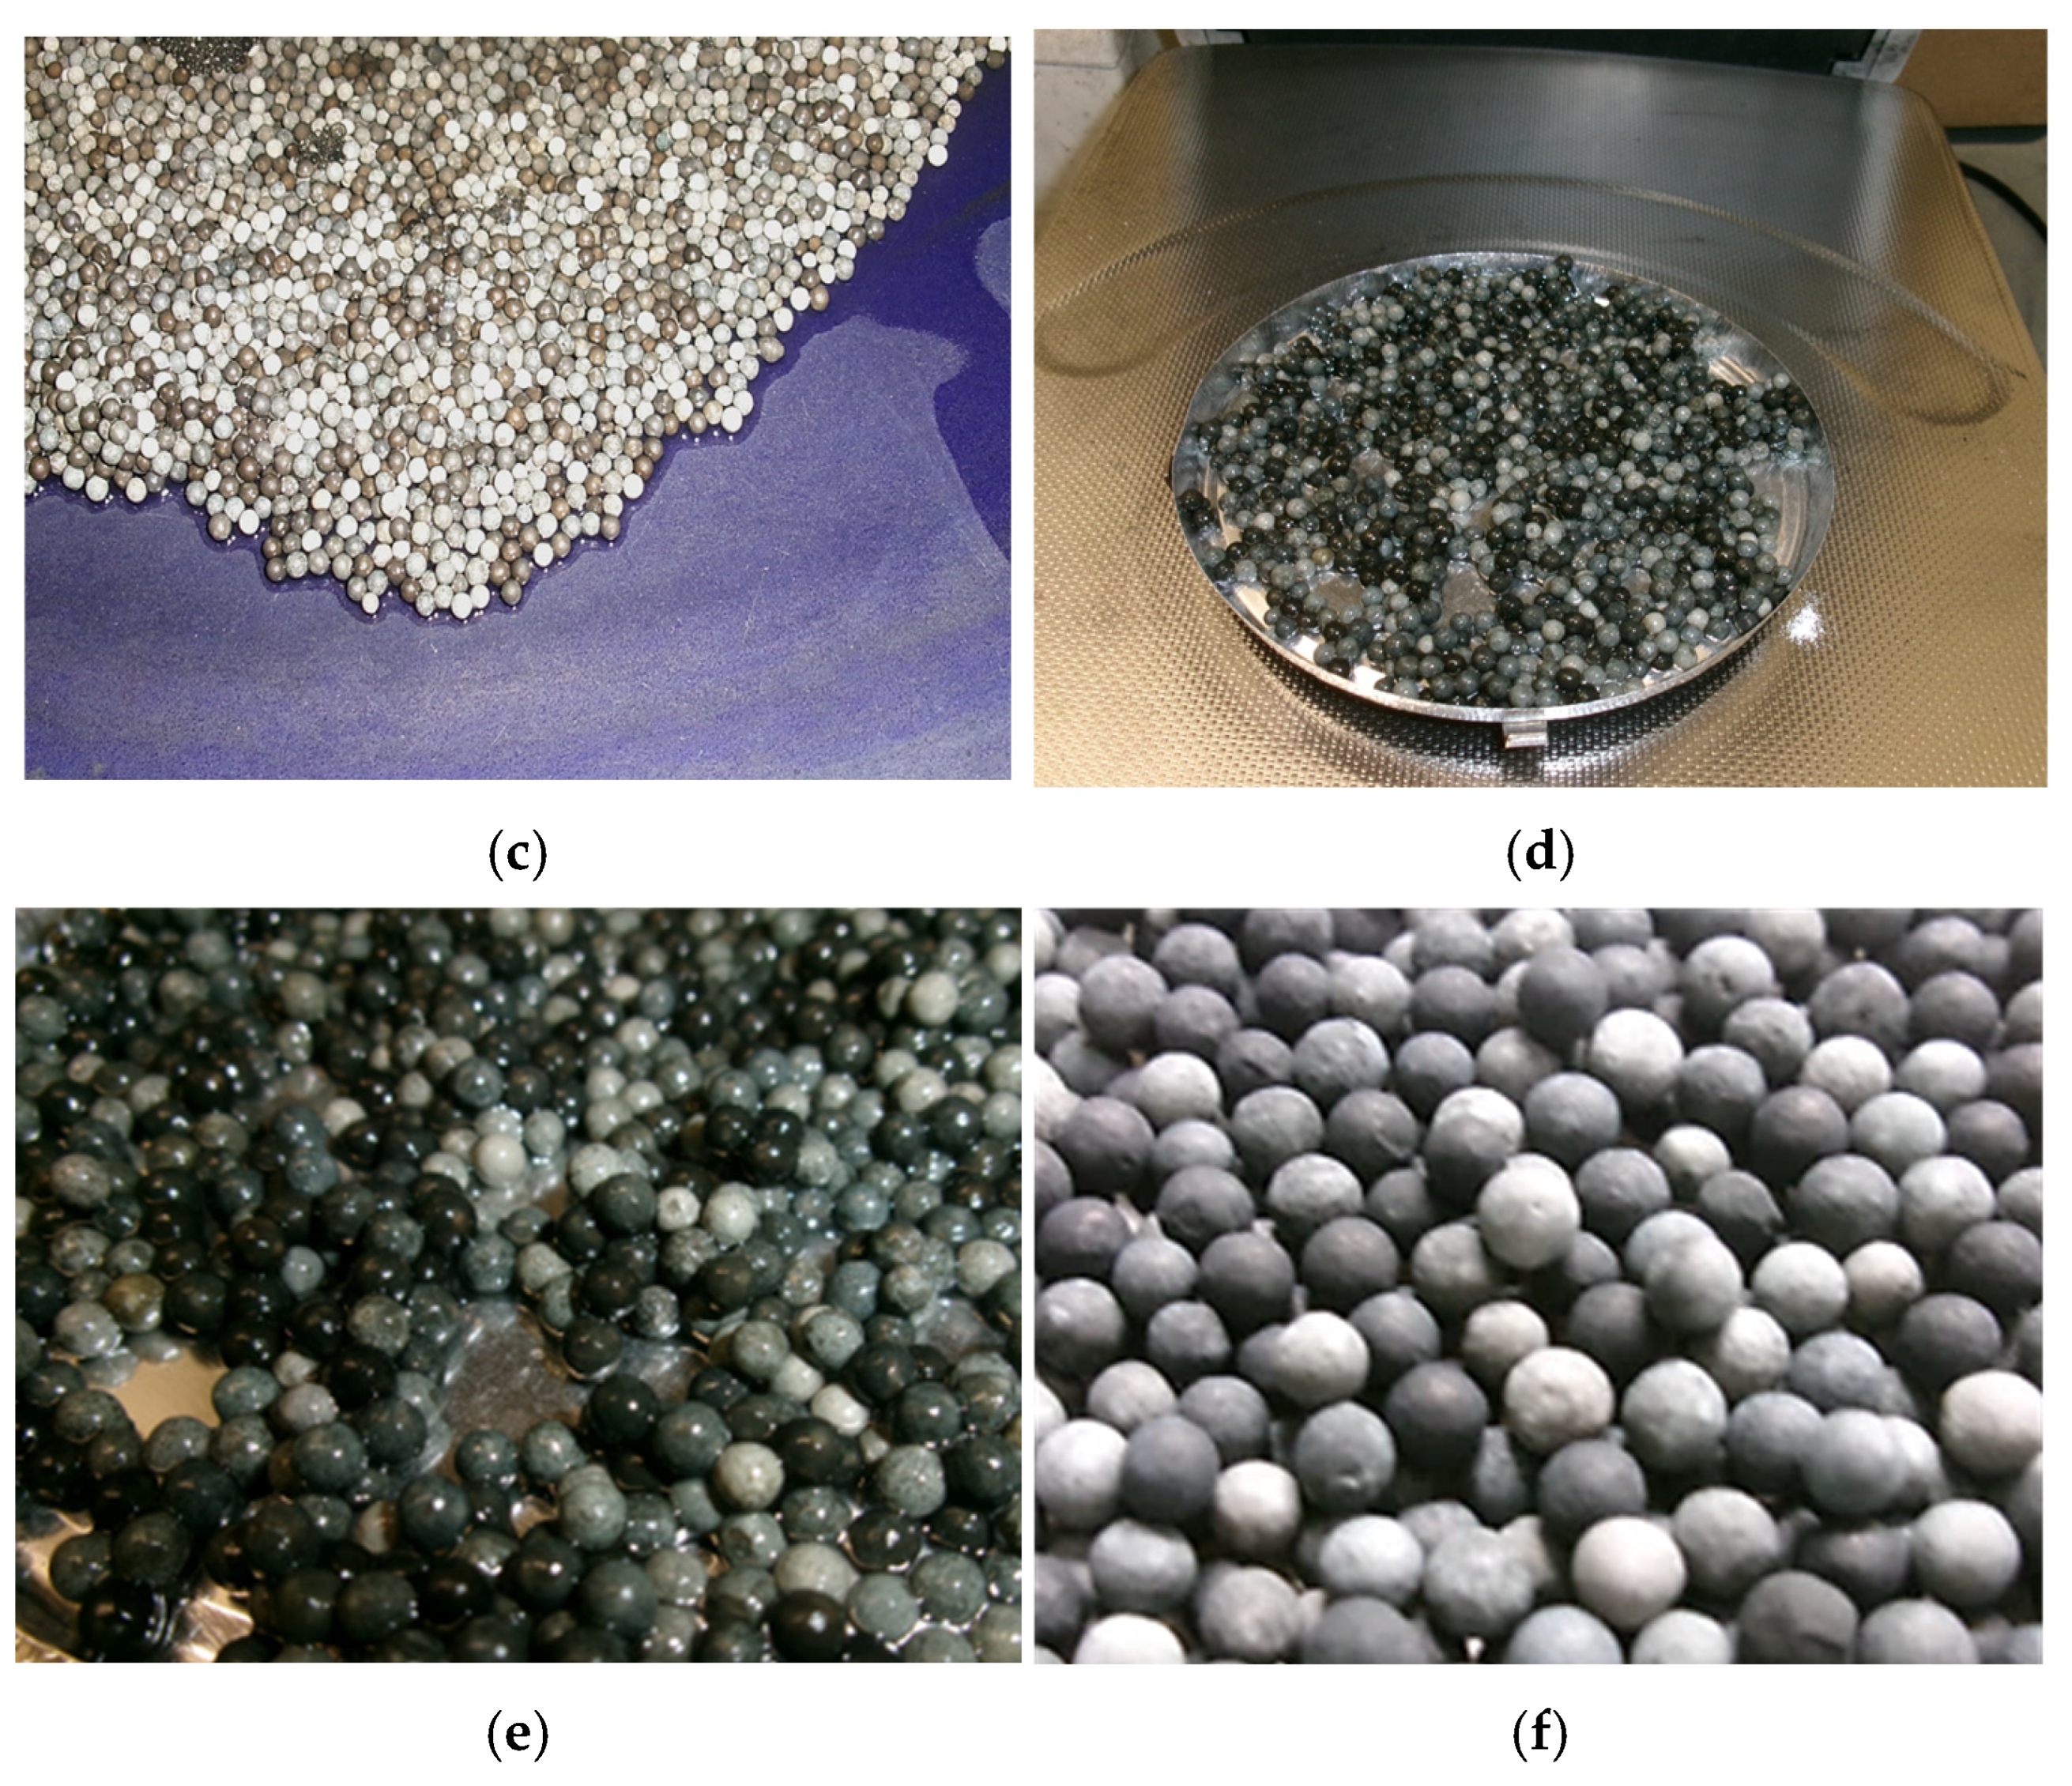
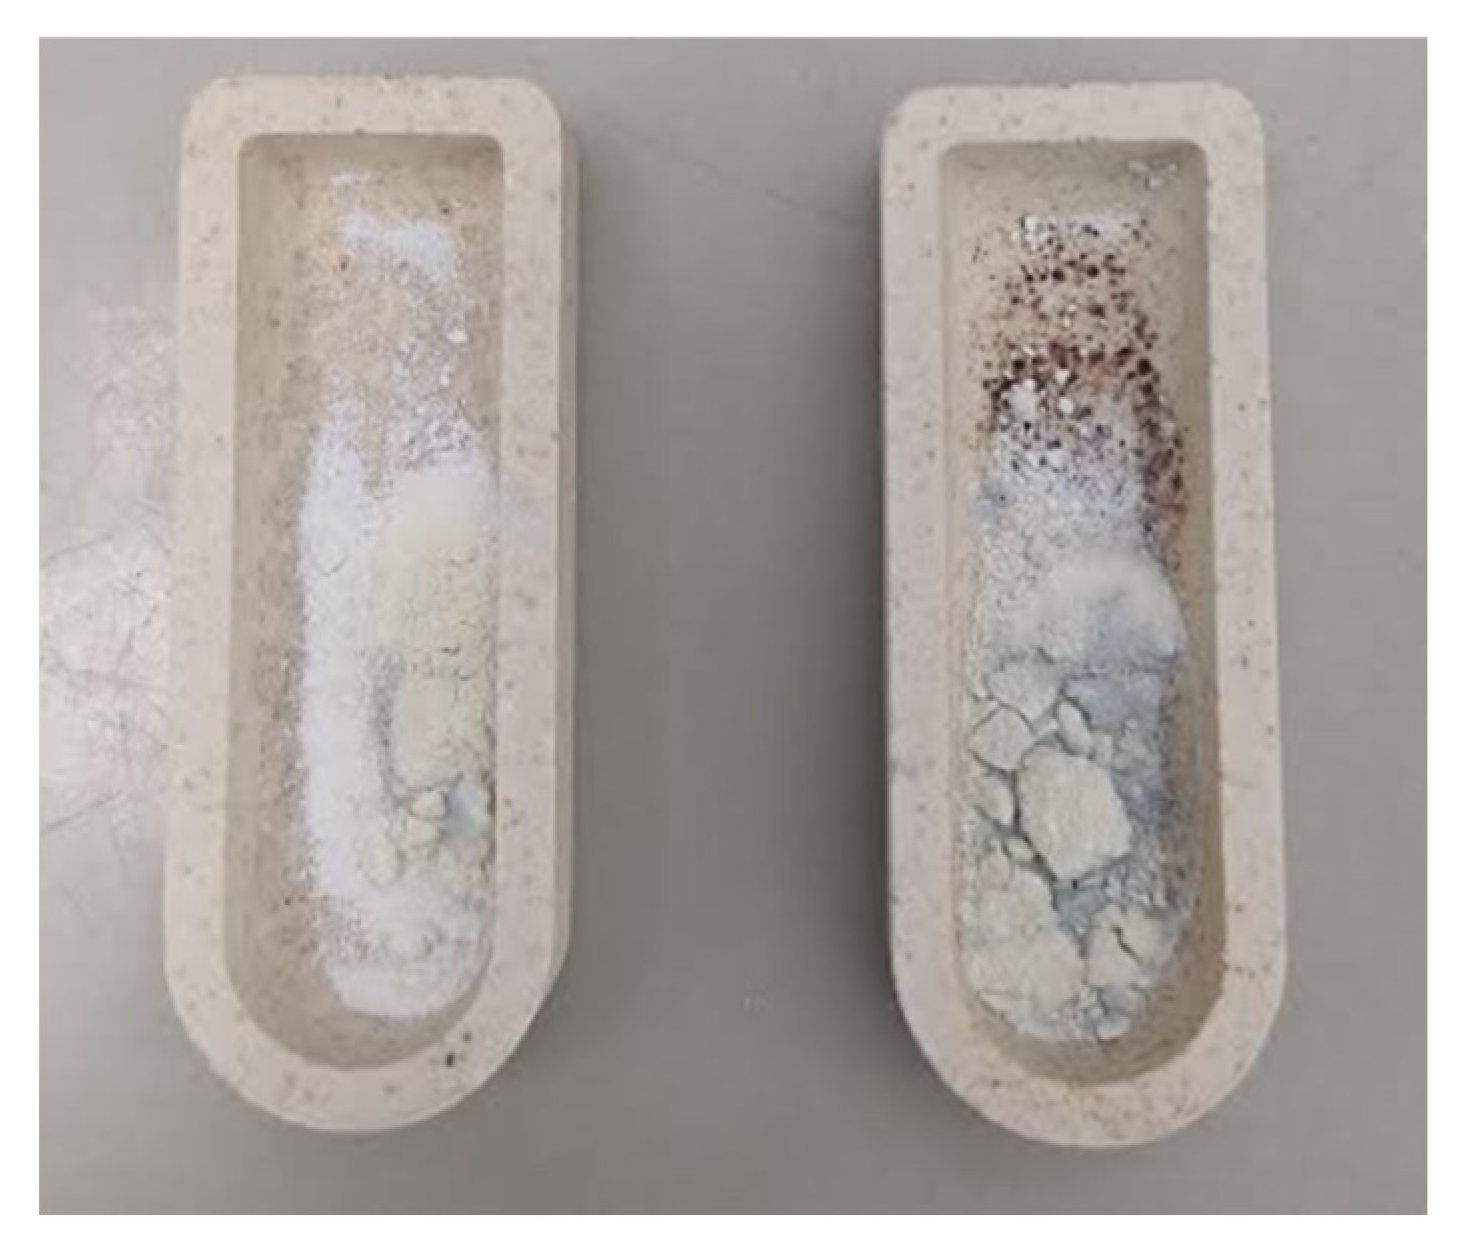
4.1. Preparation Results
4.2. ICP-OES Results
4.3. Chloride Analysis Results
4.4. Free and Tapped Bulk Density Results
4.5. Attrition Loss Results
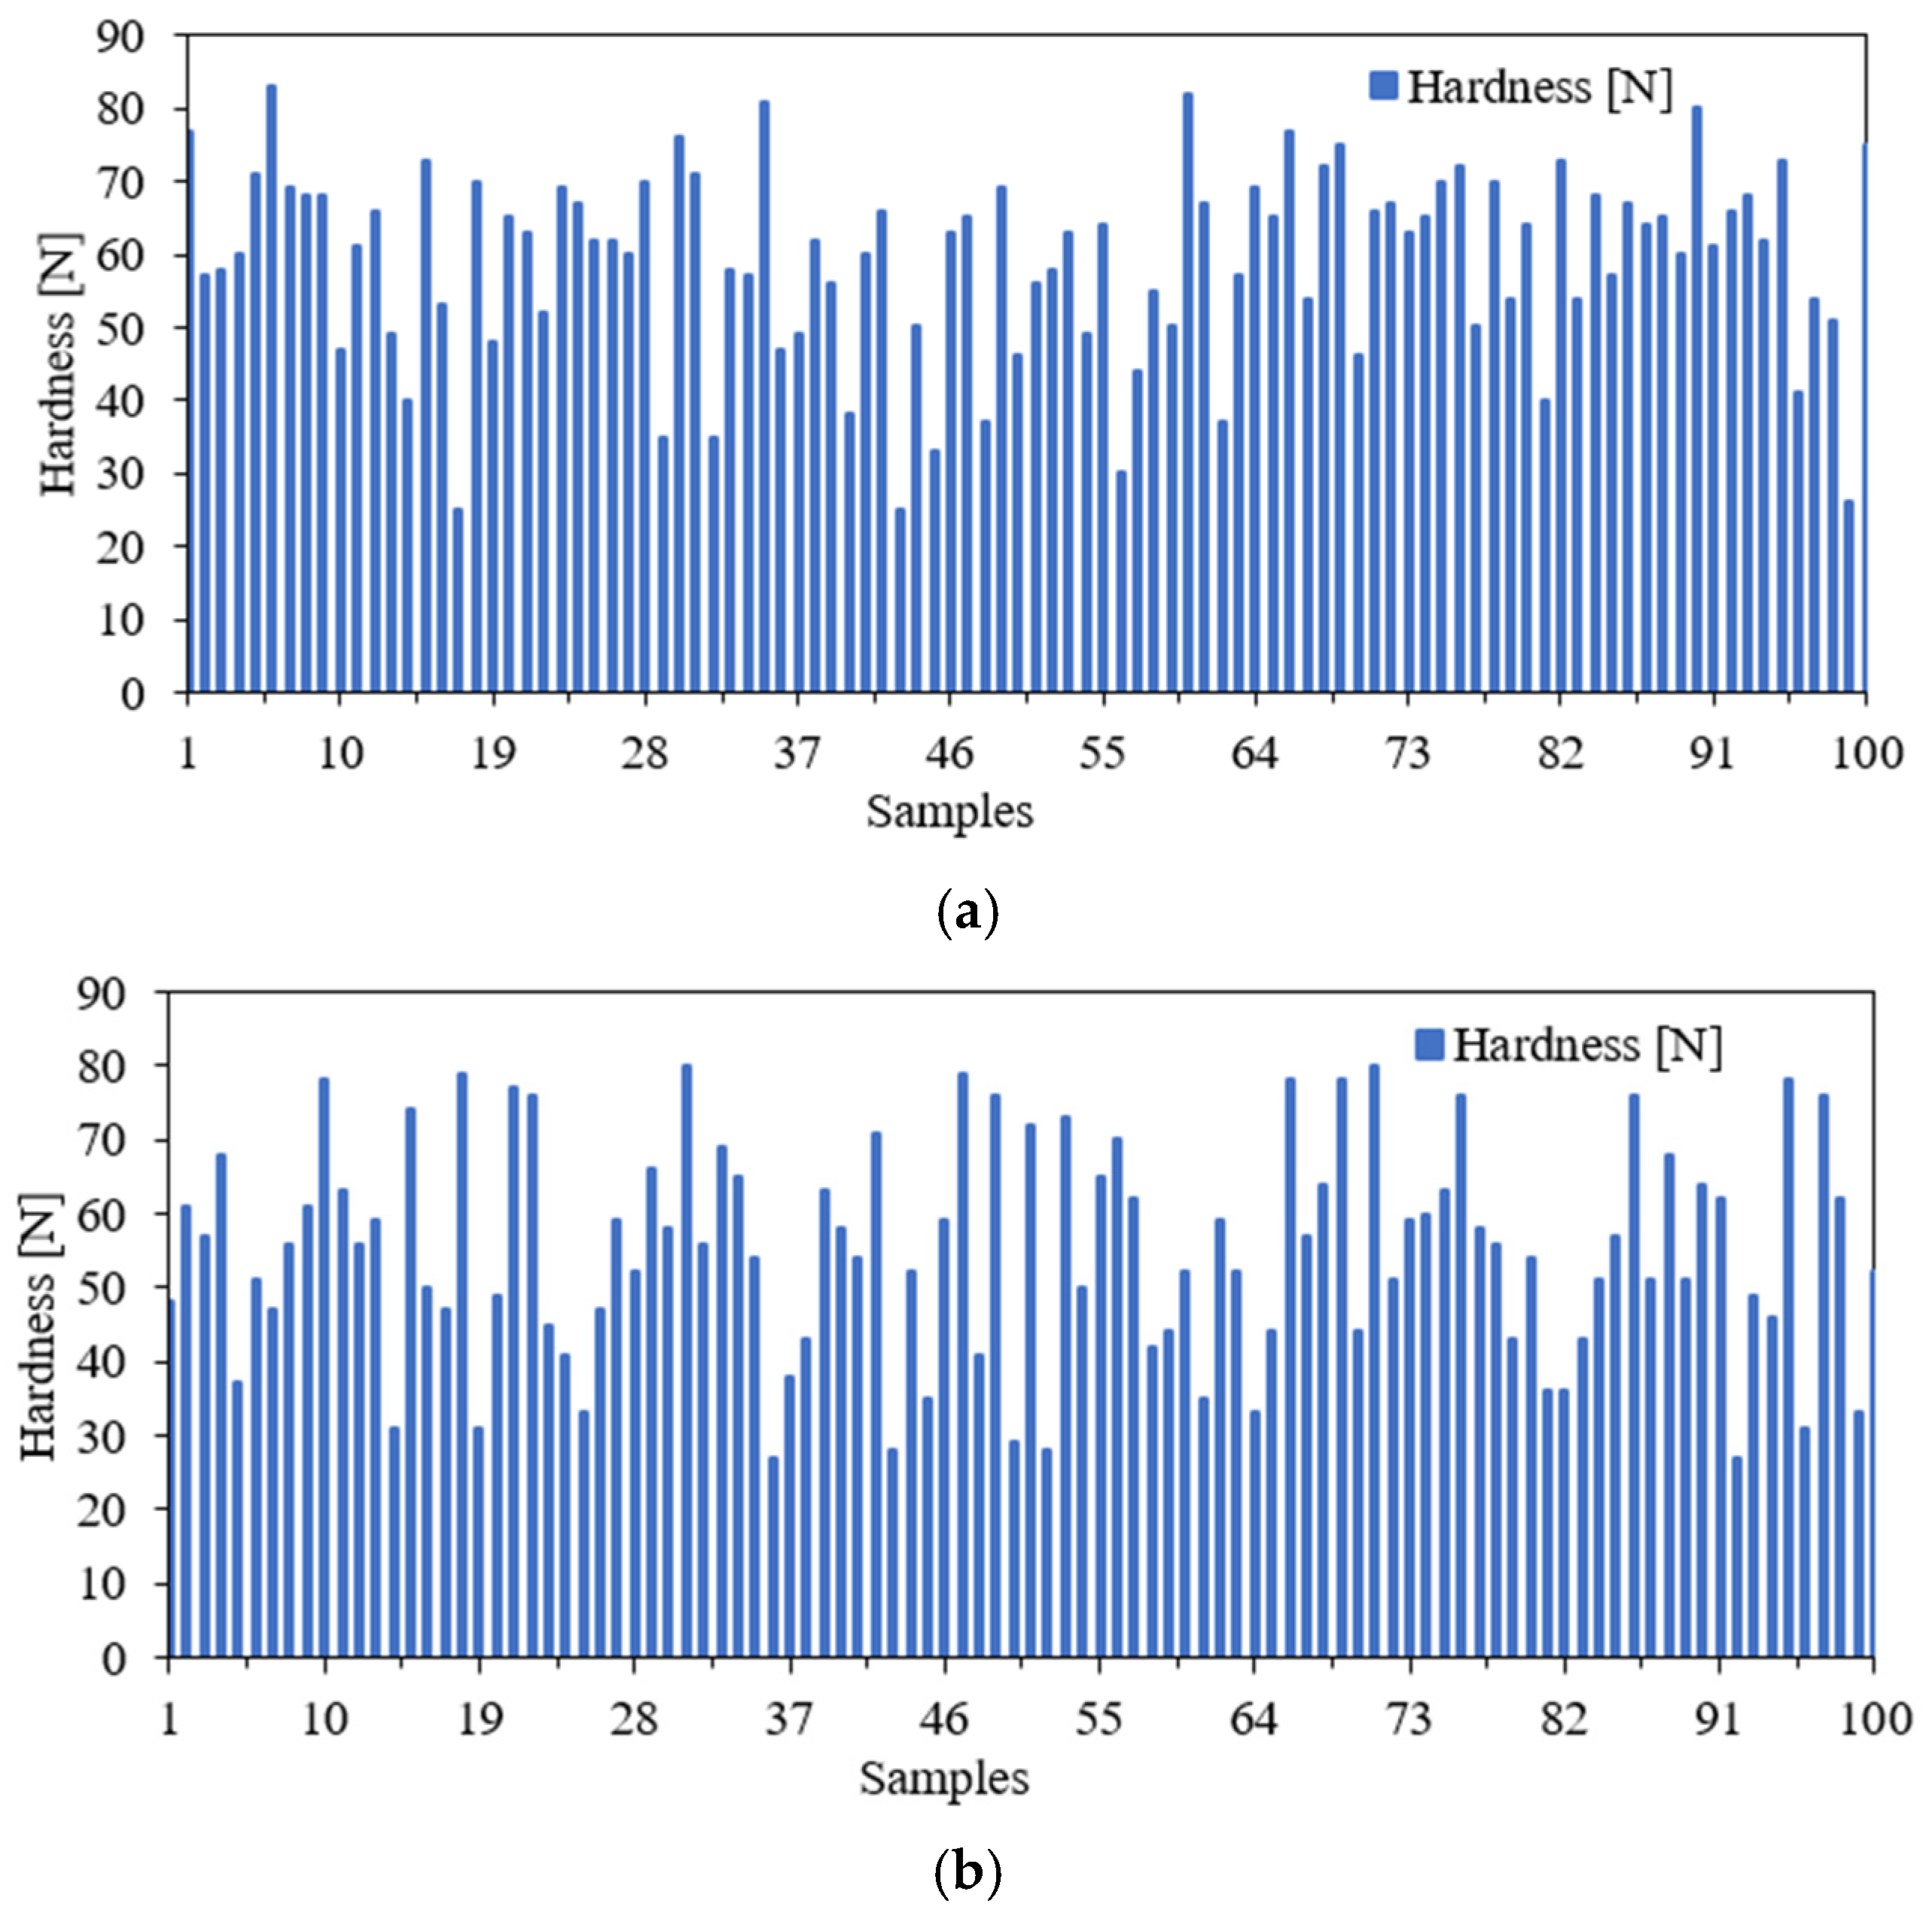
4.6. Crushing Test Results
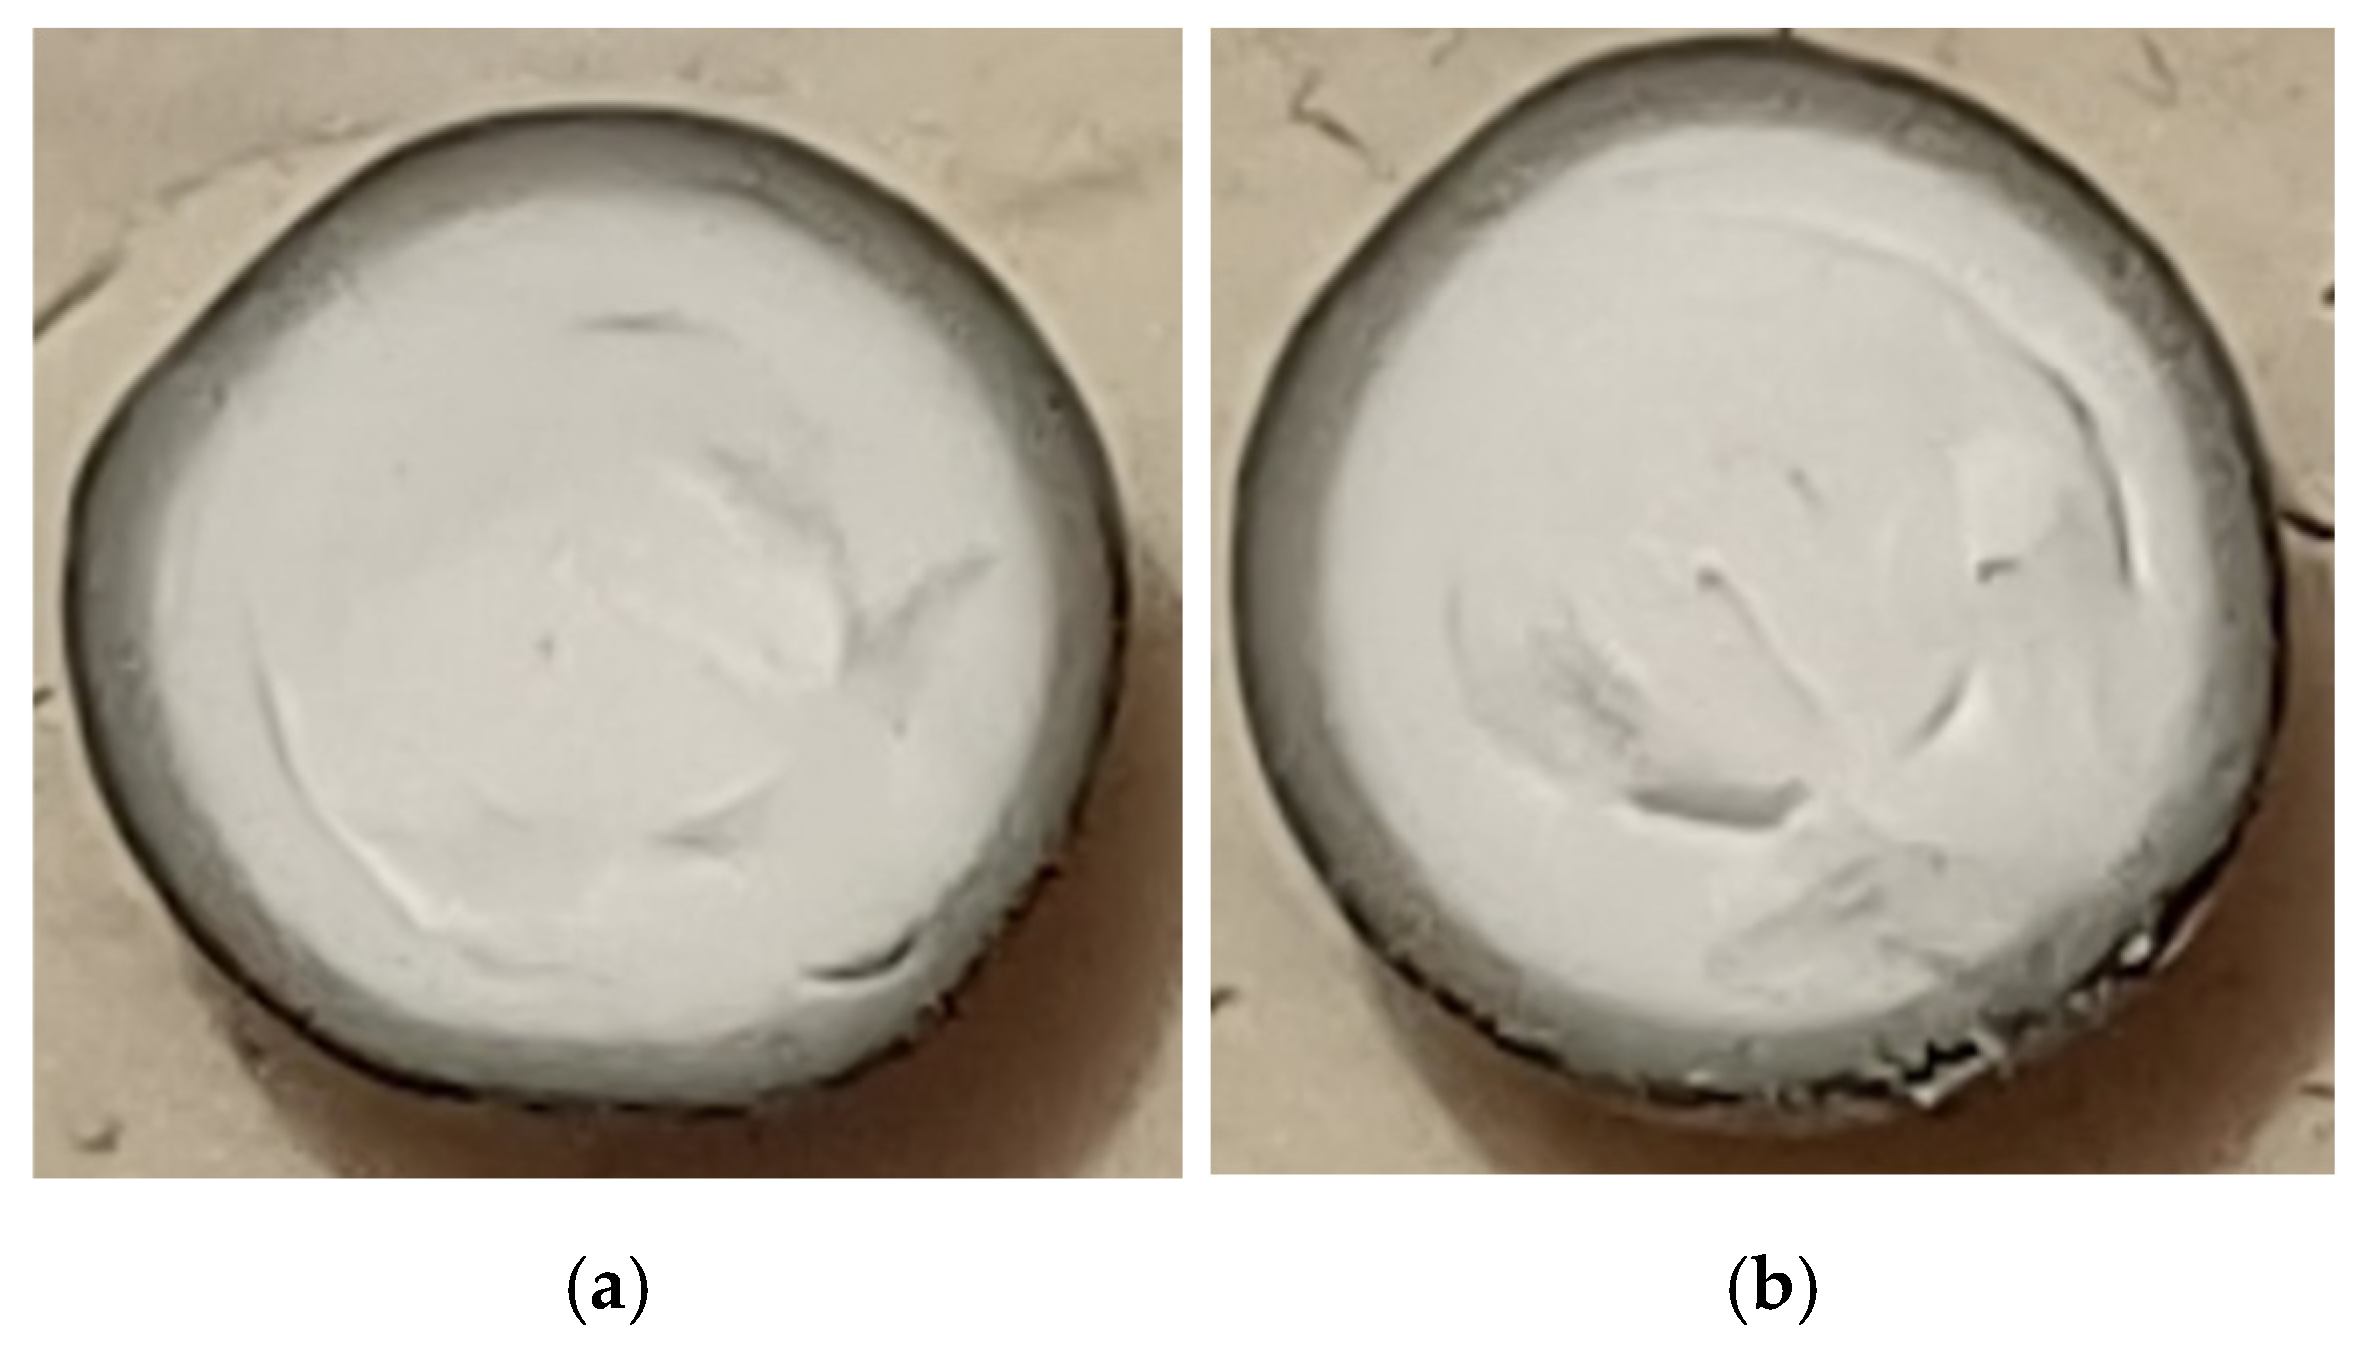
4.7. PMP Results
4.8. MSA Chemisorption Test Results
4.9. TSA Results
4.10. XRF Results
4.11. C and S Results
5. Conclusions
Author Contributions
Funding
Data Availability Statement
Acknowledgments
Conflicts of Interest
Abbreviations
| PtG | Power to Gas |
| SNG | Synthetic Natural Gas |
| RWGS | Reverse Water Gas Shift |
| PFR | Plug Flow Reactor |
| ICP-OES | Inductively Coupled Plasma Optical Emission Spectroscopy |
| PMP | Precious Metal Penetration |
| MSA | Metal Surface Area |
| TSA | Total Surface Area |
| XRF | X-ray Fluorescence |
| BET | Brunauer–Emmett–Teller |
| BJH | Barrett–Joyner–Halenda |
| NDIR | Non-dispersive infrared |
| ERC | Equivalence Point Recognition Criterion |
| TCD | Thermal Conductivity Detector |
References
- Gayen, D.; Chatterjee, R.; Roy, S. A Review on Environmental Impacts of Renewable Energy for Sustainable Development. Int. J. Environ. Sci. Technol. 2024, 21, 5285–5310. [Google Scholar] [CrossRef]
- Caglar, A.E.; Daştan, M.; Bulut, E.; Marangoz, C. Evaluating a Pathway for Environmental Sustainability: The Role of Competitive Industrial Performance and Renewable Energy Consumption in European Countries. Sustain. Dev. 2023, 32, 1811–1824. [Google Scholar] [CrossRef]
- Osman, A.I.; Chen, L.; Yang, M.; Msigwa, G.; Farghali, M.; Fawzy, S.; Rooney, D.W.; Yap, P.-S. Cost, Environmental Impact, and Resilience of Renewable Energy under a Changing Climate: A Review. Environ. Chem. Lett. 2023, 21, 741–764. [Google Scholar] [CrossRef]
- Yalew, S.G.; van Vliet, M.T.H.; Gernaat, D.E.H.J.; Ludwig, F.; Miara, A.; Park, C.; Byers, E.; De Cian, E.; Piontek, F.; Iyer, G.; et al. Impacts of Climate Change on Energy Systems in Global and Regional Scenarios. Nat. Energy 2020, 5, 794–802. [Google Scholar] [CrossRef]
- Litheko, A.; Oboirien, B.; Patel, B. Life Cycle Assessment of Power-to-Gas (PtG) Technology—Evaluation of System Configurations of Renewable Hydrogen and Methane Production. Sustain. Energy Technol. Assess. 2023, 60, 103527. [Google Scholar] [CrossRef]
- Glenk, G.; Holler, P.; Reichelstein, S. Advances in Power-to-Gas Technologies: Cost and Conversion Efficiency. Energy Environ. Sci 2023, 16, 6058–6070. [Google Scholar] [CrossRef]
- Megy, C.; Massol, O. Is Power-to-Gas Always Beneficial? The Implications of Ownership Structure. Energy Econ. 2023, 128, 107094. [Google Scholar] [CrossRef]
- Götz, M.; Lefebvre, J.; Mörs, F.; McDaniel Koch, A.; Graf, F.; Bajohr, S.; Reimert, R.; Kolb, T. Renewable Power-to-Gas: A Technological and Economic Review. Renew. Energy 2016, 85, 1371–1390. [Google Scholar] [CrossRef]
- Liu, W.; Wen, F.; Xue, Y. Power-to-Gas Technology in Energy Systems: Current Status and Prospects of Potential Operation Strategies. J. Mod. Power Syst. Clean Energy 2017, 5, 439–450. [Google Scholar] [CrossRef]
- Ma, J.; Li, Q.; Kühn, M.; Nakaten, N. Power-to-Gas Based Subsurface Energy Storage: A Review. Renew. Sustain. Energy Rev. 2018, 97, 478–496. [Google Scholar] [CrossRef]
- Momeni, M.; Soltani, M.; Hosseinpour, M.; Nathwani, J. A Comprehensive Analysis of a Power-to-Gas Energy Storage Unit Utilizing Captured Carbon Dioxide as a Raw Material in a Large-Scale Power Plant. Energy Convers. Manag. 2021, 227, 113613. [Google Scholar] [CrossRef]
- Colelli, L.; Bassano, C.; Verdone, N.; Segneri, V.; Vilardi, G. Power-to-Gas: Process Analysis and Control Strategies for Dynamic Catalytic Methanation System. Energy Convers. Manag. 2024, 305, 118257. [Google Scholar] [CrossRef]
- Mesfun, S.; Sanchez, D.L.; Leduc, S.; Wetterlund, E.; Lundgren, J.; Biberacher, M.; Kraxner, F. Power-to-Gas and Power-to-Liquid for Managing Renewable Electricity Intermittency in the Alpine Region. Renew. Energy 2017, 107, 361–372. [Google Scholar] [CrossRef]
- Navarro, J.; Centeno, M.; Laguna, O.; Odriozola, J. Policies and Motivations for the CO2 Valorization through the Sabatier Reaction Using Structured Catalysts. A Review of the Most Recent Advances. Catalysts 2018, 8, 578. [Google Scholar] [CrossRef]
- Brooks, K.P.; Hu, J.; Zhu, H.; Kee, R.J. Methanation of Carbon Dioxide by Hydrogen Reduction Using the Sabatier Process in Microchannel Reactors. Chem. Eng. Sci. 2007, 62, 1161–1170. [Google Scholar] [CrossRef]
- Stangeland, K.; Kalai, D.; Li, H.; Yu, Z. CO2 Methanation: The Effect of Catalysts and Reaction Conditions. Energy Procedia 2017, 105, 2022–2027. [Google Scholar] [CrossRef]
- Mutschler, R.; Moioli, E.; Luo, W.; Gallandat, N.; Züttel, A. CO2 Hydrogenation Reaction over Pristine Fe, Co, Ni, Cu and Al2O3 Supported Ru: Comparison and Determination of the Activation Energies. J. Catal. 2018, 366, 139–149. [Google Scholar] [CrossRef]
- Moioli, E.; Züttel, A. A Model-Based Comparison of Ru and Ni Catalysts for the Sabatier Reaction. Sustain. Energy Fuels 2020, 4, 1396–1408. [Google Scholar] [CrossRef]
- Pham, C.Q.; Bahari, M.B.; Kumar, P.S.; Ahmed, S.F.; Xiao, L.; Kumar, S.; Qazaq, A.S.; Siang, T.J.; Tran, H.-T.; Islam, A.; et al. Carbon Dioxide Methanation on Heterogeneous Catalysts: A Review. Environ. Chem. Lett. 2022, 20, 3613–3630. [Google Scholar] [CrossRef]
- Podrojková, N.; Sans, V.; Oriňak, A.; Oriňaková, R. Recent Developments in the Modelling of Heterogeneous Catalysts for CO 2 Conversion to Chemicals. ChemCatChem 2020, 12, 1802–1825. [Google Scholar] [CrossRef]
- Védrine, J.C. Revisiting Active Sites in Heterogeneous Catalysis: Their Structure and Their Dynamic Behaviour. Appl. Catal. A Gen. 2014, 474, 40–50. [Google Scholar] [CrossRef]
- Vojvodic, A.; Nørskov, J.K. New Design Paradigm for Heterogeneous Catalysts. Natl. Sci. Rev. 2015, 2, 140–143. [Google Scholar] [CrossRef]
- Hutchings, G.J. Heterogeneous Catalysts—Discovery and Design. J. Mater. Chem. 2009, 19, 1222–1235. [Google Scholar] [CrossRef]
- Heveling, J. Heterogeneous Catalytic Chemistry by Example of Industrial Applications. J. Chem. Educ. 2012, 89, 1530–1536. [Google Scholar] [CrossRef]
- Sheldon, R.A. Engineering a More Sustainable World through Catalysis and Green Chemistry. J. R. Soc. Interface 2016, 13, 20160087. [Google Scholar] [CrossRef]
- Alrafei, B.; Polaert, I.; Ledoux, A.; Azzolina-Jury, F. Remarkably Stable and Efficient Ni and Ni-Co Catalysts for CO2 Methanation. Catal. Today 2020, 346, 23–33. [Google Scholar] [CrossRef]
- Vogt, C.; Groeneveld, E.; Kamsma, G.; Nachtegaal, M.; Lu, L.; Kiely, C.J.; Berben, P.H.; Meirer, F.; Weckhuysen, B.M. Unravelling Structure Sensitivity in CO2 Hydrogenation over Nickel. Nat. Catal. 2018, 1, 127–134. [Google Scholar] [CrossRef]
- Engbæk, J.; Lytken, O.; Nielsen, J.H.; Chorkendorff, I. CO Dissociation on Ni: The Effect of Steps and of Nickel Carbonyl. Surf. Sci. 2008, 602, 733–743. [Google Scholar] [CrossRef]
- Barrientos, J.; González, N.; Lualdi, M.; Boutonnet, M.; Järås, S. The Effect of Catalyst Pellet Size on Nickel Carbonyl-Induced Particle Sintering under Low Temperature CO Methanation. Appl. Catal. A Gen. 2016, 514, 91–102. [Google Scholar] [CrossRef]
- Quindimil, A.; De-La-Torre, U.; Pereda-Ayo, B.; Davó-Quiñonero, A.; Bailón-García, E.; Lozano-Castelló, D.; González-Marcos, J.A.; Bueno-López, A.; González-Velasco, J.R. Effect of Metal Loading on the CO2 Methanation: A Comparison between Alumina Supported Ni and Ru Catalysts. Catal. Today 2020, 356, 419–432. [Google Scholar] [CrossRef]
- Zhang, Z.; Tian, Y.; Zhang, L.; Hu, S.; Xiang, J.; Wang, Y.; Xu, L.; Liu, Q.; Zhang, S.; Hu, X. Impacts of Nickel Loading on Properties, Catalytic Behaviors of Ni/γ–Al2O3 Catalysts and the Reaction Intermediates Formed in Methanation of CO2. Int. J. Hydrogen Energy 2019, 44, 9291–9306. [Google Scholar] [CrossRef]
- Ashok, J.; Pati, S.; Hongmanorom, P.; Tianxi, Z.; Junmei, C.; Kawi, S. A Review of Recent Catalyst Advances in CO2 Methanation Processes. Catal. Today 2020, 356, 471–489. [Google Scholar] [CrossRef]
- Wang, C.; Lu, Y.; Zhang, Y.; Fu, H.; Sun, S.; Li, F.; Duan, Z.; Liu, Z.; Wu, C.; Wang, Y.; et al. Ru-Based Catalysts for Efficient CO2 Methanation: Synergistic Catalysis between Oxygen Vacancies and Basic Sites. Nano Res. 2023, 16, 12153–12164. [Google Scholar] [CrossRef]
- Li, Y.; Liu, Z.; Rao, Z.; Yu, F.; Bao, W.; Tang, Y.; Zhao, H.; Zhang, J.; Wang, Z.; Li, J.; et al. Experimental and Theoretical Insights into an Enhanced CO2 Methanation Mechanism over a Ru-Based Catalyst. Appl. Catal. B 2022, 319, 121903. [Google Scholar] [CrossRef]
- Yang, C.; Zhang, T.; Chen, Y.; Wang, W.; Zhuo, H.; Yang, X.; Huang, Y. Intrinsic Mechanism for Carbon Dioxide Methanation over Ru-Based Nanocatalysts. ACS Catal. 2023, 13, 11556–11565. [Google Scholar] [CrossRef]
- Mäki-Arvela, P.; Murzin, D.Y. Effect of Catalyst Synthesis Parameters on the Metal Particle Size. Appl. Catal. A Gen. 2013, 451, 251–281. [Google Scholar] [CrossRef]
- Mehrabadi, B.A.T.; Eskandari, S.; Khan, U.; White, R.D.; Regalbuto, J.R. A Review of Preparation Methods for Supported Metal Catalysts. Adv. Catal. 2017, 61, 1–35. [Google Scholar]
- Campanati, M.; Fornasari, G.; Vaccari, A. Fundamentals in the Preparation of Heterogeneous Catalysts. Catal. Today 2003, 77, 299–314. [Google Scholar] [CrossRef]
- Chang, F.-W.; Kuo, M.-S.; Tsay, M.-T.; Hsieh, M.-C. Hydrogenation of CO2 over Nickel Catalysts on Rice Husk Ash-Alumina Prepared by Incipient Wetness Impregnation. Appl. Catal. A Gen. 2003, 247, 309–320. [Google Scholar] [CrossRef]
- Sietsma, J.R.A.; Jos van Dillen, A.; de Jongh, P.E.; de Jong, K.P. Application of Ordered Mesoporous Materials as Model Supports to Study Catalyst Preparation by Impregnation and Drying. Stud. Surf. Sci. Catal. 2006, 162, 95–102. [Google Scholar]
- Garbarino, G.; Bellotti, D.; Finocchio, E.; Magistri, L.; Busca, G. Methanation of Carbon Dioxide on Ru/Al2O3: Catalytic Activity and Infrared Study. Catal. Today 2016, 277, 21–28. [Google Scholar] [CrossRef]
- Kwak, J.H.; Kovarik, L.; Szanyi, J. CO2 Reduction on Supported Ru/Al2O3 Catalysts: Cluster Size Dependence of Product Selectivity. ACS Catal. 2013, 3, 2449–2455. [Google Scholar] [CrossRef]
- Cimino, S.; Boccia, F.; Lisi, L. Effect of Alkali Promoters (Li, Na, K) on the Performance of Ru/Al2O3 Catalysts for CO2 Capture and Hydrogenation to Methane. J. CO2 Util. 2020, 37, 195–203. [Google Scholar] [CrossRef]
- Porta, A.; Falbo, L.; Visconti, C.G.; Lietti, L.; Bassano, C.; Deiana, P. Synthesis of Ru-Based Catalysts for CO2 Methanation and Experimental Assessment of Intraporous Transport Limitations. Catal. Today 2020, 343, 38–47. [Google Scholar] [CrossRef]
- Falbo, L.; Martinelli, M.; Visconti, C.G.; Lietti, L.; Bassano, C.; Deiana, P. Kinetics of CO2 Methanation on a Ru-Based Catalyst at Process Conditions Relevant for Power-to-Gas Applications. Appl. Catal. B 2018, 225, 354–363. [Google Scholar] [CrossRef]
- PerkinElmer Optima 7300 ICP-OES Spectrometers; PerkinElmer: Waltham, MA, USA, 2014; Available online: https://resources.perkinelmer.com/lab-solutions/resources/docs/bro_optima7300vfamily.pdf (accessed on 1 June 2024).
- ASTM D974-22; Standard Test Method for Acid and Base Number by Color-Indicator Titration. ASTM International: West Conshohocken, PA, USA, 2017. Available online: https://cdn.standards.iteh.ai/samples/114324/0e718916faa54479848ba2bf309c9929/ASTM-D974-22.pdf (accessed on 1 June 2024).
- Metrohm OMNIS Titrator; Metrohm: Herisau, Switzerland, 2023; Available online: https://www.metrohm.com/it_it/products/8/0005/80005448.html (accessed on 1 June 2024).
- ERWEKA SVM II Tapped Density Tester; ERWEKA: Langen, Gemany, 2023; Available online: https://www.erweka.com/products/physical-testers/tapped-density/item/svm-ii-tapped-density-tester.html# (accessed on 1 June 2024).
- Materials Technologies ROTAB Series. Novara, Italy, 2023. Available online: https://materialstechnologies.com/rotab-series/ (accessed on 1 June 2024).
- SOTAX MT50—Robust Manual Hardness Tester for All Sizes and Materials. Aesch, Switzerland, 2024. Available online: https://www.sotax.com/physicaltesting/tablet_hardness_tester/manual_tablet_hardness_tester (accessed on 1 June 2024).
- Leica Microsystems Leica DM1750 M Materials Analysis Microscope; Leica Microsystems: Milano, Italy, 2024; Available online: https://www.leica-microsystems.com/products/light-microscopes/p/leica-dm1750-m/?country=IT (accessed on 1 June 2024).
- Anton Paar ChemBET Plusar: Automatic Chemisorption Analyzer; Anton Paar: Boynton Beach, FL, USA, 2019; Available online: https://www.anton-paar.com/?eID=documentsDownload&document=60630&L=0 (accessed on 1 June 2024).
- Micrometrics Instrument Corporation TriStar II Plus Surface Area and Porosity Analyzer; Micrometrics Instrument Corporation: Norcross, GA, USA, 2020.
- Malvern Panalytical Zetium, Elemental Excellence; Malvern Panalytical: Worcestershire, UK, 2021; Available online: https://www.malvernpanalytical.com//en/assets/pn12720_br_zetium_elemental%20excellence_tcm50-65641.pdf (accessed on 1 June 2024).
- LECO Corporation SC-144DR Sulfur/Carbon Determinator; LECO Corporation: St. Joseph, MI, USA, 2005; Available online: https://www.leco.com/documents/app-notes/203-821-144/ (accessed on 1 June 2024).
- Betancourt, P.; Rives, A.; Hubaut, R.; Scott, C.E.; Goldwasser, J. A Study of the Ruthenium–Alumina System. Appl. Catal. A Gen. 1998, 170, 307–314. [Google Scholar] [CrossRef]
- Suoranta, T.; Niemelä, M.; Perämäki, P. Comparison of Digestion Methods for the Determination of Ruthenium in Catalyst Materials. Talanta 2014, 119, 425–429. [Google Scholar] [CrossRef]
- Fabec, J.L.; Ruschak, M.L. Determination of Aluminum, Cobalt, Lanthanum, and Ruthenium on Alumina-Based Catalysts by Inductively Coupled Plasma Atomic Emission Spectrometry. Anal. Chem. 1983, 55, 2241–2246. [Google Scholar] [CrossRef]
- Mazzieri, V.A.; L’Argentière, P.C.; Coloma-Pascual, F.; Fígoli, N.S. Effect of Chlorine on the Properties of Ru/Al2O3. Ind. Eng. Chem. Res. 2003, 42, 2269–2272. [Google Scholar] [CrossRef]
- Mieth, J. The Effect of Catalyst Preparation on the Performance of Alumina-Supported Ruthenium Catalysts II. The Impact of Residual Chloride. J. Catal. 1989, 118, 218–226. [Google Scholar] [CrossRef]
- Abdullah, E.C.; Geldart, D. The Use of Bulk Density Measurements as Flowability Indicators. Powder Technol. 1999, 102, 151–165. [Google Scholar] [CrossRef]
- Traina, K.; Cloots, R.; Bontempi, S.; Lumay, G.; Vandewalle, N.; Boschini, F. Flow Abilities of Powders and Granular Materials Evidenced from Dynamical Tap Density Measurement. Powder Technol. 2013, 235, 842–852. [Google Scholar] [CrossRef]
- Park, Y.S.; Kim, H.S.; Shun, D.; Song, K.S.; Kang, S.K. Attrition Characteristics of Alumina Catalyst for Fluidized Bed Incinerator. Korean J. Chem. Eng. 2000, 17, 284–287. [Google Scholar] [CrossRef]
- Russell, A.S.; Lewis, J.E. Abrasive Characteristics of Alumina Particles. Ind. Eng. Chem. 1954, 46, 1305–1310. [Google Scholar] [CrossRef]
- Yahiaoui, K.; Messaoud Aberkane, S.; Naitbouda, A. Correlation between Surface Hardness of α-Alumina Samples and Their Spectroscopic Parameters. Mater. Chem. Phys. 2021, 259, 124045. [Google Scholar] [CrossRef]
- Buelna, G.; Lin, Y.S.; Liu, L.X.; Litster, J.D. Structural and Mechanical Properties of Nanostructured Granular Alumina Catalysts. Ind. Eng. Chem. Res. 2003, 42, 442–447. [Google Scholar] [CrossRef]
- Okal, J.; Zawadzki, M.; Kępiński, L.; Krajczyk, L.; Tylus, W. The Use of Hydrogen Chemisorption for the Determination of Ru Dispersion in Ru/γ-Alumina Catalysts. Appl. Catal. A Gen. 2007, 319, 202–209. [Google Scholar] [CrossRef]
- Taylor, K. Determination of Ruthenium Surface Areas by Hydrogen and Oxygen Chemisorption. J. Catal. 1975, 38, 299–306. [Google Scholar] [CrossRef]
- Okal, J. Characterization and Thermal Stability of Ruthenium Nanoparticles Supported on γ-Alumina. Catal. Commun. 2010, 11, 508–512. [Google Scholar] [CrossRef]
- Veselovskaya, J.V.; Parunin, P.D.; Netskina, O.V.; Okunev, A.G. A Novel Process for Renewable Methane Production: Combining Direct Air Capture by K2CO3/Alumina Sorbent with CO2 Methanation over Ru/Alumina Catalyst. Top. Catal. 2018, 61, 1528–1536. [Google Scholar] [CrossRef]
- Lin, B.; Wang, R.; Yu, X.; Lin, J.; Xie, F.; Wei, K. Physicochemical Characterization and H2-TPD Study of Alumina Supported Ruthenium Catalysts. Catal. Lett. 2008, 124, 178–184. [Google Scholar] [CrossRef]
- Muñoz-Murillo, A.; Domínguez, M.I.; Odriozola, J.A.; Centeno, M.A. Selective CO Methanation with Structured RuO2/Al2O3 Catalysts. Appl. Catal. B 2018, 236, 420–427. [Google Scholar] [CrossRef]
- Trueba, M.; Trasatti, S.P. Γ-Alumina as a Support for Catalysts: A Review of Fundamental Aspects. Eur. J. Inorg. Chem. 2005, 2005, 3393–3403. [Google Scholar] [CrossRef]


| Percent of Sample Mass [%] | Atomic Weight | Stoichiometry Factor | Atomic Cross-Sectional Area [nm2] | Density [g/cm3] |
|---|---|---|---|---|
| 0.50 | 101.07 | 1.0 | 0.1620 | 12.30 |
| Type | Description | Value | Unit of Measure |
|---|---|---|---|
| Sample information | Empty tube | 32.56 | g |
| Sample + tube | 33.37 | g | |
| Sample mass | 0.80 | g | |
| Density | 0.43 | g/cm3 | |
| Tube information | Sample tube | 0.5 | inch |
| Ambient free space | 1.00 | cm3 | |
| Analysis free space | 1.00 | cm3 | |
| Non-ideality factor | 6.2 × 10⁻⁵ | - | |
| Operating conditions | Evacuation rate | 0.67 | kPa |
| Vacuum level | 1.33 × 10⁻⁴ | kPa | |
| Evacuation time | 10 | min | |
| Batch temperature | −195.85 | °C | |
| Temperature ramp rate | 10 | °C/min | |
| Target temperature | 30 | °C | |
| Hold pressure | 13.3 | kPa | |
| Equilibrium interval | 30 | s |
| Parameter | Value | Unit of Measure |
|---|---|---|
| Low Sulfur IR Cell | 8.72 | V |
| High Sulfur IR Cell | 8.56 | V |
| Carbon IR Cell | 8.45 | V |
| Oven Temperature | 48.62 | °C |
| Furnace Temperature | 1322 | °C |
| Current limit | 12 | A |
| Type of Production | Moisture Content (%) | Specific on Dry Catalyst (g) | Amount of Alumina Support That Is Weighted (g) |
|---|---|---|---|
| Batch 1 | 0.59 ± 0.02 | 300.00 ± 0.01 | 301.77 ± 0.01 |
| Batch 2 | 0.64 ± 0.02 | 3000.00 ± 0.01 | 3019.20 ± 0.01 |
| Production | Ru Direct Fusion (wt%) | PRD 105 °C Solid Materials and Supports |
|---|---|---|
| Batch 1 | 0.48 ± 0.01 | 0.44 ± 0.01 |
| Batch 2 | 0.48 ± 0.01 | 0.65 ± 0.01 |
| Type of Production | Chloride Content | |
|---|---|---|
| Chromatography Test (mg/kg) | Titration Test (mg/kg) | |
| Batch 1 | 67.2 ± 0.4 | 61.4 ± 0.3 |
| Batch 2 | 81.3 ± 0.4 | 75.1 ± 0.3 |
| Production | Free Bulk Density | Tapped Bulk Density | ||||
|---|---|---|---|---|---|---|
| Weight (g) | Volume (mL) | Free Bulk Density (g/mL) | Weight (g) | Volume (mL) | Tapped Bulk Density (g/mL) | |
| Batch 1 | 73.19 ± 0.01 | 100.0 ± 0.1 | (7.319 ± 0.008) × 10−1 | 73.19 ± 0.01 | 97.0 ± 0.1 | (7.545 ± 0.008) × 10−1 |
| Batch 2 | 73.31 ± 0.01 | 100.0 ± 0.1 | (7.331 ± 0.008) × 10−1 | 73.34 ± 0.01 | 95.0 ± 0.1 | (7.719 ± 0.008) × 10−1 |
| Production | Starting Weight (g) | Final Weight (g) | Percentage Loss (% w/w) |
|---|---|---|---|
| Batch 1 | 100.02 ± 0.01 | 99.93 ± 0.01 | (8.998 ± 1.41) × 10−2 |
| Batch 2 | 100.03 ± 0.01 | 99.89 ± 0.01 | (1.399 ± 0.141) × 10−1 |
| Parameter | Hardness [N] | |
|---|---|---|
| Batch 1 | Batch 2 | |
| Max | 83 | 80 |
| Min | 25 | 27 |
| Max–Min | 58 | 53 |
| Mean | 59.08 | 54.85 |
| Harmonic mean | 55.25 | 50.50 |
| Median | 62 | 56 |
| Mode | 65 | 51 |
| Mean deviation | 10.47 | 11.99 |
| Standard deviation | 13.06 | 14.59 |
| Variance | 170.61 | 212.81 |
| Kurtosis | 0.0966 | −0.8117 |
| Parameter | Number of the Catalyst Sphere | |||
|---|---|---|---|---|
| 1 | 2 | 3 | 4 | |
| PMP NORD [mm] | 147.4 | 163.4 | 156.0 | 71.9 |
| PMP EST [mm] | 119.3 | 103.5 | 123.4 | 124.3 |
| PMP SUD [mm] | 86.1 | 156.0 | 339.7 | 87.1 |
| PMP OVEST [mm] | 87.7 | 118.6 | 127.6 | 35.5 |
| PMP average [mm] | 127.9 | |||
| RSD [%] | 51.6 | |||
| Parameter | Number of the Catalyst Sphere | |||
|---|---|---|---|---|
| 1 | 2 | 3 | 4 | |
| PMP NORD [mm] | 317.6 | 263.8 | 287.2 | 227.7 |
| PMP EST [mm] | 308.7 | 272.6 | 267.9 | 256.6 |
| PMP SUD [mm] | 310.1 | 294.5 | 261.9 | 273.9 |
| PMP OVEST [mm] | 329.6 | 247.0 | 365.1 | 241.8 |
| PMP average [mm] | 282.8 | |||
| RSD [%] | 12.7 | |||
| Peak Number | Temperature at Maximum [°C] | Volume Adsorbed [mL/g STP] | Cumulative Volume [mL/g STP] | |||
|---|---|---|---|---|---|---|
| Batch 1 | Batch 2 | Batch 1 | Batch 2 | Batch 1 | Batch 2 | |
| 1 | 25.20 ± 0.01 | 25.40 ± 0.01 | (8.05 ± 0.02) × 10−2 | (5.40 ± 0.02) × 10−2 | (8.05 ± 0.02) × 10−2 | (5.40 ± 0.02) × 10−2 |
| 2 | 25.40 ± 0.01 | 25.50 ± 0.01 | (1.23 ± 0.02) × 10−2 | (4.81 ± 0.2) × 10−3 | (9.28 ± 0.02) × 10−2 | (5.88 ± 0.02) × 10−2 |
| 3 | 25.40 ± 0.01 | 25.40 ± 0.01 | (4.81 ± 0.2) × 10−3 | (1.93 ± 0.2) × 10−3 | (9.76 ± 0.02) × 10−2 | (6.07 ± 0.02) × 10−2 |
| 4 | 25.40 ± 0.01 | 25.40 ± 0.01 | (1.75 ± 0.2) × 10−3 | 0 | (9.94 ± 0.02) × 10−2 | (6.07 ± 0.02) × 10−2 |
| 5 | 25.30 ± 0.01 | 25.40 ± 0.01 | 0 | 0 | (9.94 ± 0.02) × 10−2 | (6.07 ± 0.02) × 10−2 |
| Parameter | Value | Unit of Measure | |
|---|---|---|---|
| Batch 1 | Batch 2 | ||
| Sample mass | 0.772 ± 0.01 | 0.789 ± 0.01 | g |
| Active Loop Volume at 25 °C | 0.451 ± 0.01 | 0.451 ± 0.01 | mL STP |
| Cumulative Volume | 0.099 ± 0.02 | 0.061 ± 0.02 | mL/g STP |
| Metal Dispersion | 8.96 ± 0.03 | 5.48 ± 0.03 | % |
| Metallic Surface Area (sample) | 0.43 ± 0.02 | 0.26 ± 0.02 | m2/g sample |
| Metallic Surface Area (metal) | 86.54 ± 0.02 | 52.91 ± 0.02 | m2/g metal |
| Metallic adsorption capacity | 19.88 ± 0.01 | 12.15 ± 0.01 | cc CO/g PM |
| Active Particle diameter | 5.6 ± 0.1 | 9.2 ± 0.1 | nm |
| Type | Description | Value | Unit of Measure | |
|---|---|---|---|---|
| Batch 1 | Batch 2 | |||
| Surface Area | Single point surface area at P/P0 = 0.0796 | 49.35 ± 0.02 | 45.82 ± 0.02 | m2/g |
| BET Surface Area | 51.38 ± 0.02 | 47.68 ± 0.02 | m2/g | |
| BJH Adsorption cumulative surface area of pores | 57.11 ± 0.02 | 53.13 ± 0.02 | m2/g | |
| BJH Desorption cumulative surface area of pores | 61.57 ± 0.02 | 57.72 ± 0.02 | m2/g | |
| Pore Volume | Single point adsorption total pore volume of pores at P/P0 = 0.9855 | 0.333 ± 0.02 | 0.301 ± 0.02 | cm3/g |
| Single point desorption total pore volume of pores at P/P0 = 0.3107 | 0.0267 ± 0.02 | 0.0248 ± 0.02 | cm3/g | |
| BJH Adsorption cumulative volume of pores | 0.333 ± 0.02 | 0.301 ± 0.02 | cm3/g | |
| BJH Desorption cumulative volume of pores | 0.334 ± 0.02 | 0.302 ± 0.02 | cm3/g | |
| Pore size | Adsorption average pore diameter (4V/A by BET) | 259.38 ± 0.03 | 252.58 ± 0.03 | Å |
| Desorption average pore diameter (4V/A by BET) | 20.82 ± 0.03 | 20.83 ± 0.03 | Å | |
| BJH Adsorption average pore width (4V/A) | 233.20 ± 0.03 | 226.51 ± 0.03 | Å | |
| BJH Desorption average pore width (4V/A) | 217.01 ± 0.03 | 209.21 ± 0.03 | Å | |
| Analyte | Concentration [%] | |
|---|---|---|
| Batch 1 | Batch 2 | |
| O | 44.580 ± 0.003 | 43.807 ± 0.003 |
| Na | 0.026 ± 0.003 | 0.025 ± 0.003 |
| Al | 45.295 ± 0.003 | 45.439 ± 0.003 |
| Si | 0.034 ± 0.003 | 0.039 ± 0.003 |
| P | 0.001 ± 0.003 | 0.001 ± 0.003 |
| S | 0.001 ± 0.003 | 0.002 ± 0.003 |
| Cl | 0.025 ± 0.003 | 0.009 ± 0.003 |
| Ca | 0.033 ± 0.003 | 0.029 ± 0.003 |
| Fe | 0.023 ± 0.003 | 0.017 ± 0.003 |
| Zn | 0.007 ± 0.003 | 0.009 ± 0.003 |
| Ga | 0.005 ± 0.003 | 0.005 ± 0.003 |
| Ru | 0.438 ± 0.003 | 0.433 ± 0.003 |
| Sample | Type | Weight [g] | C [%] | S [%] |
|---|---|---|---|---|
| Batch 1 | a | 0.35 ± 0.01 | (2.49 ± 0.02) × 10−2 | Lower limit of the instrument’s measuring range |
| b | 0.31 ± 0.01 | (1.81 ± 0.02) × 10−2 | ||
| Batch 2 | c | 0.34± 0.01 | (1.14 ± 0.02) × 10−2 | |
| d | 0.33± 0.01 | (8.78 ± 0.02) × 10−2 |
Disclaimer/Publisher’s Note: The statements, opinions and data contained in all publications are solely those of the individual author(s) and contributor(s) and not of MDPI and/or the editor(s). MDPI and/or the editor(s) disclaim responsibility for any injury to people or property resulting from any ideas, methods, instructions or products referred to in the content. |
© 2025 by the authors. Licensee MDPI, Basel, Switzerland. This article is an open access article distributed under the terms and conditions of the Creative Commons Attribution (CC BY) license (https://creativecommons.org/licenses/by/4.0/).
Share and Cite
Colelli, L.; Grancini, A.; Mattei, E.; Bassano, C.; Vilardi, G. Preparation and Characterization of Ru-Based Catalyst for Power to Gas Applications. Energies 2025, 18, 827. https://doi.org/10.3390/en18040827
Colelli L, Grancini A, Mattei E, Bassano C, Vilardi G. Preparation and Characterization of Ru-Based Catalyst for Power to Gas Applications. Energies. 2025; 18(4):827. https://doi.org/10.3390/en18040827
Chicago/Turabian StyleColelli, Leonardo, Alberto Grancini, Enrico Mattei, Claudia Bassano, and Giorgio Vilardi. 2025. "Preparation and Characterization of Ru-Based Catalyst for Power to Gas Applications" Energies 18, no. 4: 827. https://doi.org/10.3390/en18040827
APA StyleColelli, L., Grancini, A., Mattei, E., Bassano, C., & Vilardi, G. (2025). Preparation and Characterization of Ru-Based Catalyst for Power to Gas Applications. Energies, 18(4), 827. https://doi.org/10.3390/en18040827