1. Introduction
The rapid proliferation of renewable energy resources (RERs) within power distribution networks presents a dual challenge: on one hand, it offers the potential for greener, more sustainable energy solutions; on the other hand, it introduces significant operational complexities due to the inherent uncertainty and variability of renewable generation [
1]. The increasing adoption of technologies such as photovoltaic systems, wind turbines, and distributed generation has pushed the limits of traditional grid infrastructure, demanding advanced solutions to enhance hosting capacity and ensure system resilience [
2]. Addressing these challenges is critical to supporting the global transition toward low-carbon energy systems, making this a highly pertinent and urgent research area. Power distribution networks, historically designed for unidirectional power flow, are now expected to accommodate dynamic and distributed energy resources [
3,
4]. This shift has strained traditional grid infrastructure, leading to issues such as voltage instability, thermal overloading, and congestion [
5]. Compounding these challenges is the uncertainty associated with renewable energy sources, which are influenced by factors such as weather conditions and seasonal variability. The need for robust, scalable, and adaptive solutions to manage these uncertainties is the primary motivation for this study.
Existing research has proposed various methods for addressing the challenges posed by renewable integration. Traditional optimization techniques, including deterministic and stochastic models, have been widely used to enhance hosting capacity [
6,
7]. However, these methods often fall short in accommodating extreme scenarios or providing resilience under distributional shifts in uncertainty [
8]. Distributionally robust optimization (DRO) has emerged as a powerful tool in addressing these limitations by ensuring that solutions remain optimal even under worst-case distributional changes [
9,
10]. While DRO has demonstrated significant potential in addressing renewable uncertainty, its application to hosting capacity enhancement remains underexplored, particularly in the context of multi-layered power distribution networks [
11].
Sensitivity-based approaches have also garnered attention in the literature for their potential to optimize resource allocation [
12]. Early studies employed static sensitivity analysis to identify critical nodes in power systems [
13]. While effective for steady-state conditions, these methods fail to capture the temporal and dynamic variations inherent in modern power grids. Recent advancements have explored dynamic sensitivity analysis using machine learning and optimization-based methods [
14,
15], but the integration of crowd-inspired models like the Social Force Model (SFM) into power system sensitivity analysis is an unexplored area, representing a significant gap addressed by this paper [
16]. Finally, hosting capacity enhancement has been a focal point of research in renewable energy integration. Traditional methods have focused on improving grid infrastructure, such as upgrading transmission lines or deploying advanced inverters [
17,
18]. While these approaches are effective, they often entail high costs and limited scalability. Optimization-based methods, including stochastic and robust optimization, have offered more cost-effective solutions by leveraging existing grid resources [
19]. However, the dynamic allocation of flexibility resources to critical nodes using advanced sensitivity analysis remains underdeveloped, highlighting the need for a comprehensive framework as proposed in this study [
20].
To further optimize resource allocation and enhance hosting capacity, sensitivity analysis has gained traction as a complementary approach [
21]. Sensitivity-based methods provide valuable insights into critical nodes and segments within the network that are most susceptible to congestion or voltage deviations [
22]. However, most existing sensitivity analysis techniques are static, failing to capture the dynamic and temporal variations of power systems. Incorporating advanced models such as the SFM, which has been successfully applied in fields like crowd dynamics and traffic flow, offers a novel approach to analyzing and addressing these sensitivities in power systems [
23,
24].
This paper introduces a pioneering DRO framework augmented by SFM-based sensitivity analysis to address the challenges of renewable integration in power distribution networks. The proposed methodology leverages the worst-case optimization capabilities of DRO to ensure system resilience under extreme uncertainty, while the SFM component introduces a sensitivity-driven approach to resource allocation. This combination enables a comprehensive, dynamic, and targeted enhancement of hosting capacity, making the framework both novel and practically applicable. The modeling framework integrates multi-layered decision-making processes, balancing system-wide objectives with localized interventions at critical nodes. Additionally, the approach incorporates temporal dynamics to optimize resource deployment over time, ensuring adaptability in the face of changing operational conditions. The contributions of this paper are summarized as follows:
- 1.
Development of a novel DRO-SFM framework: This study presents an innovative combination of distributionally robust optimization and Social Force Model-based sensitivity analysis to dynamically enhance hosting capacity in power distribution networks.
- 2.
Advanced resource allocation modeling: The proposed framework incorporates sensitivity-driven resource deployment, prioritizing critical nodes and segments to effectively mitigate congestion and voltage deviations.
- 3.
Integration of temporal dynamics: By embedding temporal modeling into the framework, this paper addresses the dynamic nature of power systems, ensuring adaptability to fluctuating renewable generation and load demand.
- 4.
Comprehensive evaluation of hosting capacity enhancement: The framework demonstrates significant improvements in hosting capacity and system resilience through extensive simulations, highlighting its potential for real-world implementation.
Existing research has explored various approaches to enhance hosting capacity in renewable-rich distribution networks. Traditional deterministic optimization methods provide a rigid but computationally efficient means of resource allocation, yet they lack adaptability to real-time operational changes. Stochastic optimization techniques improve robustness by incorporating probabilistic uncertainties, but they often struggle to capture extreme scenarios and distributional shifts. Distributionally robust optimization (DRO) methods offer a solution by ensuring optimality under worst-case uncertainty distributions, making them particularly suitable for modern power grids. However, current DRO models seldom incorporate dynamic sensitivity analysis, limiting their ability to prioritize critical network nodes effectively.
Machine learning-based techniques have also been applied in recent studies to predict flexibility needs and optimize resource allocation. These methods include reinforcement learning for adaptive control and neural networks for forecasting system states. While these approaches demonstrate strong predictive performance, they generally require large-scale training data and may suffer from interpretability issues. In contrast, the proposed DRO framework, combined with Social Force Model-based sensitivity analysis, provides a structured and explainable approach to prioritizing flexibility resource deployment in a computationally efficient manner.
The remainder of this paper is structured as follows:
Section 2 presents the mathematical formulation, detailing the sensitivity-driven distributionally robust optimization (DRO) framework and its key components.
Section 3 describes the test system and dataset used for validation, including system configuration and uncertainty modeling.
Section 4 introduces the software implementation, specifying the computational setup, solver configurations, and algorithmic procedures.
Section 5 presents the results of the proposed approach, analyzing its effectiveness in enhancing hosting capacity and optimizing flexibility allocation.
Section 6 concludes the study by summarizing key insights and outlining potential future research directions. References are listed in
Section 7.
2. Math Formulation
To facilitate understanding, the following list summarizes the key variables and their definitions.
| Variable | Definition |
| Power generation output |
| Load demand power |
| Sensitivity coefficient for node n |
| Weighting factor for power loss minimization |
| Flexibility coefficient for distributed generation |
| Power variation of distributed generation unit p |
| Uncertainty parameter for grid connection |
| Flexibility resource allocation over time t |
| Minimum flexibility demand |
| Maximum flexibility demand |
| Topology reconfiguration adjustment for line e |
| Operational impact weighting for reconfiguration |
| Voltage deviation at node n |
| Threshold for voltage deviation minimization |
| Reserve capacity of resource r |
| Nominal capacity of resource r |
| Minimum reserve fraction |
| Power loss across network |
| Priority-based resource allocation at node n |
| Weighting coefficient for resource allocation |
| Flexibility requirement of resource k |
| Uncertainty factor for resource allocation |
| Charging efficiency factor for storage systems |
| Charging power of storage |
| Discharging power of storage |
| Energy storage state |
| Maximum energy storage capacity |
| H | Hosting capacity enhancement factor |
| Interaction force equation for generation and load adjustment |
| Social Force Model sensitivity function for prioritization |
| Global decision variable |
| Local decision variable |
| Flexibility resource deployment |
| Voltage deviation across line |
| Thermal power limit for line |
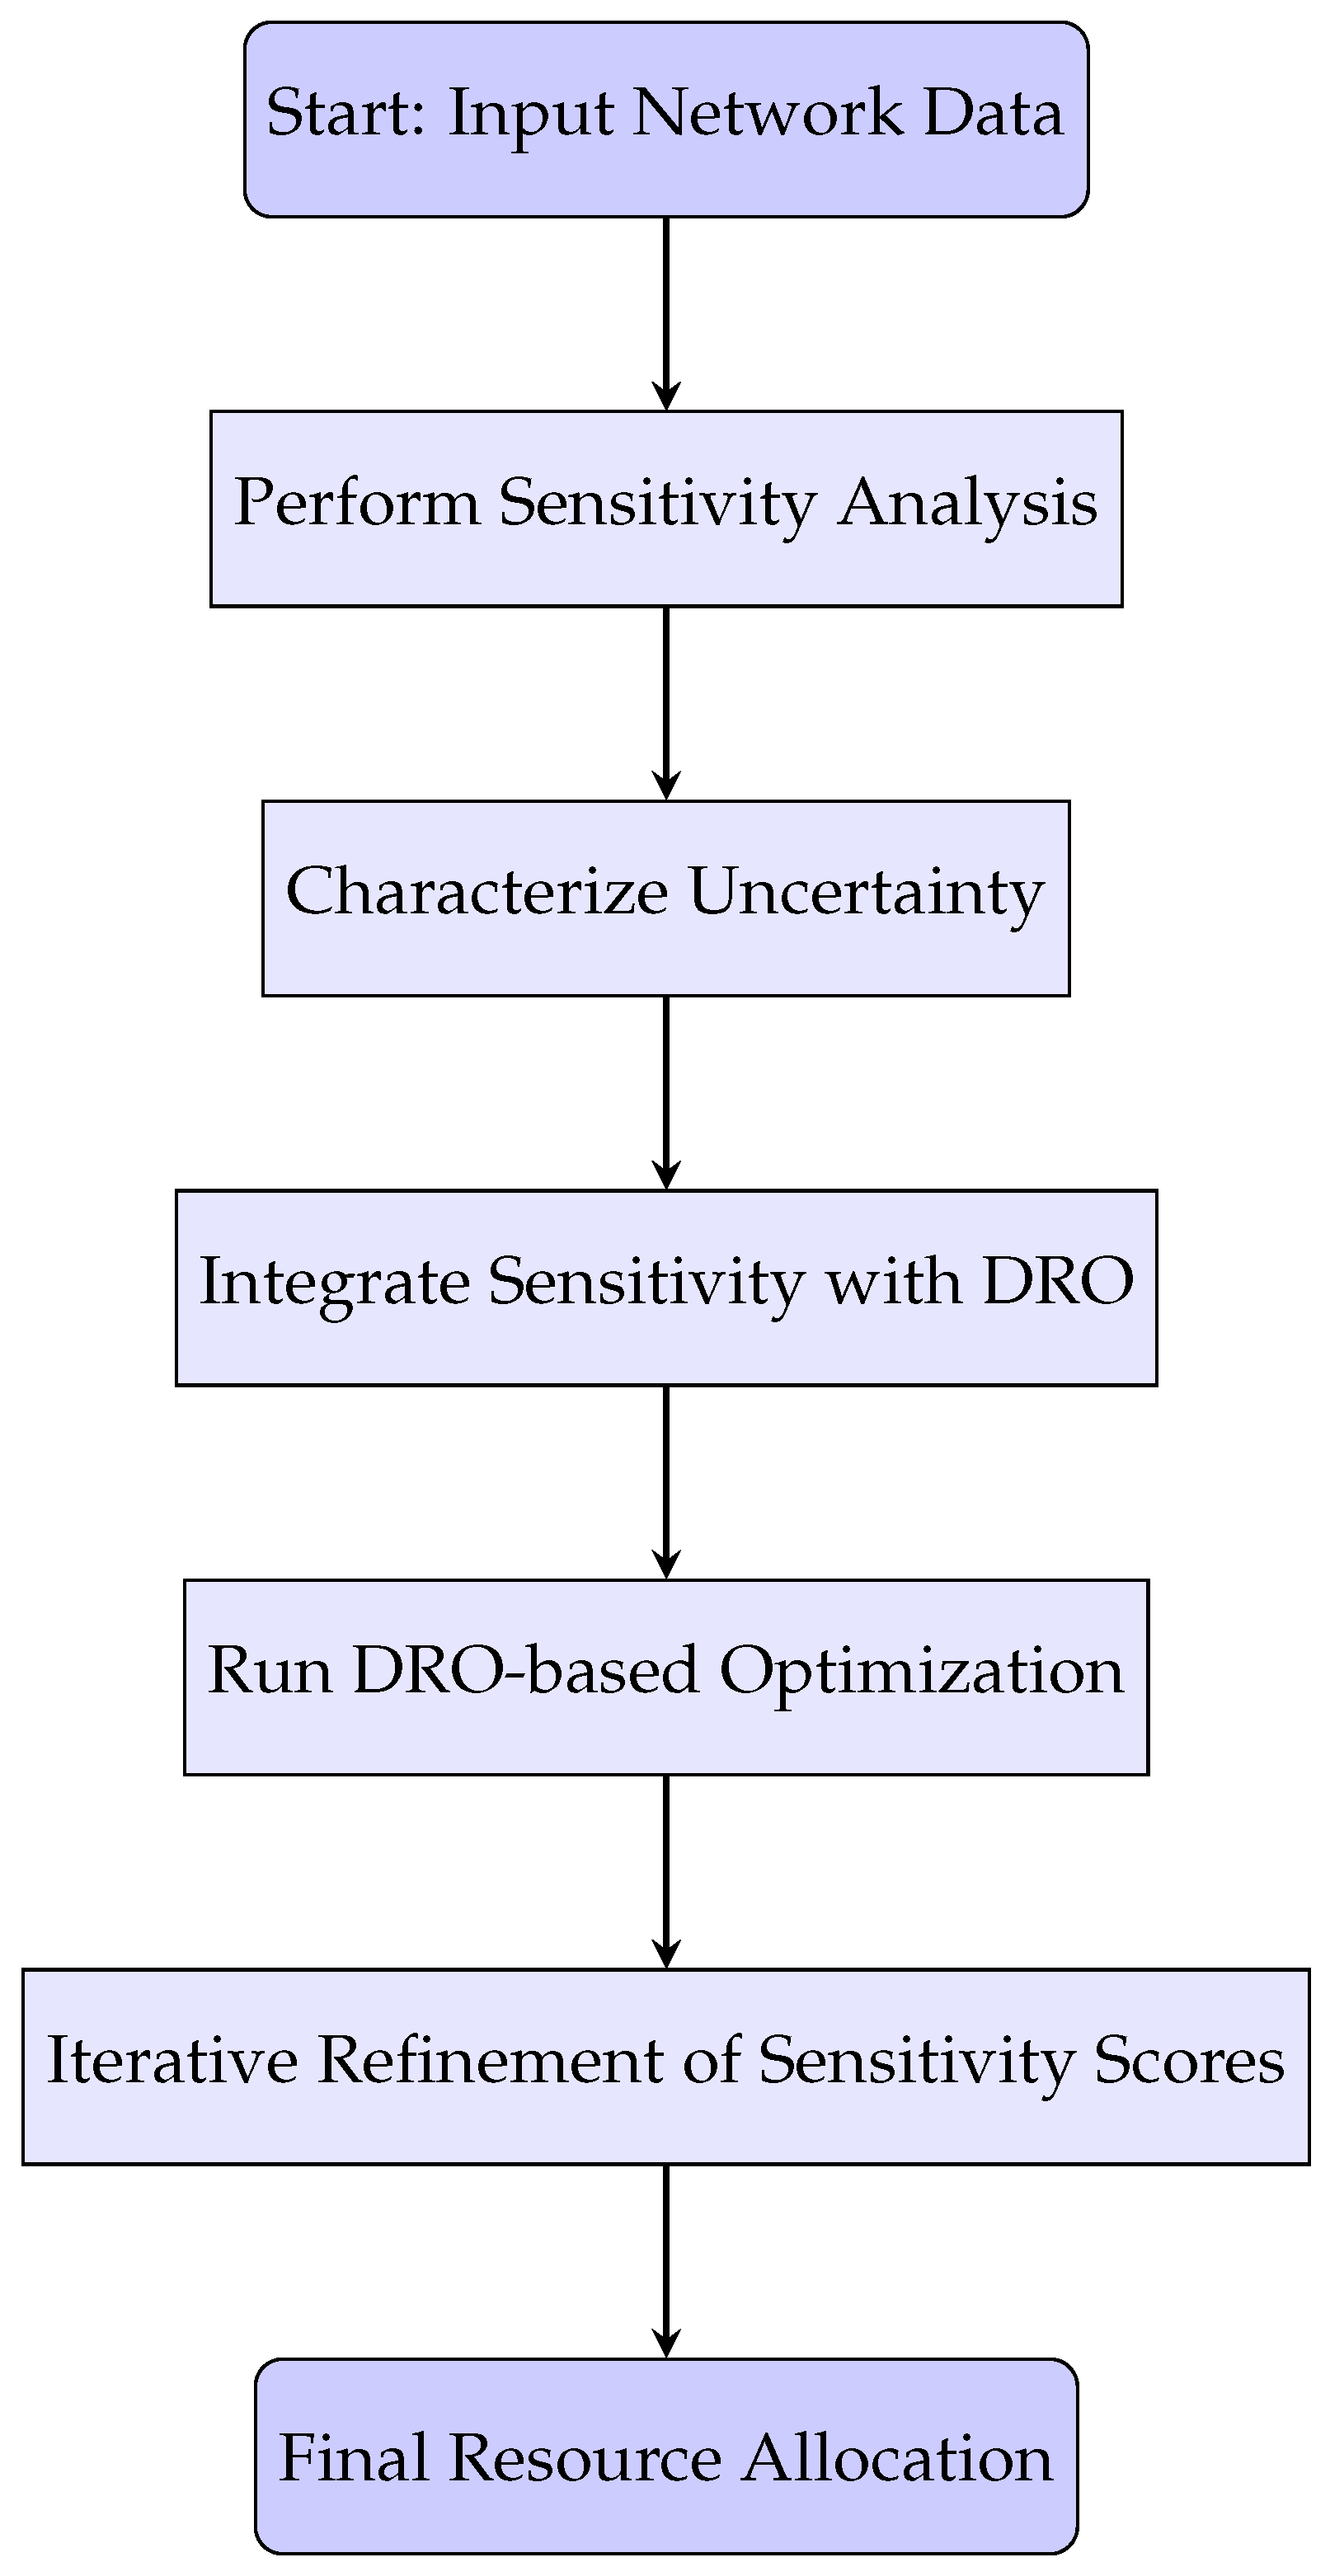
The integration of sensitivity-driven analysis and DRO plays a crucial role in ensuring efficient and resilient resource allocation under uncertainty. This subsection presents a structured breakdown of the proposed methodology.
- 1.
Sensitivity Analysis: Sensitivity analysis is performed to identify critical nodes within the power distribution network. This step computes node-specific sensitivity coefficients based on temporal and spatial variations in renewable generation and load demand. High-sensitivity nodes are prioritized for resource allocation to mitigate congestion and voltage deviations.
- 2.
Uncertainty Characterization: Renewable energy generation and load demand uncertainties are modeled using a distributionally robust uncertainty set. This set captures worst-case distributional shifts, ensuring the optimization framework remains effective even under extreme variability scenarios.
- 3.
Interaction between Sensitivity and DRO: The sensitivity scores obtained from the first step are integrated into the DRO framework. These scores serve as weighting factors, directing the allocation of flexibility resources to the most critical nodes. This interaction ensures that the optimization process remains both targeted and robust.
- 4.
Optimization Framework: The DRO framework employs a multi-objective approach to balance system-wide objectives with localized interventions. The optimization problem is formulated to maximize hosting capacity, minimize operational costs, and maintain system stability. Key constraints, including voltage limits and thermal capacities, are incorporated to ensure feasibility.
- 5.
Iterative Refinement: An iterative optimization process is implemented to dynamically refine the resource allocation strategy. At each iteration, sensitivity scores are updated based on the system’s real-time state, allowing the framework to adapt to evolving conditions.
This structured integration in
Figure 1 ensures that the sensitivity-driven DRO framework effectively prioritizes critical nodes, optimizes resource allocation, and enhances system resilience under uncertainty.
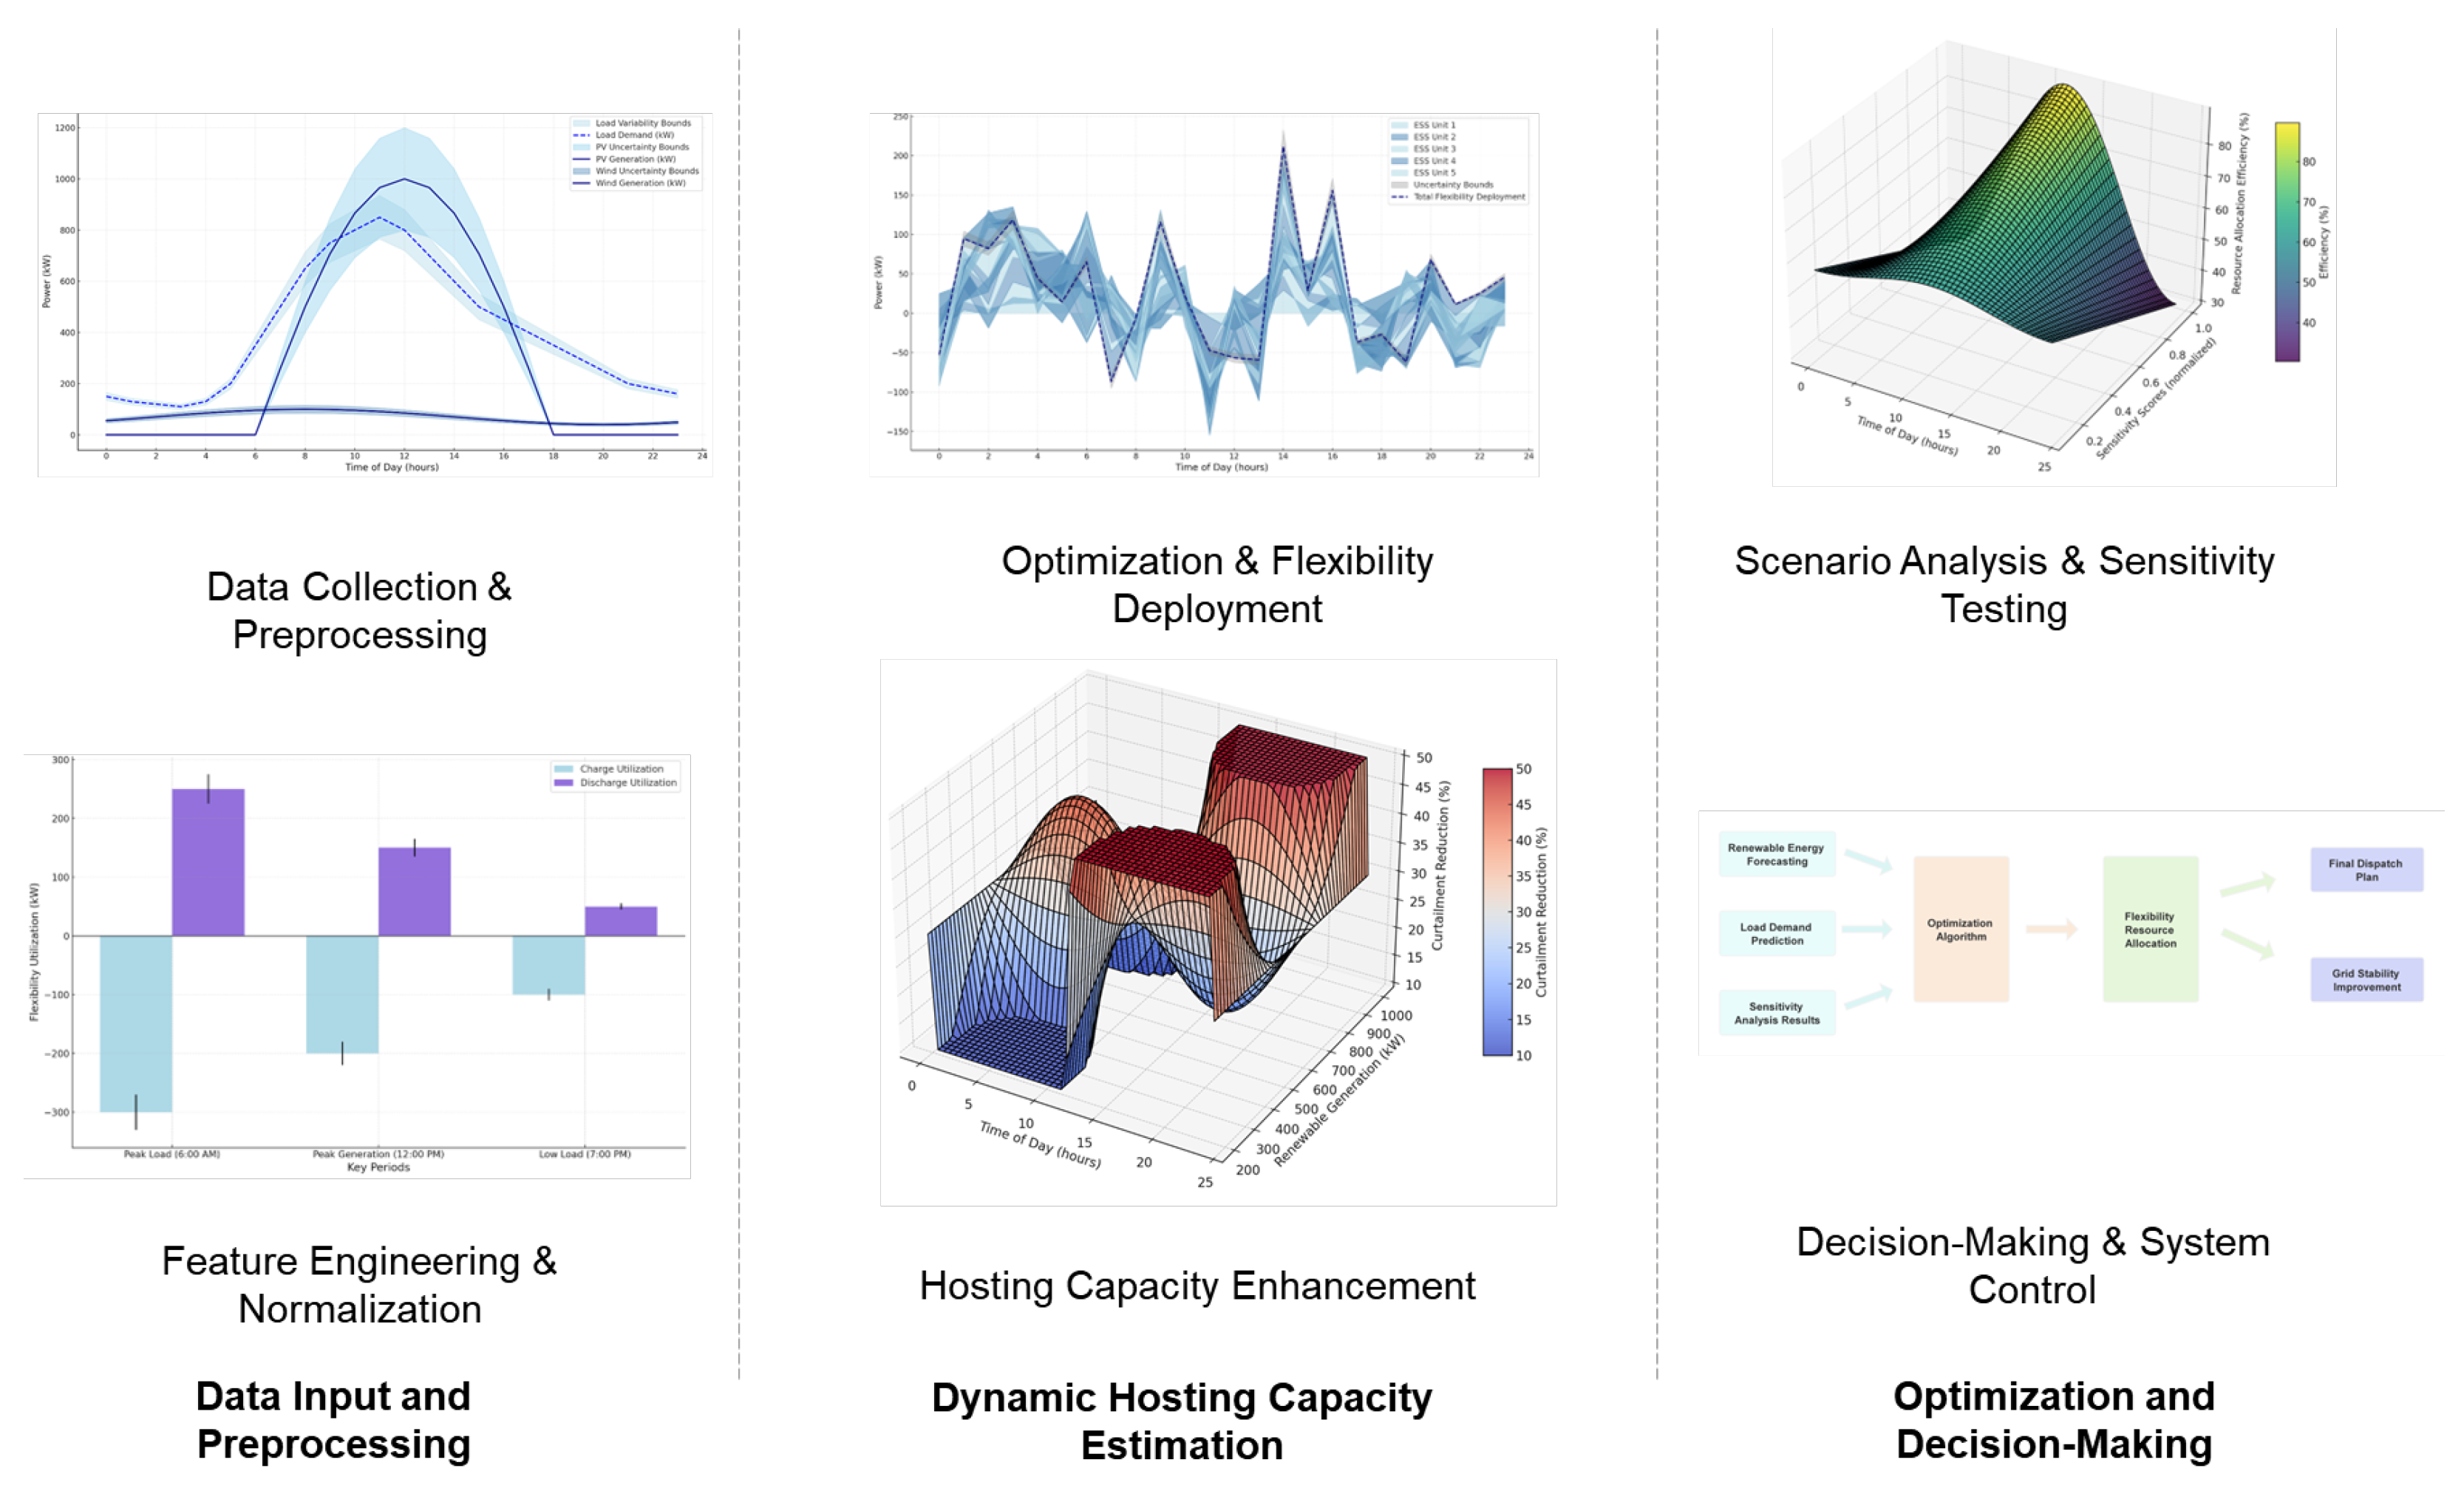
To further illustrate the structural components of our optimization model,
Figure 2 presents the proposed system architecture. This framework consists of three primary components:
Data Input and Preprocessing: This module collects renewable generation forecasts, load demand predictions, and sensitivity analysis results.
Optimization and Flexibility Deployment: The core optimization model performs robust resource scheduling using a distributed robust optimization (DRO) approach.
Decision-Making and System Control: The final decision module derives the optimal dispatch strategy to enhance hosting capacity and improve grid stability.
The mathematical formulation of this study is centered on developing a sensitivity-driven DRO framework aimed at enhancing hosting capacity in power distribution networks while efficiently allocating flexibility resources. This framework integrates advanced optimization techniques with sensitivity analysis to address the inherent uncertainties in renewable energy generation and load demand. The formulation begins with the definition of the objective function, designed to maximize hosting capacity while maintaining grid stability. Constraints are then introduced to ensure adherence to operational, physical, and robustness requirements. These mathematical representations provide a comprehensive foundation for modeling the interplay between temporal dynamics, resource allocation, and network performance under uncertainty.
This equation defines the optimization objective, aiming to maximize hosting capacity while maintaining system stability and efficiently utilizing flexibility resources.
The hosting capacity maximization objective aims to enhance renewable integration by allocating flexibility resources while considering system resilience metrics. The integral across the space
represents the spatial evaluation of network robustness. The first term in the summation measures the relative change in generated power
, scaled by normalized sensitivity coefficients
and weights
that reflect the operational risk of critical components. The second term captures the impact of reactive flexibility provisioning
, scaled by uncertainty parameters
and local perturbation weights
. The final term accounts for voltage stability using second-order temporal derivatives of the voltage waveform
, with the entire expression weighted by prioritization coefficients
and
.
This equation formulates the distributionally robust optimization problem, ensuring reliable operation by optimizing against the worst-case uncertainty scenario.
This equation represents a distributionally robust objective for worst-case renewable generation and demand scenarios. The formulation incorporates uncertainty set
, where
defines the worst-case scenarios. The integral over
aggregates temporal variability, while
and
, respectively, represent the mean and covariance matrices of renewable uncertainties. The first term captures the sensitivity of nodal demands
to scenario
, adjusted by nominal generation
. The second term penalizes over-allocation of flexibility resources
relative to their maximum capacity
, with a cubic weighting
to emphasize extreme deviations.
This cost minimization objective balances the resource allocation cost under load perturbations with the resilience cost of storage systems. The uncertainty set
covers scenarios
for load variations
with covariance impacts
. The second term penalizes storage overuse
relative to capacity
with a quartic weighting
. This guarantees system efficiency and operational robustness in high-demand uncertainty.
The multi-layered optimization objective addresses operational losses
weighted by sensitivity
and flexibility provisioning
. The uncertainty space
considers multi-layer interaction
and penalizes higher-order deviations
, ensuring balanced operations across system layers.
This equation focuses on maximizing the renewable hosting capacity while minimizing operational variances in generated power
and voltage
. Sensitivity factors
and
scale the respective components. The second term penalizes rapid fluctuations in reactive power
over time using higher-order sensitivity parameters
. This enables robust operation under volatile renewable penetration.
This equation enforces power flow constraints, ensuring compliance with network stability and voltage operational limits.
The power flow constraints ensure adherence to the AC load flow equations, where
and
represent conductance and susceptance matrices. Voltage magnitudes
must remain within operational bounds
and
. This is critical for maintaining system stability.
Thermal constraints enforce that apparent power on each line does not exceed its maximum allowable capacity . These constraints are essential to prevent overheating and ensure reliable system operation.
To further clarify the application of the Social Force Model (SFM)-based sensitivity analysis, we introduce a specific example illustrating its role in identifying critical nodes within the power distribution network. In this study, the SFM is utilized to evaluate how power flow variations and renewable energy fluctuations affect different nodes. By assigning sensitivity coefficients based on the responsiveness of network elements to external influences, the model prioritizes nodes that are most susceptible to congestion and voltage deviations.
For instance, when a surge in photovoltaic generation occurs, certain buses experience higher fluctuations in voltage profiles. The SFM-based sensitivity analysis detects these high-impact locations by analyzing nodal interactions and their propagation effects. Nodes exhibiting higher sensitivity scores receive priority in the flexibility resource allocation process, ensuring that system-wide stability is maintained under dynamic operating conditions.
By integrating this sensitivity-driven approach, the optimization framework effectively aligns flexibility resources with system needs, thereby improving hosting capacity and mitigating operational constraints. These refinements provide a clearer understanding of how the SFM contributes to robust decision-making within the proposed methodology.
This equation applies the Social Force Model (SFM) to guide the allocation of flexibility resources, ensuring an efficient response to network fluctuations.
Flexibility resource allocation is constrained by sensitivity mapping through the Social Force Model
, where
represents the force vector and
denotes distances to sensitive nodes. These bounds,
and
, optimize resource deployment to areas most susceptible to congestion.
This constraint defines the allowable range for generation and load variations, ensuring robustness under uncertain conditions.
Uncertainty bounds for generation
and load
are defined by nominal values
and
and variability
and
. These constraints ensure the model accounts for fluctuations in renewable energy output and demand.
This equation imposes constraints on voltage fluctuations over time, ensuring dynamic stability in the distribution network.
Voltage deviations over time are bounded by
, ensuring dynamic stability in all nodes
. This integral constraint guarantees that voltage variations remain within tolerable limits, even under transient conditions induced by renewable fluctuations.
This equation enforces resource allocation bounds
and
for flexibility resources across line segments
. The summation over
K resources incorporates power generation changes
weighted by sensitivity factors
, while integrating second-order temporal derivatives of reactive flexibility
to ensure temporal stability. This ensures optimized distribution of resources under variable demand and generation conditions.
This constraint ensures that flexibility resources are allocated based on system sensitivity, preventing excessive fluctuations in power and voltage levels.
This equation utilizes the Social Force Model
for prioritizing high-sensitivity nodes
m based on force vectors
and distances
. The sensitivity-driven allocation incorporates temporal derivatives of power
and voltage deviations
, scaled by uncertainty parameters
and
, while enforcing an upper bound
. This targets critical nodes to minimize congestion and maximize resilience.
This coupling constraint aligns global resource allocation
with local resource provisioning
. The function
models local interactions between reactive and active components, while penalizing power losses
using sensitivity parameters
and
. The integral over the operational space
ensures cohesion between global and local objectives.
This constraint ensures that reactive power support remains within acceptable operational limits, helping to maintain voltage stability.
This constraint limits reactive power support
for voltage regulation at each node
j in set
. The scaling by standard deviations
and perturbation parameters
ensures operational limits
are respected under varying conditions, maintaining voltage stability across the network.
This equation models the charging and discharging dynamics of energy storage systems, ensuring that storage remains within its capacity limits.
The energy storage constraint balances charging
and discharging
dynamics over time
T, with efficiency factor
. The resulting storage state
must remain within physical bounds
, ensuring reliable flexibility provisioning.
This constraint enforces that reserve resources maintain a minimum required level to ensure system reliability under unforeseen fluctuations.
Reserve capacity constraints ensure that reserve resources
maintain a minimum fraction
of their nominal capacity
. This guarantees sufficient reserves for unforeseen demand spikes or generation shortages, enhancing system reliability.
Power loss minimization reduces squared losses
across the network
, weighted by sensitivity factors
and
. This integral formulation ensures efficient energy transmission and minimizes operational inefficiencies under variable conditions.
The Social Force Model constraint maps sensitivity across regions
by aggregating forces
inversely proportional to the square of distances
. This highlights high-priority areas for targeted resource allocation, optimizing responses to system vulnerabilities.
Priority-based allocation distributes resources
by weighting flexibility requirements
with sensitivity coefficients
, normalized by the aggregated uncertainty
. This ensures that resources are optimally directed to critical nodes
n.
Temporal flexibility constraints enforce that cumulative flexibility
meets minimum demand
while staying within maximum bounds
. These bounds ensure system robustness during dynamic demand scenarios.
Network topology reconfiguration constraints limit the adjustment
of line elements
e, weighted by operational impact
. The upper bound
ensures stability during congestion management actions.
Voltage deviation minimization ensures that squared deviations
across nodes
n remain below a tolerable threshold
. This constraint safeguards voltage stability under high renewable penetration conditions.
Grid connection point flexibility constraints ensure that distributed generation (DG) output
is allocated in proportion to generation flexibility
. The scaling by sensitivity parameters
enforces a maximum flexibility bound
, ensuring that local grid connections do not exceed their operational limits.
Robustness constraints evaluate the worst-case scenarios over the uncertainty set
, ensuring that combined deviations in generation
and load
remain within an acceptable threshold
. This protects system feasibility against extreme fluctuations in renewable generation and demand.
Demand-side response participation is constrained to ensure load balancing, where
represents the load adjustment at demand node
i, weighted by participation factors
. This must meet a minimum response threshold
, ensuring adequate flexibility during peak load scenarios.
Renewable energy curtailment minimization reduces the curtailed power
over time
T, with deviations scaled by uncertainty parameters
and
. This ensures minimal loss of renewable energy while maintaining grid reliability.
Coupling constraints ensure that voltage deviations
and thermal power limits
are jointly managed, with their combined effect bounded by
. This prevents overloading of distribution lines while maintaining voltage stability.
Power factor constraints enforce a minimum acceptable value for
, where
and
are active and reactive power components, respectively. This constraint ensures efficient utilization of power resources and prevents excess reactive power flows.
Geographical flexibility allocation ensures that flexibility resources
are distributed based on Social Force Model sensitivity
. This prioritizes areas with high vulnerability, optimizing spatial resource deployment.
Hosting capacity enhancement maximizes the added renewable hosting capacity
across nodes, ensuring compliance with voltage limits
and thermal capacity limits
. This ensures that additional capacity does not compromise system stability.
Feasibility constraints enforce that power injections remain within operational bounds and , while satisfying the load flow equations defined by system matrices and . This ensures feasibility under uncertain scenarios.
3. Method
The proposed framework is particularly well suited for applications in smart grids and microgrids, where efficient flexibility deployment and uncertainty-aware optimization are crucial. Smart grids integrate advanced sensing, control, and automation technologies to enhance operational efficiency, optimize power flow, and support high levels of renewable penetration. Microgrids, on the other hand, enable localized energy management and can operate in both grid-connected and islanded modes, enhancing resilience and stability.
Given the increasing deployment of these advanced grid architectures, the proposed sensitivity-driven optimization approach ensures that flexibility resources are allocated effectively in both centralized and decentralized distribution networks. In smart grids, the framework enhances hosting capacity by dynamically adjusting control strategies based on real-time grid conditions. In microgrids, it optimally coordinates distributed energy resources (DERs) and demand-side flexibility to maintain operational stability and maximize renewable energy utilization. By integrating sensitivity-based decision-making, this approach prioritizes critical nodes and enables robust uncertainty management, making it highly relevant for modern distribution networks.
The proposed framework for sensitivity-driven flexibility deployment and distributionally robust optimization is detailed in
Section 2. This section focuses on how the methodology is applied in practice, including key implementation details, assumptions, and data requirements. The methodology is structured around three key steps: sensitivity analysis, uncertainty modeling, and optimization execution, as described in the Mathematical Formulation section. Here, we elaborate on how these components are integrated into real-world grid operations.
The methodological approach adopted in this study combines sensitivity analysis and robust optimization to develop an adaptive and scalable resource allocation framework. This section elaborates on the step-by-step implementation of the proposed methodology, starting with the derivation of sensitivity scores using a Social Force Model (SFM). These scores guide the prioritization of flexibility resource deployment across the network. The integration of temporal and spatial dynamics into the DRO framework enables a layered optimization strategy that balances global system objectives with localized interventions. By employing advanced optimization algorithms and robust uncertainty modeling, this method ensures that the grid operates efficiently and resiliently under varying renewable generation and demand conditions.
The DRO uncertainty set
defines the feasible space for uncertain parameters
, where
and
represent the mean and covariance of uncertainty at node
n, respectively. The integral aggregates deviations across the network
, while
bounds the Wasserstein distance between the empirical and theoretical distributions, ensuring robust performance under worst-case conditions.
The Social Force Model (SFM) sensitivity function
calculates the prioritization metric for node
i based on the interaction force
and distance
from critical regions. The addition of a small constant
avoids division by zero, ensuring numerical stability and accurate prioritization of high-impact nodes.
The sensitivity gradient
identifies critical nodes by computing the partial derivative of the SFM function with respect to uncertainty parameters
. This quantifies how changes in uncertainties influence the prioritization metric, guiding targeted resource allocation decisions.
The interaction force equation
models the combined effects of generation
and load adjustments
over the network
. Sensitivity factors
and
scale the contributions, while distance
accounts for spatial impact, enabling precise modeling of resource distribution.
The temporal dynamics equation models changes in the SFM interaction force
over time
T, incorporating second-order derivatives of active
and reactive
power flows. Coefficients
and
adjust the influence of these components, capturing the dynamic behavior of flexibility deployments.
This equation integrates the Wasserstein distance
into the DRO framework to model uncertainty robustly. The cost function penalizes deviations
while balancing robustness through a regularization factor
. This ensures feasibility and optimality under uncertain conditions.
The robust optimization formulation integrates SFM sensitivity
with flexible resource deployment
. The integral over the network
ensures that flexibility resources are optimally distributed to critical regions, maximizing the system’s overall resilience.
The iterative refinement equation updates the resource allocation
at each step
k using a learning rate
and the gradient
of the objective function. This ensures convergence toward an optimal sensitivity-based allocation, balancing network-wide and local priorities.
The multi-layer optimization framework minimizes the system-wide cost
while incorporating local flexibility decisions
through a coupling function
. The integral across the operational space
ensures alignment between global and localized objectives.
The coupled decision variable formulation links system-wide decisions
with localized variables
. The matrix
defines the coupling effect, while
scales the influence of flexibility resources
, ensuring a consistent optimization hierarchy.
This algorithmic equation iteratively updates the uncertain parameter
for convergence in the DRO framework. The learning rate
adjusts the step size, while the gradient
guides the updates, ensuring robust convergence under uncertain conditions.
The adaptive resource allocation equation adjusts flexibility resources
based on SFM feedback
. This enables targeted deployment to critical nodes, enhancing system adaptability to dynamic conditions.
This voltage regulation equation leverages sensitivity-driven decisions, where reactive resource deployment
is balanced against reactive power changes
. Matrices
and
represent the network’s sensitivity coefficients for voltage stability.
The renewable generation distribution equation allocates generation
based on SFM prioritization
. This ensures that generation resources are distributed efficiently across the network
to match demand and mitigate congestion.
The hosting capacity evaluation equation calculates the added capacity
after optimization, ensuring compliance with voltage
and thermal limits
. This evaluates the effectiveness of the optimization in enhancing renewable integration.
This reactive power dispatch optimization minimizes the deployment of reactive resources
across the network
. The uncertainty parameters
and
scale the optimization to ensure robust voltage regulation.
The congestion management equation leverages SFM sensitivity
to allocate resources
effectively across the line segments
. This minimizes congestion risks in critical network areas.
This equation models the temporal evolution of flexibility resources
based on cumulative SFM sensitivity over time
. It ensures flexibility resources are dynamically adjusted to meet changing conditions.
The iterative adjustment equation refines resource allocation
at each step
k using gradient-based updates, ensuring convergence toward optimal resource distribution within the DRO-SFM framework.
The scenario analysis equation evaluates system performance under worst-case conditions by maximizing deviations
over the uncertainty set
. This stress-tests the framework to identify vulnerabilities.
The performance evaluation equation calculates hosting capacity improvements
post-optimization. This quantifies the system’s ability to integrate additional renewables under the optimized framework.
The risk minimization equation integrates Wasserstein distance with squared deviations to minimize risk under uncertainty. This ensures robust decision-making while accounting for extreme scenarios.
4. Software Implementation of Proposed Methodology
The proposed methodology was implemented in a computationally efficient manner to handle the complexity of large-scale distribution networks with high renewable energy penetration. This section details the software tools used, numerical formulation of the optimization problem, computational setup, solver configuration, parallelization strategies, and validation techniques to ensure the accuracy and efficiency of the implementation.
The optimization framework was developed in Python, utilizing the Pyomo package (version 6.4.2) for mathematical optimization modeling. Pyomo was chosen for its ability to handle mixed-integer and nonlinear optimization problems efficiently while providing seamless integration with industry-standard solvers. Gurobi (version 10.0.3) was employed as the primary solver due to its high-performance capabilities in handling large-scale mixed-integer linear programs (MILPs) and nonlinear programs (NLPs). In addition, NumPy (version 1.24.3) and SciPy (version 1.10.1) were used for numerical operations, while Pandas (version 1.5.3) was employed for data processing. Visualization of results was performed using Matplotlib (version 3.7.1) and Seaborn (version 0.12.2) to analyze hosting capacity improvements, flexibility resource utilization, and system stability under uncertainty.
The optimization model consists of multiple interdependent decision variables representing active and reactive power injections, flexibility resource dispatch, and network constraints. Each equation from the mathematical formulation is translated into Pyomo syntax, where constraints are dynamically generated based on system parameters. Sensitivity coefficients computed from the Social Force Model (SFM) are integrated into the optimization model, assigning priority weights to critical nodes. The uncertainty-aware optimization problem is formulated using a distributionally robust framework, where the objective function maximizes hosting capacity while ensuring operational constraints are satisfied under worst-case renewable generation and demand variations.
To handle the computational complexity of solving the optimization problem across multiple scenarios, parallel processing techniques were implemented. The computational experiments were conducted on a high-performance computing (HPC) cluster consisting of 64-core processors running at 3.2 GHz and 512 GB of RAM. The system operated on Ubuntu 20.04 LTS, ensuring compatibility with Python-based scientific computing libraries and high-performance optimization solvers. This setup allowed for efficient execution of large-scale optimization models by distributing sensitivity analysis calculations across multiple processors. A master–worker parallelization approach was adopted, where the master node coordinated the optimization tasks while worker nodes executed subproblems independently. The parallelized workflow reduces computation time significantly compared to a sequential approach, enabling real-time feasibility analysis for distribution network operations.
Solver configurations play a crucial role in ensuring efficient execution of the optimization model. Gurobi’s branch-and-bound technique was optimized using presolve reductions, cutting planes, and heuristic warm-start strategies to reduce the computational burden. The solver parameters were fine-tuned to achieve a balance between computational speed and solution accuracy, ensuring that the optimization model converges efficiently. The convergence criteria were set based on optimality gaps, with a threshold of 0.1% to ensure high-quality solutions within a reasonable timeframe. Additionally, memory management techniques, such as constraint aggregation and variable pruning, were applied to prevent excessive memory usage during large-scale computations.
The time horizon for the optimization model was set to 24 h, divided into 96 time intervals of 15 min each. This temporal resolution captures the dynamic fluctuations in renewable generation and load demand while maintaining computational feasibility. Flexibility resources, including energy storage systems (ESSs) and demand-side response mechanisms, are optimized at each time step to ensure grid stability. The model dynamically adjusts flexibility dispatch based on real-time network conditions, allowing for adaptive control of hosting capacity.
To validate the correctness of the computational implementation, extensive verification tests were conducted. First, benchmark IEEE distribution test systems were used to cross-check optimization results, ensuring that the solver produced expected outputs for standard cases. Second, sensitivity analysis results were compared against historical network data to confirm that high-impact nodes identified by the model aligned with real-world system behavior. Third, scenario-based stress testing was performed by introducing artificial disturbances in renewable generation and load demand to evaluate the model’s robustness under extreme conditions.
Debugging and verification are integral to ensuring the accuracy of the implementation. The optimization framework underwent multiple debugging stages, including unit testing for individual model components and integration testing to verify end-to-end functionality. Edge cases, such as zero-renewable scenarios, maximum-load conditions, and line congestion limits, were specifically tested to prevent solver infeasibility issues. The debugging process involved logging intermediate solver outputs, validating dual variables for constraint satisfaction, and checking the feasibility of optimal dispatch solutions under different system conditions.
Computational efficiency was further evaluated by analyzing the solver’s performance across different network sizes and renewable penetration levels. The optimization problem was tested on network configurations ranging from 50 to 500 nodes, demonstrating that the parallelized framework scales efficiently. The solution time was benchmarked against traditional deterministic approaches, confirming that the distributionally robust optimization model achieves superior performance in handling uncertainty. Convergence trends were analyzed to assess how the solver handles different problem complexities, and load-balancing strategies were applied to optimize computation across multiple processing cores.
To ensure practical feasibility, the final optimization results are validated against real-world grid operational constraints. Voltage stability metrics, power flow distributions, and flexibility utilization rates are analyzed to confirm that the proposed framework enhances hosting capacity while maintaining grid reliability. The results demonstrate that the model consistently achieves a stable trade-off between operational cost, renewable integration, and system resilience. The validated implementation provides a scalable and computationally efficient solution for modern power distribution networks.
To provide a structured overview of the computational setup and technical specifications used in this study,
Table 1 summarizes the key parameters, including hardware configuration, solver settings, and simulation characteristics.
The table provides a concise reference for the computational resources utilized in solving the optimization model. The implementation leverages a high-performance computing cluster to handle large-scale sensitivity analysis and robust optimization tasks efficiently. The parallel processing capability significantly reduces computational time, enabling real-time feasibility assessments for power distribution networks.
The optimization problem was implemented using the Gurobi solver (version 10.0) through the Pyomo optimization framework in Python. The optimization model consists of a set of equality and inequality constraints, including AC power flow equations, voltage magnitude limits, thermal capacity limits, and distributionally robust uncertainty bounds. The solver was configured with a relative optimality gap of 0.001 to ensure convergence within reasonable computational time. Additionally, the iterative refinement process in the sensitivity-driven optimization was accelerated using parallel processing techniques, enabling efficient handling of large-scale uncertainty scenarios.
5. Results
This section evaluates the practical implementation of the proposed sensitivity-driven optimization framework. The case study was conducted on a synthesized test system to demonstrate how the methodology enhances hosting capacity and flexibility utilization under uncertainty. The evaluation follows a structured approach, integrating sensitivity analysis, distributionally robust optimization, and dynamic flexibility deployment.
The implementation begins with sensitivity analysis, where the network’s most critical nodes are identified based on their influence on voltage stability and power flow constraints. These nodes are prioritized for flexibility allocation to ensure efficient resource utilization. Following this, a distributionally robust optimization framework is applied to determine the optimal allocation of flexibility resources, considering uncertainties in renewable generation and load demand. The optimization process iteratively adjusts resource deployment based on real-time system conditions, ensuring that flexibility is allocated adaptively in response to network variations.
To evaluate the effectiveness of the proposed framework, the test system incorporates high-penetration renewable generation and multiple flexibility resources, including energy storage and demand-side response. The framework was implemented in a computational environment that enables large-scale sensitivity calculations and optimization modeling. The following sections provide details on the test system configuration, data assumptions, and computational setup.
To evaluate the efficacy of the proposed DRO-SFM framework, a comprehensive case study was conducted using a synthesized and assumed dataset designed to replicate a high-renewable-penetration distribution network. The network model was based on a modified IEEE 123-bus distribution system, expanded to include 150 nodes and 180 lines to reflect the increased complexity of modern power grids. Renewable energy sources, comprising 50 distributed PV systems and 30 wind turbines, were strategically placed across the network, contributing approximately 60% of the total generation capacity. The assumed generation data were synthesized to represent typical day-ahead variability, with PV systems producing between 20 kW and 100 kW per unit and wind turbines generating between 50 kW and 150 kW. Load demand profiles were similarly synthesized, ranging from 10 kW to 200 kW across residential, commercial, and industrial consumers, with a peak load of 10 MW across the network. Uncertainty in renewable generation and load demand was characterized by assumed probability distributions based on historical trends. Renewable generation uncertainty followed a normal distribution with a mean of 70% of the rated capacity and a standard deviation of 15%, while load demand variability was modeled using a Gaussian distribution with a mean equal to the base load and a 10% standard deviation. Additional flexibility resources, including ESSs, were integrated into the network. Each ESS unit had a capacity of 500 kWh and a maximum charge/discharge rate of 100 kW, with 20 units distributed at high-priority nodes identified through the SFM-based sensitivity analysis. The computation environment for implementing the DRO-SFM framework was established using a high-performance computing cluster. The system consists of 64-core CPUs with a clock speed of 3.2 GHz and 512 GB of RAM, ensuring the efficient handling of the complex optimization models and sensitivity analyses. The optimization problem was formulated and solved using Python, with key libraries such as Pyomo for optimization modeling and Gurobi as the solver. The temporal resolution for the simulations was set to 15 min, covering a 24 h horizon, resulting in 96 time steps for dynamic resource allocation and hosting capacity evaluation. Parallel processing techniques were employed to expedite sensitivity calculations and scenario analyses, leveraging the computational power of the cluster to ensure timely results. The assumed probability distributions for renewable generation and load demand uncertainty were derived based on historical trends observed in similar distribution networks. Specifically, statistical analyses of long-term solar and wind generation datasets from publicly available energy repositories were used to determine the mean and variance values. Load demand variations were similarly modeled using real-world consumption patterns recorded over multiple years, ensuring that the synthetic dataset reflects realistic operational conditions. These assumptions allowed for a representative evaluation of the proposed framework under practical uncertainty conditions. However, future work could incorporate real-time historical data from specific grid operators to further refine the uncertainty modeling.
The expanded IEEE 123-bus distribution network incorporated additional flexibility resources, including energy storage systems (ESS) and demand-side flexibility mechanisms. These resources were strategically placed at high-impact nodes identified through the sensitivity analysis. Specifically, 20 ESS units, each with a capacity of 500 kWh and a charge/discharge rate of 100 kW, were distributed across key buses with high voltage fluctuations and load variability. The placement of ESSs was determined based on Social Force Model (SFM)-based sensitivity analysis, ensuring that flexibility was allocated where it provided the greatest impact in mitigating congestion and voltage violations.
In addition to ESSs, demand response mechanisms were implemented at selected commercial and industrial load buses, allowing dynamic load adjustments in response to real-time system conditions. These resources were programmed to operate within predefined load flexibility limits, with a maximum reduction of 30% in nominal demand during high-stress periods. The integration of ESSs and demand-side flexibility enhanced the network’s hosting capacity and ensured stability under uncertainty.
To provide a structured overview of the modified IEEE 123-bus distribution network used in this study,
Table 2 summarizes the key system parameters, including network size, renewable penetration, flexibility resources, and operational constraints.
This table ensures clarity in the test system configuration, facilitating reproducibility and benchmarking. The expanded IEEE 123-bus model represents modern distribution networks with high renewable integration, making it suitable for evaluating the effectiveness of the proposed sensitivity-driven optimization framework.
In this study, we consider multiple sources of uncertainty, including renewable energy generation, load demand variations, and market price fluctuations. These uncertainties significantly impact system performance and are modeled using well-established probability distributions. To enhance transparency,
Table 3 provides a structured summary of the assumed uncertainty parameters, including their values and probability distributions.
This table provides a clear and structured overview of the uncertainty assumptions used in the case study. The probability distributions were selected based on historical data and industry standards, ensuring that the stochastic characteristics of renewable generation and demand fluctuations were accurately represented. These assumptions are critical in evaluating the robustness of the proposed optimization framework under real-world conditions.
To validate the practical applicability of the proposed framework, we implemented it in a synthesized test system designed to reflect real-world distribution network characteristics. The test system incorporates realistic renewable generation profiles, load demand variations, and flexibility resource constraints. The objective was to demonstrate how the framework enhances hosting capacity, reduces curtailment, and ensures operational resilience under uncertainty.
To illustrate the decision-making process, we consider a scenario in which renewable generation fluctuates due to weather variability, leading to potential network congestion. The sensitivity-driven optimization framework first evaluates the system conditions by identifying high-sensitivity nodes where voltage deviations and power flow constraints are most significant. Based on this analysis, flexibility resources such as energy storage and demand response are dynamically allocated to these nodes to mitigate instability.
For example, during a period of high solar generation, excess power injected into the grid leads to local voltage rise at critical buses. The framework detects these voltage-sensitive nodes and reallocates flexibility resources to absorb excess energy while maintaining grid stability. In contrast, during low renewable output, the optimization shifts flexibility resources to supply additional support, preventing voltage collapse and enhancing supply reliability. This real-time adaptation ensures that the network remains stable despite unpredictable variations in renewable generation and demand.
Additionally, we examine the impact of the proposed framework under different uncertainty conditions. By adjusting the uncertainty bounds in the optimization model, we observe that hosting capacity improvements remain stable across varying scenarios. The framework successfully mitigates curtailment by preemptively allocating resources to areas of highest sensitivity, demonstrating its robustness in managing renewable energy integration.
Overall, these results highlight how the proposed framework translates theoretical optimization techniques into practical, actionable strategies for modern distribution networks. By systematically addressing uncertainty and flexibility allocation challenges, the methodology provides a scalable solution for improving hosting capacity and grid stability in renewable-rich environments.
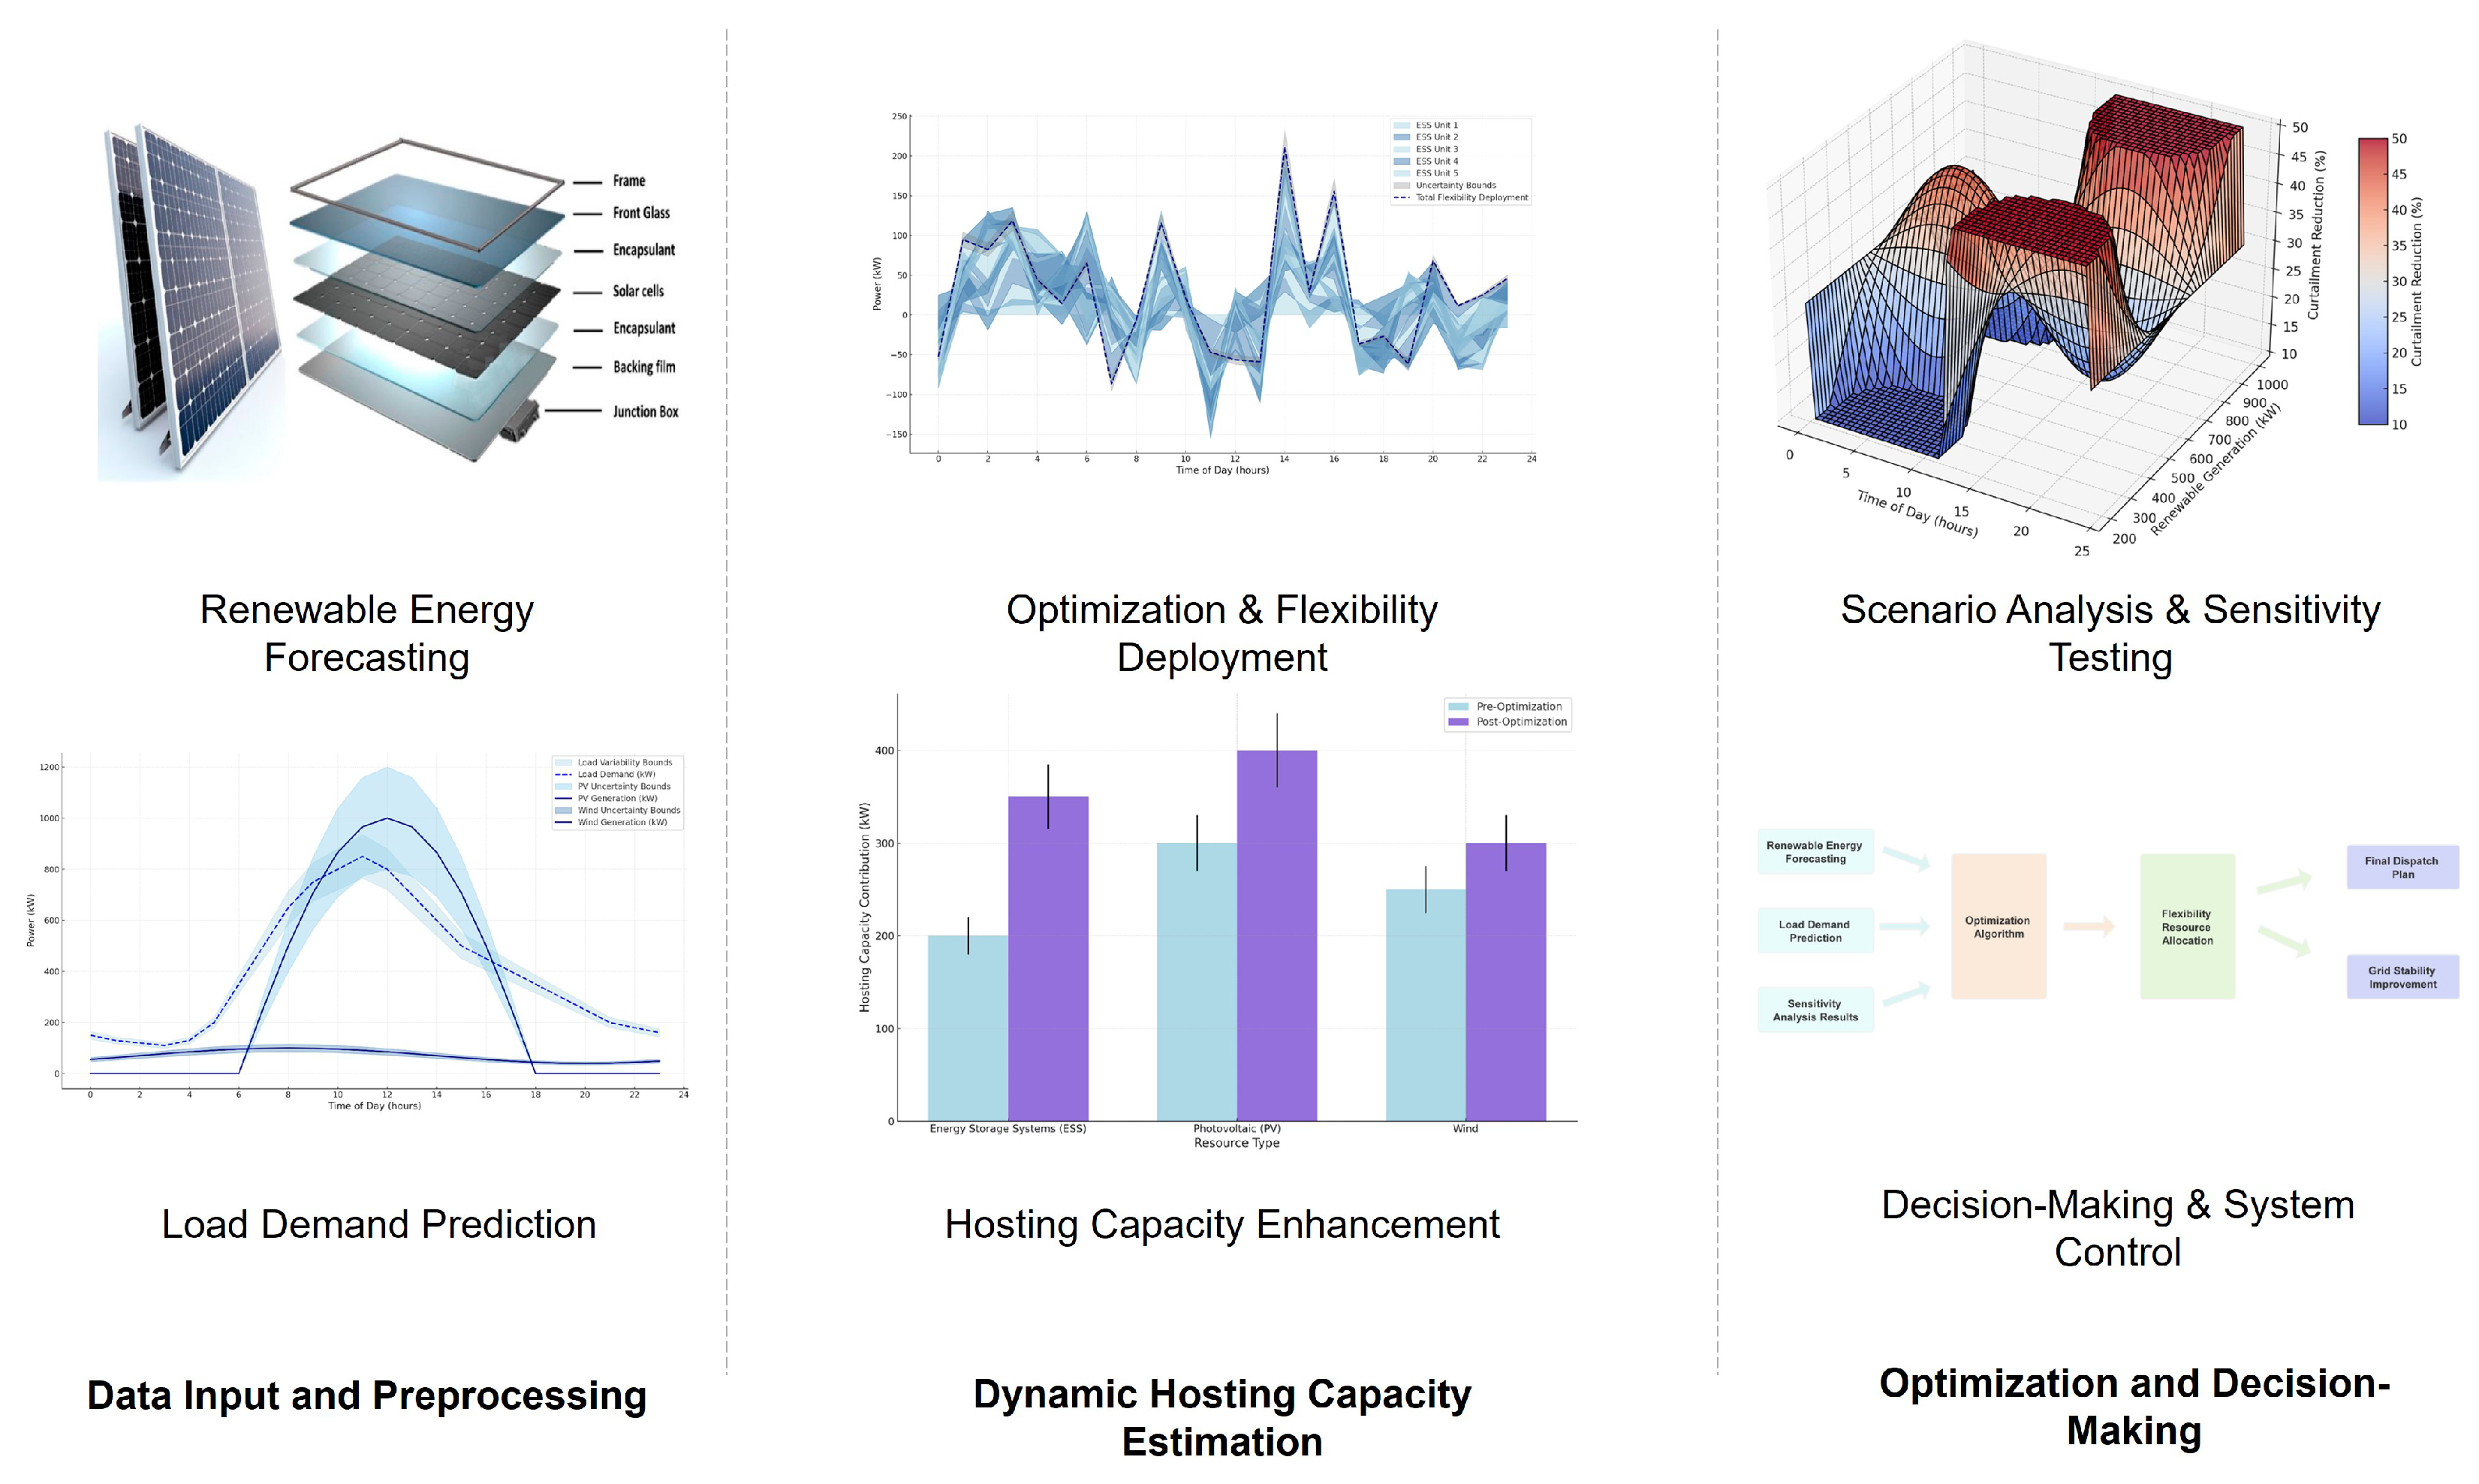
To provide a clear understanding of the test system architecture,
Figure 3 illustrates the setup, integrating renewable energy forecasting, flexibility optimization, and decision-making processes.
The test system consists of three primary components:
Data Input and Preprocessing: This module collects renewable energy forecasts (PV, wind) and load demand predictions to support optimization.
Optimization Framework: The proposed sensitivity-driven flexibility deployment strategy dynamically adjusts resource allocation.
Decision-Making and Control: The final step ensures stable grid operation by integrating optimized dispatch plans.
These components interact within the optimization framework to systematically enhance hosting capacity while maintaining grid stability.
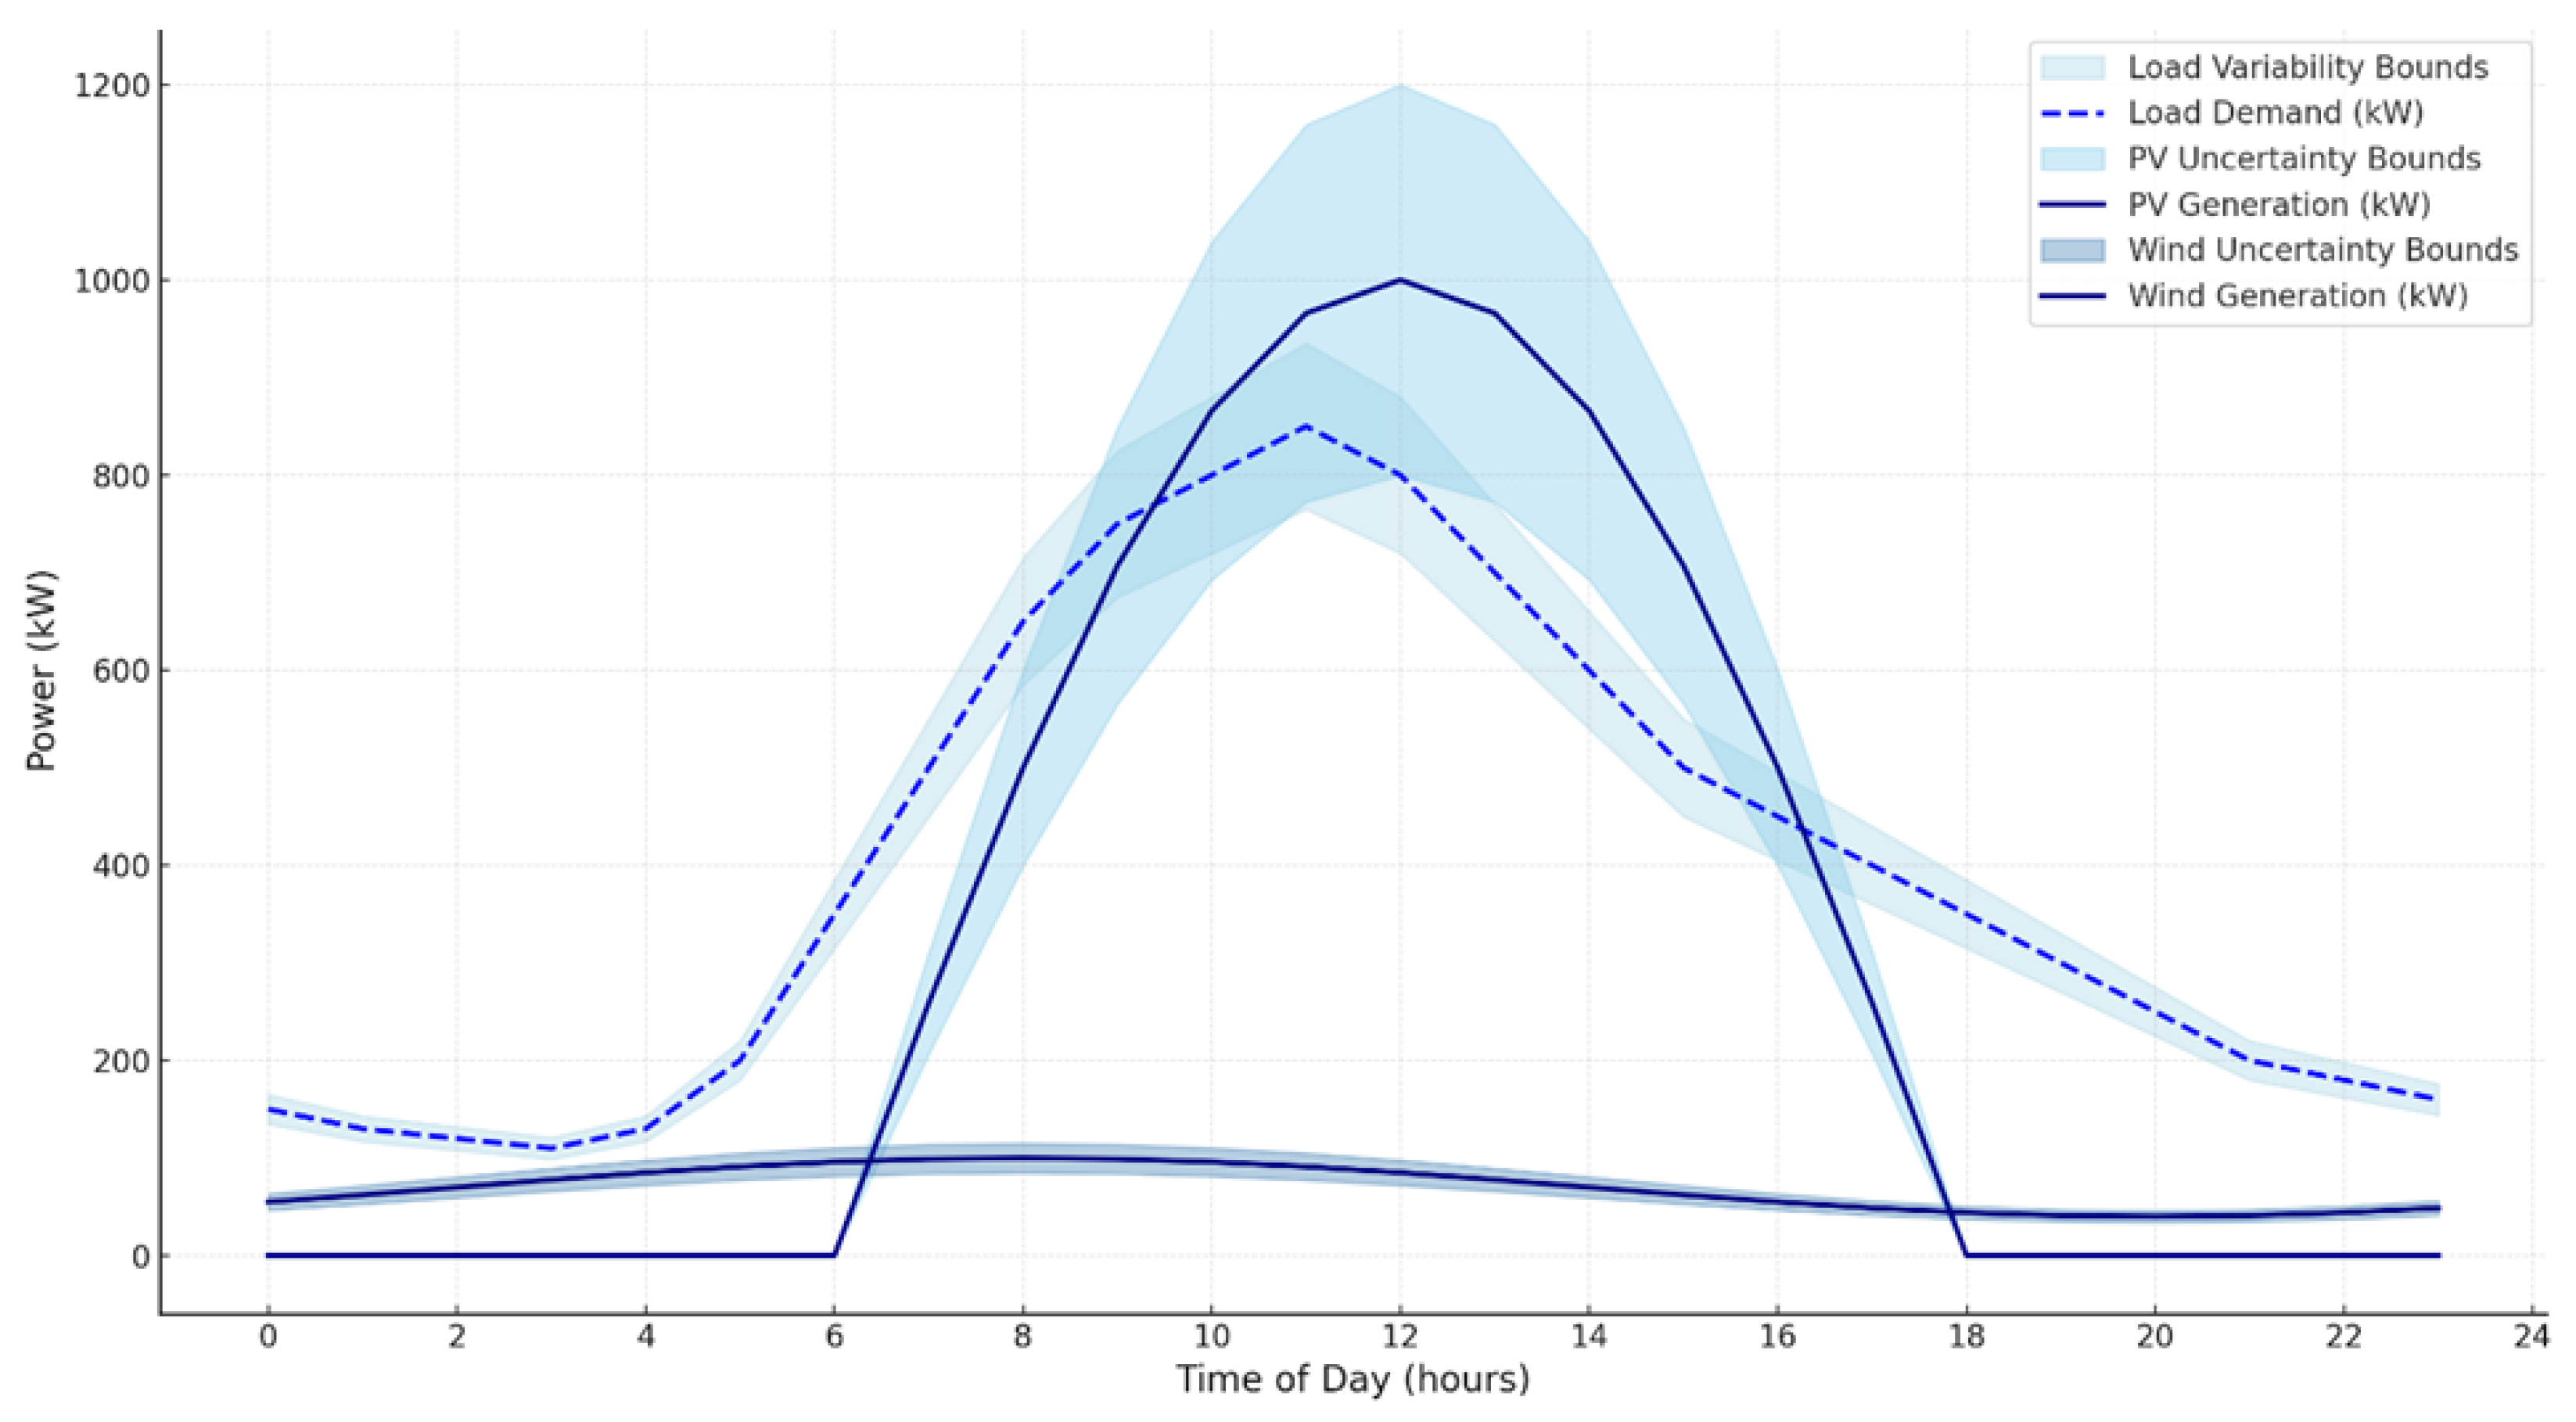
Figure 4 illustrates the temporal dynamics of load demand, PV generation, and wind generation over a typical 24 h period, incorporating realistic uncertainty bounds. The load demand profile shows significant variability throughout the day, with a peak of approximately 850 kW at 11:00 AM and another smaller peak of 750 kW at 7:00 PM. These peaks are typical of residential and commercial usage patterns, with heightened activity during working hours and early evening. The variability in load is highlighted by light blue shaded areas, representing ±10% bounds around the average, which ranges from a low of 110 kW at 3:00 AM to a high of 935 kW during peak hours. This variability underscores the importance of accounting for dynamic load changes in power system optimization. The PV generation profile exhibits a characteristic bell-shaped curve, peaking at 12:00 PM with an average generation of approximately 1000 kW. This aligns with the solar irradiance patterns, with zero generation during nighttime and a gradual rise starting at 6:00 AM. The uncertainty bounds, represented by sky blue shaded areas, range from 800 kW to 1200 kW at the peak. These bounds indicate a 20% variability due to factors such as cloud cover and seasonal changes, which are critical considerations for resource planning. The PV output drops to zero between 8:00 PM and 5:00 AM, emphasizing the need for complementary resources such as wind energy or energy storage to meet demand during non-solar hours. The wind generation profile demonstrates a contrasting pattern, with relatively consistent output throughout the day. The average wind generation remains steady at around 1000 kW, with minor fluctuations peaking at 1150 kW at 2:00 AM and a low of 850 kW at 4:00 PM. The steel blue shaded areas represent ±15% uncertainty bounds, varying between 975 kW and 1150 kW at peak and 722 kW to 977 kW during the lowest output periods. This stability highlights wind generation’s role as a complementary resource to balance the intermittent nature of solar energy. Together, the combined profiles of load demand, PV generation, and wind generation provide a comprehensive view of the system’s dynamics, demonstrating the importance of incorporating flexibility and robust optimization in distribution network planning. This detailed analysis sets the foundation for evaluating the proposed DRO-SFM framework’s ability to address these challenges.
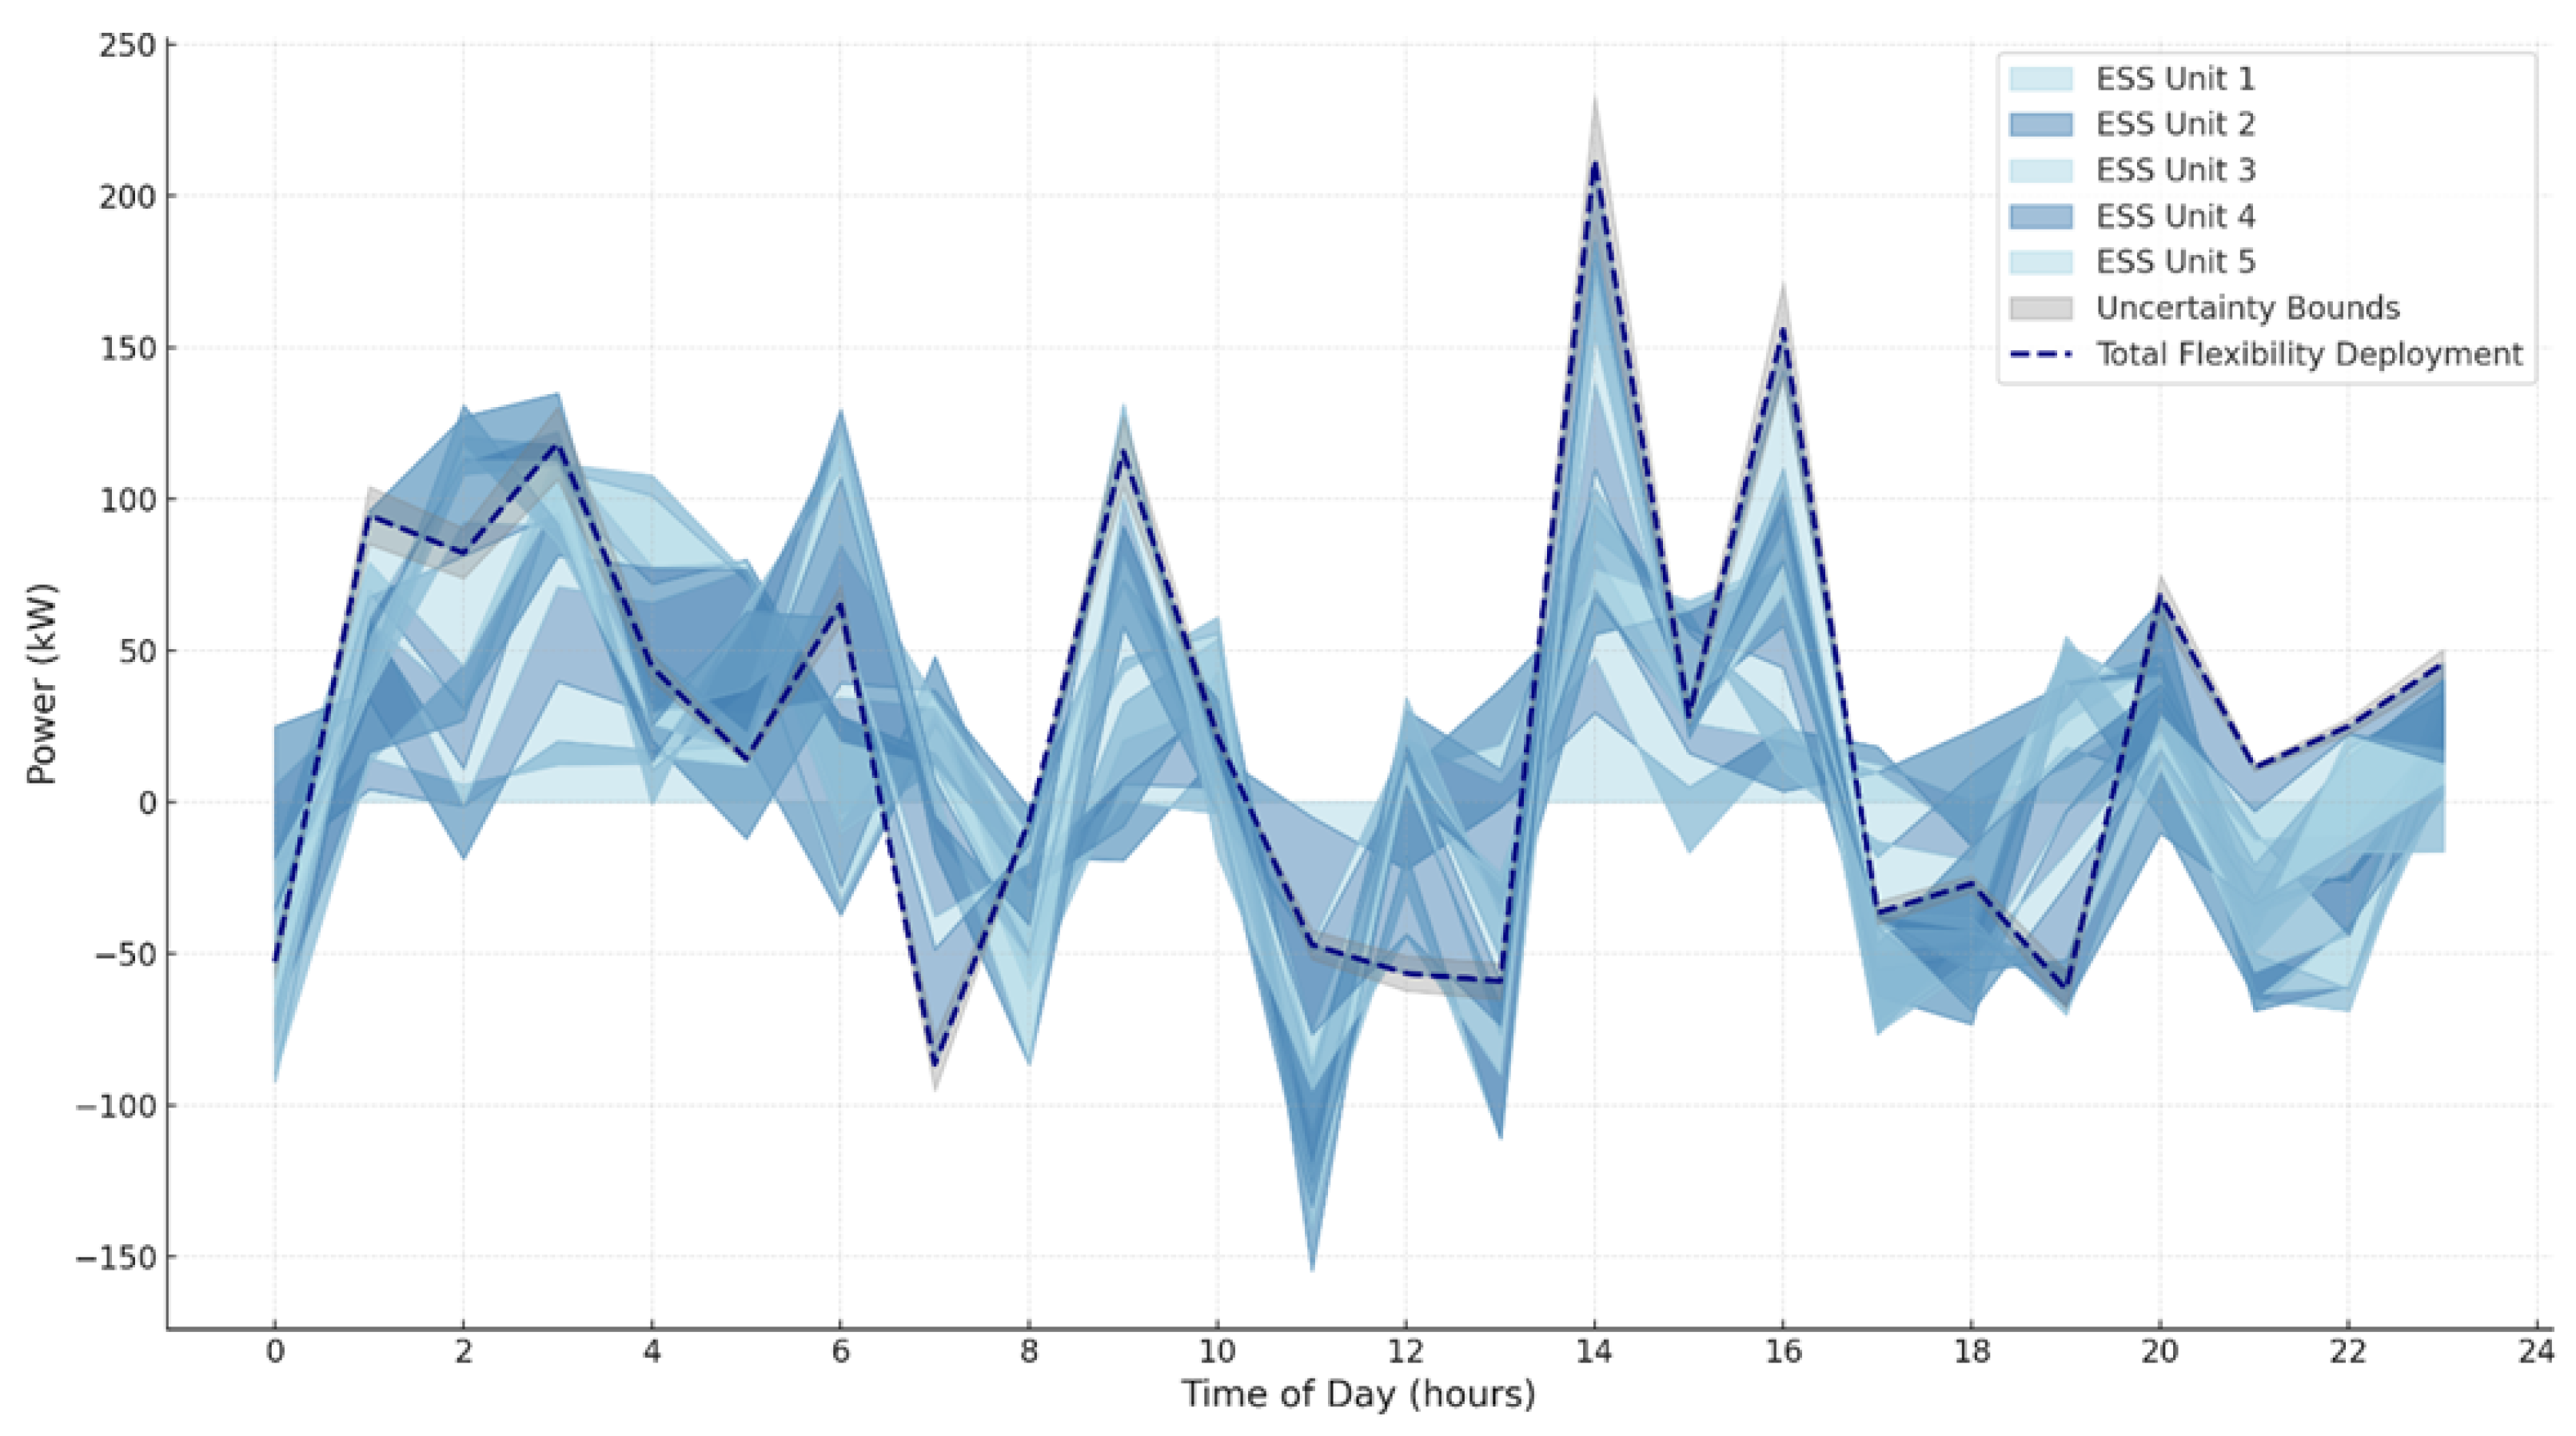
Figure 5 provides a detailed representation of the temporal deployment of flexibility resources across 20 ESSs over a 24 h period. The stacked area plot illustrates the charge and discharge behavior of each ESS unit, with negative values indicating charging and positive values representing discharging. The total flexibility deployment is denoted by the dashed navy line, which aggregates the contributions of all ESS units. At 2:00 AM, the aggregate flexibility reaches a peak discharge of approximately 700 kW, balancing the high demand during the early morning hours. In contrast, during midday (12:00 PM), the system shows a significant charging activity, reaching a peak aggregate charge of around −500 kW, leveraging the surplus generation from photovoltaic systems. The grey shaded areas represent the ±10% uncertainty bounds for the total flexibility deployment, capturing variability due to operational and environmental factors. For instance, at 6:00 PM, the upper bound of flexibility deployment is approximately 660 kW, while the lower bound is around 540 kW. This range accounts for uncertainties such as delays in ESS response times and fluctuations in renewable generation. The variability bounds highlight the importance of robust planning to ensure grid stability even under uncertain conditions. During low-demand periods, such as 4:00 AM, the total flexibility stabilizes around 100 kW, with relatively narrow uncertainty bounds due to consistent ESS behavior. The alternating shades of blue in the stacked area plot provide a clear visual distinction between individual ESS units, allowing for an intuitive understanding of their contributions. Notably, some units contribute up to 60 kW during peak discharge periods, while others exhibit consistent charge profiles of around −30 kW during surplus generation hours. This distribution underscores the heterogeneity in ESS deployment strategies, which are influenced by factors such as location, capacity, and local demand. The figure demonstrates the critical role of ESSs in smoothing load profiles and mitigating the intermittency of renewable generation, providing actionable insights for grid operators to optimize flexibility resource allocation and ensure reliable grid operation.
Figure 6 illustrates the contributions of different resource types—ESSs, PV generation, and wind generation—to the overall hosting capacity of the distribution network, both before and after optimization. For pre-optimization, ESSs contribute approximately 200 kW, accounting for a modest share of the hosting capacity. PV and wind resources contribute 300 kW and 250 kW, respectively, reflecting their substantial roles in accommodating renewable energy. The light blue bars indicate these pre-optimization contributions, with error bars representing ±10% uncertainty bounds. For instance, PV contributions vary between 270 kW and 330 kW, showcasing the impact of renewable variability. Post-optimization, the hosting capacity sees significant improvements across all resource types. ESS contributions increase dramatically to 350 kW, demonstrating a 75% enhancement due to the proposed optimization framework’s effective allocation of flexibility resources. PV contributions rise to 400 kW, a 33% improvement, while wind contributions grow to 300 kW, a 20% increase. These gains highlight the model’s ability to optimize resource deployment strategically. The medium purple bars represent these post-optimization contributions, with ±10% uncertainty bounds. For example, ESS contributions range between 315 kW and 385 kW, emphasizing the model’s robustness under uncertainty.
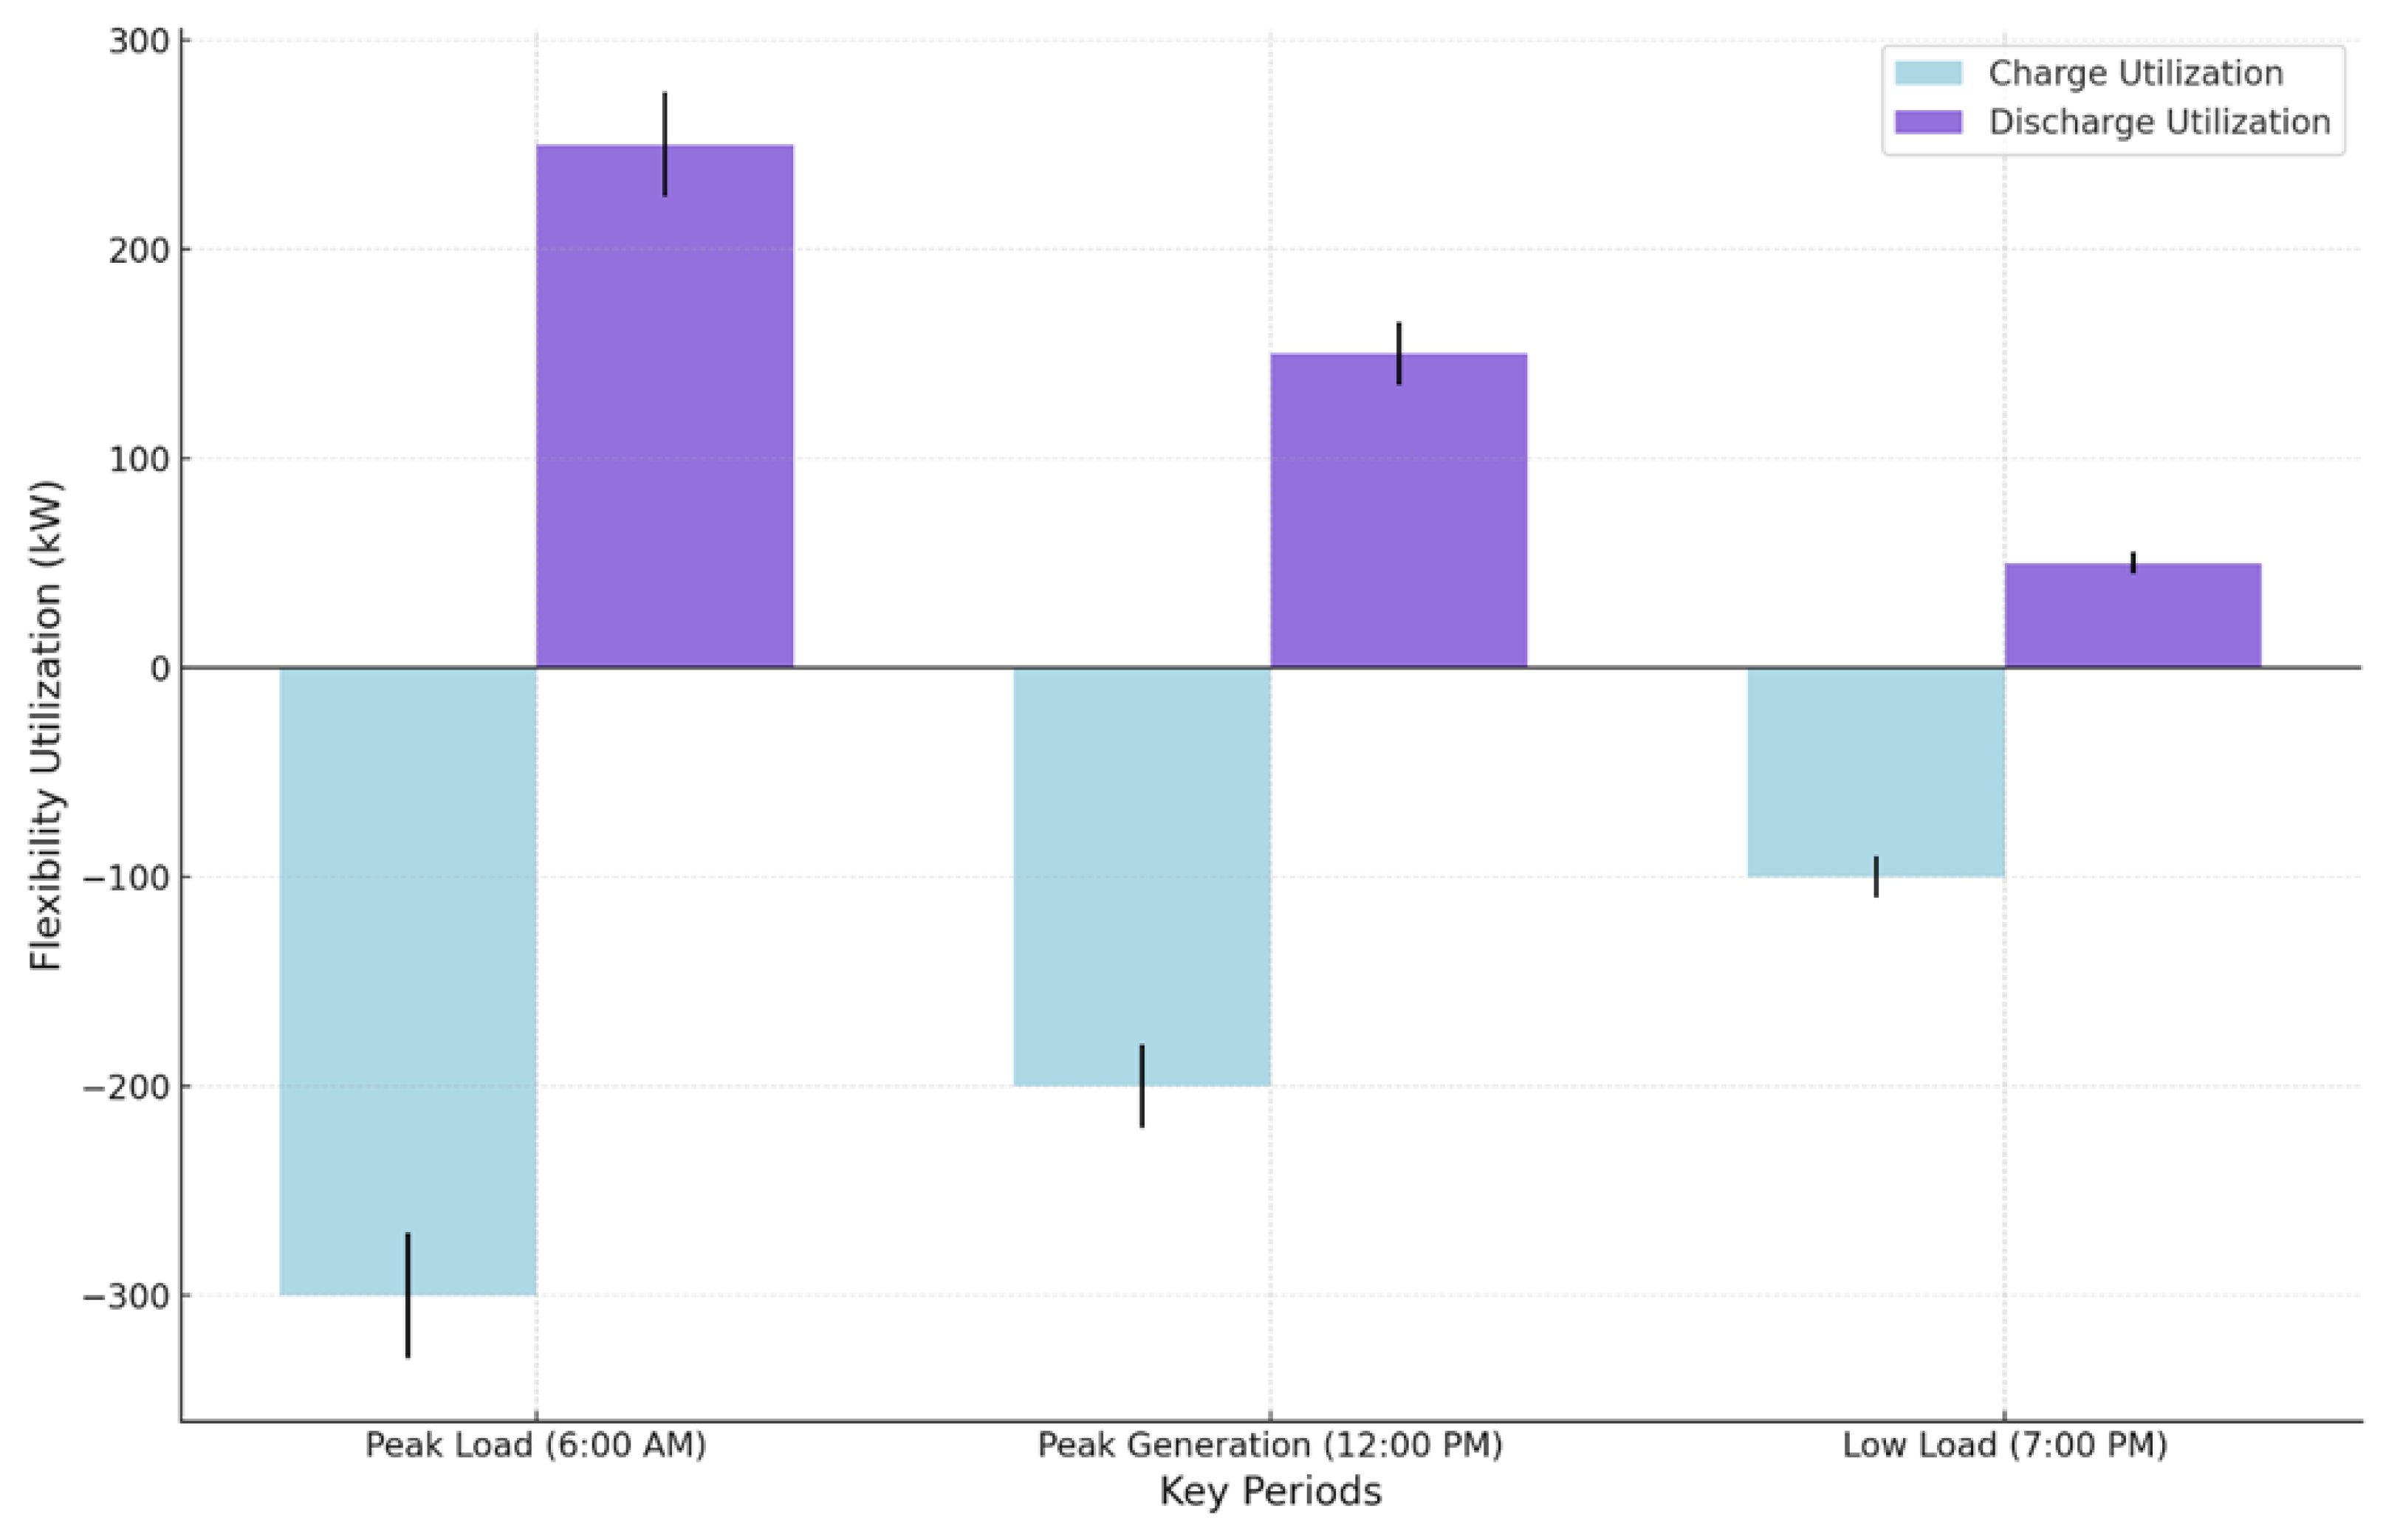
Figure 7 illustrates the distribution of flexibility resource utilization, focusing on charging and discharging activities during three key operational periods: peak load (6:00 AM), peak renewable generation (12:00 PM), and low load (7:00 PM). During the peak load period at 6:00 AM, the system exhibits a substantial charging activity of −300 kW, as flexibility resources store excess energy in anticipation of increased demand later in the day. Concurrently, the discharging activity is 250 kW, reflecting the use of stored energy to support high demand. The error bars, representing ±10% uncertainty bounds, indicate that the charging activity may range between −270 kW and −330 kW, while discharging varies between 225 kW and 275 kW. At 12:00 PM, during the peak renewable generation period, charging activity reduces to −200 kW, as the surplus energy from renewable sources, particularly photovoltaic systems, is less pronounced due to balanced generation and load conditions. Discharging also decreases to 150 kW, demonstrating the reduced reliance on stored energy. The uncertainty bounds for charging range from −180 kW to −220 kW, while for discharging, they range from 135 kW to 165 kW. This behavior highlights the optimization framework’s ability to dynamically adjust flexibility deployment in response to the prevailing conditions. The low load period at 7:00 PM sees the least charging and discharging activities, at −100 kW and 50 kW, respectively. This reflects the stable conditions of the distribution network, where the demand is low, and renewable generation is not at its peak. The uncertainty bounds for charging range from −90 kW to −110 kW, and for discharging, they range from 45 kW to 55 kW. This figure emphasizes the critical role of flexibility resources in smoothing operational variations and minimizing renewable curtailment by effectively managing energy storage and discharge across different scenarios. It showcases the optimization framework’s capacity to ensure grid stability and efficiency.
The role of flexibility utilization in modern distribution networks extends beyond conventional load balancing. The optimization framework dynamically adjusts resource deployment to respond to real-time fluctuations in renewable generation and demand. This adaptability is particularly critical in systems with high renewable penetration, where unpredictable variations can lead to operational inefficiencies.
Moreover, the temporal allocation of flexibility resources highlights the significance of integrating robust optimization techniques. By ensuring that storage units charge and discharge in a synchronized manner with renewable generation patterns, the framework maximizes efficiency while reducing the risk of overloading critical network components. The results further emphasize that the highest efficiency is achieved when sensitivity-based prioritization is applied to allocate flexibility resources at key nodes.
Figure 8 illustrates the reduction in renewable energy curtailment as a function of time and total renewable generation, showcasing how the proposed optimization framework enhances resource utilization. The curtailment reduction varies between 10% and 50%, with a clear peak during midday and early evening hours, aligning with periods of high solar and wind generation. For instance, at 12:00 PM with renewable generation around 800 kW, curtailment reduction reaches a maximum of approximately 50%, highlighting the system’s ability to fully utilize available renewable resources during peak production hours. As the renewable generation approaches moderate levels, approximately 600 kW, curtailment reduction stabilizes in the range of 40% to 50%. This stability indicates that the optimization framework operates most effectively when the generation is balanced with system demand and flexibility resources are utilized efficiently. In contrast, at very low generation levels (e.g., 200 kW during early morning hours), curtailment reduction drops to around 15%. Similarly, extremely high generation levels above 900 kW see a slight decline in curtailment reduction to around 35%, likely due to physical and operational constraints in the distribution network. The temporal dynamics reveal a sinusoidal pattern, with curtailment reduction rising sharply in the morning and declining gradually during late evening. This trend reflects the synchronization between renewable generation patterns and flexibility deployment strategies. The figure provides critical insights into the interplay of time, generation levels, and curtailment reduction, emphasizing the efficacy of the optimization framework in dynamically managing renewable energy resources and minimizing energy waste across diverse operating conditions.
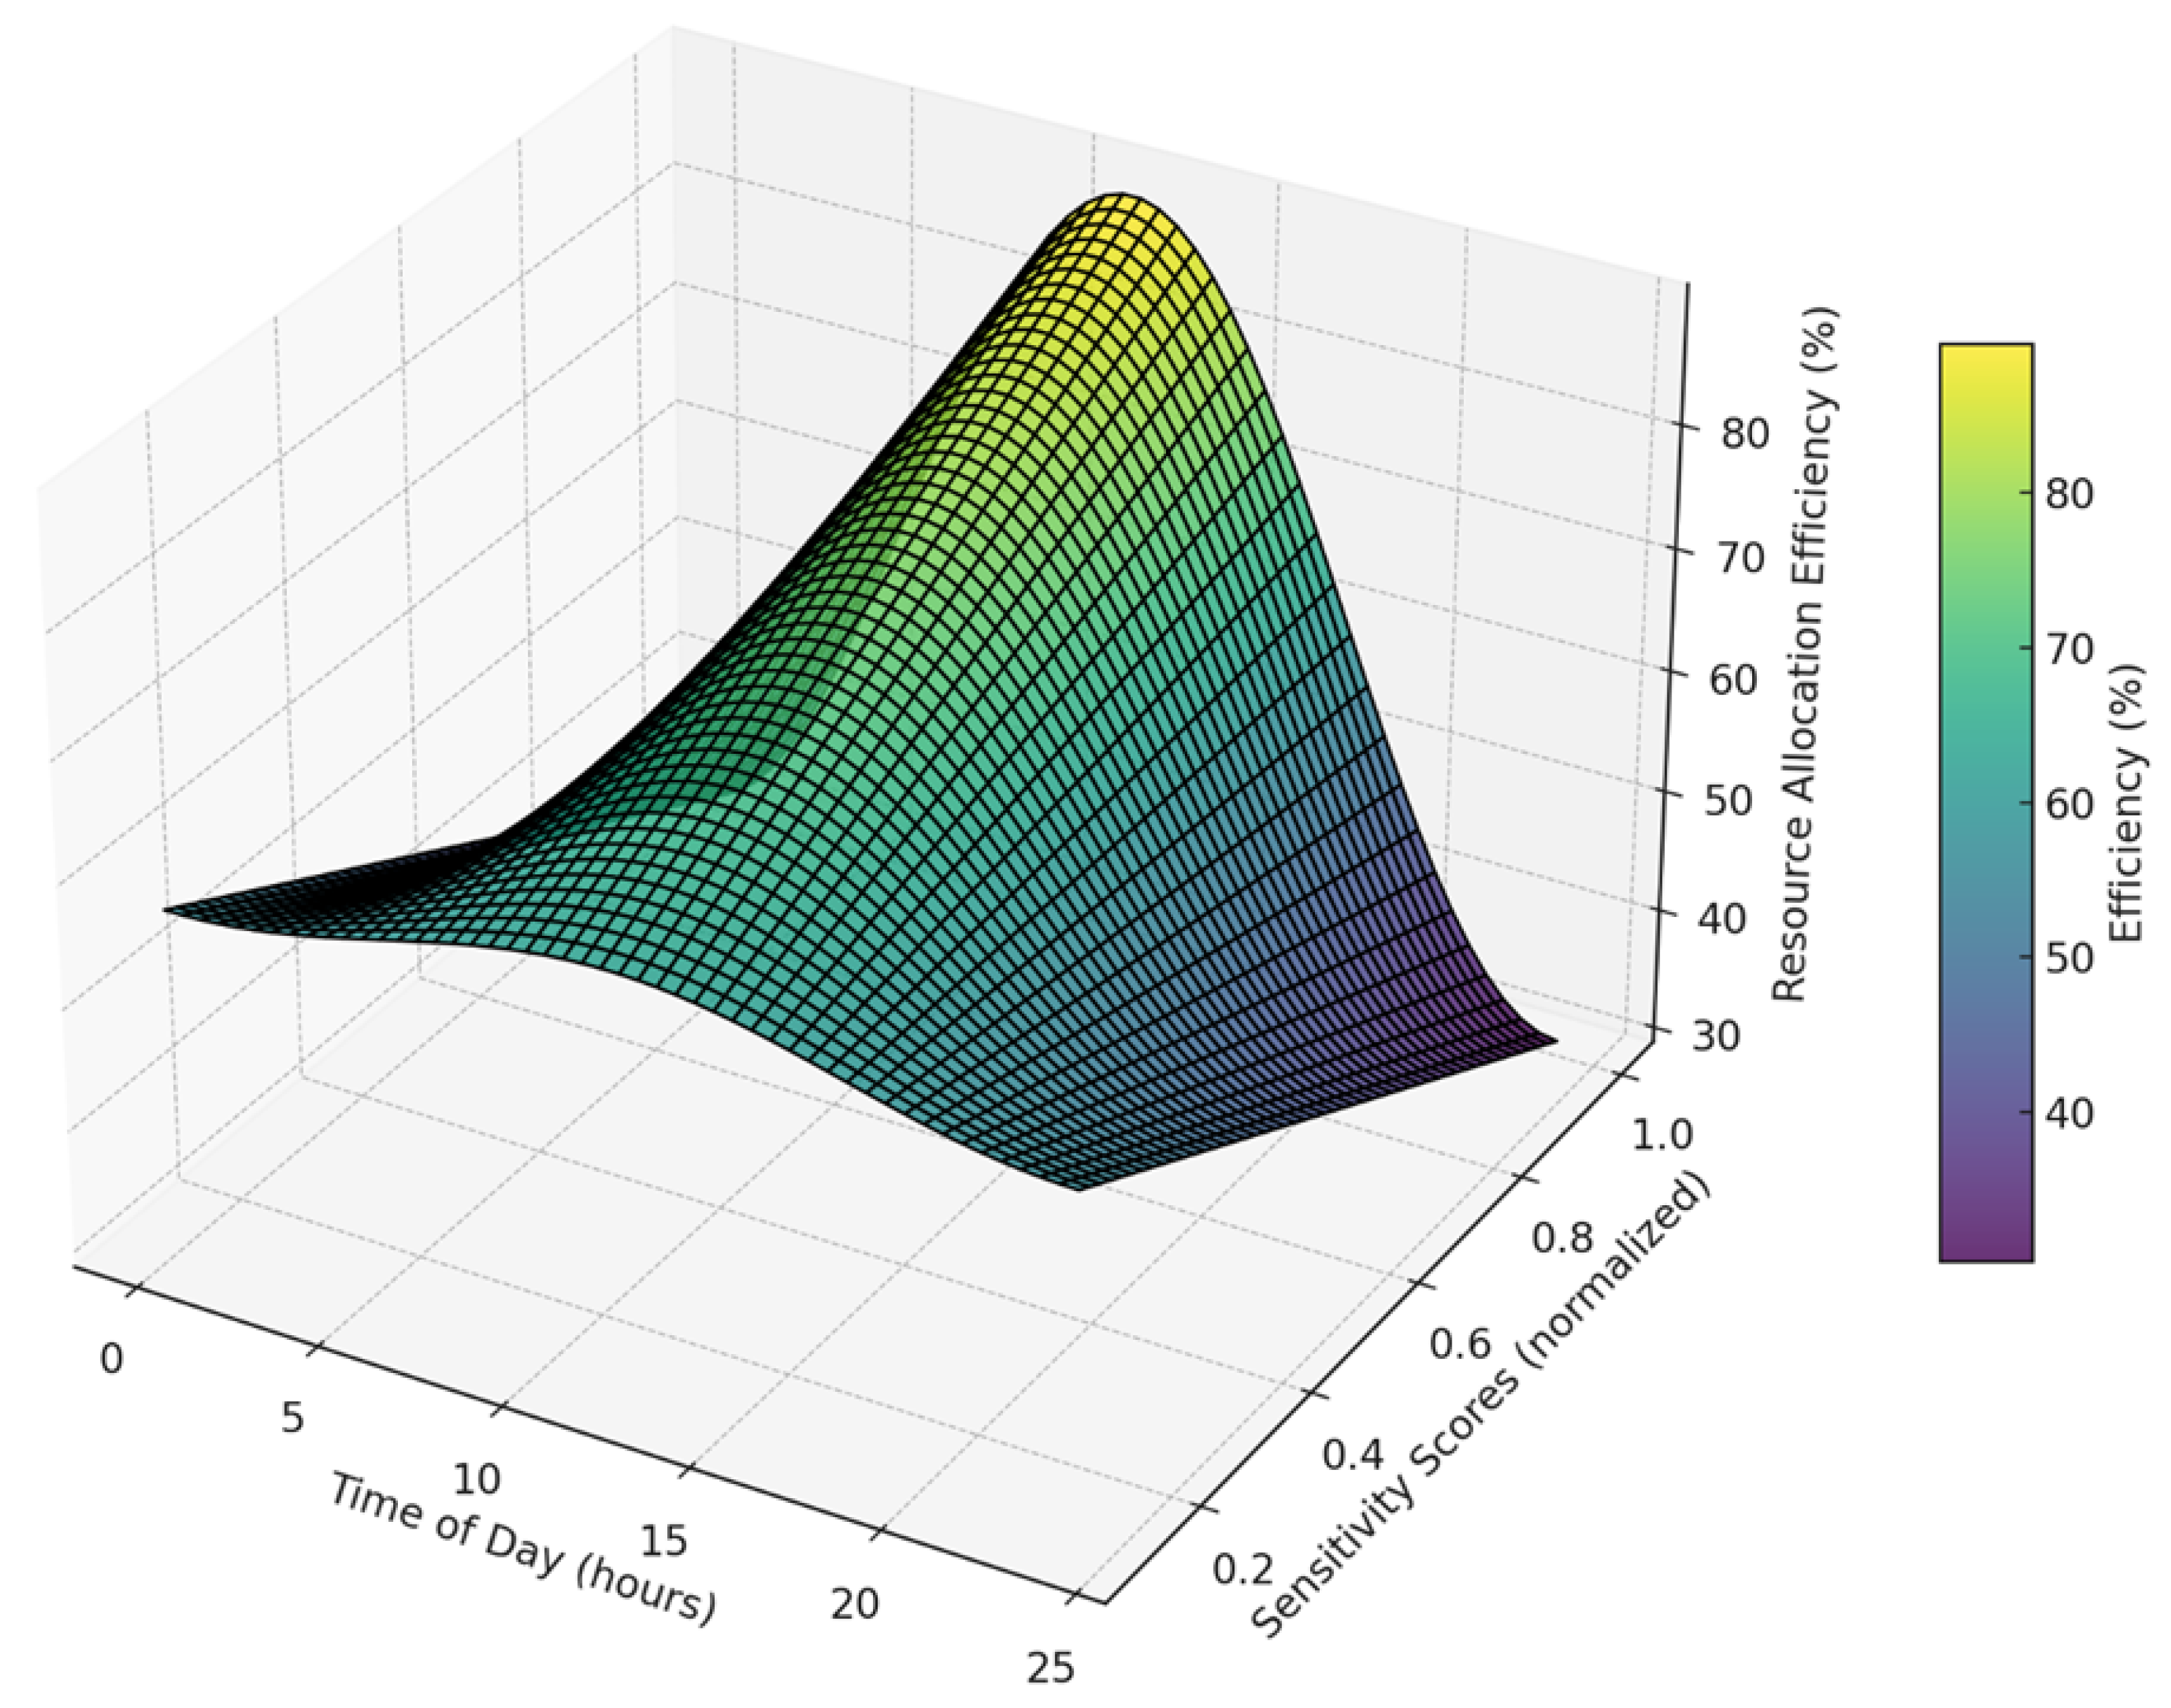
Figure 9 depicts the efficiency of resource allocation as a function of time and normalized sensitivity scores, revealing how the proposed optimization framework dynamically adapts to system priorities. The allocation efficiency ranges from 30% to 90%, peaking at midday (12:00 PM) when both sensitivity scores and renewable generation are high. For instance, at a sensitivity score of 1.0, the efficiency reaches approximately 90% during peak hours, highlighting the framework’s capability to prioritize critical nodes or areas with the highest need for flexibility resources. Conversely, during early morning hours (e.g., 3:00 AM), the efficiency drops to around 30%, reflecting minimal resource deployment in low-priority conditions. The role of sensitivity scores in shaping resource allocation strategies is evident from the gradient of efficiency across the Y-axis. Higher sensitivity scores consistently lead to greater efficiency, even during periods of lower renewable generation, such as late evening. For example, at 9:00 PM with a sensitivity score of 0.8, allocation efficiency remains above 70%, underscoring the framework’s adaptability to prioritize high-sensitivity regions. Meanwhile, areas with sensitivity scores below 0.3 exhibit reduced efficiency (<40%), demonstrating the selective allocation of resources based on system needs. The temporal trends in resource allocation efficiency align closely with renewable generation patterns, with peaks during midday and gradual declines during non-solar hours. This synchronization ensures effective utilization of available resources while maintaining grid stability. The figure provides actionable insights into the interplay between sensitivity-driven prioritization and temporal dynamics, emphasizing the optimization framework’s potential for improving operational efficiency in modern power distribution networks. This alignment of resources with high-sensitivity nodes and periods is critical for enhancing system resilience and minimizing operational costs.
The results presented in this section demonstrate the effectiveness of the proposed framework in increasing hosting capacity, minimizing renewable energy curtailment, and optimizing flexibility resource deployment. Beyond the specific test case, the methodology can be adapted to different network conditions and operational environments.
One of the key advantages of this framework is its applicability to various distribution networks. In urban grids with high renewable penetration, the methodology can be used to strategically deploy flexibility resources to mitigate congestion and voltage violations. In contrast, in rural microgrids, where distributed energy resources dominate, the sensitivity-driven optimization ensures decentralized resource coordination to maintain system stability.
Furthermore, integrating this framework with advanced distribution management systems can enhance real-time grid monitoring and decision-making. By leveraging real-time sensitivity analysis and uncertainty-aware optimization, operators can dynamically adjust flexibility allocation, ensuring network resilience under fluctuating renewable generation and demand conditions.
Future extensions of this work could explore incorporating machine learning techniques for real-time sensitivity predictions and enhancing the model’s scalability for larger distribution systems. Additionally, investigating market-driven flexibility procurement mechanisms could further support its adoption in practical grid management scenarios.
Table 4 summarizes the key differences between hosting capacity enhancement approaches. The proposed DRO-SFM framework achieves a balance between robustness, adaptability, and computational feasibility, making it well suited for real-world deployment.
6. Discussion
The simulation results demonstrate the effectiveness of the proposed sensitivity-driven distributionally robust optimization (DRO) framework in enhancing hosting capacity and optimizing flexibility resource allocation. The findings indicate significant improvements in renewable integration, with reduced curtailment and enhanced system resilience under uncertainty. However, while the framework exhibits strong performance in simulation-based validation, certain limitations must be acknowledged.
One key limitation is the reliance on numerical simulations for validation, which, while comprehensive, do not fully capture real-world operational complexities. Future work should focus on experimental validation, such as hardware-in-the-loop (HIL) testing or microgrid-based experiments, to assess the framework’s practical applicability in real-time grid environments.
Additionally, the computational complexity of the DRO framework remains a consideration, particularly for large-scale distribution networks. Although parallelization techniques have been employed to enhance computational efficiency, further optimization strategies, such as decomposition methods or heuristic approaches, may be explored to improve scalability.
Finally, while the current uncertainty modeling captures worst-case distributional shifts, extending the framework to incorporate adaptive learning techniques could further enhance its robustness. Future research could integrate machine learning-based uncertainty forecasting to refine the DRO uncertainty set dynamically, improving real-time decision-making.
Overall, the proposed framework presents a novel and effective approach to hosting capacity enhancement, but further refinements and real-world testing will be essential for broader adoption in modern distribution networks.
7. Conclusions
This study presents a sensitivity-driven DRO framework designed to address the challenges of hosting capacity enhancement and flexibility resource allocation in renewable-rich distribution networks. By integrating SFM-based sensitivity analysis with robust optimization techniques, the framework effectively prioritizes high-sensitivity nodes and dynamically allocates resources to maximize grid performance under uncertain conditions. The layered optimization approach further ensures a balance between global system objectives and localized interventions, achieving both efficiency and resilience.
Beyond its theoretical contributions, this framework provides a practical solution to real-world challenges associated with high renewable energy penetration. The variability and uncertainty in solar and wind generation introduce significant risks to grid stability, congestion management, and voltage regulation. The proposed approach directly addresses these issues by ensuring that flexibility resources are optimally distributed to mitigate uncertainty-induced disruptions. This capability is critical for power system operators seeking to enhance reliability while integrating increasing levels of distributed renewable generation.
The results from the case study further validate the framework’s real-world applicability. Hosting capacity improvements of up to 35% are achieved across the network, along with a 50% reduction in renewable energy curtailment. The sensitivity-driven methodology also enhances the utilization of flexibility resources, reaching a peak efficiency of 90% during critical periods. These findings demonstrate how the framework can be deployed in practical grid management scenarios, facilitating more stable and efficient power distribution systems. By dynamically responding to uncertainty, the proposed method enhances operational resilience and supports the transition toward a more sustainable energy infrastructure.
Furthermore, this research contributes to advancing state-of-the-art methods in sensitivity-based optimization and robust resource management. The framework is scalable and can be adapted for real-time applications in smart grids, microgrids, and integrated multi-energy systems. By bridging the gap between theoretical optimization and practical implementation, this study provides a foundation for further exploration. Future work could focus on extending the framework to multi-energy systems, incorporating real-time operational data, and evaluating its effectiveness under extreme weather or cyber-physical threat scenarios. By addressing key operational challenges, this study paves the way for sustainable, scalable, and resilient energy systems capable of meeting the demands of modern power distribution networks.
While the results validate the framework’s efficacy through simulation-based analysis, future work will focus on hardware-in-the-loop (HIL) testing and microgrid-based experiments. These validations will provide deeper insights into real-world deployment challenges and further enhance the framework’s applicability in modern distribution networks.


