Article

The Assessment of Electricity Self-Sufficiency Potential of Facade-Applied Photovoltaic Systems Based on Design Scenarios: A Case Study of an Apartment Complex in the Republic of Korea

1
Department of Architecture Engineering, Hanbat National University, Daejeon 34158, Republic of Korea
2
Metropolitan Architecture of Choi and Kang, Sejong-si 30127, Republic of Korea
*
Author to whom correspondence should be addressed.
Energies 2025, 18(3), 541; https://doi.org/10.3390/en18030541
Submission received: 15 October 2024 / Revised: 17 January 2025 / Accepted: 22 January 2025 / Published: 24 January 2025
(This article belongs to the Section A2: Solar Energy and Photovoltaic Systems)

Abstract

The performance of facade-applied photovoltaic (FPV) systems in high-rise apartment complexes varies based on the height and layout of the buildings, influencing the overall energy efficiency of the complex. This study assesses the potential of FPV systems to achieve electricity self-sufficiency in apartment complexes. Focusing on a single apartment complex in Seoul, South Korea, the geometry and layout of each building are used to estimate electricity consumption and assess the impact of FPV systems. The electricity consumption of the apartment complex was estimated based on the electricity energy use intensity derived from the analysis of public data and the gross floor area of the apartment complex, yielding an annual electricity consumption of 1803.7 MWh. Two types of photovoltaic (PV) systems were considered: rooftop-mounted photovoltaic (RFPV) systems and FPV systems installed on the south-facing facades of buildings. Three FPV design scenarios were examined (Scenario A: full facade coverage; Scenario B: horizontal-only installation; Scenario C: vertical-only installation), with no design variations for the RFPV system. The RFPV system was estimated to contribute 30.7% (553.8 MWh/yr) of the complex’s electricity consumption. The remaining electricity consumption, 1249.9 MWh/yr, is met by the FPV systems, with self-sufficiency rates under the three FPV design scenarios found to be 83.3% for Scenario A, 33.6% for Scenario B, and 64.6% for Scenario C. These findings highlight the need for additional PV installations or the incorporation of other renewable energy technologies to achieve full electricity self-sufficiency. This study provides a foundational model for applying PV systems to high-rise apartment complexes, offering insights for further research and real-world implementation.

1. Introduction

Background and Objective

In 2022, the United Nations released a report stating that buildings and construction accounted for 34% of the world’s energy consumption in 2021 [1]. Additionally, the portion of global energy consumption represented by the building sector is projected to rise from approximately 20% in 2018 to 22% by 2050 [2]. Over the last decade, accelerated urbanization and development have led to an increase in residential buildings in response to the growing population [3]. In South Korean cities, high-rise apartment buildings notably dominate the urban landscape, highlighting the importance of ensuring the energy efficiency of these structures [4]. According to a report for 2022 by the Korea Energy Agency, the building sector was responsible for approximately 20.5% of the total energy consumption and 46.8% of the electric energy consumption. Of the various building types, apartments account for about 20.2% of the total energy consumption within the building sector [5]. Building electrical energy consumption has been investigated by several researchers, finding that the amount of electricity is affected by numerous physical factors such as the type [6] and the shape of the building [7]; the density, height, and age of the construction; and the materials used in construction [8,9]. Additionally, high-density and high-rise buildings require more electrical energy for cooling and heating [10,11].
The South Korean government has implemented various policies to enhance building energy efficiency. First, they established insulation performance standards [12] for each building component to ensure that construction adheres to these requirements. In 2013, they introduced a policy aimed at enhancing the overall energy performance of buildings by focusing on total energy consumption, rather than solely on the insulation performance of building components. This policy, known as the Building Energy Efficiency Certificate [13], requires buildings to be evaluated for their energy efficiency based on their design, with a rating assigned according to the Energy Use Intensity (EUI) for primary energy, which is derived from the analysis results. Starting in 2017, a new policy, termed Zero-Energy Building (ZEB) Certification, alongside the existing regulations [14]. In contrast to the Building Energy Efficiency Certificate, this policy focuses on the concept of energy self-sufficiency. The energy self-sufficiency rate of a building refers to the ratio of its energy production to its energy consumption, and a building must achieve a self-sufficiency rate of at least 20% to be recognized as a ZEB. As such, the integration of renewable energy systems is not simply optional but mandatory.
From this perspective, renewable energy systems are crucial for enhancing the energy efficiency of buildings. In South Korea, the renewable energy technologies available for integration into buildings for electricity generation include photovoltaic (PV) systems, fuel cells, and wind turbines [15], with PV systems being the fundamental renewable energy technology applied to buildings that have obtained ZEB certification. Every certified ZEB is equipped with a PV system. When the energy production requirements cannot be fully met by the PV system alone, additional renewable energy technologies, such as geothermal systems and fuel cells, are integrated to supplement energy needs and achieve the required production levels for certification [16].
Around the world, the growing use of renewable energy sources, particularly PV systems in buildings, is significantly contributing to achieving the global climate goals aimed at reducing CO2 emissions [17]. Moreover, it helps to reduce electricity costs by increasing the share of renewable electricity production combined with local self-consumption [18,19]. PV systems can also be an effective solution for meeting the electrical energy demands of buildings. In particular, PV systems have long been used to enhance the energy efficiency of buildings and have thus undergone extensive technical validation. As a result, many countries advocate for PV systems in buildings. PV systems have been in existence for many years and are one of the most widely adopted renewable energy solutions for buildings [20]. In 2018, PV systems contributed to 55% of all new power installations globally, representing a huge portion of the 70% of new installations derived from renewable sources [21]. PV systems are characterized by their environmental friendliness, silence, and lack of pollution, making them suitable for diverse applications. These advantages contribute to their durability and reliability, which significantly reduces maintenance costs.
Research on various aspects of the energy performance of buildings and PV systems has been conducted. J. Abu Qadourah et al. [22] presented a method for evaluating the feasibility of installing PV systems on roofs and facades in Amman, Jordan, by assessing irradiation on various surfaces and considering shading from adjacent buildings. After investing the optimal solar water heating capacity for Swedish apartment buildings, N. Sommerfeldt and H. Madani suggest that for PV systems to achieve a self-consumption rate of 60–80%, they should generate sufficient power to supply 30–50% of the total load for buildings with laundry facilities or 15–35% for those without [23]. The concept of PV-sharing, particularly in apartment buildings, is summarized comprehensively yet succinctly by A. Jager-Waldau et al. [19]. The shared utilization of PV energy facilitates higher self-consumption by aggregating the energy demands of multiple households, as demonstrated by R. Luthander et al. [24], thereby enhancing the profitability of multi-occupant buildings. The findings indicate that under favorable conditions, households can achieve financial benefits from the increased self-consumption and self-sufficiency that result from implementing a PV system for aggregated loads across an apartment building.
The performance of PV systems installed in buildings has been extensively evaluated in numerous studies, considering various factors such as type of PV module [25,26,27], type of inverter and module-level power electronics [15], and PV modules with cracks [28]. These studies assessed the technical performance, energy efficiency, and economic viability of PV systems in buildings [23,29,30].
Earlier studies exploring energy consumption in residential buildings and PV System production have several limitations. First, most have primarily focused on conventional PV systems with little attention given to facade-applied PV (FPV) systems. Second, evaluations of FPV systems have usually focused on single apartment buildings, neglecting the effects of shading caused by nearby buildings in a complex, which can significantly impact system performance. Third, these studies often focus solely on the performance of FPV systems without integrating them into the building’s overall energy consumption.
This study was conducted to address the limitations of previous research and evaluate the potential for energy self-sufficiency using FPV systems in a selected apartment complex in Seoul, South Korea, designed as a ZEB. The building geometry and layout within the complex were used to assess the energy self-sufficiency potential of the FPV systems.

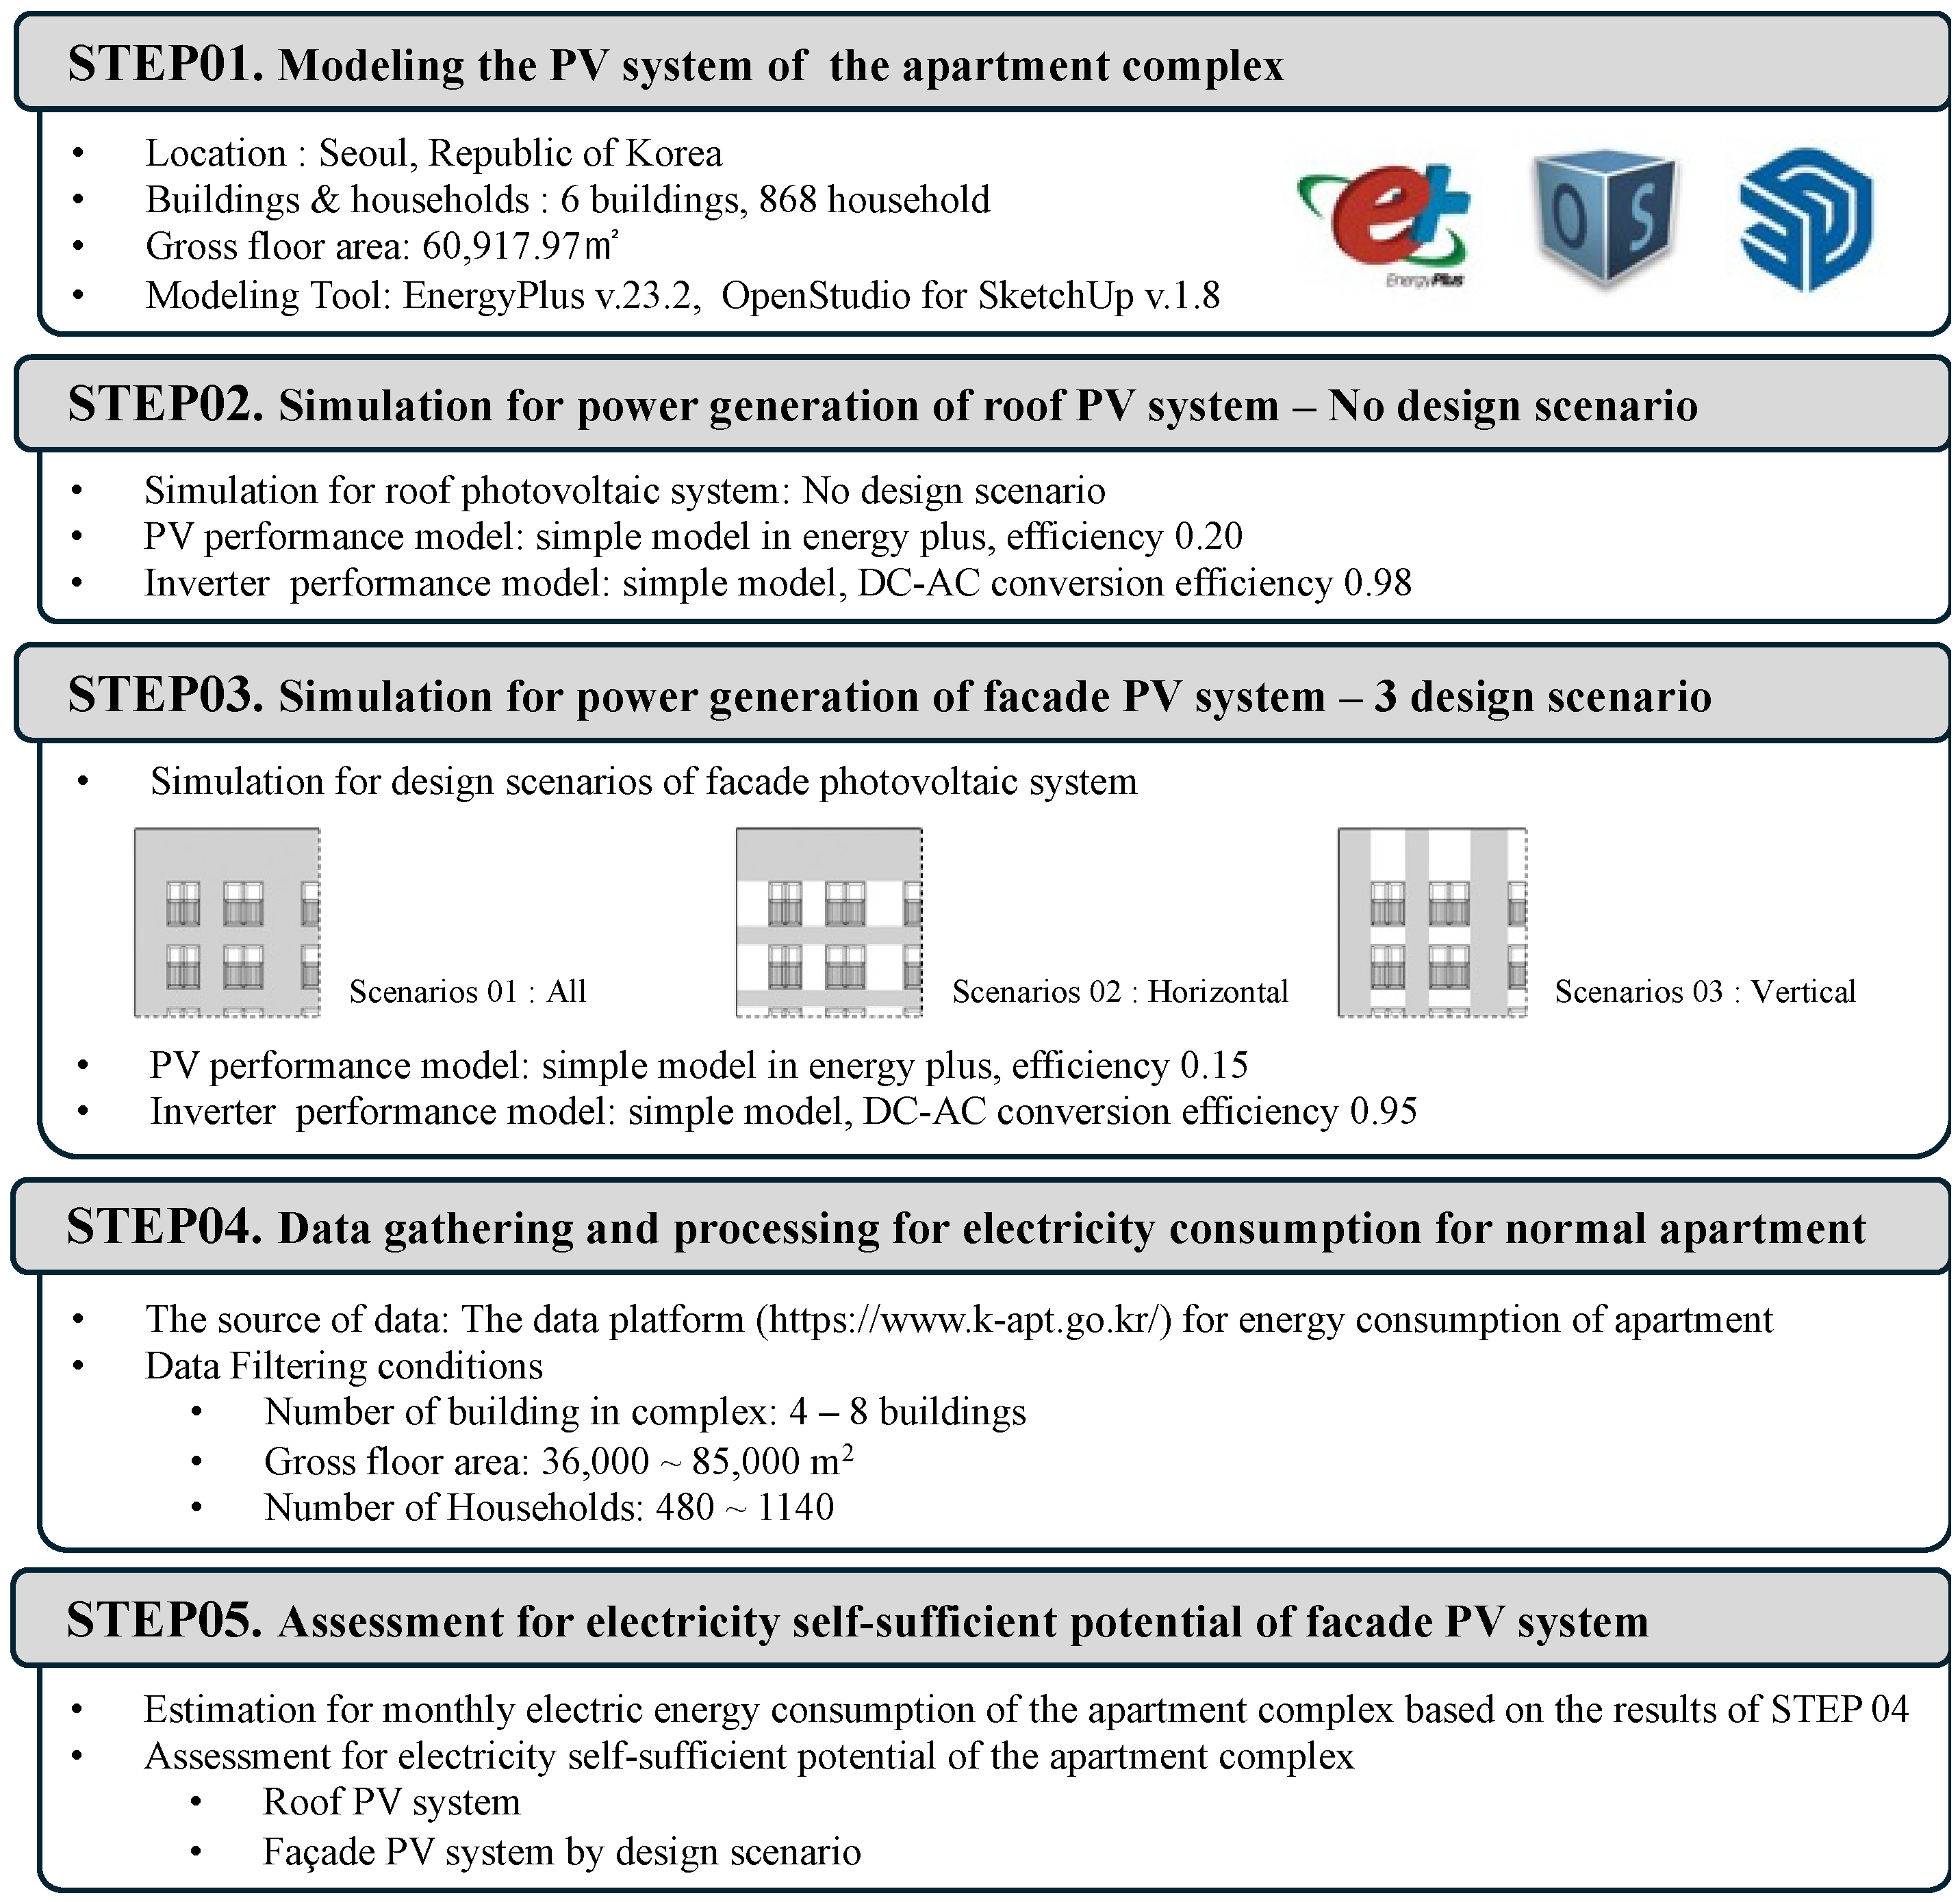
2. Research Methodology

This study evaluates the electricity self-sufficiency potential of FPV systems based on a specific design scenario. As depicted in Figure 1, the research process is divided into five distinct stages. In the first stage, the geometry of each building within the apartment complex is defined, and the orientation and spacing between buildings are modeled. The selected apartment complex consists of six buildings, and the layout and geometry of each building are incorporated into the analysis. The second stage involves modeling the rooftop-mounted PV(RFPV) system. In this study, the RFPV system is applied since RFPV systems typically generate more energy than FPV systems. In this RFPV system, the PV module efficiency and DC-AC conversion efficiency of an inverter are assumed to be 20% and 98%, respectively. The third stage focuses on modeling the FPV system under three design scenarios. The PV module efficiency is assumed to be 15%, and the DC-AC inverter conversion efficiency is set at 95%, reflecting the typical specifications and operational characteristics of FPV systems. In the fourth stage, electricity consumption data for general apartment complexes are gathered and processed. As the complex is still under construction and there are no real consumption data, its electricity consumption is estimated using public data. In the final stage, the energy contribution of the FPV system is evaluated under each design scenario by comparing the estimated electricity consumption of the apartment complex with the simulated energy production of the FPV systems. Detailed descriptions of each stage are provided in the following sections.

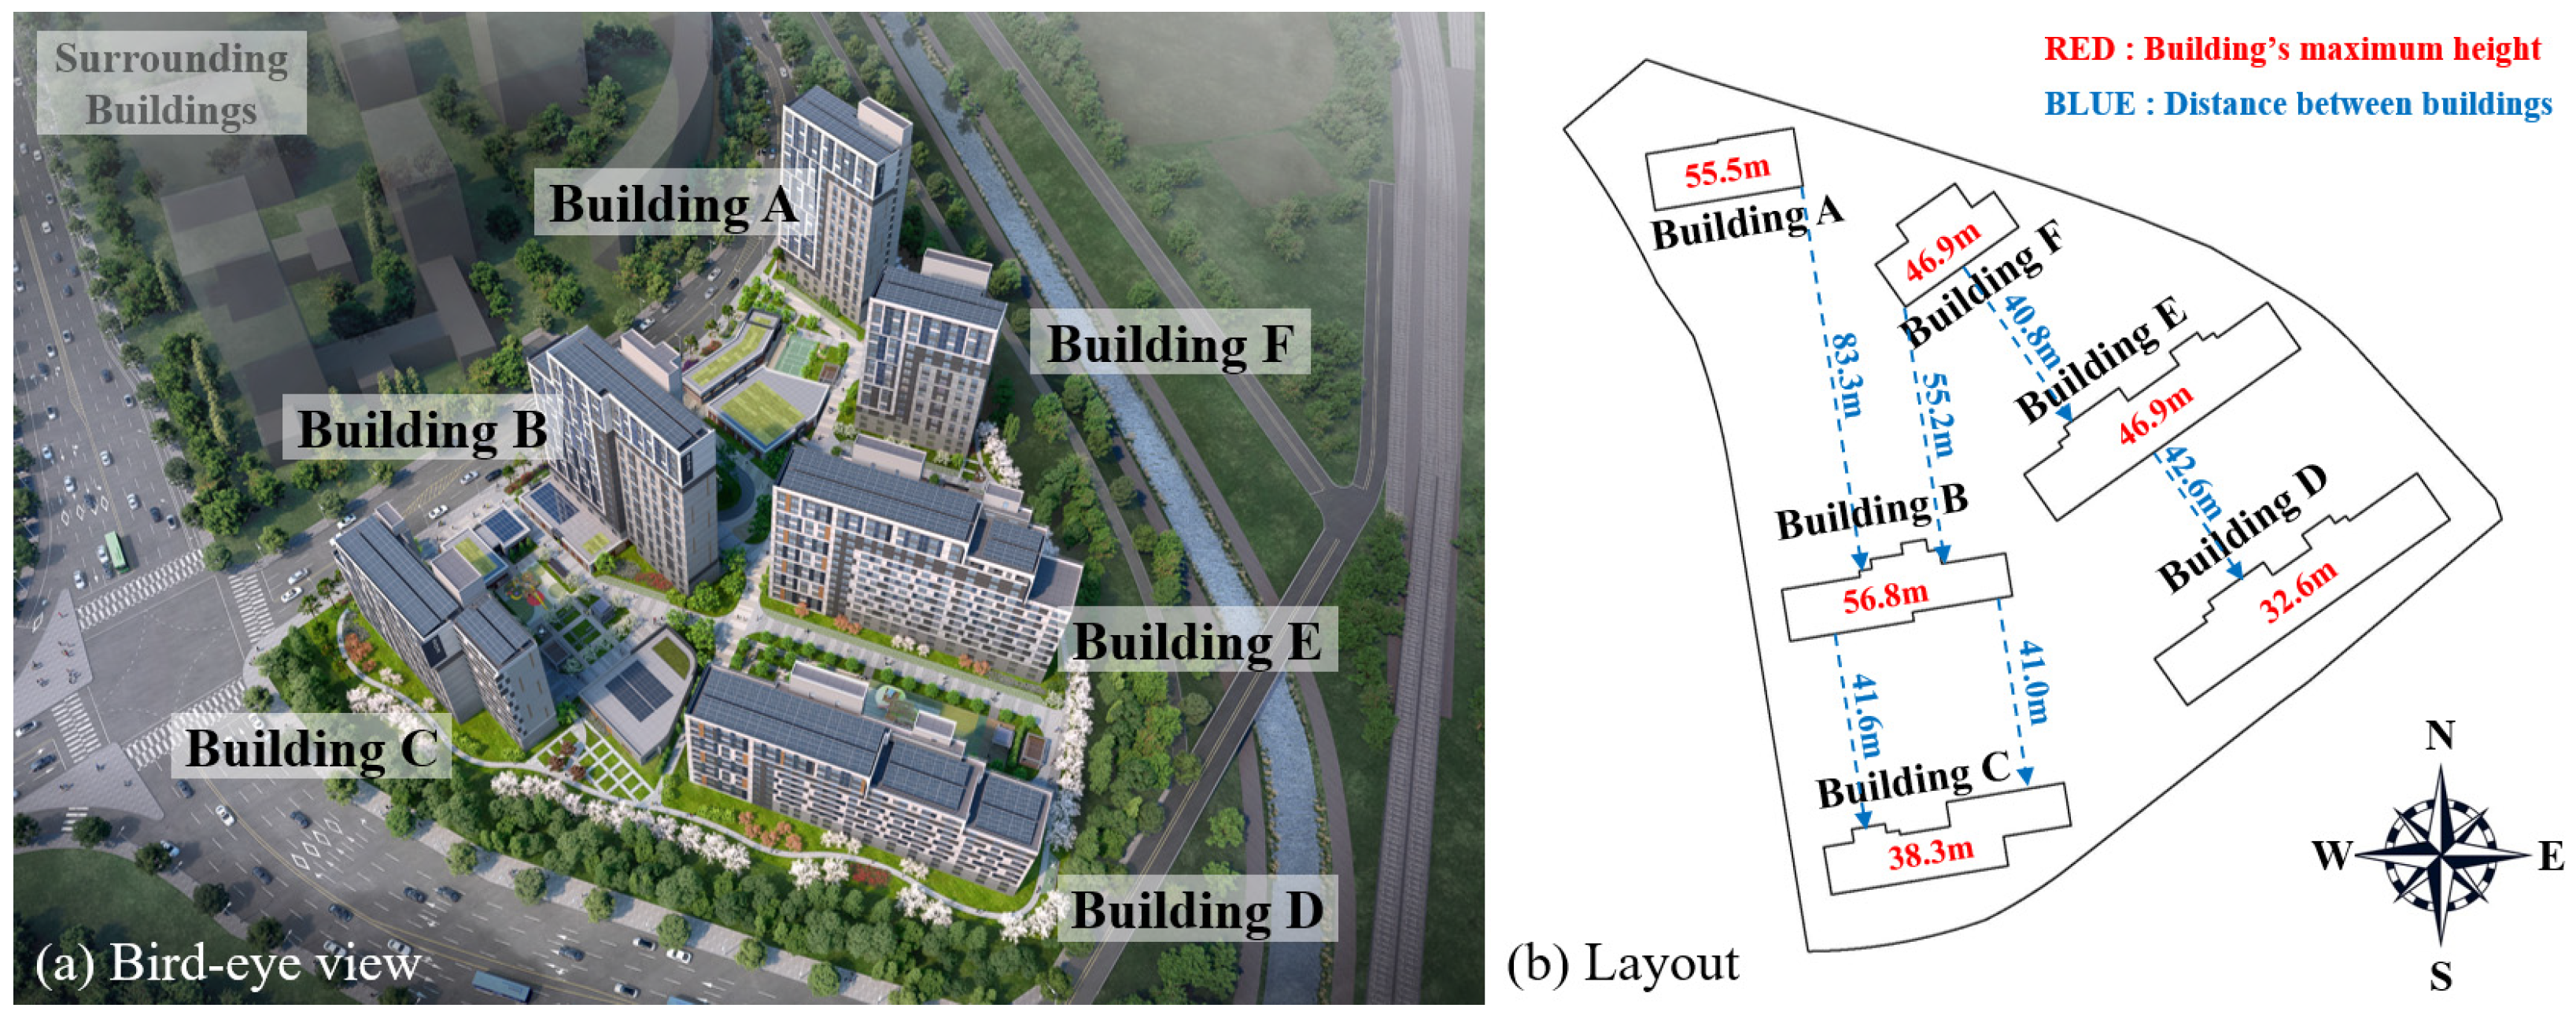
2.1. Overview of the Case Study Apartment Complex

The apartment complex examined in this study is currently under construction in Seoul, South Korea. It comprises six buildings with a total of 828 households. Each building primarily faces south, though they differ slightly in orientation. Figure 2 provides (a) a bird’s-eye view [31] and (b) the layout of each building within the complex, while Table 1 offers detailed information about each building. The design is strategic in ensuring that the front buildings are shorter than the rear buildings to minimize shading on the FPV systems installed on the facades. Additionally, as shown in Figure 2b, the distance between buildings is greater than the height of the front building, further minimizing shading effects.
Building envelopes include both walls and windows, with the windows playing a crucial role in shaping the indoor environment [32] by influencing daylighting [33] and contributing to occupants’ psychological well-being through views [34]. Additionally, the insulation performance of the building envelope is affected by the window-to-wall ratio (WWR) [35,36,37], which also determines the potential area for PV module installation. Thus, the WWR is a critical factor in both architectural design and the design of FPV systems.
The apartment complex analyzed in this study features windows installed solely on the southern and northern facades of each building. For this study, it is assumed that PV modules will only be installed on the southern facades. The WWR for the southern facade of each building is presented in Table 1. The average WWR for the apartment complex is approximately 28.6%. Building F has the lowest WWR at 26.5%, while Building C has the highest at 31.9%.
The energy-saving impact of PV systems installed on the facade of an apartment building is determined by the amount of power it generates. Assuming no internal issues, such as PV module failure or mismatch, power generation is primarily influenced by the solar radiation that reaches the PV array. In South Korea, apartment complexes usually consist of multiple buildings, which are normally taller than 10 stories. This configuration results in mutual shading between buildings, with the shading effect varying depending on their relative positions within the complex.
Figure 3 illustrates the hourly shading pattern on the southern facade of the apartment complex as of December 22. Unlike typical apartment complexes in South Korea, the spacing between buildings and their heights was specifically designed to minimize shading on the facades of buildings located behind them. However, except for Buildings C and D, which are positioned at the front, all four other buildings were found to be impacted by shading from the buildings in front. Notably, the lower floors of the shaded buildings were affected by shading for most of the day.
The seasonal and temporal changes in the sun’s position influence the amount of irradiance reaching each part of the facade. Figure 4 presents the results of the analysis of annual vertical irradiation at the center of the south facade for each floor of the buildings. Figure 4a displays the results for Buildings A, B, and C, which face south, while Figure 4b shows the results for Buildings D, E, and F, which are rotated slightly toward the east. Building C, located at the very front of the complex, is unaffected by shading from adjacent structures.
The annual vertical irradiation of the facade for each floor remains constant at 1000.4 kWh/m2·yr. For Buildings B and C, similar levels of annual vertical irradiation are observed on the upper floors as in Building A, with which they have the same orientation. However, below the third floor of Building B and below the eighth floor of Building C, the annual vertical irradiation drops to less than 90% of that observed for Building A. Building D exhibited differences in annual vertical irradiation by floor, even though there are no adjacent buildings in front. This was caused by shading from Building A during sunset. Buildings E and F had larger decreases in annual vertical irradiation compared to other buildings. On the first floor of Building F, which is furthest back, the annual vertical irradiation was 629.96 kWh/m2, about 34.8% lower than that of Building D’s first floor. Although the top floor of Building F had no direct shading, it had a lower annual vertical irradiation than the top floors of other buildings, due to diffused solar radiation being blocked by nearby buildings.

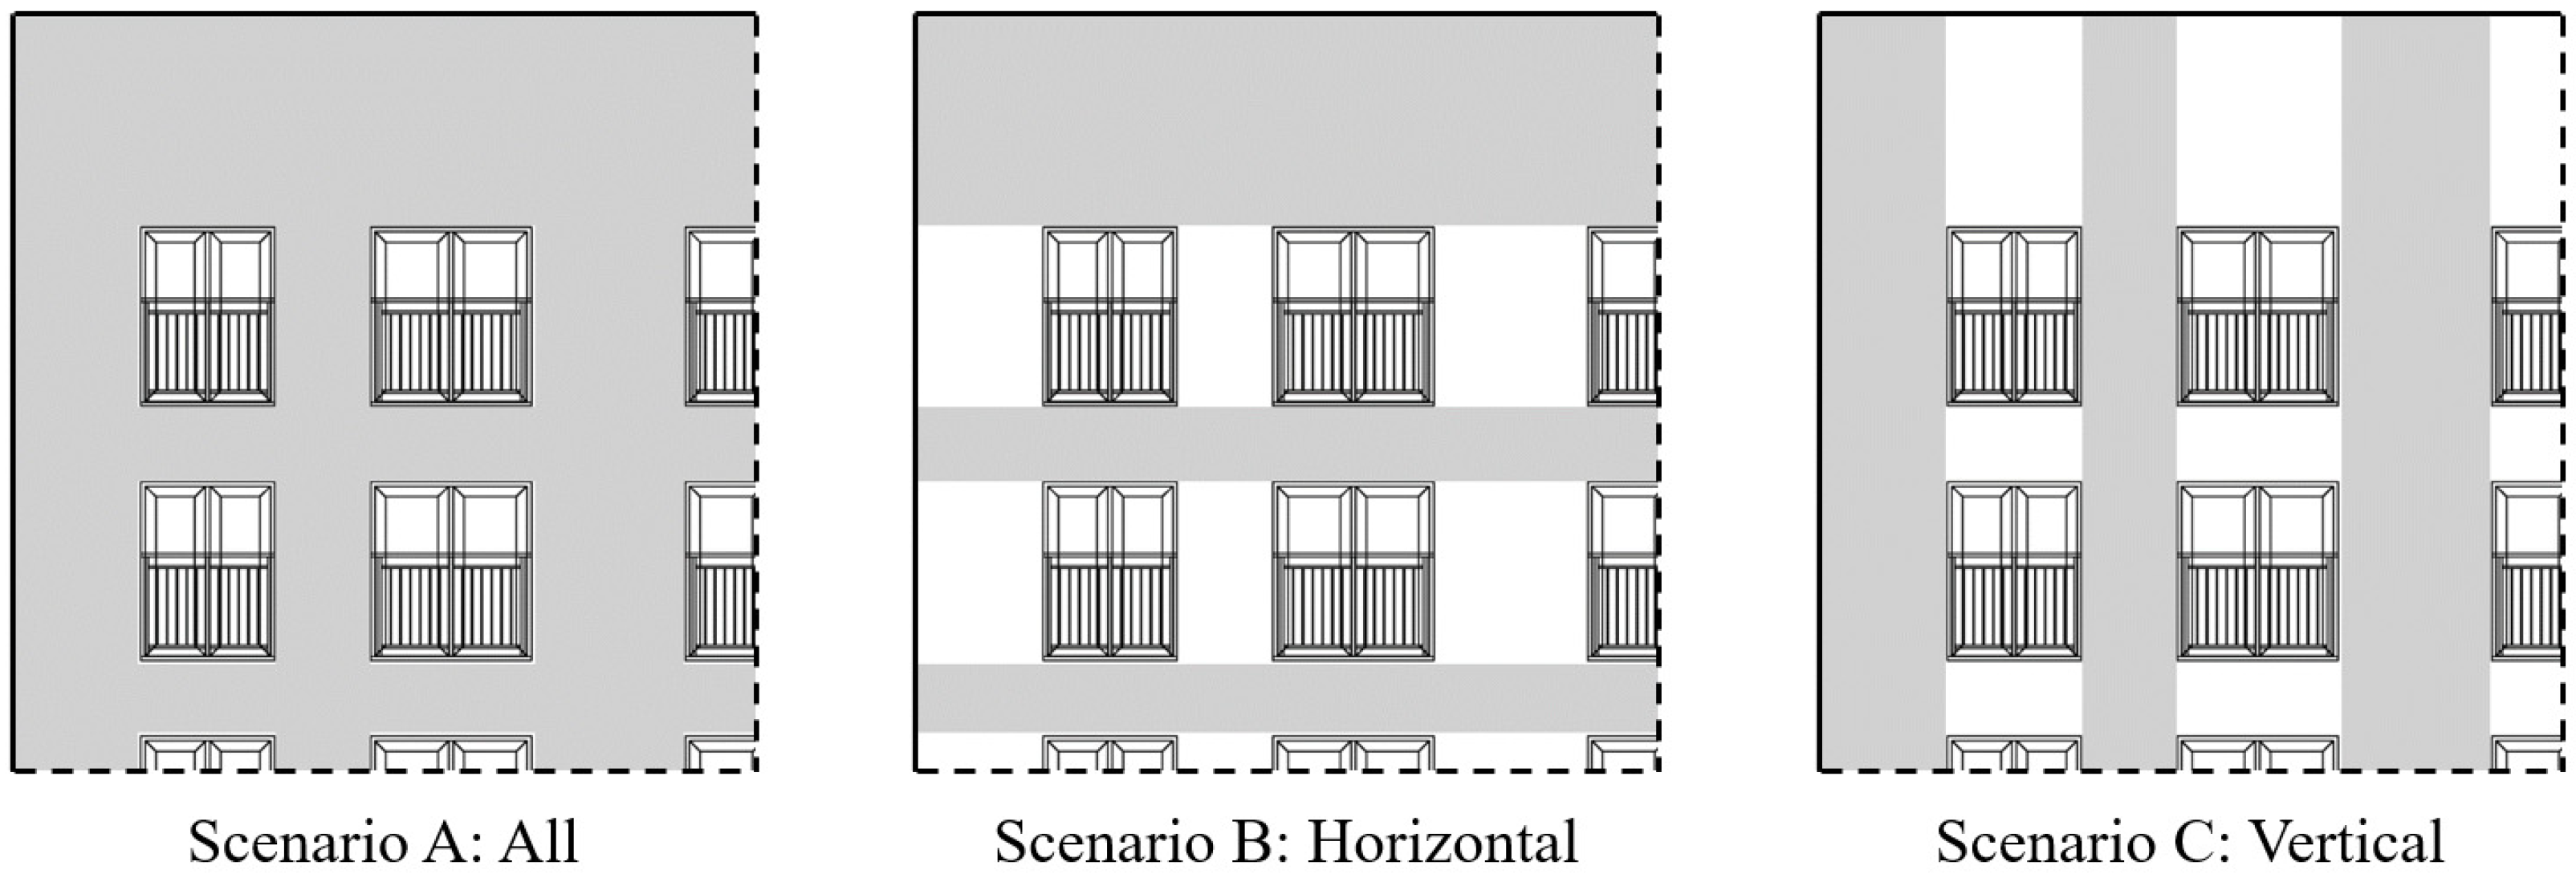
2.2. Overview of PV Systems in the Case Study Apartment Complex

To optimize energy generation from PV systems, rooftop installations should be prioritized over facade applications, as they typically offer greater surface area and sunlight exposure. In this section, the parameters and characteristics of the RFPV systems in the apartment buildings are first defined before introducing application scenarios for the FPV systems.
The RFPV systems are installed on the rooftops of all apartment buildings, with the orientation of each system aligned to match that of the respective building. The inclination angle of the RFPV systems is uniformly set at 30°, regardless of building orientation. This angle was chosen based on prior research [38], which indicates there is no significant variation in power generation performance within a 30° deviation east or west from south. The PV arrays on each building are arranged in multiple rows, ensuring that there is no shading between rows at noon on December 22.
Table 2 provides information on the area and capacity of the RFPV systems installed on each building. The installation capacity of the RFPV system for each building was calculated using Equation (1).
P o = G S T C × A s u r f × η P V
Here, P o represents the installation capacity (Wp), G S T C refers to the irradiance under standard test conditions (1000 W/m2), A s u r f is the installation area (m2), and η P V is the PV module efficiency. In this study, the PV module efficiency ( η P V ) was set at 20% based on the results of a study [39] that investigated the efficiency of commercial PV modules.
The integration of PV systems into building facades influences the building’s design, as the PV modules either replace traditional building materials or are affixed to the exterior. Conventional PV modules have limited design flexibility and offer little aesthetic variety for architects [40]. To address these limitations, advancements have been made in PV module design, including the incorporation of colors [41,42] and other visual enhancements [43,44]. These improved modules are now being increasingly applied to various buildings, offering greater architectural flexibility.
In addition to incorporating color in PV modules, the design of a building can further leverages PV modules as design elements by utilizing pattern formation and color arrangement on the exterior. Based on this concept, three basic design scenarios for the arrangement of PV modules are assumed for this study. In Figure 5, examples of each scenario are illustrated. In Scenario A, PV modules are applied across the entire exterior wall, excluding the windows. In Scenarios B and C, the PV modules are arranged horizontally and vertically in the spaces between windows on the exterior wall. By combining or partially applying these scenarios, various design possibilities can be created for the facades of apartment buildings.
Table 3 presents the installation area and capacity of the PV system for each design scenario. The installation capacity of the FPV system for each building was calculated re-using Equation (1) for the installation capacity of the RFPV system, except that the efficiency of the FPV module was assumed to be 15% based on a previous study [45]. Building B, which has the largest south-facing facade area, exhibited the highest installation capacity for each scenario. The installation capacities were 258.65 kWp in Scenario A, 103.84 kWp in Scenarios B, and 211.17 kWp in Scenarios C. The total installation capacities of the FPV system for each scenario were 1167.82 kWp, 481.89 kWp, and 930.32 kWp, respectively. The installation capacity ratios of Scenarios B and C to Scenario A were found to be 41.3% and 79.7%, respectively.
The model used for simulating the performance analysis of both rooftop and FPV systems was based on the Simple Model of EnergyPlus [46], as shown in Equation (2).
P = A s u r f × f a c t i v × G T × η c e l l × η i n v e r t
In this model, P represents the electrical power produced by the photovoltaics (W), while G T , A s u r f , f a c t i v e , η P V , and η i n v e r t denote the total solar radiation incident on the PV array (W/m2), the net surface area (m2), the fraction of surface area with active solar cells, the module conversion efficiency, and the DC to AC conversion efficiency of inverter, respectively. This model was employed to analyze hourly power generation, with monthly and annual power generation evaluated through statistical processing. Among the input variables of the simulation model, the irradiance for the plane of array was estimated using weather data for Seoul, provided from the American Society of Heating and Air-Conditioning Engineers (ASHRAE) [47], and sky radiation models [48].

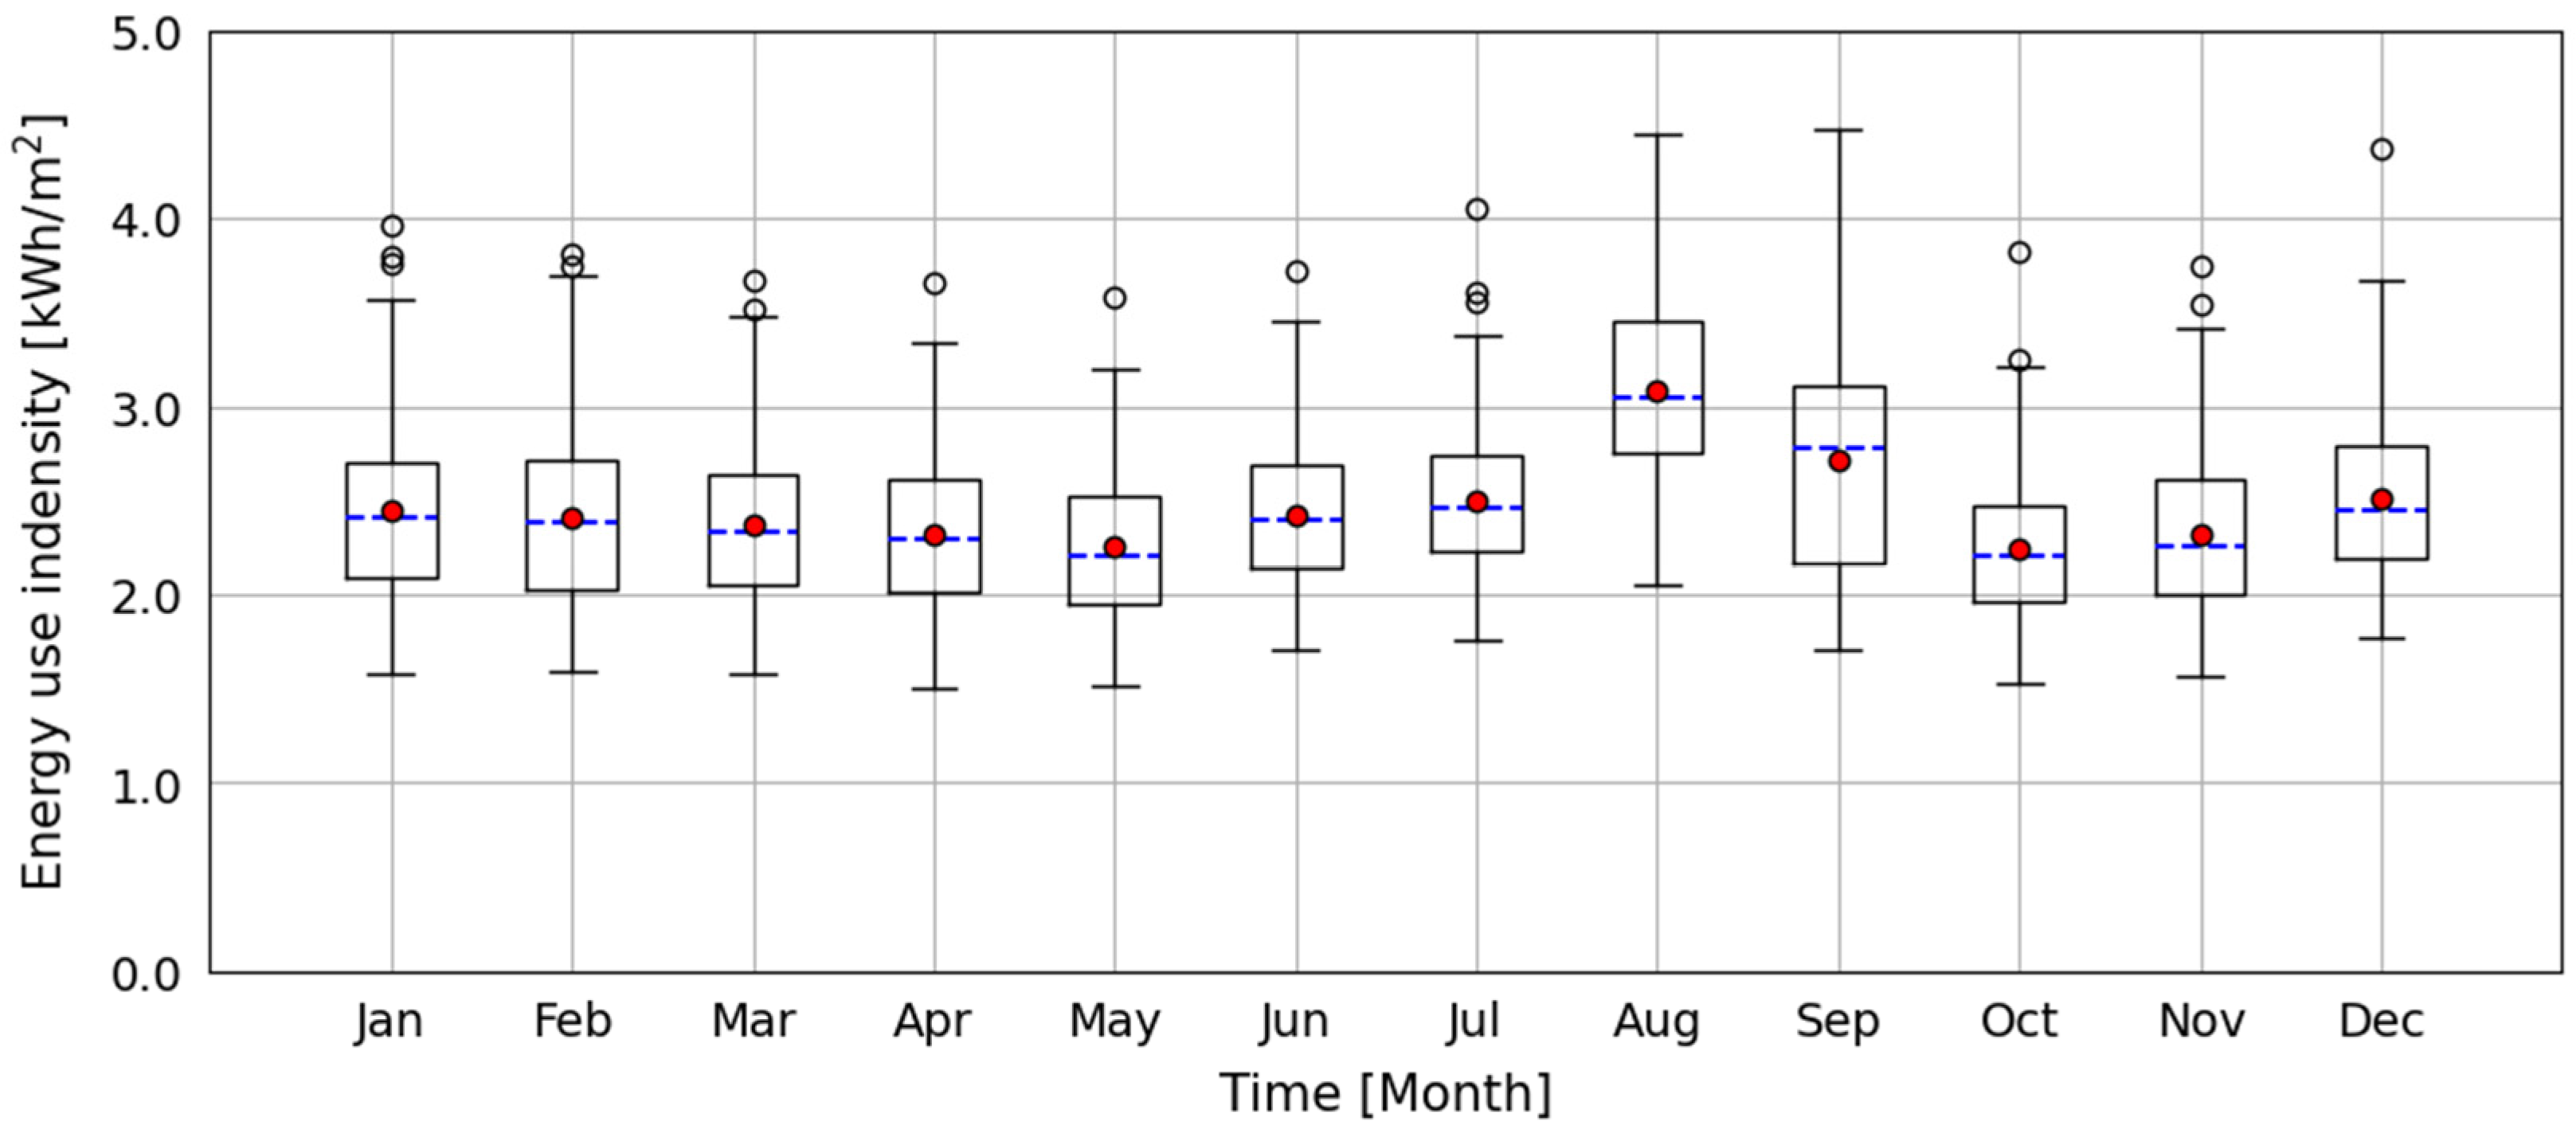
2.3. Electricity Consumption of the Apartment Complex in South Korea

For evaluating self-energy consumption, in terms of both building energy end-use and on-site power generation, real-world data from existing buildings are needed. However, since the apartment complex of this study is still under construction, actual end-use energy data are not yet available. To address this limitation, information from a public database is utilized to evaluate self-energy consumption in this study. The Korean Apartment Management Information System (K-APT) [49] offers valuable insights, including actual energy consumption and key details about apartment units.
Energy-related data for all relevant apartment buildings were sourced from the K-APT website. The data corresponds to information from 1928 apartment complexes in Seoul. Table 4 presents information on the database in a simplified format.
Self-consumption for the case study apartment complex was evaluated using data for the month’s electric energy consumption from the -K-APT. A reasonable estimate of electric energy consumption was obtained through a process of filtering and analysis. In this study, to ensure the assessment was reasonable under conditions where actual electricity consumption data are unavailable, apartment complexes of comparable size to the case apartment complex were selected, and their electric energy consumption was analyzed. Table 5 shows the filtering conditions for reasonable EUI extraction.
Actual electricity consumption data from 158 apartment complexes were extracted and analyzed using the box plot method. Box plots visually represent data by displaying the median, quartiles, and outliers, making them a valuable tool for identifying key data trends, as demonstrated in previous scientific research.
Figure 6 shows the daily EUI for each month based on the electricity consumption of the filtered suitable apartment complexes based on the box plot graph. The blue dashed line represents the median, while the red marker indicates the mean. The highest monthly EUI is in August, ranging from 2.05 kWh/m2 to 4.45 kWh/m2. The lowest monthly EUI is in May, from 1.51 kWh/m2 to 3.66 kWh/m2. To calculate and compare the self-consumption of different PV design scenarios, the monthly EUI data were extracted for apartment complexes with parameters similar to those of the case study apartment complex. From these data, it is possible to assess the potential of the FPV systems.
Table 6 presents the estimated monthly electricity consumption of the apartment complexes, calculated using the monthly average EUI from Figure 6 and the total floor area of the complexes (60,918 m2), as shown in Table 5. This information served as the basis for evaluating the self-sufficiency potential of the FPV systems.

3. Results

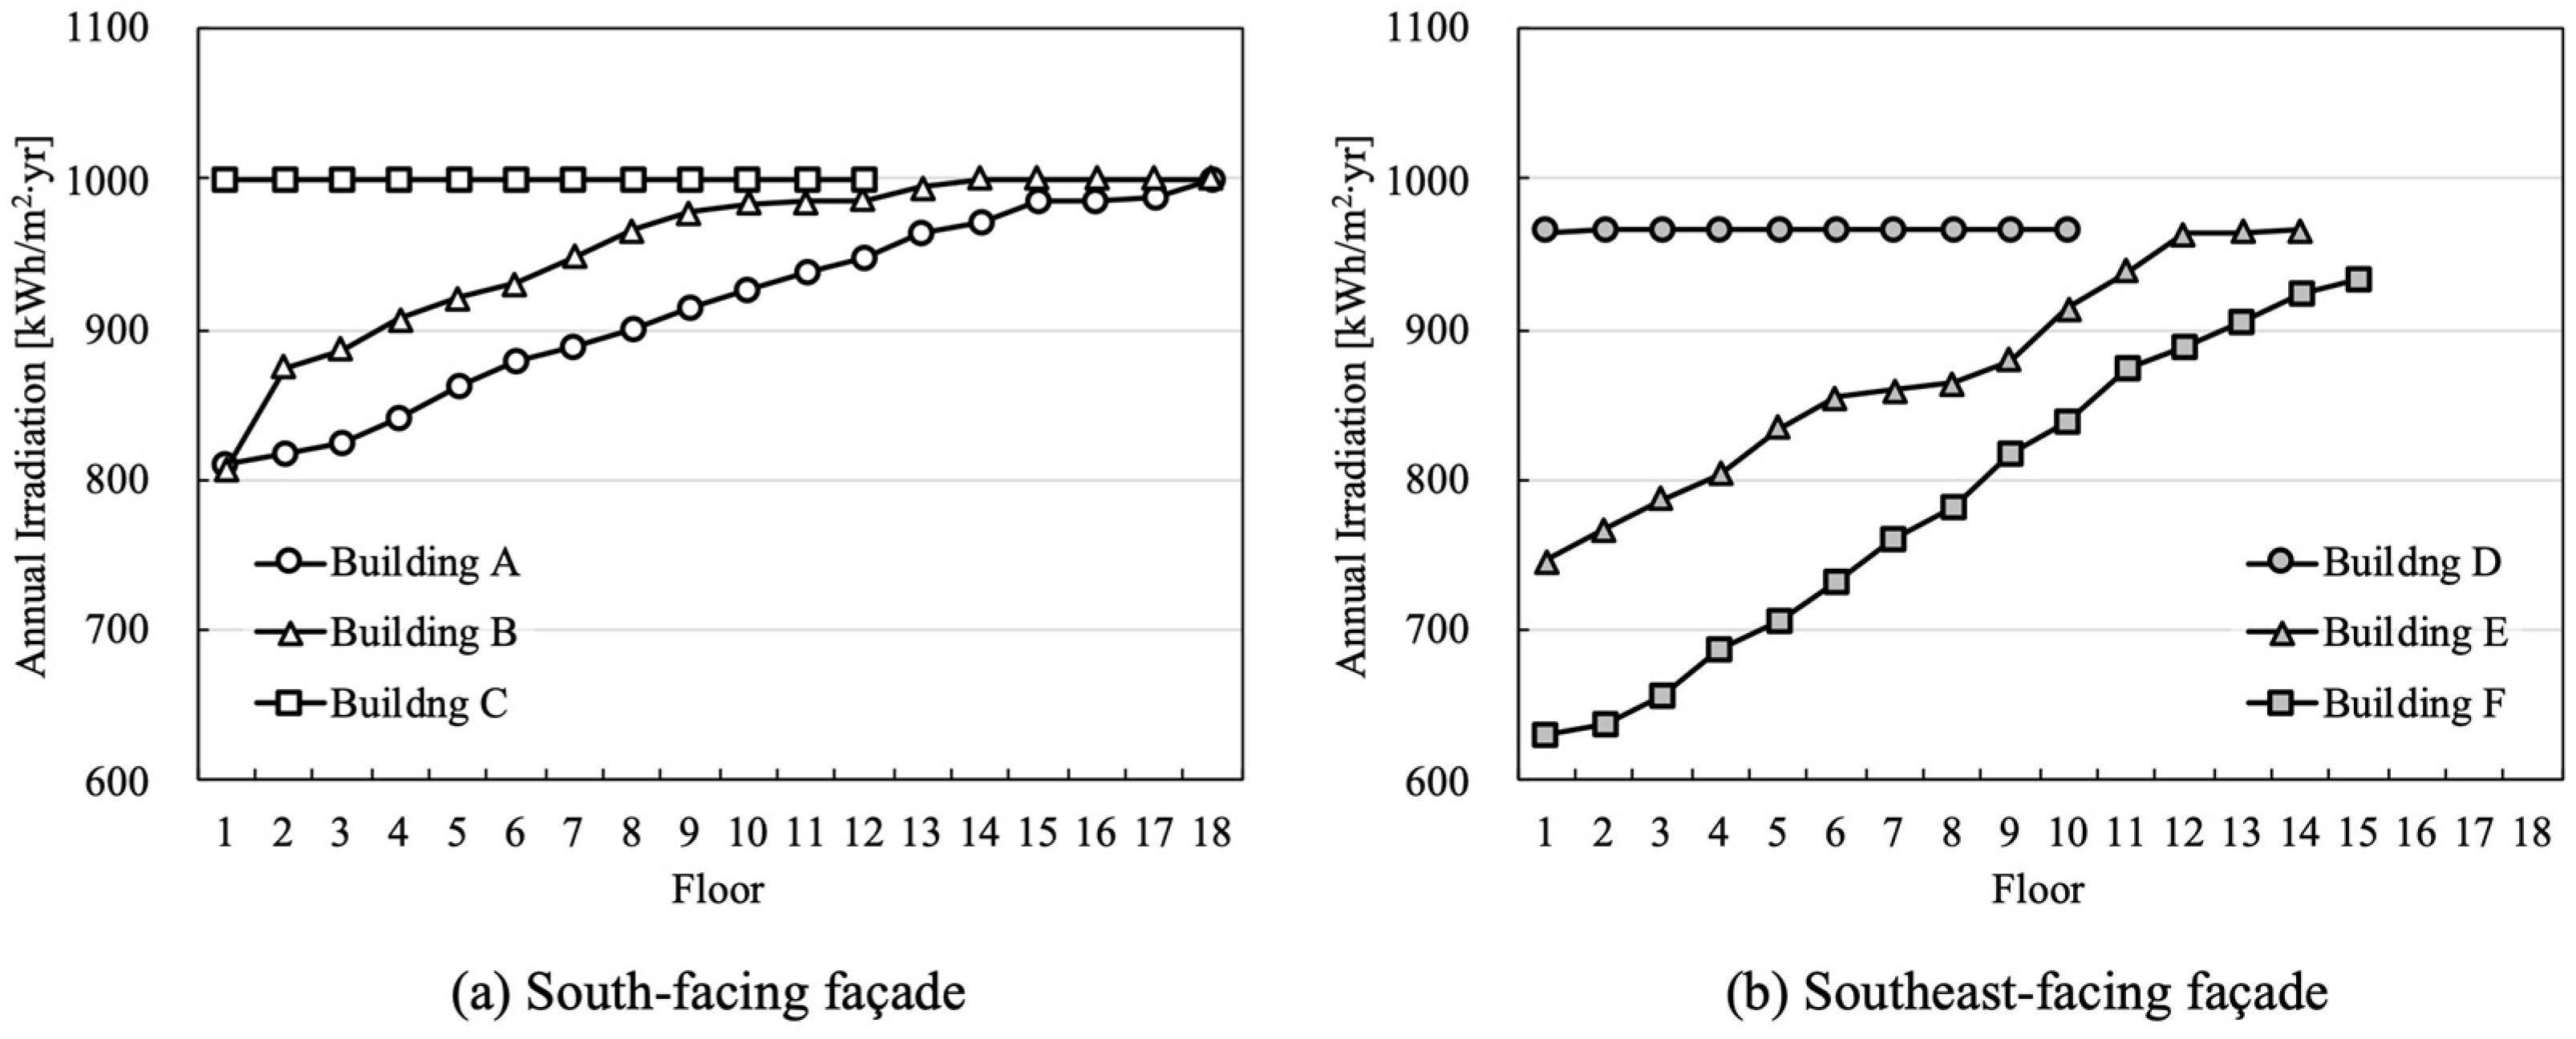
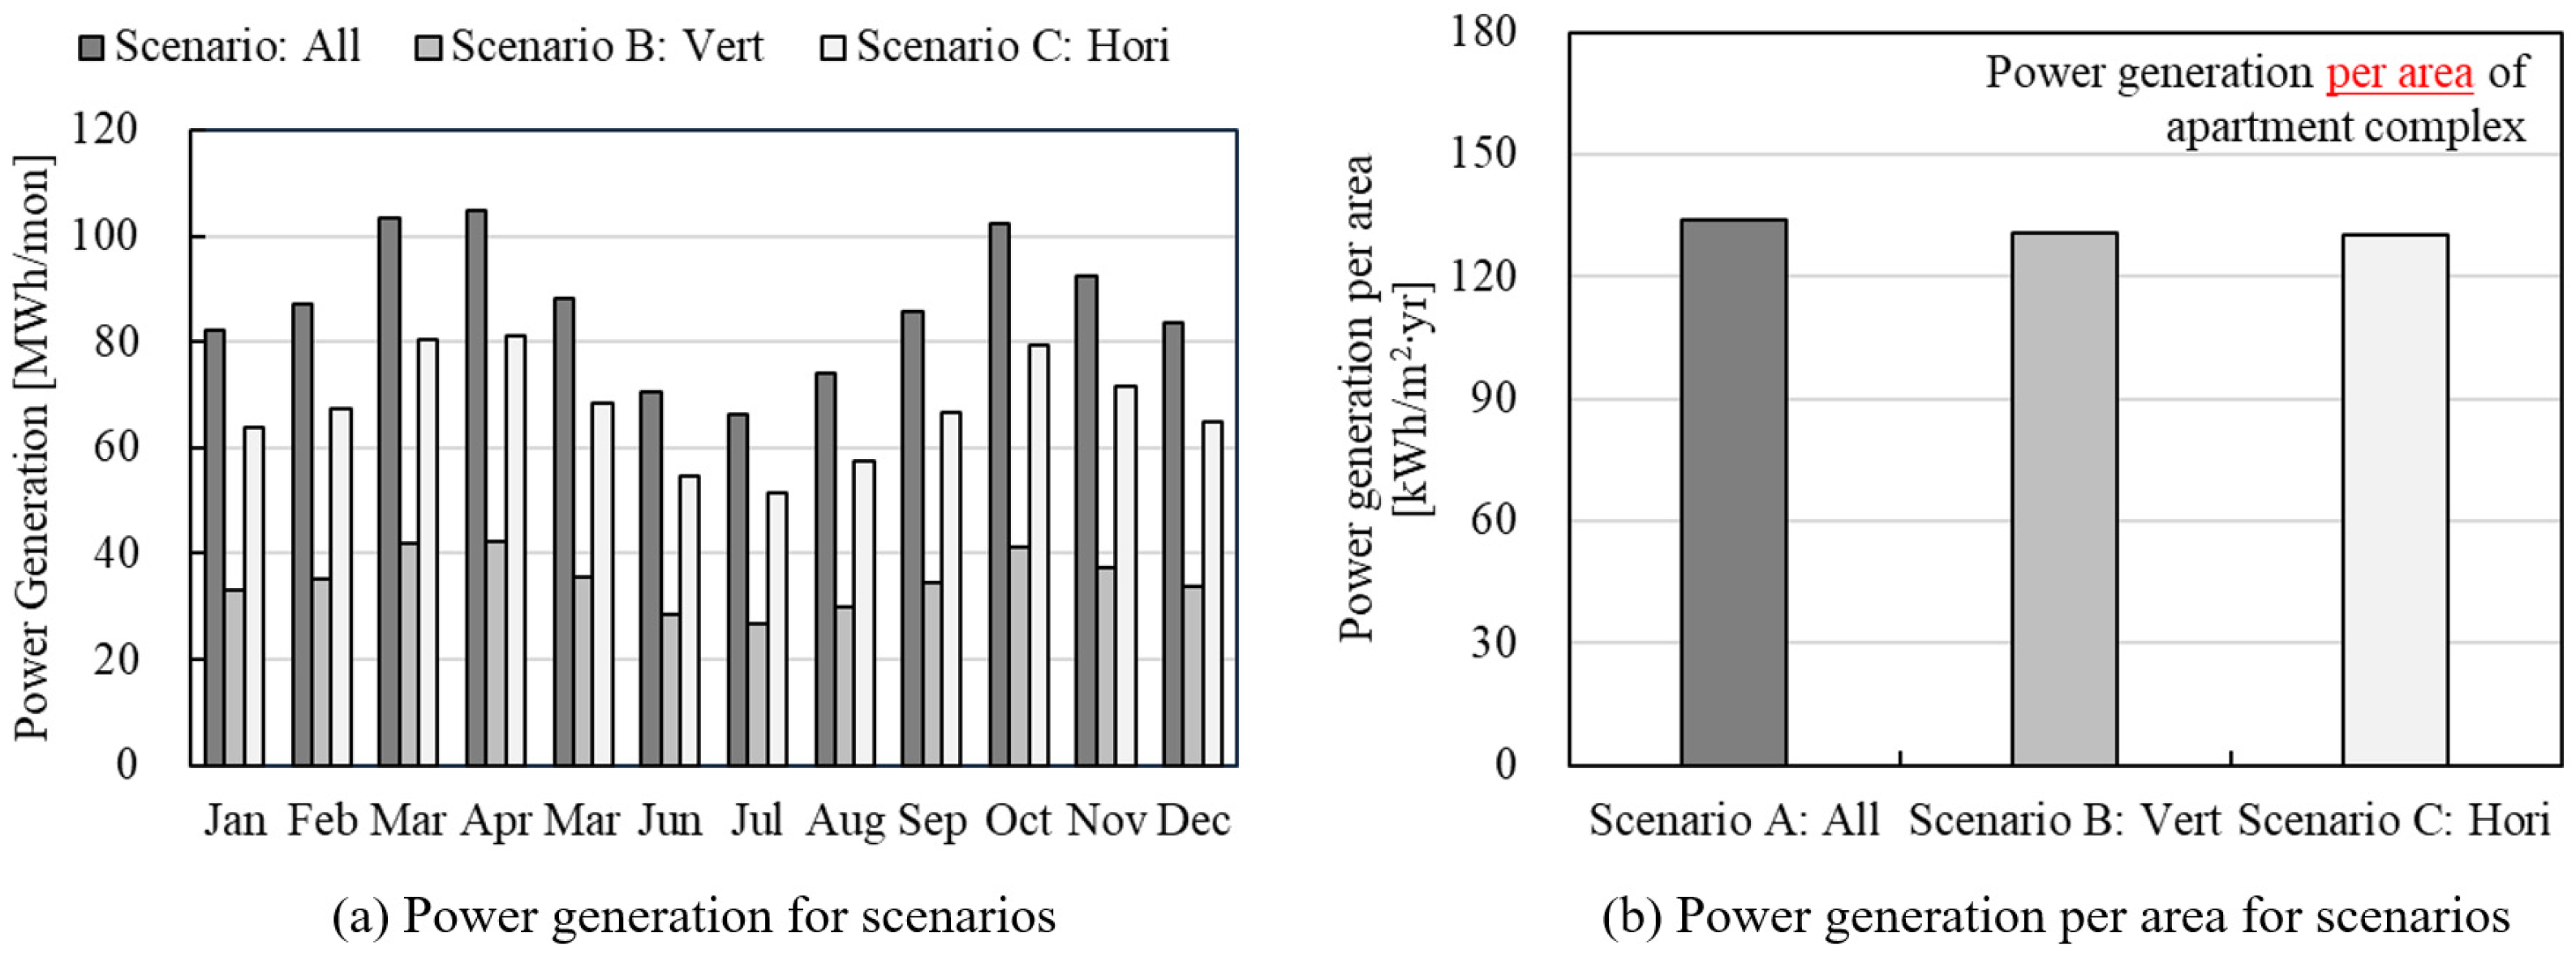
3.1. Power Performance of the FPV Systems

Figure 7 illustrates the monthly and annual power generation for each FPV system scenario. As shown in Figure 7a, power generation was highest in April and lowest in July across all scenarios. Compared to Scenario A, the monthly power generation for Scenario B ranged from 40.2% in February to 40.4% between March and September. For Scenario C, the monthly power generation ranged from 77.4% in the winter months (January, February, November, and December) to 77.6% between May and August.
The analysis shows that the power generation for Scenario A closely matches the installation capacity ratios, with Scenario B at 41.3% and Scenario C at 79.7%. However, the difference between the installation capacity and power generation ratios was 0.9% for Scenario B, while Scenario C showed a slightly larger difference of 2.3%, which is 1.4% higher. This greater discrepancy in Scenario C is due to a larger proportion of shaded areas relative to the total installation area.
From the analysis, the annual power generation for each scenario was determined as 1040.8 MWh/yr for Scenario A, 419.8 MWh/yr for Scenario B, and 806.1 MWh/yr for Scenario C. Figure 7b presents the results of annual power generation per installation area. Scenario A had the highest value at 133.7 kWh/m2·yr, followed by 130.7 kWh/m2·yr for Scenario B and 130.1 kWh/m2·yr for Scenario C. This outcome is attributed to the higher proportion of installation area in less shaded regions in Scenario A compared to the other scenarios.

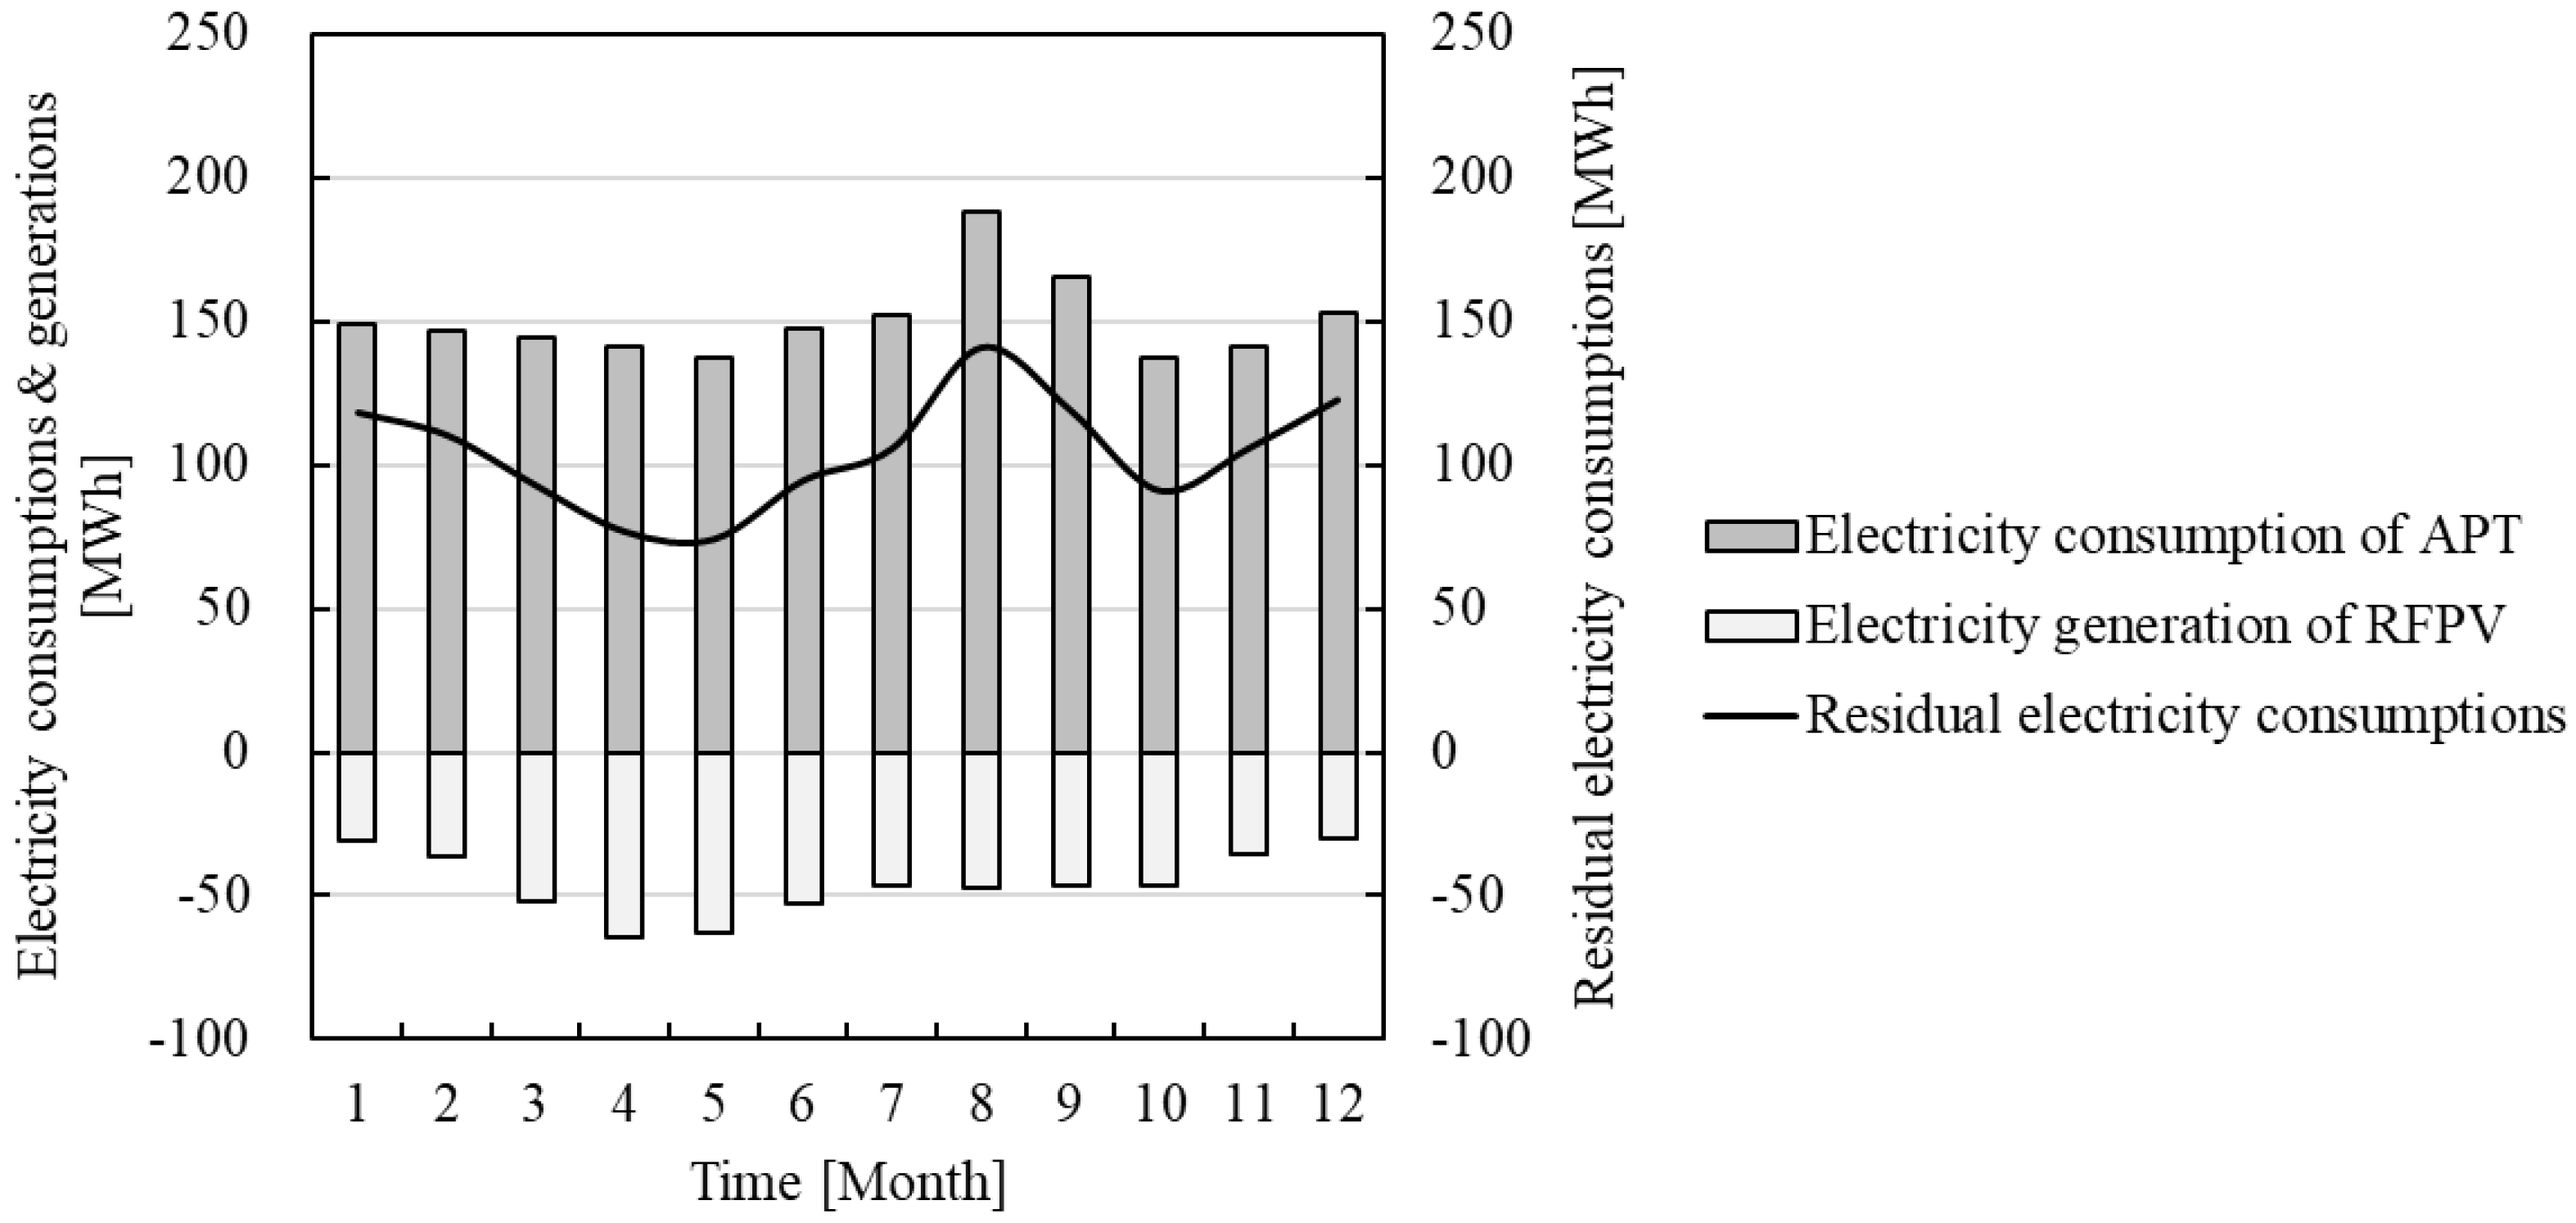
3.2. Electricity Self-Sufficiency Potential of the FPV Systems

In this section, the electricity consumption of the apartment complex, the electricity production from RFPV systems, and the contribution ratio of RFPV systems in meeting the complex’s electricity needs are evaluated. Figure 8 illustrates the monthly electricity consumption, the electricity produced by RFPV systems, and the residual electricity consumption (REC), which was calculated by subtracting the production from the consumption.
The electricity consumption of the apartment complex peaked in August at 188.2 MWh and was lowest in May at 137.1 MWh. Consumption was highest during the summer, decreased during the mid-season, and rose again in winter. This pattern reflects the increased use of heating or cooling systems during the summer and winter months. The RFPV system’s power generation was highest during the mid-seasons, reaching 64.9 MWh in April and 63.2 MWh in May, and exhibited a decreasing trend during the winter.
Table 7 presents the results of the analysis of the contribution ratio of RFPV systems and the REC for the apartment complex. The highest contribution ratio was observed in May, at 46.1%, when electricity consumption was low, and production was high. In contrast, December had the lowest contribution ratio, at 19.9%, due to minimal PV production. REC was highest in August, reaching 140.9 MWh, and lowest in May, at 73.9 MWh. The REC in Table 7 was used as a baseline for assessing the contribution ratio for the FPV system and final residual electricity consumption (FREC).
Figure 9 shows results of the FREC analyzed using the residual consumption and the FPV system generation. In this figure, negative values of FREC indicate that the FPV system production exceeds the REC. In other words, there is surplus power in that month, which is emphasized by green dots.
The monthly FREC was consistently lower in Scenario A, which exhibited the highest power generation, than in the other scenarios. The peak FREC for Scenario A occurred in August at 66.9 MWh, while the lowest was in April, when production exceeded consumption, resulting in a surplus of 28.2 MWh. Additionally, Scenario A generated surplus electricity in March, May, and October. Scenario C also produced surplus electricity in April, though this surplus was significantly smaller, amounting to just 17.4% of that in Scenario A. For Scenario B, which had the lowest installed capacity, a FREC of 111.0 MWh was recorded in August, 1.66 times higher than that of Scenario A.
The annual FREC was found to be 209.2 MWh for Scenario A, 830.1 MWh for Scenario B, and 443.0 MWh for Scenario C. Compared to Scenario A, the FREC is 3.97 times higher for Scenario B, 2.12 times higher for Scenario C.
The contribution ratio was calculated based on the annual REC and the annual power generation for each scenario. For Scenario A, a contribution ratio of 83.3% was found, indicating that while it approaches near self-sufficiency in electricity, additional energy production is required to achieve full self-sufficiency. In contrast, the contribution ratio was 33.6% for Scenario B and 64.6% for Scenario C. These results suggest that to attain full electricity self-sufficiency in both Scenarios B and C, more extensive implementation of additional PV systems or other renewable energy technologies is required.

4. Conclusions and Discussion

This study aimed to assess the potential of FPV systems in contributing to electricity generation within a high-rise apartment complex, which is a typical residential building type in South Korea. To conduct this evaluation, a specific apartment complex in South Korea was selected, and its building geometry and layout were used as the basis for analysis. Three design scenarios for FPV systems were proposed and assessed regarding their potential impact on the ability of the apartment complex to achieve electricity self-sufficiency.
To evaluate the potential of the FPV systems, data on the apartment complex’s electricity consumption are crucial. However, as the apartment complex in this study was still under construction, the measured energy consumption data were not yet available. Consequently, the electricity consumption was estimated using public data sources, resulting in a projected annual electricity consumption of 1803.7 MWh/yr.
To maximize power generation from a PV system, high irradiance is essential. The optimal installation conditions for high irradiance on PV modules include utilizing both a south-facing orientation and a 30° tilt angle. Consequently, in buildings, PV systems are typically installed on rooftops or roofs rather than facades, which is also the case for apartment complexes in South Korea. For this reason, the installation and performance of the RFPV system were assumed and analyzed. The design also included the installation of an RFPV system on the rooftop of each building, with the total system capacity for the apartment complex estimated at 410.76 kWp. The annual power generation from the RFPV system was evaluated to be 553.8 MWh/yr. Accordingly, the contribution of the FPV systems to the apartment complex was evaluated based on the remaining electricity consumption of 1249.9 MWh/yr. This value is the electricity consumption of the apartment complex after subtracting the electricity generated by the RFPV system (553.8 MWh/yr) from the original electricity consumption (1803.7 MWh/yr).
Three design scenarios for FPV systems on the southern exterior wall were proposed: full facade coverage, vertical-only installation, and horizontal-only installation. Respective installation capacities of 1167.82 kWp, 481.86 kWp, and 930.32 kWp were found, with corresponding annual power generation values of 1040.8 MWh/yr, 419.8 MWh/yr, and 806.9 MWh/yr. Based on the remaining electricity demand of 1249.9 MWh/yr, the self-sufficiency ratios for each scenario were determined as 83.3%, 33.6%, and 64.6%, respectively. Even with PV systems installed on both the roof and the southern facade, complete electricity self-sufficiency was not achievable. This indicates that additional PV installations, including on the east and west facades where irradiance is lower, would be necessary to achieve full self-sufficiency.
This study provides a foundational evaluation of the electricity self-sufficiency potential of high-rise apartment complexes equipped with FPV systems. In this study, the capacity of the FPV system was defined in a simplified manner, considering only the exterior wall area for each scenario and the efficiency of the PV modules. However, in practice, the size, capacity, and efficiency of PV modules are influenced by factors such as solar cell type (one-cell, half-cut, or shingled) as well as the dimensions of the exterior wall. The overall capacity of the FPV systems is thus determined by the configuration of these PV modules. Therefore, when considering the specific installation area and the method of solar cell application, the real-world capacity of the FPV systems may differ from the various found in this study. These variations could impact the electricity self-sufficiency potential. To address this, future research will focus on evaluating the self-sufficiency of apartment complexes based on a detailed analysis of facade designs and the integration of tailored PV module configurations.
A mandate for zero-energy buildings in public apartment complexes with more than 30 households was implemented in 2023. Currently, a building can be certified as zero-energy if it produces at least 20% of the energy required for heating, cooling, hot water, lighting, and ventilation, excluding energy for cooking and electrical appliances. However, the required energy production for a public apartment complex will gradually increase, with a target set for 100% by 2050. Basic research, like this study, on the application of renewable energy technologies in high-rise apartment complexes is expected to support South Korea’s zero-energy policies and contribute to achieving practical results in the future.
Additionally, this study focused on high-rise apartment complexes, a common feature of South Korean urban landscapes, but similar features are found in large cities worldwide. In densely populated urban areas, high-rise buildings are closely arranged and typically have a high energy consumption. Although this research specifically investigates the potential of FPV systems in South Korean high-rise apartment complexes, the findings are expected to be applicable to high-rise buildings in major cities globally, where conditions are similar.

Author Contributions

Conceptualization, D.K. and J.Y.; Methodology, H.L. and T.N.T.; Software, H.L. and T.N.T.; Formal analysis, H.L., T.N.T., R.L. and H.C.; Investigation, H.L., T.N.T. and H.C.; Data curation, H.L. and R.L.; Writing—original draft, H.L. and T.N.T.; Writing—review & editing, H.L., D.K. and J.Y.; Visualization, H.L., T.N.T. and R.L.; Supervision, D.K. and J.Y.; Project administration, D.K. and J.Y.; Funding acquisition, J.Y. All authors have read and agreed to the published version of the manuscript.

Funding

This work was supported by the Korea Institute of Energy Technology Evaluation and Planning (KETEP) and the Ministry of Trade, Industry & Energy (MOTIE) of the Republic of Korea (No.20223B10100020, RS-2023-00266248 (Expert training program for Building Integrated Photovoltaics ecosystem)).

Data Availability Statement

The original contributions presented in the study are included in the article, further inquiries can be directed to the corresponding author.

Conflicts of Interest

The authors declare no conflict of interest.

References

  1. UN Environment Programme. 2022 Global Status Report for Buildings and Construction. Available online: https://wedocs.unep.org/bitstream/handle/20.500.11822/41133/Building_Construction_2022.pdf?sequence=3&isAllowed=y (accessed on 7 March 2023).
  2. International Energy Agency. International Energy Outlook 2019 with Projections to 2050. Available online: https://www.eia.gov/outlooks/ieo/pdf/ieo2019.pdf (accessed on 7 March 2023).
  3. Chung, M.; Park, H.-C. Building Energy Demand Patterns for Department Stores in Korea. Appl. Energy 2012, 90, 241–249. [Google Scholar] [CrossRef]
  4. Pedrabissi, D. Modern Housing Complexes in South Korea. An Educational Analysis to Evaluate the Typological Evolution and Urban Adaptations. J. Pract. Eng. Educ. 2017, 9, 85–90. [Google Scholar] [CrossRef]
  5. Korea Energy Agency. Energy Usage Statistics for 2022. Available online: https://www.energy.or.kr/front/board/View9.do?boardMngNo=9&boardNo=24154 (accessed on 20 November 2024).
  6. Woo, Y.-E.; Cho, G.-H. Impact of the Surrounding Built Environment on Energy Consumption in Mixed-Use Building. Sustainability 2018, 10, 832. [Google Scholar] [CrossRef]
  7. Choi, I.Y.; Cho, S.H.; Kim, J.T. Energy Consumption Characteristics of High-Rise Apartment Buildings According to Building Shape and Mixed-Use Development. Energy Build. 2012, 46, 123–131. [Google Scholar] [CrossRef]
  8. Li, C.; Song, Y.; Kaza, N. Urban Form and Household Electricity Consumption: A Multilevel Study. Energy Build. 2018, 158, 181–193. [Google Scholar] [CrossRef]
  9. Nord, N. Building Energy Efficiency in Cold Climates. In Encyclopedia of Sustainable Technologies; Elsevier: Amsterdam, The Netherlands, 2017; pp. 149–157. [Google Scholar] [CrossRef]
  10. Santamouris, M.; Cartalis, C.; Synnefa, A.; Kolokotsa, D. On the Impact of Urban Heat Island and Global Warming on the Power Demand and Electricity Consumption of Buildings—A Review. Energy Build. 2015, 98, 119–124. [Google Scholar] [CrossRef]
  11. Lee, J.; Kim, J.; Song, D.; Kim, J.; Jang, C. Impact of External Insulation and Internal Thermal Density upon Energy Consumption of Buildings in a Temperate Climate with Four Distinct Seasons. Renew. Sustain. Energy Rev. 2017, 75, 1081–1088. [Google Scholar] [CrossRef]
  12. Kim, Y.; Yu, K.H. Study on Policy Marking of Passive Level Insulation Standards for Non-Residential Buildings in South Korea. Sustainability 2018, 10, 2554. [Google Scholar] [CrossRef]
  13. Jeong, Y.S.; Kim, D.W. Analysis of the Necessity of Revising the Building Energy Efficiency Certificate for Non-Residential Buildings in South Korea. J. Build. Eng. 2024, 94, 109811. [Google Scholar] [CrossRef]
  14. Park, B.R.; Chung, M.H. Analysis of the Additional Energy-Saving Potential of Residential Buildings after Mandatory Zero-Energy Buildings to Achieve Carbon Neutrality in South Korea. Build. Environ. 2023, 228, 109908. [Google Scholar] [CrossRef]
  15. Lee, H.; Choi, M.; Kim, J.; Kim, D.; Bae, S.; Yoon, J. Partial Shading Losses Mitigation of a Rooftop PV System with DC Power Optimizers Based on Operation and Simulation-Based Evaluation. Sol. Energy 2023, 265, 112053. [Google Scholar] [CrossRef]
  16. Korea Energy Agency. The Book about Excellent Case Study of Consulting Support for Zero Energy Building. Available online: https://zeb.energy.or.kr/BC/BC04/BC04_01_001_view.do?no=449 (accessed on 9 October 2024).
  17. Guo, X.; Dong, Y.; Ren, D. CO2 Emission Reduction Effect of Photovoltaic Industry through 2060 in China. Energy 2023, 269, 126692. [Google Scholar] [CrossRef]
  18. Lee, R.; Lee, H.; Kim, D.; Yoon, J. Investigation on Optimal Electric Energy Storage Capacity to Maximize Self-Consumption of Photovoltaic System. J. Energy Resour. Technol. 2022, 144, 070903. [Google Scholar] [CrossRef]
  19. Jager-Waldau, A.; Adinolfi, G.; Batlle, A.; Braun, M.; Bucher, C.; Detollenaere, A.; Frederiksen, K.H.B.; Graditi, G.; Lemus, R.G.; Lindahl, J.; et al. Self-Consumption of Electricity Produced with Photovoltaic Systems in Apartment Buildings—Update of the Situation in Various IEA PVPS Countries. In Proceedings of the 2020 47th IEEE Photovoltaic Specialists Conference (PVSC), Calgary, AB, Canada, 15 June–21 August 2020; pp. 938–950. [Google Scholar]
  20. Ghaleb, B.; Asif, M. Assessment of Solar PV Potential in Commercial Buildings. Renew. Energy 2022, 187, 618–630. [Google Scholar] [CrossRef]
  21. REN21 Renewables 2019 Global Status Report. Available online: https://www.ren21.net/gsr-2019/ (accessed on 27 June 2024).
  22. Abu Qadourah, J.; AL-Falahat, A.M.; Alrwashdeh, S.S. Assessment of Solar Photovoltaics Potential Installation into Multi-Family Building’s Envelope in Amman, Jordan. Cogent Eng. 2022, 9, 2082059. [Google Scholar] [CrossRef]
  23. Sommerfeldt, N.; Madani, H. Solar PV for Swedish Prosumers—A Comprehensive Techno-Economic Analysis. In Proceedings of the EuroSun2016, Palma de Mallorca, Spain, 11–14 October 2016; pp. 1–9. [Google Scholar] [CrossRef]
  24. Luthander, R.; Widén, J.; Nilsson, D.; Palm, J. Photovoltaic Self-Consumption in Buildings: A Review. Appl. Energy 2015, 142, 80–94. [Google Scholar] [CrossRef]
  25. Lee, H.M.; Kim, S.C.; Lee, C.S.; Yoon, J.H. Power Performance Loss Factor Analysis of the A-Si BIPV Window System Based on the Measured Data of the BIPV Test Facility. Appl. Sci. 2018, 8, 1645. [Google Scholar] [CrossRef]
  26. Lee, H.M.; Yoon, J.H. Power Performance Analysis of a Transparent DSSC BIPV Window Based on 2 Year Measurement Data in a Full-Scale Mock-Up. Appl. Energy 2018, 225, 1013–1021. [Google Scholar] [CrossRef]
  27. Lee, H.; Lee, R.; Kim, D.; Yoon, J.; Kim, H.; Lee, G. Performance Evaluation of Sputter-Coating Based Color BIPV Modules under the Outdoor Operational Condition: A Comparative Analysis with a Non-Color BIPV Module. Energy 2022, 8, 5580–5590. [Google Scholar] [CrossRef]
  28. Lee, K.W.; Lee, H.M.; Da Lee, R.; Kim, D.S.; Yoon, J.H. The Impact of Cracks in BIPV Modules on Power Outputs: A Case Study Based on Measured and Simulated Data. Energies 2021, 14, 836. [Google Scholar] [CrossRef]
  29. Koo, C.; Hong, T.; Jeong, K.; Ban, C.; Oh, J. Development of the Smart Photovoltaic System Blind and Its Impact on Net-Zero Energy Solar Buildings Using Technical-Economic-Political Analyses. Energy 2017, 124, 382–396. [Google Scholar] [CrossRef]
  30. Murtadha, T.K.; dil Hussein, A.A.; Alalwany, A.A.H.; Alrwashdeh, S.S.; Al-Falahat, A.M. Improving the Cooling Performance of Photovoltaic Panels by Using Two Passes Circulation of Titanium Dioxide Nanofluid. Case Stud. Therm. Eng. 2022, 36, 102191. [Google Scholar] [CrossRef]
  31. Korea Sustainable Architectural Technology Assiciation. Technological Proposal of Zero Energy Apartment Complex of Public Housing in Godeok Gangil. Available online: http://kosata.org/portfolio-item/ (accessed on 9 December 2024).
  32. Shaik, S.; Maduru, V.R.; Kontoleon, K.J.; Arıcı, M.; Gorantla, K.; Afzal, A. Building Glass Retrofitting Strategies in Hot and Dry Climates: Cost Savings on Cooling, Diurnal Lighting, Color Rendering, and Payback Timeframes. Energy 2022, 243, 123106. [Google Scholar] [CrossRef]
  33. Hee, W.J.; Alghoul, M.A.; Bakhtyar, B.; Elayeb, O.; Shameri, M.A.; Alrubaih, M.S.; Sopian, K. The Role of Window Glazing on Daylighting and Energy Saving in Buildings. Renew. Sustain. Energy Rev. 2015, 42, 323–343. [Google Scholar] [CrossRef]
  34. Elsadek, M.; Liu, B.; Xie, J. Window View and Relaxation: Viewing Green Space from a High-Rise Estate Improves Urban Dwellers’ Wellbeing. Urban For. Urban Green. 2020, 55, 126846. [Google Scholar] [CrossRef]
  35. Kim, S.C.; Yoon, J.H.; Lee, R. Da Energy Performance Assessment of a 2nd-Generation Vacuum Double Glazing Depending on Vacuum Layer Position and Building Type in South Korea. Energies 2017, 10, 1240. [Google Scholar] [CrossRef]
  36. Kim, S.C.; Yoon, J.H.; Lee, H.M. Comparative Experimental Study on Heating and Cooling Energy Performance of Spectrally Selective Glazing. Sol. Energy 2017, 145, 78–89. [Google Scholar] [CrossRef]
  37. Mangkuto, R.A.; Rohmah, M.; Asri, A.D. Design Optimisation for Window Size, Orientation, and Wall Reflectance with Regard to Various Daylight Metrics and Lighting Energy Demand: A Case Study of Buildings in the Tropics. Appl. Energy 2016, 164, 211–219. [Google Scholar] [CrossRef]
  38. Kang, E.-H.; Kim, J.-W.; Kim, D.-S.; Yoon, J.-H. Development of Predicted Power Generation Nomogram of Photovoltaic System by Installation Conditions Using Typical Meteorological Year. J. Korean Sol. Energy Soc. 2023, 43, 29–41. [Google Scholar] [CrossRef]
  39. Fraunhofer Institute for Solar Energy Systems Photovoltaics Report. Available online: https://www.ise.fraunhofer.de/content/dam/ise/de/documents/publications/studies/Photovoltaics-Report.pdf (accessed on 20 November 2024).
  40. Heinstein, P.; Ballif, C.; Perret-Aebi, L.E. Building Integrated Photovoltaics (BIPV): Review, Potentials, Barriers and Myths. Green 2013, 3, 125–156. [Google Scholar] [CrossRef]
  41. Jolissaint, N.; Hanbali, R.; Hadorn, J.C.; Schüler, A. Colored Solar Façades for Buildings. Energy Procedia 2017, 122, 175–180. [Google Scholar] [CrossRef]
  42. Soman, A.; Antony, A. Colored Solar Cells with Spectrally Selective Photonic Crystal Reflectors for Application in Building Integrated Photovoltaics. Sol. Energy 2019, 181, 1–8. [Google Scholar] [CrossRef]
  43. Giovannetti, F.; Kirchner, M.; Albert, M. Design Options for Uncovered Photovoltaic-Thermal Glass-Glass Panels. In Proceedings of the Euro Sun 2016 Conference, Palma de Mallorca, Spain, 11–14 October 2016; pp. 1–11. [Google Scholar] [CrossRef]
  44. Chen, H.Q.; Honda, T.; Yang, M.C. Approaches for Identifying Consumer Preferences for the Design of Technology Products: A Case Study of Residential Solar Panels. J. Mech. Des. 2013, 135, 061007. [Google Scholar] [CrossRef]
  45. El Samanoudy, G.; Abdelaziz Mahmoud, N.S.; Jung, C. Analyzing the Effectiveness of Building Integrated Photovoltaics (BIPV) to Reduce the Energy Consumption in Dubai. Ain Shams Eng. J. 2024, 15, 102682. [Google Scholar] [CrossRef]
  46. Department of Energy EnergyPlusTM Version 23.2.0 Documentation Engineering Reference. Available online: https://energyplus.net/assets/nrel_custom/pdfs/pdfs_v23.1.0/EngineeringReference.pdf (accessed on 23 November 2024).
  47. ASHRAE International Weather File for Energy Calculation v 2.0. Available online: https://www.ashrae.org/technical-resources/bookstore/ashrae-international-weather-files-for-energy-calculations-2-0-iwec2 (accessed on 20 November 2024).
  48. Perez, R.; Ineichen, P.; Seals, R.; Michalsky, J.; Stewart, R. Modeling Daylight Availability and Irradiance Components from Direct and Global Irradiance. Sol. Energy 1990, 44, 271–289. [Google Scholar] [CrossRef]
  49. Korea Real Estate Board K-Apt Apartment Management Information System. Available online: https://www.k-apt.go.kr/web/main/index.do#this (accessed on 10 October 2024).
Figure 1. The research process.
Energies 18 00541 g001
Figure 2. Bird’s eye view and layout of each building in the apartment complex.
Energies 18 00541 g002
Figure 3. The hourly shading pattern for December 22nd.
Energies 18 00541 g003
Figure 4. The annual irradiation at the center of the facade for each floor of the buildings.
Energies 18 00541 g004
Figure 5. The design scenarios for PV arrays on apartment facades.
Energies 18 00541 g005
Figure 6. Daily EUI for each month based on electricity consumption of the filtered suitable apartment complexes.
Energies 18 00541 g006
Figure 7. The monthly and annual power generation for each FPV system design scenario.
Energies 18 00541 g007
Figure 8. The electricity balance of the apartment complex with RFPV systems.
Energies 18 00541 g008
Figure 9. The final residual electricity consumption of the apartment complex and contribution ratio of FPV systems in each scenario.
Energies 18 00541 g009
Table 1. Detailed information about each building within the apartment complex.
ParameterBuilding ABuilding BBuilding CBuilding DBuilding EBuilding F
Direction [°]171171171145145145
Number of floors [ea]181812101415
Number of households [ea]114203115120157105
Gross area [m2]5431.07226.05444.07047.19106.74213.3
Height of building [m]55.556.838.346.946.932.6
Facade area of southern facade [m2]1743.02577.11855.51974.02549.31356.3
Window area in southern facade [m2]464.4691.2592.8582.0775.2360.0
WWR in southern facade [%]26.626.831.929.530.426.5
Table 2. The specifications of the RFPV systems in the apartment complex.
ParameterBuilding ABuilding BBuilding CBuilding DBuilding EBuilding FToal
RFPV area [m2]226.14293.52320.52546.72486.84180.122053.86
RFPV capacity [kWp]45.258.764.1109.397.436.0410.7
Table 3. The area and capacity of each building’s FPV system according to design scenarios.
ScenariosParametersBuilding ABuilding BBuilding CBuilding DBuilding EBuilding FTotal
Scenario
A
PV area [m2]1168.801724.341122.481258.981596.70914.107785.40
PV capacity [kWp]175.3258.7168.4188.9239.5137.11167.9
Scenario
B
PV area [m2]458.38692.27499.07531.12666.07365.643212.55
PV capacity [kWp]68.8103.874.979.799.954.9482.0
Scenario
C
PV area [m2]963.921407.78848.77981.361249.37750.896202.09
PV capacity [kWp]144.6211.2127.3147.2187.4112.6930.3
Table 4. Parameters describing building characteristics in the K-APT database.
ParametersDetail
CitySeoul
Number of apartment complex in database [ea]1928
Number of households per an apartment complex [ea]150~9510
Range for number of buildings per an apartment complex [ea]1~122
Range for gross floor area per an apartment complex [m2]5817~147,781,069
Table 5. The filtering conditions for extracting the EUI of suitable apartment complexes from whole data.
ParametersApartment Complex in This PaperFiltering Conditions
Number of buildings [ea]64~8
Gross floor area [m2] 160,91836,000~85,000
Number of households [ea]814480~1140
1 Gross floor area includes public space.
Table 6. The estimated monthly electricity energy consumption of the apartment complex.
ParameterJan.Feb.Mar.Apr.MayJun.Jul.Aug.Sep.Oct.Nov.Dec.
Electricity consumption [MWh]149.2146.8144.4141.3137.1147.4152.3188.2165.7137.1141.3152.9
Table 7. The distribution ratio of the RFPV systems and REC.
ParameterJan.Feb.Mar.Apr.MayJun.Jul.Aug.Sep.Oct.Nov.Dec.
Distribution ratio [%]20.825.035.945.946.136.030.625.128.233.725.319.9
Residual electricity
consumption [MWh]
118.1110.292.676.473.994.4105.6140.9118.990.8105.6122.5
Disclaimer/Publisher’s Note: The statements, opinions and data contained in all publications are solely those of the individual author(s) and contributor(s) and not of MDPI and/or the editor(s). MDPI and/or the editor(s) disclaim responsibility for any injury to people or property resulting from any ideas, methods, instructions or products referred to in the content.

