Abstract
Energy storage is vital for on-demand electricity generation from renewable sources like wind and solar. Besides employing batteries, retrofitting conventional fossil-fired power plants with thermal energy storage might present a highly cost-effective solution. State-of-the-art molten salt storage systems currently operate at a maximum temperature of 565 °C. At a higher permanent temperature, nitrate salts start to decompose. The actual wall temperatures of power components for heating, such as solar receivers and electrical heaters, may exceed temperature limits. To date, there is no clear threshold identified up to which heating surfaces in contact with nitrate salt can be operated without leading to the degradation of the salt, which is inevitably followed by increased corrosivity. In this study, possible mechanisms affecting the maximum permissible wall temperature of heating surfaces are identified. The local production of oxygen and nitrite at hot surfaces and its accumulation in the entire system is looked at in an experiment with 9.3 kg of nitrate salt. The effect of high wall temperatures on the evolution of oxygen and nitrite content over time is monitored and analyzed. Parametric studies with an experimentally validated physical model focusing on the nitrate/nitrite equilibrium reveal major influencing factors, with wall temperatures significantly exceeding current design limits. These findings potentially allow for more compact and cost-effective heating components. This work supports the advancement of high-temperature thermal energy storage systems essential for the scalability and economic competitiveness of renewable energy infrastructure.
1. Introduction
Thermal energy storage (TES) is a pivotal technology for facilitating on-demand power generation from intermittent renewable sources such as wind and solar. In this context, molten nitrate salts have emerged as a promising storage medium, although their thermal and chemical stability impose constraints on the design of heating surfaces in heat transfer components such as concentrated solar receivers and electric heaters [1,2,3]. It is imperative to enhance the power density of such components in order to reduce their associated costs. This can be achieved through one of the following methods: increasing the heat transfer area per volume, increasing the heat transfer coefficient, or increasing the temperature difference. While the limits for the first two approaches are mainly affected by hydraulics and structural integrity and are therefore well understood, the limits for the last approach remain unclear for nitrate salt. In order to identify the maximum wall temperature, it is essential to look at the influencing parameters first. Figure 1 illustrates mechanisms affecting the maximum wall temperature in heating components, categorized into critical (yellow) and non-critical mechanisms (green).
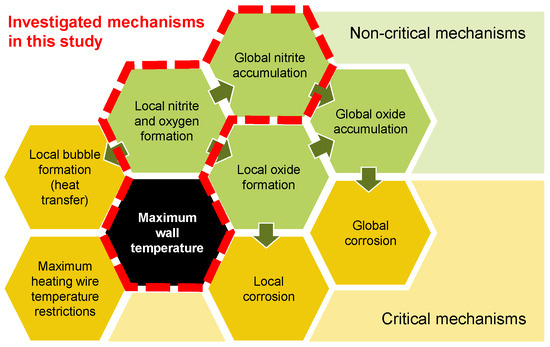
Figure 1.
Mechanisms affecting the maximum wall temperature for heating components in nitrate salts.
The critical mechanisms directly affect the feasibility and durability of the system or the heating component. The non-critical mechanisms shown in Figure 1 are per se not limiting the maximum wall temperature. In the case of an electric heater, a minerally insulated heating wire within a tube sheet is usually restricted in its maximum heating wire temperature, limiting the achievable heat flux and surface temperature [4,5]. This of course depends on how the heater is built. Other heater concepts, such as the direct heating of a pipe, can achieve substantially higher surface temperatures. At such high surface temperatures, the hypothesis is that nitrate () locally reacts to nitrite () under the formation of oxygen. This could lead to either local bubble formation at the surface, affecting the heat transfer negatively, or it could lead to global nitrite accumulation as well as further reaction of the nitrite to oxide (). Increased oxide concentrations in salt compositions have been shown to enhance its basicity [1]. In contact with steel, this can result in accelerated corrosion rates [6,7]. Locally produced oxides could then form local corrosion at the heating surface as well as accumulate globally throughout the system. At a certain oxide content in the system, this could further lead to global corrosion.
1.1. State of Knowledge of Chemical Decomposition of Nitrates
The nitrate salt most commonly employed in concentrated solar power (CSP) applications is a near-eutectic binary mixture of sodium nitrate and potassium nitrate, comprising 60% and 40% by weight. This substance, known as Solar Salt, undergoes crystallization at approximately 238 °C and becomes fully solid at 223 °C [8,9]. In concentrated solar power (CSP) applications, Solar Salt is typically employed within a temperature range of 290 °C to 565 °C. However, it becomes chemically active at temperatures exceeding approximately 450 °C, undergoing a range of reactions influenced by the temperature and the composition of the cover gas. Raising the temperature of nitrate salt above 560 °C in an air atmosphere accelerates its decomposition, leading to the formation of corrosive oxides in the molten salt [1]. However, controlling the gas atmosphere in salt tanks can reduce decomposition and corrosion to acceptable levels. Bonk et al. demonstrated improved thermal stability of Solar Salt over the long term using a closed gas atmosphere [10]. Supporting this, Sötz et al. and Steinbrecher et al. found stable oxide-ion levels, indicating low corrosivity, even after 1000 h and showed that adding small amounts of nitrous gases can regenerate decomposed Solar Salt [11,12]. In addition, Prieto et al. discovered that the degradation of Solar Salt is reduced by purging with pure oxygen at 650 °C [13]. Further studies by Bonk et al. on austenitic steel 347 H, commonly used in hot molten salt tanks, confirmed that corrosion in Solar Salt is significantly affected by temperature and the composition of the cover gas [14,15]. The decomposition of nitrate salt occurs in two steps. In the first step (Equation (1)), the nitrate ion reacts to form oxygen as gas and a nitrite ion:
In the second step (Equation (2)), two nitrite ions further react to form an oxide ion and nitrous gases. It should be noted that details of the exact second decomposition reaction are not fully understood and the equation represents one likely decomposition among other feasible decomposition reactions:
While increased nitrite ion content is not particularly problematic, a higher oxide ion content negatively affects the salt’s corrosivity. As the temperature rises, the equilibrium of both reactions shifts to the right. For instance, in the context of concentrated solar power (CSP) applications, the absence of nitrous gases results in continuous oxide production. Laboratory-scale experiments have measured oxide levels in excess of 0.08 mol% after 1000 h under such conditions [10,11]. However, increasing the partial pressure of the reaction gases, like in a closed system, shifts the equilibrium back to the left. This leads to a lower oxide ion concentration in the molten salt and hence a lower corrosivity.
The aforenamed studies all refer to the equilibrium concentration in the bulk of a molten salt system, where large quantities of salt are kept at a homogeneous temperature almost for the entire lifetime. However, by looking at components with temperature gradients and the short residence times of the salt, the decomposition of nitrate salt can vary. Such systems like electric heaters or heated pipes can be referred to as semi-equilibrium systems. Initial investigations into this effect were conducted by Kruizenga et al., who examined the decomposition effect in a pumped nitrate salt loop operating at 610 °C, incorporating a locally heated pipe with high film temperatures of up to 670 °C [16]. The authors found that global corrosion rates were approximately one order of magnitude lower than in static experiments at bulk temperatures of 670 °C.
1.2. State of Knowledge of Heat Transfer in Nitrate Components
There were three applications identified where molten salt heat transfer components can be used. One of them is a molten salt electric process heater (Figure 2a), which is gaining increasing attention for sector coupling, e.g., for the electrification process of steam supply or for Carnot batteries [17,18]. Another application is a waste heat recovery heat exchanger (Figure 2b) envisioned to be used as, for example, a flue-gas-to-molten-salt heat exchanger in electrical arc furnaces. The third application is a central solar receiver (Figure 2c), which is already commercially used in many solar thermal power plants.
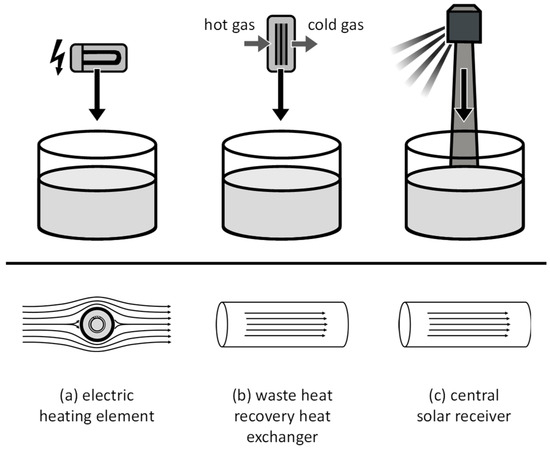
Figure 2.
(a–c) Illustration of applications for molten salt heating components (top) and prevalent flow patterns (bottom).
In all three applications, the transfer of heat is governed by the principle of forced convection. In molten salt electric heaters, the salt is commonly flowing outside a set of minerally insulated U-tube heating elements (Figure 2a), resulting in a heat flux from the inside. In waste heat recovery heat exchangers (Figure 2b) as well as in central solar receivers (Figure 2c), the molten salt flows within pipes, and heat is transferred from the pipe walls. The heat transfer coefficient can be calculated by empirical Nusselt correlations. For forced convection, Nusselt number correlations are typically equated as a function of the geometry-specific Reynolds number and the fluid-specific Prandtl number. The Nusselt number (Equation (3)) is defined as a function of the heat transfer coefficient , a characteristic length and the thermal conductivity of the fluid :
The Reynolds numbers typically observed in molten salt central solar receiver tubes fall within the range of 10,000 to over 200,000, leading to Nusselt numbers between 200 and 1000 [19]. Typical maximum planar surface flux densities fall within the range of 50 W/cm2 to over 100 W/cm2 [20]. This equates to a circumferentially averaged flux density of approximately 16 to 32 W/cm2 in each receiver tube.
In contrast, the heater surface flux densities typically employed in modern molten salt electrical heaters are significantly lower, often below 10 W/cm2 and frequently around 4 W/cm2 [4]. In the hot part of the electric heater, the flux densities are particularly low, at approximately 2.5 W/cm2 for some designs [5,21]. This limitation is attributed to the configuration of electric resistance heaters, which typically comprise a shell, baffles, and minerally insulated heating elements that can be either straight or bent. The heating elements comprise a stainless steel or nickel alloy sheath in contact with molten salt, compacted magnesium oxide (MgO) powder for electrical insulation, and a heating wire situated in the center. The heating wire, composed of a high-temperature material (typically nickel chromium alloy), is either straight or coiled and functions as an ohmic resistor, generating heat. The heat is conducted through the MgO powder to the outer layer of the sheath. The MgO powder, which serves as an electric insulator, also insulates thermally, resulting in the wire inside typically reaching temperatures several hundred degrees higher than the surface. Consequently, the flux density is significantly constrained by the allowable temperature of the heating wire.
The average Reynolds number in the electric molten nitrate salt heater is typically around 10,000 [4,21,22], and the heat transfer coefficient typically ranges between 2000 and 6500 W/m2K, with an average of approximately 3000 W/m2K [4]. Hot spots in electric heaters are not expected at the entire sheath surface but rather in heated dead zones of current heater designs, which can be avoided with an appropriate design and safe operation.
The required surface area of a molten salt heating component is inversely proportional to the temperature difference between the heating surface and the salt. Consequently, the required surface area and the associated cost can thus be reduced by increasing the temperature difference. Taking a molten salt electric or, more generally, a U-tube heat exchanger as an example reveals a significant cost reduction potential: For instance, a 50% reduction in the surface area of a U-tube heat exchanger has been shown to result in a 40% decrease in costs [23]. It can be hypothesized that the cost of an electric heater would scale in a similar manner.
This study also assumes that the flow pattern of the molten salt (pipe flow versus flow around a cylinder) does not significantly impact the temperature-dependent degradation rate of the salt. For the purpose of model development, we therefore assume a pipe flow.
1.3. Knowledge Gaps and Objective of the Work
The literature, so far, has mainly looked at salt degradation and heat transfer separately. One study known to the authors focused on both with a main emphasis on experiments [16]. This study mainly looked at global corrosion in a real setup. However, the experiments carried out involved inductive heating and were performed in open atmosphere. While these findings underscore the potential influence of high film temperatures on salt degradation and corrosion, the following points are still unknown. Firstly, what are the major influential parameters on salt degradation in heated films and how sensitive are degradation rates to changes in these parameters? Secondly, what are the maximum achievable film temperatures depending on the acceptable nitrite content?
This study focuses on the mechanism of nitrite and oxygen formation and accumulation, which is a first step towards closing the knowledge gap in maximum wall temperature determination. Knowing the temperature limit of hot surfaces in contact with molten nitrate salt is essential to building compact and cost-effective molten salt heating components such as heat exchangers and electric heaters.
The goal of this research was to develop an experiment with which we could investigate the influence of high wall temperatures on the changes in the chemistry of molten nitrate salts. This experiment was then used to validate a kinetic model. In the last step, this kinetic model was used to perform a parametric study on the allowable maximum wall temperature depending on different boundary conditions.
2. Materials and Methods
2.1. Experimental Setup
The experimental setup was designed to simulate the conditions occurring during heat transfer in molten salt heating components (e.g., central solar receiver, electric heater, heat exchanger). The objective of the experiment was to capture the interplay between a heated film volume, a core volume representing the center temperature regime of a flow, and a gas volume allowing for diffusive gas exchange with a predefined purge gas. In a representative thermal energy storage application, diffusion from the tank surface to the film volume in the heating component is limited by the long diffusion length (tank height and interconnecting piping), as shown in Figure 3a.
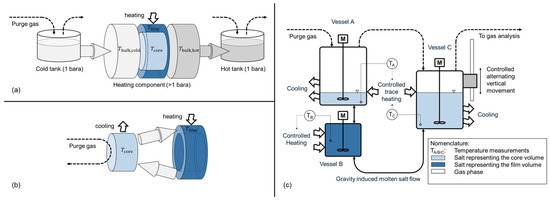
Figure 3.
Simplified temperature regimes and relevant volumes for gas diffusion in a representative thermal energy storage application during charging (a), isolated concept for worst-case experimental analysis with minimal gas transport limitation (b), and schematic representation of chosen test setup for investigation of interaction between wall temperature and decomposition (c).
In comparison with a real system, the characteristic zones of the film and core region occur in the heating component, while the gas phase occurs mainly above the melt in the hot molten salt tank. In a real storage system, the presence of pipework results in a substantial salt volume between the heating components’ exit and the gas in the hot tank, thereby impeding diffusive mass transport of dissolved gases. This mass transport limitation is not incorporated within the experimental setup, consequently rendering it a worst-case scenario with regard to salt degradation. This concept is shown in Figure 3b, and the corresponding test setup is shown in Figure 3c. The setup consists of three interconnected vessels filled with molten Solar Salt. A smaller vessel acts as a reactor representing the film volume during heat transfer. Here, the salt is heated, for example, to 620 °C. The remaining salt volume is maintained at 560 °C via convective cooling. To maintain the desired temperatures, both vessels are heated externally using a temperature-controlled electric heating element. Gas is used to purge the surface of the salt in vessels A and C. To pump the salt, the left vessel C is moved vertically in a controlled way. The direction is alternating. This way, the salt is recirculated between the vessels by gravity. Submerged stirrers maintain a homogeneous temperature in each vessel. During the process, thermal decomposition of the molten salt may release oxygen, which bubbles out and is analyzed using a gas analysis system. This gas analysis system uses a continuous gas analyzer with an infrared (Magnos206 for O2) and ultraviolet (Limas11 NO/NO2) measuring cell. In total, two different experiments were conducted. Table 1 summarizes all relevant parameters, including the uncertainty range where applicable.

Table 1.
Fixed and variable experimental parameters for experiment 1 and experiment 2.
The first experiment aimed to investigate the influence of a high wall temperature on the production of oxygen and nitrous gases. The evolution of NOx (NO2 and NO) and oxygen was monitored over time. At three successive steps, the temperature setpoint in the film region was elevated from an initial 560 °C to 600 °C, 620 °C, and 630 °C. In the last step, the film temperature was set back to 560 °C. The core temperature was maintained at 560 °C. The system was purged with a mixture of 79% oxygen and 21% nitrogen. This experiment lasted for 13.3 h, and the step changes in temperature were two hours apart.
In the second experiment, the focus was on the nitrate to nitrite reaction over a longer time period of 300 h. In this experiment, the film temperature was increased from core temperature level of 560 °C to a film temperature level of 620 °C for a duration of approximately 50 h. In this case, the system was purged with 20% oxygen and 80% nitrogen. Salt samples were taken at different times to monitor the change in nitrite content. The nitrite content was analyzed using wet chemical methods and ion chromatography.
2.2. Modeling Approach
As mentioned above, we assume a pipe flow to be the representative flow regime in the heating component. For the analogy with this pipe flow, definitions of the wall temperature, minimum temperature, bulk temperature, film temperature, and core temperature are introduced. Also, the pipe cross-section is categorized into two regions, the film volume close to the wall and the remaining core volume in the center, as shown in Figure 4.
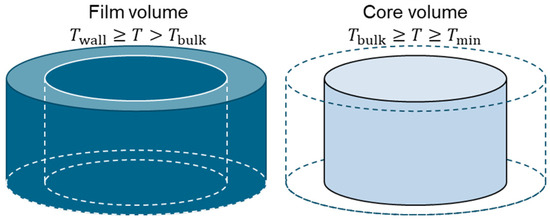
Figure 4.
Illustration of the film and core volume of the fluid in a pipe cross-section.
The definition of the different temperatures is exemplified in the left diagram in Figure 5. The wall temperature is the highest temperature in a heated pipe occurring directly at the wall, the bulk temperature is the average temperature of the entire fluid cross-section within the pipe, and the minimum temperature is the lowest temperature occurring at the center of the pipe flow. In this study, the radius at which the temperature profile is equal to the bulk temperature also marks the separation surface between the film and the core volume. In this simplified model, the temperatures in the film and core volume are assumed isothermal as per the right diagram in Figure 5. The film temperature is chosen to be equal to the wall temperature and the core temperature is chosen to be equal to the bulk temperature. This assumption assures that the temperatures in the parameter study are higher than in a real system, representing a worst-case scenario.
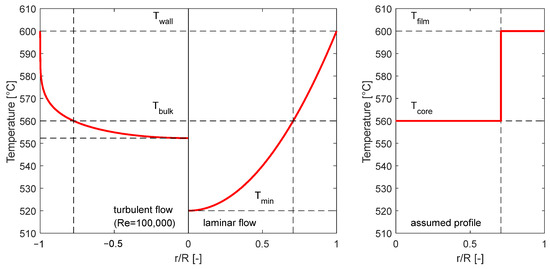
Figure 5.
Example for the radial temperature profile for turbulent and laminar pipe flow in a heated pipe (left diagram) and example for an assumed temperature profile for the worst-case scenario (right).
The test setup can further be described with the physical model illustrated in Figure 6. This physical model represents the simplification introduced in Figure 3b. The model under consideration consists of three characteristic zones: a film region, a core region, and a gas phase.
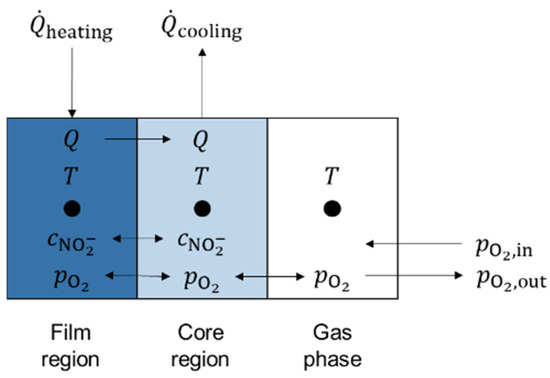
Figure 6.
Simplified physical three-zone model for test setup.
In the proposed model with the three nodes introduced in Figure 6, concentrations of ions and gaseous components are exchanged between the film region and the core region by means of convection and diffusion. Furthermore, the concentration of nitrate and dissolved oxygen can equilibrate. The gas phase allows gas transport to and from the core region. For this model description, two formulae were derived from a mass balance over the test setup and demonstrate the differential equation for nitrite concentration in core volume and film volume (Equation (4)), as well as the differential equation for oxygen partial pressure in gas volume (Equation (5)). The terms , , , and represent the constant rate for the reducing (subscript ‘re’) and oxidizing (subscript ‘ox’) reaction in the bulk (subscript ‘b’) and the wall (subscript ‘w’) volume. The values for the rate constants were taken from Sötz et al. [25]. The term represents the nitrite concentration, the term represents the total salt volume, is the oxygen molar mass, is the oxygen density at ambient temperature, is the total amount of salt, and is the total gas volume flow at ambient temperature.
As previously outlined, under the most unfavorable conditions, the film volume can be designated as equivalent to 50% of the total flow cross-section within a molten salt heating component. This also marks the highest volume share occurring only under laminar flow conditions. It is evident that the experiments yielded a divergent ratio, a consequence of the geometrical constraints imposed by the test setup. Nevertheless, the model was still validated with these parameters, and the high ratio of 50% was used for the parametric study.
3. Results
3.1. Experiment 1 for Identifying Dominant Chemical Reactions
The first experiment investigated the influence of elevated wall temperatures on the production of oxygen and nitrous gases. Figure 7 illustrates the temporal evolution of NOx (NO2 and NO) and oxygen concentrations. The temperature setpoint in the film region was successively increased from an initial 560 °C to 600 °C, 620 °C, and finally 630 °C, before being returned to 560 °C in the final step. Throughout the experiment, the core temperature was maintained at 560 °C. The system was purged with a gas mixture containing 79% oxygen and 21% nitrogen.
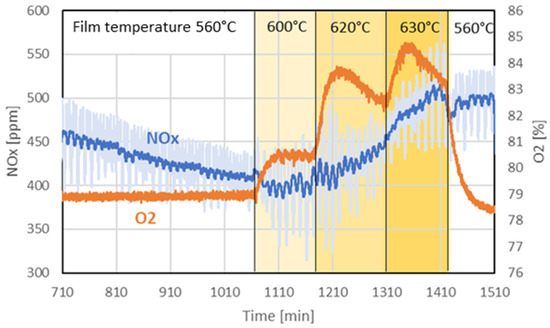
Figure 7.
Evolution of nitrous gases (NO2 and NO) and oxygen over time in experiment 1. THe dark blue of the NOx signal refers to the time-averaged NOx concentration, and pale blue refers to the actual measured value.
When the film temperature was increased to 600 °C, the measured oxygen concentration rose sharply and stabilized at an elevated level. A further increase to 620 °C resulted again in a sharp increase in oxygen concentration, followed by a gradual but steady decline. At 630 °C, the oxygen concentration rose again and began to also decrease after approximately 30 min. Upon reverting the film temperature to 560 °C, the oxygen concentration dropped rapidly, falling below the level corresponding to the purge gas composition. The experiment was halted before reaching equilibrium.
Analysis of the nitrous gas concentrations indicates that a steady state was not achieved before the experiment, as it continued to fall in the first period. The initial temperature increase to 600 °C did not significantly affect nitrous gas production within the time frame of that step. However, with further temperature increases, the concentration of nitrous gases began to rise slowly. Notably, after reducing the film temperature back to 560 °C, the nitrous gas concentration plateaued rather than drop immediately, in contrast to the behavior of the oxygen concentration.
While the film temperature appears to directly influence the oxygen concentration, the results of this experiment do not allow us to directly correlate the evolution of nitrous gas concentration with it.
3.2. Experiment 2 for Model Validation
Figure 8 illustrates the dynamic behavior of temperature, oxygen content, and nitrite content during the experimental and simulated sequential heating process. The top graph (a) displays the setpoint for the film temperature as a step change from 560 °C to 620 °C, maintained for approximately 50 h before returning to the initial level in the model and experiment. In the middle graph (b), the oxygen content evolution is compared between simulation (black line) and experimental measurements (orange line). An initial peak is observed in the simulation when the film temperature setpoint is increased. This peak can be attributed to the first degradation reaction from the nitrate to nitrite under the release of oxygen, as described by Equation (1). While in the simulation, where transport limitations are absent, the oxygen content reaches 42% shortly after the step increase in the film temperature; in the experiment, a slightly lower oxygen content of 27% was measured. In both the simulation and the experiment, the oxygen concentration declines again, almost reaching the initial value. After the film temperature is lowered to the initial 560 °C, the oxygen content in the simulation sharply decreases to 10%. This behavior can be attributed to the back reaction of nitrite to nitrate under the consumption of oxygen. The measurements of the oxygen content show similar overall behavior compared to the simulation. However, the experimental peak is again considerably lower in its magnitude. This difference can be explained by the diffusive and convective transport limitation of dissolved oxygen in the experiment. The fact that oxygen production happened faster than oxygen consumption in the experiment can be explained by bubble formation enabling high gas transport in one direction.
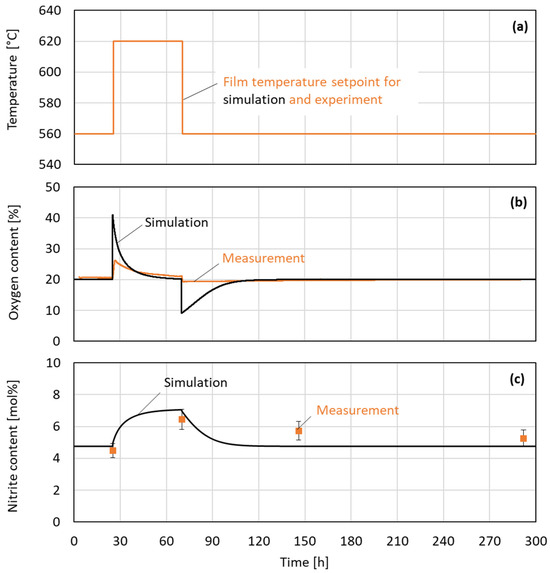
Figure 8.
Evolution of temperature setpoint (a), oxygen content in purge gas return (b), and nitrite content in salt (c) over time during sequential heating in experiment 2.
As expected, the nitrite content of the simulation as well as the measurement increases after the rise in the film temperature setpoint due to the temperature-sensitive nitrate–nitrite reaction. This can be observed in the bottom graph. After the film temperature step changes from 620 °C back to 560 °C, the nitrite level declines for both the experiment and the simulation. In the simulation, the decline happens almost completely within 30 h. In the measurements, the decline happens over a period of more than 225 h, and the initial nitrate–nitrite equilibrium is not reached after the termination of the experiment.
The fact that the validated model does not perfectly predict the measured nitrite and oxygen content can be accepted, as the objective of this study is to find a worst-case model first. The model does not incorporate any transport limitations; consequently, the rate of degradation due to the hot salt film is determined exclusively by reaction kinetics. Furthermore, the temperatures were systematically and deliberately overestimated. The underlying logic of this approach is to identify a worst-case scenario. In a real system, it is hypothesized that degradation is slowed down due to the presence of transport limitations and lower temperatures. This is a probable explanation for the reduced degradation observed in the experiment.
3.3. Parametric Study with Model
By varying the key process parameters, such as the core temperature, film temperature, targeted nitrite level, total pressure, partial cover gas oxygen pressure in tanks, and residence time, a parameter study was conducted to identify their influence on nitrite formation. The principal sketch of the system used for this parametric study is shown in Figure 3a,b. The tank is assumed to have a specified cover gas oxygen concentration.
Figure 9 illustrates the maximum film temperature as a function of the core temperature for three equilibrium nitrite levels (5%, 7.5%, and 10%) at ambient pressure. While for the heating component, two pressure levels were investigated (1 bar and 5 bar), the partial pressure of the cover gas oxygen content in the atmospheric tanks was varied from 0 to 1 bar (0.2 bar and 1 bar indicated) and as a theoretical value further above 1 bar (dashed lines). The left-hand plot shows the case of infinite residence time, where chemical equilibrium can be fully established. The right-hand plot displays the results for a limited residence time of 10 s. For the case with an infinite residence time, the allowed film temperature is between 620 °C and 680 °C, which is slightly sensitive to the core temperature but mainly dependent on the nitrite level, where higher nitrite targets lead to a significant increase in film temperature. The finite residence time allows for an even higher film temperature due to incomplete reaction progress. Here, the maximum film temperature can reach up to 780 °C depending on the nitrite level and core temperature. It should be emphasized at this point that the approach presented is a simplified modeling method without consideration of NOx formation, and therefore, no conclusions for the design of a heating component like an electric heater can be drawn. The major purpose of this study is to enhance the understanding of how the nitrate–nitrite ratio develops within the component or the system.
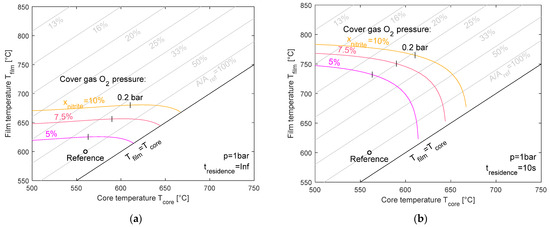
Figure 9.
Maximum film temperature for equilibrium nitrite levels of 5%, 7.5%, and 10% for an infinite (a) and 10 s residence time (b) at ambient pressure.
Figure 10 presents the same set of conditions, but at a higher system pressure of 5 bar. Compared to ambient pressure, the increased absolute pressure leads to generally higher film temperatures for the same nitrite levels. Again, the contrast between infinite (left) and finite (right) residence times is evident, demonstrating the kinetic limitations that increase the film temperature rise at shorter residence times. For an infinite residence time, the film temperature can reach 740 °C, and for the 10 s residence time, it can reach 790 °C. The dashed lines in the diagrams illustrate the theoretical film temperature limit for cover gas oxygen pressures larger than 1 bar. In most cases, this is technically not feasible.
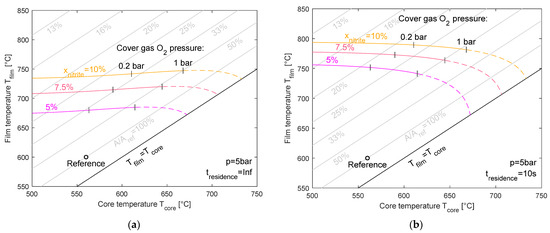
Figure 10.
Maximum film temperature for equilibrium nitrite levels of 5%, 7.5%, and 10% for an infinite (a) and 10 s residence time (b) at 5 bar pressure.
The gray lines represent the lines of the constant ratio of the required heat transfer areas with respect to a reference case, which has a 560 °C core temperature and 600 °C film temperature. As can be seen from the graph, in some cases (e.g., 10 s residence time, 5 bar system pressure, 10% nitrite content, and 560 °C core temperature), the required area is below 20% of the reference case’s heat transfer area. This would result in reduced costs to below 25% of a heating component with a 600 °C film temperature. This calculation is based on the assumption that halving the size would reduce the costs by 40%, as introduced earlier [23].
4. Discussion
4.1. Key Findings of Experiment and Simulation
This study investigated the chemical behavior of nitrate salt at elevated wall temperatures, providing crucial insights into the design of high-power-density molten salt components. The first key finding from the experiments is related to the nitrate–nitrite dynamics. The experimental results demonstrate that when the film temperature was increased from 560 °C to 620 °C, there was a measurable increase in nitrite content and oxygen production. After returning to the initial temperature, the nitrite content gradually decreased. A second key finding is that an increase in the wall temperature has a measurable impact on nitrous gas formation. However, this impact was small in the measured temperature range.
The comparison of the experiment results with the simulation results shows the following. The kinetic models of the nitrate–nitrite reaction show a fast response to a change in the film temperature. In the experiments, this rapid change was not as pronounced as in the simulation, indicating complex transport limitations. On the other hand, model validation revealed that the physical three-zone model developed for this study accurately captured the overall behavior of nitrite formation and oxygen evolution, although differences in peak magnitudes were observed due to transport limitations that were not fully accounted for in the model. However, this model can be considered valid for worst-case investigations and under the assumption that oxide formation plays a subordinate role locally. Finally, experiments confirmed that local production of oxygen and nitrite at hot surfaces does occur, but the rate of accumulation in the entire system is slowed down by transport limitations.
These findings are in line with a previous report by Kruizenga et al. [16], which found that on the one hand, an increased wall temperature has a measurable impact on salt chemistry, but on the other hand, reaction rates are well below equilibrium values for the investigated temperature. Our results extend the understanding to higher wall temperature regimes (>600 °C) and quantify the influence of transport limitations, which have often been neglected in kinetic models [25,26].
From the parameter study, we identified critical parameters. It could be shown that the maximum permissible film temperature is primarily influenced by four parameters. Firstly, it is important to note that the acceptable limits of nitrite content have a considerable impact on the final film temperature. It was demonstrated that higher allowable nitrite levels permit higher film temperatures. Secondly, the system pressure at the point of heat input is of significance (it was demonstrated that higher pressures enable operation at higher film temperatures). Thirdly, the residence time must be considered. Shorter residence times allow higher film temperatures due to incomplete reactions. Fourthly, and to a lesser extent, the core temperature was shown to have a marginal influence on the allowable film temperature.
Through choosing the optimum values, the operating range can be substantially extended. Under optimal conditions (5 bar pressure, short residence times, and accepting a 10% nitrite level), film temperatures of up to 790 °C can be permitted without causing excessive nitrite production. In this way, the required heat transfer area can be reduced. At these high film temperatures, the theoretically required heat transfer area would become less than 20% of that in a conventional design with 600 °C film temperature. This presents a relevant cost saving potential for molten salt heating components.
4.2. Implications for Component Design
By identifying conditions under which elevated wall temperatures do not result in unacceptable nitrite or oxide accumulation, this work provides a pathway toward reducing the size and cost of thermal components. Specifically, the ability to safely operate at higher wall temperatures allows for greater temperature differentials, which directly translates to a reduction in the required heat transfer surface area. In looking only at the film temperature as the limiting design parameter and excluding local oxide formation, a film temperature as high as 790 °C could potentially reduce the size of electric heaters to below 20% and its capital costs to below 25% of a heater with a 600 °C film temperature (based on the assumption that halving the size would reduce the costs by 40%). This also depends of course on other design constraints and is likely an upper limit for the film temperature. The findings from this study have several important implications for the design of molten salt heating components. The first is increased power density. By allowing wall temperatures higher than those previously considered safe, the power density of molten salt components can be significantly increased. Also, based on our parameter study, we can now provide specific design recommendations (Figure 9 and Figure 10) for the maximum allowable wall temperatures depending on the system pressure, residence time, and acceptable nitrite content. These guidelines enable engineers to optimize the design of heat transfer components while ensuring safe operation:
- System pressure: Operating molten salt heating systems at moderate pressures (e.g., 5 bar) can significantly increase the allowable film temperature compared to operation at atmospheric pressure. Maintaining constantly high pressure during heat transfer is important to not compromise salt stability.
- Residence time: Designing systems with limited salt residence times at high-temperature surfaces can limit nitrite formation, allowing for higher-temperature operation than would be possible in equilibrium systems like storage tanks. Consequently, high flow velocities and small fluid volumes are desired in molten salt heating components.
- Nitrite content: The acceptable nitrite content has a direct influence on the allowable film temperature. By assuring that the remaining system allows for a high nitrite content, a high film temperature limit can be selected.
For the design of molten salt heating components and electric heaters specifically, our findings suggest that current designs with a maximum film temperature of 600 °C are overly conservative considering the nitrite–nitrate conversion. With proper consideration of the parameters identified in this study, more compact and cost-effective heaters can be developed that operate safely at higher heat fluxes.
4.3. Future Research Directions
While this study has provided valuable insights into the behavior of nitrate salt at elevated wall temperatures, several areas for further experimentation were identified. Further validation experiments at higher temperatures are required to increase the reliability of the model. Extended operation studies exceeding 1000 h are needed to verify the long-term stability of the salt composition and the integrity of components under the elevated temperature conditions identified in this work.
The film temperature may also be limited by oxide formation accompanied by nitrogen oxide release. This aspect was only partly evaluated in the experiments and was not included in the model. Therefore, investigating the second decomposition reaction (nitrite to oxide) at elevated wall temperatures is necessary to fully understand potential corrosion mechanisms during long-term operation.
Studies on the corrosion behavior of various materials at the identified elevated film temperatures would provide crucial information for material selection in high-temperature molten salt applications. Validation of the findings in larger-scale systems that more closely represent industrial conditions would also be beneficial before full commercial implementation. Furthermore, research on gas management strategies in closed-loop systems is needed to maintain optimal cover gas composition and pressure during extended high-temperature operation.
Simulation models could also be improved. More detailed modeling of diffusion and convective transport phenomena would enhance the prediction of system behavior where transport limitations are significant. Additionally, design studies on flow field configurations that minimize residence time in high-temperature regions while maintaining efficient heat transfer would support the practical implementation of these findings in heat exchanger designs.
5. Conclusions
This research demonstrated that the maximum permissible wall temperature in molten salt systems could be significantly higher than the conventionally accepted maximum permissible wall temperature of around 600 °C. In an experiment, we achieved film temperatures of max. 630 °C without excessive salt degradation. With experimentally validated models, we showed that in theory, film temperatures up to 790 °C can be safely employed under appropriate conditions without causing detrimental nitrite formation.
The findings challenge conventional design limitations for molten salt components and provide a pathway toward more compact and cost-effective heating components. By understanding the interplay between temperature, pressure, residence time, and nitrite formation, engineers can now identify critical influential parameters in order to optimize component size while ensuring safe and reliable operation.
The potential for substantial cost reduction in thermal energy storage systems through more compact heat transfer components has significant implications for the economic viability of concentrated solar power and other renewable energy technologies that rely on thermal energy storage. As we continue to refine the understanding of high-temperature molten salt behavior, these systems will become increasingly competitive in the global energy landscape, contributing to a more sustainable energy future.
Overall, this study represents an important step forward in pushing the operational limits of molten salt thermal energy storage systems, paving the way for next-generation designs that maximize efficiency and minimize costs while maintaining system integrity and longevity.
Author Contributions
Conceptualization, F.K. and T.B.; methodology, F.K.; software, F.K.; validation, F.K.; investigation, F.K.; writing—original draft preparation, F.K.; writing—review and editing, F.K. and T.B.; visualization, F.K.; supervision, T.B. All authors have read and agreed to the published version of the manuscript.
Funding
This project was funded by the German Federal Ministry for Economic Affairs and Energy under Grant No. 03EE5043.
Data Availability Statement
The raw data supporting the conclusions of this article will be made available by the authors on reasonable request.
Acknowledgments
Chemical salt analysis in laboratory was performed by Andrea Hanke (DLR Stuttgart) and is greatly appreciated.
Conflicts of Interest
The authors declare no conflicts of interest. The funders had no role in the design of the study; in the collection, analyses, or interpretation of data; in the writing of the manuscript; or in the decision to publish the results.
Abbreviations
The following abbreviations are used in this manuscript:
| CSP | Concentrated Solar Power; |
| TES | Thermal Energy Storage. |
References
- Stern, K.H. High Temperature Properties and Decomposition of Inorganic Salts Part 3, Nitrates and Nitrites. J. Phys. Chem. Ref. Data 1972, 1, 747–772. [Google Scholar] [CrossRef]
- Kelly, B.D. Advanced Thermal Storage for Central Receivers with Supercritical Coolants; Office of Scientific and Technical Information (OSTI): Oak Ridge, TN, USA, 2010; 184p. [Google Scholar]
- Kolb, G.J. An Evaluation of Possible Next-Generation High Temperature Molten-Salt Power Towers; Sandia National Laboratories: Albuquerque, NM, USA, 2011; 121p. [Google Scholar]
- Mahdi, Z.; Merige, P.S.; Caminos, R.A.C.; Schmitz, P.; Herrmann, U.; Boura, C.T.; Schmitz, M.; Gielen, H.; Gedle, Y.; Dersch, J. Modeling the thermal behavior of solar salt in electrical resistance heaters for the application in PV-CSP hybrid power plants. In Proceedings of the SOLARPACES 2020: 26th International Conference on Concentrating Solar Power and Chemical Energy Systems, Freiburg, Germany, 28 September–2 October 2020; AIP Conference Proceedings. AIP Publishing: Melville, NY, USA, 2022. [Google Scholar]
- He, X.; Wang, Y.; Ren, C.; Yu, L.; Hu, N.; Zheng, C.; Gao, X. Mitigation of the local overheating phenomenon in molten salt electric heaters through flow field optimization. J. Energy Storage 2024, 94, 112229. [Google Scholar] [CrossRef]
- Ma, L.; Zhang, C.; Wu, Y.; Lu, Y.; Ma, C. Dynamic corrosion behavior of 316L stainless steel in quaternary nitrate-nitrite salts under different flow rates. Sol. Energy Mater. Sol. Cells 2020, 218, 110821. [Google Scholar] [CrossRef]
- Kruizenga, A.; Gill, D. Corrosion of Iron Stainless Steels in Molten Nitrate Salt. Energy Procedia 2014, 49, 878–887. [Google Scholar] [CrossRef]
- Mehos, M.; Turchi, C.; Vidal, J.; Wagner, M.; Ma, Z.; Ho, C.; Kolb, W.; Andraka, C.; Kruizenga, A. Concentrating Solar Power Gen3 Demonstration Roadmap; Office of Scientific and Technical Information (OSTI): Golden, CO, USA, 2017; 140p. [Google Scholar]
- Rogers, D.J.; Janz, G.J. Melting-crystallization and premelting properties of sodium nitrate-potassium nitrate. Enthalpies and heat capacities. J. Chem. Eng. Data 1982, 27, 424–428. [Google Scholar] [CrossRef]
- Bonk, A.; Braun, M.; Sötz, V.A.; Bauer, T. Solar Salt—Pushing an old material for energy storage to a new limit. Appl. Energy 2020, 262, 114535. [Google Scholar] [CrossRef]
- Sötz, V.A.; Bonk, A.; Steinbrecher, J.; Bauer, T. Defined purge gas composition stabilizes molten nitrate salt—Experimental prove and thermodynamic calculations. Sol. Energy 2020, 211, 453–462. [Google Scholar] [CrossRef]
- Steinbrecher, J.; Bonk, A.; Sötz, V.A.; Bauer, T. Investigation of Regeneration Mechanisms of Aged Solar Salt. Materials 2021, 14, 5664. [Google Scholar] [CrossRef]
- Prieto, C.; Lopez-Roman, A.; Cabeza, L.F. Experimental evaluation of the thermal degradation of solar salt under different gas covers. J. Energy Storage 2023, 72, 108412. [Google Scholar] [CrossRef]
- Bonk, A. Thermal Energy Storage Using Solar Salt at 620 °C: How a Reactive Gas Atmosphere Mitigates Corrosion of Structural Materials. In SolarPACES Conference; German Aerospace Center: Albuquerque, NM, USA, 2022. [Google Scholar]
- Bonk, A.; Ding, W.; Hanke, A.; Braun, M.; Müller, J.; Klein, S.; Bauer, T. Effect of gas management on corrosion resistance in molten solar salt up to 620 °C: Corrosion of SS316-types and SS347. Corros. Sci. 2024, 227, 111700. [Google Scholar] [CrossRef]
- Kruizenga, A.M.; Kolb, W.; Briggs, R.J.; Christian, J.; Ray, D.; Gill, D.; Kelton, J.; Chisman, K. Loop for the Observation of Film Temperature Effects on Decomposition (LOFTED); SAND2014-18103; Sandia National Laboratories: Albuquerque, NM, USA, 2014. [Google Scholar]
- Roca Reina, J.C.; Volt, J.; Carlsson, J.; Dlugosz, M.; Georgakaki, A.; Ince, E.; Kuokkanen, A.; Letout, S.; Mountraki, A.; Shtjefni, D.; et al. Clean Energy Technology Observatory: Novel Thermal Energy Storage in the European Union—2023 Status Report on Technology Development, Trends, Value Chains and Markets; Publications Office of the European Union: Luxembourg, 2023. [Google Scholar] [CrossRef]
- Novotny, V.; Basta, V.; Smola, P.; Spale, J. Review of Carnot Battery Technology Commercial Development. Energies 2022, 15, 647. [Google Scholar] [CrossRef]
- Frantz, C.; Buck, R.; Röger, M.; Hoffschmidt, B. Experimental Analysis of Forced Convective Heat Transfer of Nitrate Salt in a Circular Tube at High Reynolds Numbers and Temperatures. Int. J. Heat Mass Transf. 2023, 201, 123563. [Google Scholar] [CrossRef]
- Dersch, J.; Paucar, J.; Polkas, T.; Schweitzer, A.; Stryk, A. Blueprint for Molten Salt CSP Power Plant Final Report of the Project “CSP-Reference Power Plant” No. 0324253. 2021. Available online: https://elib.dlr.de/141315/ (accessed on 5 May 2025).
- Drosatos, P.; Itskos, G.; Nikolopoulos, N. Cross-Cutting CFD Support for Efficient Design of a Molten Salt Electric Heater for Flexible Concentrating Solar Power Plants. Energies 2023, 16, 6403. [Google Scholar] [CrossRef]
- Du, B.-C.; He, Y.-L.; Wang, K.; Zhu, H.-H. Convective heat transfer of molten salt in the shell-and-tube heat exchanger with segmental baffles. Int. J. Heat Mass Transf. 2017, 113, 456–465. [Google Scholar] [CrossRef]
- Peters, M.S.; Timmerhaus, K.D.; West, R.E. Plant Design and Economics for Chemical Engineers; McGraw-Hill Education: New York, NY, USA, 2003. [Google Scholar]
- Pacheco, J.E.; Ralph, M.E.; Chavez, J.M.; Dunkin, S.R.; Rush, E.E.; Ghanbari, C.M.; Matthews, M.W. Results of Molten Salt Panel and Component Experiments for Solar Central Receivers: Cold Fill, Freeze/Thaw, Thermal Cycling and Shock, and Instrumentation Tests; SAND–94-2525; Sandia National Laboratories: Albuquerque, NM, USA, 1994. [Google Scholar] [CrossRef]
- Sötz, V.A.; Bonk, A.; Forstner, J.; Bauer, T. Microkinetics of the reaction NO3− ⇌ NO2− + 0.5 O2 in molten sodium nitrate and potassium nitrate salt. Thermochim. Acta 2019, 678, 178301. [Google Scholar] [CrossRef]
- Nissen, D.; Meeker, D. Nitrate/nitrite chemistry in sodium nitrate-potassium nitrate melts. Inorg. Chem. 1983, 22, 716–721. [Google Scholar] [CrossRef]


Disclaimer/Publisher’s Note: The statements, opinions and data contained in all publications are solely those of the individual author(s) and contributor(s) and not of MDPI and/or the editor(s). MDPI and/or the editor(s) disclaim responsibility for any injury to people or property resulting from any ideas, methods, instructions or products referred to in the content. |
© 2025 by the authors. Licensee MDPI, Basel, Switzerland. This article is an open access article distributed under the terms and conditions of the Creative Commons Attribution (CC BY) license (https://creativecommons.org/licenses/by/4.0/).