1. Introduction
The need to design energy-efficient buildings arises from current regulatory requirements. In European countries and many others, new regulations have introduced mandatory standards for nearly zero-energy buildings (nZEB) [
1]. The implementation of these standards is closely linked to successive revisions of the European Energy Performance of Buildings Directive (EPBD) [
2,
3,
4,
5]. In addition to minimizing energy consumption, reducing the environmental impact of buildings throughout their life cycle is essential [
6]. An equally important but often underestimated design criterion is user comfort. This aspect, although fundamental, is sometimes overshadowed by the focus on energy efficiency. The basics of studying thermal comfort were formulated in the 1970s by Fanger [
7].
Since then, research on thermal comfort has significantly evolved. In [
8], the authors reviewed developments in indoor thermal comfort research and practice since the late 1990s, highlighting two main areas: thermal comfort models and standardization, and the role of computerization in building performance assessment. Piasecki [
9,
10] demonstrated the practical application of an indoor environmental quality (IEQ) model for assessing both a retrofitted historical masonry building and a single-family building with near-zero energy consumption. Other studies [
11,
12,
13] analyzed features of the building envelope that strongly influence the summer indoor microclimate in low-energy buildings, introducing the concept of “passive overheating protection measures”. The adaptive comfort method was used as a criterion for evaluating indoor conditions, emphasizing the possibility of achieving comfort without mechanical cooling, thus reducing energy demand. Similar conclusions were reached in [
14], where the effectiveness of outdoor shading elements was investigated during the transitional season, showing that passive measures alone may not ensure comfort throughout the year and temporary mechanical conditioning may still be necessary. Mechanical air conditioning often causes uncomfortable draughts and increased air movement for users. Scientists have taken this aspect into account in their research [
15,
16]. Other studies [
17,
18] expanded the topic of thermal comfort to include indoor air quality aspects.
Waiting areas, commonly found in buildings such as office complexes, public administration facilities, transport terminals, or healthcare centers, are specific indoor environments that require careful provision of optimal user comfort. These spaces often accommodate large groups of visitors who remain there for extended periods. Occupants—frequently situated in relatively narrow and crowded waiting rooms—expect adequate comfort during their stay, including thermal, acoustic, and visual comfort, as well as good indoor air quality.
The design of nZEB buildings is based on integrated approaches that treat the building as a single system, aiming to ensure minimal energy consumption, reduced environmental impact, and maximum user comfort [
19]. Numerous studies have addressed renewable energy harvesting and storage [
20,
21,
22,
23], as well as intelligent HVAC systems [
24,
25,
26,
27], including active building envelope concepts [
28]. Thermal comfort and indoor air quality, especially important in crowded spaces vulnerable to overheating on sunny days, can be ensured through systems such as fan coil units (FCUs). FCUs, widely used in energy-efficient buildings, are flexible HVAC components capable of both heating and cooling. They consist of a fan and a heat exchanger, transferring heat between a circulating medium and indoor air [
29]. Modern FCUs can be equipped with humidification modules [
30], advanced control systems, and energy-efficient brushless motors. Thanks to the ability to locally and rapidly control thermal conditions in different zones of a building, FCUs align well with the concept of demand-driven energy management in nZEB buildings [
31,
32,
33]. These features make FCUs widely used in various types of buildings, including offices, hotels, schools, and residential facilities, across different climate regions [
34,
35,
36]. At the same time, FCUs fulfill distinct functions depending on the building type, reflecting the specific operational and comfort requirements of each environment [
37,
38]. In offices, FCUs prioritize local zone temperature control to ensure an efficient working environment; in hotels, they provide personalized comfort for guests while accommodating transient and highly variable occupancy; and in hospitals, they provide thermal comfort and enable infection-control measures to support patient well-being.
However, the localized air jet generated by FCUs may affect occupant comfort [
39]. Kiil et al. [
40] conducted a comparative analysis between office spaces cooled by FCUs and underfloor systems. The study found that FCUs produce rapid air jets, which may cause drafts. Similarly, Võsa et al. [
41] compared thermal comfort and cooling efficiency parameters in an office-like test environment for several systems: ceiling panels, underfloor cooling, fan-assisted radiators, and FCUs. Differences in comfort were quantitatively assessed by measuring both air velocity and operative temperature at the occupant level. The most effective systems in terms of cooling performance and occupant comfort were ceiling panels and fan-assisted units, followed by underfloor cooling. Due to high air velocities, FCUs did not provide thermal comfort across the entire occupied zone. For heating mode, similar findings were reported by Jahanbin [
42], who performed a CFD-based thermal comfort analysis of four heating terminals—FCU, fin radiator, floor radiation, and a coal stove wall heater—in a dormitory room model of 5 m × 4 m. After optimization of the PMV–PPD parameters, thermal conditions were maintained within the neutral comfort range; however, the uniformity of indoor air temperature varied significantly among the systems. In the room where the FCU was installed, higher air temperatures occurred along the direction parallel to the air outlet, while other areas remained relatively cool. The sensation of air movement was strong, particularly at the head level (1.7 m), leading to local discomfort. Consequently, the FCU provided the lowest overall thermal comfort among the analyzed heating terminals. Furthermore, Semprini et al. [
43] conducted a CFD-based thermal comfort analysis of a university office equipped with an FCU terminal. Their findings showed that even if the air temperature in the room is spatially uniform, operative temperature may vary significantly due to window surface temperature (radiant asymmetry) and the relative position of the FCU with respect to occupant locations.
The phenomenon of discomfort caused by excessive air movement is particularly relevant in office waiting areas, where visitors are typically seated or standing for extended periods and have limited ability to avoid localized air jets. For building staff, by contrast, these zones often serve as transitional or multifunctional spaces used for short meetings, visitor reception, or brief work tasks. Unlike typical workstations in office environments, occupants of waiting areas generally have limited control over the indoor conditions (e.g., opening windows or adjusting HVAC settings). Consequently, in such environments, localized air jets and uneven or fluctuating thermal conditions—often resulting from intermittent operation of the FCU—may significantly affect occupants’ perceived comfort.
Thermal comfort in office buildings has been widely investigated across many studies. Lamsal et al. [
44] conducted a comprehensive literature review of adaptive thermal comfort studies in office buildings worldwide, analyzing the temperature ranges considered acceptable by occupants under different climatic and ventilation conditions. In a related context, Barbadilla-Martín et al. [
45] highlighted the increasing importance of HVAC control strategies in such buildings, primarily due to their impact on both user comfort and energy efficiency. However, there is a clear predominance of studies focused on long-term occupied office rooms, while short-term occupancy spaces—such as waiting areas—remain noticeably underrepresented in the literature.
Recent studies have increasingly emphasized the importance of maintaining thermal comfort in waiting areas. One of the commonly investigated environments is high-speed railway station waiting halls. For example, Huang and Lin [
46] analyzed the thermal environment in such a facility located in a severely cold region of China, combining subjective surveys with field measurements. They found that while most passengers tolerated short-term fluctuations in air temperature and velocity, humidity was a major source of discomfort, with 25.4% of respondents reporting low tolerance. Similarly, Zhou et al. [
47] proposed an adaptive zonal ventilation control strategy based on real-time occupancy, achieving a 28% reduction in fan energy consumption and improved comfort by minimizing uneven temperature distribution. Extending this perspective, Du et al. [
48] examined the interaction between thermal, visual, and acoustic conditions in comparable waiting halls through field and VR-based studies. Their findings demonstrated that comfort perception is shaped not by single parameters but by the interaction of multiple factors, such as temperature, illuminance, and sound pressure, which are often interrelated. This multidimensional perspective is echoed in healthcare environments. Bazley et al. [
49] demonstrated that in hospital waiting rooms, users’ expectations and spatial arrangements significantly affect comfort perception, while Peng et al. [
50] showed that standard PMV models overestimate thermal sensation for pregnant women, indicating the need for user-specific comfort thresholds. Complementary findings by Ismayadi et al. [
51] revealed that comfort perception in healthcare waiting areas is shaped not only by thermal parameters but also by architectural, social, and cognitive factors. Beyond these sector-specific studies, Hou [
52] conducted an extensive investigation of indoor transitional spaces—including corridors, reception zones, and other semi-transient zones—highlighting their hybrid character between circulation and stationary functions. The research demonstrated that such environments exhibit highly variable comfort dynamics driven by intermittent occupancy, local air velocity variations, and short-term exposure. Collectively, these studies underline that waiting areas represent a specific challenge for HVAC design. Although they are often perceived as transitional spaces with short-term occupancy, users’ limited ability to modify their position or activity makes them particularly vulnerable to thermal discomfort, air jet, fluctuating environmental conditions, and even psychosocial stressors.
In summary, most existing thermal comfort research in buildings has focused on spaces designed for long-term occupancy—such as offices, classrooms, or residential rooms [
12,
14,
44]—while semi-transient zones, including waiting areas, have received considerably less attention. Despite their growing importance in modern offices and public-service buildings, thermal comfort in waiting areas remains insufficiently explored, particularly in the context of nZEB office environments. Similarly, although FCUs are widely used in energy-efficient buildings, little is known about their localized impact on comfort in such semi-transient zones. Preliminary interviews with users of waiting areas in buildings equipped with FCUs also indicated discomfort associated with perceived drafts and temperature fluctuations, highlighting the need for a more detailed investigation.
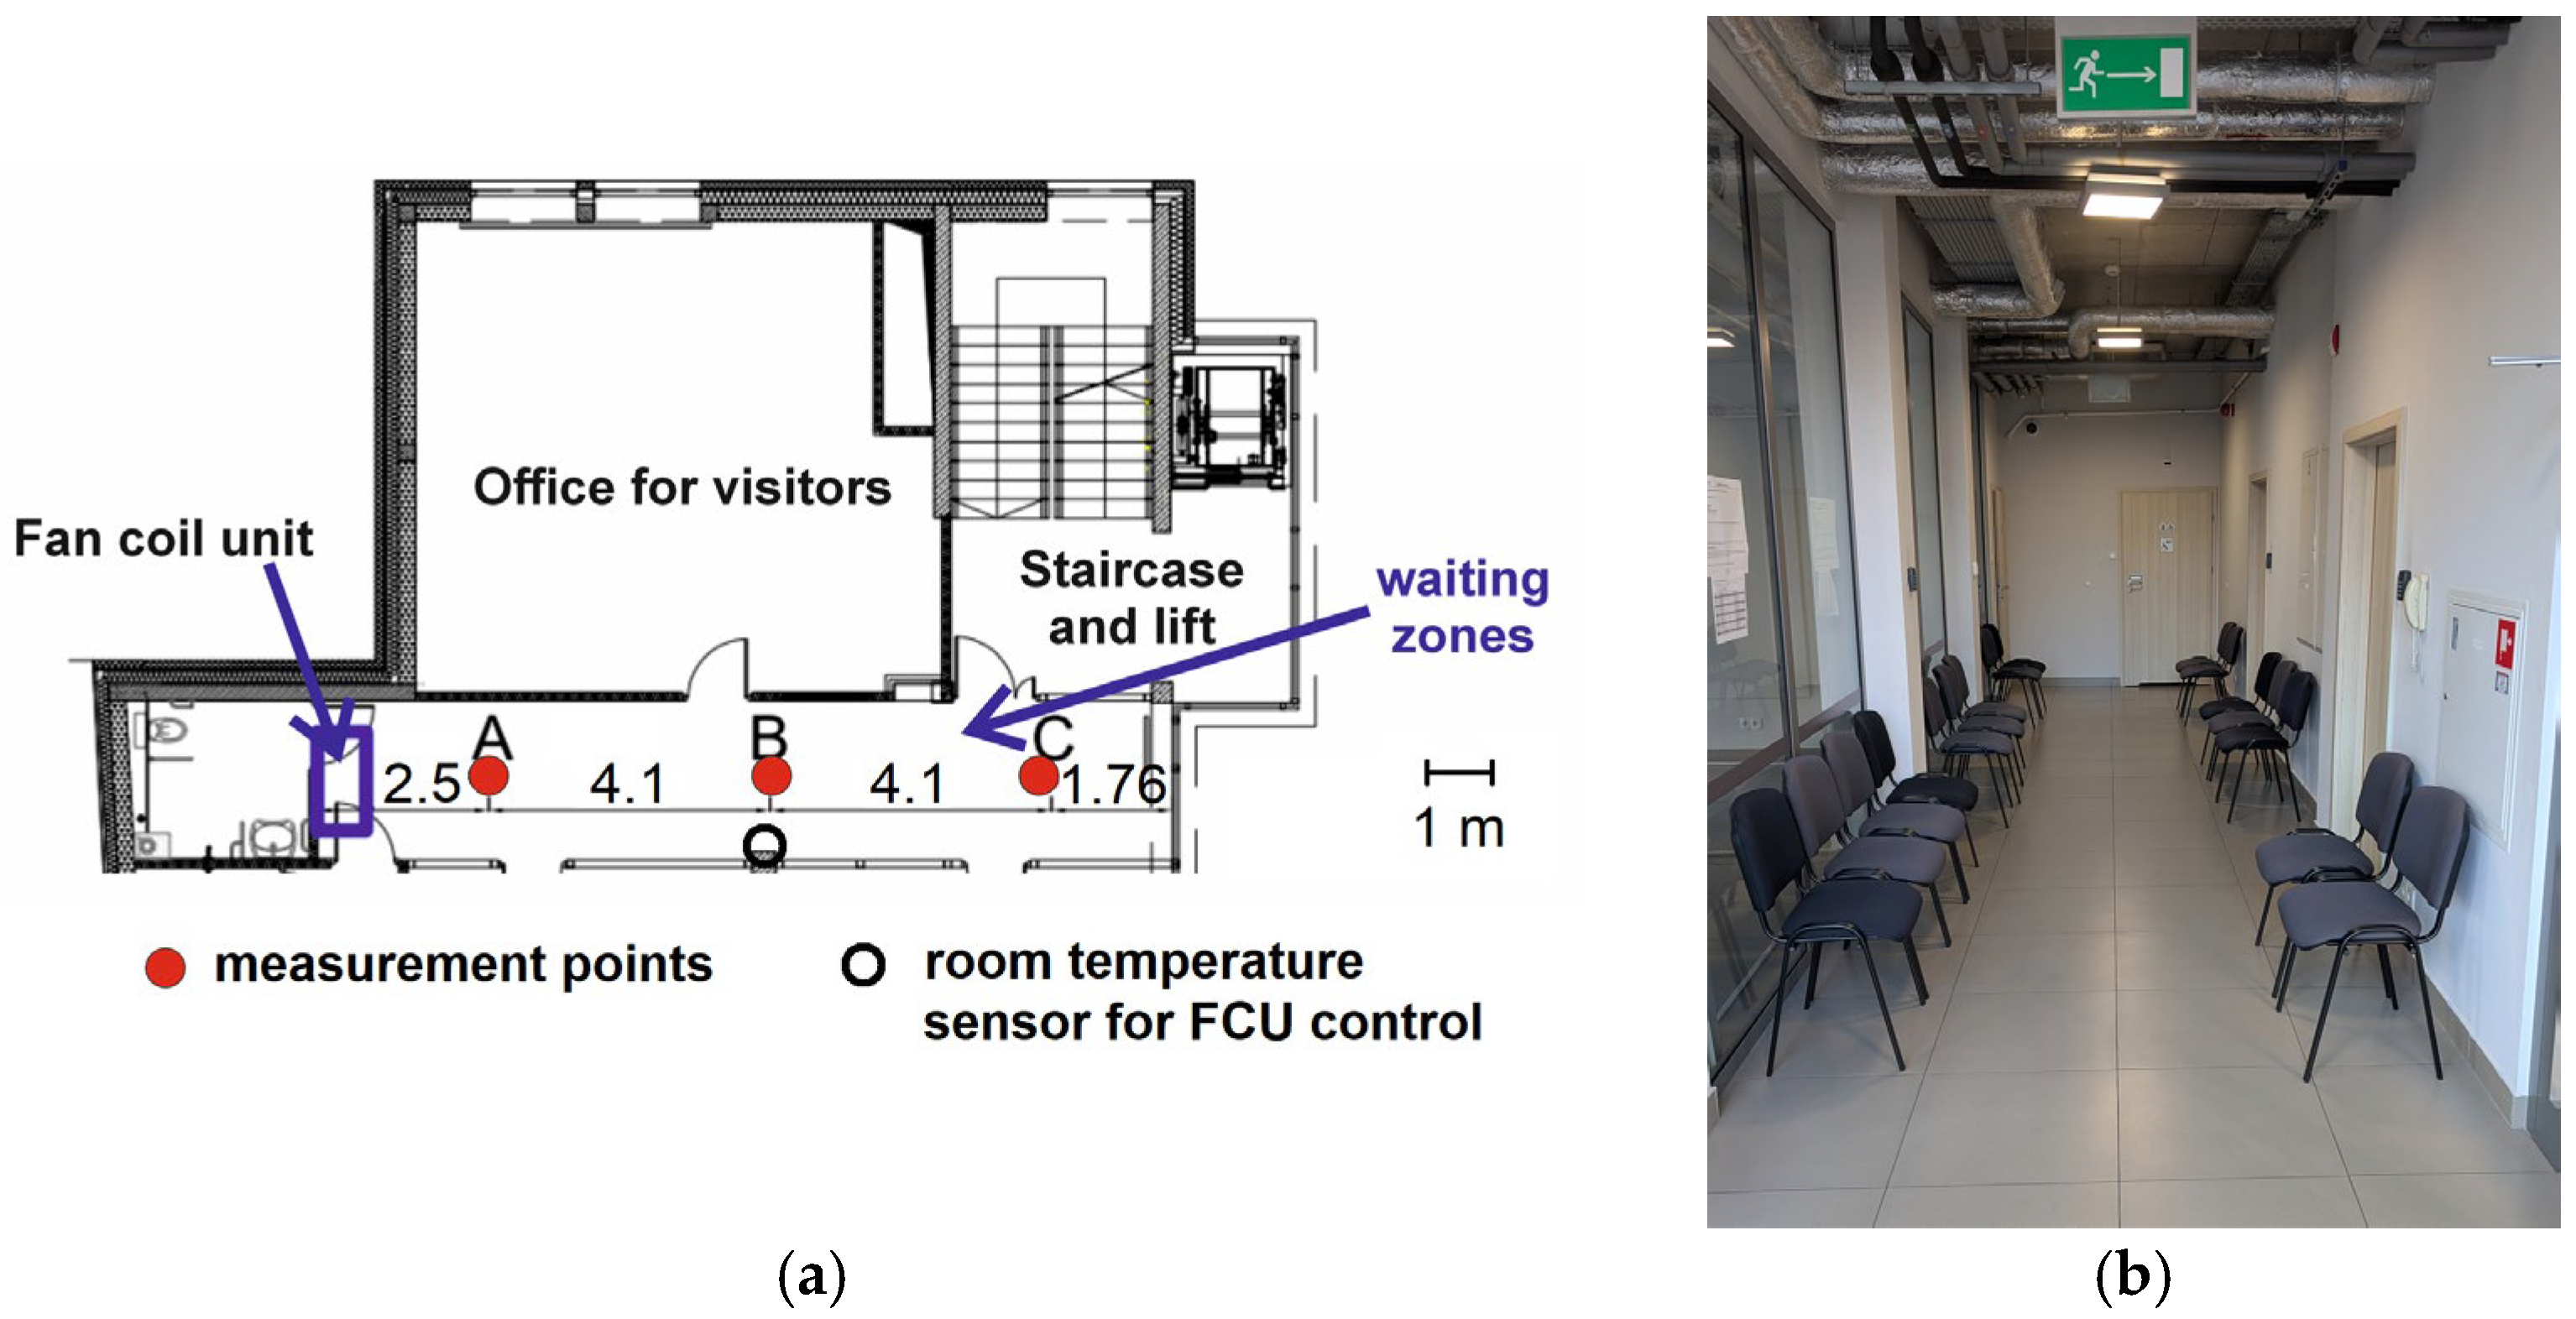
To address this research gap, the present study experimentally investigates thermal comfort conditions in an office waiting area of a modern nZEB equipped with a ceiling-mounted FCU operating in heating mode. This study links measured microclimatic parameters with subjective comfort perception to evaluate how FCU operation influences occupant experience. Specifically, the objectives are as follows:
- (1)
To determine the spatial distribution of thermal comfort parameters using the PMV and PPD indices;
- (2)
To assess the influence of FCU operation on occupant-perceived comfort based on short interviews;
- (3)
To propose HVAC control strategies that improve occupant comfort without compromising energy efficiency.
3. Results
3.1. Fan Coil Unit OFF Mode
In the OFF mode, the FCU was turned off.
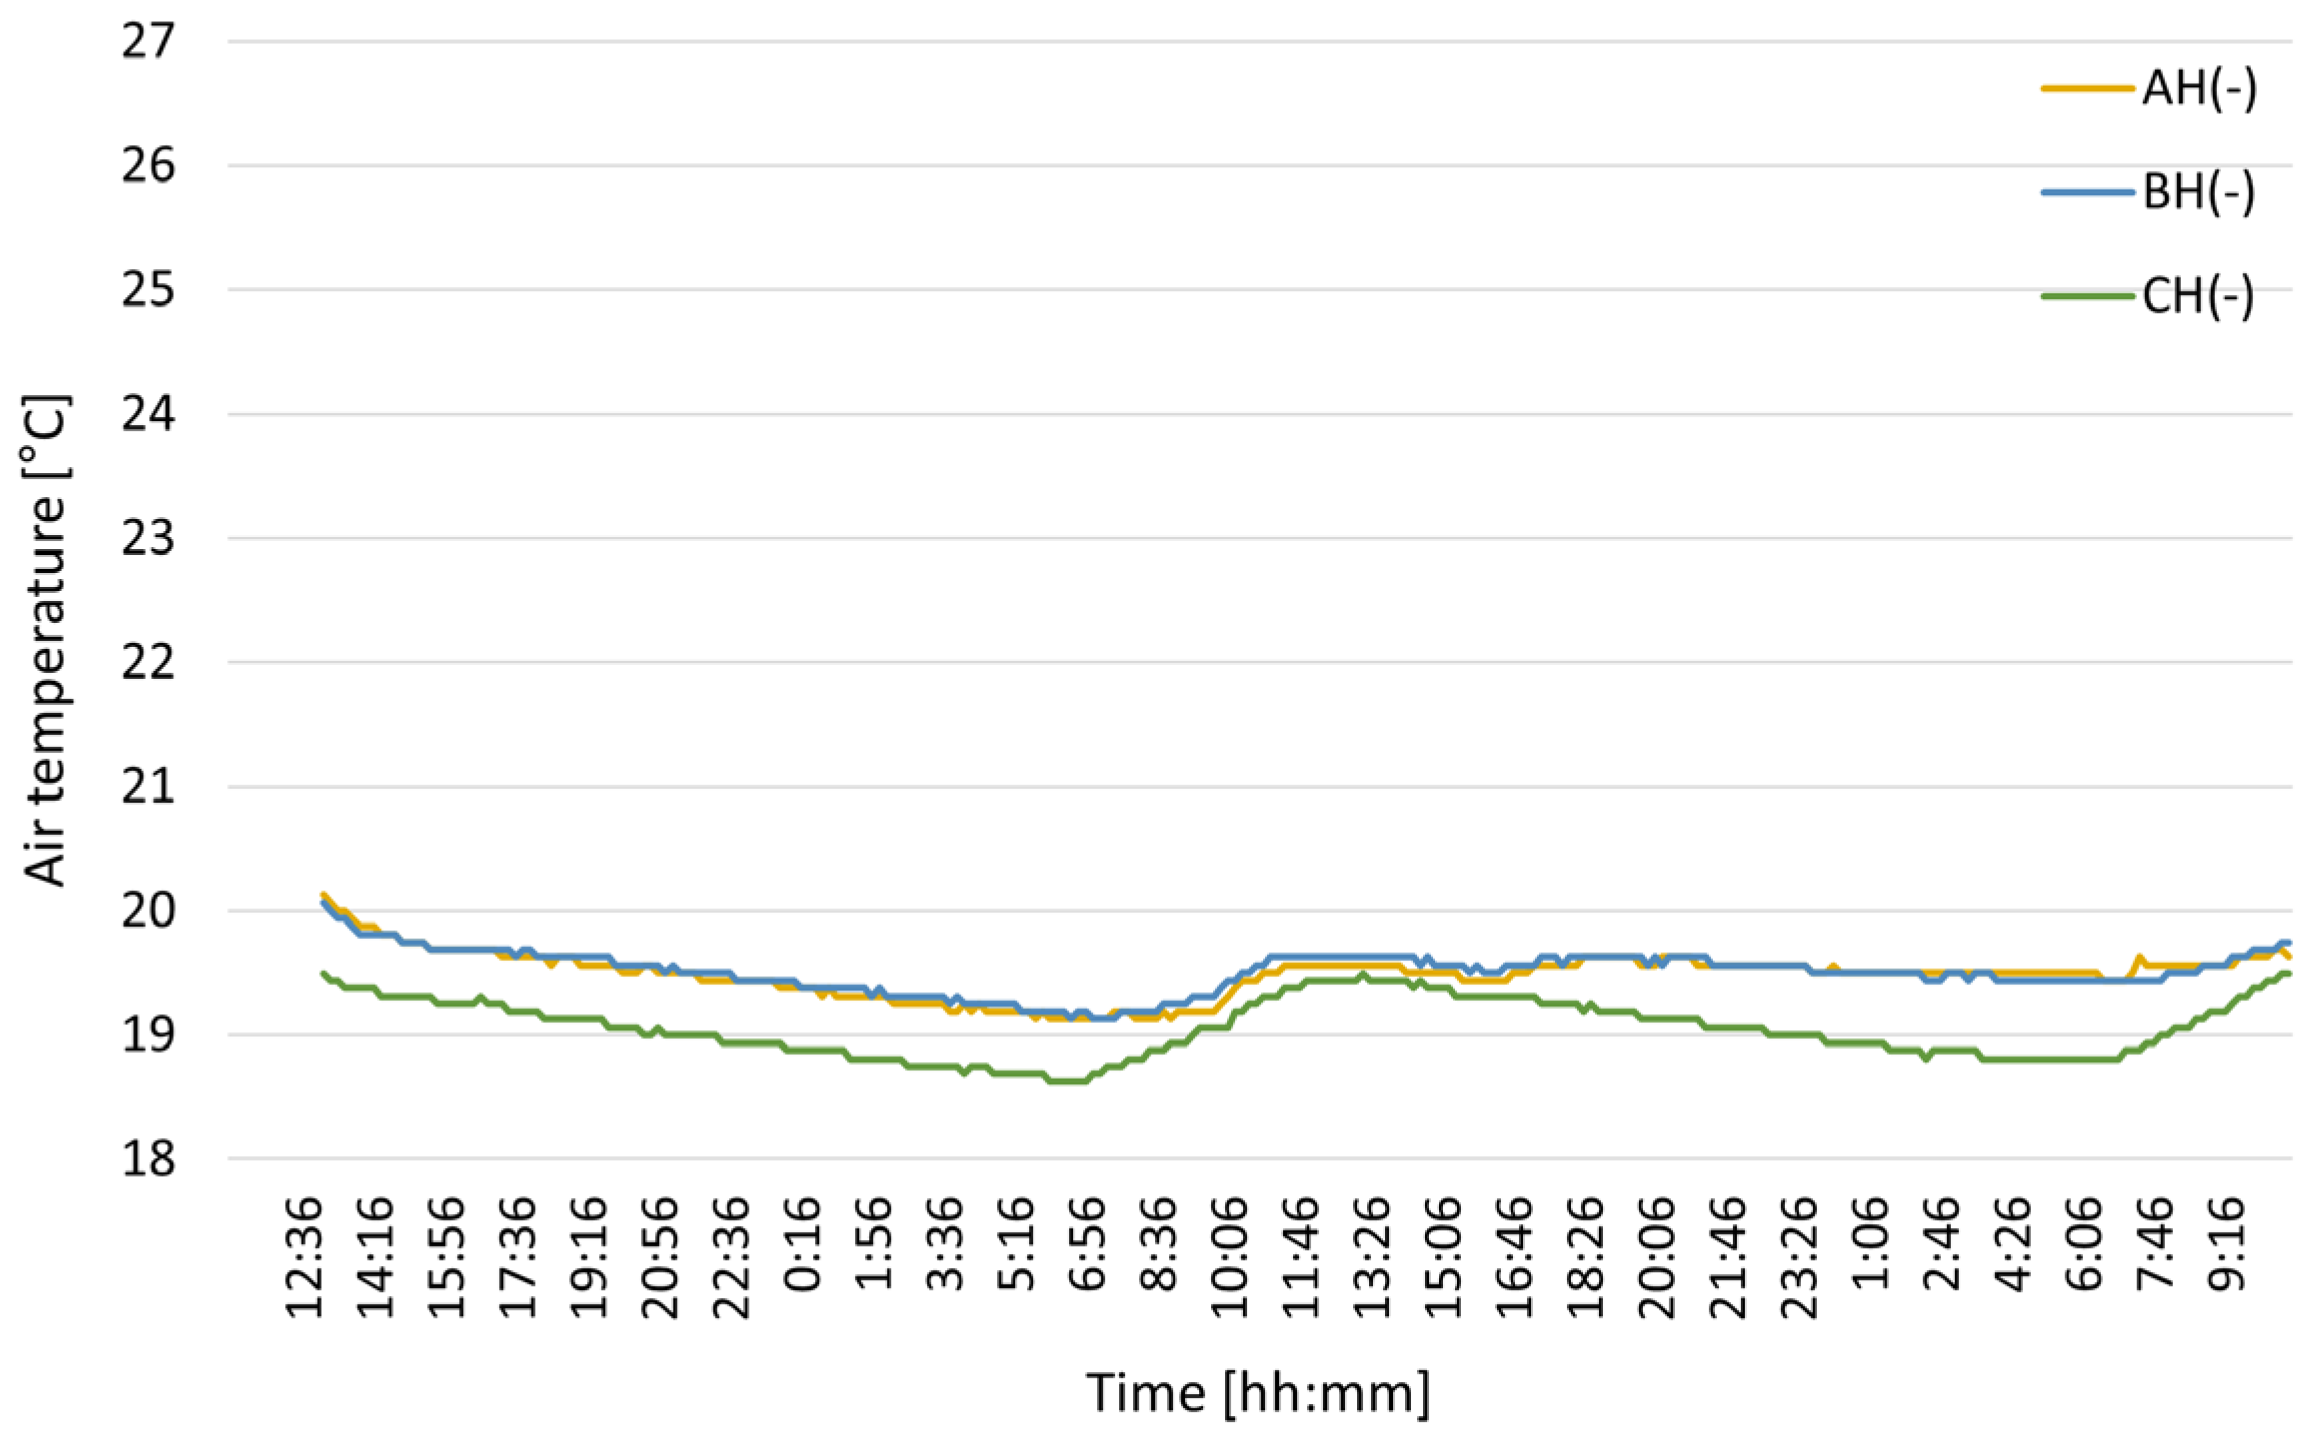
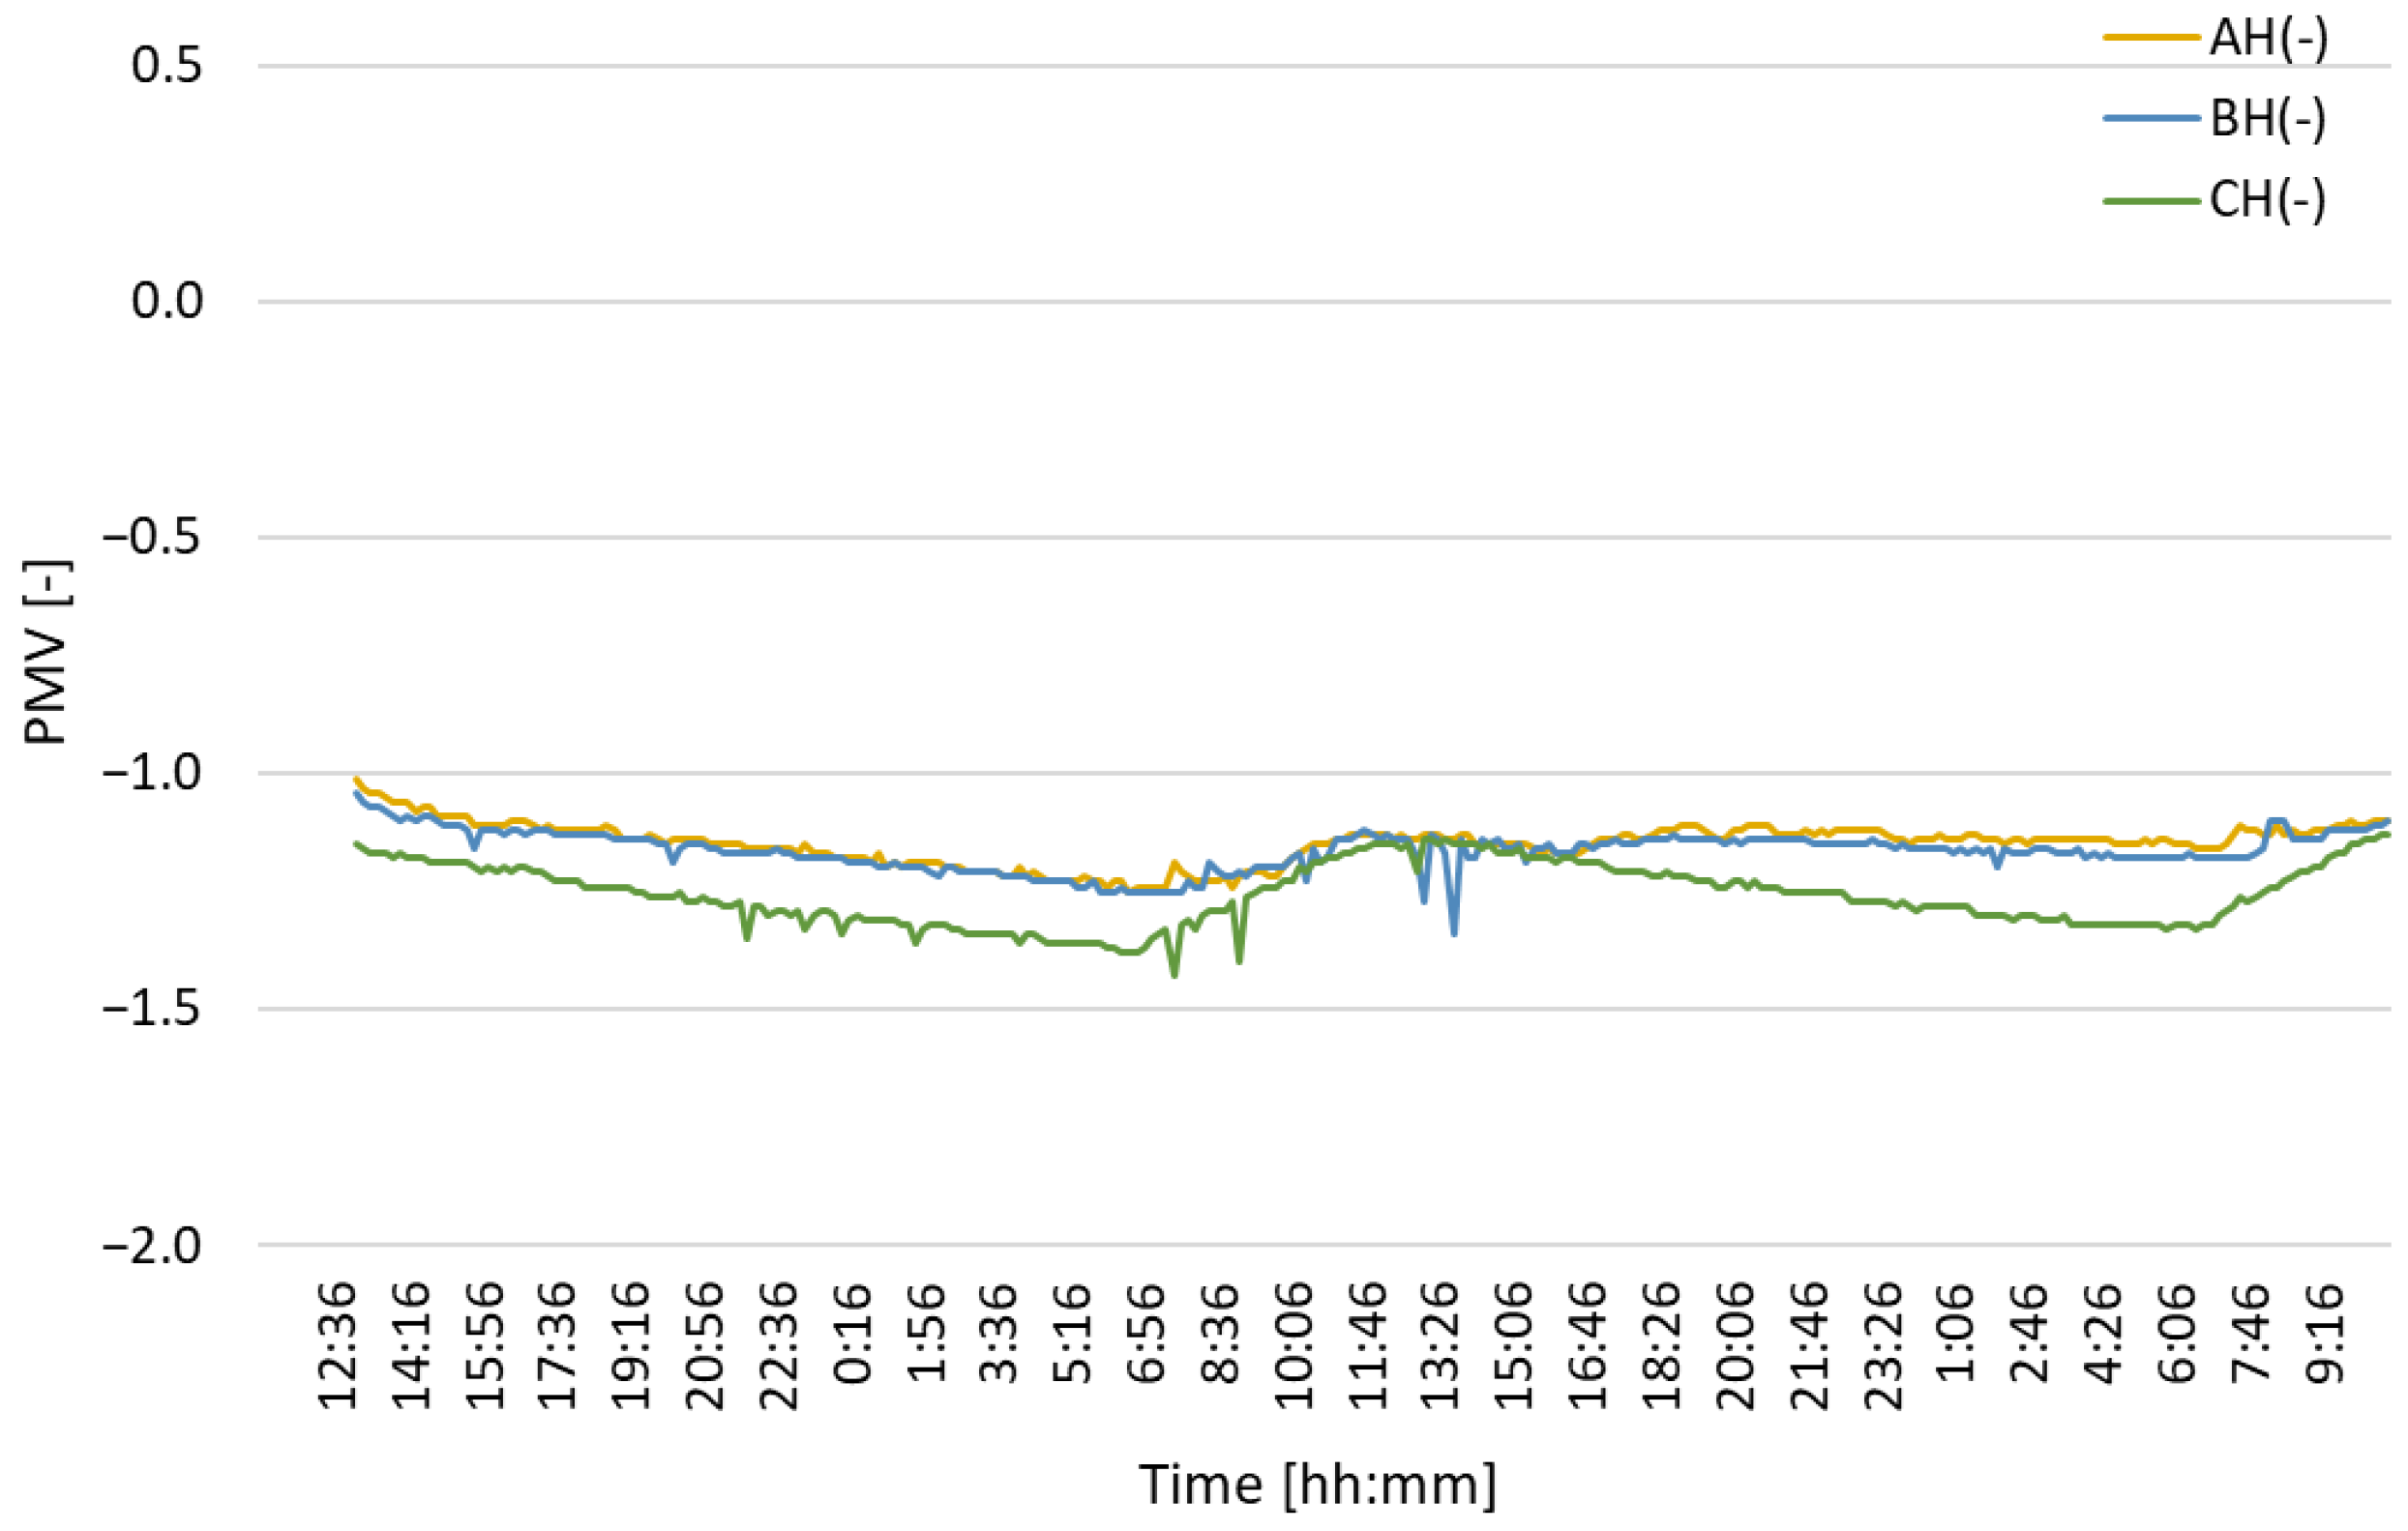
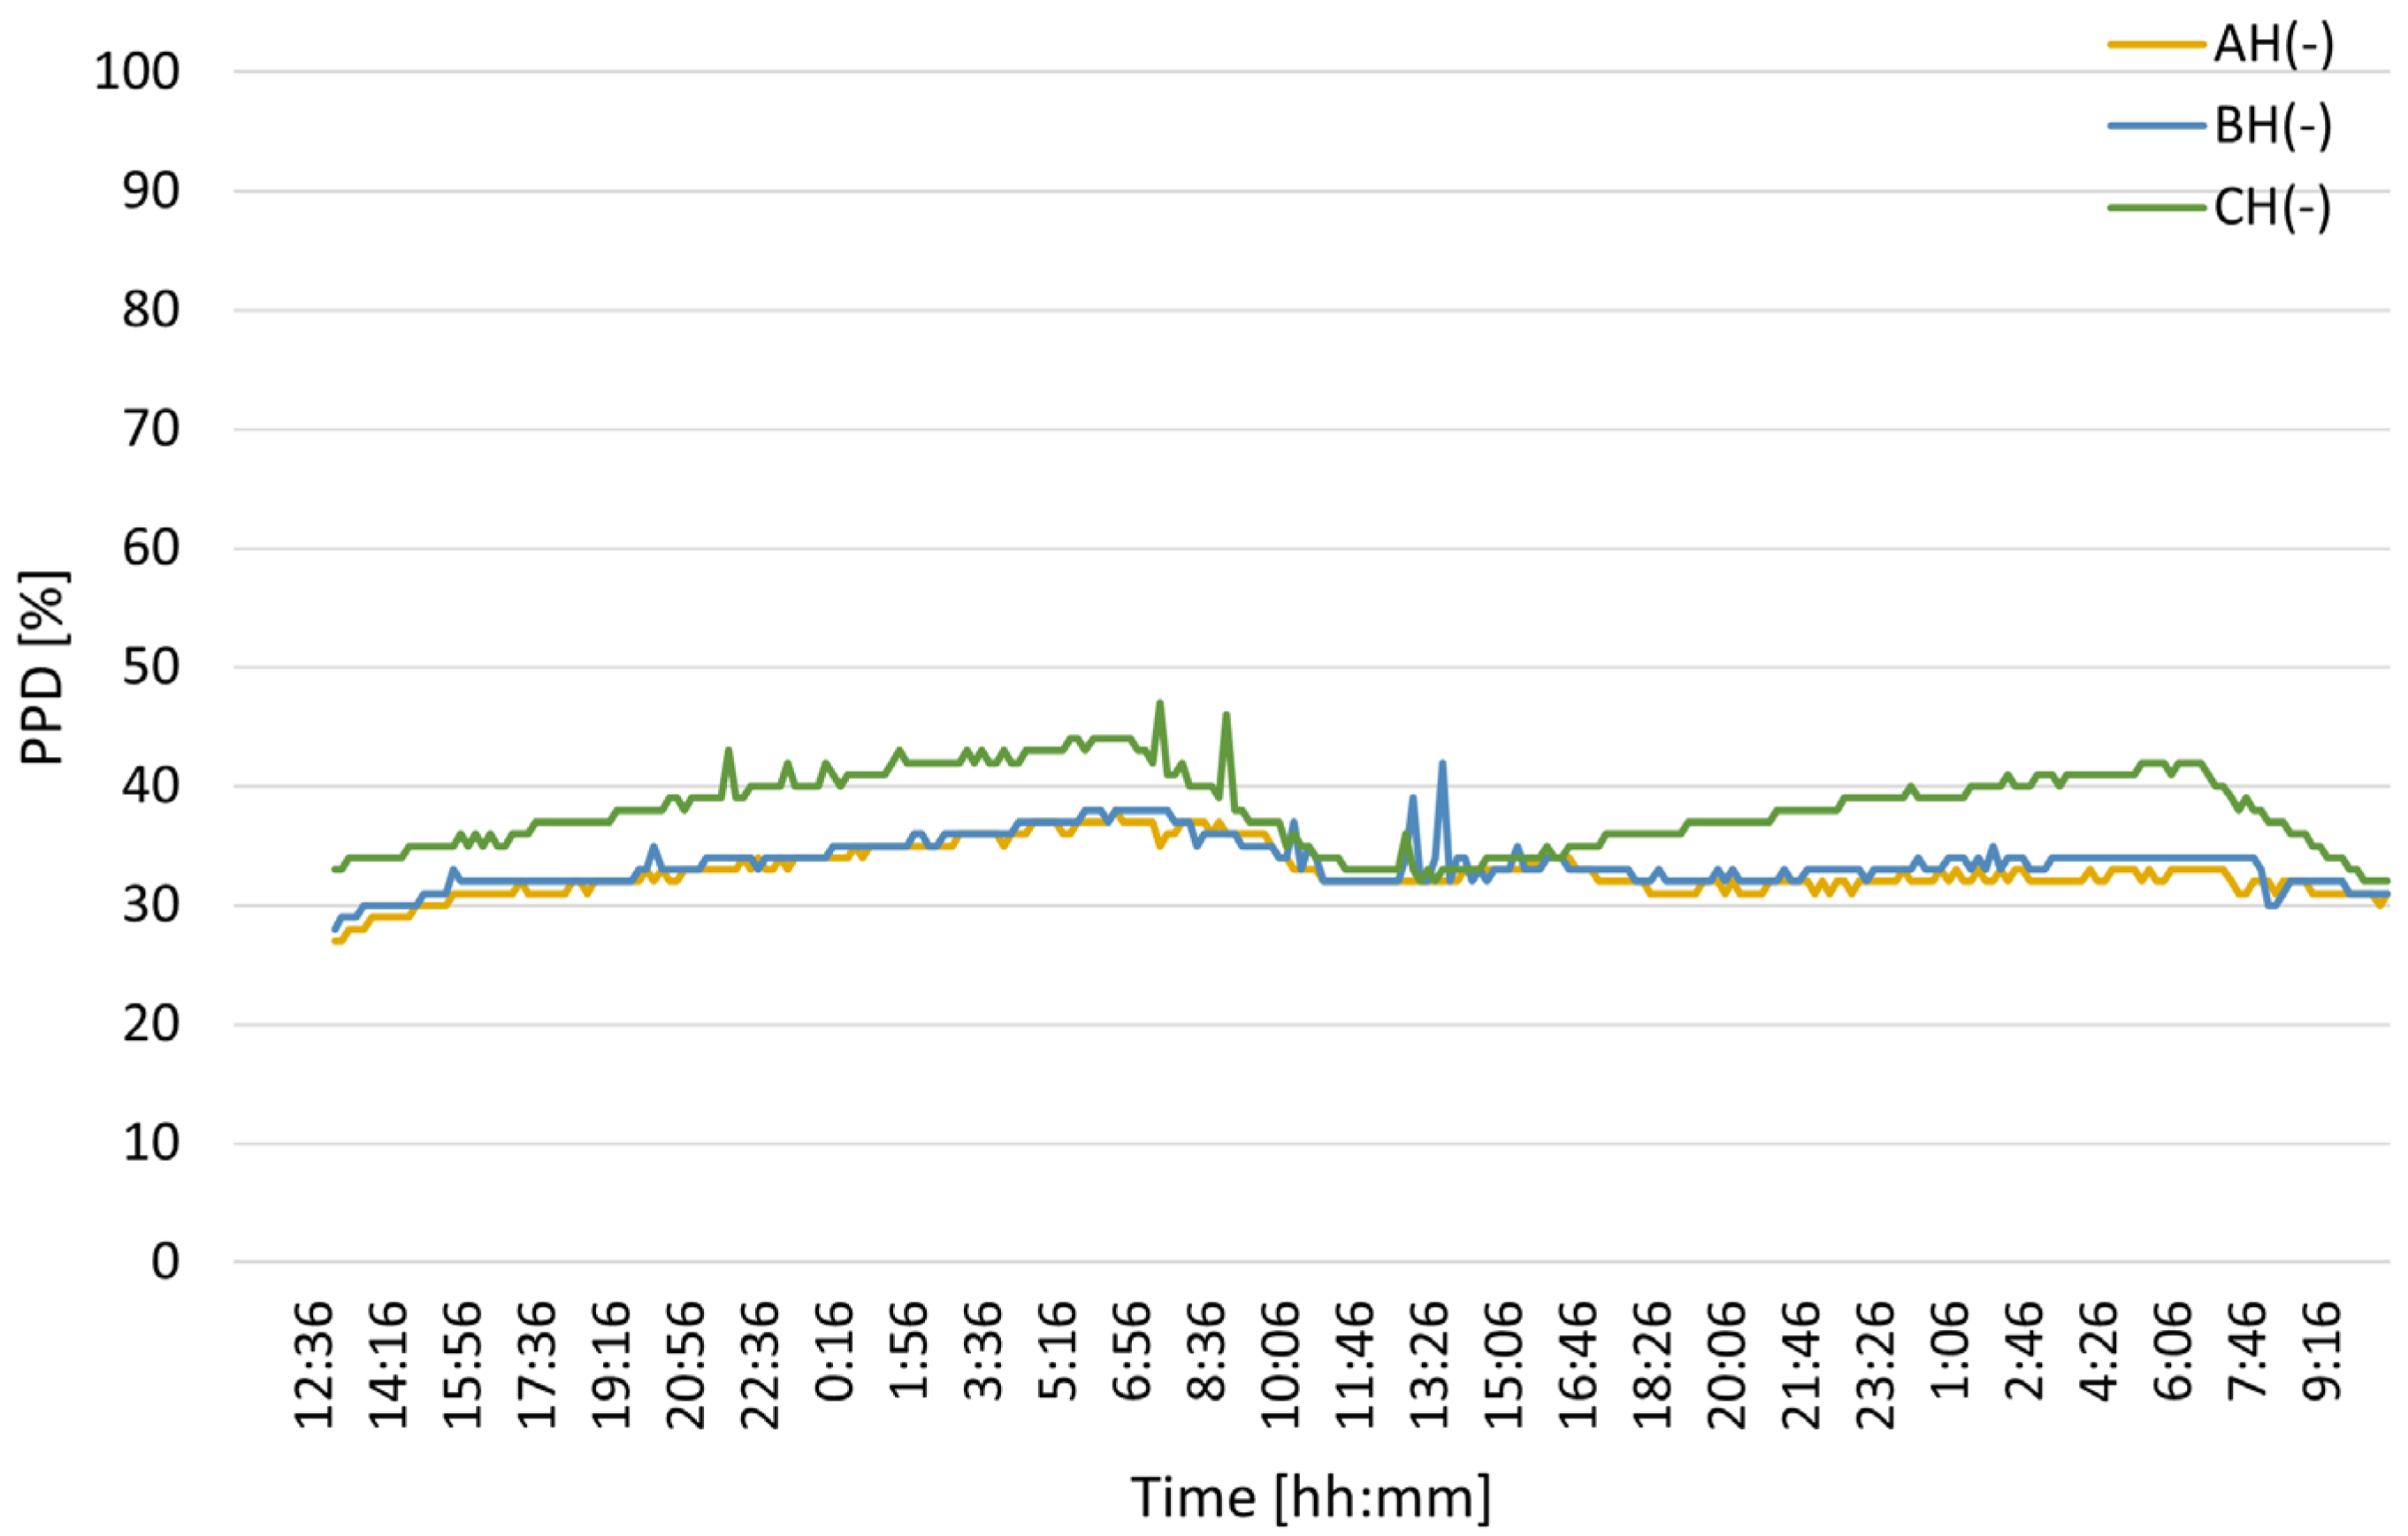
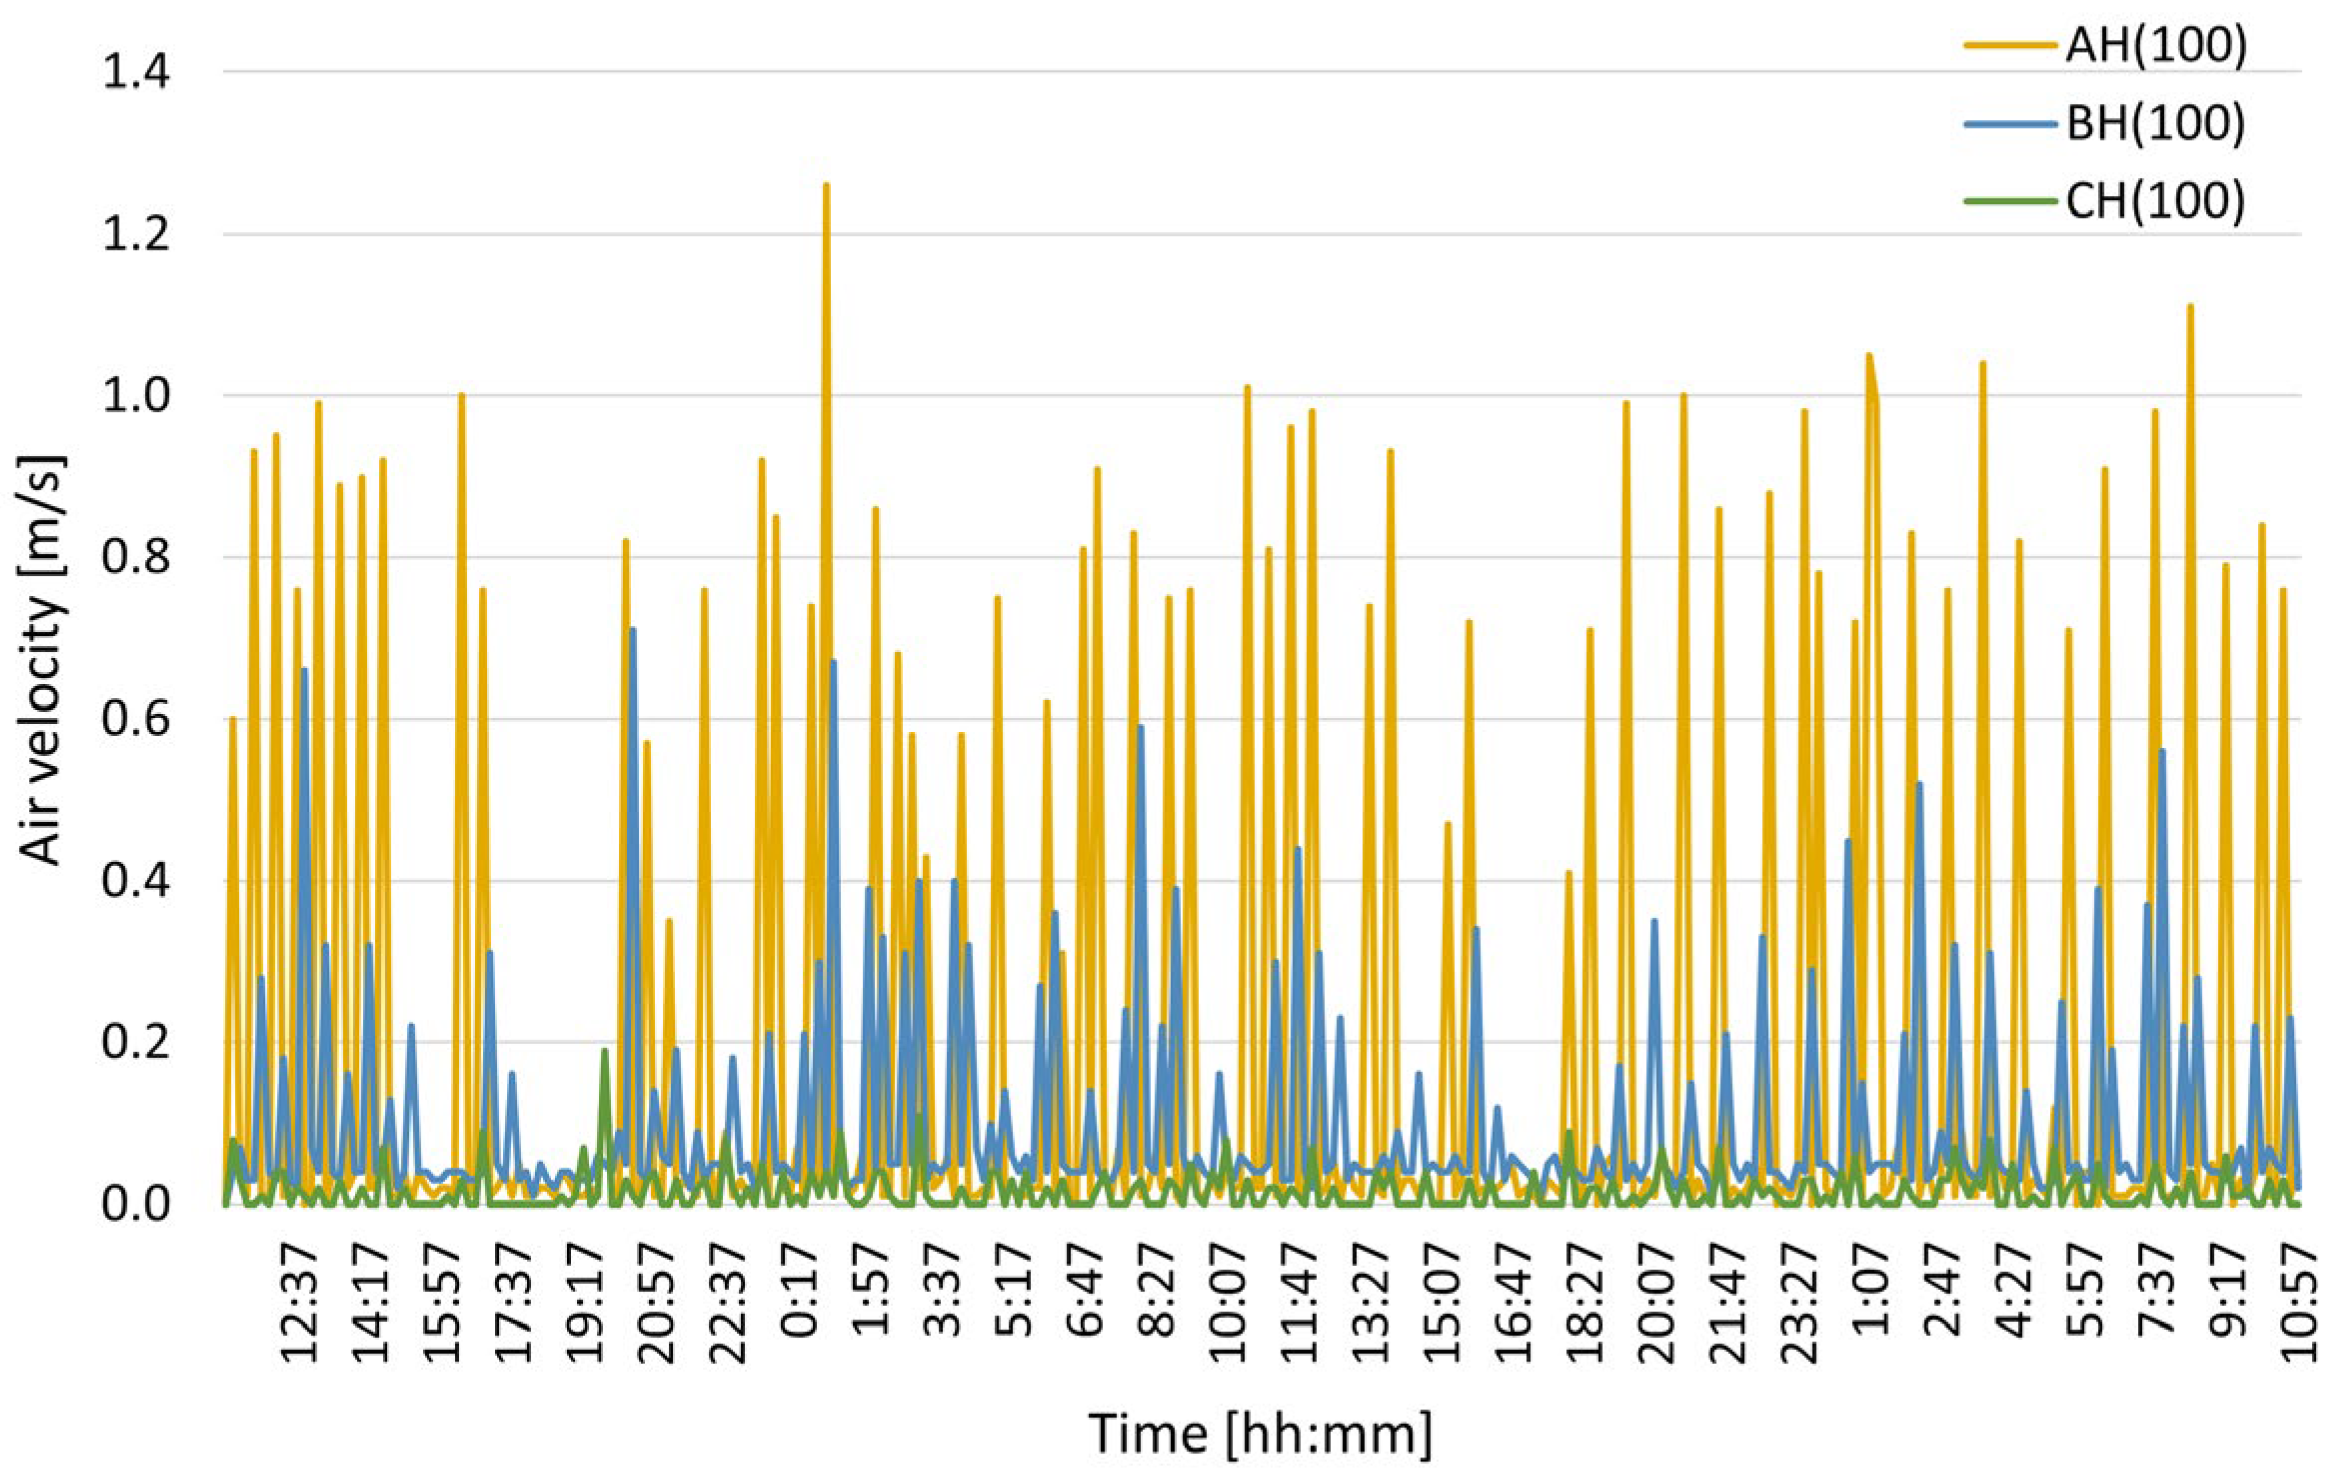
Figure 6,
Figure 7,
Figure 8 and
Figure 9 show, respectively, temperatures, air velocities, PMV and PPD indices recorded at points A, B, C, at 1.7 m level.
In the OFF mode, due to the absence of active heating, the air temperature generally did not exceed 20 °C. With no forced airflow from the FCU, the air velocity remained below 0.1 m/s at all measurement points. However, the air velocities are not constant and differ in values at measurement points A, B, and C. The thermal comfort index PMV ranged between −1.43 < PMV < −1.01, indicating a thermal state between “cool” and “cold” (according to ISO 7730 [
56]). The PPD index indicates that there will be between 27% and 47% of dissatisfied people with the prevailing conditions. Therefore, the room conditions are outside the classification limits of indoor environment categories defined in EN 16798 [
58]. The most significant deviations from optimal conditions, confirmed by the largest number of dissatisfied is attributed to point C, located closest to the glass facade. This location has the lowest recorded temperatures, too low to provide thermal comfort for occupants. The results characterize the condition of an unheated room in which the thermal environment is shaped primarily by passive factors—the supply of tempered ventilation air, heat exchange with adjacent rooms in both horizontal and vertical planes, and dynamic external atmospheric influences transmitted through the building envelope. This configuration leads to uneven temperature distribution and locally reduced comfort, particularly in zones exposed to the façade, where thermal losses are most pronounced.
3.2. Fan Coil Unit ON Mode
In the ON mode, the FCU’s fan operated at 100% capacity during periods of heating demand in the room.
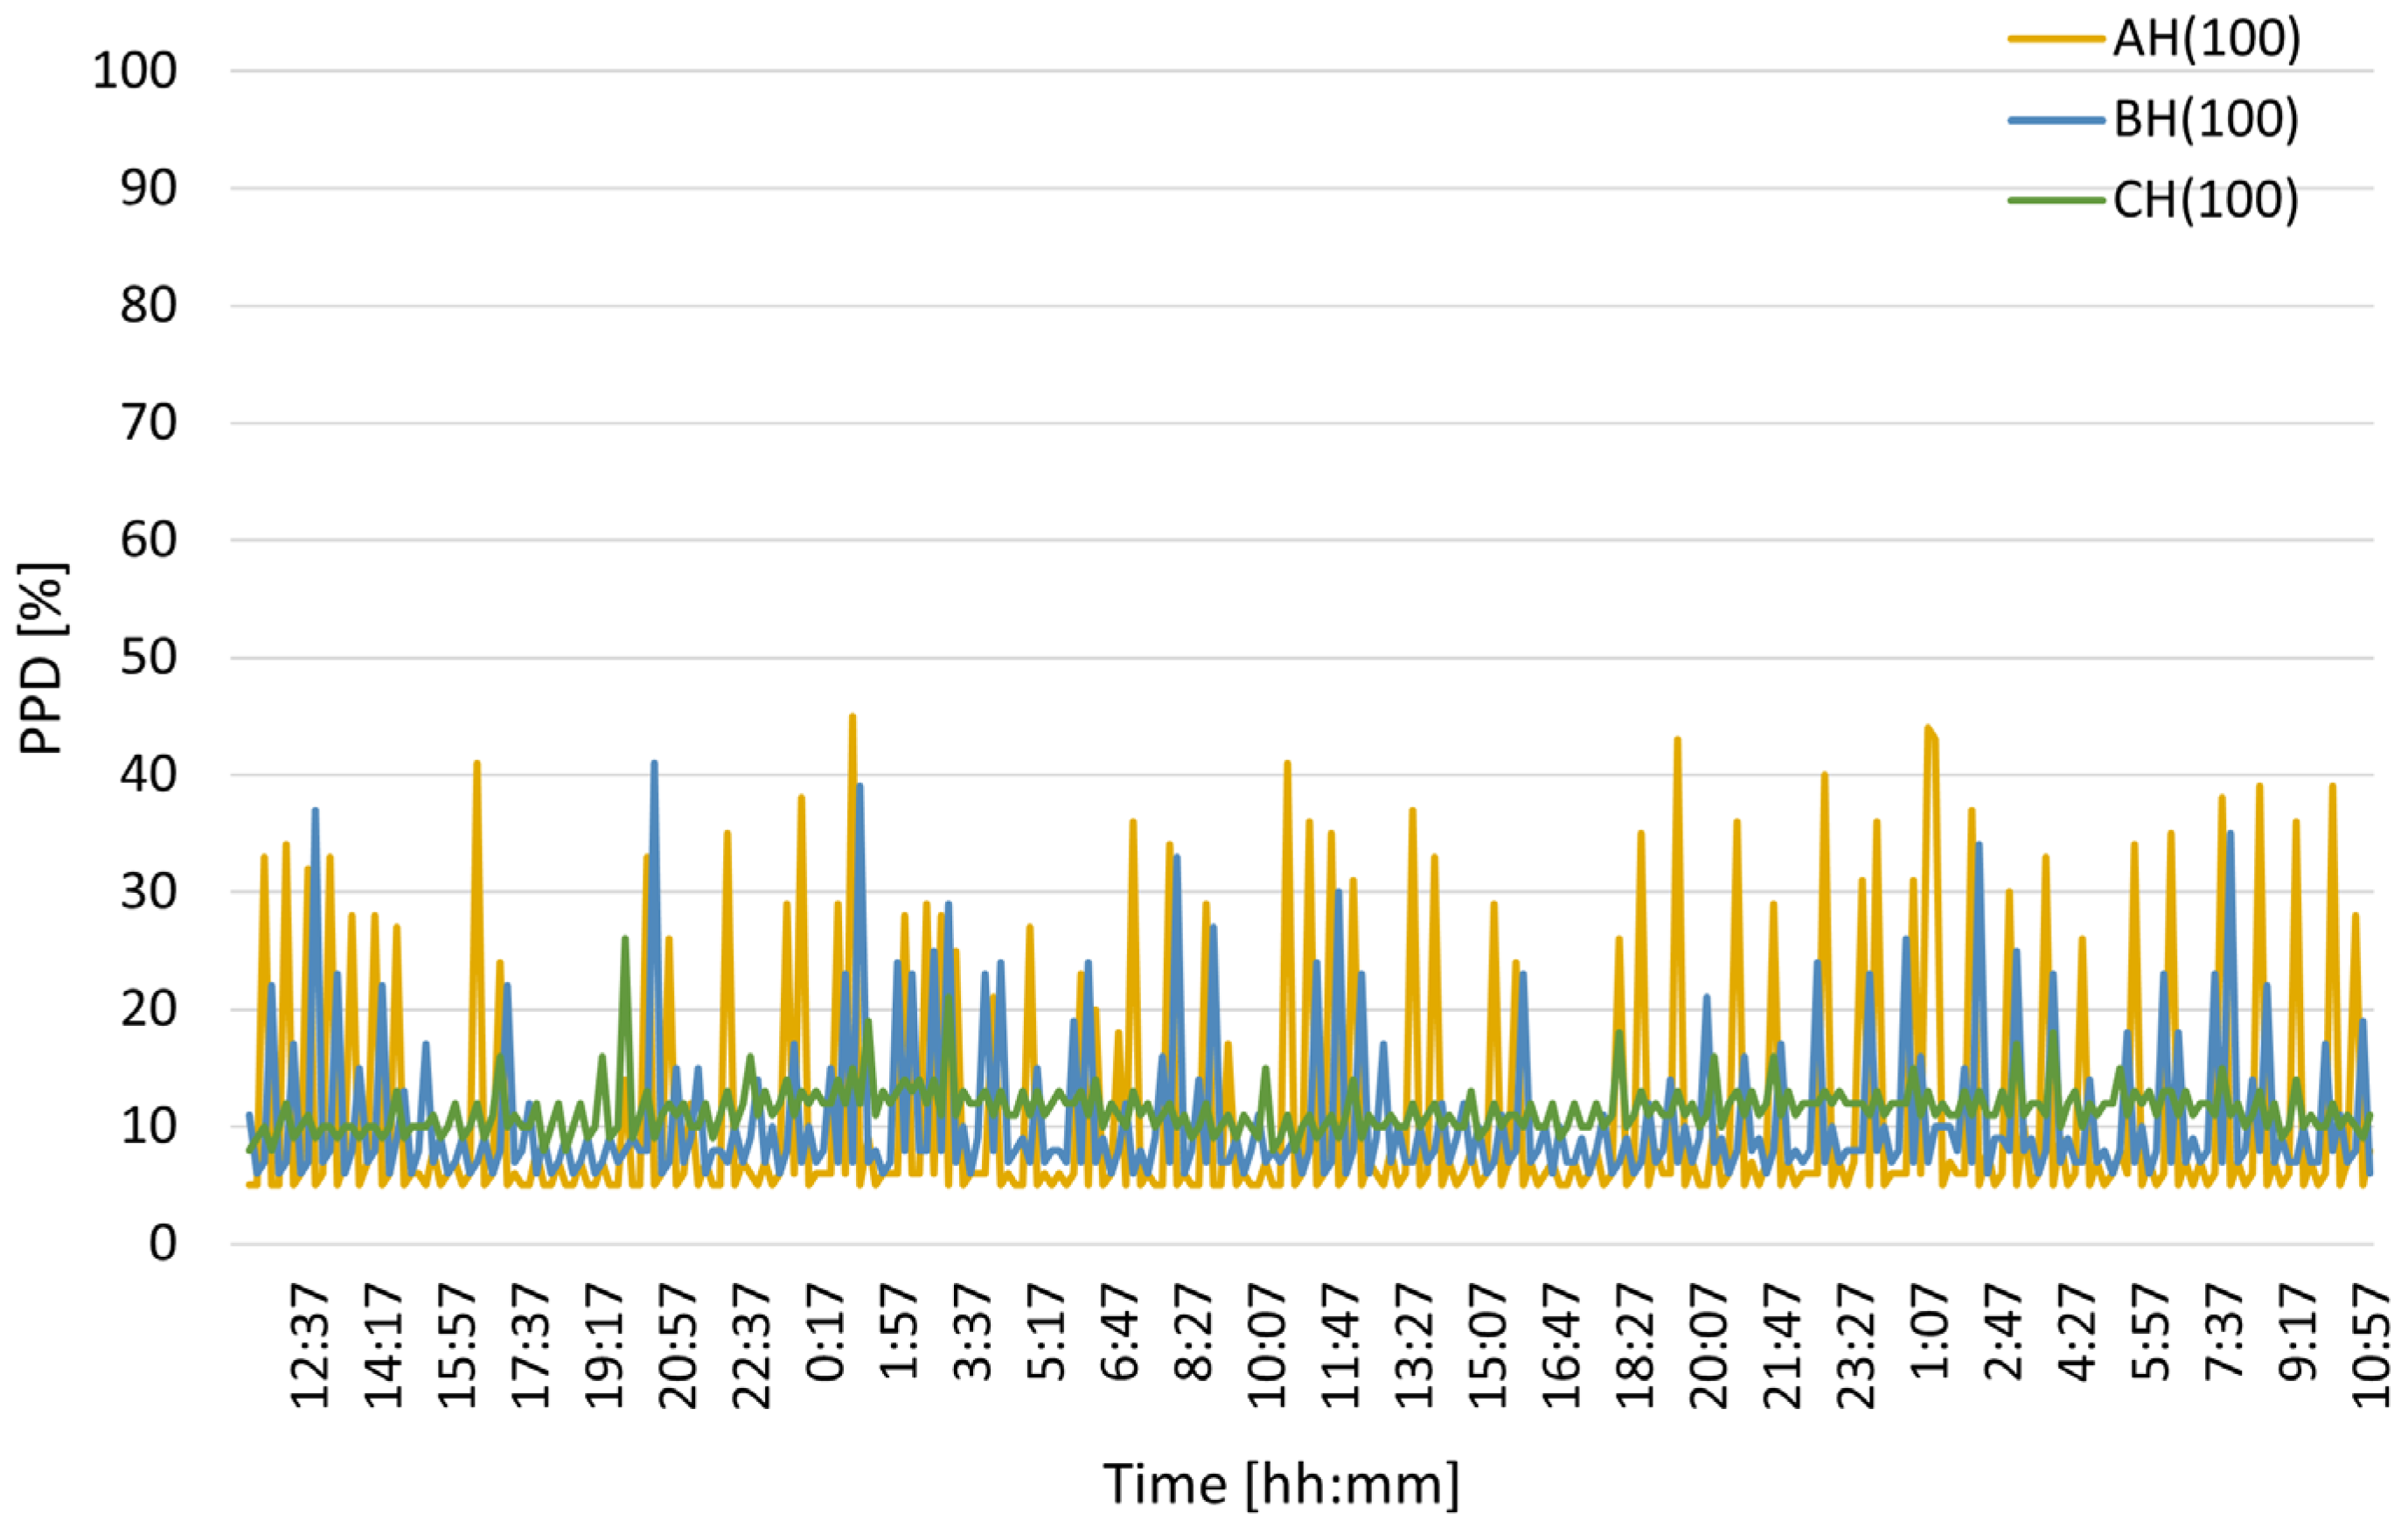
Figure 10,
Figure 11,
Figure 12 and
Figure 13 show, respectively, temperatures, air velocities, PMV and PPD indices recorded at points A, B, C, at 1.7 m level in the ON mode.
In the ON mode, an increase in average air temperature was observed with increasing distance from the window and decreasing distance to the FCU. This pattern reflects the combined influence of moving away from the cooling effect of the glazed façade and approaching the main heat source. The temperature profiles shown in
Figure 10 clearly illustrate the principle of the applied automatic temperature regulation method using the FCU in ON mode. Alternating heating phases—resulting from the unit’s operation—and subsequent natural cooling of the room are clearly visible. The associated temperature fluctuations were most pronounced near the FCU, where the unit’s periodic operation produced the strongest transient heating effect. Based on the 1 min BMS data, the FCU was active for 22.4% of the analyzed period.
The control system was set to maintain a target temperature of 22 °C, measured by the wall-mounted sensor, which—as shown in
Figure 10—approximately corresponded to the average temperature recorded by the microclimate sensors at point C. However, at points A and B, the measured temperatures significantly exceeded this value. At point A, temporary temperature peaks above 25 °C indicated that the FCU control logic, driven by data from the wall-mounted sensor, led to local overheating. At point B, located closest to the wall-mounted sensor, the average temperature was about 1 °C higher than the setpoint. This discrepancy was likely caused, among other factors, by the thermal influence of the column on which the sensor was mounted and by the lower accuracy class of the wall sensor compared to the precision microclimate sensors. In this case, applying a downward offset of approximately 1 °C to the wall sensor reading would allow the control system to better maintain the desired average room temperature.
Air velocity measurements revealed substantial spatial variation: at point A, located directly beneath the FCU, peak velocities reached 1.26 m/s, while at the most distant point, values did not exceed 0.19 m/s. The authors are aware of the limitations of the applicability of the PMV model to air velocity of 1 m/s. In this study, higher readings represented only 1.8% of all data and did not significantly affect the overall interpretation.
The thermal comfort index (PMV) ranged from −1.39 to +0.15. Proximity to the FCU was associated with greater variability in PMV, resulting from intensified air movement and the intermittent heating operation of the unit. The most stable comfort conditions occurred at point C, where the FCU’s direct influence was minimal; however, its location near the glazed façade caused a noticeable cooling effect from external conditions. At this point, the degree of dissatisfaction expressed by the PPD index ranged from 6% to 41%. The highest PMV variability occurred at point A, closest to the FCU, where the comfort category ranged from I to values exceeding the allowable limits for category IV (
Table 3), depending on fan operation. The PPD index for this point ranged from 5% to 45%. Such pronounced PMV fluctuations—up to 1.0–1.2 units within 10 min—may lead to additional discomfort for individuals remaining in this zone for extended periods.
3.3. Analysis of Air Velocity Distribution
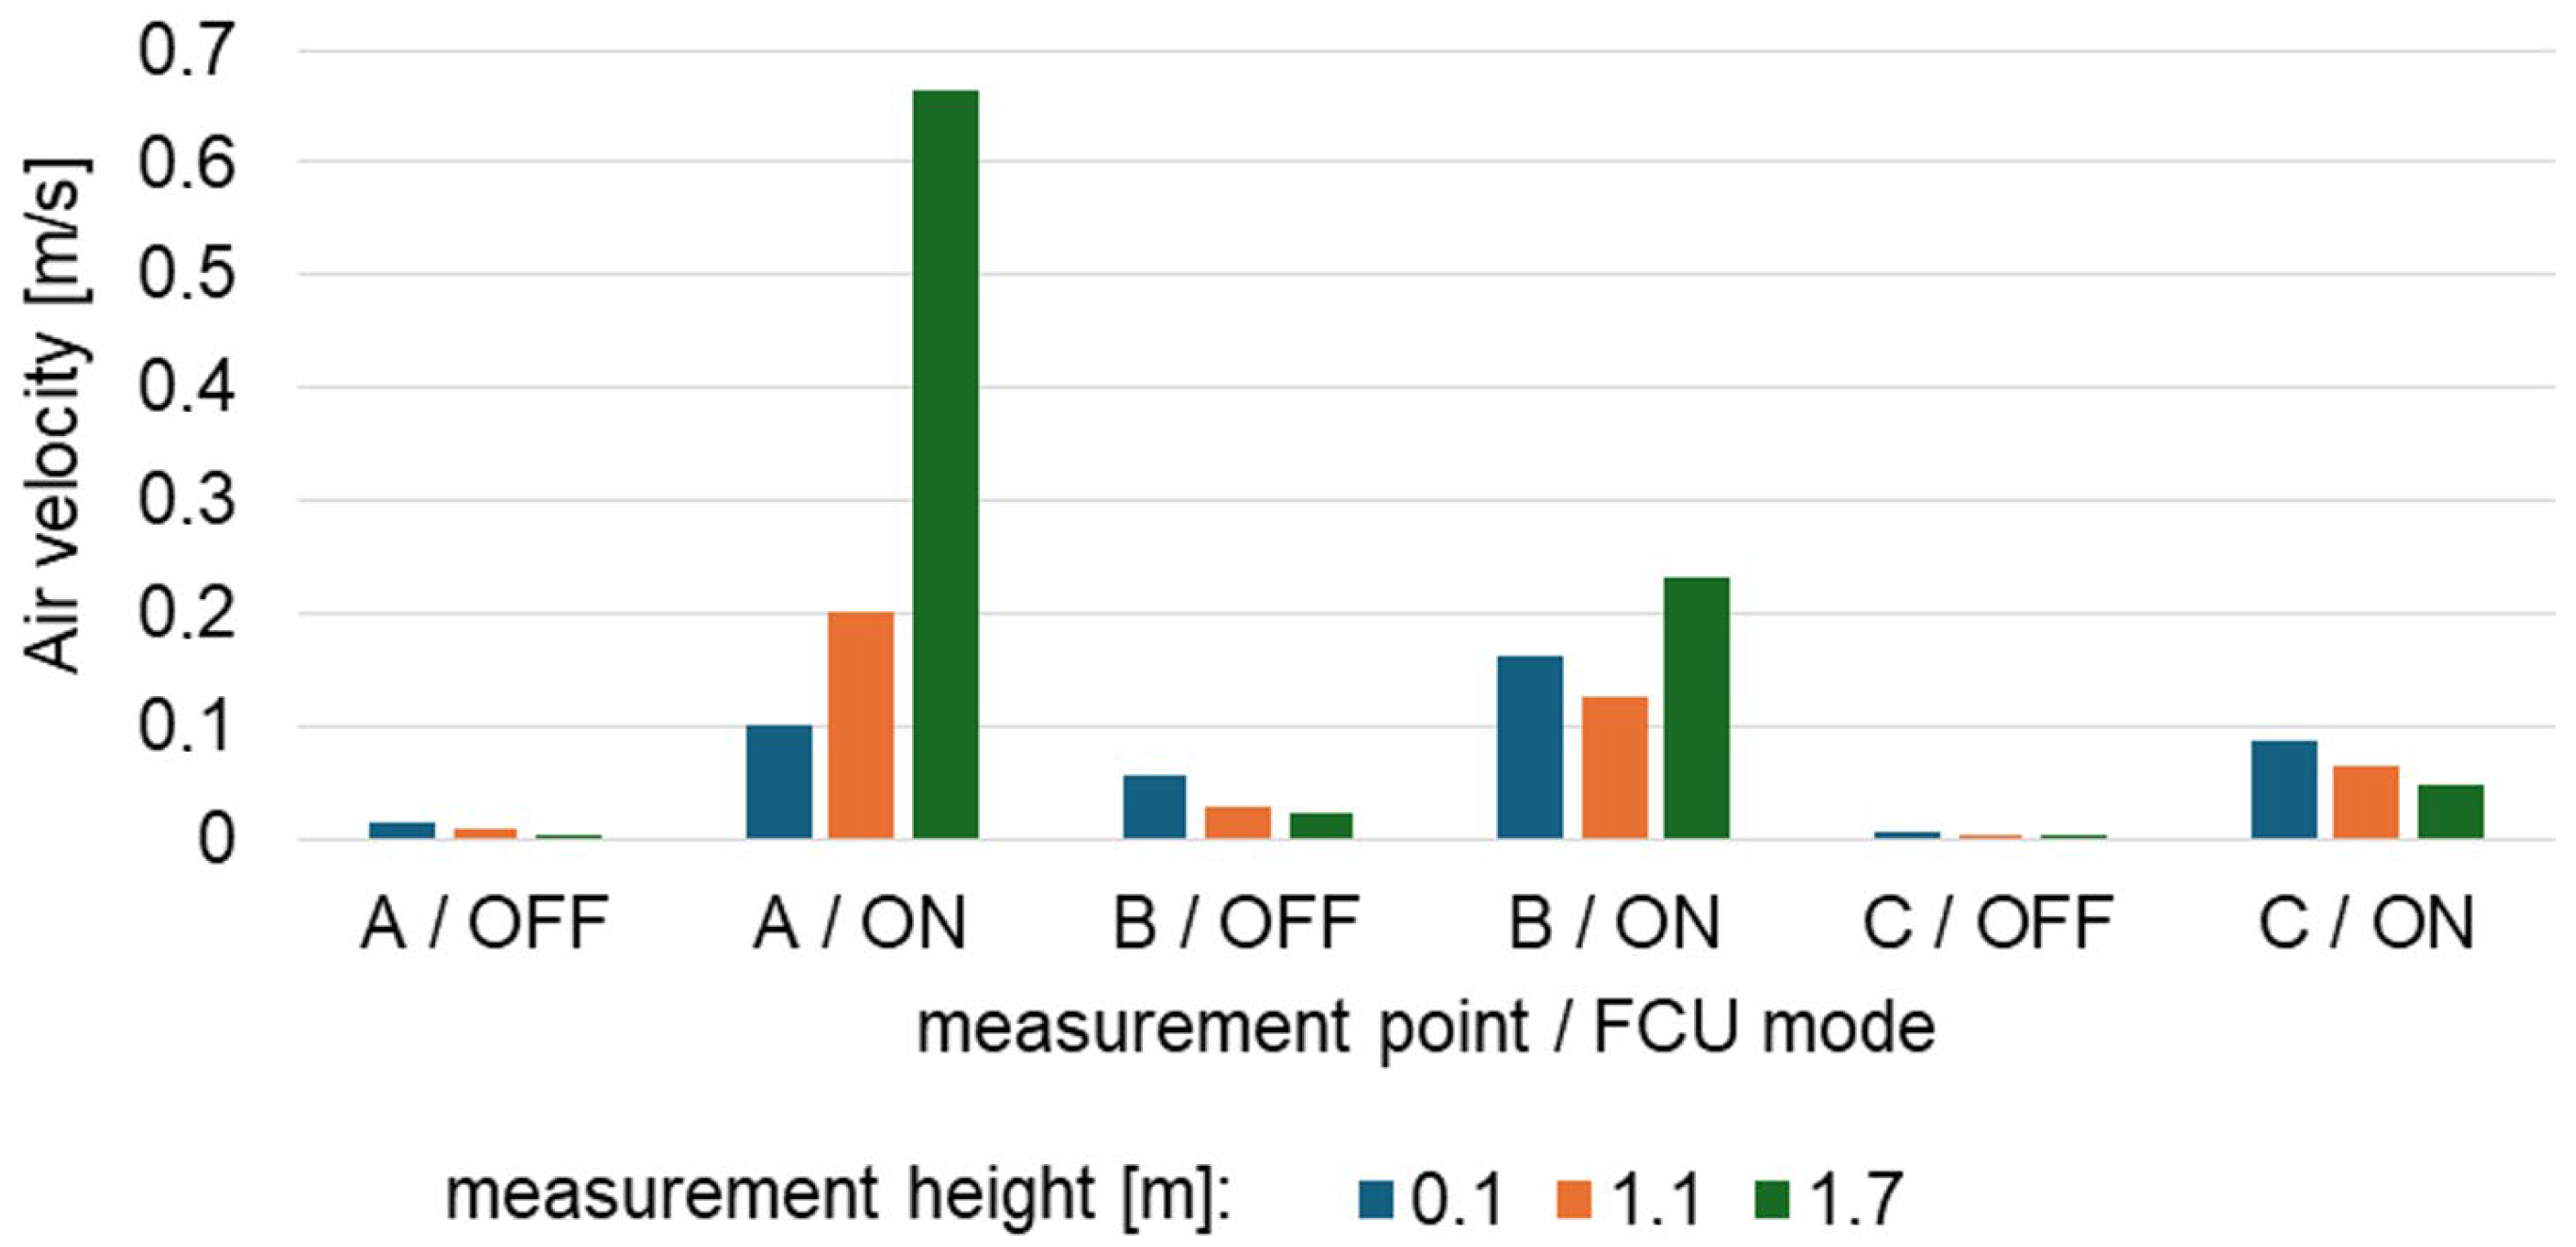
To visualize the vertical and longitudinal variation in air velocity in the waiting area for both FCU operating modes (OFF and ON with the FCU in operation), distribution of average air velocity was generated based on data from nine measurement points (see
Figure 14).
When the FCU was switched off, the results indicated a relatively uniform indoor environment, with air velocity remaining at a low and stable level—generally below 0.05 m/s. Slightly higher mean air velocities than at the other zones were observed in the central part of the waiting area (point B), most likely due to the nearby termination of the ventilation supply duct. The vertical gradient of air velocity was also relatively small, indicating stable air conditions without noticeable stratification.
In contrast, in the ON mode with the FCU operating, a significant increase in air velocity was observed across all zones of the waiting area. The spatial distribution became less uniform, with a distinct weakening of the airflow toward the far end of the area (point C). A pronounced vertical gradient appeared at point A, with the highest mean air velocity recorded at 1.7 m and a marked decrease toward the floor. This pattern reflects the directional discharge of the airflow from the FCU outlet and local mixing effects. At point B, air velocities increased substantially at all measured heights compared to the OFF mode, which can be attributed to partial dispersion of the air jet at this distance. At point C, air velocities were the lowest, resulting from the significant attenuation of the air stream at that distance from the unit.
The analysis of air velocity distribution under both operating conditions shows that the operating FCU significantly modifies local airflow patterns within the waiting area. While the OFF mode provided stable and uniform conditions, each activation of the FCU in ON mode generated distinct air jets and vertical gradients, particularly in the vicinity of the unit. These intensified airflows, although beneficial for heat distribution, may simultaneously cause localized draft sensations and increase variability in perceived thermal comfort.
3.4. Comparison of Modelled Thermal Comfort in Both FCU Operating Modes
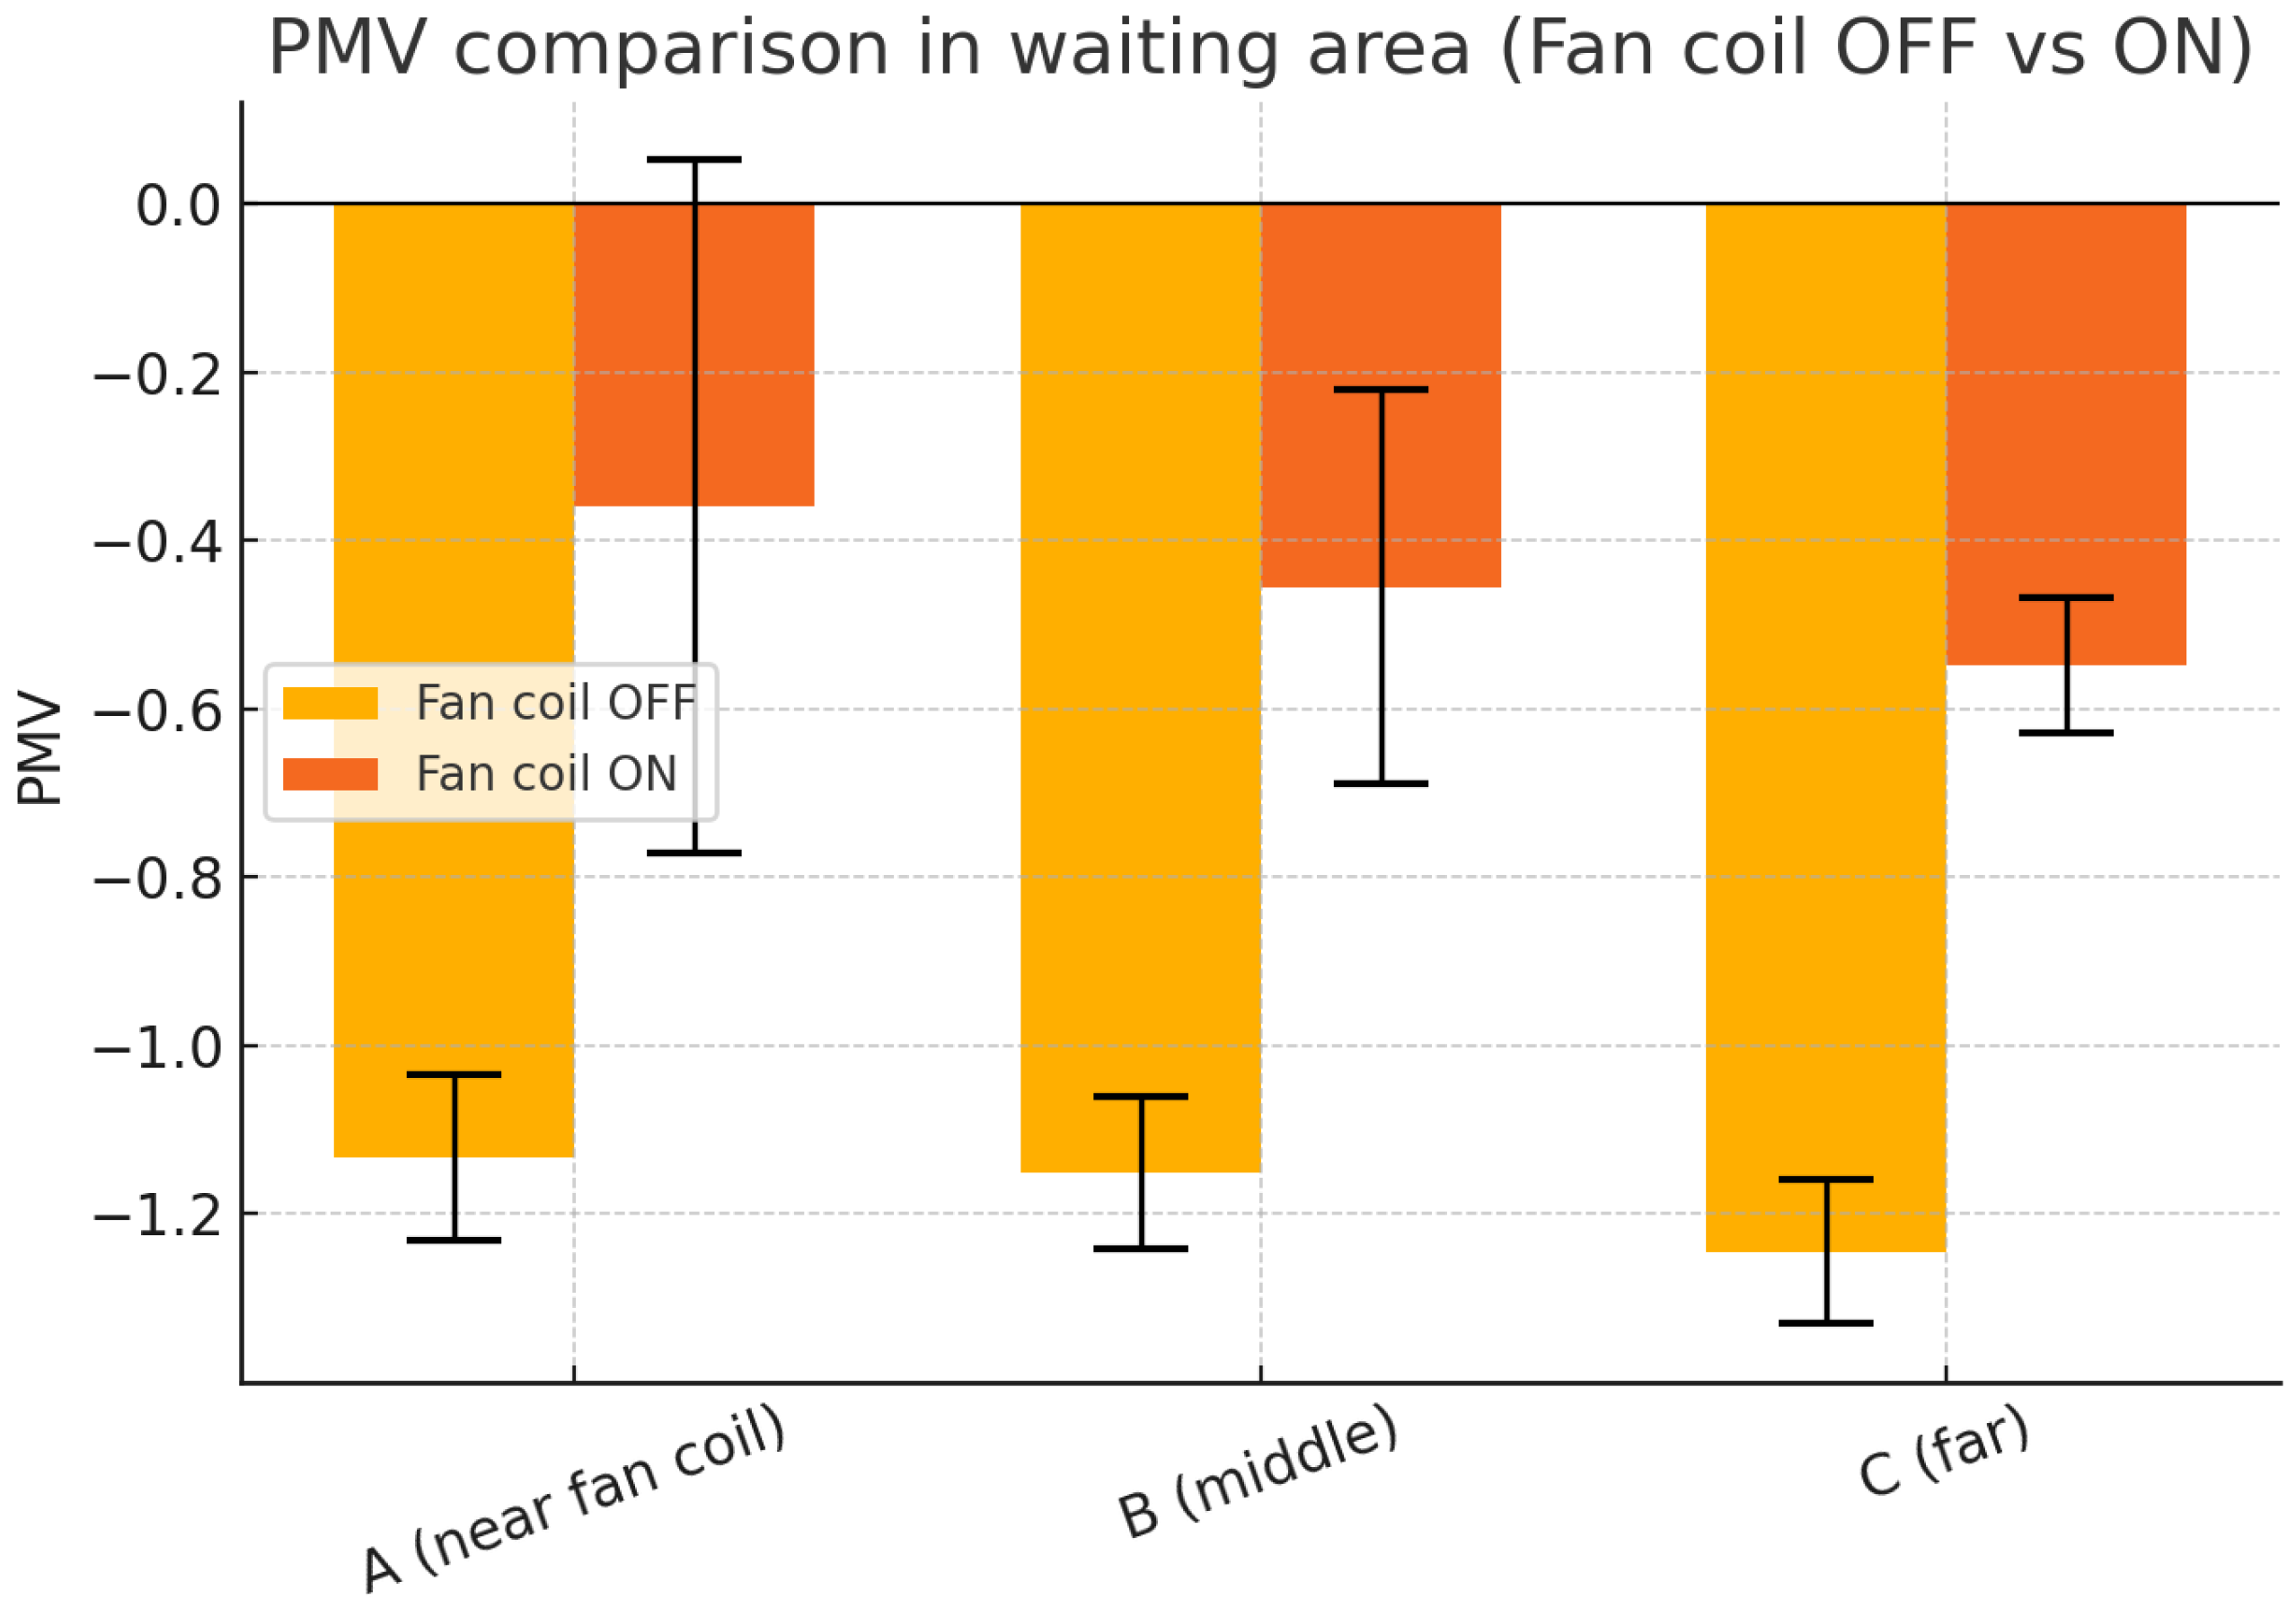
The average values of the PMV index were calculated for three measurement points (A, B, and C) in the waiting area, for two FCU modes: switched off (OFF) and operating at full capacity in heating mode (ON) (see
Figure 15).
The results show that in the ON mode, the FCU increased the average PMV values at all measurement points, indicating a shift toward warmer thermal perception compared to the OFF mode. However, the results also revealed significant spatial differences. In particular, point A (located closest to the FCU) exhibited the highest variability (standard deviation ±0.41), confirming unstable thermal conditions due to the intermittent on/off operation and the impact of local air jet. These findings suggest that while the FCU improves average thermal comfort, the generated local air jet can negatively influence comfort stability, especially in zones near the FCU.
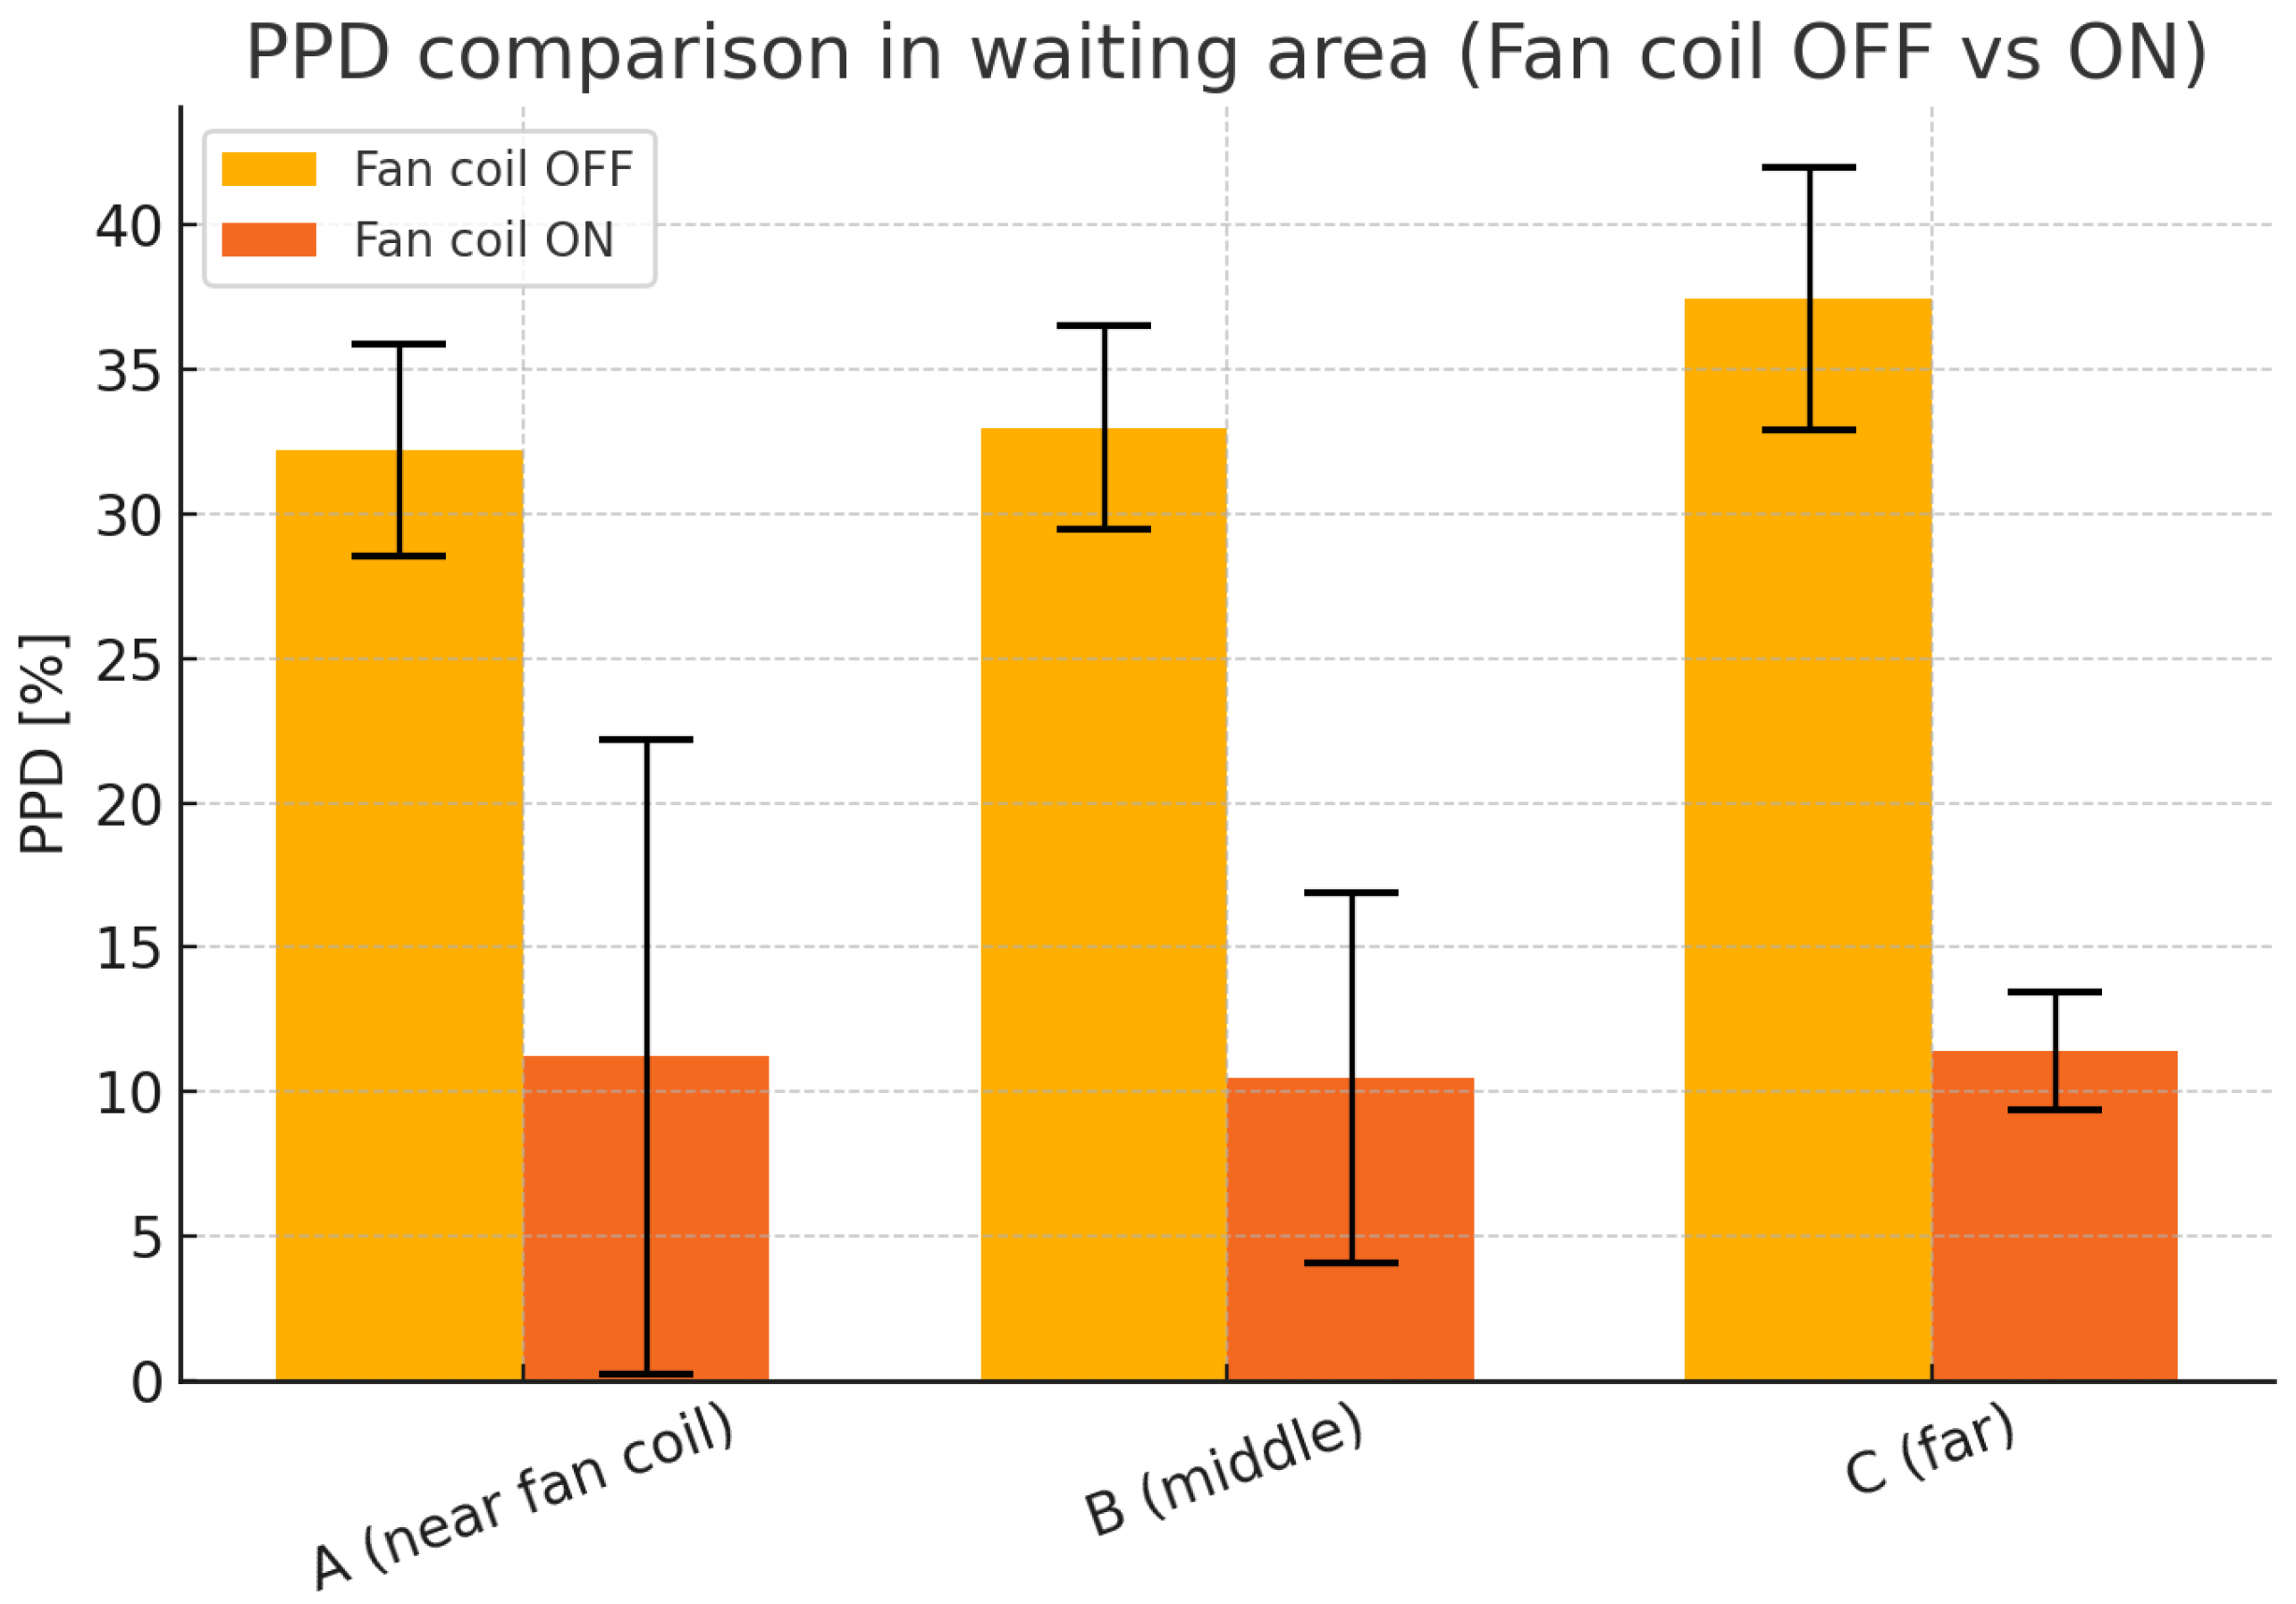
In addition to PMV, the PPD index was determined to quantify the proportion of occupants potentially dissatisfied with the thermal environment under different operating conditions of the FCU.
Figure 16 compares the PPD values at three measurement points (A, B, C) in the waiting area, for both operating modes.
The results show a significant decrease in PPD values when the FCU was operating—from 32–37% in the OFF mode to around 10–11% in the ON mode. However, point A (located closest to the FCU) exhibited high variability (SD ± 11%), indicating the influence of unstable local air velocity (periodic air jet) and the resulting transient comfort conditions, despite the overall improvement in temperature.
3.5. Comparison of Modelled and Surveyed Dissatisfaction
To validate the objective comfort indices (PMV and PPD) and account for subjective perceptions, a short questionnaire survey was conducted among occupants present in the waiting area in the ON mode.
Table 5 summarizes the results. The comparison between PPD values and questionnaire is shown in
Figure 17.
The modelled PPD values showed much higher variability, particularly in point A, where the intermittent on/off operation of the FCU caused rapid changes in local thermal conditions and air velocity patterns. In contrast, the survey responses, which reflect the average occupant experience over thirty minutes of exposure, indicated slightly higher overall dissatisfaction and smaller variability. This suggests that instantaneous model-based comfort indices may underestimate discomfort in transient air velocity conditions, whereas subjective surveys smooth out short-term fluctuations and provide a more realistic assessment of perceived comfort. The combined use of objective modelling and subjective feedback allows a better understanding of both the dynamic effects of FCU operation and the overall occupant experience, highlighting that the middle zone (point B) offers the most stable and comfortable conditions.
4. Discussion
Based only on the instantaneous PMV waveforms in the ON mode (with the FCU operating at 100% capacity according to demand) it is difficult to clearly identify the measurement point where the highest comfort level was achieved (see
Figure 12). However, during periods when the FCU was inactive, the results indicate that thermal comfort was highest at point A, lower at point B, and lowest at point C. This pattern reflects the temperature distribution at these points, with uniformly low air velocity. In contrast, when the FCU was blowing air, the order reversed–comfort was highest at point C, lower at point B, and lowest at point A. This was caused by the strong air jet from the FCU, which intensified the sensation of coolness. The effect gradually weakened with increasing distance from the unit. unit.
To assess the overall comfort conditions in the waiting area, the PMV and PPD indices were statistically analyzed for different measurement points in both FCU operating modes, complemented by the results of short questionnaire surveys on subjective thermal perceptions. The results show that although the temperature increased during FCU operation, perceived thermal comfort was not uniformly improved. Near the FCU (point A), occupants reported discomfort primarily due to local air jet (draught sensation), while at the farthest point C cooler conditions persisted. The middle zone (point B) provided the most balanced and stable comfort conditions.
These results confirm that while the FCU improves the overall thermal comfort index, local air jet can cause fluctuations in occupant comfort, which is particularly relevant in semi-transient spaces such as waiting areas. The findings emphasize that although FCUs enable rapid thermal conditioning through warm-air delivery, they may simultaneously negatively affect perceived comfort and should therefore be operated under control strategies designed to minimize draft sensation. A practical approach involves adjusting fan speed according to occupancy schedules, maintaining the lowest airflow rate that still ensures adequate heating capacity and effective air mixing for heat distribution within the room. Attention should also be given to the initial phase of FCU operation, when the fan begins circulating room air through a heat exchanger that has not yet reached its target temperature–due to the control system characteristics, actuator response delays, and the time required for the heating medium to reach the unit. As a result, occupants may experience an initial blast of unheated air. This effect can be mitigated by preheating the heat exchanger prior to fan operation and by implementing a gradual fan speed ramp-up strategy. Moreover, incorporating occupancy-sensor-based control can further enhance system performance by adapting operation to real-time usage patterns. For instance, preheating can be triggered before expected occupancy periods, whereas setback temperature settings during unoccupied hours can contribute to energy savings. In thermally non-uniform environments, it is essential that control feedback is based on temperature readings from a representative location within the room. The application of multi-point temperature sensing for feedback control can further improve regulation accuracy and overall comfort stability.
The analysis of instantaneous spatial comfort distributions—supported by statistical evaluation of comfort indices as a function of distance from the FCU—confirmed a systematic comfort gradient along the analyzed waiting area in both FCU operating modes. In the ON mode, during periods when the FCU was active, the model-based PPD values exhibited high variability, particularly near the FCU, due to the automatic on/off control that caused rapid fluctuations in local air velocity and temperature. In contrast, survey responses showed slightly higher overall dissatisfaction and smaller variability, reflecting the averaging effect of occupant perception over time.
These findings demonstrate the limitations of simple on/off control strategies for FCUs in waiting areas. Intermittent operation not only introduces transient discomfort when the FCU switches on (perceived as a sudden draught) but also fails to ensure a uniform temperature distribution. To address these issues, it is recommended to:
operate the FCU at lower but continuous fan speeds that are still sufficient to provide the required heating capacity and maintain effective air mixing and heat distribution within the room,
integrate occupancy-based control strategies, such as reducing fan speed in response to occupancy or activating room preheating before expected occupancy periods,
in thermally non-uniform environments, consider implementing control based on multi-point temperature measurements,
implement heat exchanger preheating prior to fan activation and gradual fan speed ramp-up, to prevent unheated air drafts during system start-up.
Such measures would reduce local discomfort caused by draughts and noise, while improving perceived comfort and reducing peak power demand of the fan drive. However, these solutions must be adapted to the specific characteristics of the space, including the location of the FCU, heating demand, and local climatic conditions. Future work should focus on detailed analysis of short-term comfort changes during the start-up phase and the effectiveness of advanced FCU control strategies, including preheating of the heat exchanger before fan activation, use gradual fan speed ramp-up to avoid blasts of unheated air at start-up, as well as combining modelled comfort indices with real user feedback.
The results of this study confirm that even in energy-efficient office buildings, terminal HVAC devices such as FCUs may negatively affect thermal comfort in localized zones. While the FCU increased the average temperature in the waiting area, its operation also introduced intensified air movement, shifting perceived thermal sensation toward cooler values in the immediate vicinity of the unit. This effect was confirmed by both model-based comfort indices (PMV, PPD) and user feedback from surveys.
A key finding is that instantaneous model calculations of PPD exhibited high variability, especially near the FCU, due to the intermittent on/off operation of the device. In contrast, occupant surveys showed slightly higher overall dissatisfaction and smaller variability, indicating that short-term airflow fluctuations are less impactful when averaged over typical waiting times. These results suggest that while model-based indices are useful for identifying potential problem areas, subjective surveys provide essential insight into perceived comfort stability. These findings are consistent with earlier studies highlighting the importance of local air velocity patterns and their influence on occupant comfort. Fanger and Christensen [
16] demonstrated that occupants are particularly sensitive to draughts in environments with moderate activity levels, and that local air velocity often dominates comfort perception even when average room temperature is acceptable. Similarly, Hou et al. [
59] emphasized that local discomfort, especially in transient or transitional zones, is one of the main challenges in implementing energy-saving HVAC strategies.
In the context of nZEB buildings, Piasecki [
10] and other researchers [
9,
11,
24] noted that achieving energy efficiency while ensuring indoor environmental quality remains a complex task. Much of the existing research focuses on permanently occupied office spaces or residential rooms [
12,
14], whereas semi-transient spaces such as waiting areas are often overlooked in design guidelines. The present study extends current knowledge by providing field data from a real nZEB office building, combining objective comfort indices (PMV, PPD) and spatial analysis methods that account for the distance from the FCU with direct user feedback.
The results also support the recommendations found in previous research [
15,
16], which suggest adopting advanced FCU control strategies to mitigate start-up discomfort and draft sensations. Gradual fan speed ramp-up, preheating of heat exchangers before fan activation, and integration of occupancy-based control strategies have the potential to reduce discomfort events while maintaining energy efficiency. Recent studies on HVAC control approaches highlight that data-driven and adaptive control strategies—including reinforcement learning, fuzzy logic, and artificial neural networks—are increasingly viewed as viable alternatives to conventional rule-based and Model Predictive Control (MPC) strategies. Moreover, MPC enhanced with Large Language Models (LLMs), as well as constrained reinforcement learning frameworks, have demonstrated the potential to optimize HVAC operation with higher comfort compliance and reduced energy consumption. Taken together, these findings suggest that future FCU management—particularly in dynamically occupied spaces such as waiting areas—could benefit from integrating such advanced decision-making mechanisms into real-world building automation systems [
24,
25,
26,
27].
Nevertheless, this study has limitations. Only one waiting area was analyzed, the subjective assessment was limited to short interviews, and the monitoring period was relatively short. Despite these limitations, the consistency between our findings, subjective feedback, and published literature strengthens the conclusion that terminal HVAC units such as FCUs, if not properly controlled, can negatively influence perceived comfort even in spaces intended for short-term occupancy.
5. Conclusions
This study analyzed the influence of a ceiling-mounted FCU operating in heating mode on thermal comfort in an office waiting area of a nearly zero-energy building (nZEB). Two distinct operating modes were considered: the fan coil (FCU) switched off, and single-speed on/off temperature control at full capacity. The research combined objective microclimate measurements with comfort indices (PMV, PPD) and a short occupant survey.
An innovative aspect of this study is its focus on semi-transient waiting areas—a type of space rarely analyzed in previous research—and the evaluation of localized comfort effects within such environments. The results revealed that while FCU operation increased the average temperature, it also generated air jet patterns that locally reduced comfort near the FCU. The calculated PPD showed high temporal variability in this zone due to the on/off control strategy, whereas survey responses indicated higher and more stable dissatisfaction levels, highlighting the importance of combining model-based indices with occupant feedback.
Another significant finding concerns transient discomfort during start-up phases, where a blast of unheated air was perceived due to heating system delays. These results demonstrate that simple on/off FCU control is insufficient to ensure uniform and stable comfort, even in spaces intended for short-term occupancy.
Practical implications include the following recommendations:
Operate FCUs at reduced but continuous fan speeds;
Implement heat exchanger preheating and gradual fan speed ramp-up to prevent start-up discomfort;
Integrate occupancy-based control strategies and consider control based on multi-point temperature measurements.
Future research should extend these analyses to year-round conditions to reflect the variability in weather and seasonal changes. Additionally, a more in-depth investigation of vertical comfort profiles at different body heights—for both standing and seated occupants—would be valuable, preferably supported by CFD analyses and more detailed occupant surveys. It would also be beneficial to broaden the scope to include multiple waiting areas and other semi-transient spaces. Furthermore, future studies may evaluate advanced intelligent control strategies that integrate occupancy detection, multipoint temperature measurements, and air velocity modulation. These efforts would support improved comfort in semi-transient spaces while maintaining the energy efficiency objectives of nZEB buildings.
